

Framework for Healthiness Assessment of Water Cycle to Decide the Priority of Enhancement and Restoration Plans

1
Industry-University Cooperation Foundation, Pukyong National University, Busan 48513, Republic of Korea
2
Civil Engineering, Department of Sustainable Engineering, Pukyong National University, Busan 48513, Republic of Korea
3
Disaster Prevention Research Institute, Pukyong National University, Busan 48513, Republic of Korea
4
Department of Civil Engineering, Kyungsung University, Busan 48434, Republic of Korea
*
Author to whom correspondence should be addressed.
Water 2023, 15(1), 6; https://doi.org/10.3390/w15010006
Submission received: 7 November 2022
/
Revised: 10 December 2022
/
Accepted: 16 December 2022
/
Published: 20 December 2022
(This article belongs to the Special Issue Advance in Water Management and Water Policy Research)
Abstract
:The water cycle in watersheds is vulnerable due to climate change; hence, the need for sustainable watershed management is increasing. This paper suggests a framework for a healthiness assessment of the water cycle to provide a guideline for systematic watershed management considering the previous and current states. The suggested framework aims to prioritize restoration and enhancement plans based on the graded healthiness of the water cycle elements by the watersheds. The framework is composed of two assessment procedures: a problem-focused assessment to identify problems such as flood, drought, and river depletion in the watershed and the highest priority assessment to select the watershed for enhancement and restoration plans. The healthiness assessment method for each metric is suggested based on the Korean Framework Act on Water Management. The framework was applied to four different watersheds in South Korea. The framework is proven to be an effective method to identify practical emerging problems for the water cycle in each watershed. The framework can contribute to providing technical information to detect the water problem of the watershed by objectively diagnosing the watersheds with various potential water problems via the healthiness assessment.
1. Introduction
A river basin and watershed management plan is a process for stating problems and threats, e.g., flood, drought, and ecocide, to water resources and developing a framework to address these threats. The plan includes the following components: characterize watershed conditions, identify and prioritize problems, define the goal for watershed management, and implement restoration and enhancement strategies. Because an understanding the state of watershed conditions is the basis for implementing the above components, many researchers and nations have suggested various approaching methods for assessing watershed conditions [1,2,3,4].
The US Environmental Protection Agency (EPA) has established the Health Watersheds Program (HWP) to support states, regions, and associated agencies through an unregulated and cooperative approach to watershed health assessment and water quality management [5]. The HWP suggests the watershed health assessment, which is a summarization of watershed elements based on the primary physical attributes of watershed conditions. The watershed health assessment of the US EPA evaluates the watershed conditions using six indicators (i.e., landscape condition, geomorphology, hydrology, water quality, habitat, and biological condition), and the scores of each indicator are integrated to identify healthy watersheds and assess vulnerability [5]. The watershed health assessment of the US EPA divides the basin into watershed units, and the healthiness of the watershed units is relatively assessed based on the score for the natural state of the watershed or the average score between watersheds. The relative assessment method has a limitation in that it is not easy to derive clear goals or criteria for establishing alternatives to enhance healthiness in the watersheds to be assessed.
The Nature Conservancy, a global environmental organization, has developed the indicators of hydrology (IHA) program, which can analyze hydrological condition changes [6]. The IHA assesses hydrological changes using 33 indicators that are ecologically meaningful and sensitive to artificial effects. The IHA statistically analyzes hydrological changes before and after a specific period to assess changes in the hydrological environment in the watershed due to watershed development such as dam construction. Hence, the criteria of the assessment for the hydrological condition changes is the natural condition of the watershed. The IHA assesses the ratio of current hydrological conditions compared to natural conditions. The assessment method of the IHA does not have the absolute criteria to assess hydrological condition changes, and assessment from the water quality perspective is omitted. In addition to the aforementioned institutions, institutions in charge of watershed management in various countries also suggest systems for evaluating watershed healthiness [7,8,9,10].
In addition, since the national finances that can be invested in watershed management are limited, it is necessary to determine the watershed and elements that are prioritized for the restoration and enhancement plans. Accordingly, many researchers have proposed a method of integrating the watershed health evaluated for each element based on mathematical theories such as decision-making techniques [11,12,13,14]. Nevertheless, challenges are still present regarding the need for an agreed upon or commonly used concept for watershed management, difficulties in the goals and plan strategies for embodying a sound water cycle, and insufficient roles and responsibilities for each subject for watershed management [15]. That is, many research results related to watershed health assessment are often not taken into practice due to the gap between stakeholders and researchers in the direction, purpose, and understanding of watershed management.
Therefore, this paper aims to present a method for assessing water cycle healthiness in accordance with the national policy direction, laws, and systems for watershed management, and to determine the watersheds where restoration and enhancement plans need priority. In South Korea, the Framework Act On Water Management [16] was enacted to cope with damages to water cycle healthiness, such as river depletion, water pollution caused by various types of wastewater, a decrease in penetration function due to the expansion of the impervious area, and the inhibition of the continuity of surface and groundwater. The Korean Framework Act On Water Management [16] defines a healthy water cycle as a water cycle condition in which water helps human activities, and where environmental conservation is properly maintained. The key points of the Framework Act On Water Management are as follows: integrated river basin management, the restoration and maintenance of a healthy water cycle, water quality management, and water disasters prevention such as floods and droughts. In accordance with the Framework Act on Water Management [16], which defines a healthy water cycle, the process for watershed healthiness assessment presented below is defined as a framework for the healthiness assessment of the water cycle (FHAWC). The FHAWC was set to suggest the direction of watershed management by selecting indicators and criteria to identify the problems of the water cycle in the watershed. The FHAWC aims to propose the priorities of the restoration and enhancement plans in the watershed based on the healthiness assessment of the elements for the water cycle. The FHAWC has two assessment procedures: a problem-focused assessment to identify problems in the watershed and a priorities assessment to select the watershed with the highest priority for the restoration and enhancement plans.
2. Materials and Methods
2.1. Framework for the Healthiness Assessment of the Water Cycle
2.1.1. Conceptualization and Objectives
Ref. Han et al. [15] defined the water cycle management by dividing it into broad and narrow senses. The broad-minded water cycle management defined by Han et al. [15] means that the water function for the maintenance of the ecosystem and human activities can be maintained normally by considering all of the water-related factors in the water cycle process in an integrated manner. The narrow sense refers to all actions that minimize the problem of distorting the water cycle and that maximize the benefits by utilizing structural and non-structural measures to restore or maintain the natural water cycle. The Framework Act on Water Management [16], which suggests the direction of water management policy in South Korea, defines water cycle management in the broadest sense. The Framework Act on Water Management [16] suggests that all factors related to the water cycle process, such as water use, water environment, and flood and drought management, should be integrally managed to direct a healthy water cycle.
The FHAWC was divided into three categories: water environment, water use, and water safety, by adopting water cycle management in the broadest sense (column No. 1 in Table 1). Each category contains two or more themes that are factors for assessing the healthiness of the water cycle in that category (column No. 2 in Table 1). Specifically, within the water environment category, three themes are included: water quality, non-point source pollution, and aquatic ecology. The category of water use includes water flow maintenance and groundwater, and the category of water safety includes flood and water supply. The FHAWC of each theme is analyzed through one or more metrics (column No. 3 in Table 1). Metrics were selected that can identify the problems for the water cycle that may occur in the watershed. In particular, each metric, included in the themes for water quality, non-point source pollution, aquatic ecology, and water flow maintenance, was proposed based on the law and the system in force.
The metrics for the water quality, non-point source pollution, and aquatic ecology in the water environment category were suggested based on the standards and guidelines presented in the Water Environment Conservation Act (WECA) [17]. The WECA is established to manage and preserve the water environment in South Korea. The WECA presents the ambient water quality standard that evaluates the water quality of rivers and the aquatic ecology health indices that evaluate the aquatic ecological soundness. The ambient water quality standard is the rating guide that presents seven water quality factors, i.e., power of hydrogen (pH), biological oxygen demand (BOD), total organic carbons (TOC), suspended solids (SS), dissolved oxygen (DO), total porosity (TP), and coliforms. The WECA presents the target grades for BOD and TP for each watershed to preserve the water quality of rivers and lakes. In the FHAWC, the water quality condition was evaluated using the ambient water quality standard for BOT and TP according to the WECA. The details of the water quality theme are described in Section 2.3.1.
In the aquatic ecology health indices, five indicators related to aquatic ecology are presented in five grades. In the FHAWC, the aquatic ecological soundness is evaluated using the integrated aquatic ecology index that integrates the five indicators presented in the aquatic ecology health indices into one indicator.
The calculation method of the integrated aquatic ecological index was described in Section 2.3.3.
The WECA presents the Guidelines for Calculating Water Circulation Management Indicators for Non-Point Pollution Management for non-point pollution management. This guideline presents the water cycle ratio as an indicator for evaluating the vulnerability to non-point pollution management in the watershed. The water cycle rate refers to the percentage of rainwater penetration, storage, and evaporation in the target rainfall. The target rainfall is defined as 25.4 mm in Guidelines for Calculating Water Circulation Management Indicators for Non-Point Pollution Management. The metric of the non-point source pollution theme for FHAWC is defined using the above guidelines and evaluates the vulnerability with a direct runoff depth for the target rainfall. The details of the water quality theme are described in Section 2.3.2.
The Korean Ministry of Environment (KME) announces the instream flow rate for the major river and stream points to preserve the function of rivers. In the FHAWC, the condition of the water flow management is evaluated by a percentage of the flow duration for the announced instream flow in a year (). Since PFD is significantly affected by drought or flooding, this study evaluated the condition of the water flow management with a ten-year averaged .
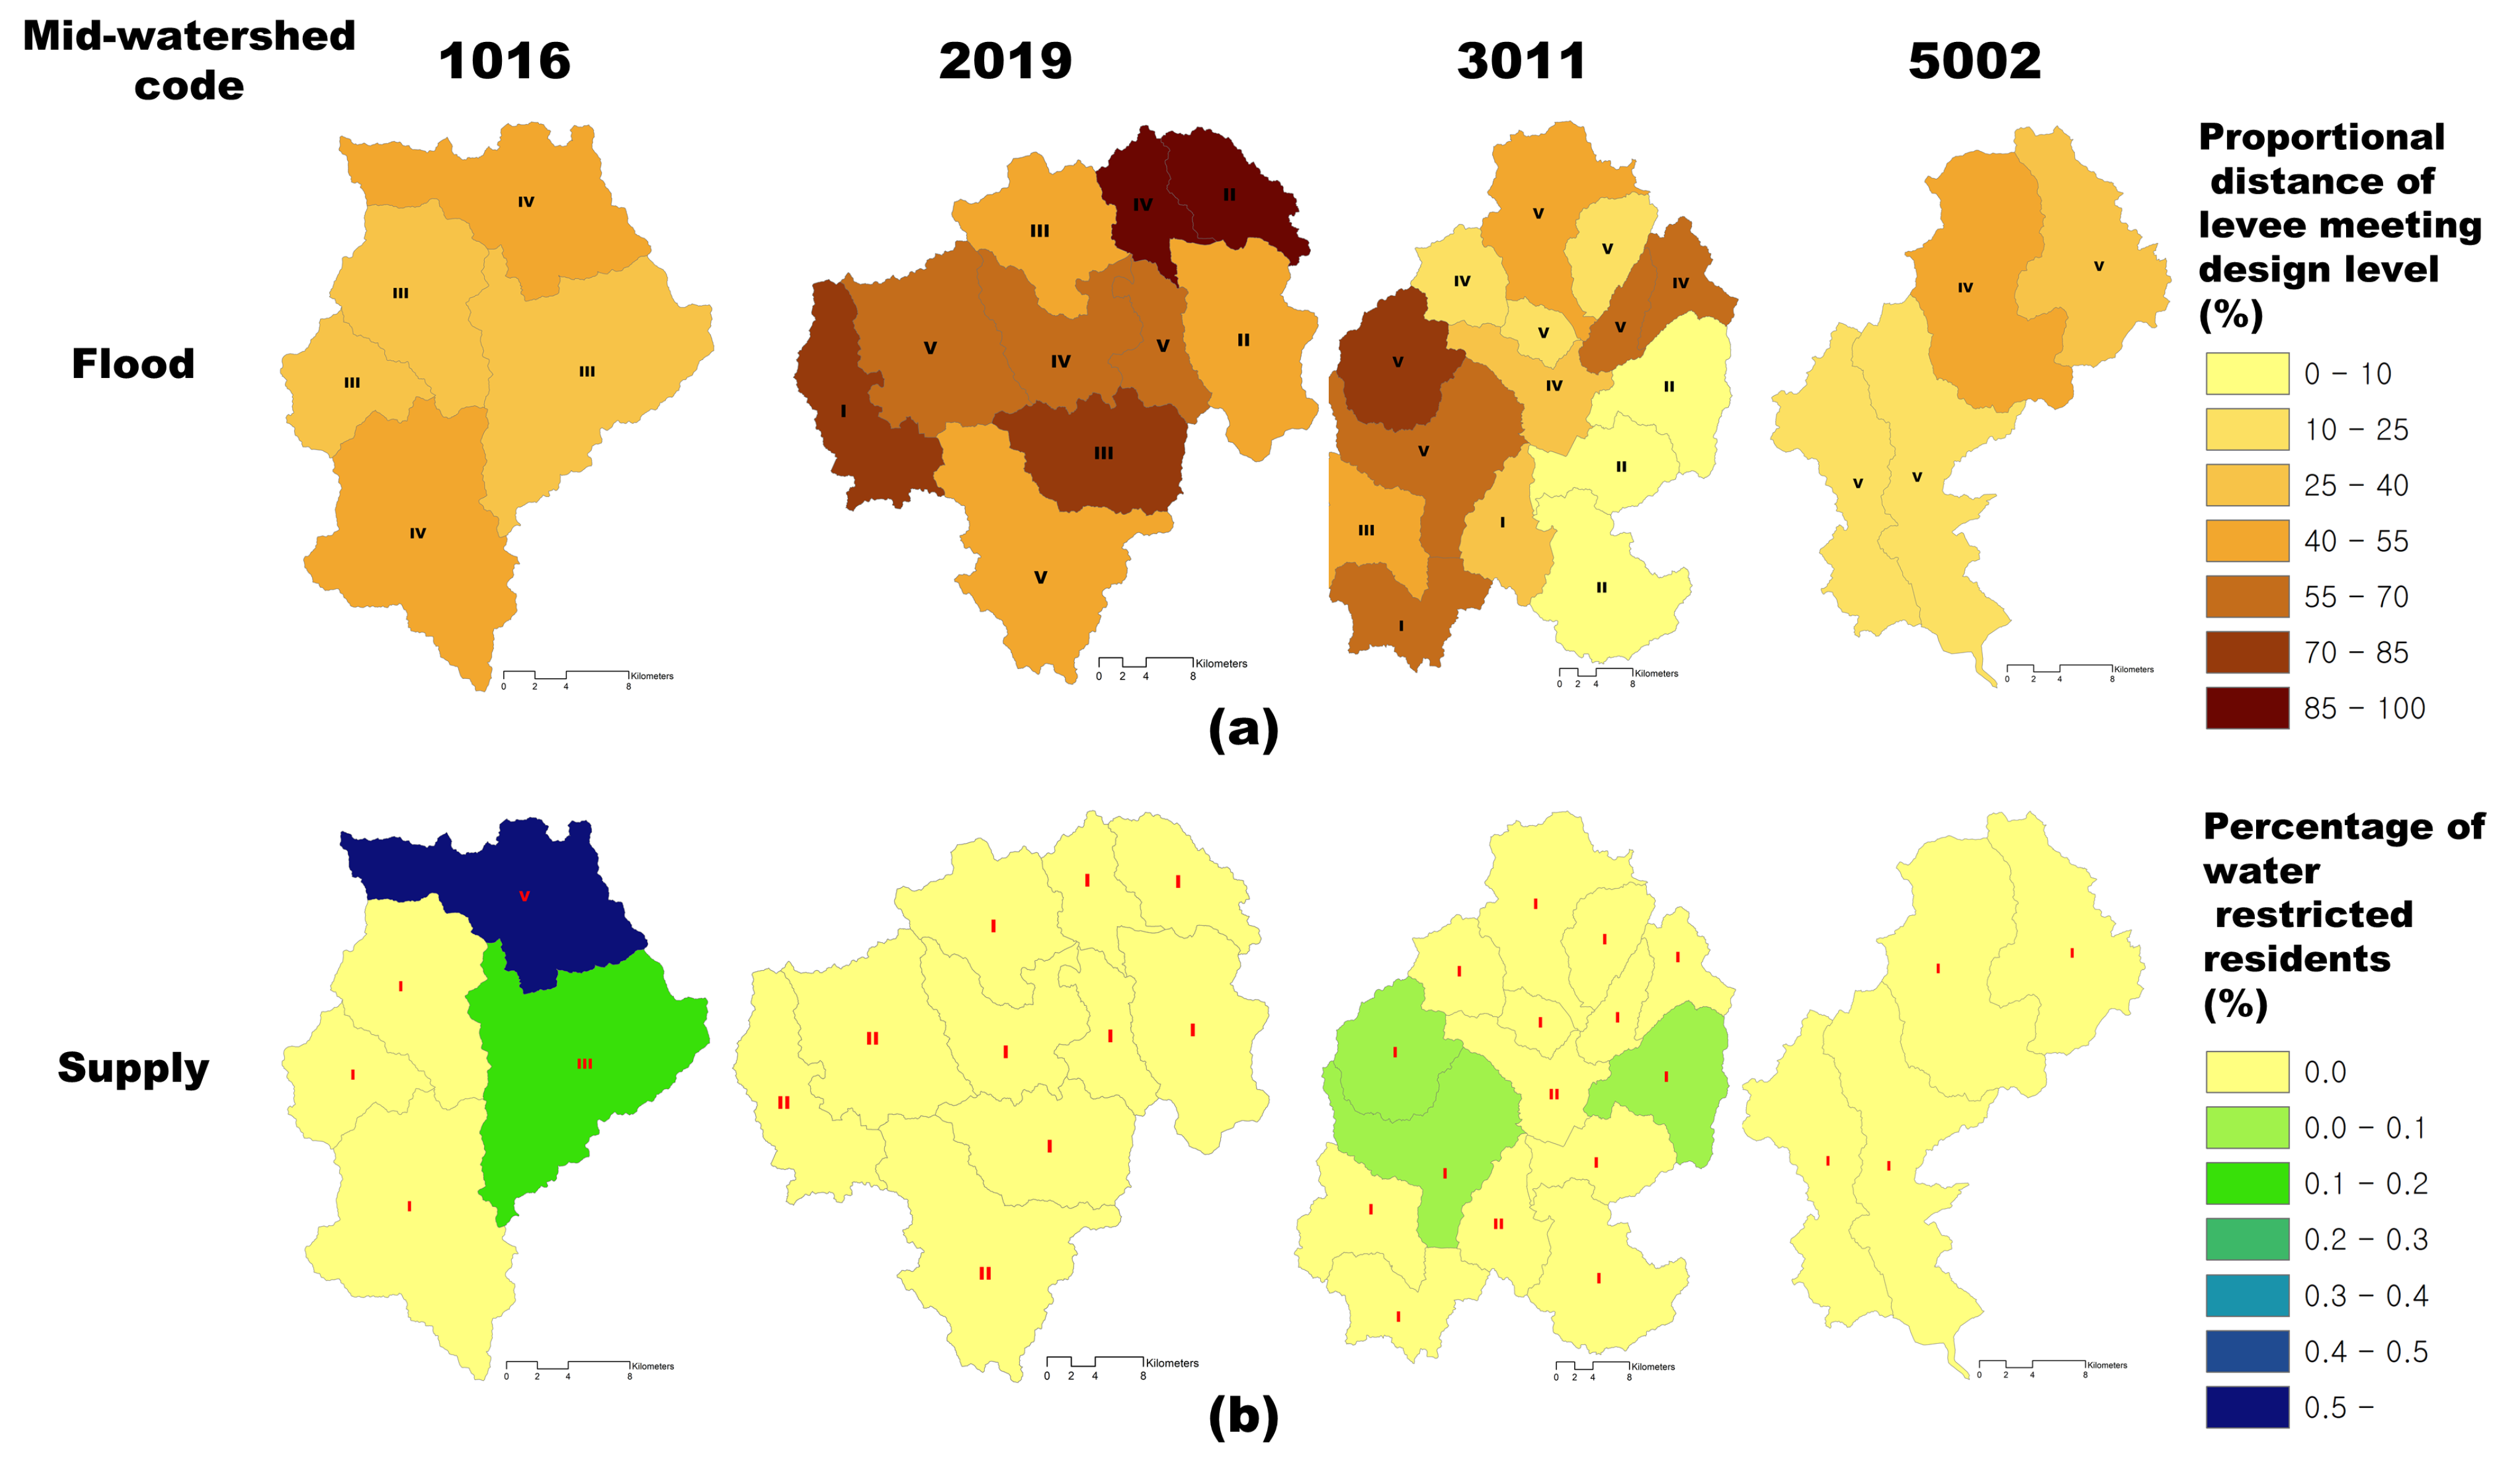
In South Korea, various indicators for evaluating the status of groundwater conservation, flood risk management, and water supply management have been developed at the research level, and a legal system is currently being prepared. Thus, this study suggested the metrics of the theme for groundwater, flood, and water supply as the following grounds. The groundwater theme is evaluated as a percentage of groundwater development considering the limitations of groundwater development. The flood theme evaluates the flood risk management status as a proportional distance of the levee meeting the design level (). The is an indicator presented in the Guidelines for Establishing a River Basin Water Management Plan, which is being established in South Korea. The percentage of water supply-restricted residents () evaluates the vulnerability to the water supply. Details of the groundwater, flood, and water supply themes are described in Section 2.3.5, Section 2.3.6 and Section 2.3.7.
The FHAWC aims to diagnose the water cycle healthiness of the watershed to identify problems and achieve a healthy water cycle via enhancement and restoration plans necessary for the watershed. In South Korea, the enhancement and restoration plan to improve the water cycle healthiness is established in the mid-watershed unit, and the plan is implemented in the sub-watershed unit (the standard watershed of the South Korean hydrologic unit map). Thus, in order to improve the water cycle healthiness in the mid-watershed, an absolute evaluation method to identify the problems and a relative evaluation method to select the sub-watersheds where the plan will be implemented is needed. The FHAWC consists of two ways for an assessment to be performed for two purposes. The first way is to identify the problems for the water cycle by reviewing whether the defined criteria are achieved in each sub-watershed (column No. 4 in Table 1). The first way is defined as a problem-focused assessment in this study. The second way is the derivation of priorities for the restoration and enhancement plan using an inter-watershed comparison. The priorities are determined via integrated scores for the classified water cycle healthiness index (column No. 5 in Table 1). The second way is defined as a priorities assessment in this study. The priority assessment and problem-focused assessment are described in Section 2.1.2 and Section 2.1.3, and the selection procedure of sub-watersheds for implementing the restoration and enhancement plan is described in Section 2.1.4.
2.1.2. Priorities Assessment for Inter-Watershed Comparison
To derive the priorities of the sub-watershed for restoration and enhancement plans, not only is there a relative comparison of the water cycle healthiness between the sub-watersheds, but an integrated score from the seven metrics is also required. In this study, the analytic hierarchy process (AHP) was applied as a method to integrate the seven metrics. The AHP, which is a multi-criteria decision-making method, was suggested by Saaty [20], Saaty [21]. The AHP is a theory of measurement for dealing with quantifiable and intangible criteria that have been applied to numerous areas as well as the water resources management field [11,12,13,22]. In order to apply the AHP, a grade for each metric is required, and in this study, each metric was classified into seven grades (Table 2). The classification of grades using seven levels is based on psychological theory. Most adults can store between five and nine items in their short-term memory. This idea was put forward by Miller [23]. The frameworks for watershed assessment and planning are iterative, and the assessment criteria and grade boundaries might need to be updated depending on the condition of the watershed being evaluated. As shown in Table 2, each grade boundary in the classified metric has been supplemented based on the pre-application results of various watersheds in South Korea. The metrics and grade boundaries in Table 2 are not absolute; they can be modified and supplemented according to the conditions of the watershed and the direction of national policies.
The authors defined the integrated index for the seven-metric index as a water cycle healthiness index (). The is calculated using the derived grades and weight values for each metric (Equation (1)).
where i is the metric, and is the score for the decided grade of the metric i for the watershed. is the weight value for the metric i, which is derived using the AHP.
The procedure for determining the weight value of the using the AHP is as follows:
- Step 1.
- In order to conduct pair comparisons, a questionnaire is designed and distributed among the respondents to collect their opinion. Since the healthiness assessment for the water cycle consists of seven metrics, the number of questions in the pairwise comparison questionnaire between indicators of the AHP is 21 (the number of asterisks in Table 3).
- Step 2.
- The pairwise comparison matrix, which is called matrix A, is extracted from the data collected from the response results (Table 4). In Table 4, represents the attributing values that vary from 1 to 5, and the scale presents the relative importance of an alternative when compared with another alternative.
- Step 3.
- Review whether the response results of an expert are consistent. The consistency of the response is evaluated using the consistency ratio () in Equations (2) and (3). n is 7 is the number of metrics, and is the maximum eigen value of matrix A. The value of is related to the dimension of the matrix, which is 1.32 when n is 7. If the consistency ratio () is lower than 0.10, it may be determined that the response result is consistent.
- Step 4.
- Calculate an integrated pairwise comparison matrix. The integrated pairwise comparison matrix is determined by calculating the geometric mean of the same metric from the pairwise comparison matrix of the selected responses in Step 3.
- Step 5.
- Determine weight vector (). The weight vector () is computed as the unique solution of .
The priorities assessment is performed by comparing the score of the calculated for each sub-watershed using Equation (1). In the priorities assessment, seven points are given to the sub-watershed, which is grade I in the theme, and one point is given to the basin, which is grade VII. Accordingly, it can be assessed that the water cycle is healthy in the watershed with high scores of the .
2.1.3. Problem-Focused Assessment for Each Watershed
The healthiness assessment aims to intuitively identify the water cycle problems in the sub-watershed. Accordingly, in the problem-focused assessment, the water cycle of the sub-watershed is evaluated with regard to whether the criteria for each metric are achieved (column No. 3 in Table 1).
On the other hand, since the water cycle problems may vary with the sub-watershed, it is appropriate to establish a different goal for each element rather than being defined as a uniform criterion. Since the restoration and enhancement plans are being established on a mid-watershed basis in South Korea, the criteria of the problem-focused assessment are the goals of the mid-watershed management. The condition of the water cycle healthiness may vary by mid-watershed. Thus, the criteria of the problem-focused assessment may be differently configured for each mid-watershed. In addition, since the condition of the water cycle healthiness can change to natural or artificial effects, it is appropriate that the criteria of the problem-focused assessment are set variably to reflect the current condition. However, in this paper, the uniform criterion (IV) was set for the study areas as a case of proposing the FHAWC. Table 5 presents the criteria of the problem-focused assessment for each theme set in grade IV based on Table 2.
2.1.4. Selection Procedure of Watersheds for Implementing the Restoration and Enhancement Plan
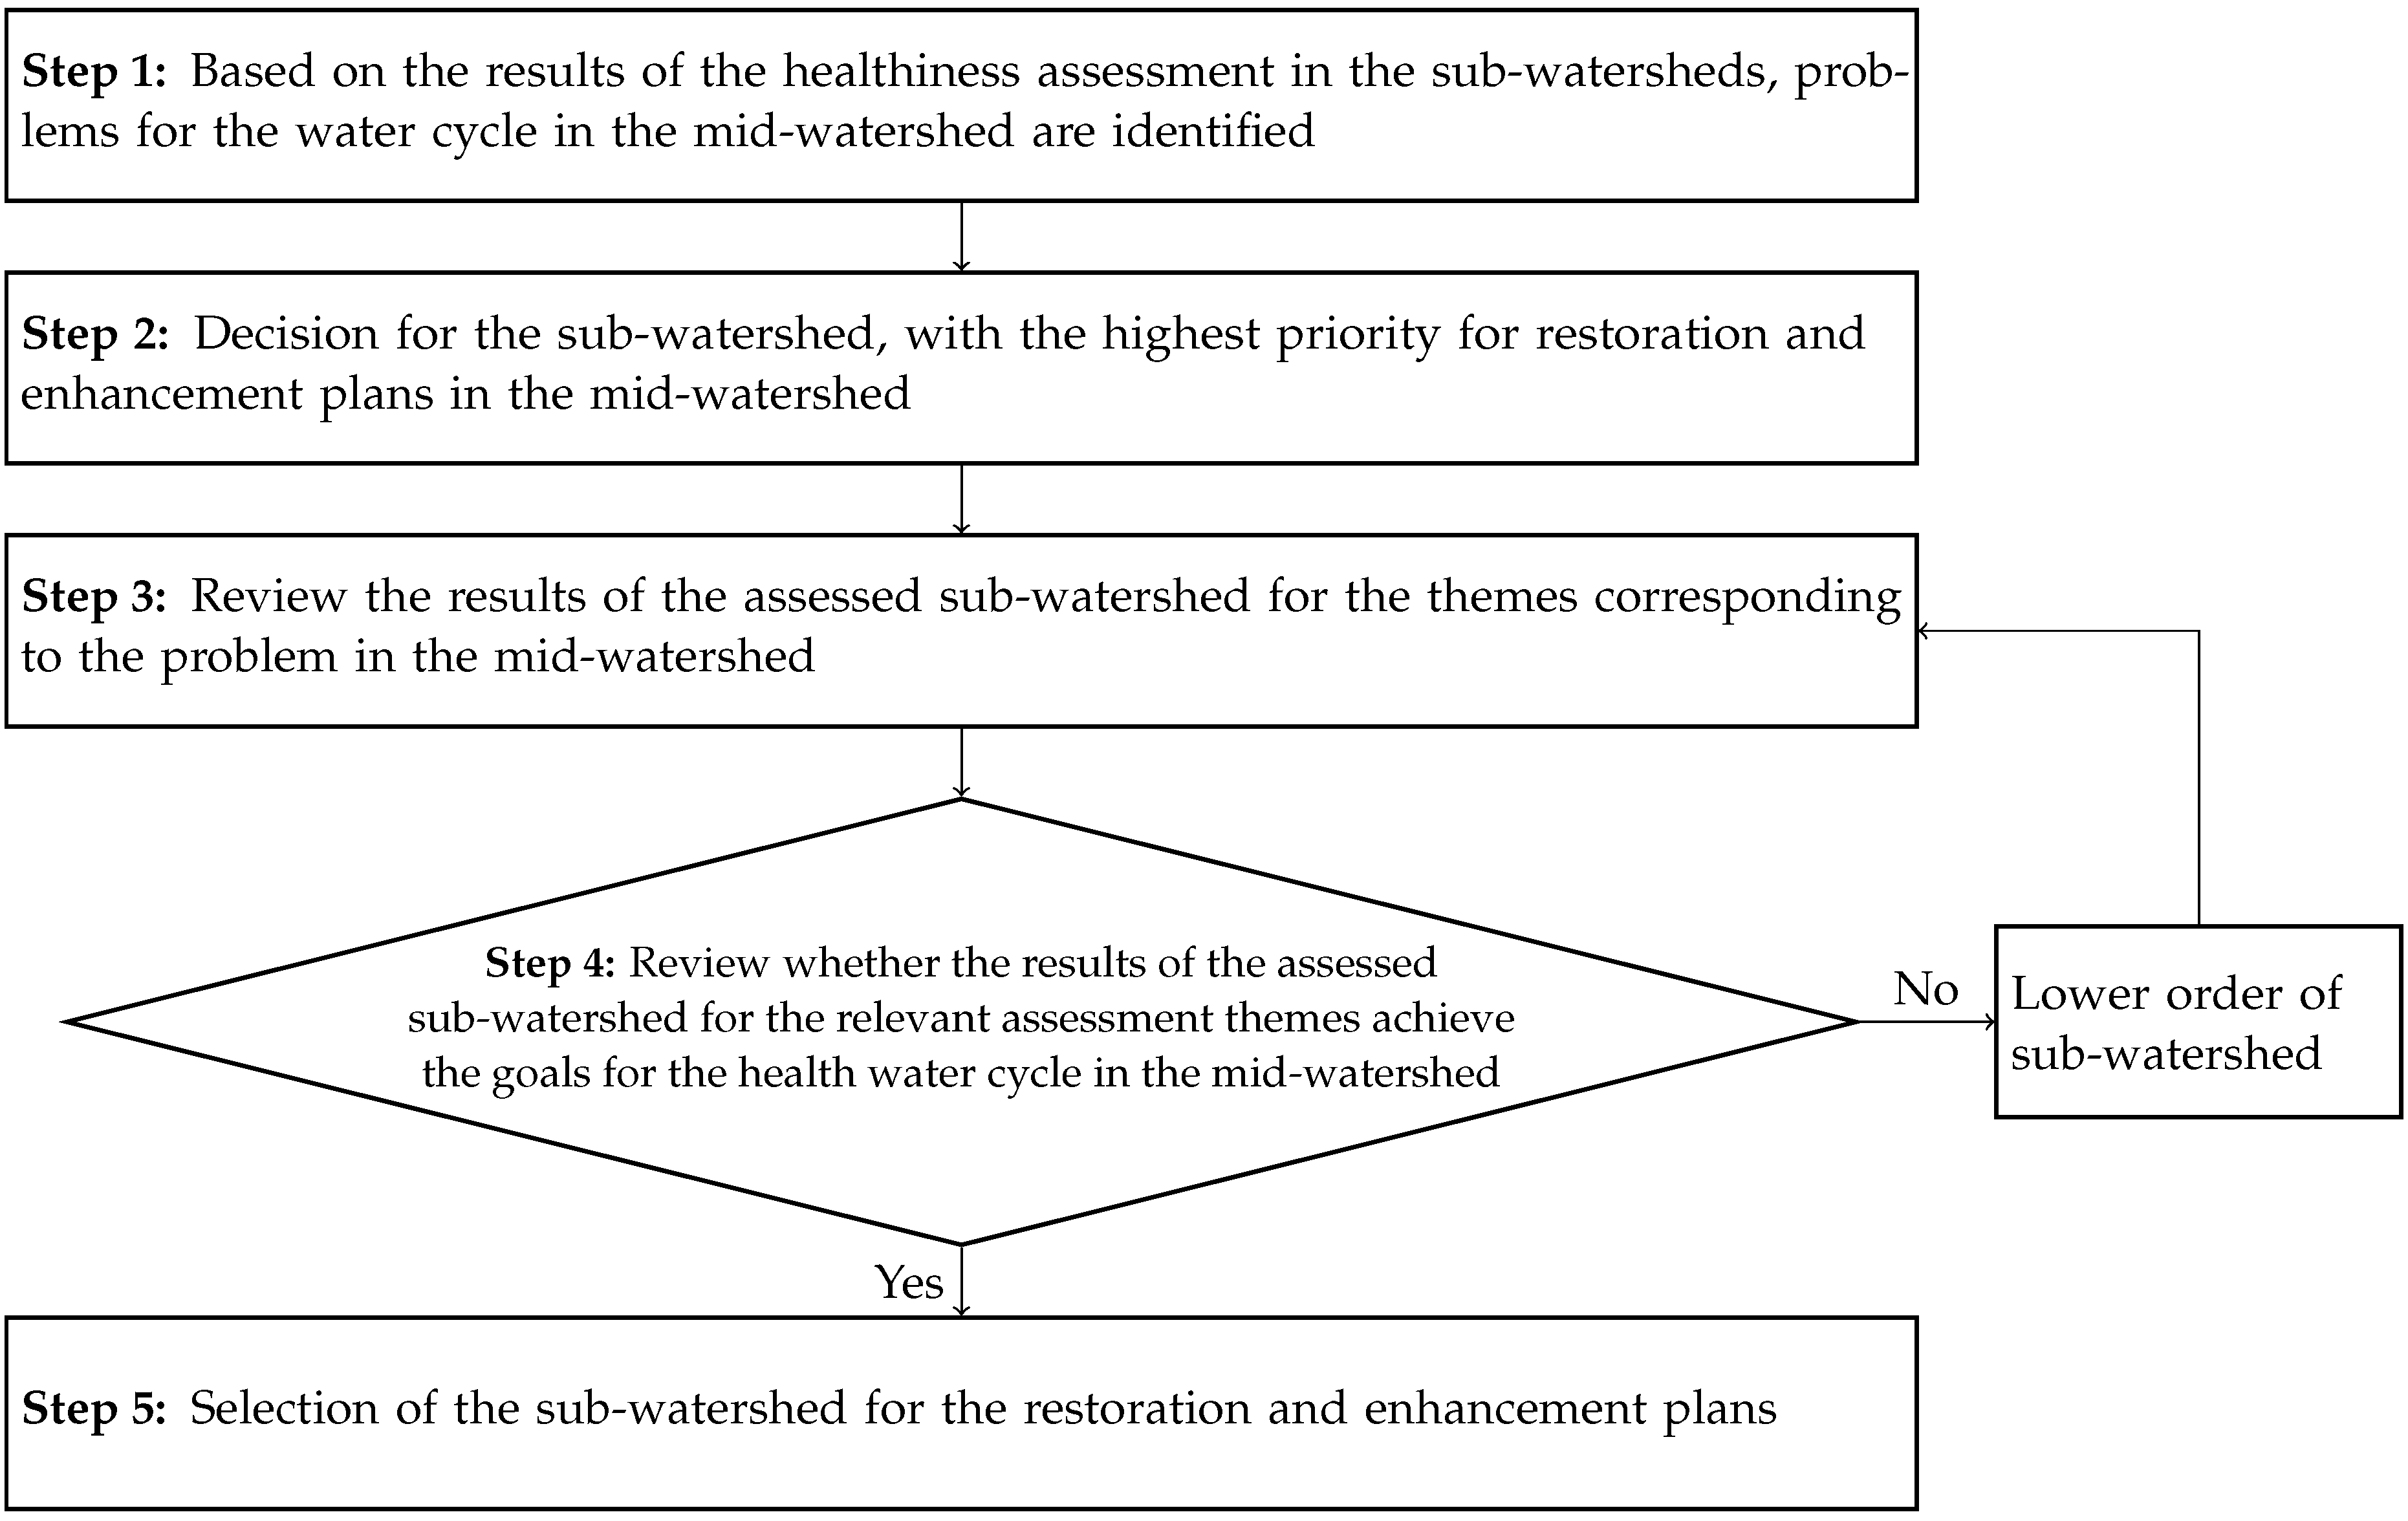
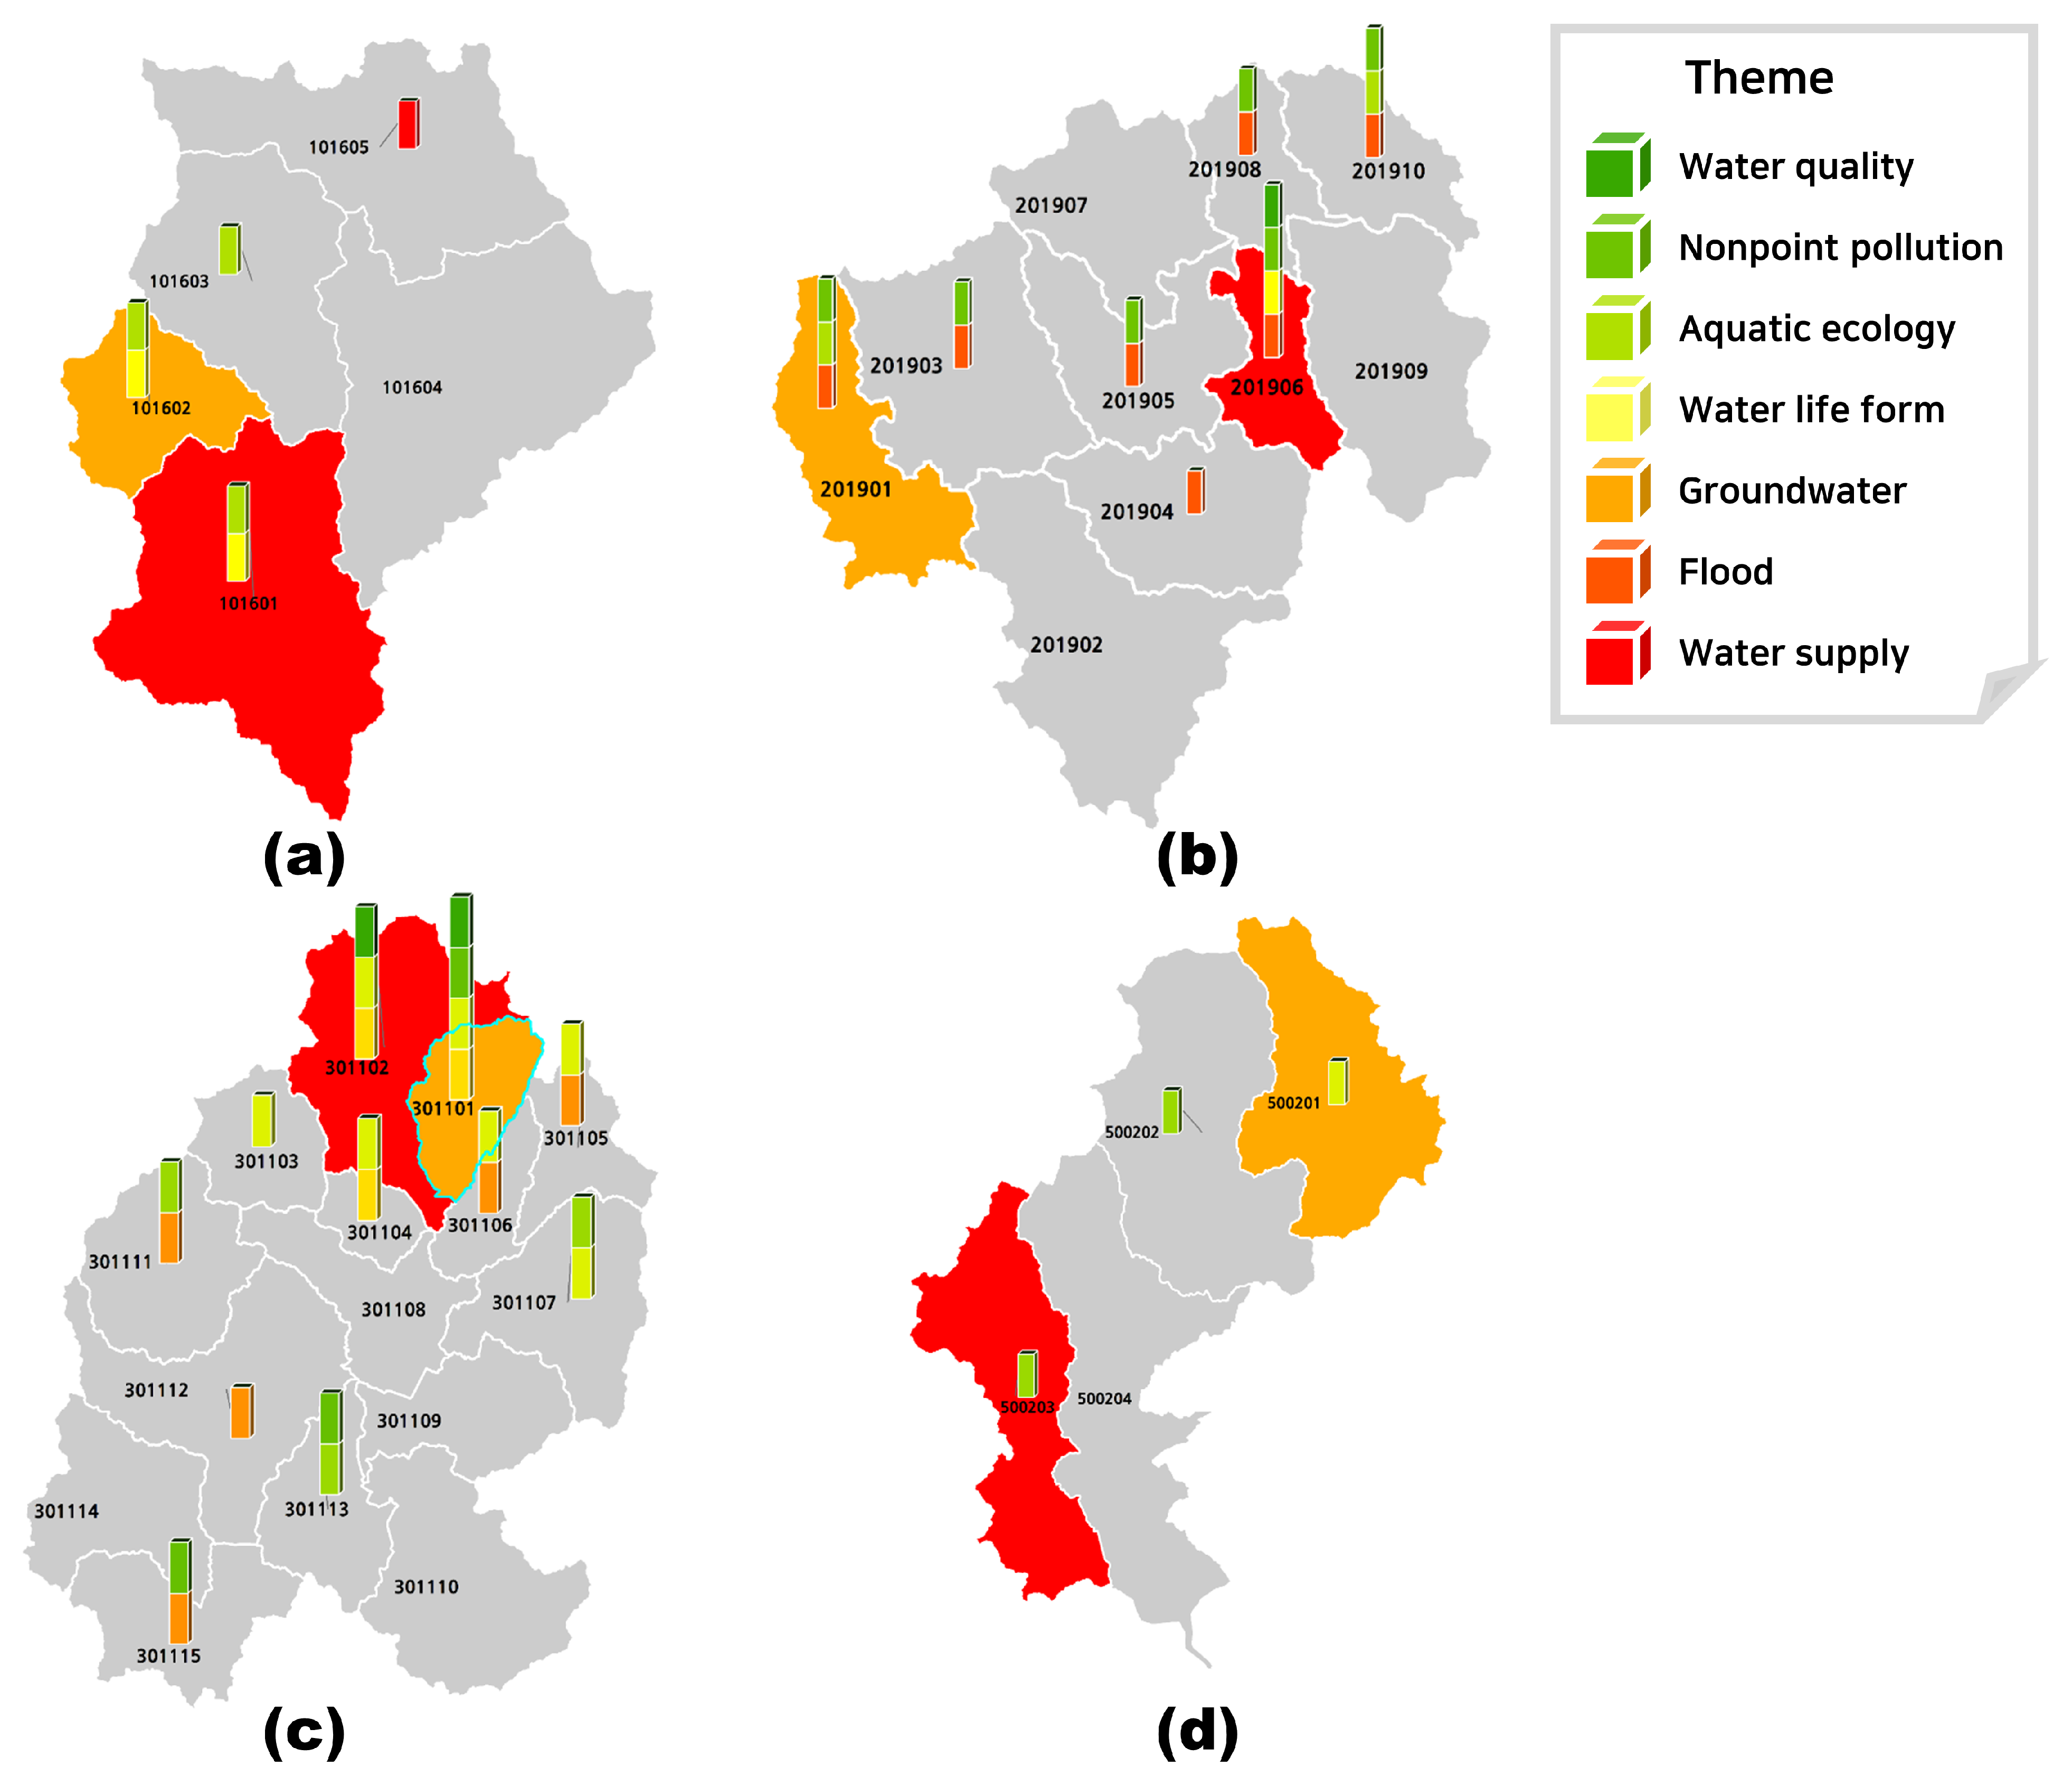
In South Korea, the restoration and enhancement plan to improve the water cycle healthiness in the mid-watershed is implemented in the sub-watershed unit. Accordingly, the restoration and enhancement plan is targeted at the sub-watershed with the highest priority that is decided using the above procedure. However, it is necessary to review whether the sub-watershed is an appropriate target to solve the problem in the mid-watershed. In other words, it should be reviewed whether there is a problem that is the same as the mid-watershed, even in the corresponding sub-watershed. Therefore, in this study, the procedure for selecting the sub-watershed for the restoration and enhancement plan is presented as shown in Figure 1.
First, after implementing the problem-focused assessment of the sub-watersheds in the mid-watershed, the theme with the most counted problems is selected as the representative water cycle problem in the mid-watershed (step 1 in Figure 1). The WHSIs for the sub-watersheds are computed via the priorities assessment. The sub-watershed, given the minor WHSI score, is selected for the sub-watershed with the worst water cycle healthiness (step 2 in Figure 1). The next step is to review whether the theme that determined that the selected sub-watershed has a problem in the problem-focused assessment is the same as the representative water problem in the mid-watershed (step 3 in Figure 1). If the selected sub-watershed has the same problem as the theme for the representative water cycle problem in the mid-watershed, the selected sub-watershed is decided as the target that needs restoration and enhancement plans the most (steps 4 to 5 in Figure 1). On the contrary, if the healthiness of the selected sub-watershed meets the goal for the representative problem theme in the mid-watershed, the sub-watershed of the next order is selected, and Steps 3 and 4 are repeated.
2.2. Study Area
South Korea has five major river basins: the Han river basin (41,405 ), Nakdong river basin (17,537 ), Geum river basin (9912 ), Seomjin river basin (7599 ), and Yeongsan river basin (7599 ). The Yeongsan river and Seomjin river basins have been managed as one basin, and the five river basins are called the four major river basins in South Korea. The river basins have been delineated into 113 mid-watersheds (within a middle watershed on the Korean Hydrologic Unit Map) to systematically manage river and water resources. In addition, each mid-watershed is delineated into several sub-watersheds (within a standard watershed on the Korean Hydrologic Unit Map). The annual average precipitation in South Korea was 1324 mm from 2005 to 2014, which is equivalent to approximately 1.6 times the world average. It is enough to classify the country as a high-rainfall region. Still, South Korea has a disadvantageous condition for managing water resources because most of the precipitation is concentrated in the rainy season (from 25 June to 25 September).
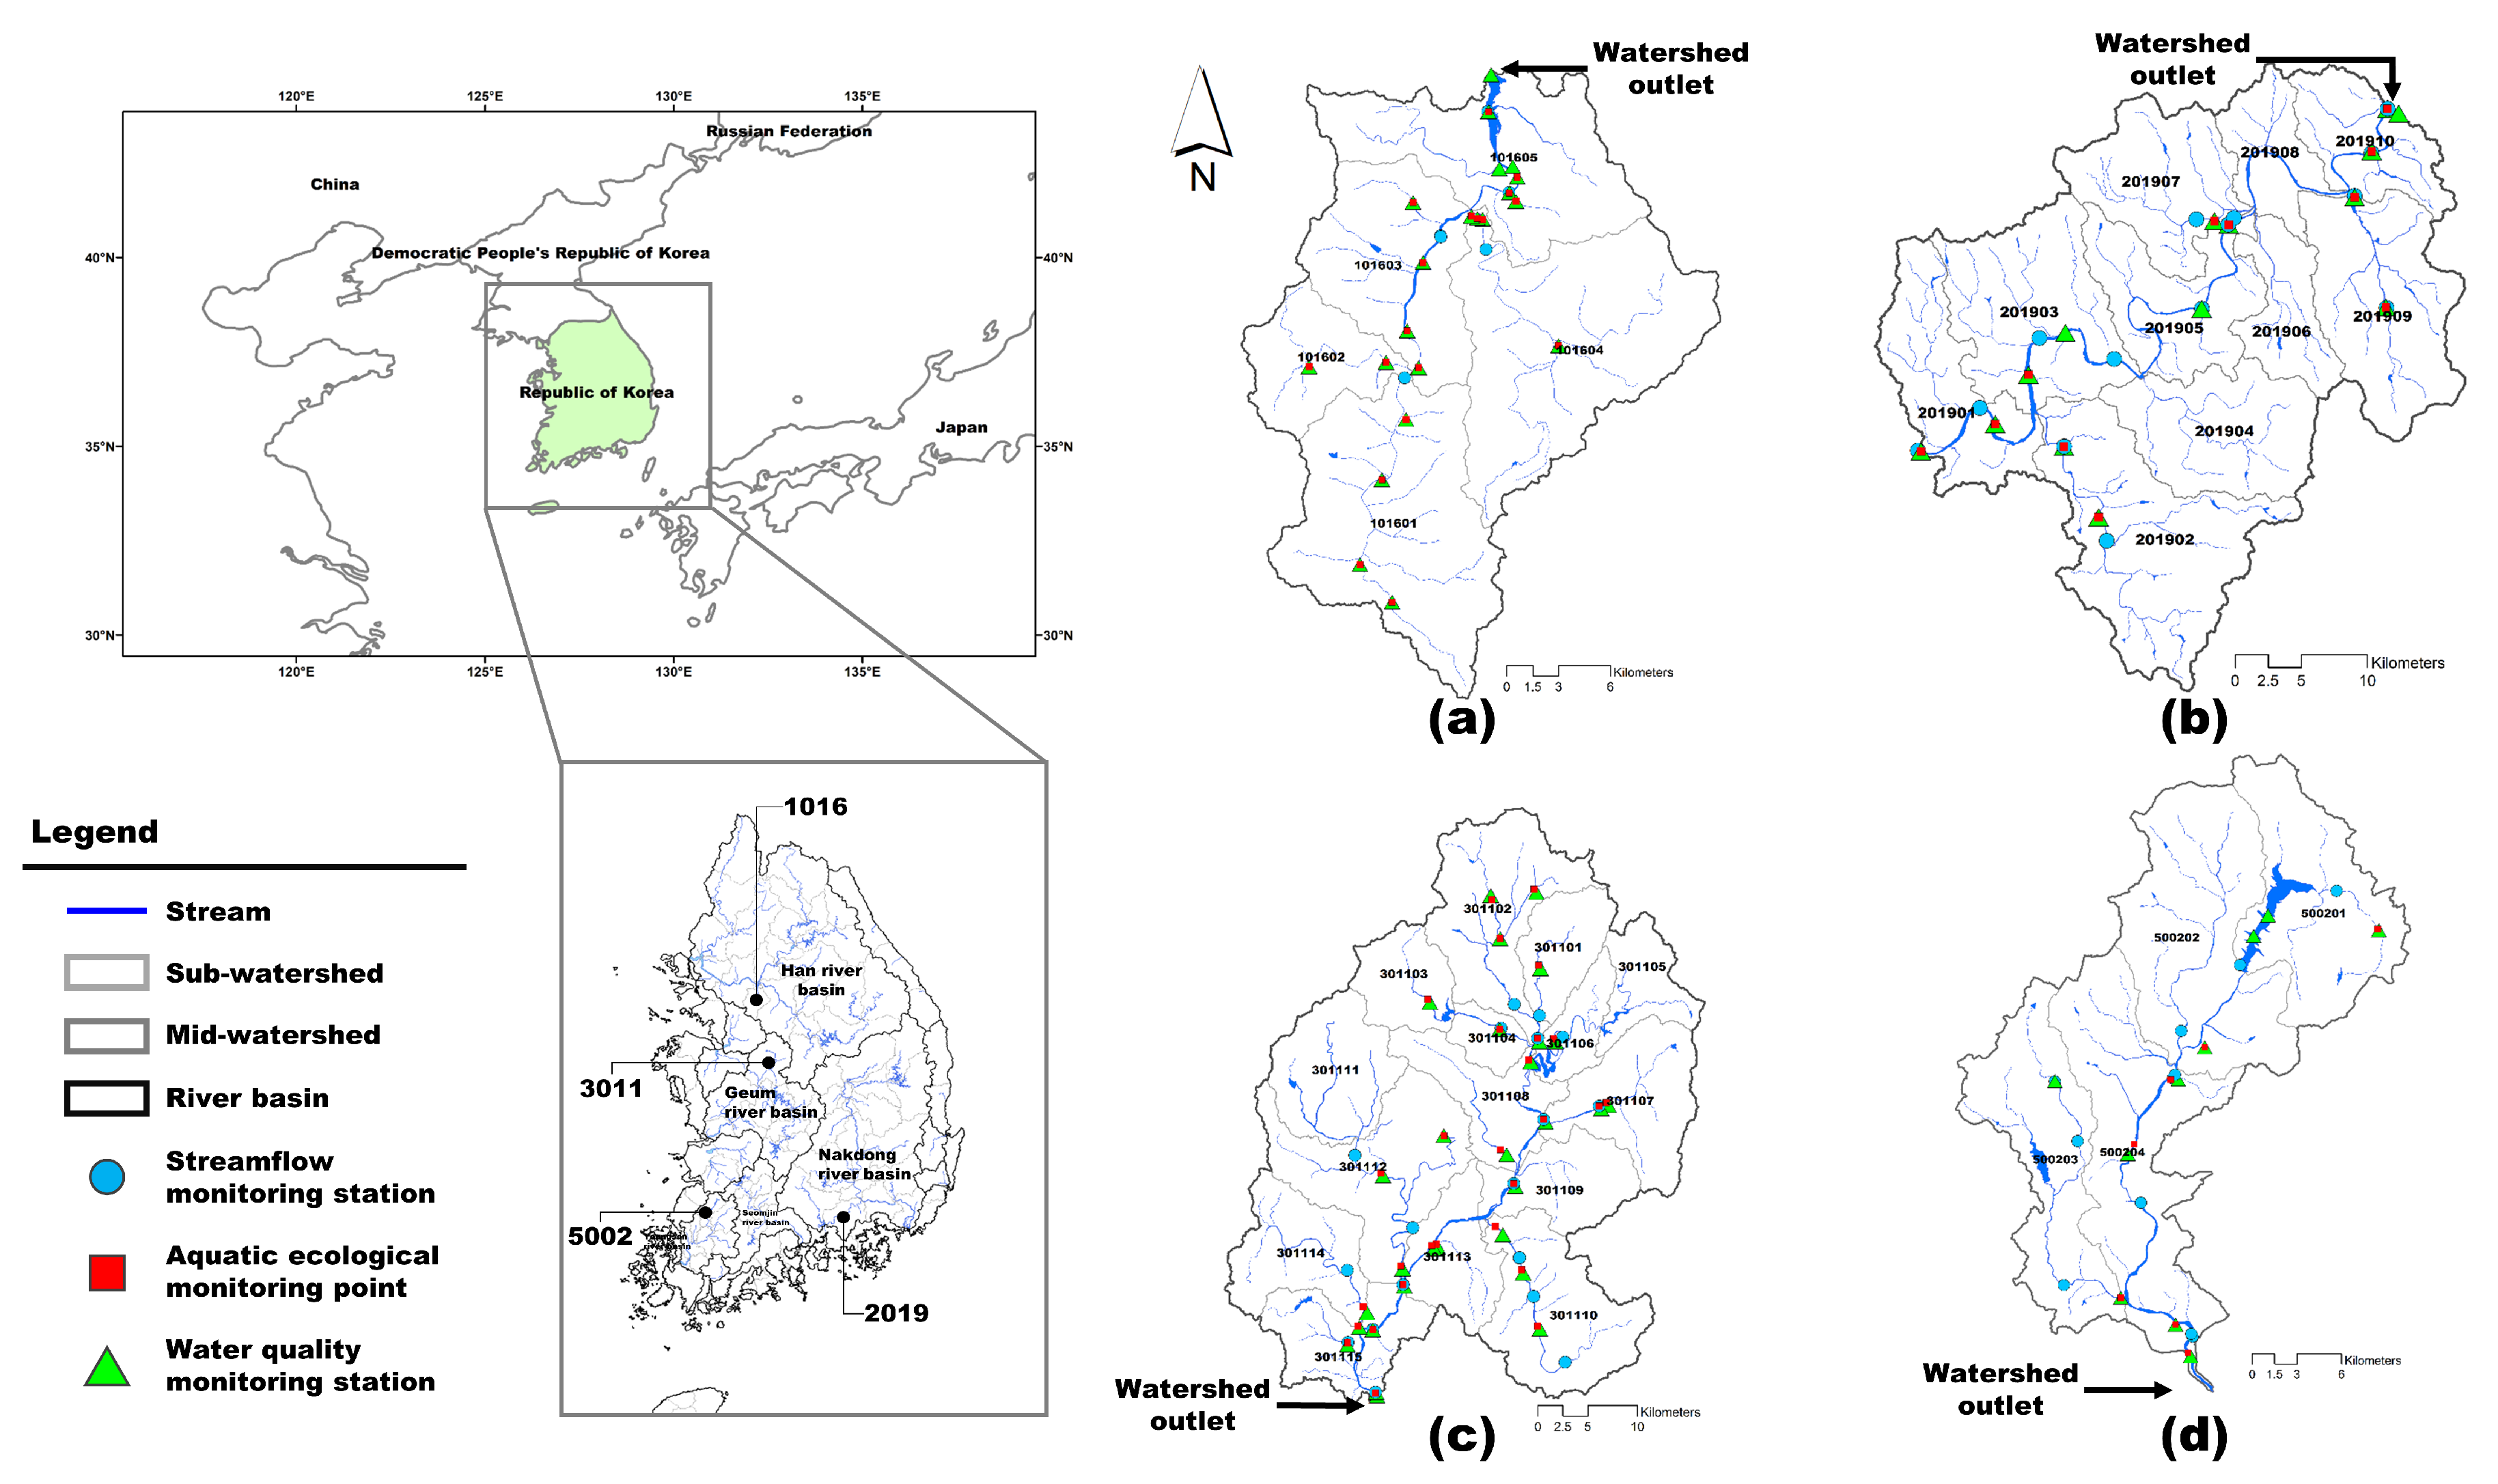
As study areas, the mid-watersheds in each river basin were selected based on two criteria: the number of water quality monitoring stations in the sub-watershed and the presence or absence of problems for the water cycle. The study area should be a well-known watershed where problems for the water cycle emerge to verify the results of the healthiness assessment for the water cycle. In addition, since the water quality of the watershed in the healthiness assessment for the water cycle is evaluated based on monitoring data, the number of monitoring stations located in the sub-watershed is important. Therefore, the study areas selected for each river basin were the mid-watersheds of Gyeongan stream (watershed code: 1016), Namgang river (watershed code: 2019), Miho stream (watershed code: 3011), and Hwangryong river (watershed code: 5002), as shown in Figure 2. South Korea installs and operates an automatic water quality monitoring system in rivers and lakes across the country for the purpose of water source protection and water quality management. In addition, an aquatic ecological monitoring network is being operated to evaluate the current status and soundness aquatic ecosystem. At the aquatic ecology monitoring points, fish, benthic invertebrates, and waterfront vegetation are monitored once to four times a year. Figure 2 presents water quality and streamflow monitoring stations and aquatic ecology monitoring points in the study areas. The monitoring data are available in the Water Environment Information System (https://water.nier.go.kr/, accessed on 30 October 2022) and Water Resources Information System (http://www.wamis.go.kr:8081/eng/, accessed on 30 October 2022) of the Korea Ministry of Environment. Table A1 presents the characteristics of the study area: watershed area, mean elevation, slope, annual precipitation, and land use characteristics. To apply the FHAWC to various watersheds and verify their performance, the study areas include sub-watersheds with various topographic and meteorological characteristics: highland mixed land use mountainous watersheds, rural watersheds, and urban watersheds (Table A1). Table 6 presents the emergent problems for the water cycle and the current conditions for the study of mid-watersheds.
2.3. Water Cycle Healthiness Index
2.3.1. Water Quality
The Korean Ministry of Environment (KME) established the Water Environment Conservation Act (WECA) in 2013 [17] to manage and preserve the water environment in public waters, e.g., rivers, streams, and lakes. The ambient water quality standards are noted as contributing to a living environment and a human health protection by Article 10-2 of the WECA [17]. The ambient water quality standards for the living environment suggest seven water quality factors, i.e., power of hydrogen (pH), biological oxygen demand (BOD), total organic carbons (TOC), suspended solids (SS), dissolved oxygen (DO), total porosity (TP), and coliforms. The ambient water quality standards for the human health protection suggests 20 chemicals, including heavy metals. The items for the human health protection are restrictively being measured in South Korea, so that there is a limit being used to assess the water cycle healthiness.
In accordance with Article 10-2 of the WECA [17], the KME announces the goal for the water quality criteria of BOD and TP in the mid-watershed, and the ambient water quality standards are shown in Table 7. The goal for water quality criteria is announced differently for each mid-watershed with the consideration of various conditions: the purpose of rivers and lakes, the conditions for the water environment, the aquatic ecological soundness, and the status and prospects of point source pollution. The goals for the water quality criteria of the mid-watersheds are shown in Table 8.
The ambient water quality standards for the living environments of rivers were used as a metric of the water quality theme in the healthiness assessment of the water cycle. The classified water quality index for the priorities assessment adopted the ambient water quality standards for the living environments of rivers in Table 7.
On the other hand, as a result of pre-applying the healthiness assessment of the water cycle, few sub-watersheds achieved the goal in Table 8, and there were a few sub-watersheds assessed as grade III in the water quality theme. When the goals in Table 8 are adopted for the criteria of the problem-focused assessment, water quality problems are identified in almost all the study areas, making it difficult to prioritize. Thus, in this study, the criteria of the problem-assessment evaluation for the water quality theme was set to grade IV in Table 2. The healthiness assessment for water quality theme was conducted using the water quality monitoring data from 2010 to 2019. The water quality monitoring data are available in the Water Environment Information System (https://water.nier.go.kr/, accessed on 30 October 2022).
2.3.2. Non-Point Source Pollution
In accordance with Article 53-5 of the WECA [17], the KME presented the Guidelines for Calculating Water Circulation Management Indicators for Non-Point Pollution Management. In this guideline, the rainfall goal to control non-point source pollution is defined as 25.4 mm. As an indicator, the following equation is presented:
where the designed rainfall is 25.4 mm. For reference, the water cycle ratio defined in Article 53-5 of the WECA [17] is different from the broad sense aimed in this study.
The metric of the non-point source pollution theme for FHAWC is defined using the above guidelines. As the metric of the non-point source pollution theme, the NRCS method to determine excess rainfall presented in Equation (5) is used.
where Q denotes the direct runoff depth (mm), P denotes the rainfall depth (mm), and S denotes the potential maximum retention (mm). The relationship between S and the curve number (CN) can be expressed as follows:
2.3.3. Aquatic Ecology
In accordance with Article 9-3 of the WECA [17], the KME presents the Guidelines on Examination of Current Status and Health Assessment of Aquatic Ecosystems. The guidelines present five aquatic ecology health indices that are classified into five groups, as shown in Table 9. The indices for aquatic ecological soundness are the trophic diatom index (TDI), benthic macroinvertebrate index (BMI), fish assessment index (FAI), riparian vegetation index (RVI), and habitat and riparian index (HRI).
The aquatic ecology health indices in Table 9 were used as a metric for the aquatic ecology theme in the FHAWC. In the problem-focused assessment of the aquatic ecology theme, the criteria for the decision that there is no problem are a grade of IV in Table 2. The priorities assessment for the aquatic ecology theme is determined using the averaged normalization scores for each of the five indices, as shown in Equation (7).
where n is the number of indices. For the aquatic ecology health indices, and in this study, five indicators are used, so that it becomes 5. is the normalized score of the aquatic ecology health index, and it is calculated as follows:
where i is the aquatic ecology health index in Table 9. is the score for the aquatic ecology health index i of the sub-watershed to be assessed. and are the maximum and minimum scores of all sub-watersheds assessed for the aquatic ecology health index i.
In this study, the aquatic ecology health indices of the study areas were computed using the aquatic ecology monitoring data from 2010 to 2019 (10 years). The aquatic ecology monitoring data are available in the Water Environment Information System (https://water.nier.go.kr/, accessed on 30 October 2022).
2.3.4. Water Flow Maintenance
In accordance with Article 51-1 of the River Act [18], the KME announces the instream flow rate for the major river and stream points. The metric for the water flow maintenance in the FHAWC was set as proportional flow duration for the announced instream flow (). The flow duration is defined as the number of days per year in which a discharge is greater than a particular value (https://www.epa.gov/caddis-vol2/flow-alteration, accessed on 30 October 2022). Since the is significantly affected by drought or flooding, this study evaluated the condition of the water flow maintenance with ten years averaged . Thus, the metric for the water flow maintenance theme in the healthiness assessment of the water cycle is assessed based on the average for ten years (2010–2019).The PFD can be formulated as follows:
is the days when daily streamflow exceeds the announced instream flow in the yeary. is the number of years.
The instream flow rate in the sub-watershed where the instream flow rate was not announced was replaced with the standard low flow rate. As a standard flow that determines a diversion requirement by evaluating the water supply ability of streamflow in the aspect of water use, the standard low flow is calculated by the one-day flow that occurs on average once every 10 years. is the 355th daily flow in the flow–duration curve. Table 10 presents the announced instream flow and standard low flow for the study areas. For reference, the Korean Han River Flood Control Center provides values of the standard low flow and the instream flow for each sub-watershed nationwide (http://ras.hrfco.go.kr:8989/introLowFlowList.do, accessed on 30 October 2022).
The problem-focused assessment for the water maintenance theme is assessed by examining whether the by sub-watershed is less than 32%. Here, 70% of the is the boundary value of grade IV for the groundwater theme in Table 2. As the daily flow data for each sub-watershed, the monitoring data are used when there is the monitoring station where the flow is measured in the sub-watershed. On the other hand, the simulation result, which is calculated by the Soil and Water Assessment Tool (SWAT), is used when there is no monitoring station.
2.3.5. Groundwater
In the Republic of Korea, groundwater environmental data, including water temperature and water quality, and groundwater level are monitored, and the monitoring data related to groundwater are provided through the National Groundwater Information Center (http://www.gims.go.kr/en/, accessed on 30 October 2022). In addition, the National Groundwater Information Center monitors the amount of groundwater pumped nationwide to understand the current status of groundwater development, and it estimates and provides the volume for the available groundwater development in the watershed. The metric for the groundwater theme in the healthiness assessment for the water cycle is the stage of groundwater development (). The is defined as a ratio of the annual groundwater draft and net annual groundwater availability in percentage by India of the Central Ground Water Board [24]. The is formulated as follows:
The National Groundwater Information Center of the KME operates the groundwater monitoring network and opens the monitoring data via a website (https://www.gims.go.kr/en/, accessed on 30 October 2022). The monitoring data related to groundwater include the groundwater quality, level, and the annual groundwater draft in the watershed unit. In addition, the National Groundwater Information Center provides the net annual groundwater availability in watershed units. This study calculated the using the collected annual groundwater draft and net annual groundwater availability in 2019.
The problem-focused assessment for the groundwater metric is assessed by examining whether the by sub-watershed exceeds 70%. Here, 70% of the SGD is the boundary value of grade IV for the groundwater theme in Table 2.
2.3.6. Flood
The Guidelines for Establishing a River Basin Water Management Plan, which is being established pursuant to Article 6 of the Water Resources Investigation, Planning and Management Act, presents the proportional distance of the levee meeting the design level () as an indicator of the flood management of rivers and streams. The is formulated as follows:
In the problem-focused assessment, the goal of achieving the is set at 35%, and the achievement of each sub-watershed is reviewed. The priorities assessment for the flood theme is conducted by considering the grade according to the in Table 2. The healthiness assessment of the flood theme is performed based on the monitoring data. In this regard, the monitoring data for the river regime (e.g., the distance of levee for the rivers, and the current state of the restoration and refurbishment plans for the rivers) is available on the list of rivers in South Korea [25].
2.3.7. Water Supply
The metric for the water supply theme is set as a percentage of water supply-restricted residents (). The is formulated as follows:
The problem-focused assessment for the water supply theme is evaluated by reviewing the occurrence of water restrictions for the sub-watershed. The priorities assessment for the water supply theme is conducted by considering the grade according to the in Table 2. In this regard, the monitoring data (e.g., the number of residents by administrative district, the number of water supply-restricted residents, and the ratio between the sub-watershed and administrative district residents) are supported by the Korean National Drought Information-Analysis Center (https://www.drought.go.kr/english/, accessed on 30 October 2022). In this study, the is computed using the collected monitoring data from 2010 to 2019 (10 years).
3. Results and Discussion
3.1. Results of the Healthiness Assessment for the Water Cycle
3.1.1. Water Environment Category
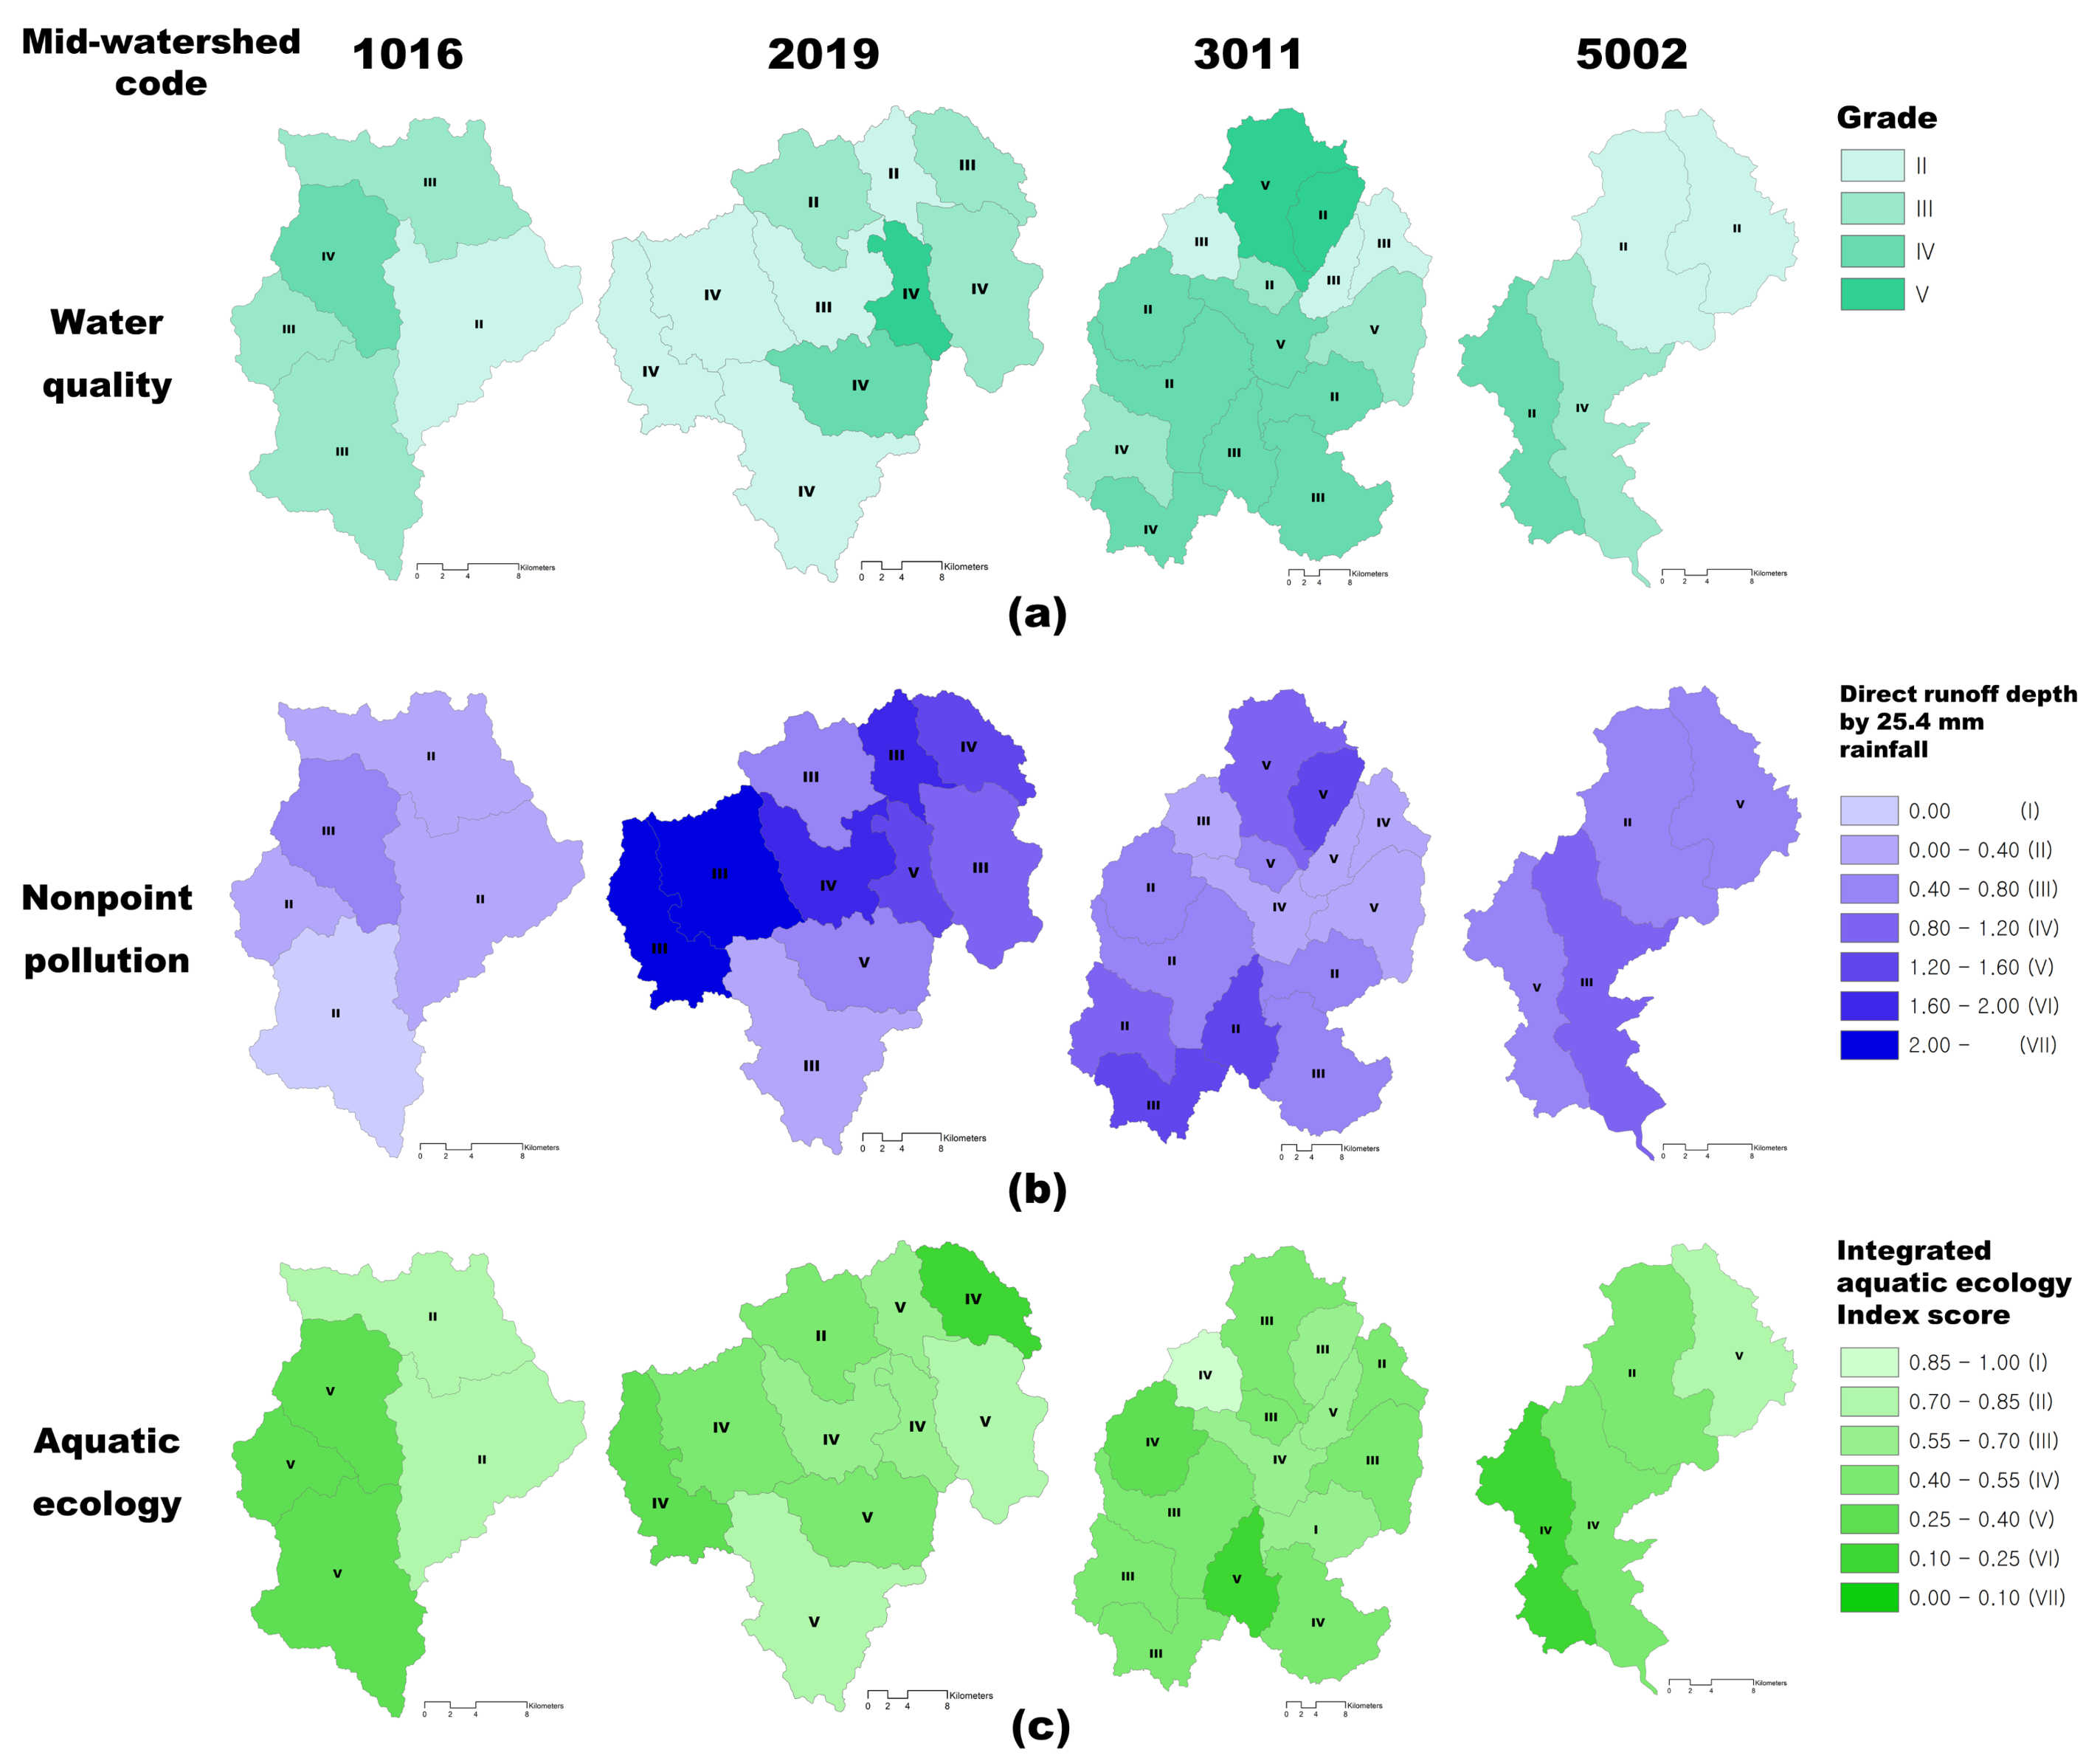
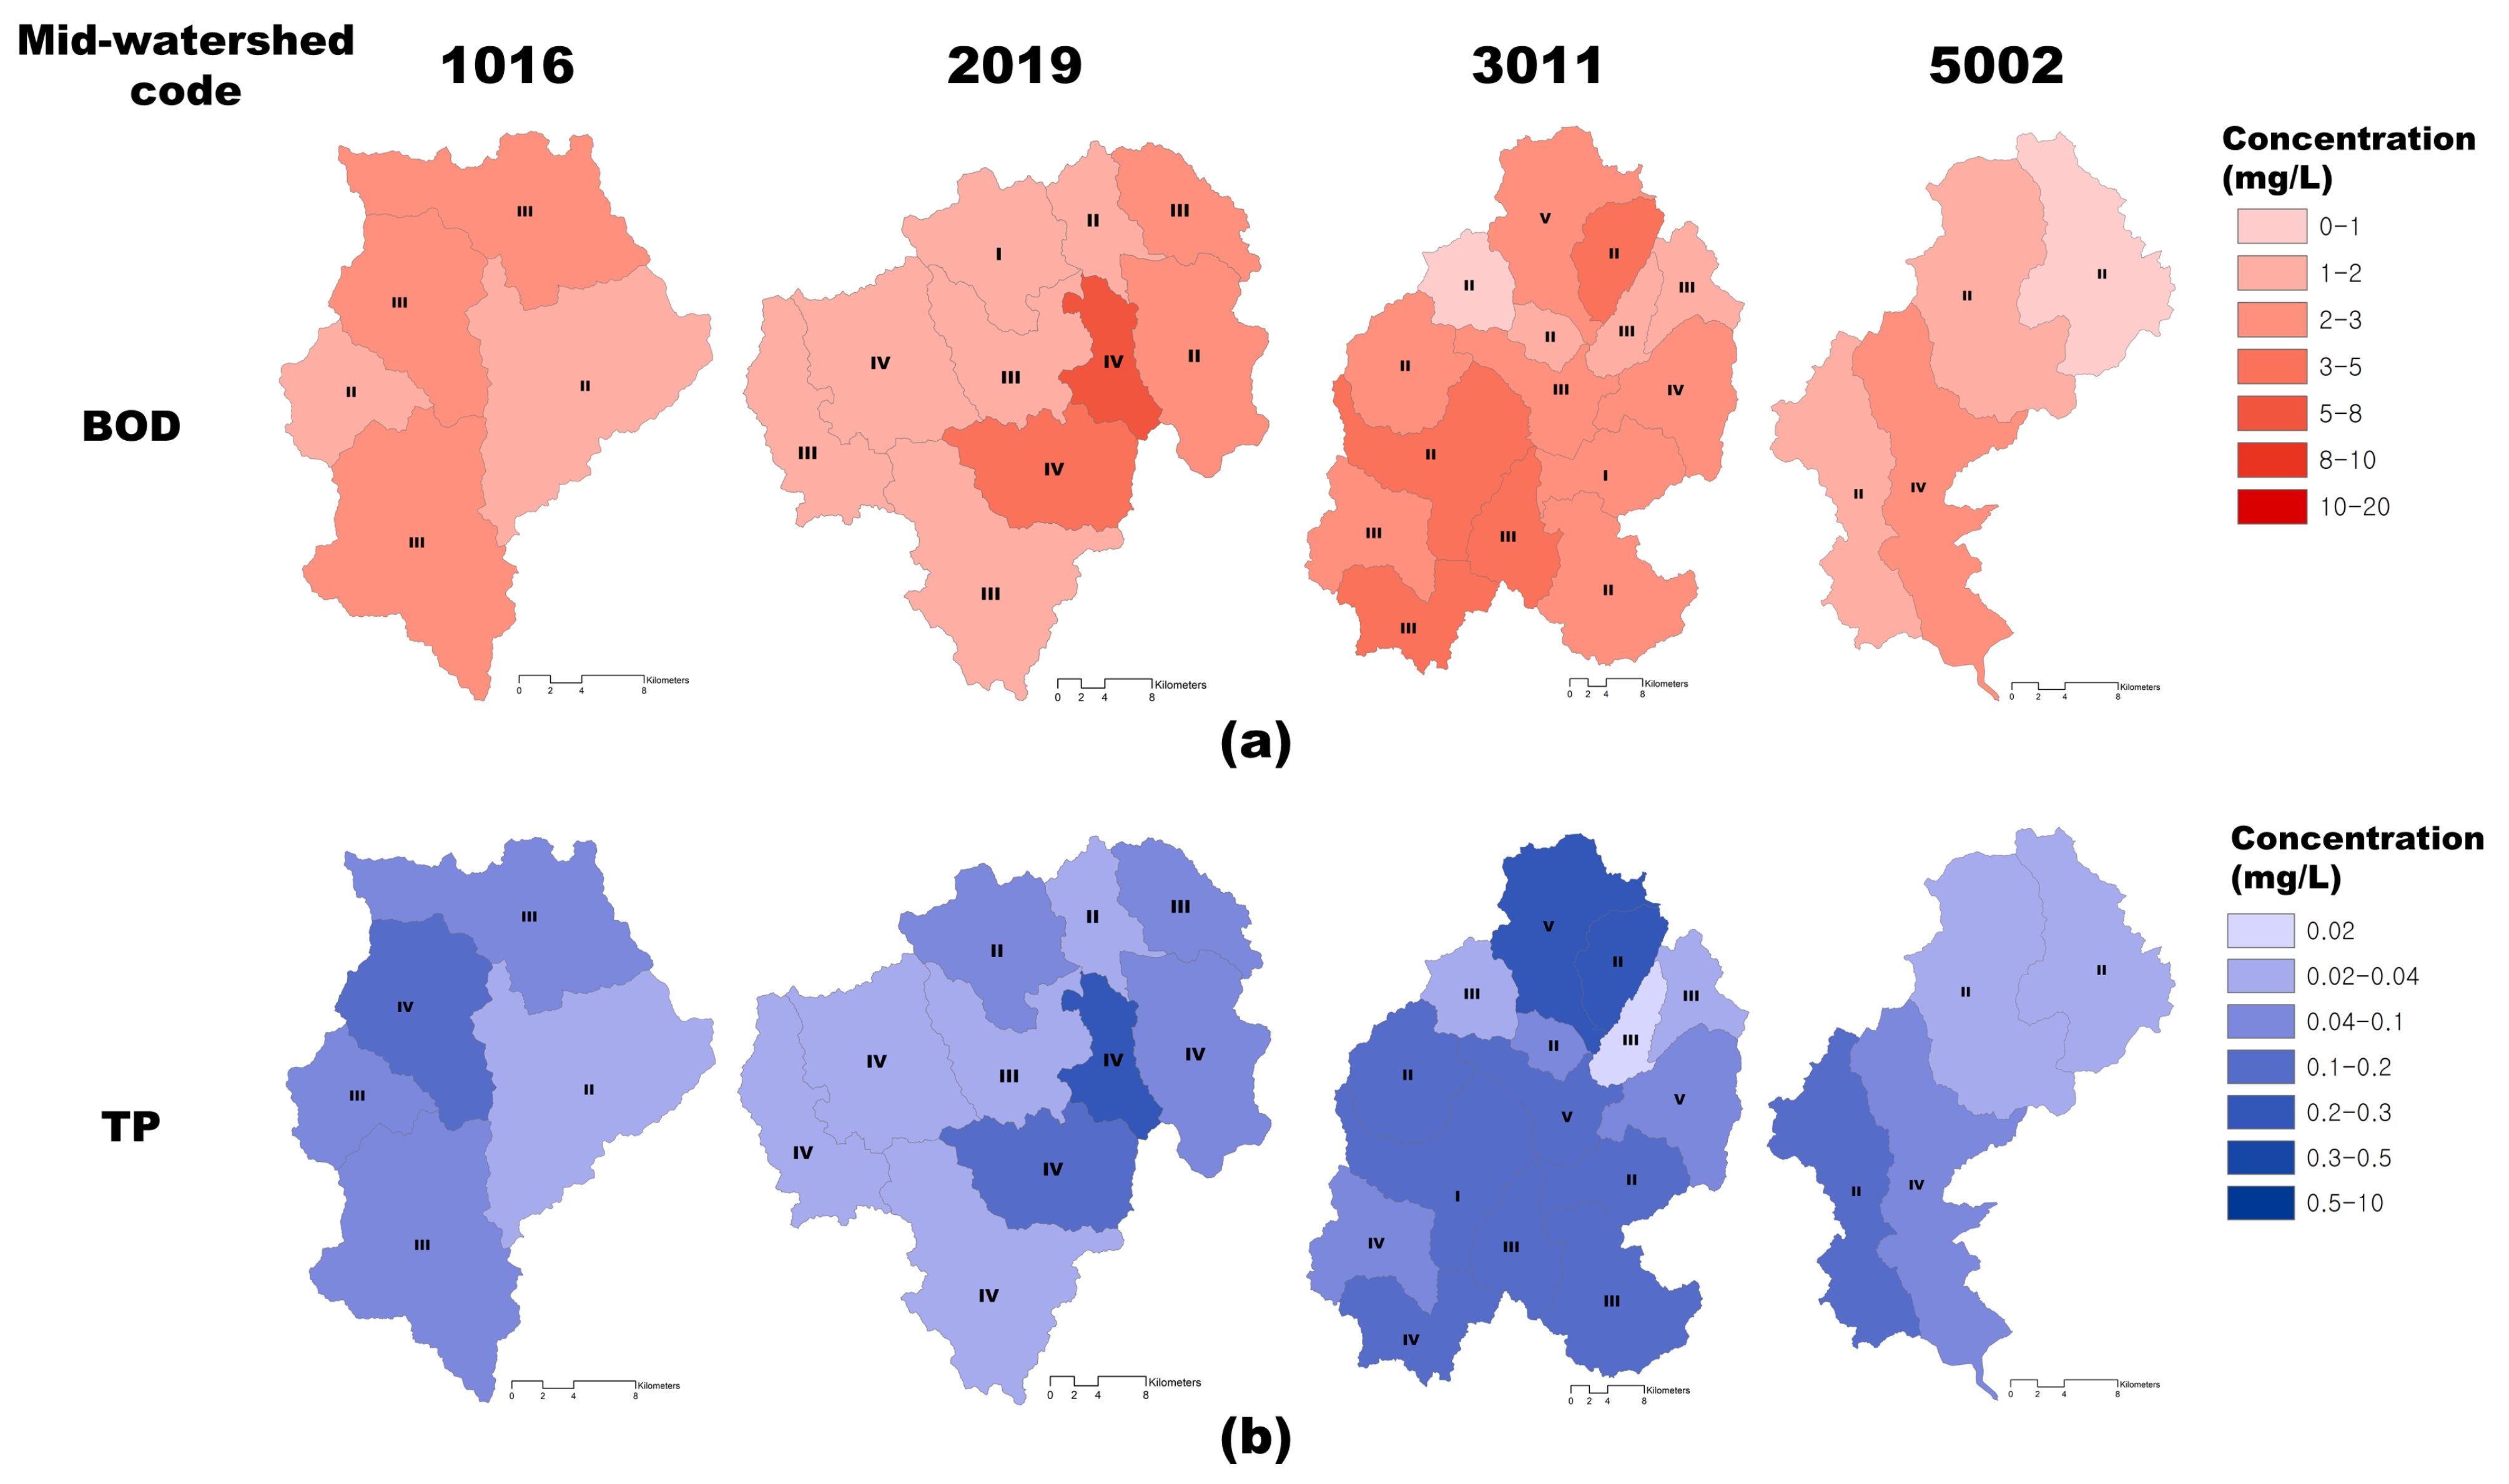
The healthiness evaluation by the sub-watershed was performed using observational data from 2010 to 2019. Figure 3a shows the results of the healthiness assessment for the water quality theme for each sub-watershed included in the study area. In Figure 3a, after evaluating the healthiness of BOD and TP (Figure A1), the lower of the two evaluation indicators was decided as the grade for the water quality theme in the sub-watershed. When several of the water quality monitoring stations were located in the sub-watershed, the number of water quality monitoring data points was different, so the weighted average was analyzed using the number of monitoring data points. For this reason, the monitoring data were calculated as a weighted average using the number of monitoring data points, and they were graded based on the weighted average value.
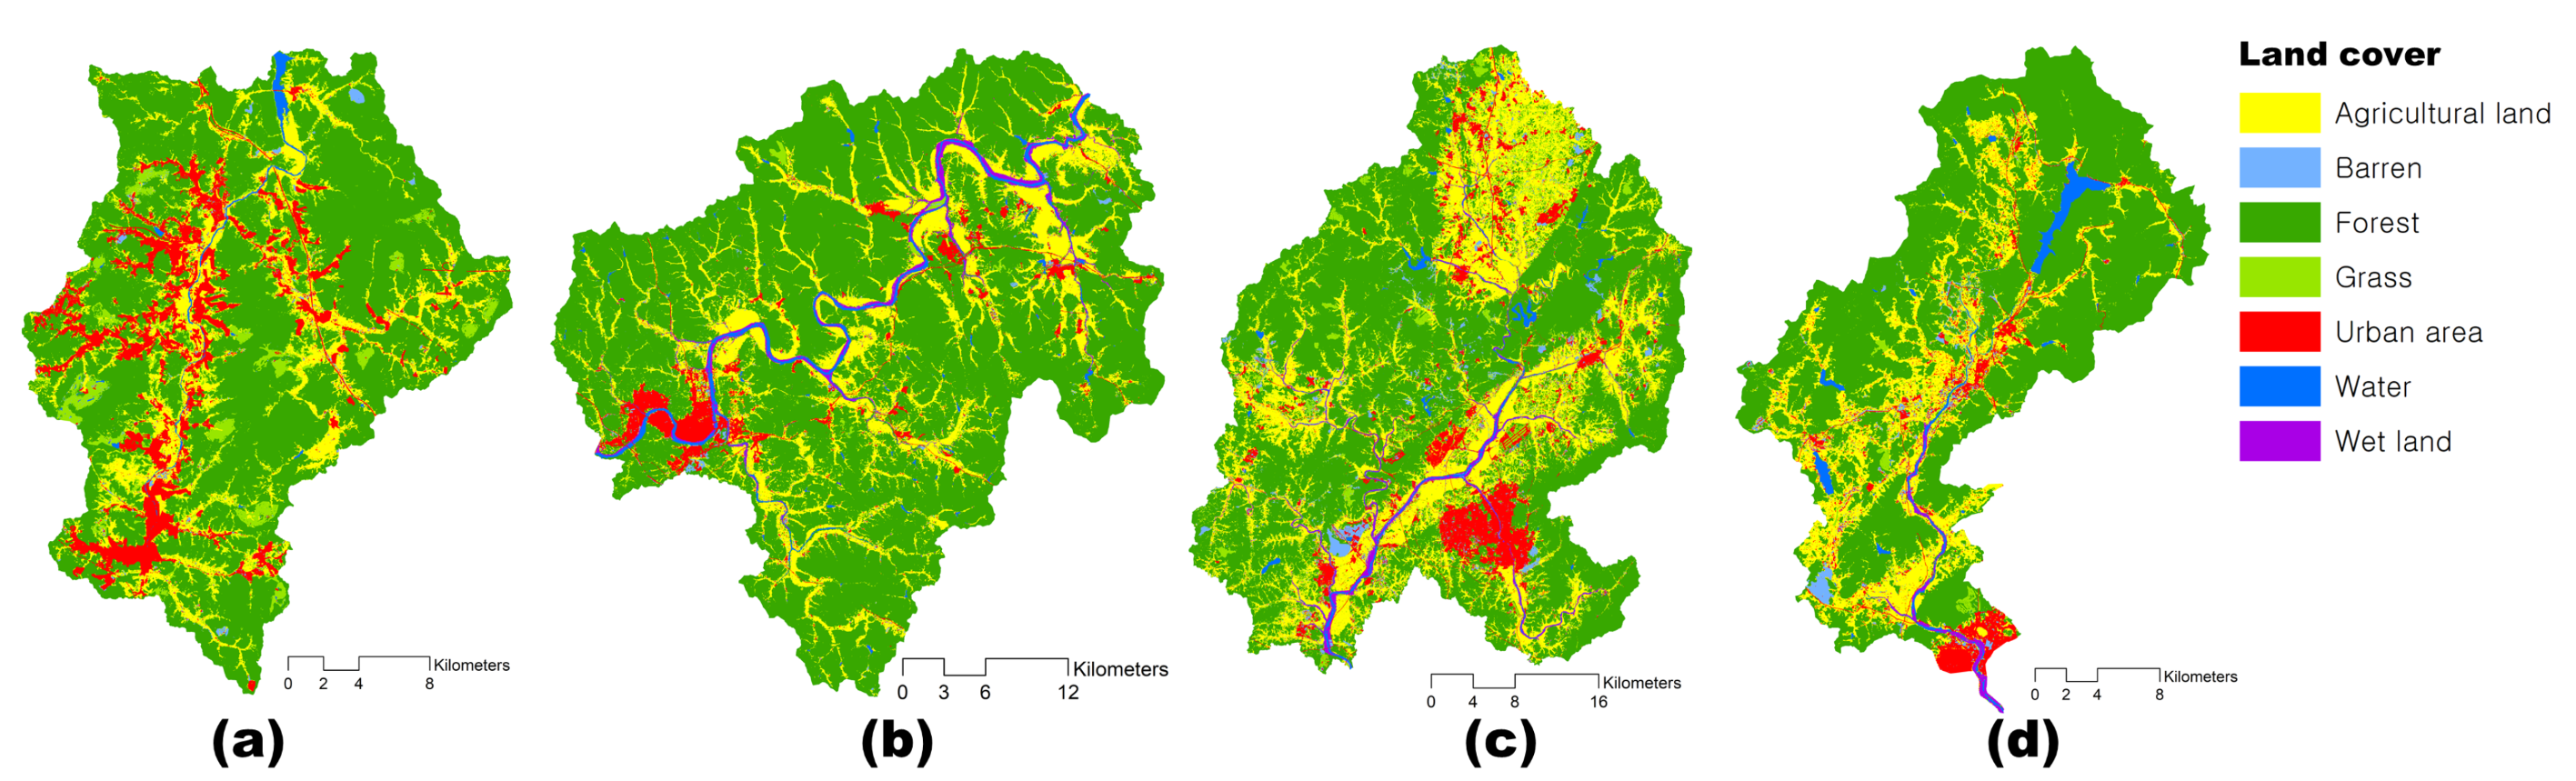
The healthiness of the non-point source pollution theme is assessed using the excess rain depth for the design rainfall (25.4 mm) according to the ’Guidelines for Calculating Water Circulation Management Index for Non-point Pollution Control.’ In this study, the CN (curve number) was determined using the soil and land use map (Figure A2) for the sub-watershed of the four study areas (mid-watershed). The direct runoff depth for each sub-watershed was calculated using Equations (5) and (6).
Figure 3b shows the assessed water cycle healthiness for the non-point source pollution theme. For reference, the CN to catch the design rainfall (25.4 mm) was analyzed as 67.3. That is, if the CN is 67.3, the excess rainfall depth becomes ‘0’ for the design rainfall of 25.4 mm.
The soundness of the aquatic ecology theme was assessed using the monitoring data from 2010 to 2019. One or more aquatic ecological monitoring points were located in all of the sub-watersheds included in the four study areas. The integrated aquatic ecology index by the sub-watershed is the average value of 10 years. The sub-watershed has multiple monitoring points, and the integrated score is determined by averaging the data by point. However, since the number of measurements by year and point was different, a weighted average was taken into consideration for the number of monitoring data.
3.1.2. Water Use Category
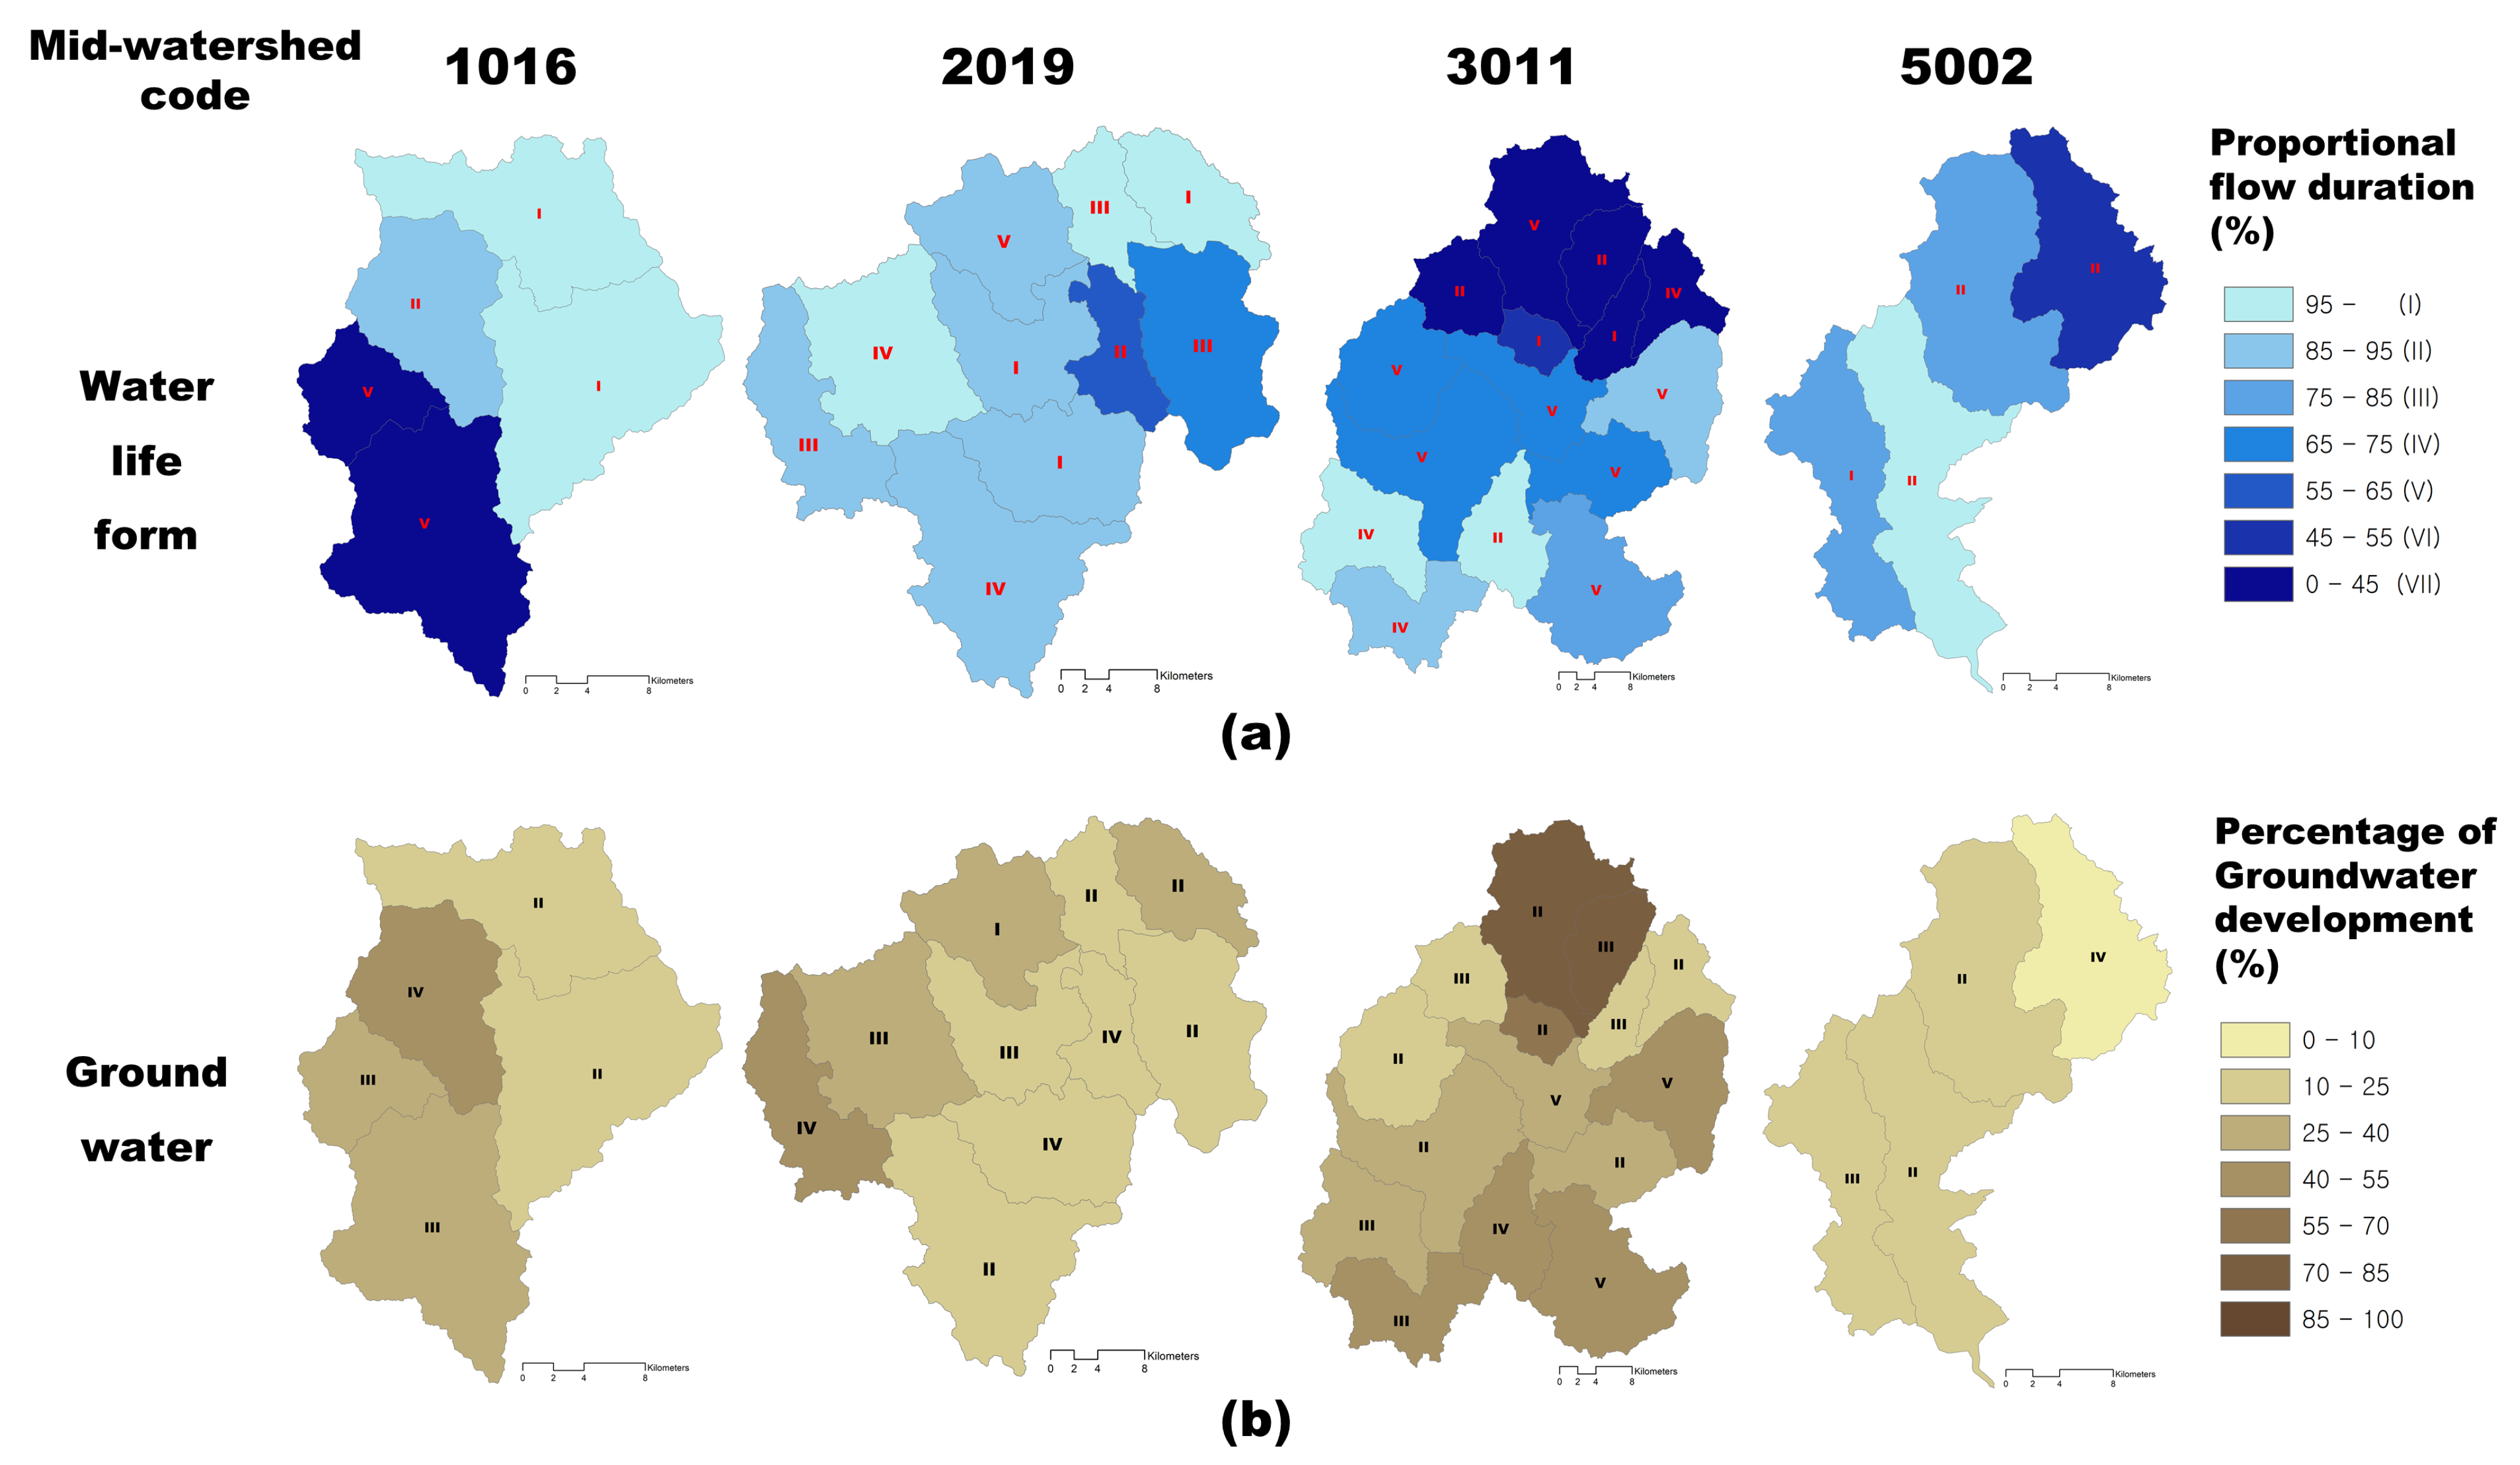
Figure 4 shows the assessed healthiness for water flow maintenance (Figure 4a) and the groundwater theme (Figure 4b). The healthiness assessment of the water flow maintenance theme is assessed using the in Equation (9). The healthiness assessment of the water flow maintenance was performed from 2010 to 2019.
The healthiness of the groundwater theme is assessed using , which is calculated as the ratio of the annual groundwater draft and the net annual groundwater availability as a percentage (Equation (10)). The monitoring data, which consist of the annual groundwater draft and net annual groundwater availability on the sub-watershed, are available from the National Groundwater Information Center (http://www.gims.go.kr/en/, accessed on 30 October 2022).
Figure 4b shows the assessed healthiness for the groundwater theme.
3.1.3. Water Safety Category
The healthiness of the flood theme is assessed using the proportional distance of the levee meeting the design level, (Equation (11)). For determining the for each sub-watershed, the state of the refurbished and the restored river in the sub-watershed was acquired from the KME [25]. Since each sub-watershed has several rivers or streams, the was calculated using the weighted average, considering the length of the river.
3.2. Analysis of Water Cycle Problems by the Mid-Watersheds
This section reviews whether the goal (IV: the criterion of the problem-focused assessment) for the water cycle healthiness was achieved for the four mid-watersheds. Figure 6 shows the results of the problem-focused assessment for the study areas. The themes that do not meet the goal for the water cycle healthiness are presented for each sub-watershed in Figure 6 using stacked bar graphs. As shown in Figure 6, the nine sub-watersheds (without the stacked bar in Figure 6) met the goal for the water cycle healthiness of all themes.
In the problem-focused assessment, the major problem theme of the mid-watershed was decided via the number of sub-watersheds that do not meet the goal by theme. That is, the theme with the largest number of sub-watersheds that failed to achieve the goal of water cycle healthiness was considered to have the most serious problem in the mid-watershed.
In the 1016 mid-watershed (Figure 6a), which has five sub-watersheds, the theme for including the largest number of sub-watersheds that do not meet the goal is the aquatic ecology theme. That is, the aquatic ecological problem can be decided as being the most serious theme for the water cycle in 1016. Similarly, the major problems for the 2019 (Figure 6b), 3011 (Figure 6c), and 5002 (Figure 6d) mid-watersheds can be determined as the themes for floods, water flow maintenance, and aquatic ecology, respectively.
When the healthy mid-watershed is determined by the number of sub-watersheds that do not meet the goal for the water cycle healthiness, 5002 can be determined as being relatively healthy. In addition, in the case of the mid-watershed of 2019, the problem tended to be concentrated in specific themes (non-point source pollution and flood), while the mid-watershed of 3011 was decided to have problems in all themes. In this case, it is difficult to get to the core theme of the problem. Therefore, the results for 3011 mean that it is necessary to set up the goal, considering the characteristics of the watershed, rather than collectively applying the goal in all mid-watersheds.
3.3. Selection of a Targeted Sub-Watershed for Restoration and Enhancement Plans
In Section 3.1, the sub-watershed was assessed for each metric. The water cycle healthiness of the sub-watershed is scored on a seven-point scale for each of the seven metrics, and it is digitized as the weighted sum of these scores. If the water cycle healthiness of the sub-watershed is indicated by one value, the superiority or inferiority of the healthiness between the sub-watersheds can be determined. The importance weight value for each of the seven themes, which is required to calculate the weighted sum, was derived by the AHP survey. Forty-two questionnaire responses, including scientists and engineers in the water resources and environment fields working at research institutes and design firms, were collected. As a result of reviewing the consistency of the questionnaire answered by forty-two experts, it was analyzed that the responses of twenty-three experts were consistent. Table 11 shows a single pairwise comparison matrix with a geometric mean of the pairwise comparison values for the results of twenty-three responses. For example, the value of 1.298 in the first row and second column of the pairwise comparison matrix (Table 11) means that the water quality theme is 1.298 times more important than the non-point source pollution theme. In contrast, 0.770 (= 1/1.298) in the second row and the first column of the matrix is the reciprocal of 1.298, which means that non-point source pollution is 0.77 times more important than water quality. In other words, non-point source pollution is not more important than water quality. The derived weight values are presented in Table 12. This study performed AHP analysis using Mathworks’ Matlab and Microsoft Excel.
Table A2 presents the assessment results for each metric of the water cycle healthiness by the sub-watersheds and the integrated scores calculated by Equation (1). In Section 3.2, the problem theme of the water cycle was determined for the study areas. As a result, the restoration and enhancement plans for the aquatic ecology are necessary for 1016 and 5002. Watersheds 2019 and 3011 need refurbishment and enhancement plans for the flood and water flow maintenance themes, respectively.
Table 13 summarizes the problems of the theme and the sub-watershed with the highest priority for restoration and enhancement plans in the relevant mid-watershed. In Table 13, sub-watersheds up to the second- or third-order priorities are presented with consideration of the number of sub-watersheds in the mid-watershed. As shown in Table 13, it can be seen that most of the sub-watersheds with high priorities do not meet the goal for the water cycle healthiness corresponding to the problem theme in the mid-watershed. In other words, the problem for the sub-watershed with high priority represents the problems in the mid-watershed.
From Table 13, sub-watersheds may be determined to implement the restoration and enhancement plans necessary for improving the water cycle problems in the mid-watershed. The selection of the sub-watershed for the restoration and enhancement plans was performed according to the procedure shown in Figure 1.
The problem of the water cycle in 1016 is the aquatic ecology theme. The sub-watershed with the highest priority in 1016 is 101601. The grade for the aquatic ecology theme in 101601 was analyzed to be grade V, and 101601 did not meet the goal for the aquatic ecology theme (IV). Therefore, 101601 is appropriate for implementing the restoration and enhancement plans in 1016. The problem of the water cycle in 2019 is the flood theme. The sub-watershed with the highest priority in 2019 is 201906. Since 201906 does not meet the goal for the flood theme (IV), 201906 is selected as the target sub-watershed to implement the restoration and enhancement plans in 2019. In the case of 3011, it is necessary to improve the water flow maintenance. The sub-watershed of the highest priority is 301102, which does not meet the goal of the water flow maintenance theme. Therefore, 301102 is appropriate to implement the restoration and enhancement plans in 3011. The problem of the water cycle in 5002 is the aquatic ecology theme. The sub-watershed with the highest priority is 500203 in 5002. Since 500203 does not meet the goal for the aquatic ecology theme, 500203 is selected as the target sub-watershed to implement the restoration and enhancement plans in 5002.
4. Discussion
The framework for the healthiness assessment of the water cycle (FHSWC) is set to suggest the direction of watershed management by selecting indicators and criteria to identify the problems of the water cycle in the watershed. The FHSWC aims to propose the priorities of the restoration and enhancement plans in the watershed based on the healthiness assessment of the elements for the water cycle. The FHSWC has two assessment procedures: a problem-focused assessment to identify problems in the watershed and a priorities assessment to select the watershed with the highest priority for the enhancement plans.
The FHSWC consists of three categories (water environment, water use, and water safety) and indicators for evaluating the healthiness of seven themes (water quality, non-point source pollution, aquatic ecology, water flow maintenance, groundwater, flood, and water supply). The healthiness assessment method for each metric is suggested based on South Korean laws, enforcement degrees, and policy directions. The accuracy of the monitoring data is required because most of the metrics of the FHSWC are calculated using monitoring data, as presented in Table 1. In other words, it may be difficult to trust the results of the FHSWC in ungauged watersheds where the construction of monitoring systems is insufficient or monitoring data are inaccurate. On the other hand, the limitations of the FHSWC can be a tool to propose the need for the establishment of a monitoring network improvement plan for effective and efficient watershed management.
The water cycle healthiness was assessed using 10 years (2010–2019) of monitoring data and simulation results to take the variability in the hydrological condition by year into account. The performance of the FHSWC can be verified by reviewing whether the problems of the study areas presented in Table 7 are presented in the evaluation results for each item in Table A2. In this study, themes evaluated as more serious conditions than grades IV (grades V, vI, and VII) were defined as problem items. The FHSWC was applied to the four mid-watersheds. As a result, it can be possible to identify the emerging problems for the water cycle in each mid-watershed. Reviewing 3011 (mid-watershed code) as an example, the well-known emergent problems in 3011 are the high ratio of impervious areas, water quality problems, and serious stream depletion (Table 7). An increase in the impervious area causes an increase in CN, which deteriorates the healthiness of the non-point source pollution theme. As shown in Table A2, three sub-watersheds (301101, 301113, 301115) in 3011 were evaluated as grade V in the non-point source pollution theme. In addition, It can be seen that the water quality problem of 3011 is particularly problematic in 301101 and 301102. The worst problem in the 3011 is stream depletion, and it can be seen that the five sub-watersheds (301131, 301102, 301103, 301105, 301106) in the 3011 are evaluated as the most serious grade VII in Table A2.
The FHSWC can diagnose the worst problem theme in the mid-watershed with problem-focused assessment, and it can derive the sub-watershed to be implementing an enhancement plan via priority assessment and procedures suggested in Section 2.1.4. The representative problem in the mid-watershed is the theme in which the most problems are identified, and the priority is determined by . The is calculated by Equation (1) using the grade evaluated for the sub-watershed and the weight value derived by the AHP. The weight values were derived by the AHP with the results of a survey of 23 experts who passed the consistency review results among 42 experts. As shown in Table 11, Korean experts responded that water flow maintenance was the most important theme in watershed management. This result is analyzed due to the following advantages in securing the streamflow: securing the stability of the water supply, securing the groundwater level near the river, and preserving the water environment.
Watershed management is an iterative and adaptive process. Therefore, the classified standards of the FHAWC in Table 2 and the criteria to identify the problem are not absolute criteria. Since the watershed conditions vary depending on the climate, land cover, soil, and human activity, the criteria should be modified via preliminary evaluation. In addition, as the watershed conditions improve by implementing enhancement and restoration plans, the initially set criteria must be gradually raised.
5. Conclusions
Recently, various water problems have turned up in South Korea due to floods and droughts caused by climate change, urbanization, and the distortion of the water cycle due to inter-watershed water transfer. This distortion of the water cycle results in a decrease in the healthiness of the water cycle in the watershed, and the need for sustainable watershed management is increasing. Therefore, this study suggests a framework for the assessment of the healthiness of the water cycle, which is the purpose of systematic watershed management in consideration of the current state of water management in South Korea.
The framework for the healthiness assessment of the water cycle was set to suggest the direction of watershed management by selecting indicators and criteria to identify the problems of the water cycle in the watershed. The framework aimed to propose the priorities of the restoration and enhancement plans in the watershed based on the healthiness assessment of the elements for the water cycle. The healthiness assessment method for each item was suggested based on South Korean laws, enforcement degrees, and policy directions. The framework for the healthiness assessment of the water cycle was applied to the four mid-watersheds. As a result, it can be possible to identify the practical emerging problems for the water cycle in each mid-watershed.
The framework for the healthiness assessment of the water cycle was developed in line with the national policy direction under the Framework Act on Water Management. The framework can contribute to providing technical information to detect the water problem of the watershed by objectively diagnosing the watershed where various water problems (water use, water environment, water safety, etc.) occur through the healthiness assessment.
Author Contributions
Conceptualization, S.L., T.K. and Y.J.; methodology, T.K., Y.J. and S.L.; software, Y.J. and Y.K.; validation, T.K., Y.J. and Y.K.; investigation, T.K. and Y.J.; data curation, T.K. and Y.J.; writing—original draft preparation, Y.J., S.L. and Y.K.; writing—review and editing, Y.K., S.L. and N.L.; visualization, Y.J.; project administration, S.L. and Y.K. All authors have read and agreed to the submitted version of the manuscript.
Funding
This work was supported by the Korea Environmental Industry & Technology Institute (KEITI) through the Aquatic Ecosystem Conservation Research Program, funded by the Korea Ministry of Environment (MOE) (2020003050002). This research was also supported by the Basic Science Research Program through the National Research Foundation of Korea (NRF), funded by the Ministry of Education (NRF-2021R1F1A1062223).
Data Availability Statement
Not applicable.
Conflicts of Interest
The authors declare no conflict of interest.
Abbreviations
The following abbreviations are used in this manuscript:
| AHP | Analytic hierarchy process |
| BMI | Benthic macroinvertebrate index |
| BOD | Biological oxygen demand |
| CN | Curve number |
| DO | Dissolved oxygen |
| EPA | US Environmental Protection Agency |
| FAI | Fish assessment index |
| FHAWC | Framework for healthiness assessment of the water cycle |
| HRI | Habitat and riparian index |
| HWP | Health Watersheds Program |
| KME | Korean Ministry of Environment |
| PFD | Proportional flow duration for the announced instream flow/ |
| standard low flow that averages ten years | |
| pH | Power of hydrogen |
| RVI | Fiparian vegitation index |
| SS | Suspended solids |
| TDI | Trophic diatom index |
| TOC | Total organic carbons |
| TP | Total porosity |
| WCHI | Water cycle healthiness index |
| WECA | Water Environment Conservation Act |
Appendix A

Table A1.
Watershed information by sub-watersheds.
| Mid- Watershed Code | Sub- Watershed Code | Watershed Area (km) | Mean Elevation (El. m) | Mean Slope (%) | Mean Annual Precipitation (mm) | Ratio of Land Use in the Watershed (%) | Curve Number | |||||
|---|---|---|---|---|---|---|---|---|---|---|---|---|
| Agric. | Forest | Urban | Barren | Grass | Water | |||||||
| 1016 | 101601 | 149.9 | 167.95 | 26.83 | 1288.8 | 16.45 | 58.43 | 14.10 | 0.88 | 9.73 | 0.41 | 67.98 |
| 101602 | 48.47 | 184.93 | 27.12 | 1283.5 | 11.13 | 53.19 | 19.54 | 0.68 | 15.17 | 0.28 | 68.46 | |
| 101603 | 90.38 | 143.15 | 27.37 | 1264.5 | 12.76 | 52.97 | 22.94 | 1.02 | 9.18 | 1.13 | 72.76 | |
| 101604 | 158.51 | 207.35 | 32.92 | 1287.5 | 16.70 | 70.63 | 5.77 | 0.61 | 6.20 | 0.09 | 70.45 | |
| 101605 | 113.86 | 193.64 | 37.17 | 1268.2 | 12.18 | 76.71 | 3.35 | 1.06 | 4.36 | 2.34 | 71.58 | |
| 2019 | 201901 | 113.58 | 82.12 | 29.15 | 1498.7 | 6.74 | 69.02 | 16.30 | 1.53 | 2.59 | 3.82 | 80.46 |
| 201902 | 205.52 | 153.8 | 35.36 | 1428.0 | 17.50 | 75.61 | 2.66 | 0.62 | 2.03 | 1.58 | 71.41 | |
| 201903 | 158.81 | 80.8 | 29.94 | 1463.1 | 18.60 | 70.06 | 4.34 | 0.82 | 1.98 | 4.20 | 80.38 | |
| 201904 | 124.36 | 97.36 | 34.24 | 1367.9 | 20.47 | 72.48 | 2.98 | 0.45 | 2.02 | 1.60 | 74.15 | |
| 201905 | 109.6 | 94.31 | 32.72 | 1298.6 | 20.93 | 67.82 | 1.92 | 0.45 | 1.85 | 7.03 | 78.54 | |
| 201906 | 63.06 | 105.18 | 29.05 | 1263.5 | 20.39 | 67.52 | 7.06 | 0.59 | 2.30 | 2.14 | 77.19 | |
| 201907 | 114.4 | 184.57 | 39.88 | 1281.3 | 13.24 | 81.54 | 1.98 | 0.36 | 1.94 | 0.95 | 73.08 | |
| 201908 | 61.04 | 66.46 | 27.31 | 1260.6 | 21.59 | 64.46 | 2.16 | 0.63 | 1.90 | 9.26 | 79.3 | |
| 201909 | 155.19 | 127.84 | 31.69 | 1225.9 | 19.13 | 72.51 | 3.46 | 0.88 | 1.61 | 2.41 | 75.47 | |
| 201910 | 79.52 | 60.11 | 28.56 | 1209.1 | 23.38 | 65.30 | 2.07 | 0.96 | 2.11 | 6.18 | 77.37 | |
| 3011 | 301101 | 85.83 | 97.88 | 12.28 | 1167.9 | 47.89 | 22.17 | 10.41 | 3.37 | 15.97 | 0.19 | 77.42 |
| 301102 | 202.98 | 134.89 | 16.8 | 1168.2 | 43.85 | 33.64 | 10.55 | 2.27 | 8.14 | 1.56 | 76.89 | |
| 301103 | 85.66 | 254.18 | 41.61 | 1194.5 | 9.30 | 84.63 | 0.39 | 0.51 | 2.94 | 2.23 | 72.05 | |
| 301104 | 39.66 | 110.23 | 18.23 | 1229.8 | 37.82 | 42.26 | 10.42 | 1.88 | 4.89 | 2.72 | 73.32 | |
| 301105 | 75.72 | 227.28 | 37.08 | 1186.3 | 14.12 | 78.38 | 1.12 | 1.51 | 3.49 | 1.38 | 69.69 | |
| 301106 | 56.85 | 162.43 | 39.11 | 1204.8 | 6.79 | 84.08 | 1.35 | 0.34 | 2.18 | 5.26 | 69.65 | |
| 301107 | 157.61 | 141.35 | 23.37 | 1192.5 | 28.25 | 54.07 | 6.00 | 2.66 | 8.23 | 0.79 | 72.41 | |
| 301108 | 112.6 | 146.99 | 29.57 | 1213.7 | 15.16 | 68.17 | 3.41 | 3.49 | 6.73 | 3.03 | 68.77 | |
| 301109 | 110.02 | 94.76 | 15.39 | 1185.8 | 34.38 | 41.76 | 7.33 | 2.00 | 10.78 | 3.74 | 73.51 | |
| 301110 | 196.88 | 148.69 | 23.83 | 1160.9 | 17.36 | 55.62 | 16.86 | 1.94 | 6.03 | 2.20 | 73.84 | |
| 301111 | 145.98 | 198.86 | 31.41 | 1188.9 | 23.35 | 68.86 | 1.36 | 1.32 | 3.39 | 1.73 | 74.61 | |
| 301112 | 220.3 | 116.44 | 22.79 | 1213.5 | 23.14 | 60.80 | 4.20 | 3.39 | 5.87 | 2.60 | 73.99 | |
| 301113 | 103.99 | 59.2 | 11.04 | 1215.2 | 30.84 | 30.97 | 25.34 | 1.91 | 7.34 | 3.61 | 77.62 | |
| 301114 | 135.3 | 130.75 | 27.85 | 1218.5 | 22.60 | 62.92 | 5.05 | 3.91 | 3.90 | 1.62 | 75.32 | |
| 301115 | 125.6 | 64.56 | 16.78 | 1203.4 | 30.53 | 45.91 | 5.30 | 2.79 | 7.80 | 7.66 | 77.2 | |
| 5002 | 500201 | 122.93 | 276.03 | 45.87 | 1368 | 5.73 | 87.10 | 1.14 | 0.20 | 0.37 | 5.46 | 73.18 |
| 500202 | 163.64 | 179.49 | 31.42 | 1362.3 | 21.03 | 70.11 | 4.64 | 1.33 | 2.14 | 0.75 | 73.06 | |
| 500203 | 117.73 | 120.1 | 23.04 | 1355.9 | 30.83 | 57.99 | 3.82 | 3.37 | 1.52 | 2.48 | 74.02 | |
| 500204 | 160.74 | 110.43 | 23.64 | 1346.5 | 25.18 | 55.48 | 9.81 | 1.86 | 3.24 | 4.43 | 75.27 | |
Figure A1.
Thematic maps for the assessment results of water quality. (a) BOD, (b) TP.

Figure A2.
Thematic maps of layers for land-use. (a) 1016, (b) 2019, (c) 3011, (d) 5002.

Table A2.
The results of the priority assessment by the sub-watershed.
| Min- Watershed Code | Sub- Watershed Code | Water Environment | Water Use | Water Safety | Integrated Score | Priorities | ||||
|---|---|---|---|---|---|---|---|---|---|---|
| Water Quality | Non-Point Source Pollution | Aquatic Ecology | Water Flow Maintenance | Ground- Water | Flood | Water Supply | ||||
| 1016 | 101601 | III | II | V | VII | III | IV | I | 4.29 | 1 |
| 101602 | III | II | V | VII | III | III | I | 4.45 | 2 | |
| 101603 | IV | III | V | II | IV | III | I | 5.13 | 4 | |
| 101604 | II | II | II | I | II | III | III | 5.85 | 5 | |
| 101605 | III | II | II | I | II | IV | VII | 4.81 | 3 | |
| 2019 | 201901 | II | VII | V | II | IV | vI | I | 4.49 | 2 |
| 201902 | II | II | II | II | II | IV | I | 5.87 | 10 | |
| 201903 | II | VII | IV | I | III | V | I | 5.07 | 5 | |
| 201904 | II | III | IV | II | II | vI | I | 5.23 | 4 | |
| 201905 | II | vI | III | II | III | V | I | 5.08 | 7 | |
| 201906 | IV | V | III | V | II | V | I | 4.43 | 1 | |
| 201907 | III | III | IV | II | III | IV | I | 5.31 | 9 | |
| 201908 | III | vI | III | I | II | VII | I | 4.95 | 6 | |
| 201909 | III | IV | II | IV | II | IV | I | 5.13 | 8 | |
| 201910 | III | V | vI | I | III | VII | I | 4.61 | 3 | |
| 3011 | 301101 | V | V | III | VII | vI | II | I | 3.94 | 2 |
| 301102 | V | IV | IV | VII | vI | IV | II | 3.42 | 1 | |
| 301103 | II | II | I | VII | II | II | I | 5.28 | 12 | |
| 301104 | III | III | IV | vI | V | II | I | 4.6 | 7 | |
| 301105 | II | II | IV | VII | II | V | I | 4.48 | 5 | |
| 301106 | II | II | III | VII | II | V | I | 4.59 | 6 | |
| 301107 | III | II | V | II | IV | I | II | 5.49 | 15 | |
| 301108 | IV | II | III | IV | III | III | I | 5.15 | 10 | |
| 301109 | IV | III | III | IV | III | I | I | 5.37 | 13 | |
| 301110 | IV | III | IV | III | IV | I | II | 5.16 | 11 | |
| 301111 | IV | III | V | IV | II | vI | II | 4.27 | 3 | |
| 301112 | IV | III | IV | IV | III | V | II | 4.43 | 4 | |
| 301113 | IV | V | vI | I | IV | III | I | 5.02 | 9 | |
| 301114 | III | IV | IV | I | III | IV | I | 5.41 | 14 | |
| 301115 | IV | V | IV | II | IV | V | I | 4.71 | 8 | |
| 5002 | 500201 | II | III | II | vI | I | III | I | 5.22 | 2 |
| 500202 | II | III | V | III | II | IV | I | 5.24 | 3 | |
| 500203 | IV | III | vI | III | II | II | I | 5.2 | 1 | |
| 500204 | III | IV | IV | I | II | II | I | 5.84 | 4 | |
Figure A3.
Thematic maps for the assessment results of the aquatic ecological health indices. (a) TDI, (b) BMI, (c) FAI, (d) RVI, and (e) HRI.
Figure A3.
Thematic maps for the assessment results of the aquatic ecological health indices. (a) TDI, (b) BMI, (c) FAI, (d) RVI, and (e) HRI.

References
- Bhatti, A.M.; Koike, T.; Jaranilla-Sanchez, P.A.; Rasmy, M.; Yoshimura, K.; Ahmad, B. Climate change impact assessment on the hydrology of a semi-arid river basin. J. Jpn. Soc. Civ. Eng. 2014, 70, I_121–I_126. [Google Scholar] [CrossRef] [PubMed]
- Koike, T.; Koudelova, P.; Jaranilla-Sanchez, P.A.; Bhatti, A.M.; Nyunt, C.T.; Tamagawa, K. River management system development in Asia based on Data Integration and Analysis System (DIAS) under GEOSS. Sci. China Earth Sci. 2015, 58, 76–95. [Google Scholar] [CrossRef]
- Kang, H.; Jeon, D.J.; Kim, S.; Jung, K. Estimation of fish assessment index based on ensemble artificial neural network for aquatic ecosystem in South Korea. Ecol. Indic. 2022, 136, 108708. [Google Scholar] [CrossRef]
- Ahn, S.R.; Kim, S.J. Assessment of integrated watershed health based on the natural environment, hydrology, water quality, and aquatic ecology. Hydrol. Earth Syst. Sci. 2017, 21, 5583–5602. [Google Scholar] [CrossRef] [Green Version]
- USEPA. Identifying and Protecting Healthy Watersheds: Concepts, Assessments, and Management Approaches; USEPA: Washington, DC, USA, 2012. [Google Scholar]
- The Nature Conservancy. Indicators of Hydrologic Alteration Version 7.1 User’s Manual; The Nature Conservancy: Arlington County, VA, USA, 2009. [Google Scholar]
- Hering, D.; Borja, A.; Carstensen, J.; Carvalho, L.; Elliott, M.; Feld, C.K.; Heiskanen, A.S.; Johnson, R.K.; Moe, J.; Pont, D.; et al. The European Water Framework Directive at the age of 10: A critical review of the achievements with recommendations for the future. Sci. Total Environ. 2010, 408, 4007–4019. [Google Scholar] [CrossRef] [PubMed] [Green Version]
- Water by Design. Total Water Cycle Management Planning Guideline for South East Queensland: Version 1; Department of Environment and Resource Management: Brisbane, QLD, Australia, 2010. [Google Scholar]
- Weber, T.; Ramilo, N. Integrated Water Cycle Management–Dealing with Dilemmas. In Proceedings of the 7th International Conference on Water Sensitive Urban Design, Richmond, Australia, 21–23 February 2012. [Google Scholar]
- California Department of Water Resources. California Water Plan Update 2018; California Department of Water Resources: Sacramento, CA, USA, 2018. [Google Scholar]
- Srdjevic, B.; Medeiros, Y.D.P. Fuzzy AHP Assessment of Water Management Plans. Water Resour. Manag. 2008, 22, 877–894. [Google Scholar] [CrossRef]
- Calizaya, A.; Meixner, O.; Bengtsson, L.; Berndtsson, R. Multi-criteria Decision Analysis (MCDA) for Integrated Water Resources Management (IWRM) in the Lake Poopo Basin, Bolivia. Water Resour. Manag. 2010, 24, 2267–2289. [Google Scholar] [CrossRef]
- Wang, Y.; Li, Z.; Tang, Z.; Zeng, G. A GIS-Based Spatial Multi-Criteria Approach for Flood Risk Assessment in the Dongting Lake Region, Hunan, Central China. Water Resour. Manag. 2011, 25, 3465–3484. [Google Scholar] [CrossRef]
- Ahn, S.R.; Kim, S.J. Assessment of watershed health, vulnerability and resilience for determining protection and restoration Priorities. Environ. Model. Softw. 2019, 122, 103926. [Google Scholar] [CrossRef]
- Han, H.; Kim, S.; Lee, D.; Jang, Y.; Lee, K.; Kim, J. A Framework and Strategy for the Integrated Water Cycle Management; Technical Report; Korea Environment Institute: Sejong-si, Republic of Korea, 2020. [Google Scholar]
- Ministry of Environment. Framework Act On Water Management. Available online: https://elaw.klri.re.kr/kor_service/lawView.do?hseq=56108&lang=ENG (accessed on 30 October 2022).
- Ministry of Environment. Water Environment Conservation Act. Available online: https://elaw.klri.re.kr/kor_service/lawView.do?hseq=54838&lang=ENG&searchTxt (accessed on 30 October 2022).
- Land, Infrastructure and Transport. River Act. Available online: https://elaw.klri.re.kr/kor_service/lawView.do?hseq=57588&lang=ENG (accessed on 30 October 2022).
- Land, Infrastructure and Transport. Act on the Investigation, Planning, and Management of Water Resources. Available online: https://elaw.klri.re.kr/kor_service/lawView.do?hseq=55436&lang=ENG (accessed on 30 October 2022).
- Saaty, R.W. The analytic hierarchy process—What it is and how it is used. Math. Model. 1987, 9, 161–176. [Google Scholar] [CrossRef]
- Saaty, T.L. What Is the Analytic Hierarchy Process? Springer: Berlin/Heidelberg, Germany, 1988; pp. 109–121. [Google Scholar]
- Chowdary, V.M.; Chakraborthy, D.; Jeyaram, A.; Murthy, Y.V.; Sharma, J.R.; Dadhwal, V.K. Multi-Criteria Decision Making Approach for Watershed Prioritization Using Analytic Hierarchy Process Technique and GIS. Water Resour. Manag. 2013, 27, 3555–3571. [Google Scholar] [CrossRef]
- Miller, G.A. The magical number seven, plus or minus two: Some limits on our capacity for processing information. Psychol. Rev. 1956, 63, 81–97. [Google Scholar] [CrossRef] [PubMed]
- Central Ground Water Board. Central Ground Water Board (CGWB). Available online: http://cgwb.gov.in/faq.html (accessed on 30 October 2022).
- Ministry of Environment. List of River in Korea 2020; Ministry of Environment: Sejong-si, Republic of Korea, 2020.
Figure 1.
Selection procedure of watersheds for implementing a restoration and enhancement plan.

Figure 2.
Locations of the study cases. (a) Kyungan stream watershed (sub-watershed code: 1016); (b) Namgang river watershed (sub-watershed code: 2019); (c) Miho stream watershed (sub-watershed code: 3011); (d) Hwangryong river watershed (sub-watershed code: 5002).
Figure 2.
Locations of the study cases. (a) Kyungan stream watershed (sub-watershed code: 1016); (b) Namgang river watershed (sub-watershed code: 2019); (c) Miho stream watershed (sub-watershed code: 3011); (d) Hwangryong river watershed (sub-watershed code: 5002).

Figure 3.
Thematic maps for the assessment results of the water environment category. (a) Water quality, (b) non-point source pollution, (c) aquatic ecology.
Figure 3.
Thematic maps for the assessment results of the water environment category. (a) Water quality, (b) non-point source pollution, (c) aquatic ecology.

Figure 4.
Thematic maps for the assessment results of the water environment category. (a) Water flow maintenance, (b) groundwater.
Figure 4.
Thematic maps for the assessment results of the water environment category. (a) Water flow maintenance, (b) groundwater.

Figure 5.
Thematic maps for the assessment results of the water environment category. (a) Flood, (b) water supply.
Figure 5.
Thematic maps for the assessment results of the water environment category. (a) Flood, (b) water supply.

Figure 6.
The results of the problem-focused assessment by the study areas. (a) 1016, (b) 2019, (c) 3011, (d) 5002.
Figure 6.
The results of the problem-focused assessment by the study areas. (a) 1016, (b) 2019, (c) 3011, (d) 5002.

Table 1.
Assessment method and metrics for the healthiness assessment of the water cycle.
| Category | Theme | Metric | Assessment Methodology | Note | |
|---|---|---|---|---|---|
| Problem-Focused Assessment | Priorities Assessment | ||||
| Water environment | Water quality | Ambient water quality index (BOT, TP) 1 | Whether the water quality satisfies the defined criterion (unit: grade) at mid-watershed | Classified water quality index | Monitoring data Simulation results |
| Non-point source pollution | Direct runoff depth by 25.4 mm rainfall 2 | Whether direct runoff above the defined criterion (unit: mm) for 25.4 mm rainfall occurs | Classified direct runoff depth for 25.4 mm rainfall | Simulation results | |
| Aquatic ecology | Aquatic ecology index 3 | Whether integrated aquatic ecology index satisfies the defined criterion (unit: score) | Classified integrated aquatic ecology index | Monitoring data | |
| Water use | Water flow maintenance | Instream flow regime 4 | Whether proportional flow duration for the announced instream flow fulfills the defined criterion (unit: %) | Classified proportional flow duration for the announced instream flow | Monitoring data Simulation results |
| Groundwater | Stage of groundwater development 5 | Whether the percentage of groundwater development does not exceed the defined criterion (unit: %) | Classified percentage of groundwater development | Monitoring data | |
| Water safety | Flood | Levee meeting design level 6 | Whether the proportional distance of the levee that meets the design level fulfills the defined criterion (unit: %) | Classified the proportional distance of the levee that meets the design level | Monitoring data |
| Water supply | Water restrictions 7 | Whether percentage of residents that have been imposed water restrictions do not exceed the defined criterion (unit: %) | Classified percentage of residents that have been imposed water restrictions | Monitoring data | |
1 The ambient water quality standard is the water quality criteria that classifies the measured water quality into seven grades. The ambient water quality standard and the goal for the grade of water quality is announced in Article 10-2 of the Water Environment Conservation Act [17]. 2 The administration procedures guide of determination for the water cycle management indicator to control non-point source pollution announced in Article 53-5 of the Water Environment Conservation Act [17]. 3 Article 9-3 of the Water Environment Conservation Act [17]; guidelines on how to investigate the current status of aquatic ecosystems and evaluate health note five aquatic ecologic indices. 4 In Article 51-1 of the River Act [18], the instream flow for each river and stream is announced. 5 Consideration of Groundwater Development Limits. 6 In Article 18 of the Act on the Investigation, Planning, and Management of Water Resources [19], River Basin Water Resource Management Plans are notified. As a safety assessment indicator for flood, a proportional length of the levee meeting the design level is suggested in the plans. 7 Reliability for water supply based on monitoring data.
Table 2.
The classified standards for an assessment of the water cycle healthiness by theme.
| Condition | Water Quality | Non-Point Pollution | Aquatic Ecology | Instream Flow | Groundwater | Flood Control | Water Supply |
|---|---|---|---|---|---|---|---|
| I | Excellent | 0 | ≥0.85 | ≥95% | ≤10% | ≥85% | 0 |
| II | Good | ≤0.4 mm | ≥0.70 | ≥85% | ≤25% | ≥70% | ≤0.1% |
| III | Fairly Good | ≤0.8 mm | ≥0.55 | ≥75% | ≤40% | ≥55% | ≤0.2% |
| IV | Fair | ≤1.2 mm | ≥0.40 | ≥65% | ≤55% | ≥40% | ≤0.3% |
| V | Marginal | ≤1.6 mm | ≥0.25 | ≥55% | ≤70% | ≥25% | ≤0.4% |
| vI | Poor | ≤2.0 mm | ≥0.10 | ≥45% | ≤85% | ≥10% | ≤0.5% |
| VII | Very poor | >2.0 mm | <0.10 | <45% | >85% | <10% | >0.5% |
Table 3.
Composition of the questions in the pairwise comparison questionnaire.
| Contents | Water Quality | Non-Point Source Pollution | Aquatic Ecology | Water Flow Maintenance | Ground- Water | Flood | Water Supply |
|---|---|---|---|---|---|---|---|
| Water quality | *1 | * | * | * | * | * | |
| Non-point source pollution | * | * | * | * | * | ||
| Aquatic ecology | * | * | * | * | |||
| Water flow maintenance | * | * | * | ||||
| Groundwater | * | * | |||||
| Flood | * | ||||||
| Water suuply |
1 * means that two themes, the column name and the index name where * is located, are compared in pairs. The number of * means the number of pairwise comparison questions in the questionnaire.
Table 4.
Pairwise comparison matrix for the healthiness assessment of the water cycle.
| Contents | Water Quality | Non-Point Source Pollution | Aquatic Ecology | Water Flow Maintenance | Ground- Water | Flood | Water Suuply |
|---|---|---|---|---|---|---|---|
| Water quality | 1 | ||||||
| Non-point source pollution | 1 | ||||||
| Aquatic ecology | 1 | ||||||
| Water flow maintenance | 1 | ||||||
| Groundwater | 1 | ||||||
| Flood | 1 | ||||||
| Water suuply | 1 |
Table 5.
The criteria of the problem-focused assessment for each theme.
| Theme | Criteria of the Problem-Focused Assessment | |
|---|---|---|
| Water Cycle Healthiness Index | Criteria | |
| Water quality | Classified water quality index | ≥IV (Fair) |
| Non-point source pollution | Direct runoff depth for 25.4 mm | ≤1.2 mm |
| Aquatic ecology | Integrated ecology index score | ≥0.40 |
| Water flow maintenance | Proportional flow duration for the announced instream flow | ≥65% |
| Groundwater | Percentage of groundwater development | ≤55% |
| Flood | Proportional distance of the levee that meets the design level | ≥40% |
| Water supply | Percentage of residents that have been imposed water restrictions | ≤0.3% |
Table 6.
The emergent problems for the water cycle and current conditions on the mid-watershed.
| Major River Basin | Mid-Watershed Code (NO. Sub-Watershed) | Emergent Problems for the Water Cycle and Current Conditions on the Mid-Watershed |
|---|---|---|
| Han | 1016 (5) |
|
| Nakdong | 2019 (10) |
|
| Geum | 3011 (15) |
|
| Youngsan and Seumjin | 5002 (4) |
|
Table 7.
The ambient water quality standards for rivers and lakes of the Korean Ministry of Environment.
Table 7.
The ambient water quality standards for rivers and lakes of the Korean Ministry of Environment.
| Condition | Grade | River | Lake | ||
|---|---|---|---|---|---|
| BOD (mg/L) | TP (mg/L) | TOC (mg/L) | TP (mg/L) | ||
| Excellent | Ia | ≤1 | ≤0.02 | ≤2 | ≤0.01 |
| Good | Ib | ≤2 | ≤0.04 | ≤3 | ≤0.02 |
| Fairly good | II | ≤3 | ≤0.1 | ≤4 | ≤0.03 |
| Fair | III | ≤5 | ≤0.2 | ≤5 | ≤0.05 |
| Marginal | IV | ≤8 | ≤0.3 | ≤6 | ≤0.10 |
| Poor | V | ≤10 | ≤0.5 | ≤8 | ≤0.15 |
| Very poor | VI | >10 | >0.5 | >8 | >0.15 |
Table 8.
The goal for water quality criteria on the ambient water quality standards.
| Mid-Watershed Code | Goal for Water Quality Criteria | |
|---|---|---|
| Condition | Grade | |
| 1016 | Fairly good | II |
| 2019 | Good | Ib |
| 3011 | Fairly good | II |
| 5002 | Fairly good | II |
Table 9.
Aquatic ecology health indices and assessment criteria.
| Numerical Indices | Assessment Criteria | |||||
|---|---|---|---|---|---|---|
| Excellent | Good | Fair | Poor | Very Poor | ||
| (A) | (B) | (C) | (D) | (E) | ||
| Aquatic ecology | TDI 1 | ≥90 | ≥70 | ≥50 | ≥30 | <30 |
| BMI 2 | ≥80 | ≥65 | ≥50 | ≥35 | <35 | |
| FAI 3 | ≥80 | ≥60 | ≥40 | ≥20 | <20 | |
| Naturalness of River | RVI 4 | ≥65 | ≥50 | ≥30 | ≥15 | <15 |
| HRI 5 | ≥80 | ≥60 | ≥40 | ≥20 | ≥20 | |
1 Trophic Diatom Index: Diatoms are the primary producers of the food chain in the river ecosystem, and the index refers to the diatoms attached to the gravel or stones of the riverbed among the algae responsible for energy transfer in the ecosystem. 2 Benthic Macroinvertebrate Index: Benthic macroinvertebrates are the primary and secondary consumers of the river ecosystem, and they are biological indicators that reflect regional characteristics. The index refers to a biota in which aquatic insects account for most species appearing in the ecosystem. 3 Fish Assessment Index: Organisms at the apex of the food chain in the water columns representing omnivores, herbivores, insectivores, and carnivores at various trophic levels. 4 The RVI is a multimetric index based on compositional metrics (e.g., the cover and number of alien and endemic species) and functional metrics associated with life cycle and reproduction (e.g., numbers of perennial species), and with trophic status (e.g., proportion of nitrophyllous species). 5 Habitat and Riparian Index: Physical external environment influencing living organisms in the river watershed.
Table 10.
The announced instream flow and standard low flow by sub-watersheds.
| Mid-Watershed Code | Sub-Watershed Code | The Announced Instream Flow /Standard Low Flow () |
|---|---|---|
| 1016 | 101601 | 0.126 |
| 101602 | 0.041 | |
| 101603 | 1.490 | |
| 101604 | 0.134 | |
| 101605 | 0.473 | |
| 2019 | 201901 | 11.18 |
| 201902 | 0.560 | |
| 201903 | 12.236 | |
| 201904 | 0.339 | |
| 201905 | 13.000 | |
| 201906 | 0.172 | |
| 201907 | 0.312 | |
| 201908 | 13.595 | |
| 201909 | 0.423 | |
| 201910 | 14.268 | |
| 3011 | 301101 | 0.240 |
| 301102 | 0.807 | |
| 301103 | 0.239 | |
| 301104 | 0.351 | |
| 301105 | 0.212 | |
| 301106 | 0.371 | |
| 301107 | 0.441 | |
| 301108 | 2.284 | |
| 301109 | 3.133 | |
| 301110 | 0.552 | |
| 301111 | 0.408 | |
| 301112 | 1.024 | |
| 301113 | 4.456 | |
| 301114 | 0.381 | |
| 301115 | 5.188 | |
| 5002 | 500201 | 0.271 |
| 500202 | 0.631 | |
| 500203 | 0.259 | |
| 500204 | 1.070 |
Table 11.
The decided problem theme and derived priorities by the study areas.
| Contents | Water Quality | Non-Point Source Pollution | Aquatic Ecology | Water Flow Maintenance | Ground- Water | Flood | Water Suuply | Eigen Vector () |
|---|---|---|---|---|---|---|---|---|
| Water quality | 1.000 | 1.298 | 1.371 | 0.584 | 1.062 | 0.748 | 0.620 | 0.3214 |
| Non-point source pollution | 0.770 | 1.000 | 0.906 | 0.549 | 0.928 | 0.663 | 0.569 | 0.2647 |
| Aquatic ecology | 0.729 | 1.103 | 1.000 | 0.533 | 1.005 | 0.726 | 0.595 | 0.2778 |
| Water flow maintenance | 1.712 | 1.821 | 1.877 | 1.000 | 1.974 | 1.257 | 1.026 | 0.5189 |
| Ground-water | 0.942 | 1.078 | 0.995 | 0.507 | 1.000 | 0.661 | 0.609 | 0.2815 |
| Flood | 1.337 | 1.509 | 1.378 | 0.796 | 1.513 | 1.000 | 0.835 | 0.4084 |
| Water suuply | 1.613 | 1.758 | 1.681 | 0.975 | 1.643 | 1.198 | 1.000 | 0.4839 |
Table 12.
The weight values of the themes for the healthiness assessment of the water cycle.
| Contents | The Themes for the Healthiness Assessment of the Water Cycle | ||||||
|---|---|---|---|---|---|---|---|
| Water Quality | Non-Point Source Pollution | Aquatic Ecology | Water Flow Maintenance | Groundwater | Flood | Water Supply | |
| Weight value | 0.1257 | 0.1035 | 0.1087 | 0.203 | 0.1101 | 0.1597 | 0.1893 |
Table 13.
The decided problem theme and derived priorities by the study areas.
| Mid-Watershed Code | Problem for Mid-Watershed | Projection and Restoration Priorities | Problem for Sub-Watershed | ||
|---|---|---|---|---|---|
| Sub-Watershed Code | HCI | Priorities | |||
| 1016 | Aquatic ecology | 101601 | 4.29 | 1 | Below target (V) |
| 101602 | 4.45 | 2 | Below target (V) | ||
| 2019 | River flood control | 201906 | 4.43 | 1 | Below target (V) |
| 201901 | 4.49 | 2 | Below target (vI) | ||
| 3011 | Water flow maintenance | 301102 | 3.42 | 1 | Below target (VII) |
| 301101 | 3.94 | 2 | Below target (VII) | ||
| 301105 | 4.23 | 3 | Below target (VII) | ||
| 5002 | Aquatic ecology | 500203 | 5.20 | 1 | Below target (vI) |
| 500201 | 5.22 | 2 | Above target (II) | ||
Disclaimer/Publisher’s Note: The statements, opinions and data contained in all publications are solely those of the individual author(s) and contributor(s) and not of MDPI and/or the editor(s). MDPI and/or the editor(s) disclaim responsibility for any injury to people or property resulting from any ideas, methods, instructions or products referred to in the content. |
© 2022 by the authors. Licensee MDPI, Basel, Switzerland. This article is an open access article distributed under the terms and conditions of the Creative Commons Attribution (CC BY) license (https://creativecommons.org/licenses/by/4.0/).
Share and Cite
MDPI and ACS Style
Jin, Y.; Lee, S.; Kang, T.; Kim, Y.; Lee, N. Framework for Healthiness Assessment of Water Cycle to Decide the Priority of Enhancement and Restoration Plans. Water 2023, 15, 6. https://doi.org/10.3390/w15010006
AMA Style
Jin Y, Lee S, Kang T, Kim Y, Lee N. Framework for Healthiness Assessment of Water Cycle to Decide the Priority of Enhancement and Restoration Plans. Water. 2023; 15(1):6. https://doi.org/10.3390/w15010006
Chicago/Turabian StyleJin, Youngkyu, Sangho Lee, Taeuk Kang, Yeulwoo Kim, and Namjoo Lee. 2023. "Framework for Healthiness Assessment of Water Cycle to Decide the Priority of Enhancement and Restoration Plans" Water 15, no. 1: 6. https://doi.org/10.3390/w15010006
Note that from the first issue of 2016, this journal uses article numbers instead of page numbers. See further details here.