
Transcriptomic Analysis of Ulva prolifera in Response to Salt Stress
by
Jintao Zhuo
1,2,3, 
Hong Wang
1,2,3,
Yifei Du
1,4,
Mengmeng Shi
1,5,
Li Huan
1,3,* and
Guangce Wang
1,3,* 1
Key Laboratory of Experimental Marine Biology, Center for Ocean Mega-Science, Institute of Oceanology, Chinese Academy of Sciences, Qingdao 266071, China
2
College of Earth Sciences, University of Chinese Academy of Sciences, Beijing 100049, China
3
Laboratory for Marine Biology and Biotechnology, Qingdao National Laboratory for Marine Science and Technology, Qingdao 266237, China
4
College of Marine Life Sciences, Ocean University of China, Qingdao 266100, China
5
College of Life Sciences, Qingdao Agricultural University, Qingdao 266109, China
*
Authors to whom correspondence should be addressed.
Water 2023, 15(1), 63; https://doi.org/10.3390/w15010063
Submission received: 1 December 2022
/
Revised: 19 December 2022
/
Accepted: 22 December 2022
/
Published: 25 December 2022
(This article belongs to the Special Issue Response of Algae to Environmental/Abiotic Stress)
Abstract
:Since 2007, Ulva prolifera, a green macroalgal species that blooms periodically in the Yellow Sea of China, has caused the world’s biggest green tide, which induced harmful ecological impacts and economic losses. When the alga is subject to prolonged exposure to air, it suffers abiotic stresses. To explore the physiological and molecular mechanisms of salt stress, the transcriptome data of U. prolifera at different salinities (30, 50, and 90 psu) were obtained by high-throughput sequencing using the Illumina HiSeq platform, and photosynthetic physiological parameters were also measured. The results showed that a total of 89,626 unigenes were obtained after de novo assembly, of which 60,441 unigenes were annotated in the databases (NR, NT, KO, SWISS-PROT, PFAM, GO, and KOG). GO functional enrichment analysis revealed that the enrichment of differentially expressed genes (DEGs) was mainly in cellular, cell, and binding processes. KEGG metabolic pathway enrichment analysis showed that the most frequently enriched pathways of DEGs included glycolysis, pyruvate metabolism, peroxisome, and fatty acid biosynthesis. In addition, resistance-associated proteins, such as heat-shock proteins, microtubule-associated proteins, ubiquitin-associated proteins, abscisic-acid-signaling-pathway-associated proteins, and antioxidant-related proteins are upregulated under salt stress. Genes associated with photosynthesis and carbon fixation pathways are also upregulated, accompanied by an increase in photosynthetic oxygen release rates. These findings provide a basis for understanding the molecular mechanisms of the response of U. prolifera to salinity change, thus providing a theoretical basis for the analysis of the green tide outbreak mechanism.
1. Introduction
The green tide is an ecological and environmental anomaly caused by floating green macroalgae accumulation [1]. Green tides have been occurring periodically in the Yellow Sea of China for 16 years, since 2007. Although the mechanism of the green tide is extremely complex, the central cause is the rapid accumulation of huge biomass by the green tide causative species Ulva prolifera. During green tide outbreaks, large amounts of algae accumulate on the coast, which has a negative impact on offshore tourism, aquaculture, and sea voyages. In addition, the degradation of U. prolifera produces secondary hazards, such as seawater acidification and hypoxia, which are extremely harmful to the coastal environment and marine communities [2,3,4,5].
The rapid accumulation of huge U. prolifera biomass is not only related to its rapid growth rate [6,7] but also benefits from its excellent performance under abiotic stresses. During the floating growth process, the upper layers of U. prolifera are stressed by high salt, high light, and high temperature, but they maintain a higher photosynthetic activity than that of the lower and middle layers [8]. As one of the environmental stressors, salt stress has recently received great attention and is a major factor affecting the growth and development of U. prolifera.
Physiological and biochemical studies have shown that salt stress has a pronounced effect on the function and physiological activity of algal cells [9,10]. When subjected to salt stress, the cellular osmotic pressure, pigment content, and growth rate of U. prolifera were changed [11,12]. With the rapid development of transcriptome sequencing (RNA-Seq) [13], an investigation of the molecular mechanisms of algal cells to salt stress becomes convenient. Li et al. [14] found that the expression of photosynthesis and the glycerol metabolism of key genes were upregulated under salt stress by analyzing transcriptome data of Dunaliella salina. Chlamydomonas reinhardtii maintained lipid homeostasis by regulating phosphatidic acid and enhancing glycolytic metabolism to decrease carbohydrate accumulation in response to salt stress [15]. By comparing transcriptomic data, Ulva Compressa could provide sufficient energy to tolerate prolonged low salt stress by maintaining normal functioning of the photosystem and rapid recovery of carbon metabolism [16]. Overall, transcriptomic analysis revealed some crucial biological process changes in algae under salt stress. Although it has been reported that U. prolifera is a euryhaline alga, it can maintain photosynthetic activity when subjected to extreme salt stress [10]. However, there is still a lack of research on the molecular mechanisms of adaptation to a hypersaline environment. To better understand the molecular mechanisms, additional exploration of the transcriptional regulation of the relevant pathways is required.
In this study, three salinity treatments were set up, and RNA-seq was used to explore the molecular physiological mechanisms of U. prolifera in response to salt stress. Through functional annotation, clustering analysis, and GO and KEGG enrichment analysis, combined with the physiological data of U. prolifera under salt stress, we aimed to provide a more theoretical basis for the outbreak mechanism of the green tide.
2. Materials and Methods
2.1. Sample Collection and Culture
The floating sample was collected in the intertidal zone of Qingdao, Shandong Province, China (36°03’14” N, 120°22’17” E) during the green tide outbreak on 2 July 2019. It was confirmed as U. prolifera by morphological observation and molecular identification. The thalli were rinsed 3 to 4 times using sterile seawater to remove impurities, sediment, and other adherents from the algal surface. The thalli were cultured in sterile seawater at 22 ℃ with 50 µmol photons m−2 s−1 using a 12 h light/12 h dark cycle. Before the sample was used for the formal experiments, the thalli were cultured under the aforementioned conditions for 2 weeks to allow them to completely acclimatize to the environment.
2.2. Experimental Processing and Sample Collection
NaCl was added to sterile seawater to prepare seawater with different salinities (30, 50, and 90 psu), while seawater with a salinity of 30 psu was used as a control. Samples in healthy and consistent condition were cultured in different salinities (30, 50, and 90 psu) for 1 h. The samples were named C, S5, and S9, respectively. Some of the samples were used for the determination of photosynthetic parameters and the rest were blotted dry with absorbent paper, snap-frozen in liquid nitrogen, and stored at −80 °C for freezing. Each of the above treatments was set up with three replicas.
2.3. RNA Extraction and Library Construction
The RNA was extracted according to the instructions of the RNAprep Pure Polysaccharide Polyphenol Plant RNA Extraction Kit, and the concentration and quality of RNA were determined using a Nanodrop Photometer (IMPLEN, Westlake Village, CA, USA). High-quality RNA samples were selected and enriched with Oligo(dT) beads. mRNA was then broken into short fragments by adding a fragmentation buffer. mRNA was used as a template to synthesize single-stranded cDNA using six-base random hexamers, followed by the addition of buffer, dNTPs, and double-stranded cDNA using AMPure XP beads. The purified double-stranded cDNA was then end-repaired, subjected to poly(A) addition and sequenced with AMPure XP beads, and the fragment size was selected using AMPure XP beads. PCR amplification was performed and the final library was obtained by purifying the PCR products with AMPure XP beads. Libraries were sequenced using the Illumina HiSeq platform from Novogene.
2.4. Transcript Splicing and Function Annotation
Sequencing yielded raw reads and removed spliced, low-quality reads to obtain high-quality clean reads. The clean reads were then spliced using Trinity [17], and the resulting transcript-sequence information was stored in FASTA format. All transcripts were annotated for gene function using seven databases: NCBI Non-Redundant Protein Sequence Database (NR), NCBI nucleotide sequences (NT), SWISS-PROT (protein sequence annotation and review database), Clusters of Orthologous Groups of proteins (COG/KOG), Kyoto Encyclopedia of Genes and Genomes (KEGG), Gene Ontology (GO), and Protein family (Pfam).
2.5. Identification and Enrichment Analysis of Differentially Expressed Genes (DEGs)
Differential analysis was performed using readcount data and normalized using Deseq2 [18]. DEGs were identified by the following thresholds: padj < 0.05 and|log2FoldChange| > 1. For DEGs, if log2Foldchange > 0, the DEGs were considered to be up-regulated, and conversely, if log2Foldchange < 0, the DEGs were down-regulated. All DEGs were then mapped to the Genes Ontology (GO) and KEGG terms for enrichment analysis to further identify relevant biological pathways and biological functions.
2.6. Validation of mRNA Expression Patterns by Quantitative Real-Time PCR (qRT-PCR)
Ten DEGs were chosen for qRT-PCR to confirm the accuracy of the sequencing results randomly. Gene sequences were obtained from transcriptome data and sequence numbers were obtained by sequence alignment in Symbiodiniaceae and Algal Genomic Resource (SAGER) (http://sampgr.org.cn/ (accessed on 1 November 2022). The β-actin gene was selected as the internal reference gene and primers were designed using Primer Premier 5.0. The primer sequences are shown in Table 1. After total RNA extraction, cDNA was obtained by reverse transcription according to the TaKaRa Reverse Transcriptase Kit instructions. The qRT-PCR reaction system was 20 μL and consisted of 10 μL 2 × SYBR Green Master Mix (Roche, Germany), 0.4 μL of each upstream and downstream primer (10 μM), 1 μL of template cDNA, and 8.2 μL of ddH2O. qRT-PCR was performed using a StepOne Plus multicolor real-time quantitative fluorescence PCR instrument (ABI, Foster, CA, USA) with the following reaction procedure: pre-denaturation at 95 °C for 10 min, denaturation at 95 °C for 10 s, annealing at 55 °C for 15 s, and extension at 72 °C for 25 s for 40 cycles. All samples were repeated three times and relative differential gene expression levels were calculated by the 2−ΔΔCt method [19].
2.7. Photosynthetic Parameter Determination
To study the physiological response of U. prolifera to salt stress, the photosynthetic properties of U. prolifera were measured using a modulated chlorophyll fluorometer (Dual-PAM-100. Walz, Germany) after 1 h treatment with different salinities (30, 50, and 90 psu). The chlorophyll fluorimeter was first manipulated using Dual-PAM software to measure the induction curve, with a photochemical light provided by an LED at 635 nm with a light intensity of 50 μmol photons m−2s−1 and a saturation pulse intensity of 10,000 μmol photons m−2s−1. The dark fluorescence yield (F0) was measured after the thalli were subjected to dark adaptation for 8 min, and then maximal fluorescence yield (Fm) was measured by applying a saturated pulse. The whole measurement lasted 300 s. Variable fluorescence (Fv) was obtained from the difference between Fm and F0, and the maximal PS II quantum yield was shown as Fv/Fm. The effective PS II quantum yield (Y(II)) was calculated according to the formula [Y(II) = (Fm’ − F)/Fm’] [20], where F was the fluorescence yield and Fm’ was the maximum fluorescence yield. The light curve was then measured and the rate of charge separation at PS II reaction centers (ETR(II)) was recorded.
2.8. Measurement of Photosynthetic Oxygen Release and Respiratory Oxygen Consumption
The samples were treated with different salinities as above. Thalli (FW) in the amount of 0.01 g was used to determine photosynthetic oxygen release and respiratory oxygen consumption rates using an Oxylab oxygen electrode (Hansatech, UK) and by calculating the slope of the oxygen concentration curve. The respiratory oxygen consumption rate was first measured for 15 min without the addition of light, followed by the photosynthetic oxygen release rate, which was measured for 15 min with the addition of light intensity with 50 μmol photons m−2 s−1, and all samples were repeated three times. The entire measurement took place in the reaction tank of the Oxylab oxygen electrode and the oxygen concentration was monitored in real time by Oxylab (v1.15), dedicated software for oxygen electrodes.
2.9. Statistical Analysis
All the results were statistically analyzed using the LSD method in PASW Statistics 18, setting a significance level of p < 0.05 and using Origin 2021 for the graphs.
3. Results
3.1. Transcriptome Sequencing Quality and Annotation Results
Nine samples of U. prolifera were sequenced for transcriptome, yielding a total of 504,232,690 raw reads (Table 2). For each sample, 47,717,318 to 61,146,286 clean reads were kept after low-quality data were eliminated, and the Q20 and Q30 values exceeded 94.69% and 86.74%, respectively. The Pearson correlation coefficients between all samples ranged from 0.851 to 0.999 (R > 0.750) (Figure 1A), indicating a strong degree of repeatability between samples within the group. These results indicated that the transcriptome data obtained from the sequencing were of excellent quality and could be used for additional investigation.
3.2. Screening and Enrichment Analysis of DEGs
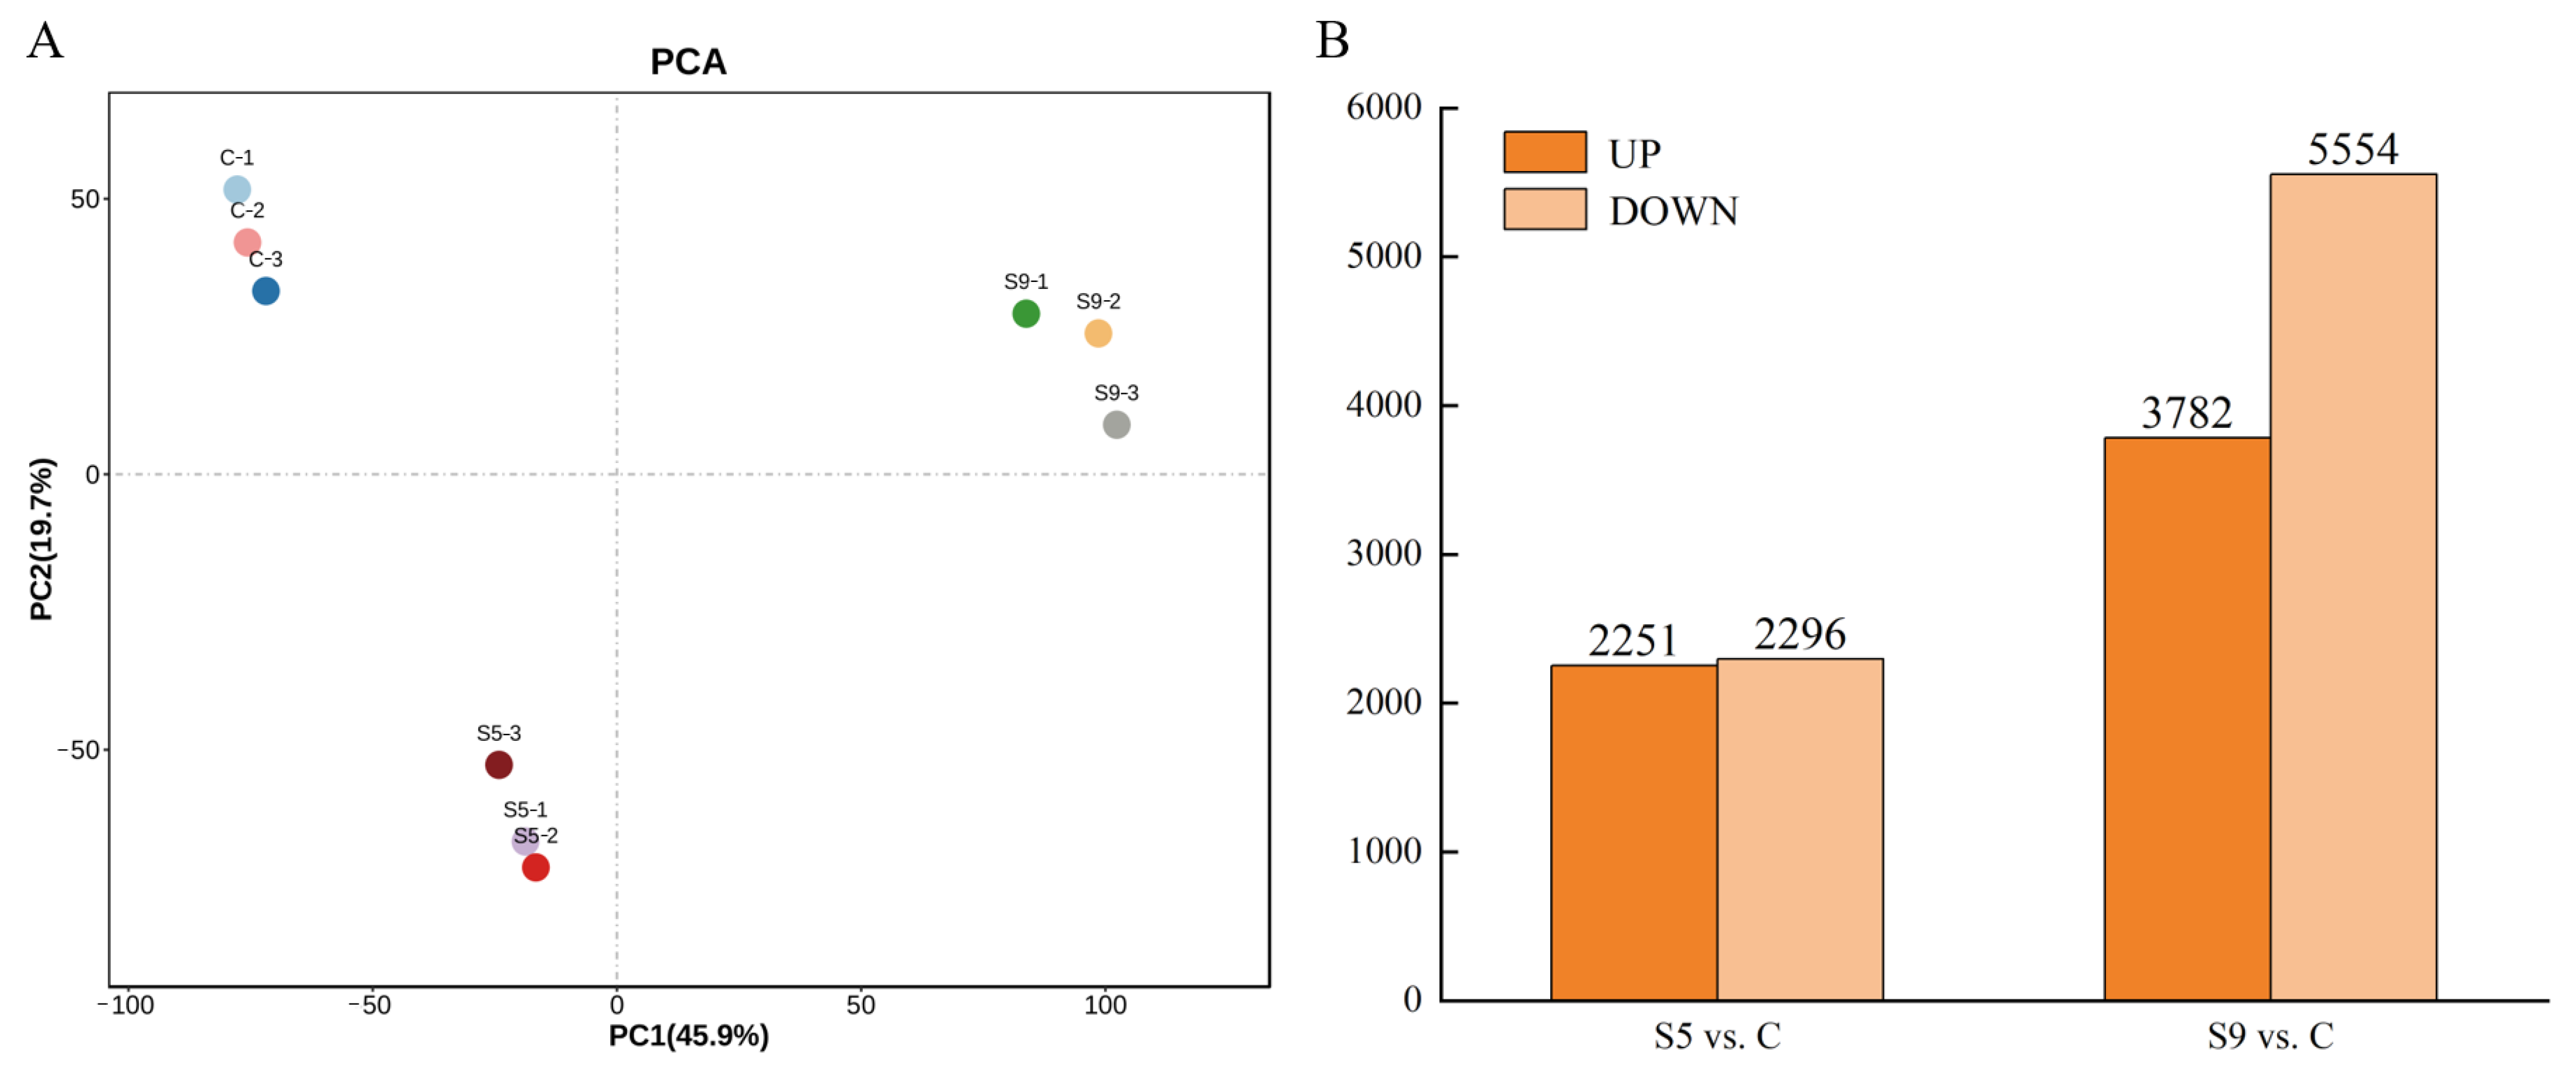
Principal component analysis (PCA) of gene expression showed (Figure 2A) that the three groups of treatments differed significantly in both PC2 and PC1, indicating that salt stress had a significant effect on U. prolifera. A total of 11,819 DEGs were identified in the three groups (Figure 2B), of which the number of upregulated genes was approximately equal to the number of downregulated genes in the S5 vs. C comparison. There were 2251 upregulated genes and 2296 downregulated genes, and the number of DEGs accounted for 38.47% of the total number of DEGs. In contrast, the number of DEGs was significantly higher in the S9 vs. C comparison, with 3782 upregulated genes and 5554 downregulated genes, accounting for 61.53% of the total number of DEGs.
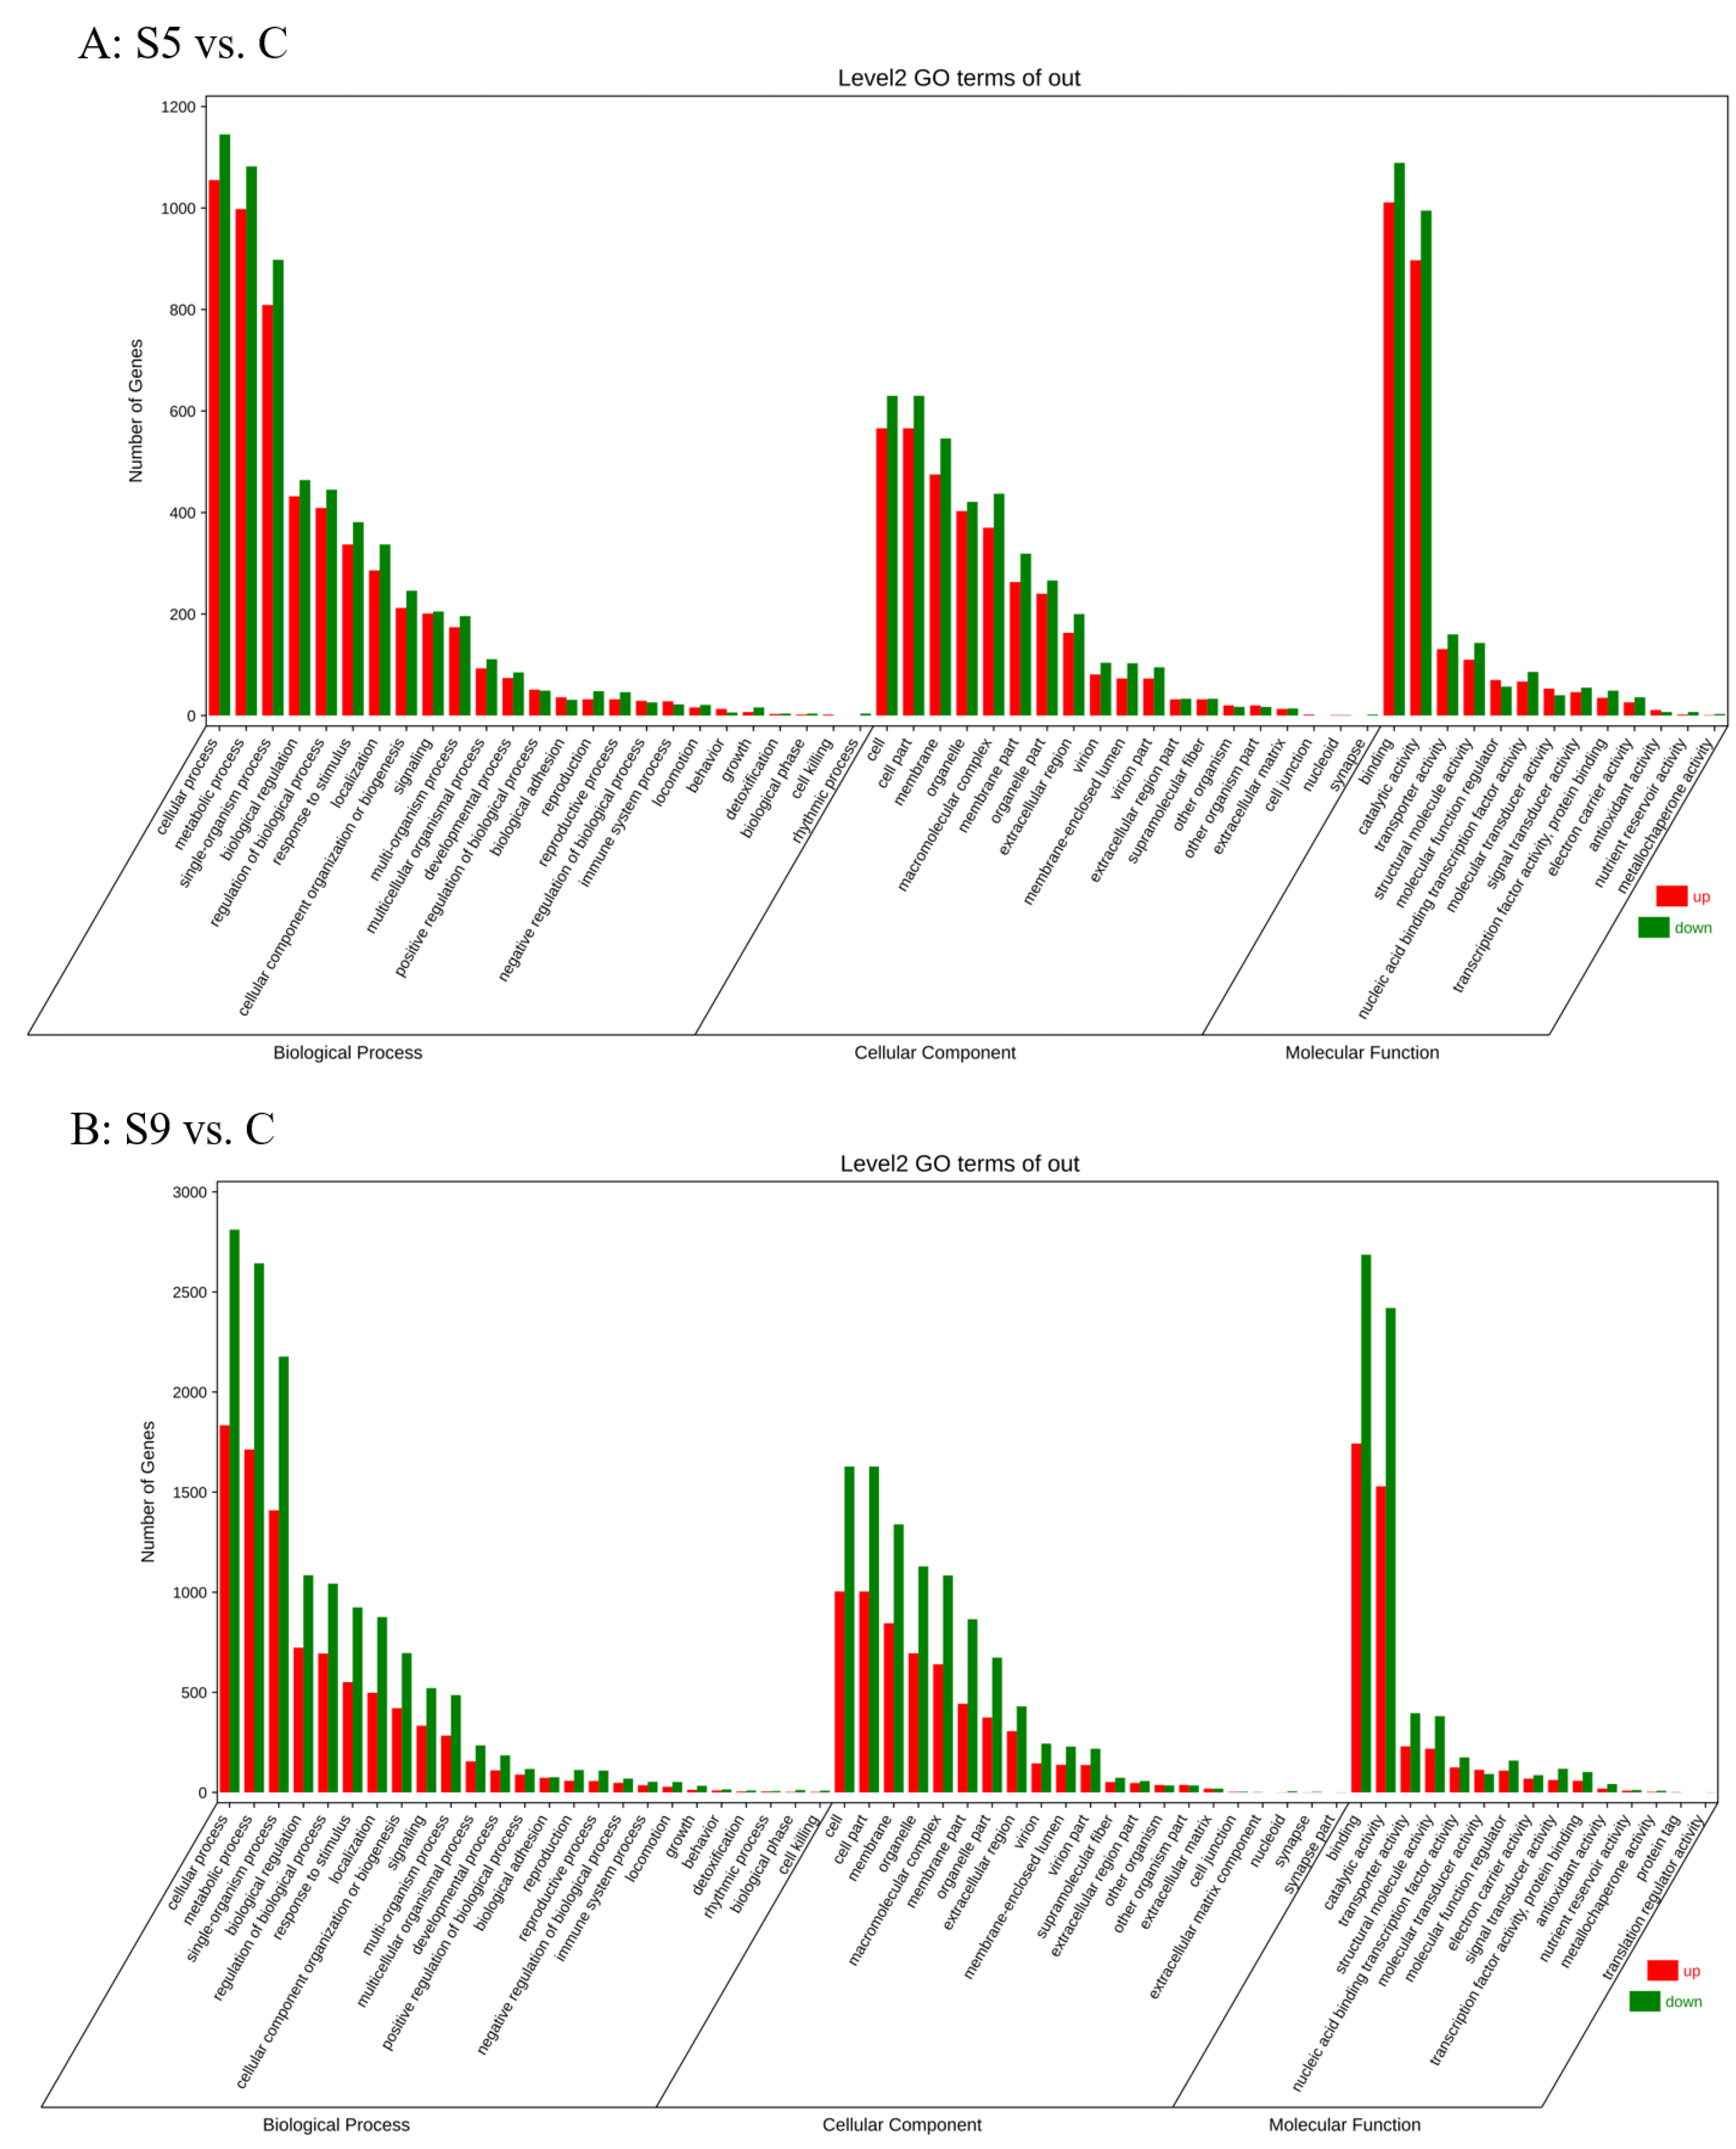
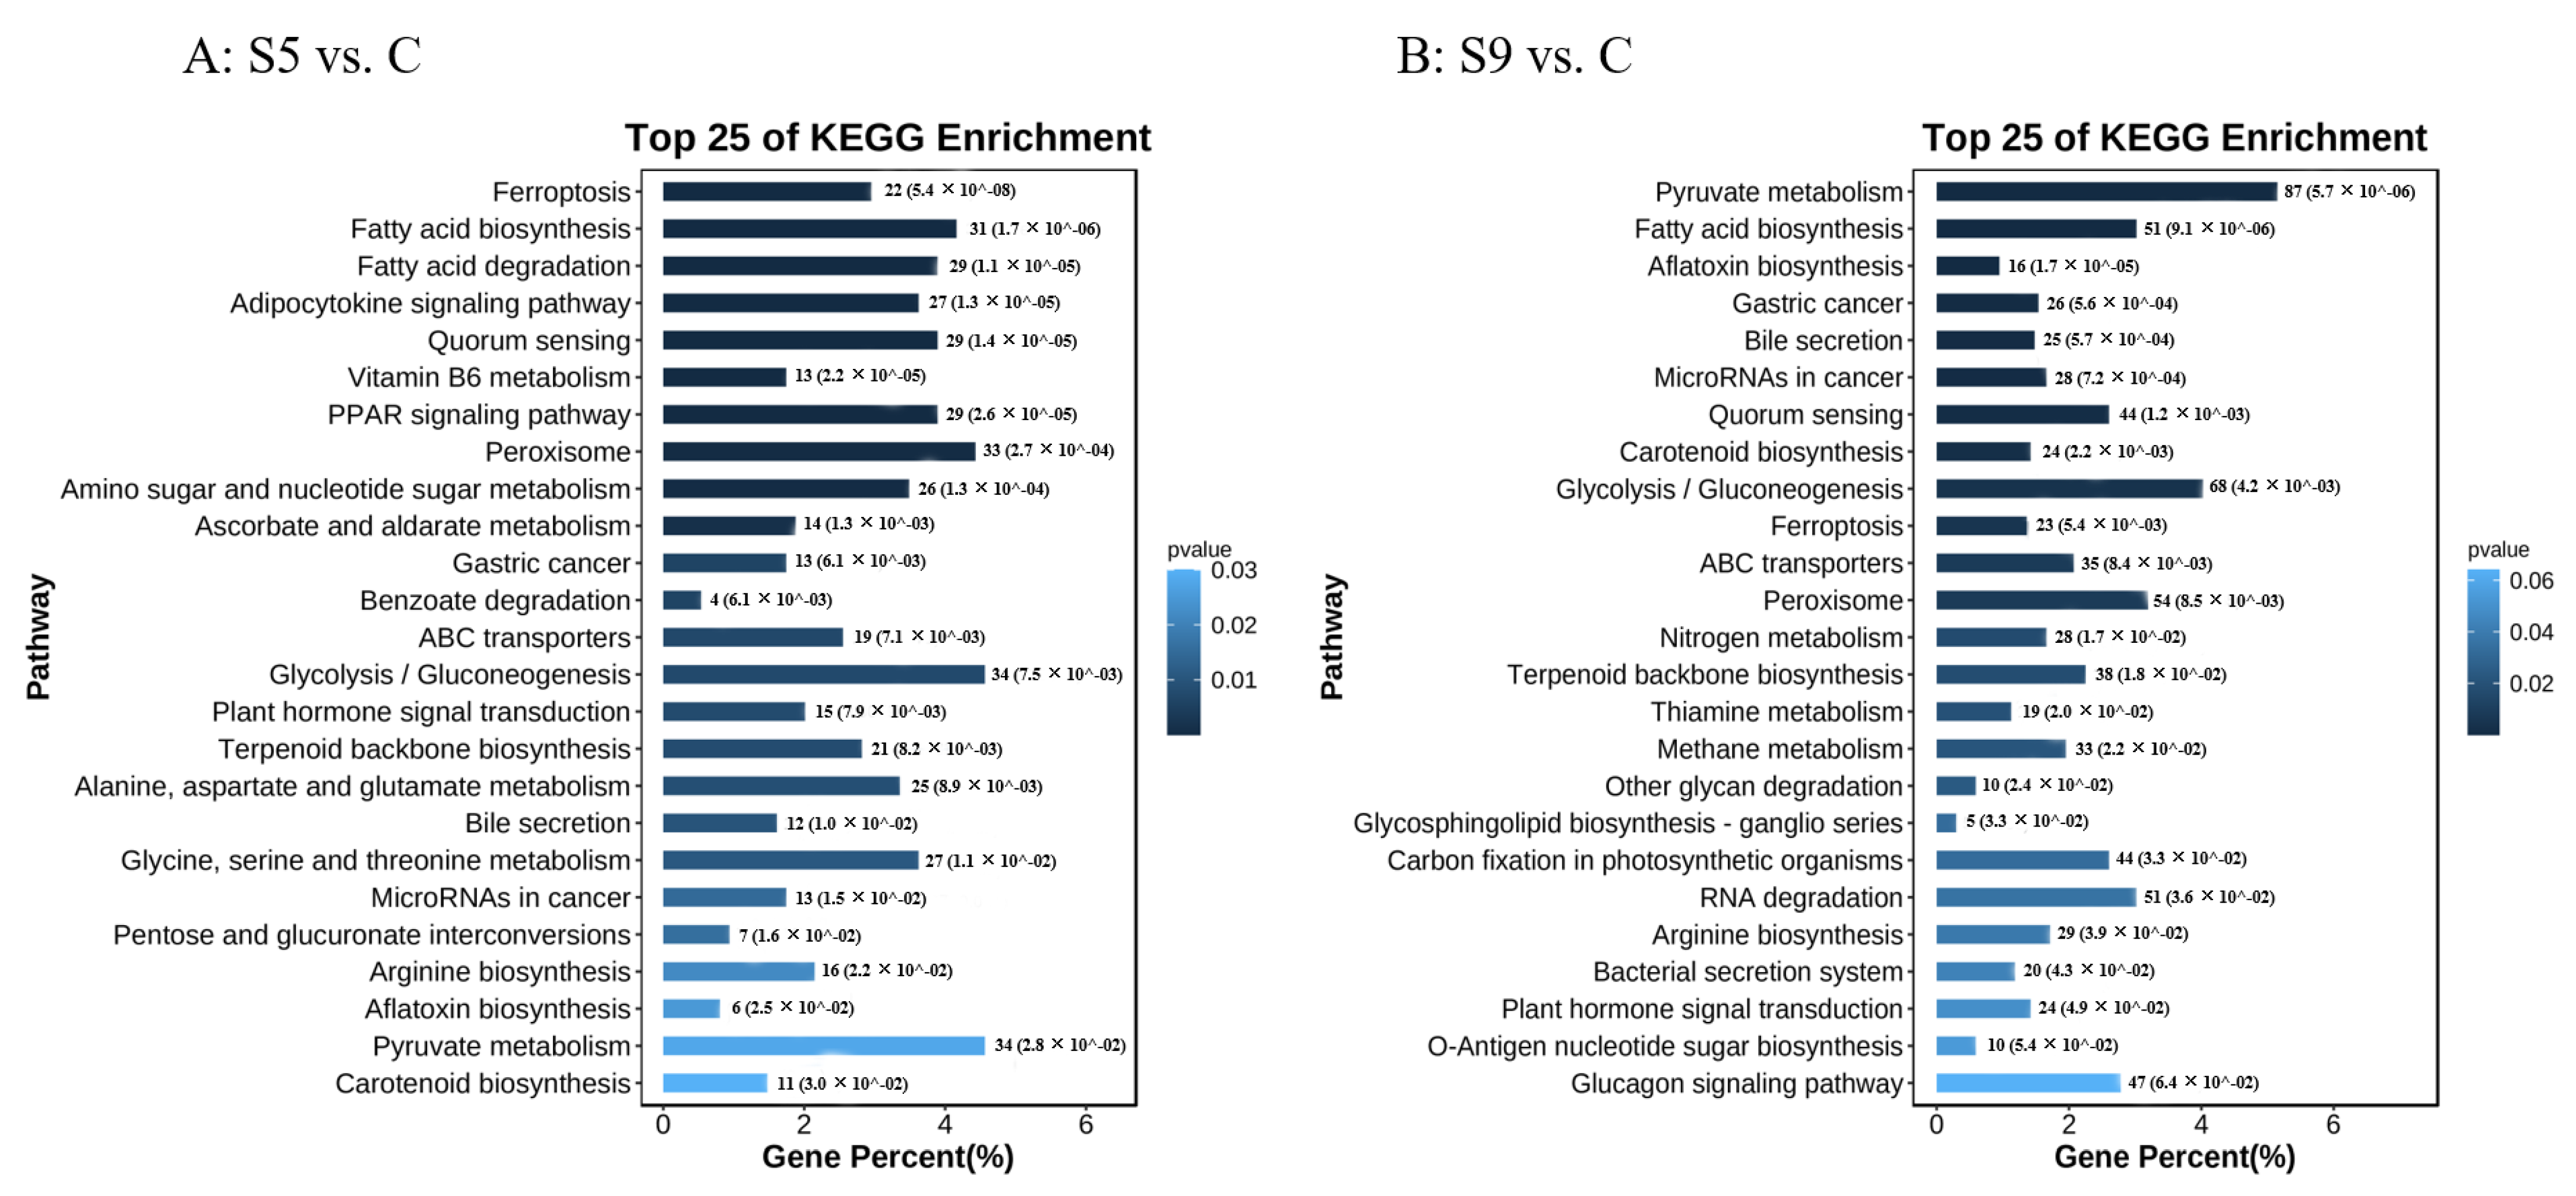
Gene Ontology received annotations for 51,884 DEGs in total (Figure 1B). In the biological process category, the main enriched terms were cellular process, metabolic process, and single-organism process; in the cellular component category, cell, cell part, and membrane were the three main enriched terms; binding and catalytic activity were the two main enriched terms in the molecular function category (Figure 3). In a KEGG enrichment analysis, more pathways responded to salt stress. In the S5 vs. C and S9 vs. C comparisons, the seven pathways that shared the highest enrichment frequencies mainly included glycolysis, pyruvate metabolism, peroxisome, and fatty acid biosynthesis. In addition, fatty acid degradation, quorum sensing, and PPAR signaling pathways were included in the S5 vs. C comparison, while RNA degradation, glucagon signaling pathways, and carbon fixation in photosynthetic organisms were also included in the S9 vs. C comparison. which may also be associated with salt stress response (Figure 4).
3.3. qRT-PCR Validation of Gene Expression Patterns
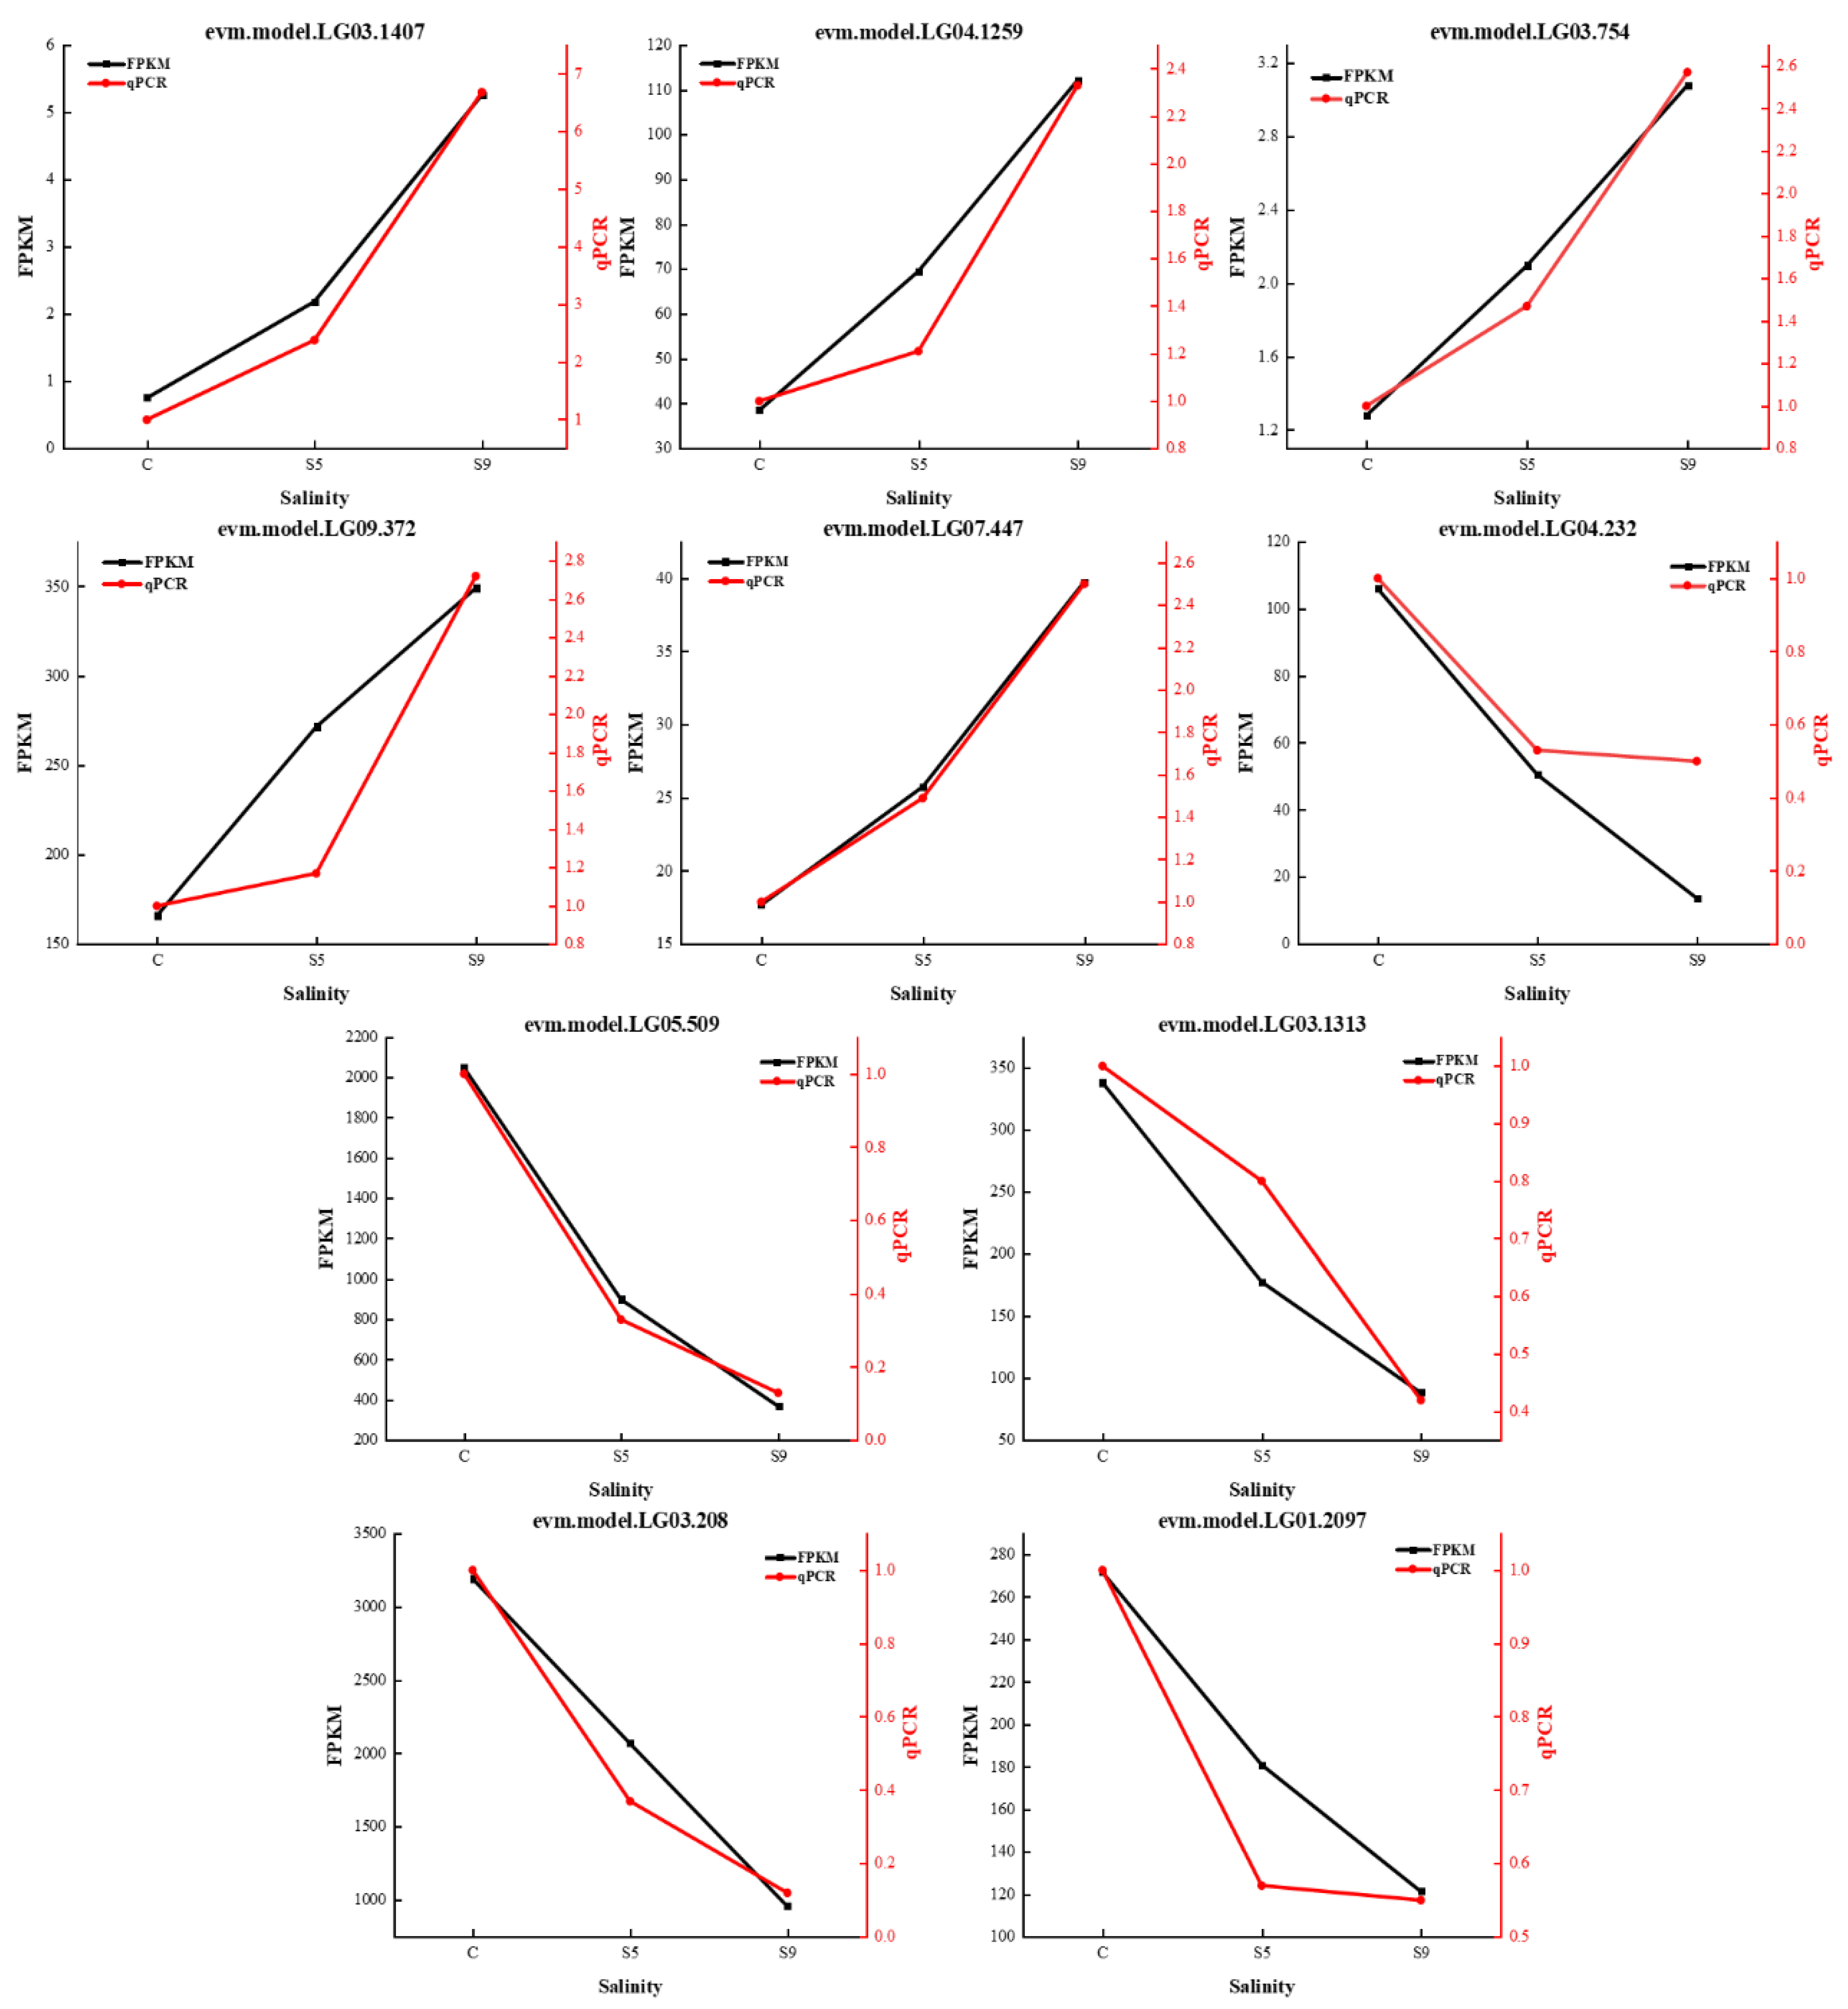
Five upregulated genes (evm.model.LG03.1407, evm.model.LG04.1259, evm.model.LG03.754, evm.model.LG09.372, and evm.model.LG07.447) and five downregulated genes (evm.model.LG04.232, evm.model.LG05.509, evm.model.LG03.1313, evm.model.LG01.2097, and evm.model.LG03.208) were randomly selected from the transcriptomic data and were validated by qRT-PCR. The results showed that the expression trends of the ten DEGs at different salinities (30, 50, and 90 psu) showed essentially the same changes as the relative expression levels of the DEGs detected by RNA-seq (Figure 5).
3.4. Resistance-Related Gene Expression
In the transcriptome analysis, we found that numerous genes related to stress resistance pathways were upregulated (Table 3), including heat-shock proteins, microtubule-associated proteins, ubiquitin-associated proteins, abscisic-acid-signaling-pathway-associated proteins, and antioxidant-associated proteins, with heat-shock proteins and antioxidant-associated proteins being significantly upregulated under elevated salinity conditions (S9).
3.5. Expression of Genes Related to Photosynthesis and Carbon Fixation Pathways
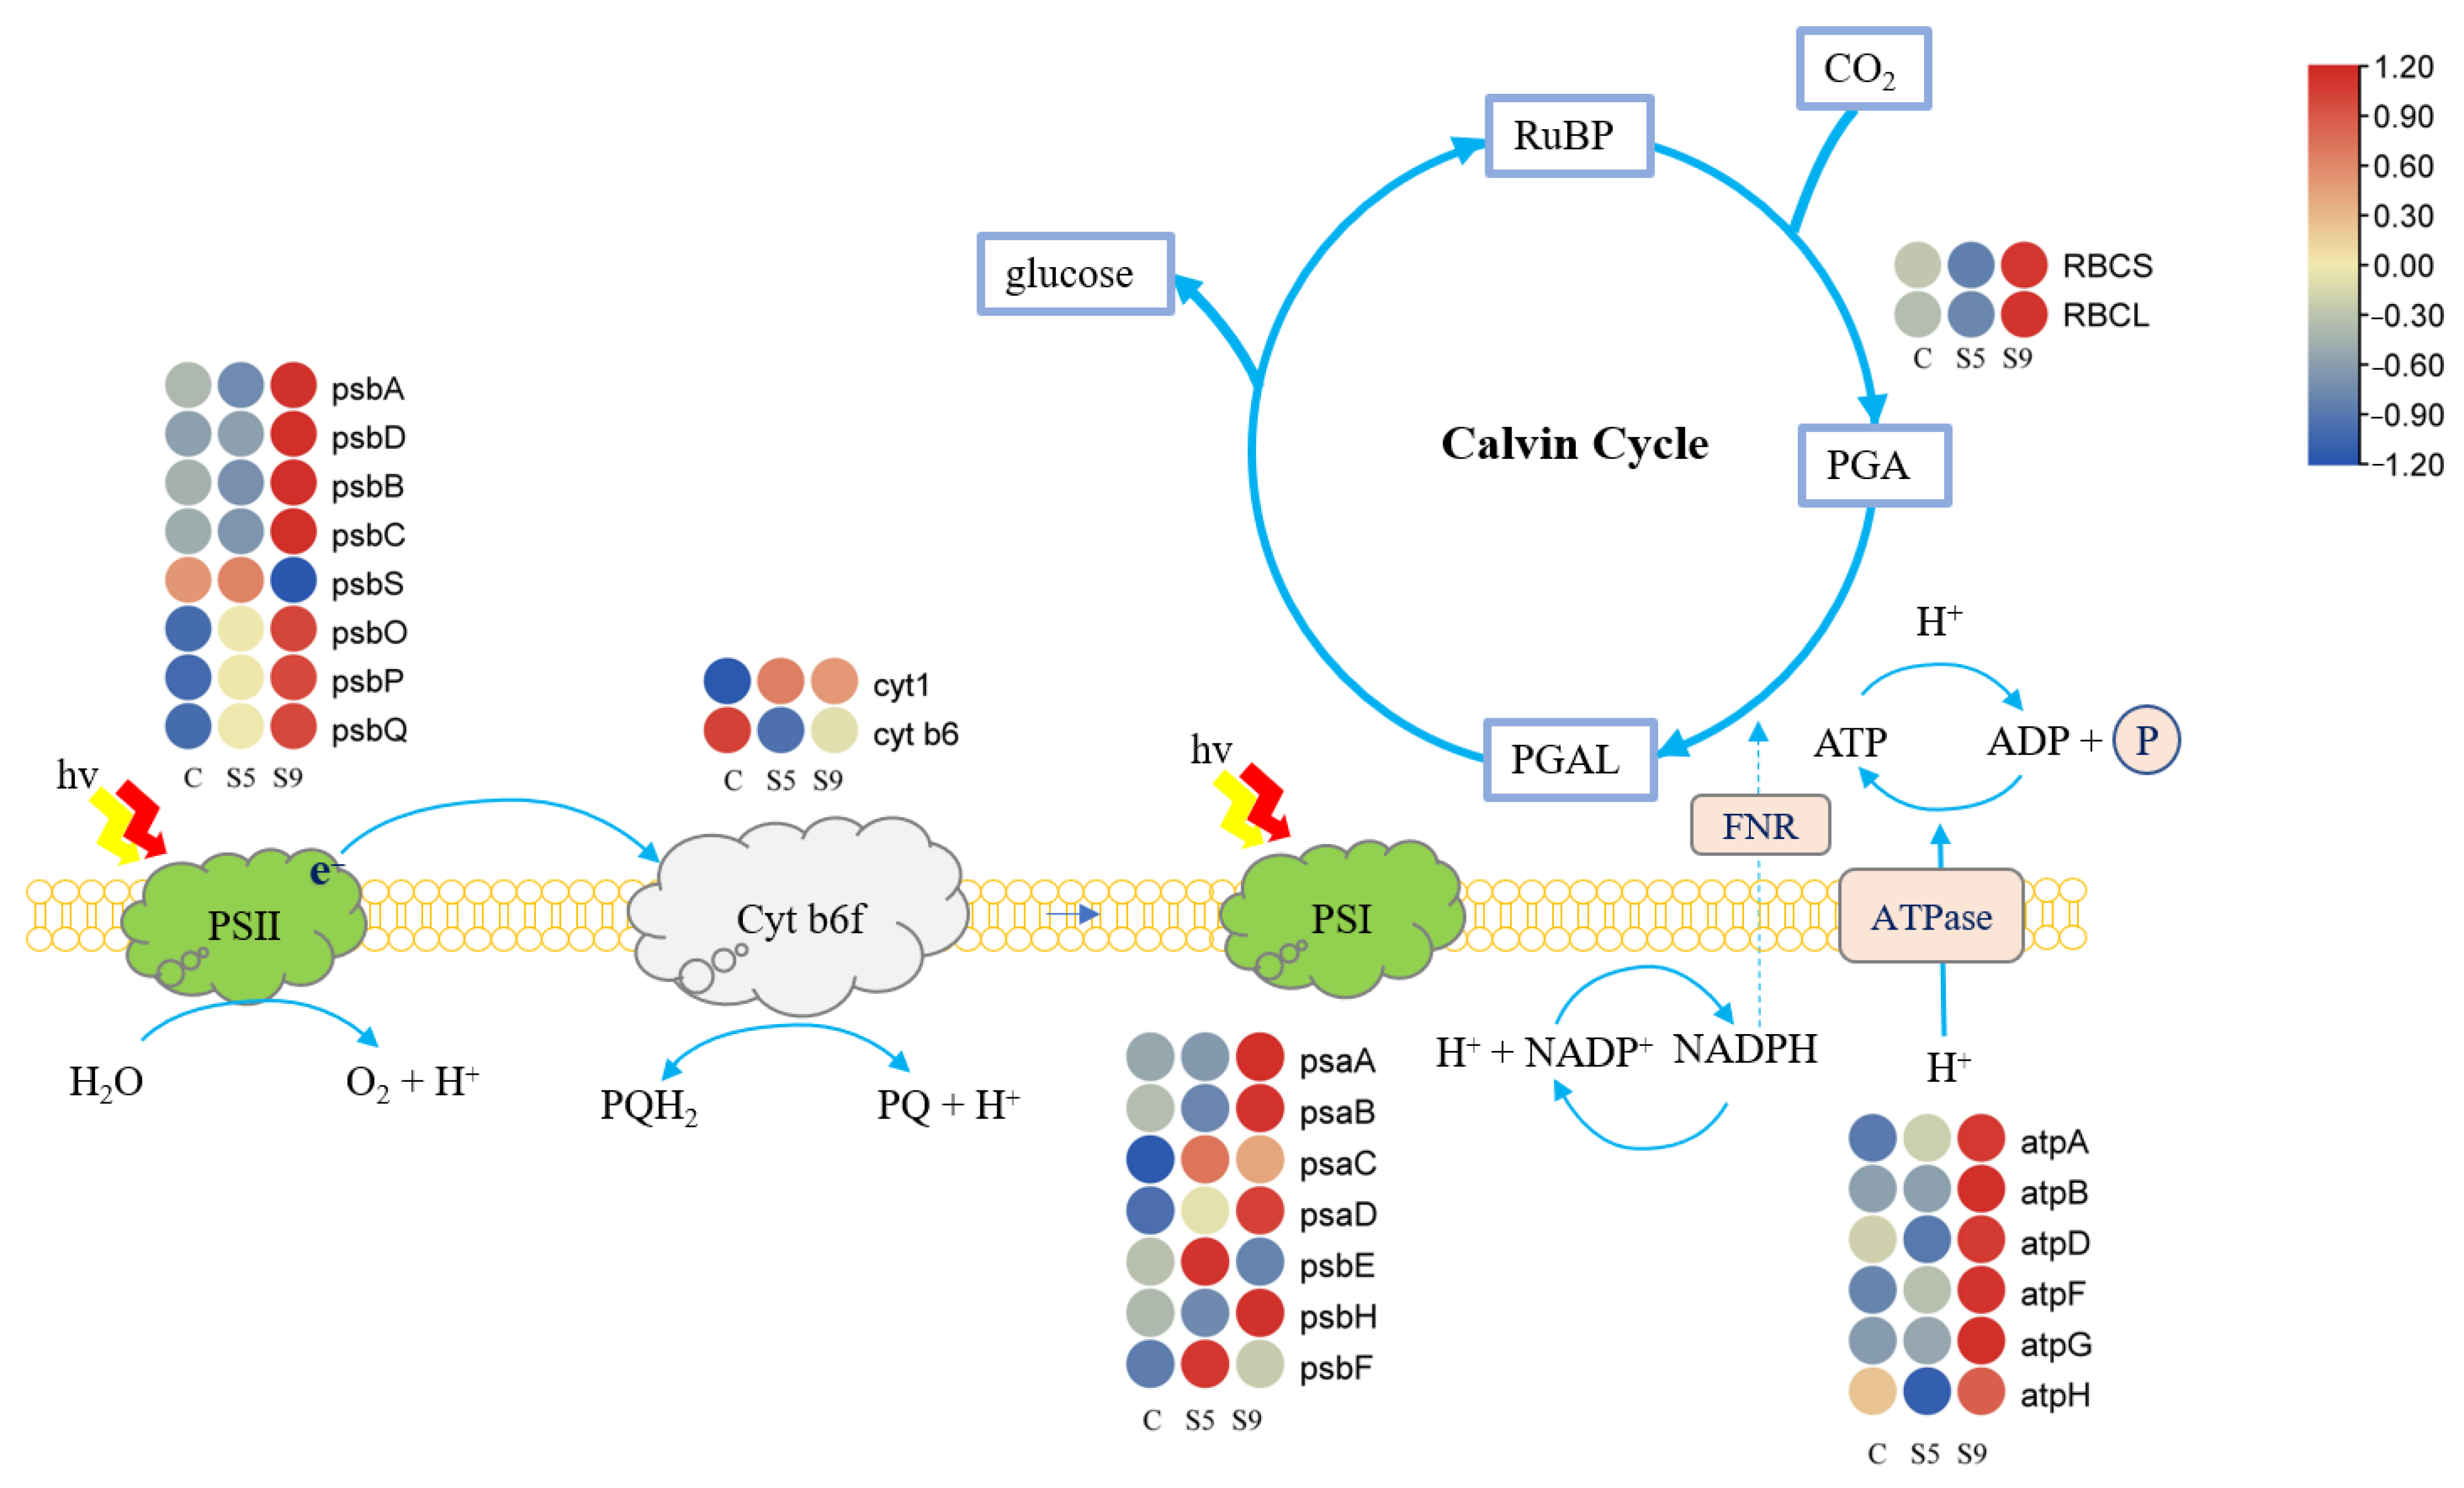
According to the expression of photosynthesis-related genes in the transcriptome plotted as a heat map (Figure 6), the abundance of transcripts of genes related to photosynthesis and carbon fixation pathways changed under salt stress. The reaction center protein cytb6 of Cyt b6f and the protein psbS of the reaction center of PS II were downregulated. PS I, ATPase, Rubisco, and the remaining PS II reaction center proteins were up-regulated.
3.6. Changes in Physiological Activity, Photosynthetic Oxygen Release, and Respiratory Oxygen Consumption
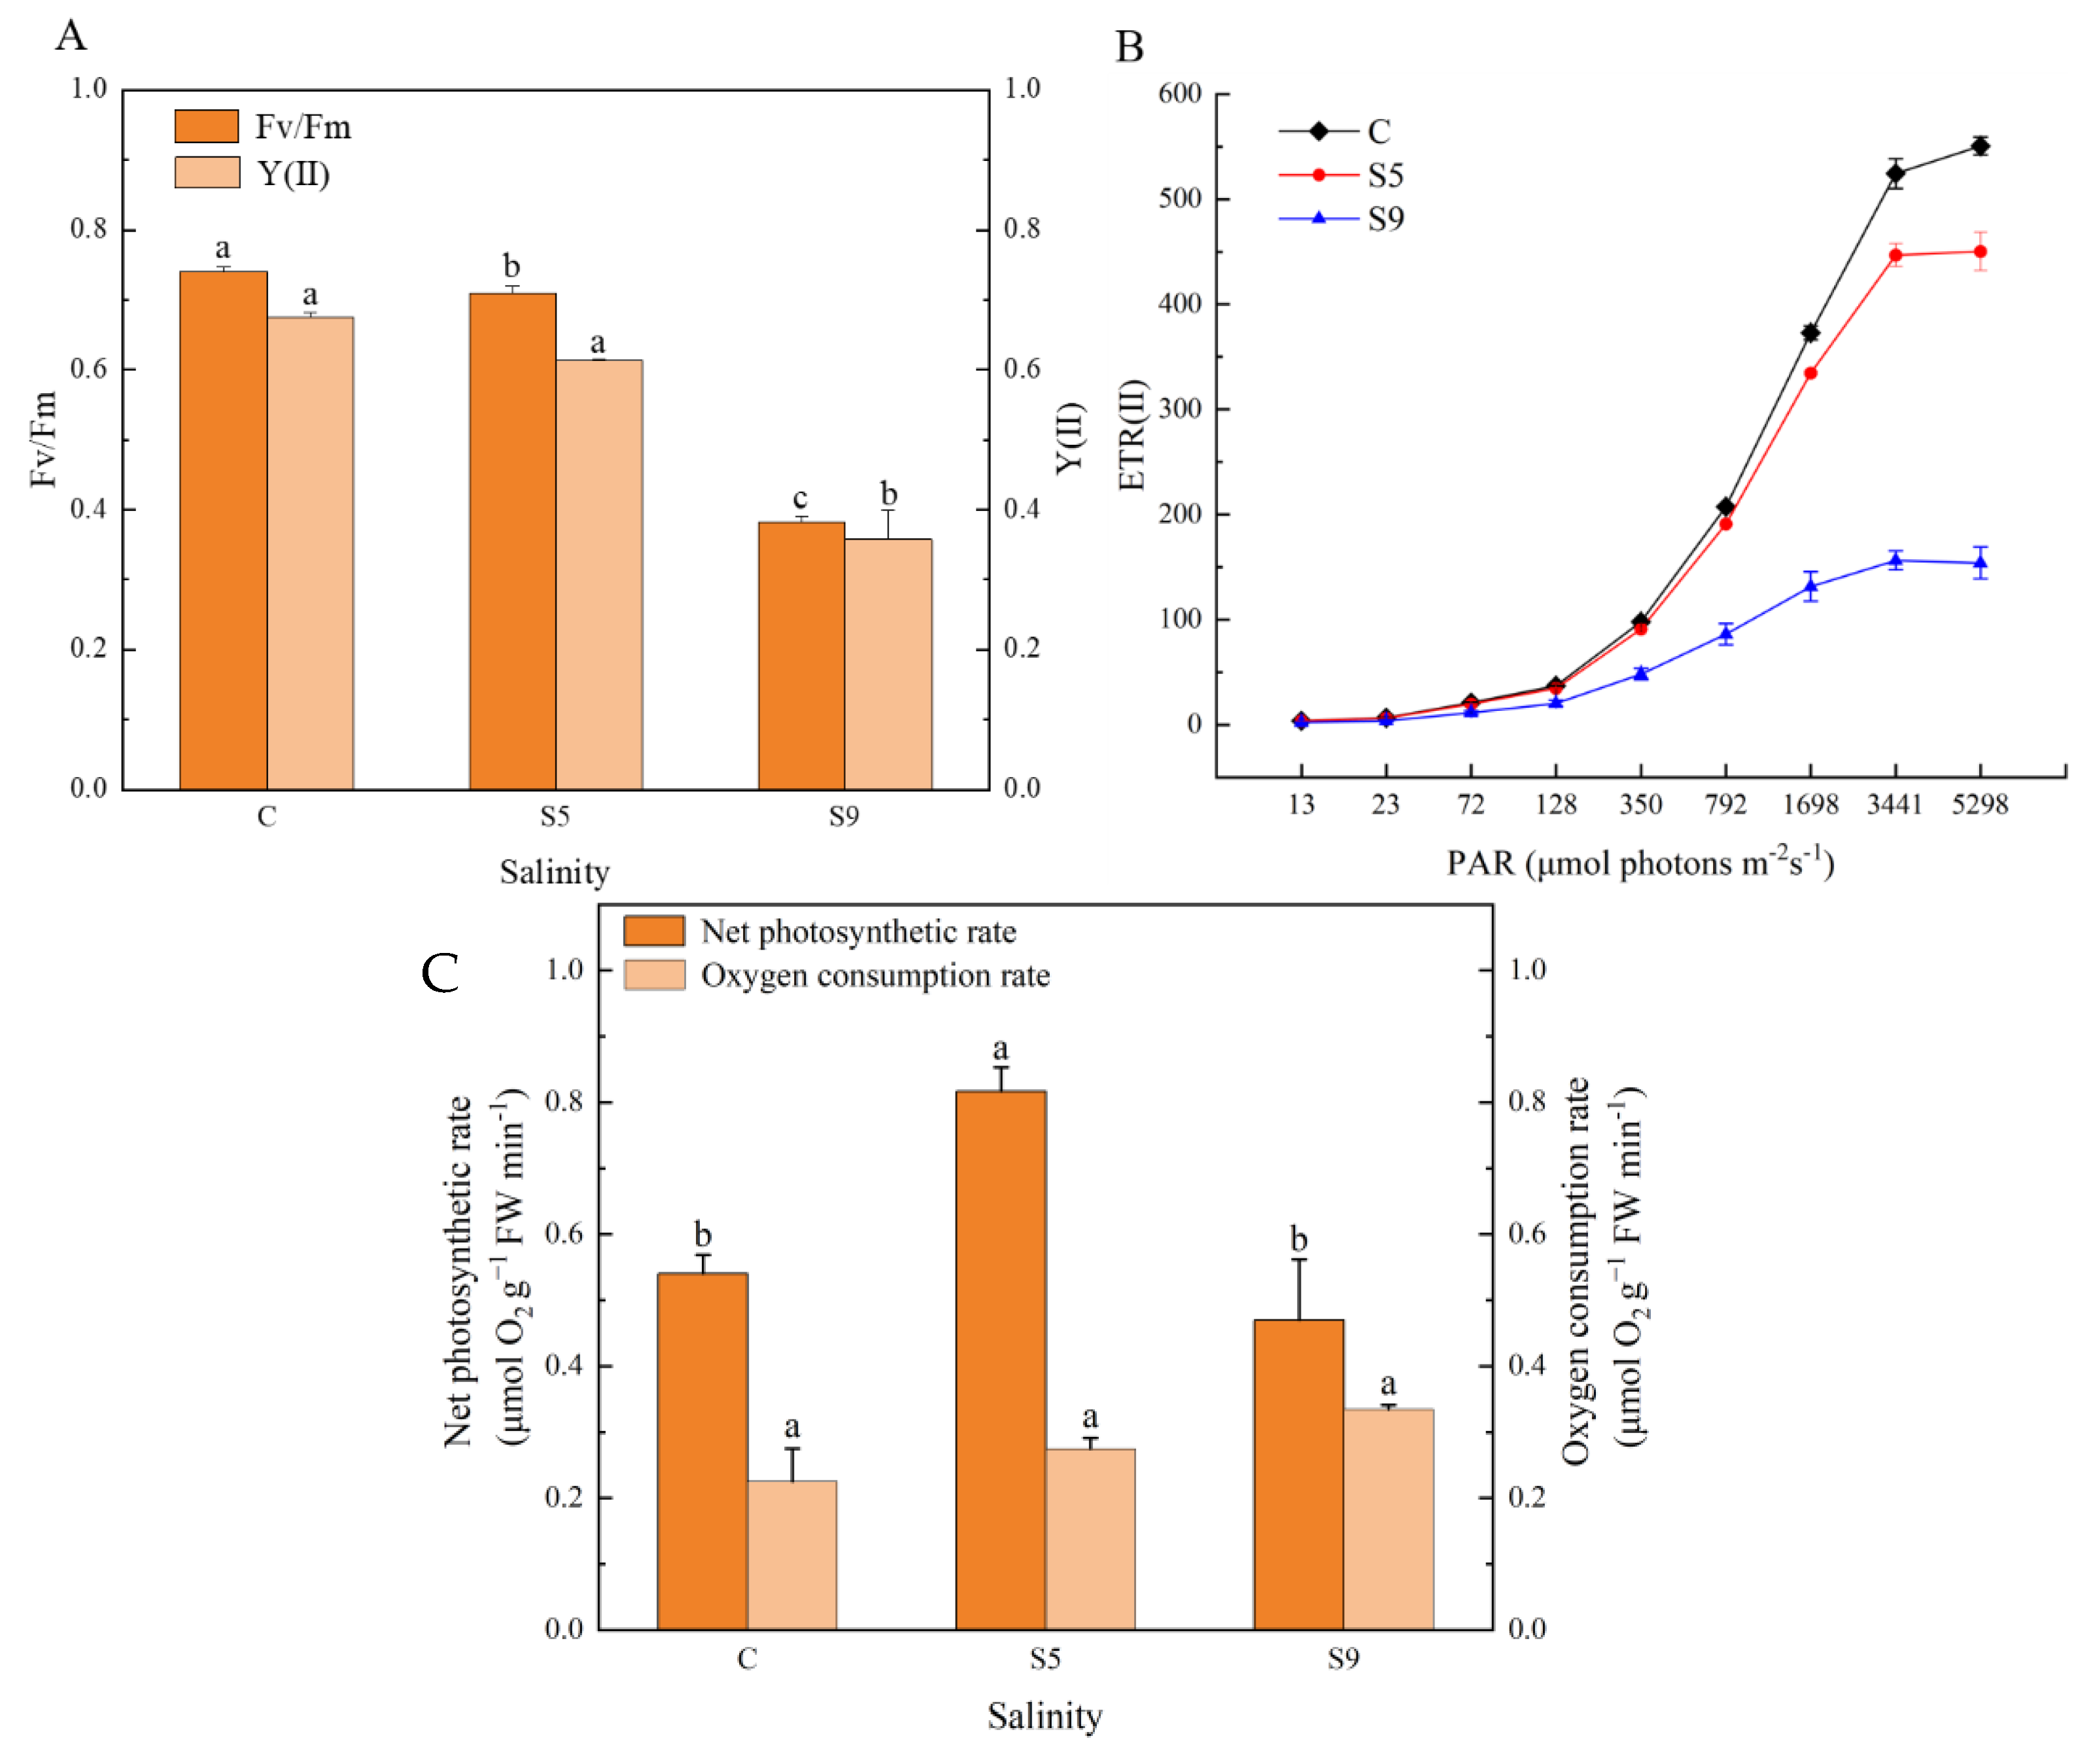
Fv/Fm and Y(II) in U. prolifera varied with increasing salinity (Figure 7A). The differences in Fv/Fm values among the three groups reached a significant difference levels (p < 0.05), with the general trend being that Fv/Fm gradually decreased with increasing salinity and decreased significantly when salinity reached 90 psu. The trend in Y(II) was similar to that of Fv/Fm, but there was no significant difference between groups S5 and C (p > 0.05). The overall trend of light acclimation capacity in the three groups was generally consistent (Figure 7B), with ETR(II) gradually becoming smaller as light intensity increased. When the light intensity reached 350μ, the ETR(II) became smaller and tended to increase steeply. The ETR(II) in groups C and S5 remained consistently higher, while the ETR(II) in group S9 remained consistently lower.
In addition, the photosynthetic oxygen release rate showed a trend of increasing and then decreasing with increasing salinity, and the photosynthetic oxygen release rate of group S5 was significantly higher than that of group C (p < 0.05), while the difference between group S9 and group C was not significant (p > 0.05). The respiratory oxygen consumption rate gradually increased with increasing salinity, but the difference among the three groups was not significant (p > 0.05) (Figure 7C).
4. Discussion
4.1. Downregulated Genes Increase Significant under Salt Stress
U. prolifera experiences high salt stress when exposed to the atmosphere for a long time. In this study, the ratio of upregulated to downregulated genes was close to 1:1 when U. prolifera was subjected to moderate salt stress (S5). When it was subjected to high salt stress (S9), the ratio was close to 2:3 and the number of DEGs was 2.2 times higher than that of the S5 (Figure 2), indicating that the number of DEGs gradually increased with the increase in salinity, and the number of downregulated genes was significantly higher than the number of upregulated genes. The physiological activity results showed that U. prolifera was still able to maintain a high physiological activity under moderate salt stress (S5); however, it decreased significantly under high salt stress (S9) (Figure 7). During high salt treatment (S9), the downregulated genes were mainly concentrated on the metabolic pathways of protein processing in the endoplasmic reticulum, aminoacyl-tRNA biosynthesis, and valine, leucine, and isoleucine biosynthesis (Figure 3 and Figure 4). The endoplasmic reticulum is a channel for secretion of plant cells and approximately one-third of proteins are folded or assembled in the endoplasmic reticulum. When subjected to environmental stress, unfolded and misfolded proteins accumulate in the endoplasmic reticulum, thereby causing damage to the cell [21]. In addition, amyl and valine, leucine, and isoleucine also play essential roles in intracellular homeostasis [22].
4.2. Expression of Resistance-Related Genes was Upregulated under Salt Stress
According to the results of DEGs enrichment analysis, DEGs were mainly enriched in glycolysis, pyruvate metabolism, peroxisome, and fatty acid biosynthesis pathways (Figure 3 and Figure 4), which play a crucial role in the stress tolerance of U. prolifera under salt stress.
Salt stress commonly leads to excessive accumulation of reactive oxygen species (ROS) in plants, and the toxicity of ROS will lead to damage of carbohydrates, lipids, DNA, and proteins, and ultimately to oxidative stress [23,24]. A similar process may have occurred in U. prolifera, where DEGs were significantly enriched in the peroxisome synthesis pathway during salt stress, including upregulated expression of ascorbate peroxidase, superoxide dismutase, and glutathione reductase (Table 3), which are critical for ROS scavenging [25,26]. In a transcriptome analysis of salt-stressed C. reinhardtii cells, genes involved in removing ROS, such as plastid Fe SOD1, thioredoxins, glutathione transferase, and heat-shock factor binding proteins, were also significantly upregulated [24].
As molecular chaperones, heat-shock proteins participated in the process of folding polypeptide chains to form proteins with a spatial structure. They could stabilize polypeptide chains and prevent protein inactivation under stressful conditions, enhancing cellular tolerance to stress and, thus, improving the adaptive capacity of cells [27]. It was reported that Hsp70 overexpression could increase tolerance to various abiotic stresses in higher plants [28,29]. In our results, multiple Hsp-related genes were also found to be upregulated, which may play an important role in cellular protein homeostasis. However, the up-regulation of all the resistance-related genes mentioned above was mainly at the transcriptional level, and whether they were upregulated at the protein level remains to be explored further.
In addition, studies have shown that algae require sufficient energy for stress adaptation, including osmotic pressure accumulation and protein synthesis process [30]. The glycolytic pathway was exceptionally active in U. prolifera with salt stress (Figure 4). Glycolysis is a key respiratory pathway for the production of ATP, which provides energy for cellular glucose transport. It plays an important role in plant development and adaptation to abiotic stressors such as salt, drought, and cold [31]. Salt stress significantly increases the content of major carbohydrates, which can be involved in osmotic regulation and used as a protective agent for cell homeostasis regulation during salt stress tolerance [32,33,34,35].
4.3. Photosynthetic Oxygen Release Rate Enhanced Significantly under Salt Stress
In this study, the photosynthetic activity of U. prolifera was significantly decreased under high salt stress. However, in the S5 treatment, the photosynthetic oxygen-release rate was significantly increased; in the S9 treatment, the photosynthetic oxygen-release rate was still maintained (Figure 7C). The results showed that U. prolifera responds differently to different salinities. When the thalli were subjected to salt stress, the expression of PSII reaction center proteins increased (Figure 6), which promoted oxygen release in a short period and facilitated the maintenance of higher physiological levels. Based on the transcriptome data, we found that the carbon fixation pathway was enriched significantly. For example, the expression of FNR and ATPase genes in the light reaction increased to provide additional NAD(P)H and ATP to support carbon metabolism (Figure 6). We hypothesize that when U. prolifera was in response to salt stress, glycolysis and pyruvate metabolism were enhanced to release CO2 and ATP, and on the other hand, the expression of genes related to Rubisco and Calvin cycle was upregulated to facilitate the operation of dark reactions, while consuming accumulated sucrose or starch between cells by photosynthesis [34], thus maintaining photosynthesis and ultimately reducing the effects of salt stress on U. prolifera.
5. Conclusions
To investigate the molecular and physiological mechanisms of U. prolifera in response to salt stress, transcriptomic data were sequenced using the Illumina HiSeq high-throughput sequencing platform under different salinity treatments (30, 50, and 90 psu), along with photosynthetic physiological activity parameters, the photosynthetic oxygen release rate, and respiratory oxygen consumption data. The study of GO and KEGG enrichment revealed that 11,819 DEGs had been discovered. The genes were enriched in metabolic pathways, such as glycolysis, pyruvate metabolism, and peroxisome. In addition, the active expression of heat-shock proteins, antioxidant proteins, and the enhanced photosynthetic oxygen release play an important role in salt resistance. This study provides a foundation for further understanding the molecular mechanism of U. prolifera in response to salinity changes.
Author Contributions
L.H. and J.Z. conceived and designed the experiment. J.Z., L.H., H.W., Y.D. and M.S. conducted the experiments and analyzed the data. J.Z., L.H. and G.W. drafted and revised the manuscript. All authors have read and agreed to the published version of the manuscript.
Funding
This research was funded by Jiangsu Marine Science and Technology Innovation Project, grant number JSZRHYKJ202206; China Agriculture Research System of MOF and MARA, grant number CARS-50 and the National Natural Science Foundation of China, grant number 41976097.
Data Availability Statement
No applicable.
Conflicts of Interest
The authors declare no conflict of interest.
References
- Guidone, M.; Thornber, C.S. Examination of Ulva bloom species richness and relative abundance reveals two cryptically co-occurring bloom species in narragansett bay, rhode island. Harmful Algae 2013, 24, 1–9. [Google Scholar] [CrossRef] [Green Version]
- Wang, C.; Yu, R.; Zhou, M. Effects of the decomposing green macroalga Ulva (Enteromorpha) prolifera on the growth of four red-tide species. Harmful Algae 2012, 16, 12–19. [Google Scholar] [CrossRef]
- Zhang, T.; Wang, X. Release and microbial degradation of dissolved organic matter (DOM) from the macroalgae Ulva prolifera. Mar. Pollut. Bull. 2017, 125, 192–198. [Google Scholar] [CrossRef] [PubMed]
- Zhang, Y.; He, P.; Li, H.; Li, G.; Liu, J.; Jiao, F.; Zhang, J.; Huo, Y.; Shi, X.; Su, R.; et al. Ulva prolifera green-tide outbreaks and their environmental impact in the yellow sea, China. Natl. Sci. Rev. 2019, 6, 825–838. [Google Scholar] [CrossRef] [PubMed] [Green Version]
- Chen, J.; Li, H.; Zhang, Z.; He, C.; Shi, Q.; Jiao, N.; Zhang, Y. Doc dynamics and bacterial community succession during long-term degradation of Ulva prolifera and their implications for the legacy effect of green tides on refractory DOC pool in seawater. Water Res. 2020, 185, 116268. [Google Scholar] [CrossRef]
- Liu, D.; Keesing, J.K.; Dong, Z.; Zhen, Y.; Di, B.; Shi, Y.; Fearns, P.; Shi, P. Recurrence of the world’s largest green-tide in 2009 in yellow sea, China: Porphyra yezoensis aquaculture rafts confirmed as nursery for macroalgal blooms. Mar. Pollut. Bull. 2010, 60, 1423–1432. [Google Scholar] [CrossRef]
- Cui, J.; Shi, J.; Zhang, J.; Wang, L.; Fan, S.; Xu, Z.; Huo, Y.; Zhou, Q.; Lu, Y.; He, P. Rapid expansion of Ulva blooms in the yellow sea, China through sexual reproduction and vegetative growth. Mar. Pollut. Bull. 2018, 130, 223–228. [Google Scholar] [CrossRef]
- Lin, A.; Shen, S.; Wang, G.; Yi, Q.; Qiao, H.; Niu, J.; Pan, G. Comparison of chlorophyll and photosynthesis parameters of floating and attached Ulva prolifera. J. Integr. Plant. Biol. 2011, 53, 25–34. [Google Scholar] [CrossRef]
- Choi, T.S.; Kang, E.J.; Kim, K.Y. Effect of salinity on growth and nutrient uptake of Ulva pertusa (Chlorophyta) from an eelgrass bed. Algae 2010, 25, 17–26. [Google Scholar] [CrossRef]
- Huan, L.; Xie, X.; Zheng, Z.; Sun, F.; Wu, S.; Li, M.; Gao, S.; Gu, W.; Wang, G. Positive correlation between PSI response and oxidative pentose phosphate pathway activity during salt stress in an intertidal macroalga. Plant Cell Physiol. 2014, 55, 1395–1403. [Google Scholar] [CrossRef]
- Jimenez, C.; Niell, F.X. Influence of high salinity and nitrogen limitation on package effect and C/N ratio in Dunaliella viridis. Hydrobiologia 2003, 492, 201–206. [Google Scholar] [CrossRef]
- Dan, A.; Hiraoka, M.; Ohno, M.; Critchley, A.T. Observations on the effect of salinity and photon fluence rate on the induction of sporulation and rhizoid formation in the green alga Enteromorpha prolifera (Muller) J. Agardh (Chlorophyta, Ulvales). Fish. Sci. 2002, 68, 1182–1188. [Google Scholar] [CrossRef] [Green Version]
- Wang, Z.; Gerstein, M.; Snyder, M. RNA-seq: A revolutionary tool for transcriptomics. Nat. Rev. Genet. 2009, 10, 57–63. [Google Scholar] [CrossRef] [PubMed]
- Li, L.; Zhang, X.; He, N.; Wang, X.; Zhu, P.; Ji, Z. Transcriptome profiling of the salt-stress response in the halophytic green alga Dunaliella salina. Plant Mol. Biol. Rep. 2019, 37, 421–435. [Google Scholar] [CrossRef]
- Wang, N.; Qian, Z.; Luo, M.; Fan, S.; Zhang, X.; Zhang, L. Identification of salt stress responding genes using transcriptome analysis in green alga Chlamydomonas reinhardtii. Int. J. Mol. Sci. 2018, 19, 3359. [Google Scholar] [CrossRef] [PubMed] [Green Version]
- Xing, Q.; Bi, G.; Cao, M.; Belcour, A.; Aite, M.; Mo, Z.; Mao, Y. Comparative transcriptome analysis provides insights into response of Ulva compressa to fluctuating salinity conditions. J. Phycol. 2021, 57, 1295–1308. [Google Scholar] [CrossRef]
- Grabherr, M.G.; Haas, B.J.; Yassour, M.; Levin, J.Z.; Thompson, D.A.; Amit, I.; Adiconis, X.; Fan, L.; Raychowdhury, R.; Zeng, Q.; et al. Full-length transcriptome assembly from RNA-seq data without a reference genome. Nat. Biotechnol. 2011, 29, 644–652. [Google Scholar] [CrossRef] [PubMed] [Green Version]
- Dillies, M.A.; Rau, A.; Aubert, J.; Hennequet-Antier, C.; Jeanmougin, M.; Servant, N.; Keime, C.; Marot, G.; Castel, D.; Estelle, J.; et al. A comprehensive evaluation of normalization methods for illumina high-throughput RNA sequencing data analysis. Brief. Bioinform. 2013, 14, 671–683. [Google Scholar] [CrossRef] [Green Version]
- Livak, K.J.; Schmittgen, T.D. Analysis of relative gene expression data using real-time quantitative PCR and the 2-ΔΔCT method. Methods 2001, 25, 402–408. [Google Scholar] [CrossRef]
- Genty, B.; Briantais, J.M.; Baker, N.R. The relationship between the quantum yield of photosynthetic electron-transport and quenching of chlorophyll fluorescence. BBA Rev. Cancer 1989, 990, 87–92. [Google Scholar] [CrossRef]
- Deng, Y.; Srivastava, R.; Howell, S.H. Endoplasmic reticulum (ER) stress response and its physiological roles in plants. Int. J. Mol. Sci. 2013, 14, 8188–8212. [Google Scholar] [CrossRef] [PubMed] [Green Version]
- Feng, Y.; Ming, T.; Zhou, J.; Lu, C.; Wang, R.; Su, X. The response and survival mechanisms of Staphylococcus aureus under high salinity stress in salted foods. Foods 2022, 11, 1503. [Google Scholar] [CrossRef] [PubMed]
- Kaur, M.; Saini, K.C.; Ojah, H.; Sahoo, R.; Gupta, K.; Kumar, A.; Bast, F. Abiotic stress in algae: Response, signaling and transgenic approaches. J. Appl. Phycol. 2022, 34, 1843–1869. [Google Scholar] [CrossRef]
- Perrineau, M.-M.; Zelzion, E.; Gross, J.; Price, D.C.; Boyd, J.; Bhattacharya, D. Evolution of salt tolerance in a laboratory reared population of Chlamydomonas reinhardtii. Environ. Microbiol. 2014, 16, 1755–1766. [Google Scholar] [CrossRef]
- Li, K.; Pang, C.H.; Ding, F.; Sui, N.; Feng, Z.T.; Wang, B.S. Overexpression of Suaeda salsa stroma ascorbate peroxidase in Arabidopsis chloroplasts enhances salt tolerance of plants. South Afr. J. Bot. 2012, 78, 235–245. [Google Scholar] [CrossRef] [Green Version]
- Santangeli, M.; Capo, C.; Beninati, S.; Pietrini, F.; Forni, C. Gradual exposure to salinity improves tolerance to salt stress in rapeseed (Brassica napus L.). Water 2019, 11, 1667. [Google Scholar] [CrossRef] [Green Version]
- Ballinger, D.G.; Pardue, M.L. The control of protein-synthesis during heat-shock in Drosophila cells involves altered polypeptide elongation rates. Cell 1983, 33, 103–113. [Google Scholar] [CrossRef]
- Sugino, M.; Hibino, T.; Tanaka, Y.; Nii, N.; Takabe, T.; Takabe, T. Overexpression of Dnak from a halotolerant cyanobacterium Aphanothece halophytica acquires resistance to salt stress in transgenic tobacco plants. Plant Sci. 1999, 146, 81–88. [Google Scholar] [CrossRef]
- Klein, E.M.; Mascheroni, L.; Pompa, A.; Ragni, L.; Weimar, T.; Lilley, K.S.; Dupree, P.; Vitale, A. Plant endoplasmin supports the protein secretory pathway and has a role in proliferating tissues. Plant J. 2006, 48, 657–673. [Google Scholar] [CrossRef]
- Dittami, S.M.; Heesch, S.; Olsen, J.L.; Collen, J. Transitions between marine and freshwater environments provide new clues about the origins of multicellular plants and algae. J. Phycol. 2017, 53, 731–745. [Google Scholar] [CrossRef]
- Plaxton, W.C. The organization and regulation of plant glycolysis. Annu. Rev. Plant Physiol. Plant Mol. Biol. 1996, 47, 185–214. [Google Scholar] [CrossRef] [PubMed] [Green Version]
- Kato, Y.; Ho, S.H.; Vavricka, C.J.; Chang, J.S.; Hasunuma, T.; Kondo, A. Evolutionary engineering of salt-resistant Chlamydomonas sp. Strains reveals salinity stress-activated starch-to-lipid biosynthesis switching. Bioresour. Technol. 2017, 245, 1484–1490. [Google Scholar] [CrossRef] [PubMed]
- Canora, D.D.; Guasch, L.L.; Zuazo, R.S. Species-specific responses of antarctic terrestrial microalgae to salinity stress. Comparative study in klebsormidium sp. and stigeoclonium sp. Czech Polar Rep. 2022, 12, 89–102. [Google Scholar]
- Guo, J.; Li, Y.; Han, G.; Song, J.; Wang, B. Nacl markedly improved the reproductive capacity of the euhalophyte Suaeda salsa. Funct. Plant Biol. 2018, 45, 350–361. [Google Scholar] [CrossRef] [PubMed]
- Chen, H.; Lu, Y.; Jiang, J.G. Comparative analysis on the key enzymes of the glycerol cycle metabolic pathway in Dunaliella salina under osmotic stresses. PLoS ONE 2012, 7, e37578. [Google Scholar]
Figure 1.
Pearson correlation coefficients for comparisons among all samples (A); number of unigenes functional annotation in different databases (B). (C: salinity 30 psu; S5: salinity 50 psu; S9: salinity 90 psu.)
Figure 1.
Pearson correlation coefficients for comparisons among all samples (A); number of unigenes functional annotation in different databases (B). (C: salinity 30 psu; S5: salinity 50 psu; S9: salinity 90 psu.)

Figure 2.
(A) Principal component analysis (PCA) of unigenes expression; (B) numbers of up- and downregulated DEGs in each comparison. (C: salinity 30 psu; S5: salinity 50 psu; S9: salinity 90 psu.)
Figure 2.
(A) Principal component analysis (PCA) of unigenes expression; (B) numbers of up- and downregulated DEGs in each comparison. (C: salinity 30 psu; S5: salinity 50 psu; S9: salinity 90 psu.)

Figure 3.
GO enrichment analysis of DEGs in S5 vs. C (A) and S9 vs. C (B). (C: salinity 30 psu; S5: salinity 50 psu; S9: salinity 90 psu.)
Figure 3.
GO enrichment analysis of DEGs in S5 vs. C (A) and S9 vs. C (B). (C: salinity 30 psu; S5: salinity 50 psu; S9: salinity 90 psu.)

Figure 4.
Top 25 pathways in the KEGG enrichment analysis of DEGs in S5 vs. C (A) and S9 vs. C (B). (C: salinity 30 psu; S5: salinity 50 psu; S9: salinity 90 psu.)
Figure 4.
Top 25 pathways in the KEGG enrichment analysis of DEGs in S5 vs. C (A) and S9 vs. C (B). (C: salinity 30 psu; S5: salinity 50 psu; S9: salinity 90 psu.)

Figure 5.
qRT-PCR results of ten unigenes for validation of RNA-seq data. (C: salinity 30 psu; S5: salinity 50 psu; S9: salinity 90 psu.)
Figure 5.
qRT-PCR results of ten unigenes for validation of RNA-seq data. (C: salinity 30 psu; S5: salinity 50 psu; S9: salinity 90 psu.)

Figure 6.
Heat map of gene expression in photosynthesis. (Filled colors indicate expression levels based on z-score normalization.) (C: salinity 30 psu; S5: salinity 50 psu; S9: salinity 90 psu.) RuBP: Ribulose 1,5biphosphate; PGA: 3Phosphoglycerate; PGAL: Glyceraldehyde 3phosphate.
Figure 6.
Heat map of gene expression in photosynthesis. (Filled colors indicate expression levels based on z-score normalization.) (C: salinity 30 psu; S5: salinity 50 psu; S9: salinity 90 psu.) RuBP: Ribulose 1,5biphosphate; PGA: 3Phosphoglycerate; PGAL: Glyceraldehyde 3phosphate.

Figure 7.
Photosynthetic physiological parameters (A,B) and rates of photosynthetic oxygen release and respiratory oxygen consumption (C) under salt stress. Note(s): In (A) and (C), different superscript letters (a, b, c) within the same physiological parameter show significant difference (p < 0.05). (C: salinity 30 psu; S5: salinity 50 psu; S9: salinity 90 psu.)


Table 1.
Specific primer sequences used to verify transcriptomic sequencing results.
| Gene ID | Forward Primer (5′–3′) | Reverse Primer (5′–3′) |
|---|---|---|
| evm.model.LG03.754 | GCGAAGGACAGAGCACAGTAAGG | CGTTGCCATTCTTGCCGTTGTTG |
| evm.model.LG07.447 | CAGCCGACGCAGGTCTCAAAG | CCTCGTGATGTGCCAGCCAAC |
| evm.model.LG09.372 | CCGCAGACATCATTGACCAGGAG | TAGCAGAACCGCCGCAACATC |
| evm.model.LG03.1407 | CGTGAGGCGTTCCTGGCTTTC | TGGCTGTCTGCTGCTGTCATTG |
| evm.model.LG04.1259 | GACGATCACGACAAGCAGGG | CATCTCATCGGCCTTGTCGG |
| evm.model.LG04.232 | CCTCATCGCCTTCATCGCCTTC | CGGTGGGAGCAACAGTAACGAC |
| evm.model.LG05.509 | GGAGGAGCCAGAGGAGGATGAC | TCCTCACGGGTTGTCTCCACTTC |
| evm.model.LG03.1313 | GCGAGGCGGTACGAAGTCAAAC | CGGTCGGAGGATACAGGGTGAG |
| evm.model.LG01.2097 | ACAGTTATTACGACGCCGATGACC | ACTCATCCGCCTCCTCATCCAC |
| evm.model.LG03.208 | GCAGGAACTCCTTCAGCACGAC | GATGACGGAGGACGAGAAGTTTGAC |
| evm.model.LG05.203 (β-actin) | AGGATGCATACGTTGGTGAA | TTGTGGTGCCAAATCTTCTC |
Table 2.
Summary of Illumina RNA-seq data. (C: salinity 30 psu; S5: salinity 50 psu; S9: salinity 90 psu).
Table 2.
Summary of Illumina RNA-seq data. (C: salinity 30 psu; S5: salinity 50 psu; S9: salinity 90 psu).
| Sample | Total Reads | Total Bases | Clean Reads | Clean Bases | Q20 (%) | Q30 (%) | GC (%) | Uniquely Mapped | Total Mapped |
|---|---|---|---|---|---|---|---|---|---|
| C-1 | 48,022,138 | 7,203,320,700 | 47,717,318 | 7,146,882,951 | 97.63 | 93.51 | 61.23 | 89.07% | 91.64% |
| C-2 | 55,044,484 | 8,256,672,600 | 54,388,580 | 8,139,529,615 | 96.81 | 91.78 | 61.36 | 87.09% | 89.62% |
| C-3 | 59,523,928 | 8,928,589,200 | 58,841,366 | 8,810,555,804 | 96.79 | 91.76 | 61.63 | 87.70% | 90.24% |
| S5-1 | 56,877,658 | 8,531,648,700 | 56,247,326 | 8,421,268,782 | 96.80 | 91.76 | 61.82 | 87.75% | 90.17% |
| S5-2 | 58,866,622 | 8,829,993,300 | 58,041,962 | 8,685,862,641 | 96.25 | 90.60 | 61.55 | 86.98% | 89.41% |
| S5-3 | 53,921,832 | 8,088,274,800 | 53,250,108 | 7,967,943,016 | 94.69 | 86.74 | 61.74 | 86.22% | 88.51% |
| S9-1 | 53,983,414 | 8,097,512,100 | 53,259,220 | 7,973,724,974 | 96.47 | 91.12 | 61.66 | 86.23% | 88.84% |
| S9-2 | 56,064,434 | 8,409,665,100 | 55,380,048 | 8,288,100,283 | 96.68 | 91.55 | 61.41 | 87.27% | 90.04% |
| S9-3 | 61,928,180 | 9,289,227,000 | 61,146,286 | 9,152,944,506 | 96.68 | 91.57 | 61.61 | 83.99% | 86.51% |
Table 3.
Changes in expression of resistance-related genes under salt stress (expressed as ploidy). (C: salinity 30 psu; S5: salinity 50 psu; S9: salinity 90 psu.)
Table 3.
Changes in expression of resistance-related genes under salt stress (expressed as ploidy). (C: salinity 30 psu; S5: salinity 50 psu; S9: salinity 90 psu.)
| Gene ID | KEGG Ortholog | Relative Change Multiple | ||
|---|---|---|---|---|
| C | S5 | S9 | ||
| evm.model.LG04.1209 | K09562 HSPBP1; hsp70-interacting protein | 1.00 | 0.92 | 1.40 |
| evm.model.LG08.120 | K13993 HSP20; hsp20 family protein | 1.00 | 1.53 | 2.60 |
| evm.model.LG02.2352 | K09553 STIP1; stress-induced-phosphoprotein 1 | 1.00 | 1.18 | 1.38 |
| evm.model.LG04.1314 | K09490 HSPA5, BIP; heat shock 70kDa protein 5 | 1.00 | 1.08 | 1.43 |
| evm.model.LG01.496 | K07374 TUBA; tubulin alpha | 1.00 | 0.97 | 1.22 |
| evm.model.LG04.1142 | K14498 SNRK2; serine/threonine-protein kinase | 1.00 | 1.01 | 1.50 |
| evm.model.LG02.1115 | K10588 UBE3B; ubiquitin-protein ligase E3 B | 1.00 | 1.36 | 1.17 |
| evm.model.LG01.457 | K00432 E1.11.1.9; glutathione peroxidase | 1.00 | 1.37 | 1.32 |
| evm.model.LG03.168 | K00026 MDH2; malate dehydrogenase | 1.00 | 1.10 | 1.17 |
| evm.model.LG02.856 | K04564 SOD2; superoxide dismutase, Fe-Mn family | 1.00 | 1.24 | 1.64 |
| evm.model.LG02.1983 | K00383 GSR, gor; glutathione reductase (NADPH) | 1.00 | 1.22 | 1.48 |
| evm.model.LG03.1372 | K01919 gshA; glutamate-cysteine ligase | 1.00 | 1.56 | 3.54 |
| evm.model.LG01.1003 | K05928 E2.1.1.95; tocopherol O-methyltransferase | 1.00 | 0.90 | 1.02 |
| evm.model.LG04.832 | K00434 E1.11.1.11; L-ascorbate peroxidase | 1.00 | 1.37 | 1.80 |
| evm.model.LG01.1168 | K03781 katE, CAT, catB, srpA; catalase | 1.00 | 1.22 | 1.40 |
Disclaimer/Publisher’s Note: The statements, opinions and data contained in all publications are solely those of the individual author(s) and contributor(s) and not of MDPI and/or the editor(s). MDPI and/or the editor(s) disclaim responsibility for any injury to people or property resulting from any ideas, methods, instructions or products referred to in the content. |
© 2022 by the authors. Licensee MDPI, Basel, Switzerland. This article is an open access article distributed under the terms and conditions of the Creative Commons Attribution (CC BY) license (https://creativecommons.org/licenses/by/4.0/).
Share and Cite
MDPI and ACS Style
Zhuo, J.; Wang, H.; Du, Y.; Shi, M.; Huan, L.; Wang, G. Transcriptomic Analysis of Ulva prolifera in Response to Salt Stress. Water 2023, 15, 63. https://doi.org/10.3390/w15010063
AMA Style
Zhuo J, Wang H, Du Y, Shi M, Huan L, Wang G. Transcriptomic Analysis of Ulva prolifera in Response to Salt Stress. Water. 2023; 15(1):63. https://doi.org/10.3390/w15010063
Chicago/Turabian StyleZhuo, Jintao, Hong Wang, Yifei Du, Mengmeng Shi, Li Huan, and Guangce Wang. 2023. "Transcriptomic Analysis of Ulva prolifera in Response to Salt Stress" Water 15, no. 1: 63. https://doi.org/10.3390/w15010063
Note that from the first issue of 2016, this journal uses article numbers instead of page numbers. See further details here.