
A Comparative Approach to Detect Macrobenthic Response to the Conversion of an Inshore Mariculture Plant into an IMTA System in the Mar Grande of Taranto (Mediterranean Sea, Italy)
 ,
,  , ,
, ,
Abstract
:1. Introduction
2. Materials and Methods
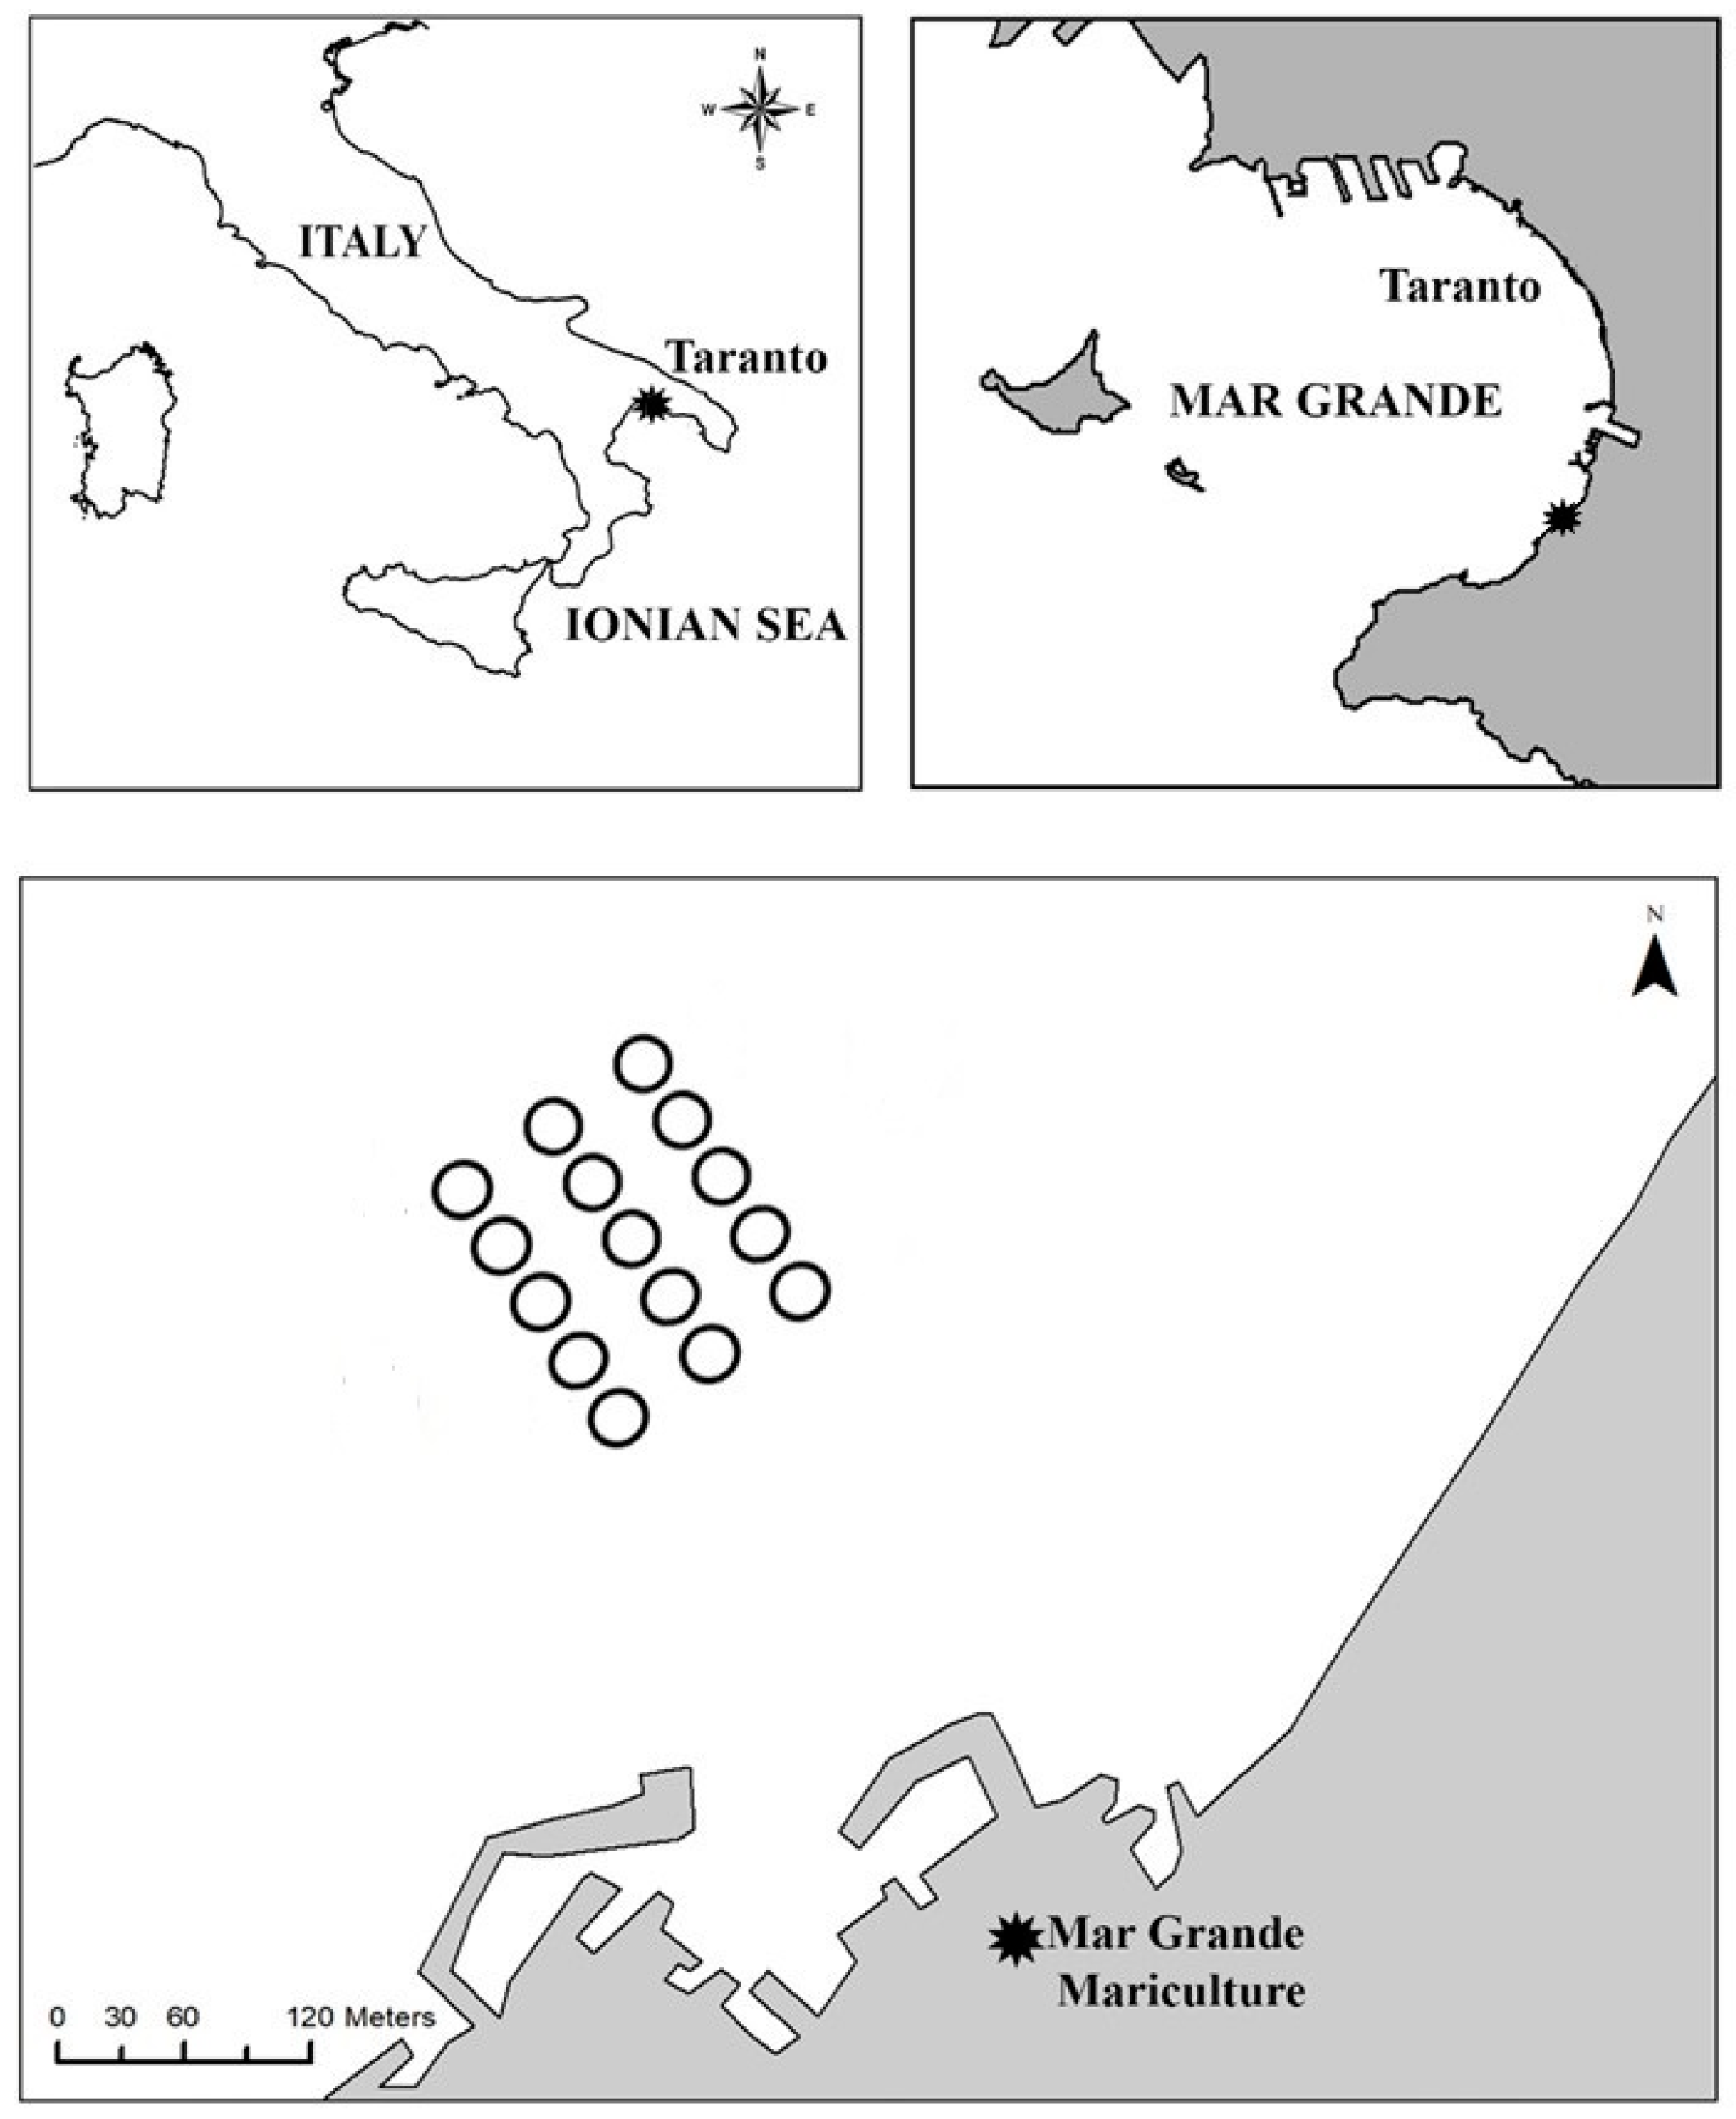
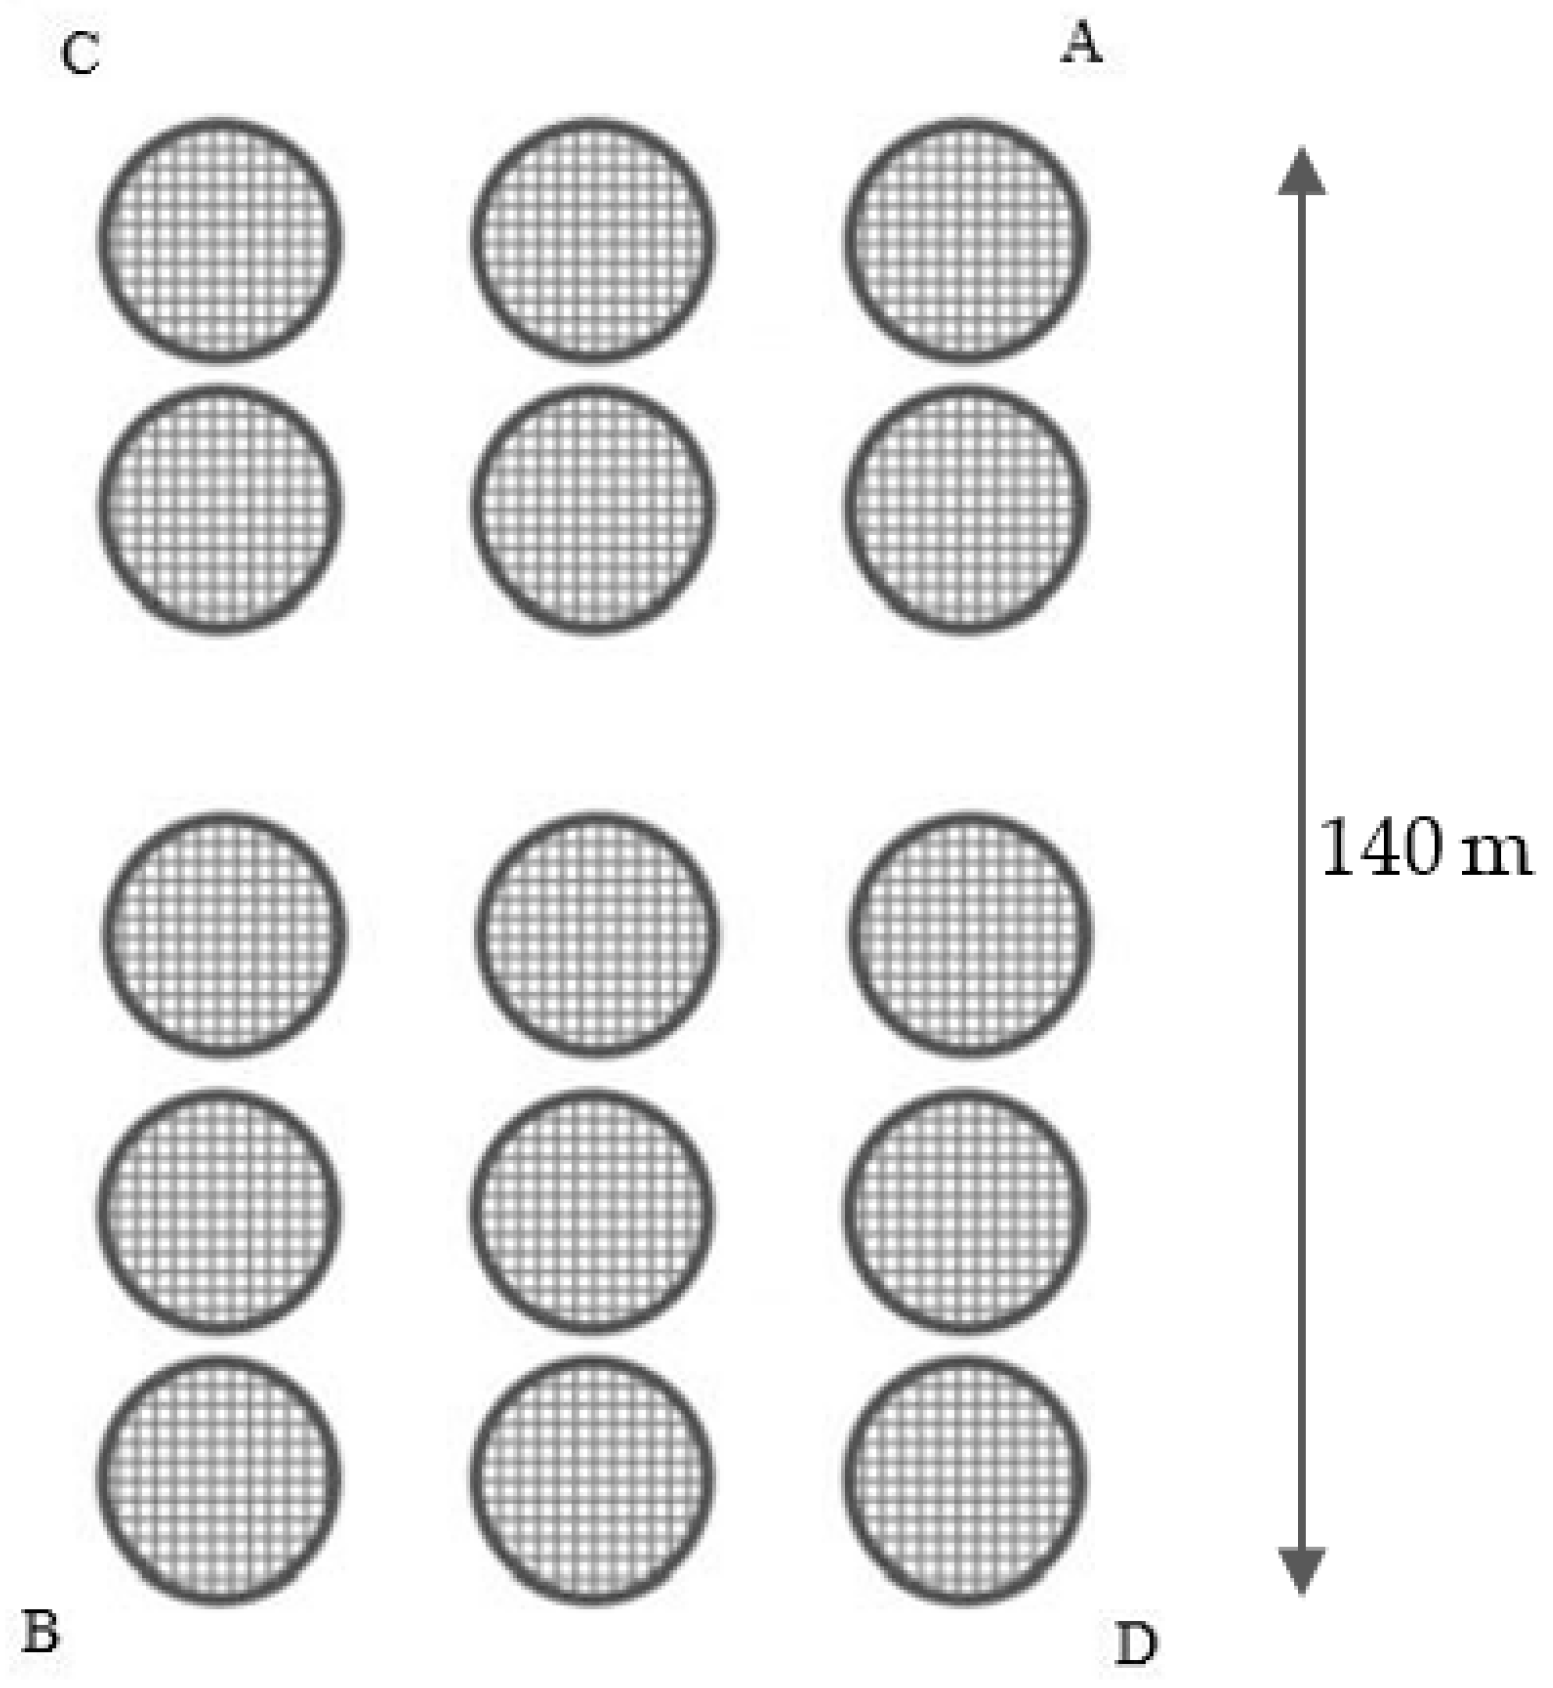
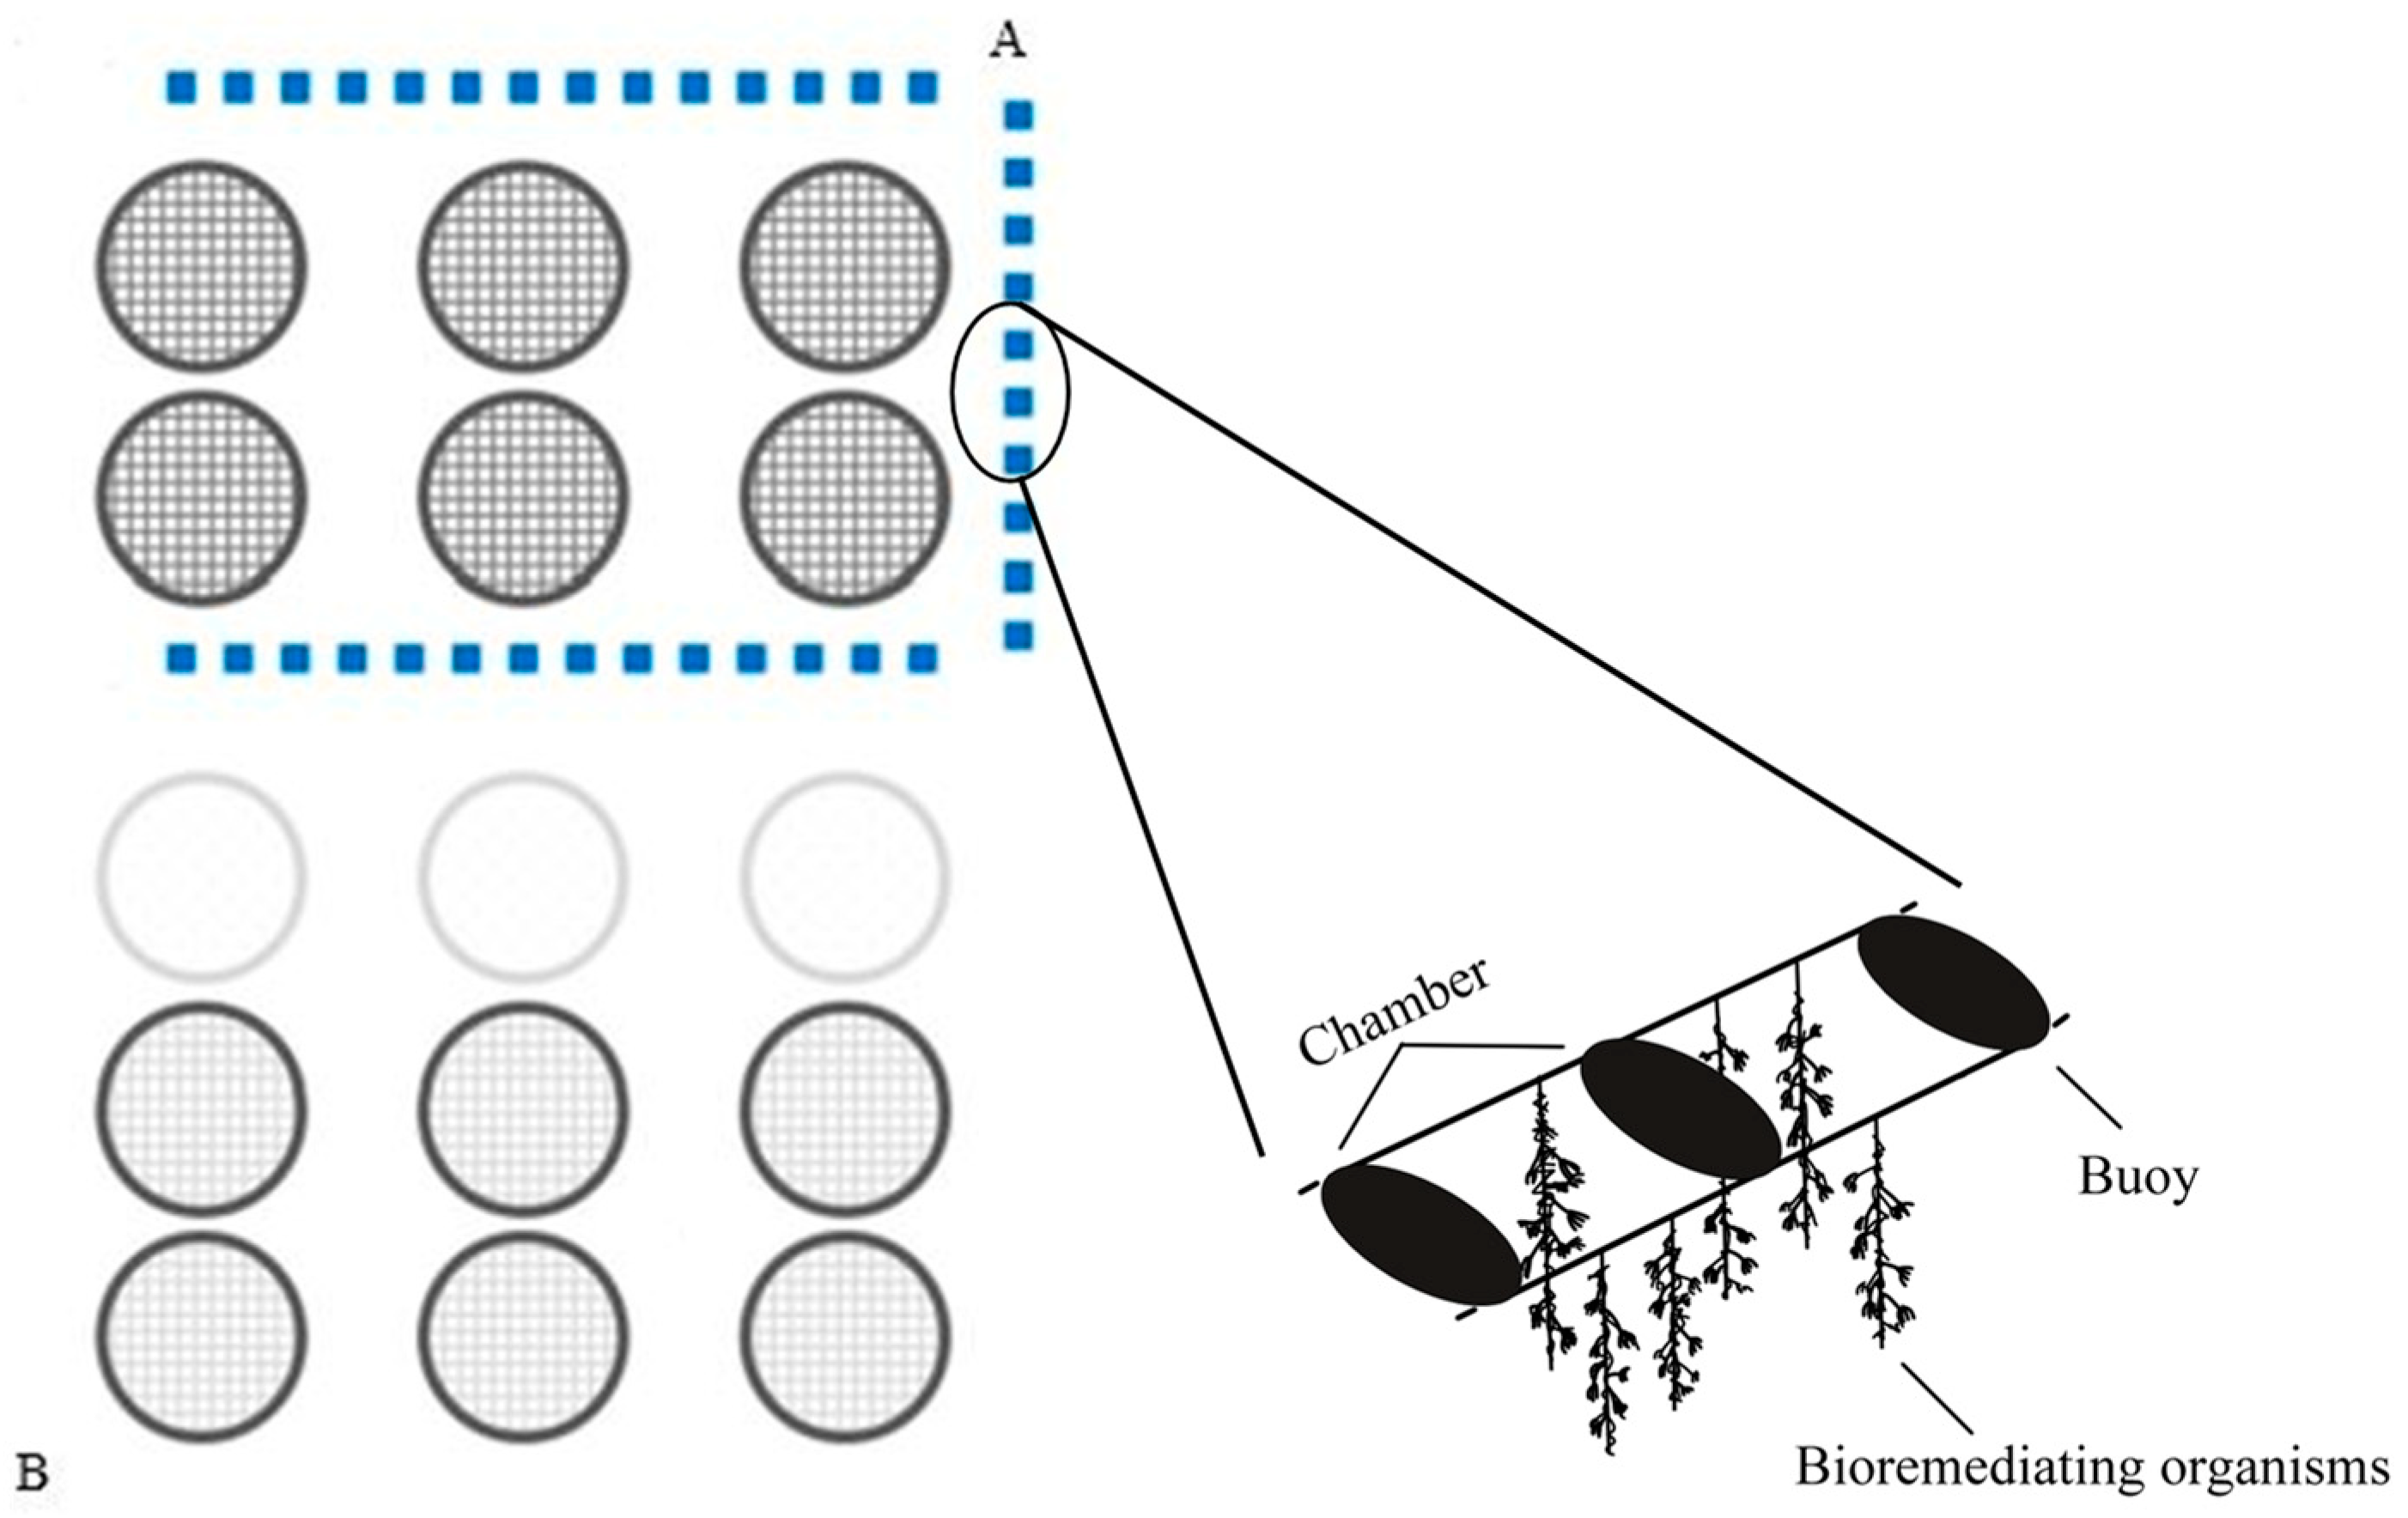
2.1. Study Area
2.2. Ex-Ante Analysis
2.3. Sampling of the Macrozoobenthos
2.4. M-AMBI
2.5. Univariate and Multivariate Analyses
3. Results
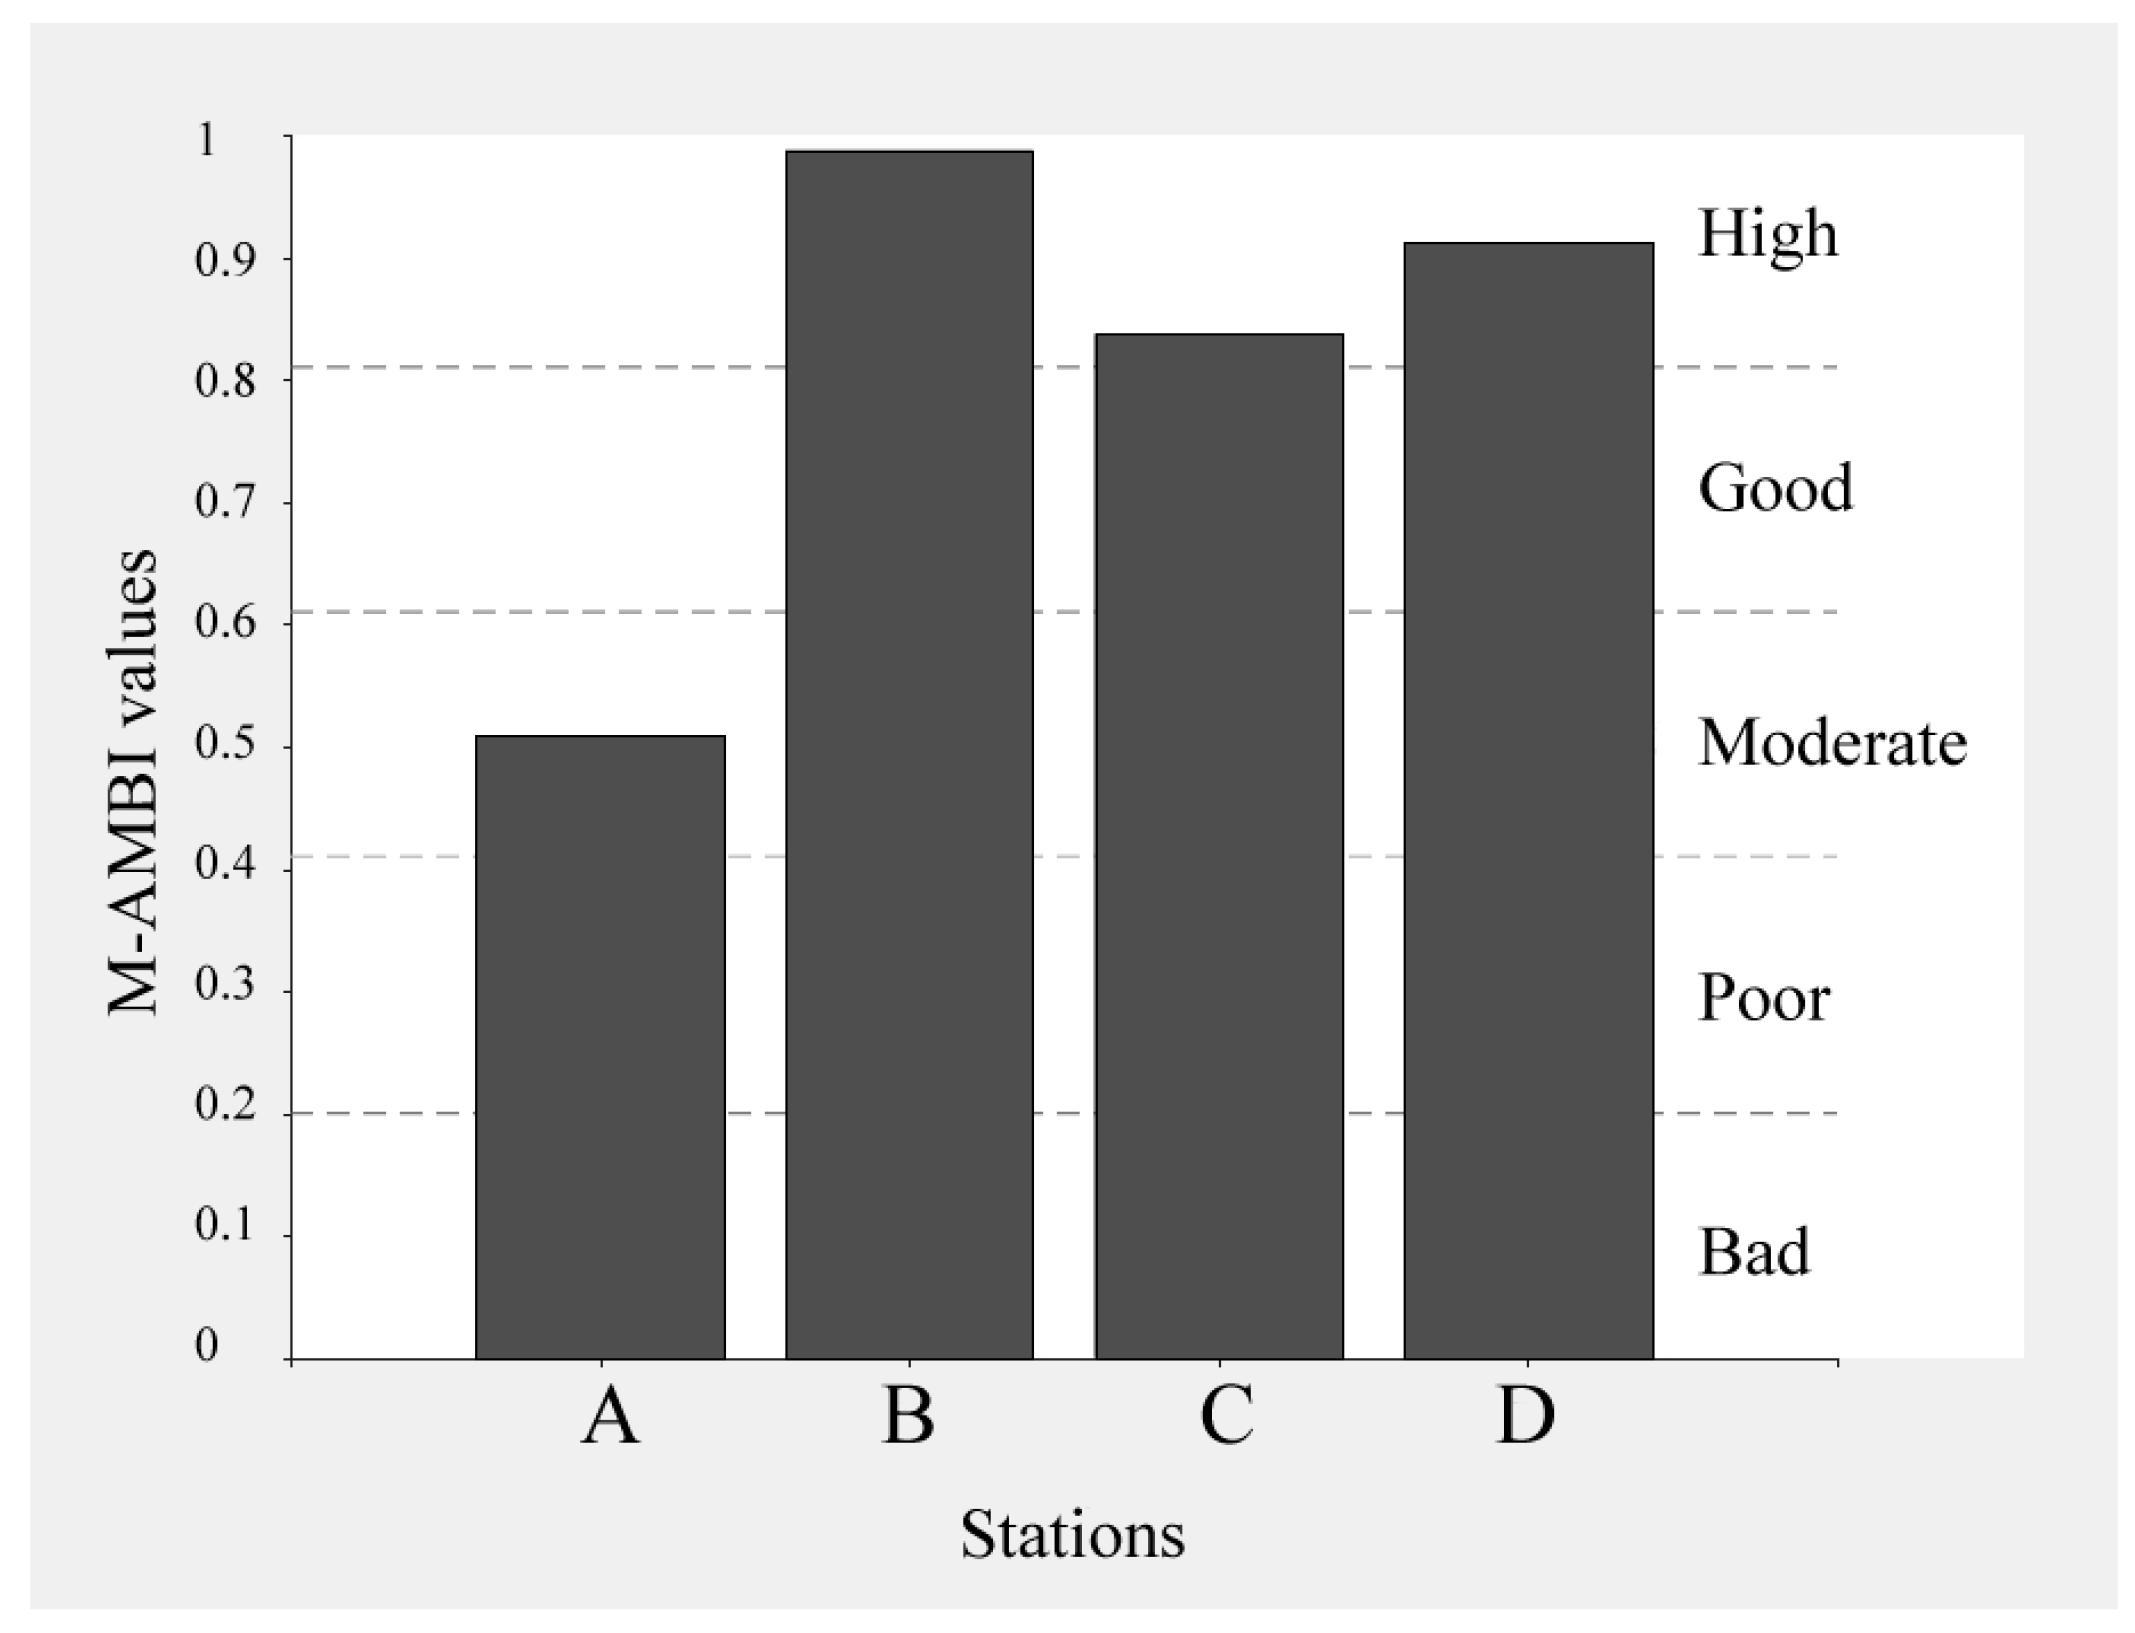
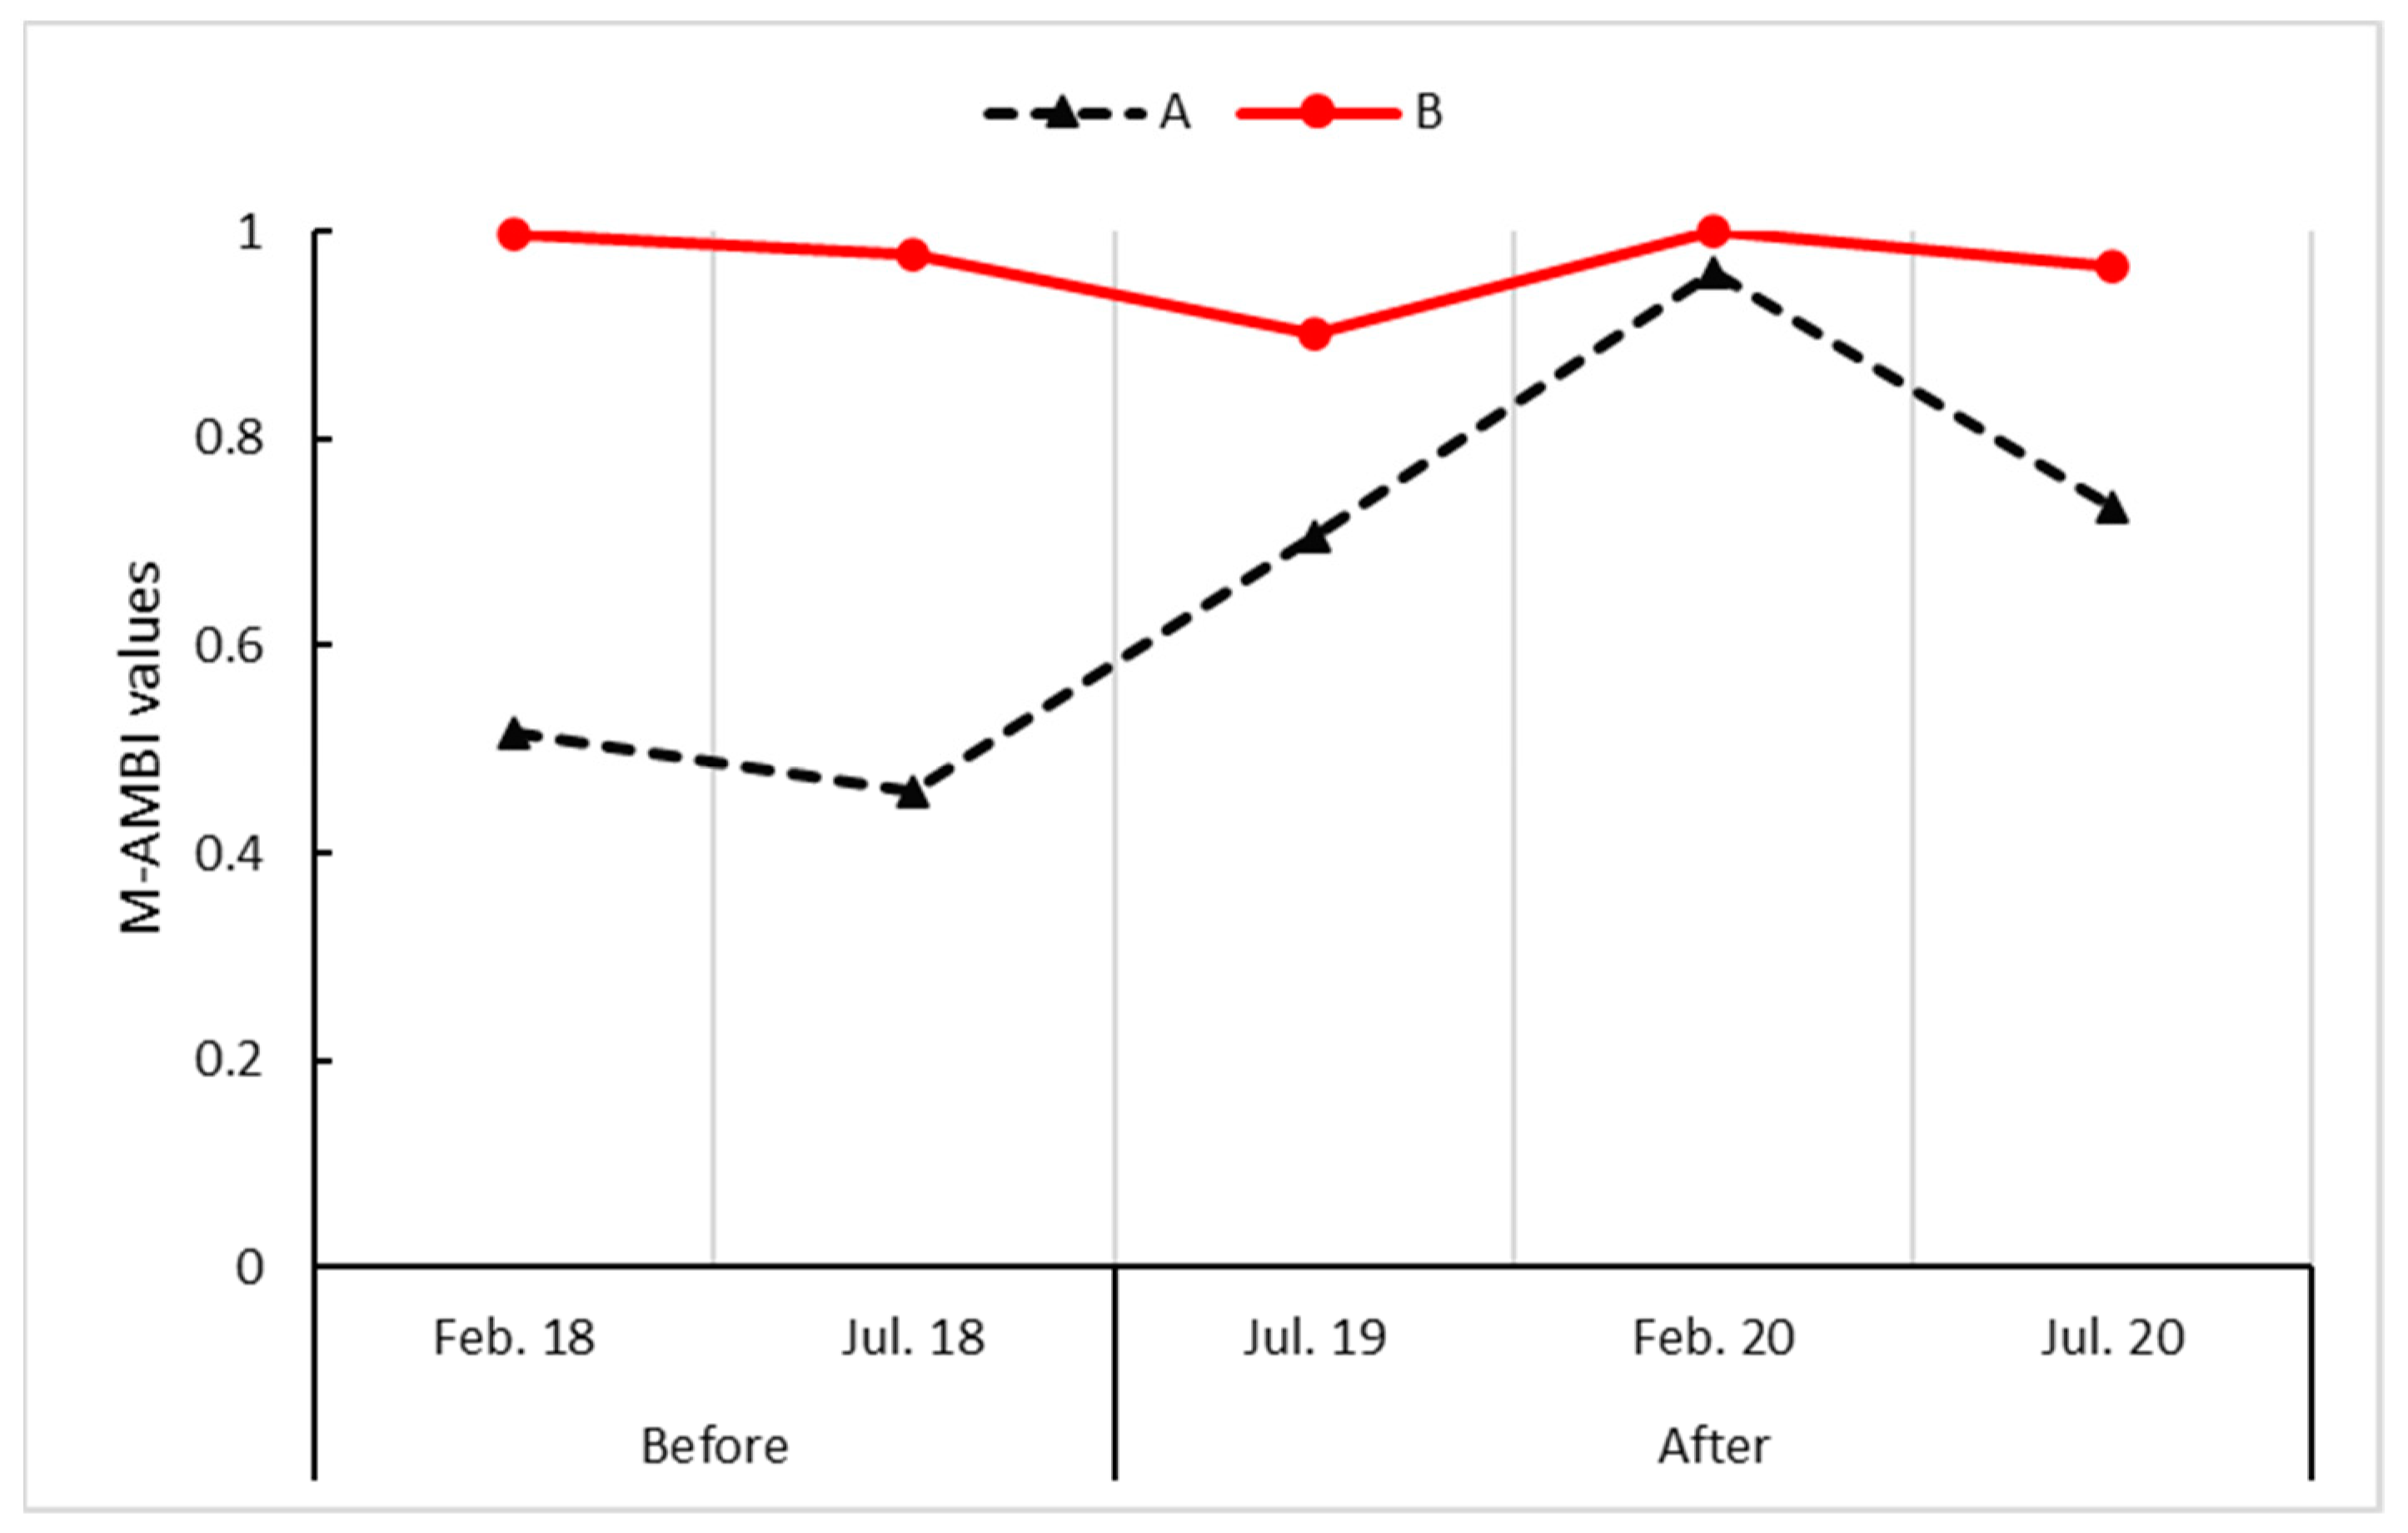
3.1. M-AMBI
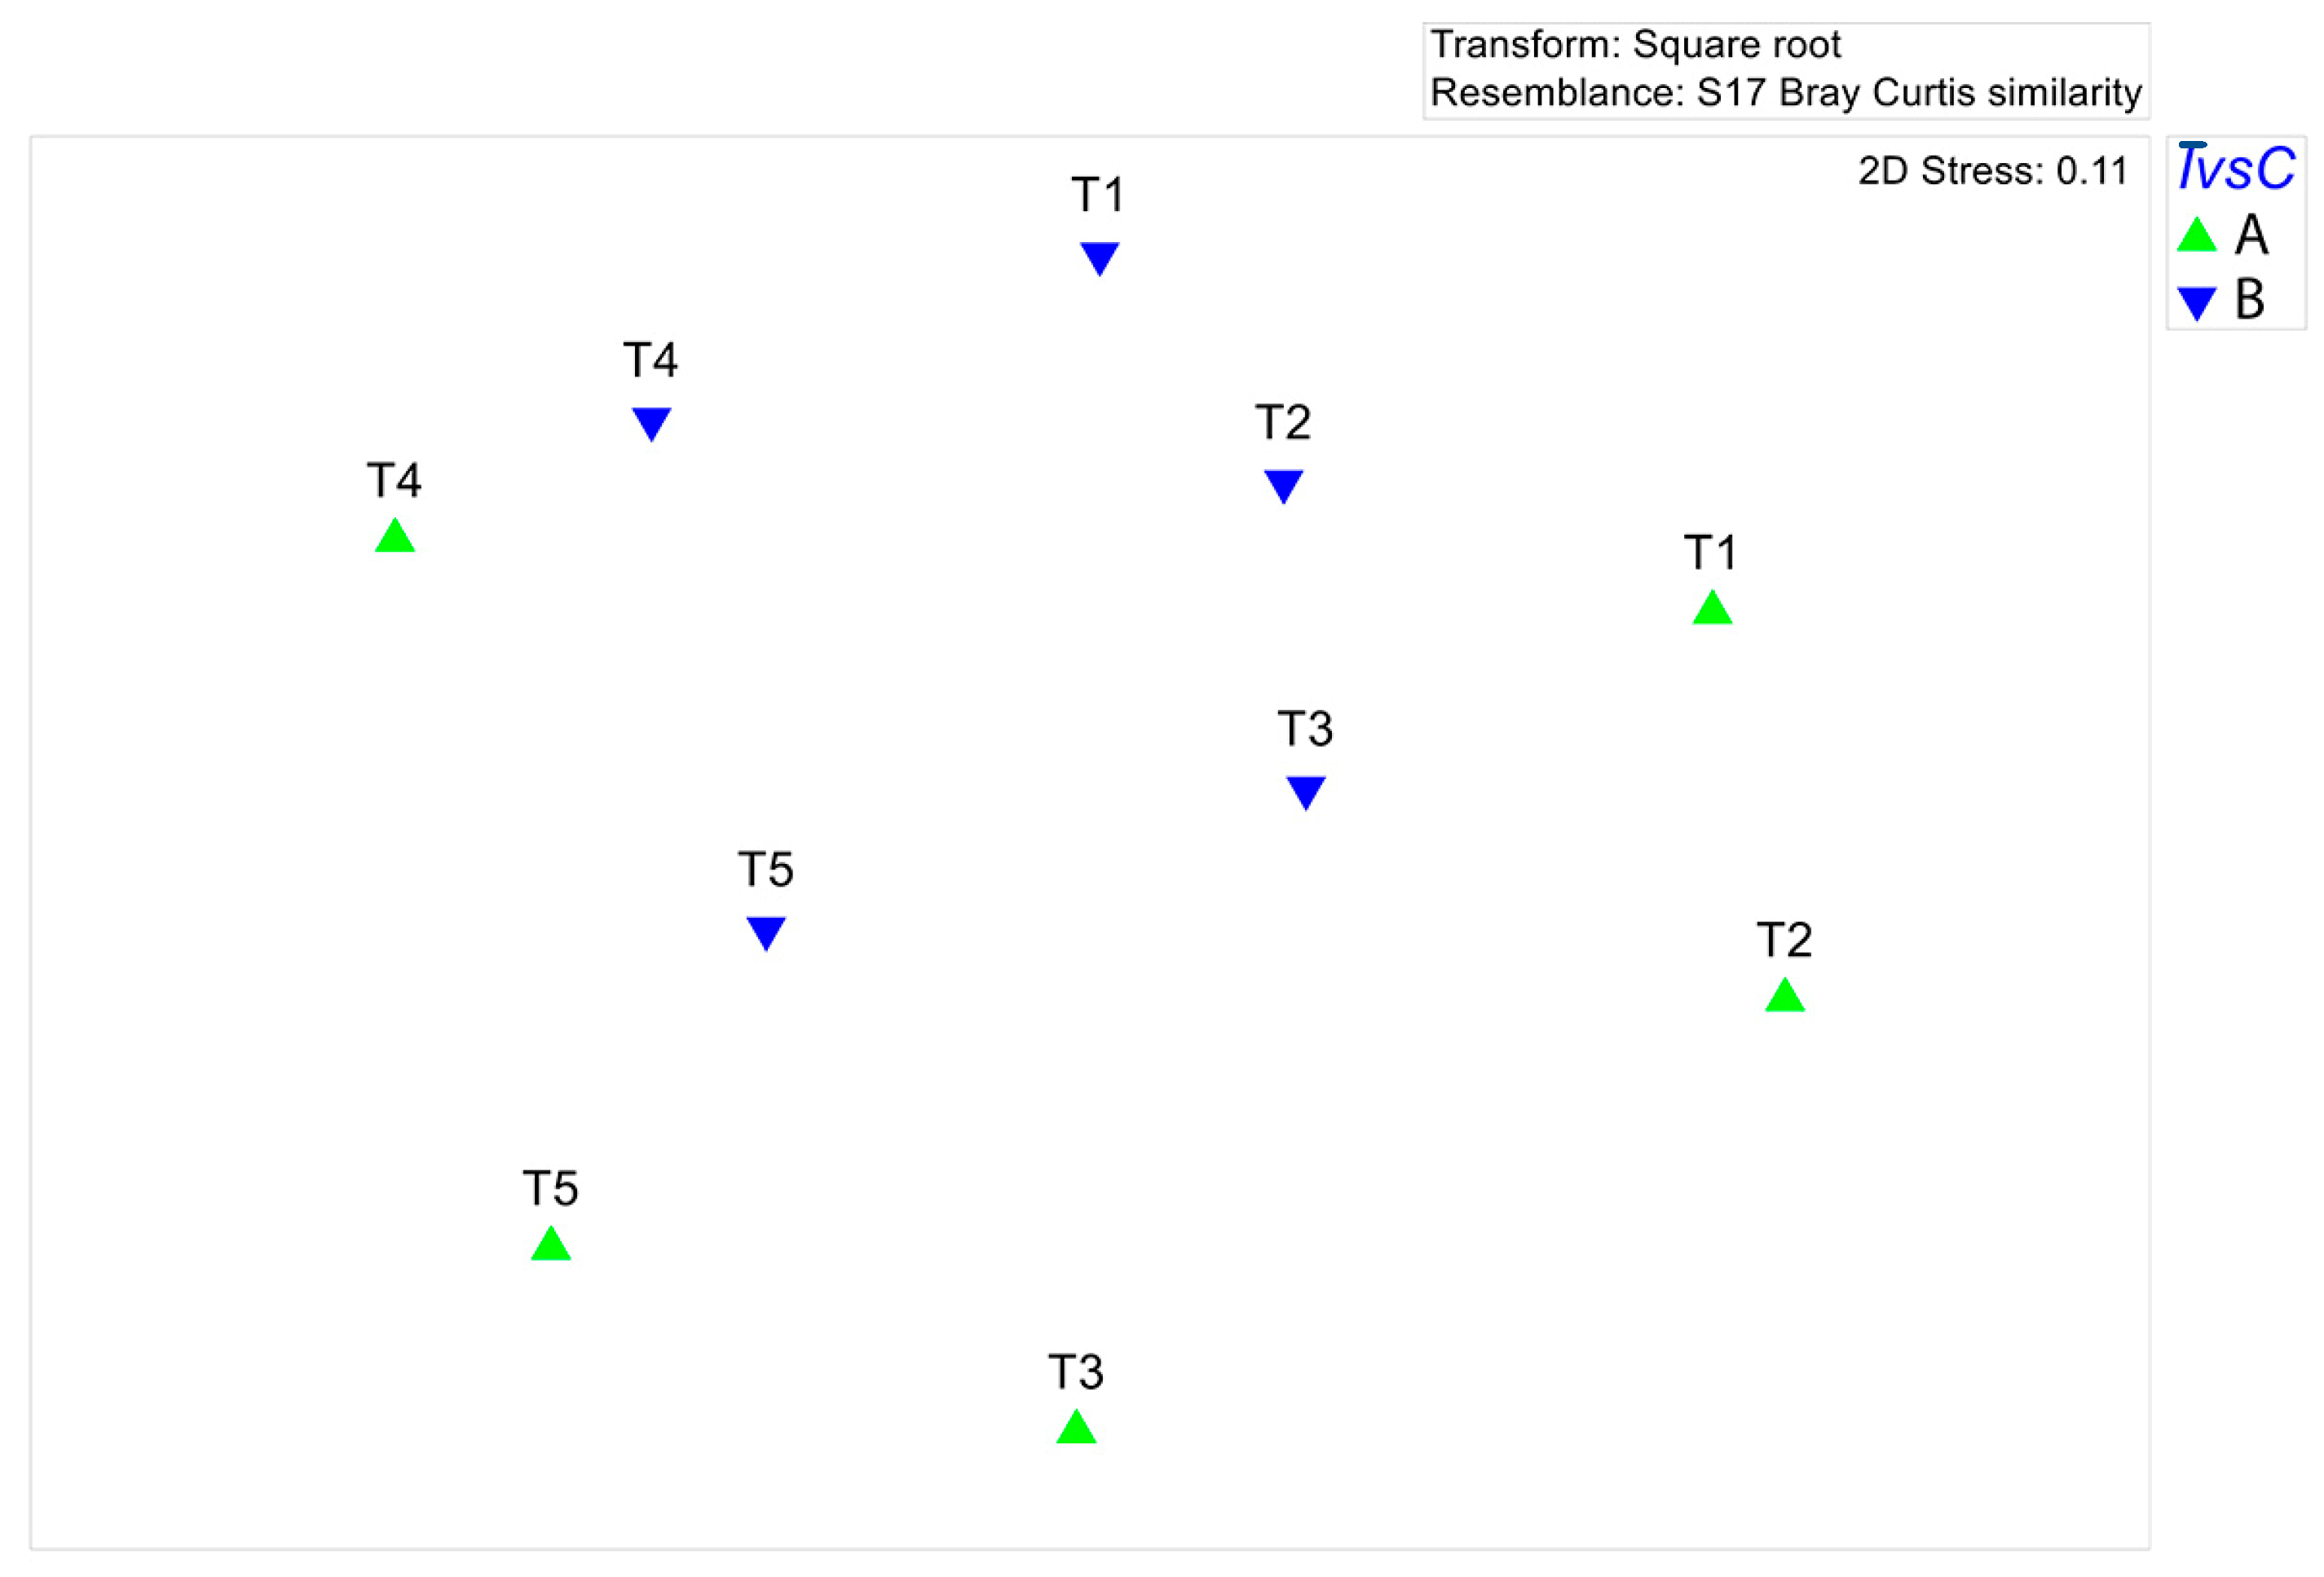
3.2. Univariate and Multivariate Analyses of Variance
4. Discussion
5. Conclusions
Author Contributions
Funding
Data Availability Statement
Acknowledgments
Conflicts of Interest
Appendix A

| A (before) | A (after) | B (before) | B (after) | |
|---|---|---|---|---|
| Abra alba (W. Wood, 1802) | X | X | X | X |
| Achaeus gracilis (O.G. Costa, 1839) | X | |||
| Achelia echinata Hodge, 1864 | X | |||
| Aclis sp. Lovén, 1846 | X | |||
| Alpheus sp. Fabricius, 1798 | X | |||
| Ampelisca sp. Krøyer, 1842 | X | |||
| Ampelisca diadema (Costa, 1853) | X | X | ||
| Ampelisca pseudosarsi Bellan-Santini & Kaim-Malka, 1977 | X | X | ||
| Ampelisca tenuicornis Liljeborg, 1856 | X | |||
| Ampelisca typica (Spence Bate, 1856) | X | X | ||
| Amphipholis squamata (Delle Chiaje, 1828) | X | X | X | X |
| Amphitrite rubra (Risso, 1826) | X | |||
| Amphitritides gracilis (Grube, 1860) | X | |||
| Amphiura chiajei Forbes, 1843 | X | X | X | X |
| Anapagurus chiroacanthus (Liljeborg, 1856) | X | |||
| Anapagurus laevis (Bell, 1845) | X | |||
| Antalis inaequicostata (Dautzenberg, 1891) | X | |||
| Aonides oxycephala (Sars, 1862) | X | X | X | X |
| Aora gracilis (Spence Bate, 1857) | X | |||
| Aphelochaeta filiformis (Keferstein, 1862) | X | |||
| Aphelochaeta marioni (Saint-Joseph, 1894) | X | X | ||
| Apseudopsis sp. Norman, 1899 | X | |||
| Apseudopsis acutifrons (Sars, 1882) | X | X | ||
| Apseudopsis latreillii (Milne Edwards, 1828) | X | |||
| Apseudopsis minimus (Gutu, 2002) | X | |||
| Arcuatula senhousia (Benson, 1842) | X | |||
| Aricidea sp. Webster, 1879 | X | |||
| Aricidea (Acmira) assimilis Tebble, 1959 | X | X | ||
| Aricidea (Acmira) catherinae Laubier, 1967 | X | X | X | |
| Aricidea (Aricidea) fragilis Webster, 1879 | X | X | ||
| Armandia cirrhosa Filippi, 1861 | X | X | X | |
| Athanas nitescens (Leach, 1814) | X | X | X | |
| Atherospio guillei (Laubier & Ramos, 1974) | X | |||
| Bittium reticulatum (da Costa, 1778) | X | |||
| Capitella capitata (Fabricius, 1780) | X | X | X | X |
| Capitella minima Langerhans, 1880 | X | X | X | |
| Caprella sp. Lamarck, 1801 | X | X | ||
| Caprella andreae Mayer, 1890 | X | |||
| Caprella scaura Templeton, 1836 | X | X | ||
| Caulleriella sp. Chamberlin, 1919 | X | X | X | |
| Caulleriella alata (Southern, 1914) | X | X | ||
| Caulleriella bioculata (Keferstein, 1862) | X | |||
| Caulleriella cabbsi Pocklington & Coates, 2010 | X | |||
| Caulleriella mediterranea Lezzi, 2017 | X | X | ||
| Caulleriella viridis (Langerhans, 1880) | X | X | X | |
| Composetia costae (Grube, 1840) | X | X | ||
| Chaetozone caputesocis (Saint-Joseph, 1894) | X | X | X | X |
| Chaetozone carpenteri McIntosh, 1911 | X | X | ||
| Chaetozone corona Berkeley & Berkeley, 1941 | X | X | ||
| Chaetozone gibber Woodham & Chambers, 1994 | X | |||
| Chaetozone setosa Malmgren, 1867 | X | X | ||
| Chondrochelia savignyi (Kroyer, 1842) | X | X | ||
| Cirriformia tentaculata (Montagu, 1808) | X | X | X | |
| Cirrophorus nikebianchii Langeneck, Barbieri, Maltagliati & Castelli, 2017 | X | X | X | X |
| Cossura pygodactylata Jones, 1956 | X | |||
| Cossura soyeri Laubier, 1964 | X | |||
| Cyathura carinata (Krøyer, 1847) | X | |||
| Cymodoce truncata Leach, 1814 | X | |||
| Dialychone dunerificta (Tovar-Hernández, Licciano, Giangrande, 2007) | X | |||
| Dipolydora flava (Claparède, 1870) | X | |||
| Elasmopus sp. Costa, 1853 | X | |||
| Elasmopus pectenicrus (Spence Bate, 1862) | X | |||
| Ericthonius punctatus (Spence Bate, 1857) | X | X | ||
| Ethusa mascarone sp. (Herbst, 1758) | X | X | ||
| Euclymene oerstedii (Claparède, 1863) | X | |||
| Eumida parva (Saint-Joseph, 1888) | X | |||
| Eulima glabra (da Costa, 1778) | X | |||
| Eunice vittata (Delle Chiaje, 1828) | X | X | X | |
| Eupolymnia nebulosa (Montagu, 1819) | X | X | ||
| Euthria cornea (Linnaeus, 1758) | X | |||
| Exogone dispar (Webster, 1879) | X | |||
| Exogone naidina Örsted, 1845 | X | X | X | |
| Fimbriosthenelais minor (Pruvot & Racovitza, 1895) | X | |||
| Fissurella nubecula (Linnaeus, 1758) | X | |||
| Gallardoneris nonatoi (Ramos, 1976) | X | X | X | X |
| Gammarus sp. Fabricius, 1775 | X | |||
| Gibbula philberti (Récluz, 1843) | X | |||
| Glycera alba (O.F. Müller, 1776) | X | X | X | X |
| Glycera celtica O’Connor, 1987 | X | X | ||
| Gouldia minima (Montagu, 1803) | X | |||
| Gyptis sp. Marion, 1874 | X | X | ||
| Harmothoe antilopes McIntosh, 1876 | X | |||
| Harmothoe gilchristi Day, 1960 | X | X | ||
| Harmothoe spinifera (Ehlers, 1864) | X | X | ||
| Hesione splendida Lamarck, 1818 | X | |||
| Heteromastus filiformis (Claparède, 1864) | X | X | X | X |
| Hexaplex trunculus (Linnaeus, 1758) | X | |||
| Hiatella arctica (Linnaeus, 1767) | X | |||
| Hilbigneris gracilis (Ehlers, 1868) | X | X | X | |
| Hypereteone foliosa (Quatrefages, 1865) | X | X | ||
| Iphinoe elisae Băcescu, 1950 | X | X | ||
| Iphinoe serrata Norman, 1867 | X | X | ||
| Iphinoe tenella Sars, 1878 | X | X | X | |
| Iphinoe trispinosa (Goodsir, 1843) | X | X | ||
| Ischnochiton rissoi (Payraudeau, 1826) | X | |||
| Janira maculosa Leach, 1814 | X | |||
| Jassa marmorata Holmes, 1905 | X | X | ||
| Kirkegaardia dorsobranchialis (Kirkegaard, 1959) | X | X | X | X |
| Kirkegaardia setosa (Dean & Blake, 2009) | X | X | ||
| Lagis koreni Malmgren, 1866 | X | X | ||
| Laonice sp. Malmgren, 1867 | X | |||
| Leiochone leiopygos (Grube, 1860) | X | X | X | |
| Leonnates sp. Kinberg, 1865 | X | |||
| Leucothoe richiardii Lessona, 1865 | X | |||
| Levinsenia demiri Çinar, Dagli & Acik, 2011 | X | |||
| Limaria hians (Gmelin, 1791) | X | |||
| Limaria tuberculata (Olivi, 1792) | X | |||
| Liocarcinus maculatus (Risso, 1827) | X | |||
| Liropus elongatus Mayer, 1890 | X | |||
| Liropus minimus Mayer, 1890 | X | |||
| Loripes orbiculatus Poli, 1795 | X | X | X | |
| Loripinus fragilis (Philippi, 1836) | X | X | X | X |
| Lucinella divaricata (Linnaeus, 1758) | X | X | ||
| Lucinoma borealis (Linnaeus, 1767) | X | |||
| Lumbrineris sp. Blainville, 1828 | X | |||
| Lumbrineris latreilli Audouin & Milne Edwards, 1833 | X | X | X | |
| Lumbrineris luciliae Martins, Carrera-Parra, Quintino & Rodrigues, 2012 | X | |||
| Lumbrineris pinaster Martins, Carrera-Parra, Quintino & Rodrigues, 2012 | X | X | ||
| Lysidice collaris Grube, 1870 | X | |||
| Lysidice unicornis (Grube, 1840) | X | X | ||
| Lysilla loveni Malmgren, 1866 | X | |||
| Macropodia linaresi Forest & Zariquiey Álvarez, 1964 | X | X | ||
| Mactra stultorum (Linnaeus, 1758) | X | |||
| Maera sp. Leach, 1814 | X | |||
| Maera grossimana (Montagu, 1808) | X | X | ||
| Magelona rosea Moore, 1907 | X | X | X | |
| Malacoceros fuliginosus (Claparède, 1868) | X | |||
| Maldanidae Malmgren, 1867 | X | |||
| Mangelia attenuata (Montagu, 1803) | X | |||
| Mediomastus capensis Day, 1961 | X | |||
| Melinna palmata Grube, 1870 | X | X | ||
| Microdeutopus sp. Costa, 1853 | X | |||
| Micronephthys longicornis (Perejaslavtseva, 1891) | X | X | X | |
| Mimachlamys varia (Linnaeus, 1758) | X | |||
| Modiolus barbatus (Linnaeus, 1758) | X | X | ||
| Moerella distorta (Poli, 1791) | X | X | ||
| Moerella pulchella (Lamarck, 1818) | X | X | ||
| Musculus costulatus (Risso, 1826) | X | X | ||
| Musculus discors (Linnaeus, 1767) | X | |||
| Musculus subpictus (Cantraine, 1835) | X | |||
| Mysia undata (Pennant, 1777) | X | |||
| Mysta picta (Quatrefages, 1866) | X | |||
| Mytilaster marioni (Locard, 1889) | X | |||
| Naineris laevigata (Grube, 1855) | X | X | ||
| Naineris setosa (Verrill, 1900) | X | X | X | |
| Neanthes acuminata (Ehlers, 1868) | X | X | X | X |
| Nephtys incisa Malmgren, 1865 | X | X | ||
| Nereimyra punctata (Müller, 1788) | X | |||
| Nereiphylla rubiginosa (de Saint-Joseph, 1888) | X | X | ||
| Notomastus aberans Day, 1957 | X | |||
| Notomastus latericeus Sars, 1851 | X | |||
| Notomastus mossambicus (Thomassin, 1970) | X | |||
| Nototropis swammerdamei (H. Milne Edwards, 1830) | X | |||
| Nucula sulcata Bronn, 1831 | X | X | X | |
| Ophiactis virens (M. Sars, 1859) | X | |||
| Ophiothrix fragilis (Abildgaard in O.F. Müller, 1789) | X | X | X | X |
| Ophiura albida Forbes, 1839 | X | |||
| Ophiura grubei Heller, 1863 | X | |||
| Oxydromus flexuosus (Delle Chiaje, 1827) | X | X | X | |
| Pagurus anachoretus Risso, 1827 | X | |||
| Papillicardium papillosum (Poli, 1791) | X | |||
| Paracerceis sculpta (Holmes, 1904) | X | |||
| Paradoneis armata Glémarec, 1966 | X | X | ||
| Paradoneis ilvana Castelli, 1985 | X | |||
| Paradoneis lyra (Southern, 1914) | X | X | ||
| Pseudakanthophoreus nanopsenos (Bamber & Bird, 2009) | X | |||
| Paranthura japonica Richardson, 1909 | X | |||
| Parvicardium exiguum (Gmelin, 1791) | X | X | ||
| Parvicardium pinnulatum (Conrad, 1831) | X | X | ||
| Paucibranchia bellii (Audouin & Milne Edwards, 1833) | X | X | ||
| Percnon sp. Gistel, 1848 | X | |||
| Perioculodes aequimanus (Kossman, 1880) | X | X | ||
| Perioculodes longimanus (Spence Bate & Westwood, 1868) | X | |||
| Perkinsyllis anophthalma (Capaccioni & San Martín, 1990) | X | |||
| Pettiboneia urciensis Campoy & San Martín, 1980 | X | |||
| Philocheras monacanthus (Holthuis, 1961) | X | |||
| Phtisica marina Slabber, 1769 | X | |||
| Phylo foetida (Claparède, 1868) | X | X | ||
| Pilumnus villosissimus (Rafinesque, 1814) | X | |||
| Pinctada imbricata Röding, 1798 | X | X | ||
| Pisidia bluteli (Risso, 1816) | X | X | ||
| Pista cristata (Müller, 1776) | X | |||
| Pista lornensis (Pearson, 1969) | X | |||
| Pitar rudis (Poli, 1795) | X | X | ||
| Polyophthalmus pictus (Dujardin, 1839) | X | X | X | |
| Prionospio sp. Malmgren, 1867 | X | X | ||
| Prionospio cirrifera Wirén, 1883 | X | X | X | |
| Prionospio depauperata Imajima, 1990 | X | X | ||
| Prionospio ergeni Dagli & Çinar, 2009 | X | |||
| Prionospio maciolekae Dagli & Çinar, 2011 | X | X | X | X |
| Prionospio multibranchiata Berkeley, 1927 | X | |||
| Prionospio pulchra Imajima, 1990 | X | X | X | X |
| Procampylaspis armata Bonnier, 1896 | X | |||
| Prosphaerosyllis sp. San Martín, 1984 | X | |||
| Prosphaerosyllis campoyi (San Martín, Acero, Contonente & Gómez, 1982) | X | |||
| Prosphaerosyllis tetralix (Eliason, 1920) | X | |||
| Prosphaerosyllis xarifae (Hartmann-Schröder, 1960) | X | |||
| Protocirrineris chrysoderma (Claparède, 1868) | X | |||
| Protodorvillea kefersteini (McIntosh, 1869) | X | X | ||
| Psammechinus microtuberculatus (Blainville, 1825) | X | X | ||
| Pseudoleiocapitella fauveli Harmelin, 1964 | X | X | ||
| Pseudoleptochelia anomala (Sars, 1882) | X | X | ||
| Pseudolirius kroyeri (Haller, 1879) | X | X | X | |
| Pseudopolydora antennata (Claparède, 1869) | X | |||
| Pterocirrus limbatus (Claparède, 1868) | X | |||
| Salvatoria euritmica (Sardá, 1984) | X | X | ||
| Schistomeringos rudolphi (Delle Chiaje, 1828) | X | X | X | X |
| Scoloplos armiger (Müller, 1776) | X | X | ||
| Sigambra sp. Müller, 1858 | X | X | ||
| Sigambra parva (Day, 1963) | X | X | ||
| Sphaerosyllis sp. Claparède, 1863 | X | |||
| Sphaerosyllis glandulata Perkins, 1981 | X | X | ||
| Sphaerosyllis hystrix Claparède, 1863 | X | X | ||
| Sphaerosyllis parabulbosa San Martín & López, 2002 | X | |||
| Spio sp. Fabricius, 1785 | X | |||
| Spio decorata Bobretzky, 1870 | X | X | ||
| Spio filicornis (Müller, 1776) | X | X | ||
| Spio martinensis Mesnil, 1896 | X | X | ||
| Spiochaetopterus costarum (Claparède, 1869) | X | X | X | |
| Stenothoe sp. Dana, 1852 | X | |||
| Streblosoma pseudocomatus Lezzi & Giangrande, 2019 | X | |||
| Stylarioides grubei Salazar-Vallejo, 2011 | X | |||
| Syllides fulvus (Marion & Bobretzky, 1875) | X | X | ||
| Syllidia armata Quatrefages, 1866 | X | |||
| Syllis gerlachi (Hartmann-Schröder, 1960) | X | X | X | |
| Synalpheus gambarelloides (Nardo, 1847) | X | |||
| Thelepus setosus (Quatrefages, 1866) | X | |||
| Timarete sp. Kinberg, 1866 | X | |||
| Tritia varicosa (W. Turton, 1825) | X | X | ||
| Varicorbula gibba (Olivi, 1792) | X | X | X | X |
| Venerupis corrugata (Gmelin, 1791) | X | |||
| Venus casina Linnaeus, 1758 | X | |||
| Westwoodilla rectirostris (Della Valle, 1893) | X | |||
| Xantho pilipes A. Milne-Edwards, 1867 | X | |||
| Zeuxo sp. Templeton, 1840 | X | X |
References
- FAO. The State of World Fisheries and Aquaculture 2020. In Sustainability in Action; FAO: Rome, Italy, 2020; Volume 32, p. 244. [Google Scholar] [CrossRef]
- Halwart, M.; Soto, D.; Arthur, J.R. Cage Aquaculture. Regional Reviews and Global Overview; FAO Fisheries Technical Paper. No. 498; FAO: Rome, Italy, 2007; p. 241. [Google Scholar]
- Karakassis, I.; Tsapakis, M.; Hatziyanni, E.; Papadopoulou, K.N.; Plaiti, W. Impact of cage farming of fish on the seabed in three Mediterranean coastal areas. ICES J. Mar. Sci. 2000, 57, 1462–1471. [Google Scholar] [CrossRef] [Green Version]
- Mazzola, A.; Sarà, G. The effect of fish farming organic waste on food availability for bivalve molluscs (Gaeta Gulf, Central Tyrrhenian, MED): Stable carbon isotopic analysis. Aquaculture 2001, 192, 361–379. [Google Scholar] [CrossRef]
- Bergqvist, J.; Gunnarsson, S. Finfish Aquaculture: Animal Welfare, the Environment, and Ethical Implications. J. Agric. Environ. Ethics 2013, 26, 75–99. [Google Scholar] [CrossRef]
- Cabello, F.C. Heavy use of prophylactic antibiotics in aquaculture: A growing problem for human and animal health and for the environment. Environ. Microbiol. 2006, 8, 1137–1144. [Google Scholar] [CrossRef]
- Naylor, R.L.; Goldburg, R.J.; Primavera, J.H.; Kautsky, N.; Beveridge, M.C.M.; Clay, J.; Folke, C.; Lubchenco, J.; Mooney, H.; Troell, M. Effect of aquaculture on world fish supplies. Nature 2000, 405, 1017–1024. [Google Scholar] [CrossRef] [Green Version]
- Naylor, R.; Hindar, K.; Fleming, I.A.; Goldburg, R.; Williams, S.; Volpe, J.; Whoriskey, F.; Eagle, J.; Kelso, D.; Mangel, M. Fugitive Salmon: Assessing the risk of Escaped Fish from Net-Pen Aquaculture. BioScience 2005, 55, 427–437. [Google Scholar] [CrossRef]
- Tsukamoto, K.; Kawamura, T.; Takeuchi, T.; Beard, T.D.; Kaiser, M.J. Fisheries for Global Welfare and Enviroment. In Memorial Book Of The 5th World Fisheries Congress 2008; Terrapub: Tokyo, Japan, 2008; pp. 335–349. [Google Scholar]
- Wang, X.; Olsen, L.; Reitan, K.; Olsen, Y. Discharge of nutrient wastes from salmon farms: Environmental effects, and potential for integrated multi-trophic aquaculture. Aquac. Environ. Interact. 2012, 2, 267–283. [Google Scholar] [CrossRef] [Green Version]
- Wang, X.; Cuthbertson, A.; Gualtieri, C.; Shao, D. A review on mariculture effluent: Characterization and management tools. Water 2020, 12, 2991. [Google Scholar] [CrossRef]
- Katranidis, S.; Nitsi, E.; Vakrou, A. Social Acceptability of Aquaculture Development in Coastal Areas: The Case of Two Greek Islands. Coast. Manag. 2003, 31, 37–53. [Google Scholar] [CrossRef]
- Giles, H. Using Bayesian networks to examine consistent trends in fish farm benthic impact studies. Aquaculture 2008, 274, 181–195. [Google Scholar] [CrossRef]
- Hargrave, B. Empirical relationships describing benthic impacts of salmon aquaculture. Aquac. Environ. Interact. 2010, 1, 33–46. [Google Scholar] [CrossRef] [Green Version]
- Olsen, M.L.; Holmer, M.; Olsen, Y. Perspectives of Nutrient Emission from Fish Aquaculture in Coastal Waters; The Fishery and Aquaculture Industry Research Fund: Oslo, Norway, 2008. [Google Scholar]
- Kerrigan, D.; Suckling, C.C. A meta-analysis of integrated multitrophic aquaculture: Extractive species growth is most successful within close proximity to open-water fish farms. Rev. Aquac. 2018, 10, 560–572. [Google Scholar] [CrossRef]
- Chopin, T.; Buschmann, A.H.; Halling, C.; Troell, M.; Kautsky, N.; Neori, A.; Kraemer, G.P.; Zertuche-González, J.A.; Yarish, C.; Neefus, C. Minireview integrating seaweeds into marine aquaculture systems: A key toward sustainability. J. Phycol. 2001, 37, 975–986. [Google Scholar] [CrossRef]
- Giangrande, A.; Pierri, C.; Arduini, D.; Borghese, J.; Licciano, M.; Trani, R.; Corriero, G.; Basile, G.; Cecere, E.; Petrocelli, A.; et al. An innovative IMTA system: Polychaetes, sponges and macroalgae co-cultured in a Southern Italian in-shore mariculture plant (Ionian Sea). J. Mar. Sci. Eng. 2020, 8, 733. [Google Scholar] [CrossRef]
- Neori, A.; Chopin, T.; Troell, M.; Buschmann, A.H.; Kraemer, G.P.; Halling, C.; Shpigel, M.; Yarish, C. Integrated aquaculture: Rationale, evolution and state of the art emphasizing seaweed biofiltration in modern mariculture. Aquaculture 2004, 231, 361–391. [Google Scholar] [CrossRef]
- Troell, M.; Joyce, A.; Chopin, T.; Neori, A.; Buschmann, A.H.; Fang, J.G. Ecological engineering in aquaculture—Potential for integrated multi-trophic aquaculture (IMTA) in marine offshore systems. Aquaculture 2009, 297, 1–9. [Google Scholar] [CrossRef]
- Barrington, K.; Chopin, T.; Robinson, S. Integrated Multi-Trophic Aquaculture (IMTA) in Marine Temperate Waters; FAO Fisheries and Aquaculture Technical Paper. No. 529; FAO: Rome, Italy, 2009; pp. 7–46. [Google Scholar]
- Chopin, T. Seaweed aquaculture provides diversified products, key ecosystem functions. Part I. Lesser-known species group tops mariculture output. In Global Aquaculture Advocate; Global Aquaculture Alliance: St. Louis, MO, USA, 2012; Volume 15, pp. 42–43. [Google Scholar]
- Chopin, T. Integrated multi-trophic aquaculture–ancient, adaptable concept focuses on ecological integration. In Global Aquaculture Advocate; Global Aquaculture Alliance: St. Louis, MO, USA, 2013; Volume 16, pp. 16–19. [Google Scholar]
- Fang, J.; Zhang, J.; Xiao, T.; Huang, D.; Liu, S. Integrated Multi-Trophic Aquaculture (IMTA) in Sanggou Bay, China. Aquac. Environ. Interact. 2016, 8, 201–205. [Google Scholar] [CrossRef] [Green Version]
- Granada, L.; Sousa, N.; Lopes, S.; Lemos, M.F.L. Is integrated multitrophic aquaculture the solution to the sectors’ major challenges?—A review. Rev. Aquac. 2016, 8, 283–300. [Google Scholar] [CrossRef]
- Ridler, N.; Wowchuk, M.; Robinson, B.; Barrington, K.; Chopin, T.; Robinson, S.; Page, F.; Reid, G.; Szemerda, M.; Sewuster, J.; et al. Integrated multi-trophic aquaculture (IMTA): A potential strategic choice for farmers. Aquac. Econ. Manag. 2007, 11, 99–110. [Google Scholar] [CrossRef]
- Bevilacqua, S.; Katsanevakis, S.; Micheli, F.; Sala, E.; Rilov, G.; Sarà, G.; Malak, D.A.; Abdulla, A.; Gerovasileiou, V.; Gissi, E.; et al. The status of coastal benthic ecosystems in the Mediterranean Sea: Evidence from ecological indicators. Front. Mar. Sci. 2020, 7, 475. [Google Scholar] [CrossRef]
- Dauvin, J.C.; Fersi, A.; Pezy, J.P.; Bakalem, A.; Neifar, L. Macrobenthic communities in the tidal channels around the Gulf of Gabès, Tunisia. Mar. Pollut. Bull. 2021, 162, 111846. [Google Scholar] [CrossRef] [PubMed]
- Giangrande, A.; Licciano, M.; Musco, L. Polychaetes as environmental indicators revisited. Mar. Pollut. Bull. 2005, 50, 1153–1162. [Google Scholar] [CrossRef] [PubMed]
- Buschmann, A.H.; Riquelme, V.A.; Hernández-González, M.C.; Varela, D.; Jiménez, J.E.; Henríquez, L.A.; Vergara, P.A.; Guíñez, R.; Filún, L. A review of the impacts of salmonid farming on marine coastal ecosystems in the southeast Pacific. ICES J. Mar. Sci. 2006, 63, 1338–1345. [Google Scholar] [CrossRef]
- Forchino, A.; Borja, A.; Brambilla, F.; Rodríguez, J.G.; Muxika, I.; Terova, G.; Saroglia, M. Evaluating the influence of off-shore cage aquaculture on the benthic ecosystem in Alghero Bay (Sardinia, Italy) using AMBI and M-AMBI. Ecol. Indic. 2011, 11, 1112–1122. [Google Scholar] [CrossRef]
- Kalantzi, I.; Karakassis, I. Benthic impacts of fish farming: Meta-analysis of community and geochemical data. Mar. Pollut. Bull. 2006, 52, 484–493. [Google Scholar] [CrossRef]
- Moraitis, M.; Papageorgiou, N.; Dimitriou, P.D.; Petrou, A.; Karakassis, I. Effects of offshore tuna farming on benthic assemblages in the Eastern Mediterranean. Aquac. Environ. Interact. 2013, 4, 41–51. [Google Scholar] [CrossRef] [Green Version]
- Tanner, J.E.; Williams, K. The influence of finfish aquaculture on benthic fish and crustacean assemblages in Fitzgerald Bay, South Australia. PeerJ 2015, 3, e1238. [Google Scholar] [CrossRef] [Green Version]
- Karakassis, I.; Hatziyanni, E.; Tsapakis, M.; Plaiti, W. Benthic recovery following cessation of fish farming: A series of successes and catastrophes. Mar. Ecol. Prog. Ser. 1999, 184, 205–218. [Google Scholar] [CrossRef] [Green Version]
- Mahmood, T.; Fang, J.; Jiang, Z.; Zhang, J. Carbon and nitrogen flow, and trophic relationships, among the cultured species in an integrated multi-trophic aquaculture (IMTA) bay. Aquac. Environ. Interact. 2016, 8, 207–219. [Google Scholar] [CrossRef]
- Ning, Z.; Liu, S.; Zhang, G.; Ning, X.; Li, R.; Jiang, Z.; Fang, J.; Zhang, J. Impacts of an integrated multi-trophic aquaculture system on benthic nutrient fluxes: A case study in Sanggou Bay, China. Aquac. Environ. Interact. 2016, 8, 221–232. [Google Scholar] [CrossRef] [Green Version]
- Arduini, D.; Borghese, J.; Gravina, M.F.; Trani, R.; Longo, C.; Pierri, C.; Giangrande, A. Biofouling Role in Mariculture Environment Restoration: An Example in the Mar Grande of Taranto (Mediterranean Sea). Front. Mar. Sci. 2022, 9, 842616. [Google Scholar] [CrossRef]
- Giangrande, A.; Arduini, D.; Borghese, J.; Pasqua, M.; del Lezzi, M.; Petrocelli, A.; Cecere, E.; Longo, C.; Pierri, C. Macrobenthic success of non-indigenous species related to substrate features in the mar grande of taranto, Italy (Mediterranean Sea). BioInvasions Rec. 2021, 10, 238–256. [Google Scholar] [CrossRef]
- Giangrande, A.; Gravina, M.F.; Rossi, S.; Longo, C.; Pierri, C. Aquaculture and restoration: Perspectives from mediterranean sea experiences. Water 2021, 13, 991. [Google Scholar] [CrossRef]
- Giangrande, A.; Licciano, M.; Arduini, D.; Borghese, J.; Pierri, C.; Trani, R.; Longo, C.; Petrocelli, A.; Ricci, P.; Alabiso, G.; et al. An Integrated Monitoring Approach to the Evaluation of the Environmental Impact of an Inshore Mariculture Plant (Mar Grande of Taranto, Ionian Sea). Biology 2022, 11, 617. [Google Scholar] [CrossRef]
- Clarke, L.J.; Esteves, L.S.; Stillman, R.A.; Herbert, R.J.H.; Kenchington, E. Impacts of a novel shellfishing gear on macrobenthos in a marine protected area: Pump-scoop dredging in Poole Harbour, UK. Aquat. Living Resour. 2018, 31, 5. [Google Scholar] [CrossRef] [Green Version]
- Keeley, N.B.; Macleod, C.K.; Hopkins, G.A.; Forrest, B.M. Spatial and temporal dynamics in macrobenthos during recovery from salmon farm induced organic enrichment: When is recovery complete? Mar. Pollut. Bull. 2014, 80, 250–262. [Google Scholar] [CrossRef]
- Underwood, A.J. Beyond BACI: Experimental Designs for Detecting Human Environmental Impacts on Temporal Variations in Natural Populations. Mar. Freshw. Res. 1991, 42, 569–587. [Google Scholar] [CrossRef]
- Verdonschot, R.C.M.; van Oosten-Siedlecka, A.M.; ter Braak, C.J.F.; Verdonschot, P.F.M. Macroinvertebrate survival during cessation of flow and streambed drying in a lowland stream. Freshw. Biol. 2015, 60, 282–296. [Google Scholar] [CrossRef]
- Underwood, A.J. Beyond BACI: The detection of environmental impacts on populations in the real, but variable, world. J. Exp. Mar. Biol. Ecol. 1992, 161, 145–178. [Google Scholar] [CrossRef]
- Anderson, M.J. A new method for non-parametric multivariate analysis of variance. Aust. Ecol. 2001, 26, 32–46. [Google Scholar]
- Borja, A.; Franco, J.; Pérez, V. A Marine Biotic Index to Establish the Ecological Quality of Soft-Bottom Benthos within European Estuarine and Coastal Environments. Mar. Pollut. Bull. 2000, 40, 1100–1114. [Google Scholar] [CrossRef]
- Borja, A.; Franco, J.; Valencia, V.; Bald, J.; Muxika, I.; Jesús Belzunce, M.; Solaun, O. Implementation of the European water framework directive from the Basque country (northern Spain): A methodological approach. Mar. Pollut. Bull. 2004, 48, 209–218. [Google Scholar] [CrossRef] [PubMed]
- D’Alessandro, M.; Esposito, V.; Giacobbe, S.; Renzi, M.; Mangano, M.C.; Vivona, P.; Consoli, P.; Scotti, G.; Andaloro, F.; Romeo, T. Ecological assessment of a heavily human-stressed area in the Gulf of Milazzo, Central Mediterranean Sea: An integrated study of biological, physical and chemical indicators. Mar. Pollut. Bull. 2016, 106, 260–273. [Google Scholar] [CrossRef] [PubMed]
- Li, B.; Wang, Q.; Li, B. Assessing the benthic ecological status in the stressed coastal waters of Yantai, Yellow Sea, using AMBI and M-AMBI. Mar. Pollut. Bull. 2013, 75, 53–61. [Google Scholar] [CrossRef] [PubMed] [Green Version]
- Muxika, I.; Borja, Á.; Bald, J. Using historical data, expert judgement and multivariate analysis in assessing reference conditions and benthic ecological status, according to the European Water Framework Directive. Mar. Pollut. Bull. 2007, 55, 16–29. [Google Scholar] [CrossRef] [PubMed]
- Simonini, R.; Grandi, V.; Massamba-N’Siala, G.; Iotti, M.; Montanari, G.; Prevedelli, D. Assessing the ecological status of the North-western Adriatic Sea within the European Water Framework Directive: A comparison of Bentix, AMBI and M-AMBI methods. Mar. Ecol. 2009, 30, 241–254. [Google Scholar] [CrossRef]
- Umehara, A.; Borja, A.; Ishida, A.; Nakai, S.; Nishijima, W. Responses of the benthic environment to reduction in anthropogenic nutrient loading in the Seto Inland Sea (Japan), based on M-AMBI assessment. Mar. Environ. Res. 2022, 173, 105509. [Google Scholar] [CrossRef]
- Borja, A.; Miles, A.; Occhipinti-Ambrogi, A.; Berg, T. Current status of macroinvertebrate methods used for assessing the quality of European marine waters: Implementing the Water Framework Directive. Hydrobiologia 2009, 633, 181–196. [Google Scholar] [CrossRef]
- Neofitou, N.; Syvri, R.; Tziantziou, L.; Mente, E.; Vafidis, D. The benthic environmental footprint of aquaculture in the Eastern Mediterranean: Organic vs conventional fish farming. Aquac. Res. 2020, 51, 2698–2710. [Google Scholar] [CrossRef]
- Tomassetti, P.; Persia, E.; Mercatali, I.; Vani, D.; Marussso, V.; Porrello, S. Effects of mariculture on macrobenthic assemblages in a western mediterranean site. Mar. Pollut. Bull. 2009, 58, 533–541. [Google Scholar] [CrossRef]
- Wang, L.; Fan, Y.; Yan, C.; Gao, C.; Xu, Z.; Liu, X. Assessing benthic ecological impacts of bottom aquaculture using macrofaunal assemblages. Mar. Pollut. Bull. 2017, 114, 258–268. [Google Scholar] [CrossRef] [PubMed]
- ARPA (Regional Agency for Environmental Prevention and Protection). Monitoraggio Qualitativo dei Corpi Idrici Superficiali per il Triennio 2016–2018. Available online: www.arpa.puglia.it›document_library›get_file (accessed on 20 September 2022).
- Underwood, A.J. On Beyond BACI: Sampling Designs that Might Reliably Detect Environmental Disturbances. Ecol. Appl. 1994, 4, 3–15. [Google Scholar] [CrossRef]
- Bray, J.R.; Curtis, J.T. An Ordination of the Upland Forest Communities of Southern Wisconsin. Ecol. Monogr. 1957, 27, 326–349. [Google Scholar] [CrossRef]
- Anderson, M.J.; Robinson, J. Generalized discriminant analysis based on distances. Aust. N. Z. J. Stat. 2003, 45, 301–318. [Google Scholar] [CrossRef]
- Anderson, M.J. Distance-based tests for homogeneity of multivariate dispersions. Biometrics 2006, 62, 245–253. [Google Scholar] [CrossRef] [PubMed]
- Underwood, A.J. Experiments in Ecology: Their Logical Design and Interpretation Using Analysis of Variance; Cambridge University Press: Cambridge, UK, 1997. [Google Scholar]
- Clarke, K.R. Non-parametric multivariate analyses of changes in community structure. Aust. J. Ecol. 1993, 18, 117–143. [Google Scholar] [CrossRef]
- Clarke, K.R.; Gorley, R.N. Getting Started with PRIMER v7; PRIMER-E: Devon, UK, 2015; p. 20. [Google Scholar]
- Anderson, M.J.; Gorley, R.N.; Clarke, R.K. Permanova+ for Primer: Guide to Software and Statistical Methods; Primer-E Ltd.: Auckland, New Zealand, 2008. [Google Scholar]
- Grabowski, J.H.; Peterson, C.H.; Bishop, M.J.; Conrad, R. The bioeconomic feasibility of culturing triploid Crassostrea ariakensis in North Carolina. J. Shellfish Res. 2007, 26, 529–542. [Google Scholar] [CrossRef]
- Theuerkauf, S.J.; Morris, J.A.; Waters, T.J.; Wickliffe, L.C.; Alleway, H.K.; Jones, R.C. A global spatial analysis reveals where marine aquaculture can benefit nature and people. PLoS ONE 2019, 14, e0222282. [Google Scholar] [CrossRef]
- Stabili, L.; Giangrande, A.; Arduini, D.; Borghese, J.; Petrocelli, A.; Ricci, P.; Cavallo, R.A.; Acquaviva, M.I.; Narracci, M.; Pierri, C.; et al. Environmental quality improvement after the conversion of a mariculture plant into an IMTA system. 2022; in prep. [Google Scholar]
- Blanchet, H.; de Montaudouin, X.; Chardy, P.; Bachelet, G. Structuring factors and recent changes in subtidal macrozoobenthic communities of a coastal lagoon, Arcachon Bay (France). Estuar. Coast. Shelf Sci. 2005, 64, 561–576. [Google Scholar] [CrossRef]
- Dauvin, J.C.; Thiébaut, E.; Gesteira, J.L.G.; Ghertsos, K.; Gentil, F.; Ropert, M.; Sylvand, B. Spatial structure of a subtidal macrobenthic community in the Bay of Veys (western Bay of Seine, English Channel). J. Exp. Mar. Biol. Ecol. 2004, 307, 217–235. [Google Scholar] [CrossRef]
- Schückel, U.; Kröncke, I.; Baird, D. Linking long-term changes in trophic structure and function of an intertidal macrobenthic system to eutrophication and climate change using ecological network analysis. Mar. Ecol. Prog. Ser. 2015, 536, 25–38. [Google Scholar] [CrossRef]
- Buzas, M.A.; Hayek, L.A.C. Biodiversity Resolution: An Integrated Approach. Biodivers. Lett. 1996, 3, 40–43. [Google Scholar] [CrossRef]
- Stirling, G.; Wilsey, B. Empirical relationships between species richness, evenness, and proportional diversity. Am. Nat. 2001, 158, 286–299. [Google Scholar] [CrossRef] [PubMed]
- Hillebrand, H.; Bennett, D.M.; Cadotte, M.W. Consequences of dominance: A review of evenness effects on local and regional ecosystem processes. Ecology 2008, 89, 1510–1520. [Google Scholar] [CrossRef]


| Reference Conditions | EQR | |||
|---|---|---|---|---|
| AMBI | H’ | S | High/Good | Good/Moderate |
| 0.5 | 4.8 | 50 | 0.81 | 0.61 |
| February 2018 (T1) | July 2018 (T2) | ||||||
| Site | S | H’ | EQR | Site | S | H’ | EQR |
| Treatment | 44 | 2.45 | Moderate | Treatment | 31 | 2.42 | Moderate |
| Control | 68 | 4.93 | High | Control | 68 | 5.19 | High |
| July 2019 (T3) | February 2020 (T4) | ||||||
| Site | S | H’ | EQR | Site | S | H’ | EQR |
| Treatment | 36 | 3.90 | Good | Treatment | 78 | 4.83 | High |
| Control | 57 | 4.91 | High | Control | 94 | 5.18 | High |
| July 2020 (T5) | |||||||
| Site | S | H’ | EQR | ||||
| Treatment | 36 | 4.19 | Good | ||||
| Control | 65 | 4.61 | High | ||||
| Source of Variation | df | MS | Pseudo-F | P(perm) | perms | P(MC) | Denominator |
|---|---|---|---|---|---|---|---|
| Site (=S) | 1 | 9072.2 | 2.694 | 0.088 | 9189 | 0.012 | S × T(B) |
| Before vs. After (=B) | 1 | 13110 | 1.840 | 0.099 | 10 | 0.091 | T(B) |
| Time(B) (=T) | 3 | 7125.1 | 3.978 | 0.0001 | 9861 | 0.0001 | Residual |
| S × B | 1 | 6563.1 | 1.949 | 0.159 | 9236 | 0.055 | S × T(B) |
| S × T(B) | 3 | 3368 | 1.880 | 0.0001 | 9835 | 0.002 | Residual |
| Residual | 20 | 1791 |
| Pairwise of S × T(B) for pairs of levels of factor Site (Control vs. Treatment) | |||||
| Time | t | P(perm) | perms | P(MC) | |
| Before | T1—February | 1.5256 | 0.1032 | 10 | 0.1060 |
| T2—July | 1.7407 | 0.0980 | 10 | 0.0526 | |
| After | T3—July | 1.7895 | 0.0995 | 10 | 0.0537 |
| T4—February | 1.4622 | 0.1003 | 10 | 0.1147 | |
| T5—July | 1.8557 | 0.0969 | 10 | 0.0509 | |
| Pairwise of S × T(B) for pairs of levels of factor Time (Before vs. After) | |||||
| Time | Site | t | P(perm) | perms | P(MC) |
| Before T1 vs. T2 | Treatment | 1.1055 | 0.2890 | 10 | 0.3348 |
| Control | 1.4358 | 0.1016 | 10 | 0.1280 | |
| After T3 vs. T4 | Treatment | 2.2320 | 0.1046 | 10 | 0.0185 |
| Control | 1.9917 | 0.1034 | 10 | 0.0239 | |
| After T3 vs. T5 | Treatment | 1.7216 | 0.0984 | 10 | 0.0626 |
| Control | 0.0995 | 0.0995 | 10 | 0.0248 | |
| After T4 vs. T5 | Treatment | 1.7409 | 0.0997 | 10 | 0.0595 |
| Control | 2.2759 | 0.0994 | 10 | 0.0187 | |
| Source of Variation | df | MS | Pseudo-F | P(perm) | perms | P(MC) | Denominator |
|---|---|---|---|---|---|---|---|
| Site (=S) | 1 | 1596.100 | 32.402 | 0.0150 | 9117 | 0.0099 | S × T(B) |
| Before vs. After (=B) | 1 | 314.690 | 0.527 | 0.9010 | 7 | 0.5230 | T(B) |
| Time(B) (=T) | 3 | 596.930 | 11.531 | 0.0002 | 9944 | 0.0003 | Residual |
| S × B | 1 | 15.022 | 0.305 | 0.6150 | 8991 | 0.6159 | S × T(B) |
| S × T(B) | 3 | 49.259 | 0.952 | 0.4320 | 9941 | 0.4310 | Residual |
| Residual | 20 | 51.767 | |||||
| Cochran test | C = 0.259 | P = 0.6695 | |||||
| Source of Variation | df | MS | Pseudo-F | P(perm) | perms | P(MC) | Denominator |
|---|---|---|---|---|---|---|---|
| Site (=S) | 1 | 63.960 | 61.650 | 0.007 | 9164 | 0.0042 | S × T(B) |
| Before vs. After (=B) | 1 | 14.234 | 1.048 | 0.509 | 10 | 0.3797 | T(B) |
| Time(B) (=T) | 3 | 13.581 | 10.794 | 0.0003 | 9951 | 0.0001 | Residual |
| S × B | 1 | 2.466 | 2.377 | 0.222 | 9115 | 0.2181 | S × T(B) |
| S × T(B) | 3 | 1.037 | 0.824 | 0.495 | 9954 | 0.4909 | Residual |
| Residual | 20 | 1.258 | |||||
| Cochran test | C = 0.373 | P = 0.149 | |||||
| Source of Variation | df | MS | Pseudo-F | P(perm) | perms | P(MC) | Denominator |
|---|---|---|---|---|---|---|---|
| Site (=S) | 1 | 0.138 | 25.526 | 0.0215 | 9081 | 0.0155 | S × T(B) |
| Before vs. After (=B) | 1 | 0.097 | 30.820 | 0.0999 | 10 | 0.0125 | T(B) |
| Time(B) (=T) | 3 | 0.003 | 0.296 | 0.8410 | 9966 | 0.8324 | Residual |
| S × B | 1 | 0.128 | 23.699 | 0.0181 | 9115 | 0.0177 | S × T(B) |
| S × T(B) | 3 | 0.005 | 0.507 | 0.6860 | 9956 | 0.6771 | Residual |
| Residual | 20 | 0.011 | |||||
| Cochran test | C = 0.373 | P = 0.149 | |||||
| Pairwise of S × T(B) for pairs of levels of factor Site (Control vs. Treatment) | |||||
| T | P(perm) | perms | P(MC) | ||
| Before | C vs. Tr | 48.2690 | 0.2616 | 3 | 0.0139 |
| After | C vs. Tr | 0.1190 | 1 | 38 | 0.9186 |
| Pairwise of S × T(B)for pairs of levels of factor Time (Before vs. After) | |||||
| Site | B | T | P(perm) | perms | P(MC) |
| Treatment | Bef vs. Aft | 6.7528 | 0.0971 | 10 | 0.0062 |
| Control | Bef vs. Aft | 0.5353 | 0.6020 | 10 | 0.6316 |
| (a) | A (before) | B (before) | |||||
| EG | Species | Av.Abund | Av.Abund | Av.Diss | Diss/SD | Contrib% | Cum.% |
| V | Capitella capitata | 90.33 | 3.67 | 27.93 | 1.34 | 31.29 | 31.29 |
| I | Amphipholis squamata | 0.50 | 13 | 6.32 | 1.05 | 7.09 | 38.38 |
| IV | Cirrophorus nikebianchii | 8.17 | 5.17 | 3.69 | 1.10 | 4.14 | 42.52 |
| II | Amphiura chiajei | 0.17 | 6.67 | 3.27 | 0.71 | 3.67 | 46.18 |
| IV | Cirriformia tentaculata | 0.17 | 7.17 | 3.02 | 0.47 | 3.38 | 49.57 |
| (b) | A (after) | B (after) | |||||
| EG | Species | Av.Abund | Av.Abund | Av.Diss | Diss/SD | Contrib% | Cum.% |
| V | Capitella minima | 14.33 | 2.56 | 5.88 | 1 | 7.01 | 7.01 |
| IV | Cirrophorus nikebianchii | 0.22 | 9.44 | 4.87 | 0.93 | 5.80 | 12.81 |
| II | Prionospio depauperata | 3 | 11.56 | 4.63 | 0.99 | 5.52 | 18.33 |
| II | Aricidea (Acmira) catherinae | 1.67 | 8.89 | 4.58 | 0.69 | 5.46 | 23.79 |
| II | Pseudolirius kroyeri | 3.67 | 5.89 | 3.91 | 0.87 | 4.66 | 28.45 |
| III | Abra alba | 6.67 | 6.11 | 3.74 | 1.09 | 4.46 | 32.90 |
| IV | Varicorbula gibba | 6 | 3 | 3.47 | 0.89 | 4.14 | 37.04 |
| I | Pisidia bluteli | 2.22 | 6.56 | 3.20 | 0.57 | 3.81 | 40.85 |
| IV | Caulleriella alata | 1.22 | 5.78 | 2.34 | 0.77 | 2.79 | 43.64 |
| I | Amphipholis squamata | 4.44 | 1.89 | 2.01 | 0.66 | 2.40 | 46.04 |
| II | Amphiura chiajei | 0.89 | 3 | 1.97 | 0.68 | 2.34 | 48.38 |
Disclaimer/Publisher’s Note: The statements, opinions and data contained in all publications are solely those of the individual author(s) and contributor(s) and not of MDPI and/or the editor(s). MDPI and/or the editor(s) disclaim responsibility for any injury to people or property resulting from any ideas, methods, instructions or products referred to in the content. |
© 2022 by the authors. Licensee MDPI, Basel, Switzerland. This article is an open access article distributed under the terms and conditions of the Creative Commons Attribution (CC BY) license (https://creativecommons.org/licenses/by/4.0/).
Share and Cite
Borghese, J.; Musco, L.; Arduini, D.; Tamburello, L.; Del Pasqua, M.; Giangrande, A. A Comparative Approach to Detect Macrobenthic Response to the Conversion of an Inshore Mariculture Plant into an IMTA System in the Mar Grande of Taranto (Mediterranean Sea, Italy). Water 2023, 15, 68. https://doi.org/10.3390/w15010068
Borghese J, Musco L, Arduini D, Tamburello L, Del Pasqua M, Giangrande A. A Comparative Approach to Detect Macrobenthic Response to the Conversion of an Inshore Mariculture Plant into an IMTA System in the Mar Grande of Taranto (Mediterranean Sea, Italy). Water. 2023; 15(1):68. https://doi.org/10.3390/w15010068
Chicago/Turabian StyleBorghese, Jacopo, Luigi Musco, Daniele Arduini, Laura Tamburello, Michela Del Pasqua, and Adriana Giangrande. 2023. "A Comparative Approach to Detect Macrobenthic Response to the Conversion of an Inshore Mariculture Plant into an IMTA System in the Mar Grande of Taranto (Mediterranean Sea, Italy)" Water 15, no. 1: 68. https://doi.org/10.3390/w15010068