
Environmental DNA Captures Variations in Fish Assemblages with Distance from Dams in Karst Reservoirs
by
 , ,
, ,
Longfei Xu
1,2,
Dandan Yang
1,2,
Yizhou Wang
2,
Junyi Li
3,
Xingchen Guo
1,2,
Cong Zeng
4,
Haibo Jiang
1,2,
Miao An
1,2 and
Jian Shao
1,2,* 1
Key Laboratory of Animal Genetics, Breeding and Reproduction in the Plateau Mountainous Region, Ministry of Education, Guizhou University, Guiyang 550025, China
2
College of Animal Science, Guizhou University, Guiyang 550025, China
3
Key Laboratory of Freshwater Biodiversity Conservation, Ministry of Agriculture and Rural Affairs of China, Yangtze River Fisheries Research Institute, Chinese Academy of Fishery Sciences, Wuhan 430223, China
4
School of Oceanography, Shanghai Jiao Tong University, Shanghai 200030, China
*
Author to whom correspondence should be addressed.
Water 2023, 15(1), 73; https://doi.org/10.3390/w15010073
Submission received: 15 November 2022
/
Revised: 6 December 2022
/
Accepted: 23 December 2022
/
Published: 26 December 2022
(This article belongs to the Section Biodiversity and Functionality of Aquatic Ecosystems)
Abstract
:Dam impoundment can cause many adverse impacts on fish assemblages upstream of dams. Here, we investigated fish diversity in one plateau riverine reservoir (Wanfeng Reservoir) using environmental DNA (eDNA) metabarcoding technology. The following conclusions were drawn: (1) 39 species of fish were monitored belonging to 9 orders and 13 families in the Wanfeng Reservoir, most of which were Cypriniformes and included a variety of common farmed fish belonging to Culter, Oreochromis, Acipenser, and Clarias; (2) the fish assemblage structures in the Up (upstream section), Mid (midstream section), and RA (reservoir area section) of this reservoir was significantly different (p-value < 0.01); (3) among the 7 environmental variables that were measured (Tem, TDS, Sal, pH, DO, NH4+, and Tra), DO (p-value < 0.01) and pH (p-value < 0.05) were the main environmental stressors causing differences in fish assemblages in different sites of the Wanfeng Reservoir. This study concluded that dam construction in the karst region provided habitats for the establishment and dispersal of exotic fish.
1. Introduction
In recent decades, biodiversity has been damaged to different degrees worldwide due to anthropogenic activities. Freshwater fishes are an important part of biodiversity, and this taxon is under more severe environmental stress because it is more dependent on the environment than terrestrial animals [1,2,3,4,5]. China is the country with the largest karst distribution area in the world, and the karst plateau in southwest China is one of the three major karst landform concentration areas in the world. There are many caves, gullies, voids, underground rivers, rock pits, and other relatively closed ecosystems, thus creating many complex microhabitats. These small habitats with high landscape heterogeneity nurture rich biodiversity, making the region one of the most concentrated and diverse areas for rare and endemic species in China. At the same time, karst ecosystems are typically fragile ecosystems with shallow soils, poor soil carrying capacity, and fragile ecological and geological environments [6]. In the past decades, the karst plateau in southwest China has undergone hydropower development and damming to create numerous artificial reservoirs due to regional needs for development and other reasons, as well as due to urbanization, industrialization, and aquaculture importing large amounts of pollution sources into the natural water system. A variety of factors have coalesced to put fish in the area under severe stress [7,8].
Dams are one of the strongest factors affecting fish assemblages, and their effects include, among others, lack of fish migration pathways and blockage of fish migration routes. Dam interception changes the water depth, water temperature, and climatic conditions of the original river section. Fish netting in reservoirs introduces exotic fish [9,10,11,12,13]. In general, the effect of dams on upstream water levels decreases with increasing distance. This indicates that there is also a relationship between the effect of dams on fish assemblages and the distance from the dam [14,15].
Environmental DNA (eDNA) metabarcoding is a technology that that allows qualitative or quantitative analysis of organisms in the environment by extracting eDNA [16,17,18]. eDNA is usually derived from skin debris, gametes, mucus, and feces dropped by organisms in the environment [19]. Ficetola et al. [20] used eDNA to successfully detect a freshwater frog (Rana catesbeiana) in an aquatic environment, the first time eDNA was used to monitor an aquatic species. Now, scientists worldwide are applying eDNA metabarcoding technology to almost all water bodies such as rivers, lakes, seas, etc., to monitor fish species composition [21,22,23,24], estimate fish biomass, and monitor fish spatial distribution patterns [25,26]. Since fish universal primers based on the mitochondrial 12S region are more effective in monitoring fish than the 16S, COI, and Cytb regions, fish universal primers based on the 12S region are being used more often [27]. eDNA metabarcoding technology has the following advantages: (1) it is not influenced by the subjective judgement of researchers, (2) it avoids the need for long-term fish sample collection and greatly improves the efficiency of species monitoring, and (3) it is non-invasive and has little impact on monitored species and their habitats [28,29]. Although current eDNA metabarcoding technology may be confusing for species identification of some closely related fish [30,31] and the use of universal primers may have amplification preferences for individual fish [32,33], the directivity of results based on eDNA metabarcoding technology has been validated and is widely used for aquatic species and biomass monitoring [34,35].
In spite of the fact that the applicability of eDNA metabarcoding technology in karst waters has been verified, most of the previous studies have focused on other species, and few studies have been conducted on fish diversity [36,37]. In this study, the eDNA metabarcoding technique was used to investigate the response of fish assemblages and their key drivers under multiple environmental stresses in the Wanfeng Reservoir, a typical large plateau riverine reservoir located in the karst region of southwest China.
2. Methods
2.1. Sampling Design
The Wanfeng Reservoir is located in the main stream of the Nanpan River, which belongs to the Pearl River system. It is one of the most important reservoirs in the karst plateau of southwest China and not only assumes an important role in people’s livelihood but also serves as an important ecological barrier in the upper reaches of the Pearl River [38].
According to the special karst geomorphic and water environment points of the Wanfeng Reservoir, it was appropriate to set up sampling points in the upstream section (Up), midstream section (Mid), and reservoir area section (RA) inlet and outlet of the reservoir as well as the central area of the reservoir and bay, respectively. Five sampling points were set in each section. The last sampling point was set under the dam for comparative observation of fish species monitoring (Figure 1).
We collected eDNA samples in September 2020. Latitude and longitude were recorded during sampling, and the water temperature (Tem), total dissolved solids (TDS), salinity (Sal), pH, dissolved oxygen (DO), and NH4+ levels were measured using a YSI (Pro Plus) portable water quality detector. Water transparency (Tra) was measured using a Secchi disc (Table 1).
2.2. Collection and Processing of eDNA Samples
Samples were collected on the deck of the vessel with a 5 L collector at each site for the upper (1 m), middle (5 m) and lower (10 m) layers and then mixed. Due to the shallow water level at sample site S1, only upper and bottom water samples were collected for mixing at this site. Each site collected 2 L of mixed water samples for this study, and the collector changed gloves once at each site. eDNA samples were stored at low temperature and protected from light and then filtered immediately upon to the laboratory. The water samples were filtered using a diaphragm vacuum pump and a sand core glass filter. eDNA was collected using a 50 mm filter membrane made of glass fiber, with pore size of 0.45 μm. The operating environment was adequately ventilated in advance, and the bench was cleaned in sequence with 1% hypochlorite solution and anhydrous ethanol. The collection bottles and all experimental equipment were treated with 1% hypochlorite solution and cleaned with distilled water. A blank control was set up, and 2 L of ddH2O was filtered using the same membrane to test for environmental contamination. After filtration, the membrane was placed in a 1.5 mL centrifuge tube and stored at −20 °C.
2.3. Extraction, Amplification, and Sequencing
Water DNA was extracted using the Water DNA Kit D5525 from Omega, and the entire extraction process was carried out strictly according to the kit instructions. We selected the following universal primers for the 12S region of the fish mitochondrial gene [39]:
Tele02-F AAACTCGTGCCAGCCACC
Tele02-R GGGTATCTAATCCCAGTTTG.
PCR was conducted using TransStart Fastpfu DNA Polymerase in the following 20 μL reaction system: 4 μL 5 × FastPfu Buffer, 2 μL dNTPs (2.5 mM), 0.8 μL Forward Primer (5 μM), 0.8 μL Reverse Primer (5 μM), 0.4 μL FastPfu Polymerase, and 10 ng Template DNA, supplemented with ddH2O to 20 μL. The PCR reaction parameters were as follows: 1 × (5 min at 95 °C); cycles × (30 s at 95 °C; 30 s at 55 °C (Tm); 45 s at 72 °C); 10 min at 72 °C, 10 °C until halted by the user. PCR products from the same sample were mixed and detected by 2% agarose gel electrophoresis. PCR products were detected and quantified by the QuantiFluor™-ST blue fluorescence quantification system (Promega) for the preliminary quantification results of electrophoresis. Samples whose bands met the sequencing requirements were subjected to high-throughput sequencing using the Illumina Nova Seq6000 platform.
2.4. Bioinformatics Analysis
The raw sequences obtained from Illumina sequencing were first subjected to the following process: (1) setting a window of 10 bp; (2) truncating the back-end bases from the window if the average quality value within the window was below 20; (3) filtering sequences below 50 bp after quality control (Trimmomatic (Version 0.3)); and (4) splicing pairs of sequences into one sequence according to the overlap relationship of double-end sequencing, with a minimum overlap length of 10 bp and a maximum allowed overlap region; the mismatch ratio was 0.2. The non-conforming sequences were screened out (FLASH (Version 1.2.7)) and split according to the tag and primer sequences, and the sequence orientation was adjusted to obtain high-quality sequences for each sample. Operational Taxonomic Unit (OTU) clustering was performed on the high-quality sequences according to 98% similarity [22], and the chimeras were removed during clustering so as to generate OTU tables (Perl program (Version 5.18.2), USEARCH (Version 10), and QIIME (Version 1.9.1)). The generated OTU tables were compared with a self-built freshwater fish database based on the NCBI website (www.ncbi.nlm.nih.gov) (created October 2021; comparison software Blast (Version 2.3.0+)) to obtain information on fish species, with fish classification based on the Fishbase database [40].
2.5. Statistical Analysis
For more accurate identification results, the following corrections were made to the identification results: (1) low abundance sequences (mean reads of sequence samples below (1) were revised as unidentified [41]); (2) the identified hybrids were corrected as follows: if the parents of the hybrids belonged to the same genus of fish A, the hybrids were revised as A sp.; otherwise, the sequences of the hybrids were revised as unidentified. We completed the analysis of diversity using different packages of R software (Version 4.1.0). The diversity analysis was done based on the data after the subsample of the vegan package [42], including heat map and RDA analysis (capscale function). We first performed a Hellinger transformation of the data for the OTU abundance table. The environmental factor data were log2 (data + 1) transformed in order to eliminate the effect of large differences in the size of the environmental factor data on the decision curve analysis (DCA). The results of the analysis showed that the redundancy analysis (RDA) model should be selected for analysis in this study. Then, we calculated a variance-inflated factor (VIF) analysis on the environmental factor data and covariance tests on the environmental factors (vif. cca function), and gradually removed the maxima until all the VIF of environmental factor were less than 10. The plots were produced using Microsoft Excel, ArcGIS (Version 10.8), and ggplot2 [43].
3. Results
3.1. Sequencing and OTU Clustering Results
The PCR results showed that the target bands of the PCR products of the experimental samples S1–S16 were of the correct size and met the sequencing conditions, while the target bands of the blank control experimental PCR products were too weak or not detected and did not meet the sequencing conditions.
A total of 9,997,923 sequences were generated in this study. The raw sequences were quality controlled and clustered at 98% similarity to obtain 1622 fish OTU sequences. The fish orders with the largest proportion of total OTUs detected were Cypriniformes (48.78%), Siluriformes (42.62%), Cichliformes (6.59%), and Acipenseriformes (1.45%).
3.2. Fish Species Identified
After counting, 47 fish species were initially identified. Eight fish species were excluded from the artificial calibration due to low sequence abundance, and three fish species were hybrids, with both parents of the same genus. In this study, 39 fish species were ultimately identified in the Wanfeng Reservoir using eDNA metabarcoding technology. Twenty species of fish were matched in the historical survey, with Oreochromis niloticus being the only exotic species matched to the historical database. Of the fish monitored in this investigation, 20 species of Cypriniformes, 9 species of Siluriformes, 4 species of Cichliformes, and 1 species each of Acipenseriformes, Anabantiformes, Beloniformes, Centrarchiformes, Gobiiformes, and Salmoniformes were identified (Table 2).
3.3. Spatial Variations of Fish Assemblages
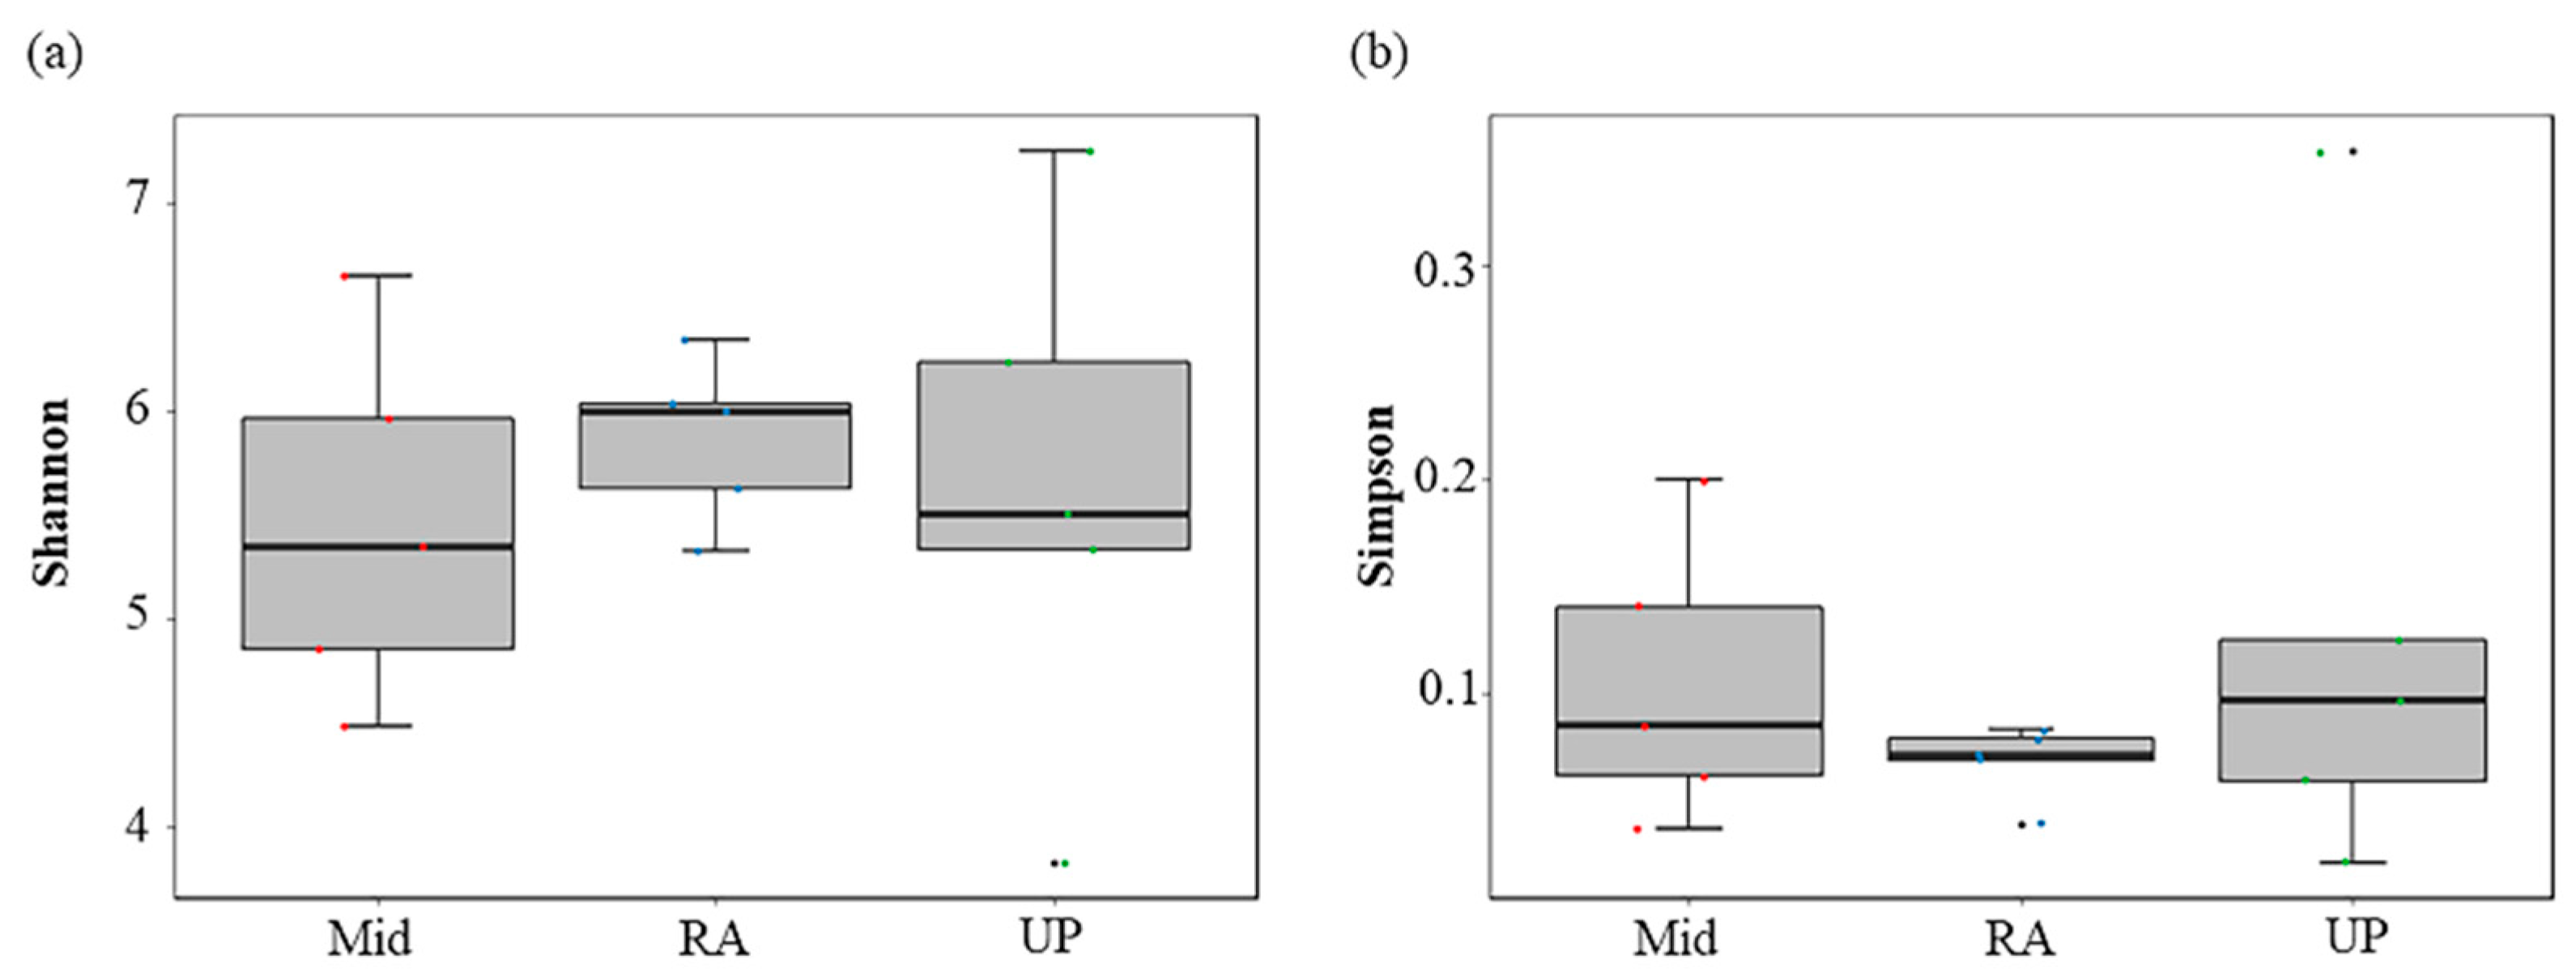
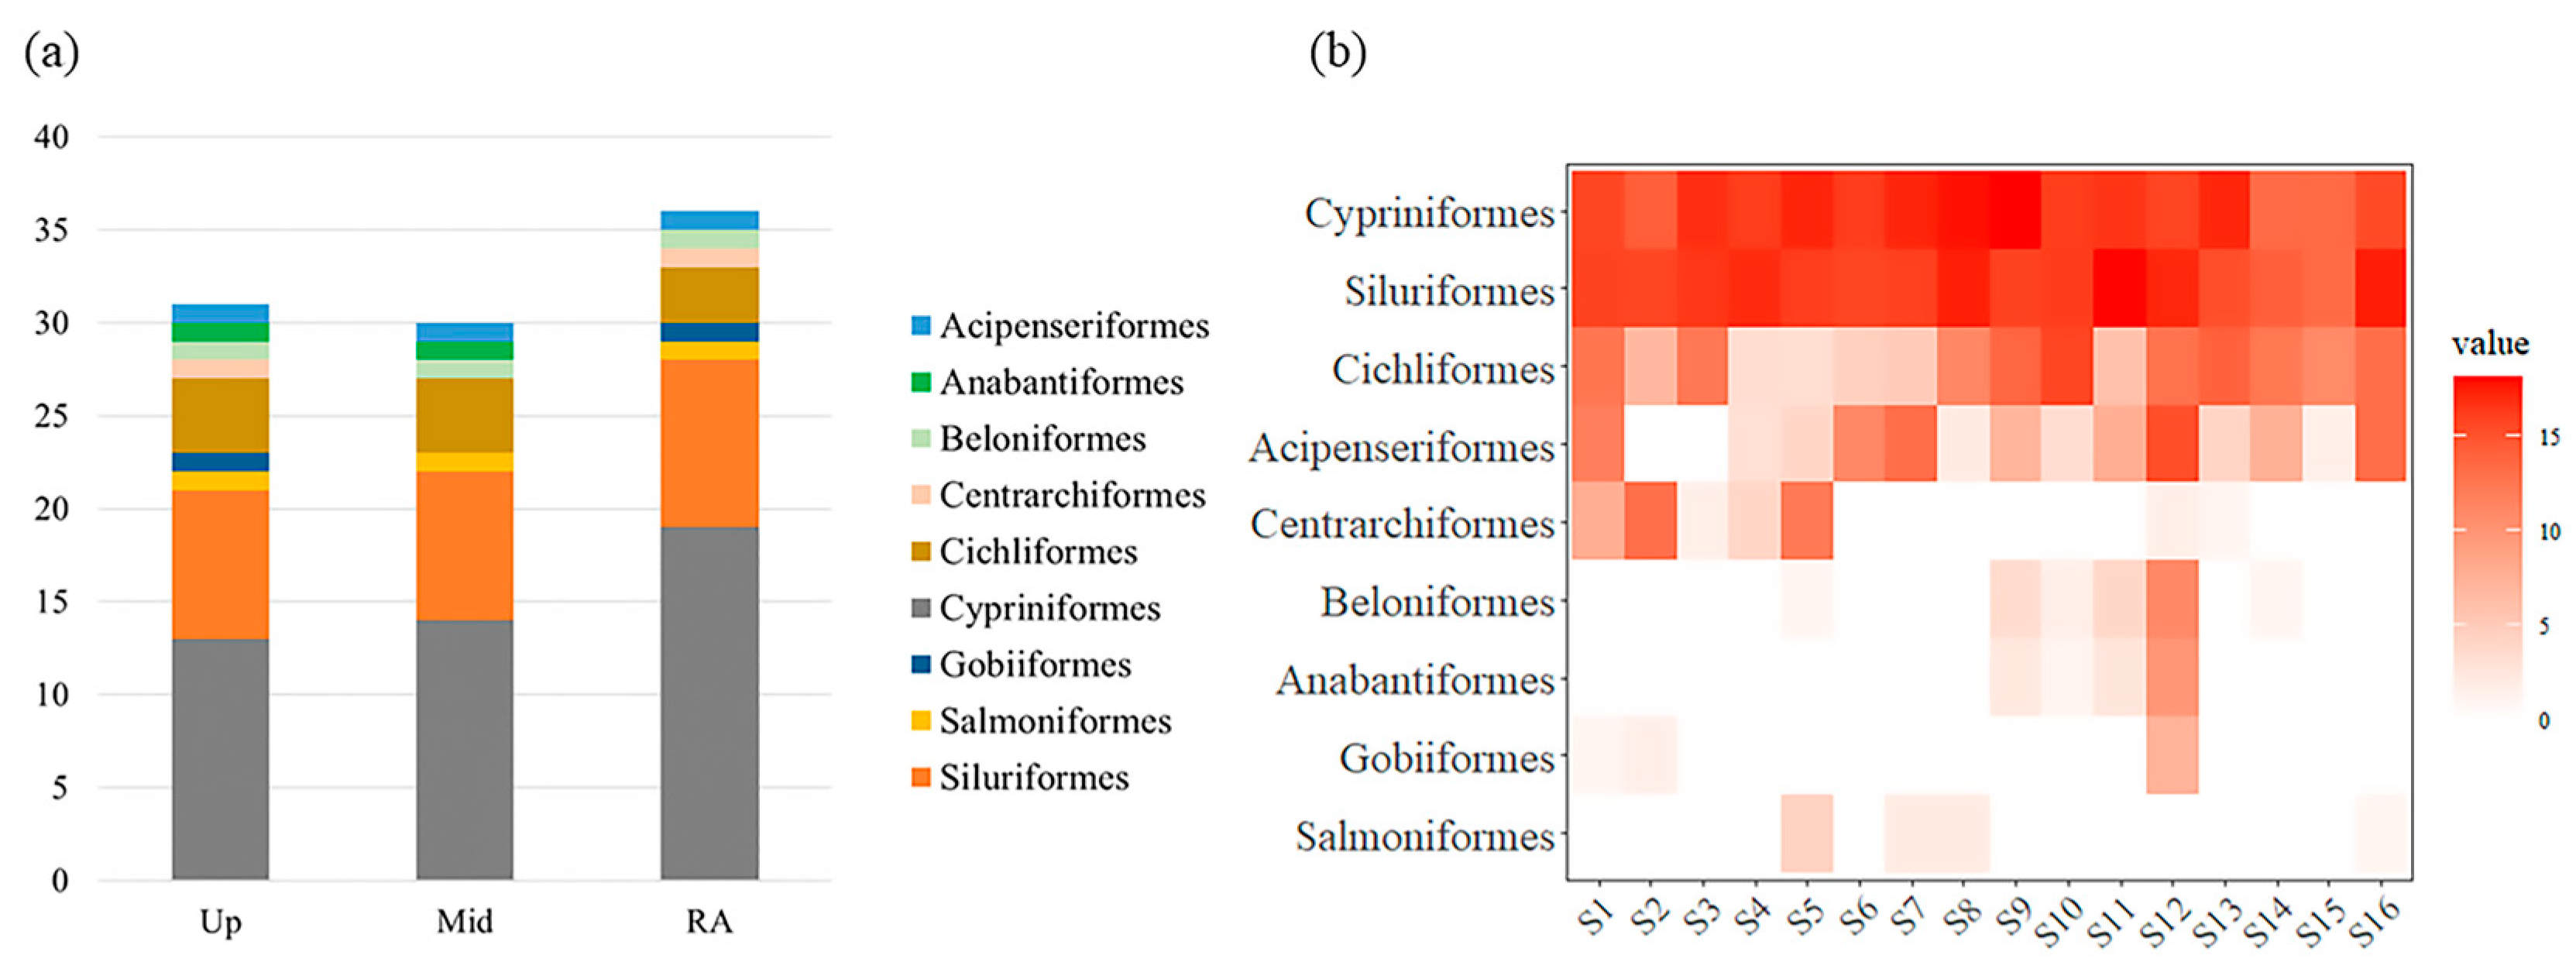
The results of α diversity showed that the fish assemblage diversity of RA was higher in different segment of the Wanfeng Reservoir than in the Up and Mid sections (Figure 2). Thirty-one species of fish were monitored in Up, 30 in Mid, and 36 in RA (Figure 3a). Six species of fish, Ctenopharyngodon idella, Carassius gibelio, Tatia intermedia, Hemiculter tchangi, Cyprinus carpio, and Tachysurus fulvidraco, were monitored at all sample sites, with no endemic fish at all sites. There were no fish monitored only in Up; Hemiculterella macrolepis was monitored only in Mid; and Acheilognathus macropterus, Xenocypris davidi, Silurus soldatovi, Squalidus argentatus, and Procypris rabaudi were monitored only in RA (Table 2).
The relative abundance of OTU sequences of fish from various sites in the Wanfeng Reservoir varied, and in general, the highest relative abundance of OTU sequences was found in Cypriniformes (Figure 3b). PERMANOVA analysis indicated significant fish β diversity variability in the Up, Mid, and RA sections of the Wanfeng Reservoir (Table 3).
3.4. The Relationship between Fish Diversity and Environmental Factors
In the RDA and variance inflation factor analyses, a total of seven environmental factors (Tem, TDS, Sal, pH, DO, NH4+, and Tra) were imported, and one environmental factor, TDS, was excluded. The total explanation of β diversity by the remaining six environmental factors was 49.39% (Figure 4). The sample points of the groups were interconnected to form a two-dimensional graph. The graphs formed by the three subgroups had no intersection between the Up and the RA, while the Mid and both the Up and the RA had intersections. On the RDA1 axis, Tem and DO were positively correlated, and the rest of the environmental factors were negatively correlated; on the RDA2 axis, Tem and NH4+ were positively correlated. The R2 for the environmental factors in the RDA analysis were DO, pH, Tem, Tra, Sal, and NH4+, in descending order. The p-value for DO = 0.001, the p-value for pH = 0.028, and the p-values for the rest of the environmental factors were greater than 0.05.
4. Discussion
4.1. Status of Fish Assemblages in the Wanfeng Reservoir
From 2008 to 2010, Wang et al. [44] collected 63 species of fish, including 45 species of Cypriniformes from the Yunnan section of the Nanpan River, which is located upstream of the Wanfeng Reservoir, and found that due to the eutrophication of water bodies and river fragmentation, a large number of indigenous fish populations have disappeared and multiple exotic fish species have been found. Moreover, in 2014–2018, Shuai et al. [45] showed that 8 species of Cypriniformes were among the top 10 fish species in terms of population abundance within the Hongshui River, which is located downstream of the Wanfeng Reservoir. The species and resources of indigenous fish in the Guangxi section of the Pearl River system have decreased, and biological invasion fish such as the genus Oreochromis have become the dominant species in each river section. Historical data show that Cypriniformes fish are the main fish in the upper and lower reaches of the Wanfeng Reservoir, that some indigenous fish populations in the upper and lower reaches of the Wanfeng Reservoir have been negatively affected, and that some exotic fish have been introduced. In this study, 39 species of fish were monitored in the Wanfeng Reservoir, including 20 species of Cypriniformes fish. A variety of common farmed fish were monitored, which are fully consistent with the characteristics of fish assemblages in this water.
Refer to the Fishbase database for the geographical distribution of fish. Five of the monitored fish in this study, Coptodon zillii, Oreochromis niloticus, Barbonymus schwanefeldii, Prosopium coulterii, and T. intermedia, have no distribution in China [40]. However, O. niloticus has actually been documented in China and verified in the historical fish database of Nanpan River [44]. C. zilli, B. schwanefeldii, and T. intermedia, all of which are not specifically documented, can be retrieved from the Chinese public network as unofficial records in China. P. coulterii and three hybrid fish species identified in the genus may be eDNA signatures of other fish of the same genus [30,31].
4.2. Correlations of Fish Assemblages and Environmental Factors
DO in the water column is essential for fish survival, and studies have shown that the distribution of wild fish assemblages shows a positive correlation with it [46]. Fish growth performance and water pH are also closely related, with pH tolerance varying greatly between fish species, making pH an important environmental factor that affects the distribution of freshwater fish [47].
In general, DO in water at 2–3 mg/L affects fish feeding and other life activities, while DO above 5 mg/L is completely normal for fish feeding and growth. DO was the main environmental factor causing differences in the fish assemblage structure at each site in the Wanfeng Reservoir, probably due to the shallow and narrow water surface of the Wanfeng Reservoir, which is influenced by photosynthesis of reservoir producers, respiration of reservoir aquatic organisms, and the significant daily variation in DO. In this study, the samples were taken at sunrise, when photosynthesis was in progress, so DO was above 5 mg/L. At sunset, when photosynthesis ceased, DO in some areas of the Wanfeng Reservoir dropped to less than 5 mg/L, making DO a limiting factor for fish assemblage distribution in some areas.
Fish are mostly suited to neutral or weakly alkaline waters and grow well in the pH range of 7.00–8.50. The pH of the water in the Wanfeng Reservoir during the sampling period of this study was 6.80–7.09, which is in a neutral to acidic environment. In acidic water, the pH of fish blood decreases, which will have some effect on fish physiological functions; therefore, fish will prefer neutral water [48]. This may be the reason why pH is one of the main environmental factors causing differences in the fish assemblage structure at each site in the Wanfeng Reservoir.
4.3. Challenges of Karst Plateau Fish Conservation
Although only 5 of 28 species of indigenous fish of the genus Anabarilius and Yunnanilus were collected in the traditional fish resource survey of the Nanpan River fish list [44], it can be assumed that some indigenous fish populations in the Yunnan section of the Nanpan River have been extremely reduced or disappeared. It should be emphasized that the mitochondrial gene sequences of the original indigenous fish in the target waters were lacking, and only 1 of the 28 species of indigenous fish could be retrieved from NCBI for the sequence of the mitochondrial 12S region (retrieved in June 2022). Although eDNA metabarcoding technology has been widely used to monitor fish diversity, it may still lead to an underestimation of fish species diversity in the karst plateau of southwest China.
In Guizhou Province, China, cage aquaculture has been completely banned in the target waters, but it was only completely removed in 2017. The eDNA signals of several commonly farmed fish species not matched to the historical database were monitored, not only in Wanfeng Lake, but also in other karst reservoirs in the region [44,49]. Average monthly temperature lows in the karst region of southwest China often fall below 10 degrees Celsius and are not conducive to the overwintering of fish such as Cichliformes. The construction of the dam has allowed for a dramatic increase in water depth, which means the water temperature in the region will be warmer during the winter months. This is probably the reason for the large number of Cichliformes monitored in the area. The results of this study support the view that the construction of the dam provides a habitat for more fish and increases the risk of exotic fish transmission [11,50].
Therefore, combining the results of this study with historical fish databases, some indigenous fish populations in southwest China’s karst region have shrunk in the wild, and some exotic farmed fish have increased to scale of wild populations [44,45]. The relevant authorities in the region should be more cautious about introducing exotic farmed fish and start to carry out measures that are conducive to restoring indigenous fish populations in the wild, such as stocking and releasing.
5. Conclusions
In this study, fish diversity was studied in the Wanfeng Reservoir through eDNA metabarcoding technology. It provides new methods and ideas for assessing fish diversity in karst area waters while monitoring the fish composition and distribution in the Wanfeng Reservoir. The following conclusions were drawn: (1) 39 species of fish from 9 orders and 13 families were identified in the Wanfeng Reservoir. (2) the fish assemblage structures of the Up, Mid, and RA sections of the Wanfeng Reservoir were significantly different (R2 = 0.22, p-value < 0.01); α diversity index and the number of monitored fish showed that the fish assemblage diversity of the RA was higher than that of the other sections. (3) DO (p-value < 0.01) and pH (p-value < 0.05) were the main environmental factors causing differences in fish assemblages structure between the various sites in the Wanfeng Reservoir.
Author Contributions
J.S. and L.X. designed the research. L.X., D.Y., Y.W., J.L. and X.G. conducted the experiments. C.Z., H.J. and M.A. performed the theoretical calculations and data analysis. L.X., C.Z. and J.S. wrote and revised the manuscript. J.S. led and oversaw the project. All authors reviewed the manuscript. All authors have read and agreed to the published version of the manuscript.
Funding
This study was supported by the Science and Technology Project of Guizhou Province, China ([2020]4Y027 & [2019]1118), the High-Level Introduction of Talent Research Start-up Fund of Guizhou University (201719), and the Key Lab of Freshwater Biodiversity Conservation, Ministry of Agriculture of China (LFBC0901).
Institutional Review Board Statement
Not applicable.
Informed Consent Statement
Not applicable.
Data Availability Statement
Raw sequencing data will be released upon article acceptance. Sequence Read Archive (SRA) database (https://www.ncbi.nlm.nih.gov/sra accessed on 5 November 2021), accession number: PRJNA778057.
Conflicts of Interest
The authors declare no conflict of interest.
References
- Dudgeon, D. Multiple threats imperil freshwater biodiversity in the Anthropocene. Curr. Biol. 2019, 29, R960–R967. [Google Scholar] [CrossRef] [PubMed]
- Rolls, R.J.; Hayden, B.; Kahilainen, K.K. Conceptualising the interactive effects of climate change and biological invasions on subarctic freshwater fish. Ecol. Evol. 2017, 7, 4109–4128. [Google Scholar] [CrossRef] [PubMed]
- Azzurro, E.; Sbragaglia, V.; Cerri, J.; Bariche, M.; Bolognini, L.; Souissi, J.B.; Busoni, G.; Coco, S.; Chryssanthi, A.; Fanelli, E.; et al. Climate change, biological invasions, and the shifting distribution of Mediterranean fishes: A large-scale survey based on local ecological knowledge. Glob. Chang. Biol. 2019, 25, 2779–2792. [Google Scholar] [CrossRef] [PubMed]
- Costa, M.J.; Duarte, G.; Segurado, P.; Branco, P. Major threats to European freshwater fish species. Sci. Total Environ. 2021, 797, 149105. [Google Scholar] [CrossRef] [PubMed]
- Duncan, J.R.; Lockwood, J.L. Extinction in a field of bullets: A search for causes in the decline of the world’s freshwater fishes. Biol. Conserv. 2001, 102, 97–105. [Google Scholar] [CrossRef]
- Wang, B.; Huang, Y.; Li, J.; Dai, Q.; Wang, Y.; Yang, D. Amphibian species richness patterns in karst regions in Southwest China and its environmental associations. Biodivers. Sci. 2018, 26, 941–950. (In Chinese) [Google Scholar] [CrossRef]
- Li, L.; Li, Q.H.; Chen, J.A.; Wang, J.F.; Jiao, S.L.; Chen, F.F. Temporal and spatial distribution of phytoplankton functional groups and role of environment factors in a deep subtropical reservoir. J. Oceanol. Limnol. 2018, 36, 762–771. [Google Scholar] [CrossRef]
- Dos Santos, J.A.; Silva, C.B.; de Santana, H.S.; Cano-Barbacil, C.; Agostinho, A.A.; Normando, F.T.; Cabeza, J.R.; Roland, F.; García-Berthou, E. Assessing the short-term response of fish assemblages to damming of an Amazonian river. J. Environ. Manag. 2022, 307, 114571. [Google Scholar] [CrossRef]
- Piria, M.; Simonović, P.; Zanella, D.; Ćaleta, M.; Šprem, N.; Paunović, M.; Tomljanović, T.; Gavrilović, A.; Pecina, M.; Špelić, I.; et al. Long-term analysis of fish assemblage structure in the middle section of the Sava River—The impact of pollution, flood protection and dam construction. Sci. Total Environ. 2019, 651, 143–153. [Google Scholar] [CrossRef]
- Gao, X.; Fujiwara, M.; Winemiller, K.O.; Lin, P.; Li, M.; Liu, H. Regime shift in fish assemblage structure in the Yangtze River following construction of the Three Gorges Dam. Sci. Rep. 2019, 9, 4212. [Google Scholar] [CrossRef]
- Wang, J.; Chen, L.; Tang, W.; Heino, J.; Jiang, X. Effects of dam construction and fish invasion on the species, functional and phylogenetic diversity of fish assemblages in the Yellow River Basin. J. Environ. Manag. 2021, 293, 112863. [Google Scholar] [CrossRef] [PubMed]
- Baumgartner, M.T.; Piana, P.A.; Baumgartner, G.; Gomes, L.C. Storage or run-of-river reservoirs: Exploring the ecological effects of dam operation on stability and species interactions of fish assemblages. Environ. Manag. 2020, 65, 220–231. [Google Scholar] [CrossRef] [PubMed]
- Cooper, A.R.; Infante, D.M.; Daniel, W.M.; Wehrly, K.E.; Wang, L.; Brenden, T.O. Assessment of dam effects on streams and fish assemblages of the conterminous USA. Sci. Total Environ. 2017, 586, 879–889. [Google Scholar] [CrossRef] [PubMed]
- Liao, C.; Wang, J.; Ye, Y.S.; Li, W.; Correa, S.B.; Zhang, T.; Liu, J. Fish assemblage response to removal of a low-head dam in the lower reach of a tropical island river. Freshw. Biol. 2022, 67, 926–937. [Google Scholar] [CrossRef]
- Wu, Z.; Zhu, S.; Li, Y.; Xia, Y.; Zhang, Y.; Li, X.; Li, J. Spatiotemporal Response of Fish Aggregations to Hydrological Changes in the Lower Pearl River, China, during the Main Spawning Season. Water 2022, 14, 1723. [Google Scholar] [CrossRef]
- Shu, L.; Ludwig, A.; Peng, Z. Standards for Methods Utilizing Environmental DNA for Detection of Fish Species. Genes 2020, 11, 296. [Google Scholar] [CrossRef] [Green Version]
- Pont, G.D.; Ritter, C.D.; Agostinis, A.O.; Stica, P.V.; Horodesky, A.; Cozer, N.; Balsanelli, E.; Netto, O.S.M.; Henn, C.; Ostrensky, A.; et al. Monitoring fish communities through environmental DNA metabarcoding in the fish pass system of the second largest hydropower plant in the world. Sci. Rep. 2021, 11, 23167. [Google Scholar] [CrossRef]
- Ahn, H.; Kume, M.; Terashima, Y.; Ye, F.; Kameyama, S.; Miya, M.; Yamashita, Y.; Kasai, A. Evaluation of fish biodiversity in estuaries using environmental DNA metabarcoding. PLoS ONE 2020, 15, e0231127. [Google Scholar] [CrossRef]
- Bohmann, K.; Evans, A.; Gilbert, M.T.P.; Carvalho, G.R.; Creer, S.; Knapp, M.; Yu, D.W.; Bruyn, M.D. Environmental DNA for wildlife biology and biodiversity monitoring. Trends Ecol. Evol. 2014, 29, 358–367. [Google Scholar] [CrossRef]
- Ficetola, G.F.; Miaud, C.; Pompanon, F.; Taberlet, P. Species detection using environmental DNA from water samples. Biol. Lett. 2008, 4, 423–425. [Google Scholar] [CrossRef]
- Zhang, S.; Zheng, Y.; Zhan, A.; Dong, C.; Zhao, J.; Yao, M. Environmental DNA captures native and non-native fish community variations across the lentic and lotic systems of a megacity. Sci. Adv. 2022, 8, eabk0097. [Google Scholar] [CrossRef] [PubMed]
- Consuegra, S.; O’Rorke, R.; Rodriguez-Barreto, D.; Fernandez, S.; Jones, J.; Leaniz, C.G.D. Impacts of large and small barriers on fish assemblage composition assessed using environmental DNA metabarcoding. Sci. Total Environ. 2021, 790, 148054. [Google Scholar] [CrossRef] [PubMed]
- Jia, H.; Zhang, H.; Xian, W. Fish Diversity Monitored by Environmental DNA in the Yangtze River Mainstream. Fishes. 2022, 7, 1. [Google Scholar] [CrossRef]
- Li, H.; Yang, F.; Zhang, R.; Liu, S.; Yang, Z.; Lin, L.; Ye, S. Environmental DNA metabarcoding of fish communities in a small hydropower dam reservoir: A comparison between the eDNA approach and established fishing methods. J. Freshw. Ecol. 2022, 37, 337–358. [Google Scholar] [CrossRef]
- Zhang, S.; Lu, Q.; Wang, Y.; Wang, X.; Zhao, J.; Yao, M. Assessment of fish communities using environmental DNA: Effect of spatial sampling design in lentic systems of different sizes. Mol. Ecol. Resour. 2020, 20, 242–255. [Google Scholar] [CrossRef]
- Yamamoto, S.; Minami, K.; Fukaya, K.; Takahashi, K.; Sawada, H.; Murakami, H.; Tsuji, S.; Hashizume, H.; Kubonaga, S.; Horiuchi, T.; et al. Environmental DNA as a ‘Snapshot’ of Fish Distribution: A Case Study of Japanese Jack Mackerel in Maizuru Bay, Sea of Japan. PLoS ONE 2016, 11, e0149786. [Google Scholar] [CrossRef] [Green Version]
- Zhang, S.; Zhao, J.D.; Yao, M. A comprehensive and comparative evaluation of primers for metabarcoding eDNA from fish. Methods Ecol. Evol. 2020, 11, 1609–1625. [Google Scholar] [CrossRef]
- Valdez-Moreno, M.; Ivanova, N.V.; Elías-Gutiérrez, M.; Pedersen, S.L.; Bessonov, K.; Bessonov, K. Using eDNA to biomonitor the fish community in a tropical oligotrophic lake. PLoS ONE 2019, 14, e0215505. [Google Scholar] [CrossRef] [Green Version]
- Antognazza, C.M.; Britton, J.R.; Potter, C.; Franklin, E.; Hardouin, E.A.; Roberts, C.G.; Aprahamian, M.; Andreou, D. Environmental DNA as a non-invasive sampling tool to detect the spawning distribution of European anadromous shads (Alosa spp.). Aquat. Conserv.-Mar. Freshw. Ecosyst. 2019, 29, 148–152. [Google Scholar] [CrossRef] [Green Version]
- Santana, C.D.D.; Parenti, L.R.; Dillman, C.B.; Coddington, J.A.; Bastos, D.A.; Baldwin, C.C.; Zuanon, J.; Torrente-Vilara, G.; Covain, R.; Menezes, N.A.; et al. The critical role of natural history museums in advancing eDNA for biodiversity studies: A case study with Amazonian fishes. Sci. Rep. 2021, 11, 18159. [Google Scholar] [CrossRef]
- Lamy, T.; Pitz, K.J.; Chavez, F.P.; Yorke, C.E.; Miller, R.J. Environmental DNA reveals the fine-grained and hierarchical spatial structure of kelp forest fish communities. Sci. Rep. 2021, 11, 14439. [Google Scholar] [CrossRef] [PubMed]
- Elbrecht, V.; Leese, F. Can DNA-Based Ecosystem Assessments Quantify Species Abundance? Testing Primer Bias and Biomass--Sequence Relationships with an Innovative Metabarcoding Protocol. PLoS ONE 2015, 10, e0130324. [Google Scholar] [CrossRef] [PubMed] [Green Version]
- Piñol, J.; Mir, G.; Gomez-Polo, P.; Agustí, N. Universal and blocking primer mismatches limit the use of high-throughput DNA sequencing for the quantitative metabarcoding of arthropods. Mol. Ecol. Resour. 2015, 15, 819–830. [Google Scholar] [CrossRef] [PubMed]
- Kelly, R.P.; Port, J.A.; Yamahara, K.M.; Martone, R.G.; Lowell, N.; Thomsen, P.F.; Mach, M.E.; Bennett, M.; Prahler, E.; Caldwell, M.R.; et al. Environmental monitoring. Harnessing DNA to improve environmental management. Science 2014, 344, 1455–1456. [Google Scholar] [CrossRef]
- Evans, N.T.; Olds, B.P.; Renshaw, M.A.; Turner, C.R.; Li, Y.; Jerde, C.L.; Mahon, A.R.; Pfrender, M.E.; Lamberti, G.A.; Lodge, D.M. Quantification of mesocosm fish and amphibian species diversity via environmental DNA metabarcoding. Mol. Ecol. Resour. 2016, 16, 29–41. [Google Scholar] [CrossRef] [Green Version]
- Chen, Y.; Qiu, K.R.; Zhong, Z.Y.; Zhou, T. Influence of environmental factors on the variability of archaeal communities in a karst wetland. Front. Microbiol. 2021, 12, 675665. [Google Scholar] [CrossRef]
- Gorički, Š.; Stanković, D.; Snoj, A.; Kuntner, M.; Jeffery, W.R.; Trontelj, P.; Pavićević, M.; Grizelj, Z.; Năpăruş-Aljančič, M.; Aljančič, G. Environmental DNA in subterranean biology: Range extension and taxonomic implications for Proteus. Sci. Rep. 2017, 7, 45054. [Google Scholar] [CrossRef]
- West, K.M.; Richards, Z.T.; Harvey, E.S.; Susac, R.; Grealy, A.; Bunce, M. Under the karst: Detecting hidden subterranean assemblages using eDNA metabarcoding in the caves of Christmas Island, Australia. Sci. Rep. 2020, 10, 21479. [Google Scholar] [CrossRef]
- Taberlet, P.; Bonin, A.; Zinger, L.; Coissac, E. Environmental DNA: For Biodiversity Research and Monitoring; Oxford University Press: New York, NY, USA, 2018. [Google Scholar]
- Froese, R.; Pauly, D. FishBase. 2022. Available online: www.fishbase.org (accessed on 23 August 2022).
- Bokulich, N.A.; Subramanian, S.; Faith, J.J.; Gevers, D.; Gordon, J.I.; Knight, R.; Mills, D.A.; Caporaso, J.G. Quality-filtering vastlynimproves diversity estimates from illumina amplicon sequencing. Nat. Methods 2013, 10, 57–59. [Google Scholar] [CrossRef]
- Oksanen, J.; Blanchet, F.G.; Friendly, M.; Kindt, R.; Legendre, P.; McGlinn, D.; Minchin, P.R.; O’Hara, R.B.; Simpson, G.L.; Solymos, P.; et al. Vegan: Community Ecology Package. R. Package Version 2.5-7. 2020. Available online: http://CRAN.R-project.org/package=vegan (accessed on 23 August 2022).
- Hadley, W.; Winston, C.; Lionel, H.; Lin, P.T.; Kohske, T.; Claus, W.; Kara, W.; Hiroaki, Y.; Dewey, D. ggplot2: Create Elegant Data Visualisations Using the Grammar of Graphics. R. Package Version 3.3.4. 2021. Available online: https://ggplot2.tidyverse.org (accessed on 23 August 2022).
- Wang, W.Y.; Yang, J.X.; Chen, X.Y. Current Status and Conservation Strategics of Fish Germplasm Resources of Nanpanjiang River System in Yunnan. J. Hydroecol. 2011, 32, 19–29. (In Chinese) [Google Scholar] [CrossRef]
- Shuai, F.M.; Li, X.H.; He, A.Y.; Liu, Q.F.; Zhang, Y.Q.; Wu, Z.; Zhu, S.L. Fish Diversity and Distribution pattern of The Pearl River system in Guangxi. Acta Hydrobiol. Sin. 2020, 44, 819–828. [Google Scholar] [CrossRef]
- Akyol, O.; Özgül, A.; Düzbastılar, F.O.; Şen, H.; Urbina, J.M.O.D.; Ceyhan, T. Influence of some physico-chemical variables on wild fish richness beneath sea-cage fish farms in the Aegean Sea, Turkey. J. Mar. Biol. Assoc. UK 2020, 100, 1171–1179. [Google Scholar] [CrossRef]
- Lemos, C.H.D.P.; Ribeiro, C.V.D.M.; Oliveira, C.P.B.D.; Couto, R.D.; Copatti, C.E. Effects of interaction between pH and stocking density on the growth, haematological and biochemical responses of Nile tilapia juveniles. Aquaculture 2018, 495, 62–67. [Google Scholar] [CrossRef]
- Yanagitsuru, Y.R.; Hewitt, C.R.; Gam, L.T.H.; Phuong-Linh, P.; Rodgers, E.M.; Wang, T.; Bayley, M.; Huong, D.T.T.; Phuong, N.T.; Brauner, C.J. Effect of water pH and calcium on ion balance in five fish species of the Mekong Delta. Comp. Biochem. Physiol. A Mol. Integr. Physiol. 2019, 232, 34–39. [Google Scholar] [CrossRef]
- Xu, L.F.; Yao, D.D.; Yang, Y.W.; Guo, X.C.; Li, J.Y.; Jiang, H.B.; An, M.; Dong, X.H.; Shao, J. Fish diversity in karst plateau artificial lakes based on environmental DNA metabarcoding technology. J. South. Agric. 2022. Available online: https://kns.cnki.net/kcms/detail/45.1381.S.20220718.1346.002.html (accessed on 19 July 2022). (In Chinese).
- Dos Santos, D.A.; Hoeinghaus, D.J.; Gomes, L.C. Spatial scales and the invasion paradox: A test using fish assemblages in a Neotropical floodplain. Hydrobiologia 2018, 817, 121–131. [Google Scholar] [CrossRef]
Figure 1.
Map of sampling sites for eDNA sample collection at the Wanfeng Reservoir, with the geographical location of the Wanfeng Reservoir in China marked on the small map in the upper left corner. Different sections are distinguished by differently colored sampling points.
Figure 1.
Map of sampling sites for eDNA sample collection at the Wanfeng Reservoir, with the geographical location of the Wanfeng Reservoir in China marked on the small map in the upper left corner. Different sections are distinguished by differently colored sampling points.

Figure 2.
Comparison of α diversity in different sections: (a) Shannon Index; (b) Simpson Index.

Figure 3.
(a) Fish species composition in different segments; (b) Heat map of fish composition based on relative sequence abundance at each sample site.
Figure 3.
(a) Fish species composition in different segments; (b) Heat map of fish composition based on relative sequence abundance at each sample site.

Figure 4.
RDA analysis of fish OTU sequence reads. Different segment sample points are distinguished by different colors. The different groupings of sample points are joined into two-dimensional patterns.
Figure 4.
RDA analysis of fish OTU sequence reads. Different segment sample points are distinguished by different colors. The different groupings of sample points are joined into two-dimensional patterns.


Table 1.
Records of latitude, longitude, and environmental factors.
| Number | Site | Longitude | Latitude | Tem | Tra | TDS | Sal | pH | DO | NH4+ |
|---|---|---|---|---|---|---|---|---|---|---|
| °C | m | mg/L | ppt | - | mg/L | mg/L | ||||
| S1 | BaXia | 105.11 | 24.95 | 22.00 | 3.00 | 261.95 | 0.19 | 6.93 | 5.90 | 0.14 |
| S2 | DaBa | 105.09 | 24.94 | 25.30 | 2.50 | 261.30 | 0.19 | 7.03 | 8.30 | 0.04 |
| S3 | HongChong | 105.06 | 24.92 | 25.60 | 1.95 | 250.90 | 0.18 | 6.99 | 8.10 | 0.03 |
| S4 | MeiJiaWan | 105.07 | 24.90 | 25.30 | 2.20 | 256.10 | 0.19 | 7.03 | 6.90 | 0.04 |
| S5 | PoNaShu | 105.04 | 24.88 | 25.70 | 2.25 | 257.40 | 0.19 | 7.00 | 5.90 | 0.05 |
| S6 | BaJie | 105.03 | 24.86 | 26.00 | 2.10 | 244.40 | 0.18 | 7.03 | 6.60 | 0.03 |
| S7 | YeYaTan | 105.04 | 24.83 | 26.30 | 1.65 | 219.70 | 0.16 | 7.07 | 7.30 | 0.02 |
| S8 | GeBu | 105.03 | 24.80 | 25.80 | 2.35 | 245.05 | 0.18 | 7.05 | 7.80 | 0.03 |
| S9 | BaAi | 104.95 | 24.77 | 25.90 | 2.15 | 254.80 | 0.19 | 6.97 | 7.90 | 0.04 |
| S10 | BaDaZhang | 104.87 | 24.74 | 27.10 | 2.10 | 227.50 | 0.17 | 6.99 | 8.50 | 0.02 |
| S11 | JinZhongShan | 104.84 | 24.68 | 26.50 | 2.05 | 234.65 | 0.17 | 7.02 | 7.80 | 0.02 |
| S12 | LaoWangZhai | 104.76 | 24.66 | 26.50 | 1.90 | 226.85 | 0.17 | 6.99 | 8.20 | 0.02 |
| S13 | HeShe | 104.73 | 24.62 | 26.40 | 1.70 | 226.85 | 0.17 | 7.06 | 8.20 | 0.02 |
| S14 | BaWan | 104.69 | 24.65 | 26.90 | 1.65 | 223.60 | 0.16 | 6.80 | 11.50 | 0.03 |
| S15 | NanGuShan | 104.61 | 24.68 | 26.50 | 2.25 | 247.00 | 0.18 | 6.96 | 8.30 | 0.03 |
| S16 | SanJIiangKou | 104.54 | 24.73 | 26.30 | 1.75 | 219.05 | 0.16 | 7.09 | 7.09 | 0.02 |
Table 2.
Summary of fish identified by eDNA from the Wanfeng Reservoir.
| Taxonomy | S1 | S2 | S3 | S4 | S5 | S6 | S7 | S8 | S9 | S10 | S11 | S12 | S13 | S14 | S15 | S16 |
|---|---|---|---|---|---|---|---|---|---|---|---|---|---|---|---|---|
| Acipenseriformes | ||||||||||||||||
| Acipenseridae | ||||||||||||||||
| Acipenser sp. | + | + | + | + | + | + | + | + | + | + | + | + | + | + | ||
| Anabantiformes | ||||||||||||||||
| Channidae | ||||||||||||||||
| Channa sp. | + | + | + | + | ||||||||||||
| Beloniformes | ||||||||||||||||
| Adrianichthyidae | ||||||||||||||||
| Oryzias sinensis * | + | + | + | + | + | + | ||||||||||
| Centrarchiformes | ||||||||||||||||
| Sinipercidae | ||||||||||||||||
| Siniperca scherzeri * | + | + | + | + | + | + | ||||||||||
| Cichliformes | ||||||||||||||||
| Cichlidae | ||||||||||||||||
| Coptodon zillii | + | + | + | + | + | + | ||||||||||
| Oreochromis niloticus * | + | + | + | + | + | + | + | + | + | + | + | + | + | + | ||
| Oreochromis tanganicae | + | + | + | + | + | + | + | + | + | |||||||
| Oreochromis sp. | + | + | + | + | + | + | + | + | + | + | + | |||||
| Cypriniformes | ||||||||||||||||
| Acheilognathidae | ||||||||||||||||
| Acheilognathus macropterus * | + | + | + | + | ||||||||||||
| Cyprinidae | ||||||||||||||||
| Ancherythroculter wangi | + | + | + | + | + | + | + | + | + | + | + | + | + | |||
| Barbonymus schwanefeldii | + | + | ||||||||||||||
| Carassius gibelio | + | + | + | + | + | + | + | + | + | + | + | + | + | + | + | + |
| Chanodichthys erythropterus * | + | + | + | |||||||||||||
| Ctenopharyngodon idella * | + | + | + | + | + | + | + | + | + | + | + | + | + | + | + | + |
| Culter alburnus * | + | + | + | + | + | + | + | + | + | + | + | + | + | + | ||
| Cyprinus carpio * | + | + | + | + | + | + | + | + | + | + | + | + | + | + | + | + |
| Hemiculter leucisculus * | + | + | + | + | + | + | + | + | + | + | + | |||||
| Hemiculter tchangi | + | + | + | + | + | + | + | + | + | + | + | + | + | + | + | + |
| Hemiculterella macrolepis | + | + | + | + | + | + | + | + | + | |||||||
| Hypophthalmichthys molitrix * | + | + | + | + | ||||||||||||
| Hypophthalmichthys nobilis * | + | + | + | + | + | + | + | + | + | + | + | + | + | + | + | |
| Osteochilus salsburyi * | + | + | + | + | + | + | + | + | + | |||||||
| Parabramis pekinensis * | + | + | + | |||||||||||||
| Procypris rabaudi | + | + | + | |||||||||||||
| Squalidus argentatus * | + | + | + | |||||||||||||
| Squaliobarbus curriculus * | + | + | + | + | + | + | + | + | + | |||||||
| Spinibarbus sinensis | + | + | + | + | + | + | ||||||||||
| Xenocypris davidi * | + | + | + | |||||||||||||
| Gobiiformes | ||||||||||||||||
| Gobiidae | ||||||||||||||||
| Rhinogobius similis | + | + | + | |||||||||||||
| Salmoniformes | ||||||||||||||||
| Salmonidae | ||||||||||||||||
| Prosopium coulterii | + | + | + | + | ||||||||||||
| Siluriformes | ||||||||||||||||
| Auchenipteridae | ||||||||||||||||
| Tatia intermedia | + | + | + | + | + | + | + | + | + | + | + | + | + | + | + | + |
| Bagridae | ||||||||||||||||
| Hemibagrus macropterus * | + | + | + | + | + | + | ||||||||||
| Pseudobagrus crassilabris * | + | + | + | + | + | + | + | + | + | + | + | + | ||||
| Pseudobagrus medianalis | + | + | + | + | + | + | + | + | + | |||||||
| Pseudobagrus ondon | + | + | + | + | + | + | + | + | + | + | + | + | + | |||
| Pseudobagrus pratti | + | + | + | + | + | + | + | + | + | + | ||||||
| Tachysurus fulvidraco * | + | + | + | + | + | + | + | + | + | + | + | + | + | + | + | + |
| Clariidae | ||||||||||||||||
| Clarias gariepinus * | + | + | + | + | + | + | + | + | + | + | + | + | ||||
| Siluridae | ||||||||||||||||
| Silurus soldatovi | + | + | + |
Table 3.
PERMANOVA on fish composition in different section data sets.
| df | SS | MS | F | R2 | p-Value | |
|---|---|---|---|---|---|---|
| Group | 2 | 0.64 | 0.32 | 1.70 | 0.22 | 0.009 |
| Residuals | 12 | 2.27 | 0.19 | 0.78 | ||
| Total | 14 | 2.90 | 1 |
Disclaimer/Publisher’s Note: The statements, opinions and data contained in all publications are solely those of the individual author(s) and contributor(s) and not of MDPI and/or the editor(s). MDPI and/or the editor(s) disclaim responsibility for any injury to people or property resulting from any ideas, methods, instructions or products referred to in the content. |
© 2022 by the authors. Licensee MDPI, Basel, Switzerland. This article is an open access article distributed under the terms and conditions of the Creative Commons Attribution (CC BY) license (https://creativecommons.org/licenses/by/4.0/).
Share and Cite
MDPI and ACS Style
Xu, L.; Yang, D.; Wang, Y.; Li, J.; Guo, X.; Zeng, C.; Jiang, H.; An, M.; Shao, J. Environmental DNA Captures Variations in Fish Assemblages with Distance from Dams in Karst Reservoirs. Water 2023, 15, 73. https://doi.org/10.3390/w15010073
AMA Style
Xu L, Yang D, Wang Y, Li J, Guo X, Zeng C, Jiang H, An M, Shao J. Environmental DNA Captures Variations in Fish Assemblages with Distance from Dams in Karst Reservoirs. Water. 2023; 15(1):73. https://doi.org/10.3390/w15010073
Chicago/Turabian StyleXu, Longfei, Dandan Yang, Yizhou Wang, Junyi Li, Xingchen Guo, Cong Zeng, Haibo Jiang, Miao An, and Jian Shao. 2023. "Environmental DNA Captures Variations in Fish Assemblages with Distance from Dams in Karst Reservoirs" Water 15, no. 1: 73. https://doi.org/10.3390/w15010073
Note that from the first issue of 2016, this journal uses article numbers instead of page numbers. See further details here.