Article

The Species Structure of Plankton Communities as a Response to Changes in the Trophic Gradient of the Mouth Areas of Large Tributaries to a Lowland Reservoir

1
Laboratory of Water Ecosystems, Department of Ecology, Institute of Biology and Biomedicine, Lobachevsky State University, 603022 Nizhny Novgorod, Russia
2
Department of Hydrology, Faculty of Geography, Lomonosov Moscow State University, 119991 Moscow, Russia
3
Department of Botany and Zoology, Institute of Biology and Biomedicine, Lobachevsky State University, 603022 Nizhny Novgorod, Russia
*
Author to whom correspondence should be addressed.
Water 2023, 15(1), 74; https://doi.org/10.3390/w15010074
Submission received: 15 November 2022 / Revised: 14 December 2022 / Accepted: 22 December 2022 / Published: 26 December 2022
(This article belongs to the Special Issue Water Resources under Growing Anthropogenic Loads)

Abstract

:
The mouth areas of large rivers can serve as a good model of heterogeneity sites with a pronounced trophic gradient to assess the impact of the degree of eutrophication on different plankton communities. The aim of this research was to identify the possible response of the diversity indicators of phyto- and zooplankton communities to trophic gradients in the mouth area of two large tributaries of the reservoir, formed in the Middle Volga River (Russia). Both linear regression models and canonical correlation analysis (CCA) were used to assess the role of abiotic and biotic predictors in the structural organization of plankton communities and to assess the changes in the parameters of the species plankton community structure in the trophic gradient. It was found that the species diversity (Adjusted R2 = 0.116) and evenness (Adjusted R2 = 0.114) of phytoplankton significantly decreased with an increase in the degree of eutrophication, while the species diversity (Adjusted R2 = 0.059) and evenness (Adjusted R2 = 0.073) of zooplankton increased. According to the CCA models, electrical conductivity (EC) explained the largest proportion of the observed dispersion. The Trophic State Index (TSI) explained 3.0% of the total variance in the phytoplankton community species structure and 7.8% in the zooplankton one. The variation in phyto- and zooplankton dominant complexes generally corresponded to the well-known patterns of plankton species succession in the gradient of trophic conditions and can be considered as a classic manifestation of the cascade effect in the food chains of freshwater plankton communities. Our results highlight the necessity of studying the mouth river areas, as well as applying an integrated approach to investigating the response of plankton communities to eutrophication processes of continental water bodies.

1. Introduction

Rivers, especially their estuarine or mouth areas, are important parts of hydrological systems due to their practical importance for human development as well as their ability to maintain a high biodiversity of aquatic living organisms [1]. Industrial progress and human activities within the catchment area contribute to the pollution of large rivers and increase the loading of high concentrations of organic and inorganic substances, accelerating the eutrophication processes of both the rivers themselves and their receiving water bodies, affecting the biological organization, and driving the changes in biodiversity of aquatic communities [2,3]. Biodiversity is directly related to ecosystem functioning and nutrient cycling [4]. It has been shown that river eutrophication can be provided not only by nutrient enrichment, but also by multiple factors, such as water exchange, climate changes, biological invasions, and human manipulation of hydrological conditions [5,6,7,8].
The assessment of the eutrophication impact on the plankton community structure, species diversity of aquatic organisms and their spatial distribution was considered for the longitudinal profiles of rivers, large lakes and reservoirs [9,10,11,12,13,14,15,16,17,18,19]. In such studies, the boundary zones of aquatic ecosystems are of particular interest. They are characterized by strong gradients in environmental variables (mineralization, nutrient content, etc.) as a result of river discharge [20]. To date, the main studies of transition zones have been carried out at the confluence of marine and continental waters [21,22]. However, the role of marginal zones in freshwater ecosystems is also undoubted, particularly in the mouth areas of tributaries of different water bodies (lakes, reservoirs) [23,24]. The river mouth areas can be considered as biological funds for lowland reservoirs, where environmental heterogeneity constitutes essential conditions for maintaining plankton species diversity and numerical variability. This effect is caused by the mixing of several types of habitats with significantly different ecological properties [25] and is regarded as the most important ecological factor [26,27].
Among the important tasks of modern research are the determination of trends in the eutrophication process in water ecosystems and the possible response to them by the main indicators of biotic communities, in particular, phyto- and zooplankton. Estuary zones with a trophic condition gradient can serve as model ecosystems to study how plankton communities respond to nutrient variation. It is known that oligotrophic and mesotrophic conditions are characterized by reduced food availability at the base of the food web. In contrast, eutrophic conditions provide an increase in the availability of food resources and, consequently, an increase in productivity [28]. It has been shown that the reaction to climate warming will be more noticeable and stronger in nutrient-rich ecosystems, while the phyto-and zooplankton communities’ response to changing habitat conditions can a trigger a restructuring of the total freshwater ecosystem [29]. Thus, according to Jeppesen et al. [30], eutrophication has a positive effect on zooplankton biomass but a negative effect on species richness, as well as the size of organisms. Large cladocerans are replaced by copepodite stages and rotifers, which is typical for nutrient-rich water ecosystems. In nutrient-deficient water bodies, the opposite is observed;a there is an increase in biodiversity and a reduction in the development of zooplankton species [31,32]. Among the changes in the phytoplankton community structure caused by eutrophication are notable algae development values (abundance, biomass) and a predominance of “r”-selective species which are small in size and have a high growth rate [33,34,35]. In addition, it has been shown that, despite their regional, latitudinal, altitudinal, and climatic differences, eutrophication contributes to the dominance of cyanobacteria in most of the studied lakes and reservoirs, mainly represented by species of the genera Microcystis, Anabaena, Planktothrix, Oscillatoria, and Cylindrospermopsis [36,37,38]. In river systems, in combination with changes to the hydrological conditions, mixotrophic phytoflagellates from different taxonomical groups also prevail [35].
The eutrophication of water bodies also leads to significant changes in the biodiversity of planktonic aquatic communities [7,38,39]. Theoretical models predict that eutrophication increases the biodiversity in nutrient-poor water bodies but reduces the biodiversity of aquatic organisms in nutrient-rich ones [39]. However, this trend may vary depending on various factors (types of biological groups, the study scale, local geological and climatic factors). Carlson’s Trophic State Index (TSI) is a common method for characterizing the trophic status of water bodies. This index has proven itself well, and among the calculated partial components of this index, TSITP and TSIChl_a demonstrate the highest reliability [40]. Based on the correlation analysis between the TSI and indicators of the plankton community diversity (Shannon index, Margalef index, Simpson index, Pielou index), the possibility of using these indices for assessing the trophic state in lakes, rivers and reservoirs has been demonstrated [10,39,40,41,42].
The aim of our study was to find out how the diversity indicators of phyto- and zooplankton communities change in the trophic status gradient (according to the TSI index) in the river mouth area of a lowland reservoir, using the Cheboksary Reservoir tributaries as an example.

2. Materials and Methods
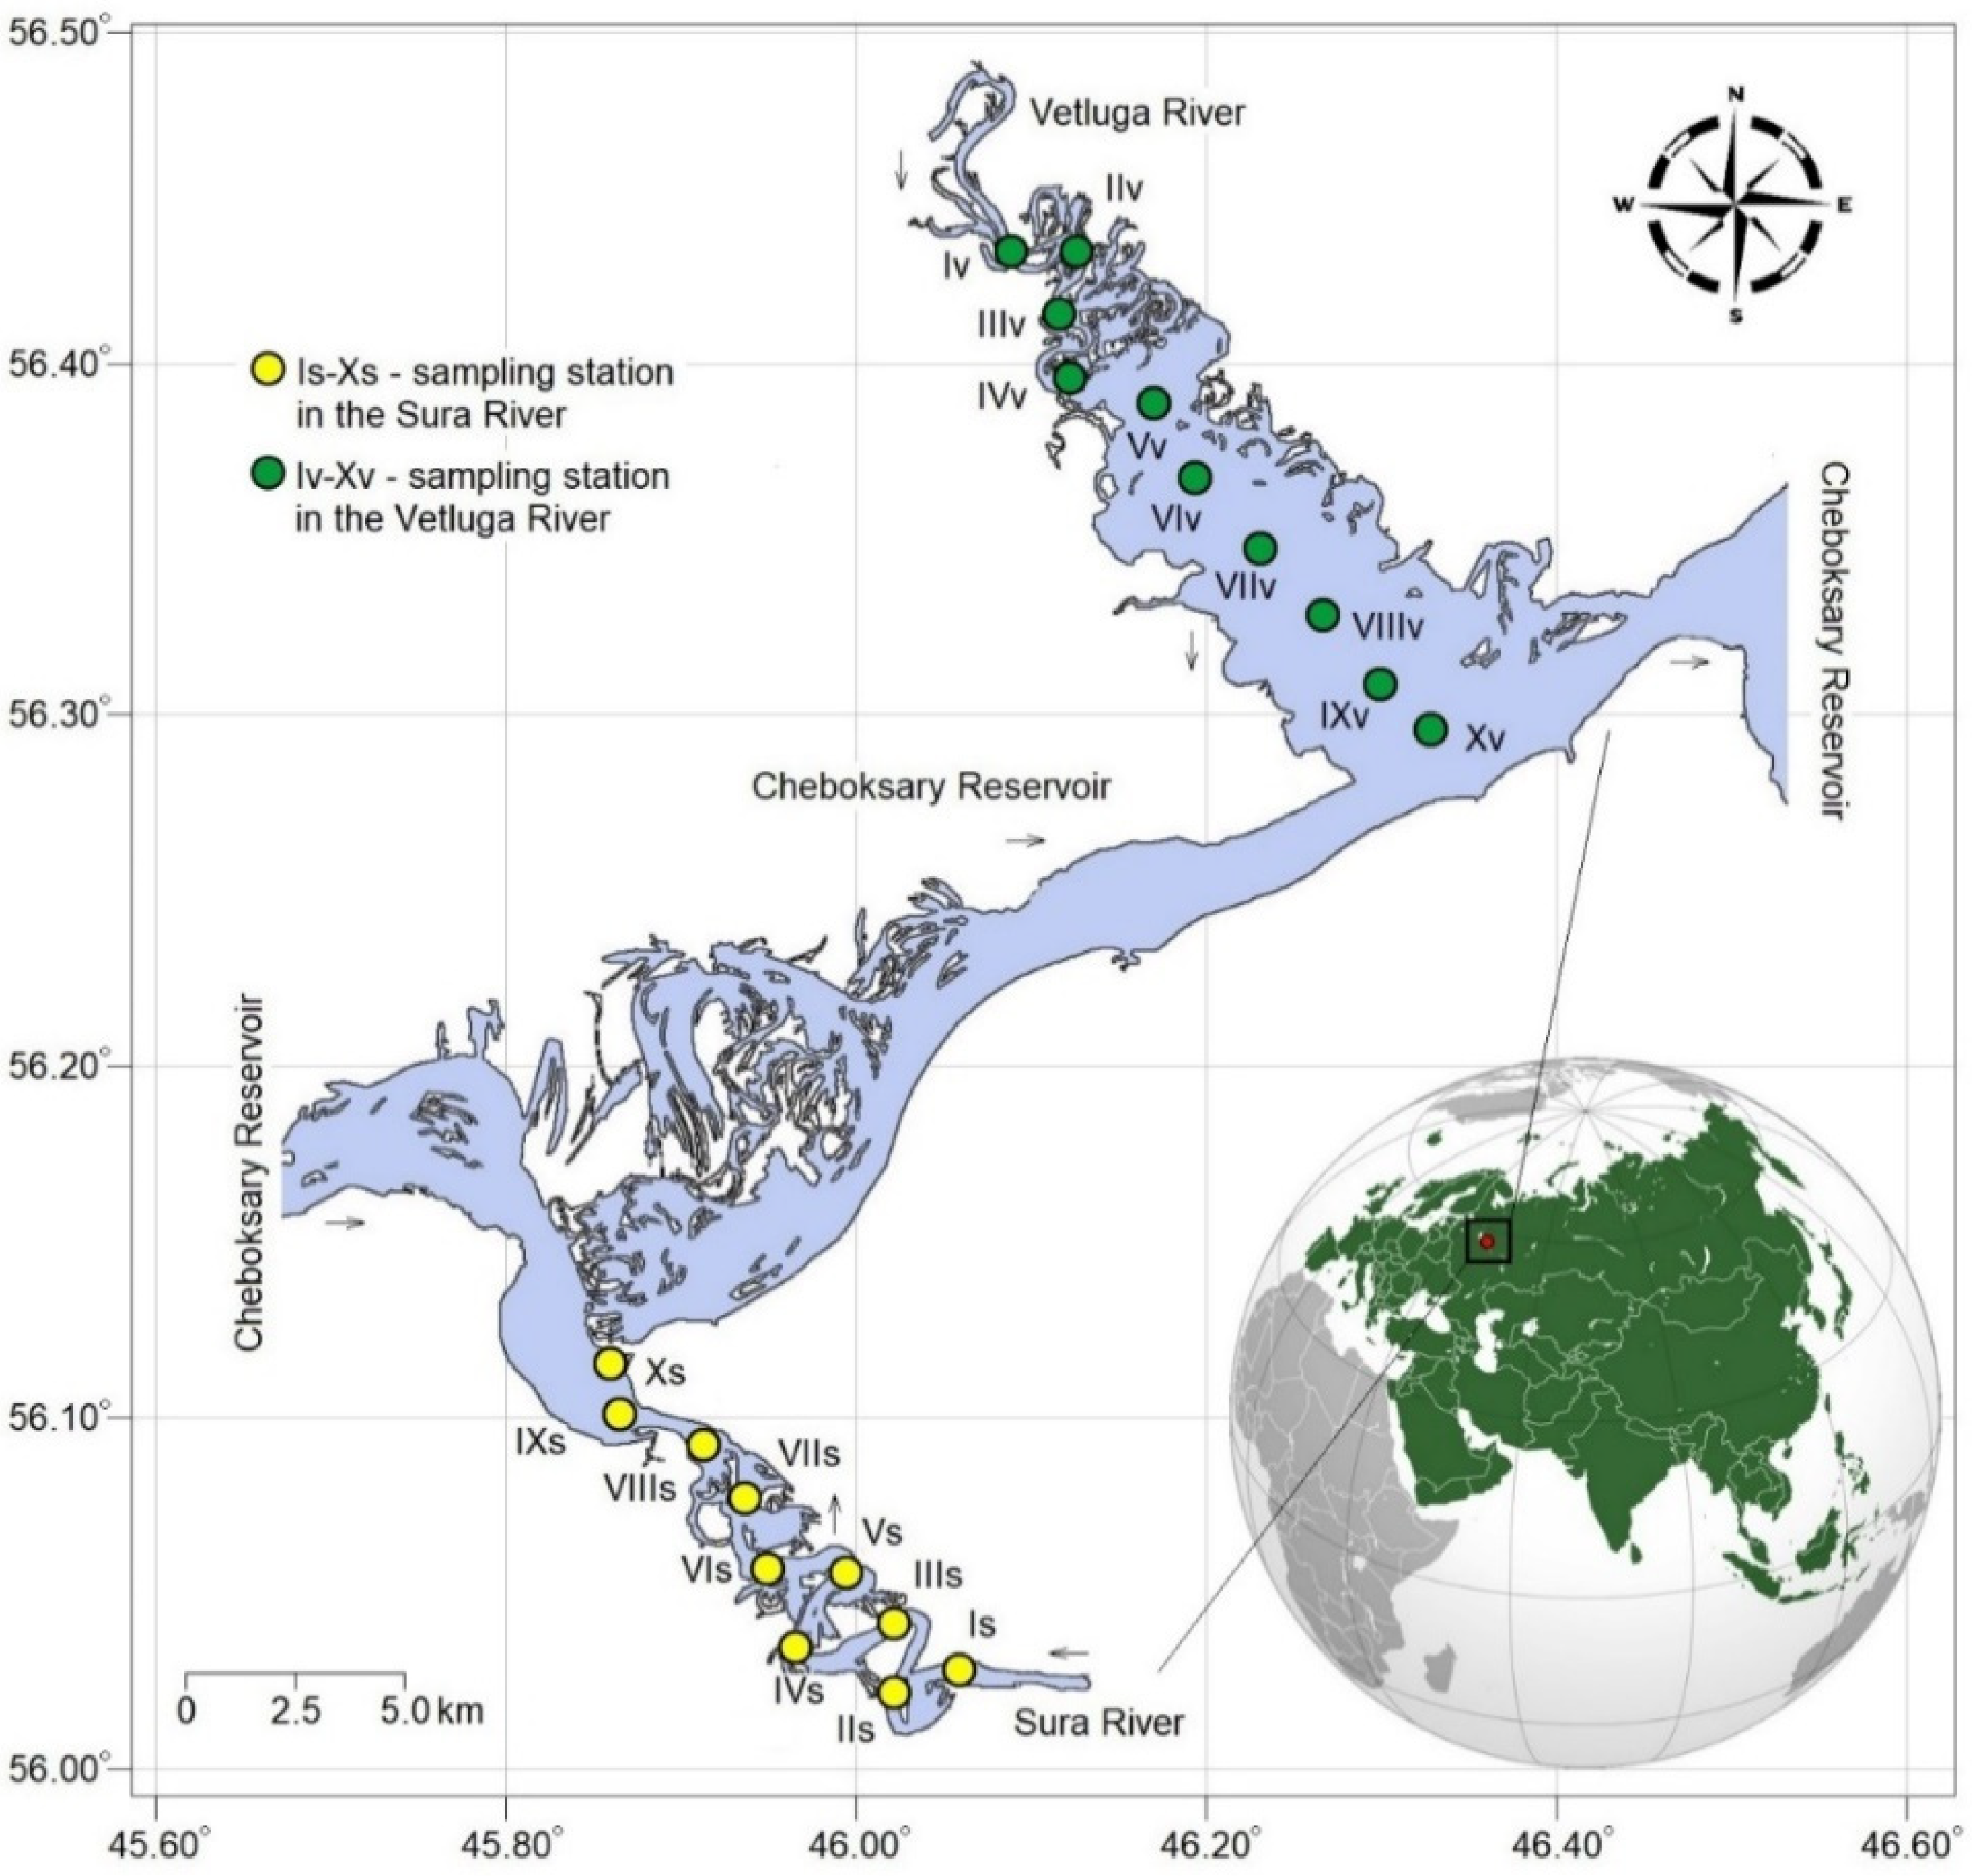
2.1. Study Area

We investigated phytoplankton and zooplankton communities in the mouth areas of the Sura and the Vetluga rivers. Both rivers are tributaries of the lowland Cheboksary Reservoir formed in the Volga riverbed (Figure 1). The Cheboksary Reservoir is located within the Middle Volga basin (Russia) and is characterized by the highest degree of lateral inflow among the reservoirs of the Volga cascade. The studied rivers are among the largest tributaries of the Cheboksary Reservoir. These tributaries are localized in close proximity to each other, so they can be used as good model objects for research. These tributaries also have a unique geographical position: along the Vetluga and the Sura riverbeds (46 E°) there is a climatic boundary of direct Atlantic influence with a further increase in climate continentality. It was partially filled in the period from 1980 to 1982. Currently, the reservoir is unfinished, functioning at an intermediate elevation of 63 m above sea level. The length of the reservoir is 341 km, the average depth is 4.7 m, and the water exchange coefficient is 20.9 (the maximum of all Volga River reservoirs) [43].
The Sura River is a large, typically flat river with a low flow rate. Its length is 841 km, the catchment area is 67,500 km2, and the average water discharge in the mouth area is 260 m3/s. The river is navigable downstream. The Vetluga River is a slow-flowing large river. Its length is 889 km, the catchment area is 39,400 km2, and the average water discharge in the mouth area is 255 m3/s. There are many oxbow lakes within its floodplain.

2.2. Sample Collection and Environmental Indicators

Phytoplankton and zooplankton samples were collected from the mouths of the Sura and Vetluga rivers. At each mouth, 10 stations (in total, 20 stations) were set up at a distance of 1 km from each other, spanning from free-flowing parts of the rivers through transition zones and down to the river–reservoir mixing zone [44]. Thus, at least 3 stations were laid in each zone, and one additional station was located as close as possible to the reservoir. Our research was carried out over a period of three years (2019, 2020, 2021). We collected the samples in the middle of the summer (the last ten days of July (2019, 2021) or the first ten days of August (2020), during the summer low water period. A total of 120 samples (60 zooplankton and 60 phytoplankton samples) were collected (40 samples per year). At sampling stations with depths greater than 3 m, zooplankton were collected by dragging a plankton net (70 µm mesh) from the bottom to the water surface, and at sites with depths less than 3 m, 150 L of water was filtered through the net (from three depths, using a Van Dorn bottle; volume, 6 L). The volume of water filtered through the network was calculated according to the standard formula for calculating the volume of the cylinder, using the diameter of the inlet of the network and the height of the water column (in this case, the depth of the station). Thus, the volume of water filtered through the network was calculated. Then we determined the abundance and biomass of zooplankton in this volume. The obtained values of zooplankton abundance and biomass were recalculated per 1 m3, thus standardizing the obtained data. Samples were fixed with 4% formaldehyde and labeled. Integrated phytoplankton samples were collected with a Ruttner water sampler (volume, 5 L) and preserved with an iodine–formaldehyde solution.
Environmental parameters were recorded at each sampling station. Water transparency (SD, m) was measured using a Secchi disk. The concentration of dissolved oxygen in the water (DO, mg/L), pH (pH), electrical conductivity (EC, µS/cm), water temperature (WT, °C) and concentration of chlorophyll-a pigment (Chl-a, mg/L) were measured with multi-parameter hydrochemical probes ProODO and ProDSS (YSI Inc., Rye Brook, New York, NY, USA). The content of total phosphorus (TP, μg/L) in the water was determined by photometric methods. The concentration of total phosphorus in the samples was determined by the Murphy–Riley method and the mineralization of all forms of phosphorus to phosphates was carried out under the influence of ammonium persulfate when the sample was heated [45].
All collected samples were stored in the collection of the Laboratory of Water Ecosystems, Department of Ecology, Institute of Biology and Biomedicine, Lobachevsky State University (Nizhny Novgorod, Russia).

2.3. Species Identification

Qualitative determination of phytoplankton species was performed based on morphology. Today, the optical method of phytoplankton analysis continues to be the principal approach in the ecological monitoring of water quality, despite some limitations [46,47]. We examined phytoplankton species under a MEIJI Techno (Saitama, Japan) optical microscope equipped with an oil immersion objective at magnifications of 200x, 400x, and 1000x. A list of guides used for species identification as well as descriptions of methods for concentrating phytoplankton samples were presented in a previous paper [48]. The current names of taxa were also checked using the AlgaeBase website (algaebase.org, accessed on 29 July 2021) [49]. Quantification of the phytoplankton abundance was made using a 0.01 mL Najott chamber where a fixed number of randomly chosen fields were counted. The unit of count was the algae cell. Individual cells (20 to 30 representatives) were measured and, after approximation to geometrical form, the biovolume of each measured cell was calculated [50]. By multiplying the population size of each taxon by the median volume of its cells, the biovolume was calculated and converted to biomass, assuming the density of the cells to be 1 g/mL. The biomass value was obtained as g/m3 that corresponds to mg/L.
The zooplankton specimens were examined microscopically using a Zeiss Stemi 2000 C stereomicroscope, and detailed morphological analysis was performed using a Zeiss Primo Star light microscope. The identification of zooplankton species was carried out in accordance with modern taxonomic guidelines [51,52,53,54] and guides [55,56,57,58,59]. All zooplankton taxa were identified and standardized to number of individuals per m3.

2.4. Trophic State Index (TSI) and Data Analysis

The comprehensive Trophic State Index (TSI) was used to describe the trophic status. The TSI was calculated according to the improved Carlson TSI formula using the concentration of chlorophyll-a (Chl_a) and total phosphorus (TP) [60,61]. As the water transparency indicator in rivers is often limited by the depth of the river channel, TSISD can introduce noticeable heterogeneity into the average TSI value. As a result, it was decided not to use TSISD for calculations. The TSI of each variable and weighted sum of TSI were established using the following formulas:
TSIChl_a = 10 × (2.5 + 1.086 × ln (Chl_a))
TSITP = 10 × (9.436 + 1.624 × ln (TP))
The final TSI value was calculated as the average of TSIChl_a and TSITP. The trophic status partition criterion was based on the TSI scores: oligotrophic, TSI < 30; mesotrophic, 30 ≤ TSI ≤ 50; slightly eutrophic, 50 < TSI ≤ 60; medium eutrophic, 60 < TSI ≤ 70; and highly eutrophic, TSI > 70.
The authors analyzed such parameters of the phytoplankton and zooplankton communities as follows: abundance (Nphyto (106 cells/L) and Nzoo (ind./m3), respectively), biomass (g/m3), species richness (species number in one sample) and average individual body weight estimated as B/N (mg). Phytoplankton and zooplankton alpha diversity indices were evaluated using Shannon’s Diversity Index and Pielou’s Evenness Index [62].
Linear regression models were conducted to test the effects of the trophic state index on plankton diversity indices, species richness and average individual body weight of organisms. The assumptions of the regression analysis, normality and homogeneity of variance were initially verified using the Shapiro–Wilk and Levene tests, respectively [62]. Linear regression models were verified using ANOVA. Canonical Correspondence Analysis (CCA) was used to test the correlation between the TSI and structural parameters of the plankton communities. CCA is the constrained form of correspondence analysis (CA) and therefore is preferred for most ecological data sets. It focuses more on relative abundance and better fits our goal to study the species structure rather than absolute abundances [63]. The significances of the CCA models were verified with a permutation test (1000 permutations). All the analyses were performed using the R open-source software [64] and applying the package “vegan” [65].

3. Results

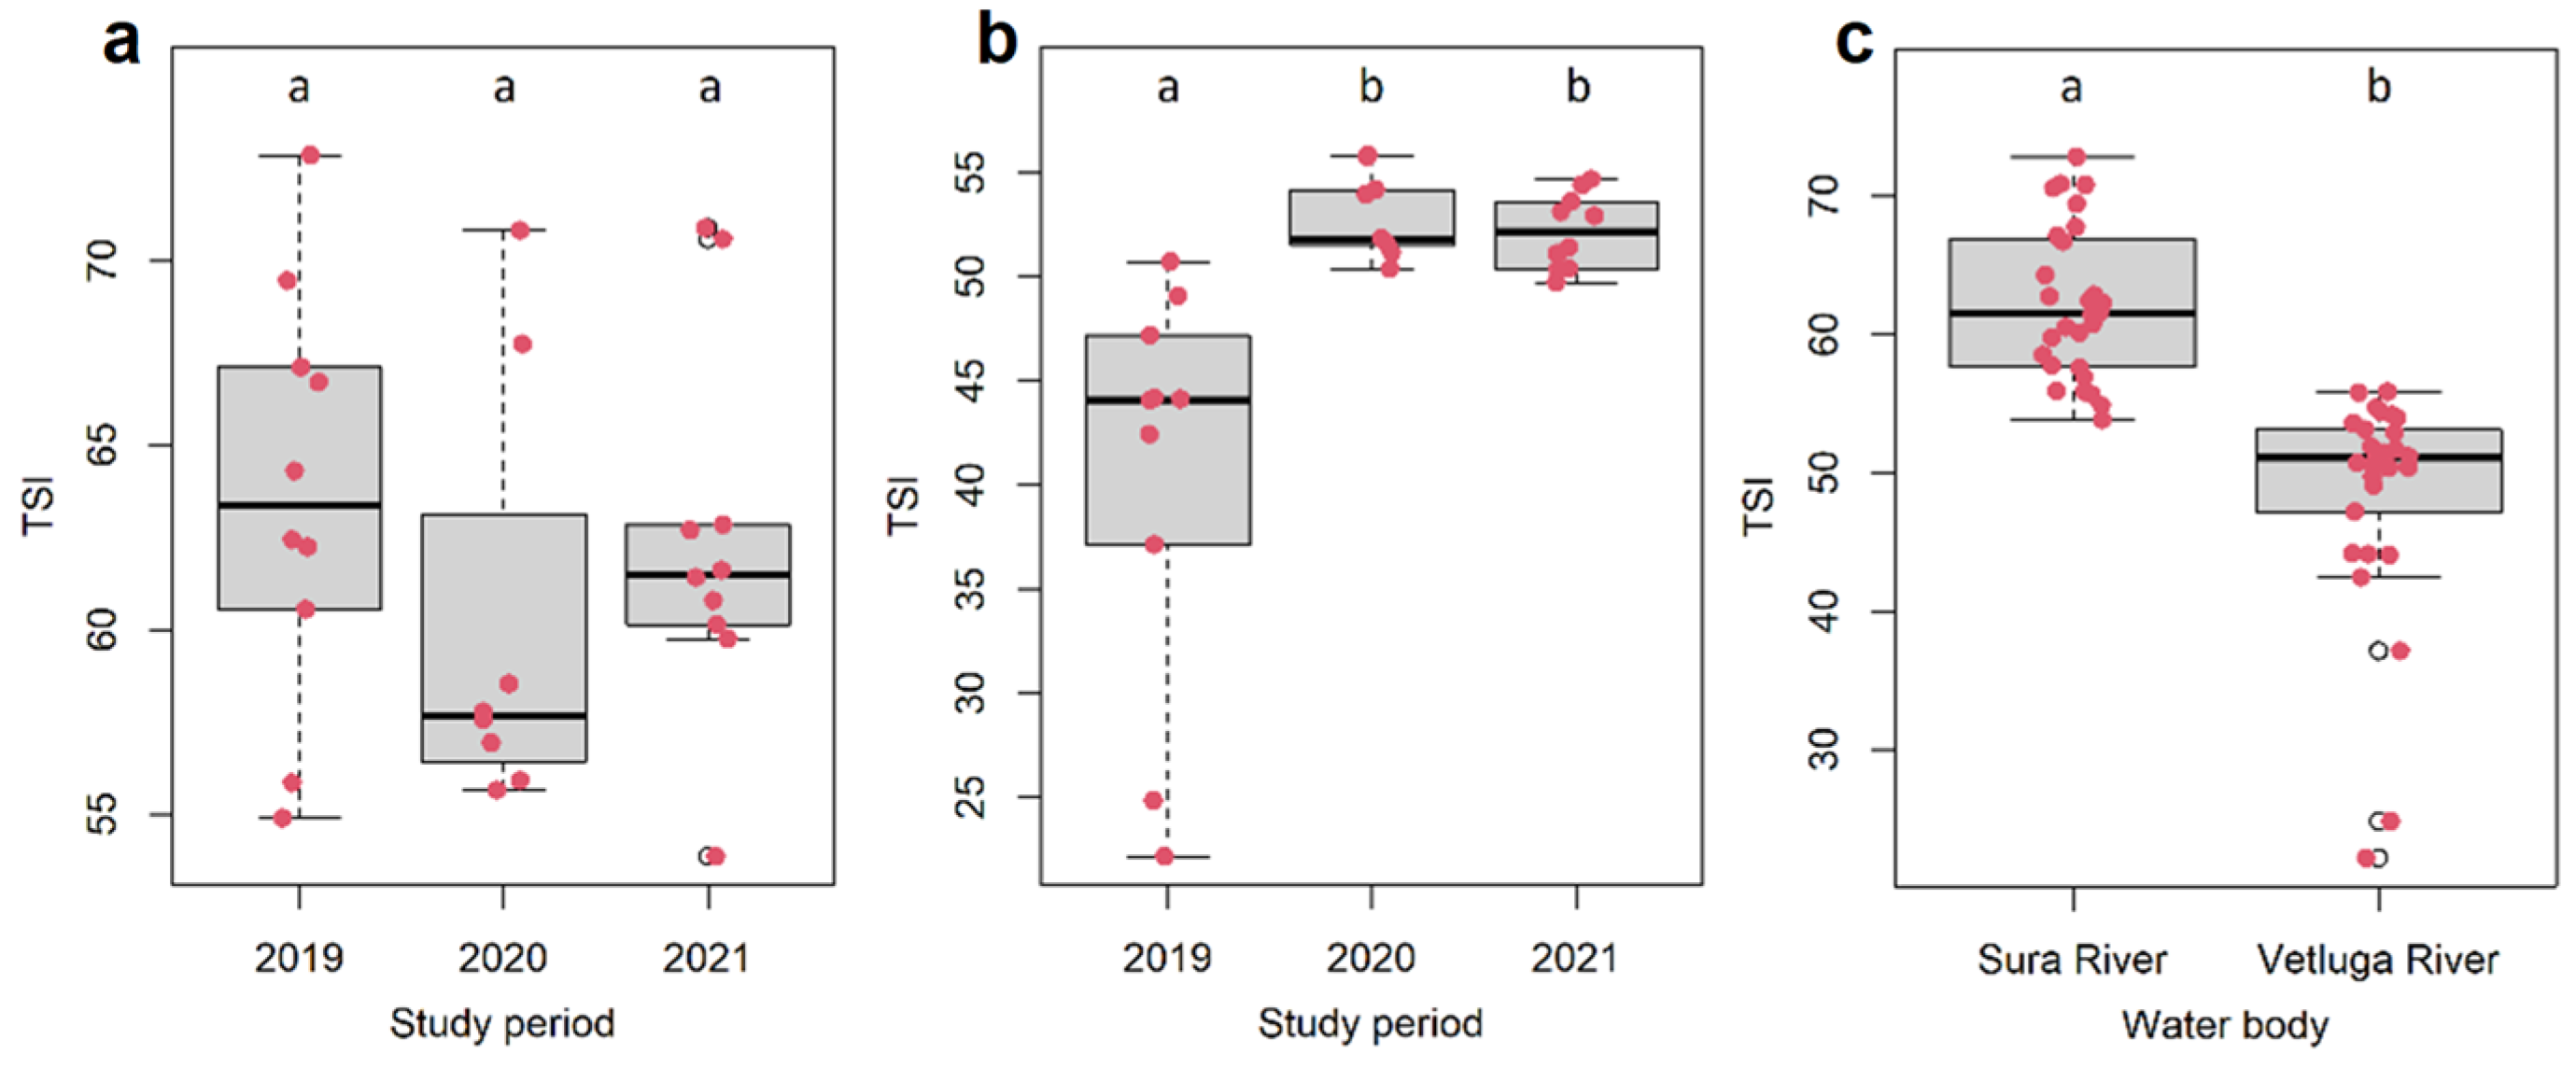
3.1. Environmental Indicators and Trophic State Index (TSI) Values

Analysis of ecological parameters allowed us to establish their appreciable differences between the rivers, as well as some inter-annual regularities (Table 1). The values of electrical conductivity in the mouth area of the Sura River were significantly higher than in the mouth area of the Vetluga River (Table 1). Dissolved oxygen concentrations in the Sura River estuary varied over a wide range from 2.2 mg/L (2020) to 13.8 mg/L (2019). The changes in oxygen concentration in the Vetluga River mouth region were less significant, ranging from 6.97 mg/L (2021) to 9.67 (2020). Hydrogen values at most stations were above 8.0, and maximum values (up to 9.56) were recorded in the Sura River mouth area in 2019. Water temperatures in 2019 and 2020 differed slightly in both estuaries (Table 1). A marked increase in the water temperature of the studied rivers was observed in 2021 (Table 1) when there was a temperature maximum of 27.4 °C in the Vetluga River mouth area and 24.9 °C in the Sura River. The content of chlorophyll-a pigment and total phosphorus was higher in the mouth area of the Sura River (Table 1), and the maximum values of chlorophyll-a (37.4 mg/L) and total phosphorus (0.45 µg/L) were noted here in 2019. The values of water transparency in the studied rivers varied over a small range (Table 1). A trend of increasing electrical conductivity values in both rivers during the study period was found (Table 1). The same pattern was noted for chlorophyll-a content in the Vetluga River mouth area.
The Trophic State Index values were the highest in the Sura River. At 57% of the sampling stations, the trophic status was assessed as medium eutrophic, another 13% of stations were ranked as strongly eutrophic, 27% of stations were ranked as slightly eutrophic, and 3% were ranked as mesotrophic. In general, the trophic status of the Sura River is evaluated as medium eutrophic. No stations with oligotrophic conditions were found. In the Vetluga River waters, most of the stations (70%) were evaluated as slightly eutrophic, 23% of stations as mesotrophic, and 7% as oligotrophic. No stations with medium eutrophic and strongly eutrophic values were found. In general, the trophic status of the Vetluga River is assessed as mesotrophic.

3.2. Taxonomical Structure of Plankton Communities

3.2.1. Phytoplankton Species Composition

The total phytoplankton species richness of the studied rivers was 317 taxa, formed by representatives of 8 taxonomical groups: Chlorophyta (47% of total species list), Bacillariophyta (13%), Cyanobacteria (11%), Euglenozoa (10%), Ochrophyta (9%), Miozoa (5%), Cryptophyta (3%), and Charophyta (2%). For the Vetluga River, the total species list of phytoplankton consisting of 234 taxa belonged to 8 phyla, including Chlorophyta (41% of total species list), Bacillariophyta (16%), Euglenozoa (12%), Cyanobacteria (11%), Ochrophyta (9%), Miozoa (6%), Cryptophyta (3%), and Charophyta (2%). The species composition of phytoplankton in the Sura River turned out to be similar. A total list of 236 taxa were noted, among them Chlorophyta (53%), Bacillariophyta (11%), Cyanobacteria (11%), Euglenozoa (10%), Ochrophyta (8%), and Miozoa (6%), and the proportion of other groups was approximately 1%.
In the species composition of phytoplankton, alien species from the diatoms and dinoflagellates were found. Among them, the dinophytes algae Unruhdinium kevei (Grigorszky et F. Vasas) Gottschling (European species) was found in both tributaries while two species of diatoms (Skeletonema subsalsum (A. Cl.) Bethge (Ponto-Caspian species) and Plagiotropis lepidoptera (W. Gregory) Kuntze) were noted only in the Vetluga River. As for the last representative, the gene bank does not contain accurate information about its possible distribution pathway, and additional research is required.

3.2.2. Zooplankton Species Composition

A total of 126 zooplankton species have been identified, which belong to three taxonomic groups: Rotifera—64 species or 50% of the total list; Cladocera—41 species or 33% of the total list; Copepoda—21 species or 17%. At all sampling stations and in all the rivers studied, nauplius and copepodite stages were found.
In the studied mouth areas, a similar number of zooplankton species was found (Sura River—116; Vetluga River—113). The ratio of zooplankton taxonomic groups was also similar. The rotifer species richness in the mouth area of the Vetluga River was estimated as 60 species; and in the mouth area of the Sura River, 59 species. In the mouth area of the Sura River, the copepods richness was almost 1.5 times more (21 species) than in the mouth area of the Vetluga River (15 species). However, the number of cladoceran species leveled this difference (36 in the Sura River, 38 in the Vetluga River). In the zooplankton of the studied rivers, six alien species were found, most of which are of southern origin (from Asian regions or from the Caspian Sea). The following non-native species were found: transcontinental alien species from North America—the rotifer Kellicottia bostoniensis (Rousselet, 1908) and the copepod Acanthocyclops americanus (Marsh, 1893); tropical alien species—rotifer Keratella tropica (Apstein, 1907) and copepod Thermocyclops taihokuensis Harada, 1931; representatives of the Ponto-Caspian fauna—copepods Eurytemora caspica Sukhikh and Alekseev, 2013; and Eurytemora velox (Lilljeborg, 1853).

3.3. Dominant Taxa

We found that in the mouth areas of the Sura and Vetluga rivers under oligotrophic and mesotrophic conditions, the centric diatoms Aulacoseira subarctica (O. Müll.) E.Y. Haw. and Aulacoseira granulata (Ehrenb.) Simonsen prevailed numerically (Table 2). The contribution of the first one decreased in more eutrophic conditions, while the proportion of A. granulata rose. Under eutrophic conditions (slightly–medium–highly) formed in the Volga backwater zone, cyanobacteria dominated—Aphanocapsa incerta (Lemmermann) G. Cronberg & Komárek; Anabaena spp.; Aphanizomenon flos-aquae Ralfs ex Bornet & Flahault (up to 20% of the total indicators)—due to the development of the trivial species responsible for the “cyanobacterial blooming” in the Volga reservoirs.
Among zooplankton in oligotrophic conditions, rotifers dominated: Synchaeta pectinata Ehrenberg, 1832; Asplanchna priodonta Gosse, 1850; Keratella cochlearis (Gosse, 1851) (Table 3). Under mesotrophic conditions, the leading positions were occupied by nauplius and copepodite stages. Brachionus angularis Gosse, 1851 also appeared in the composition of the dominant complex, and the rotifer A. priodonta retained its presence.
As the eutrophication intensified, the proportion of A. priodonta noticeably decreased, while the proportion of B. angularis increased. Under conditions of medium and highly eutrophic stages, the noticeable components of the dominant complex were cladocerans Daphnia (Daphnia) cucullata Sars, 1862 and Diaphanosoma orghidani Negrea, 1982.

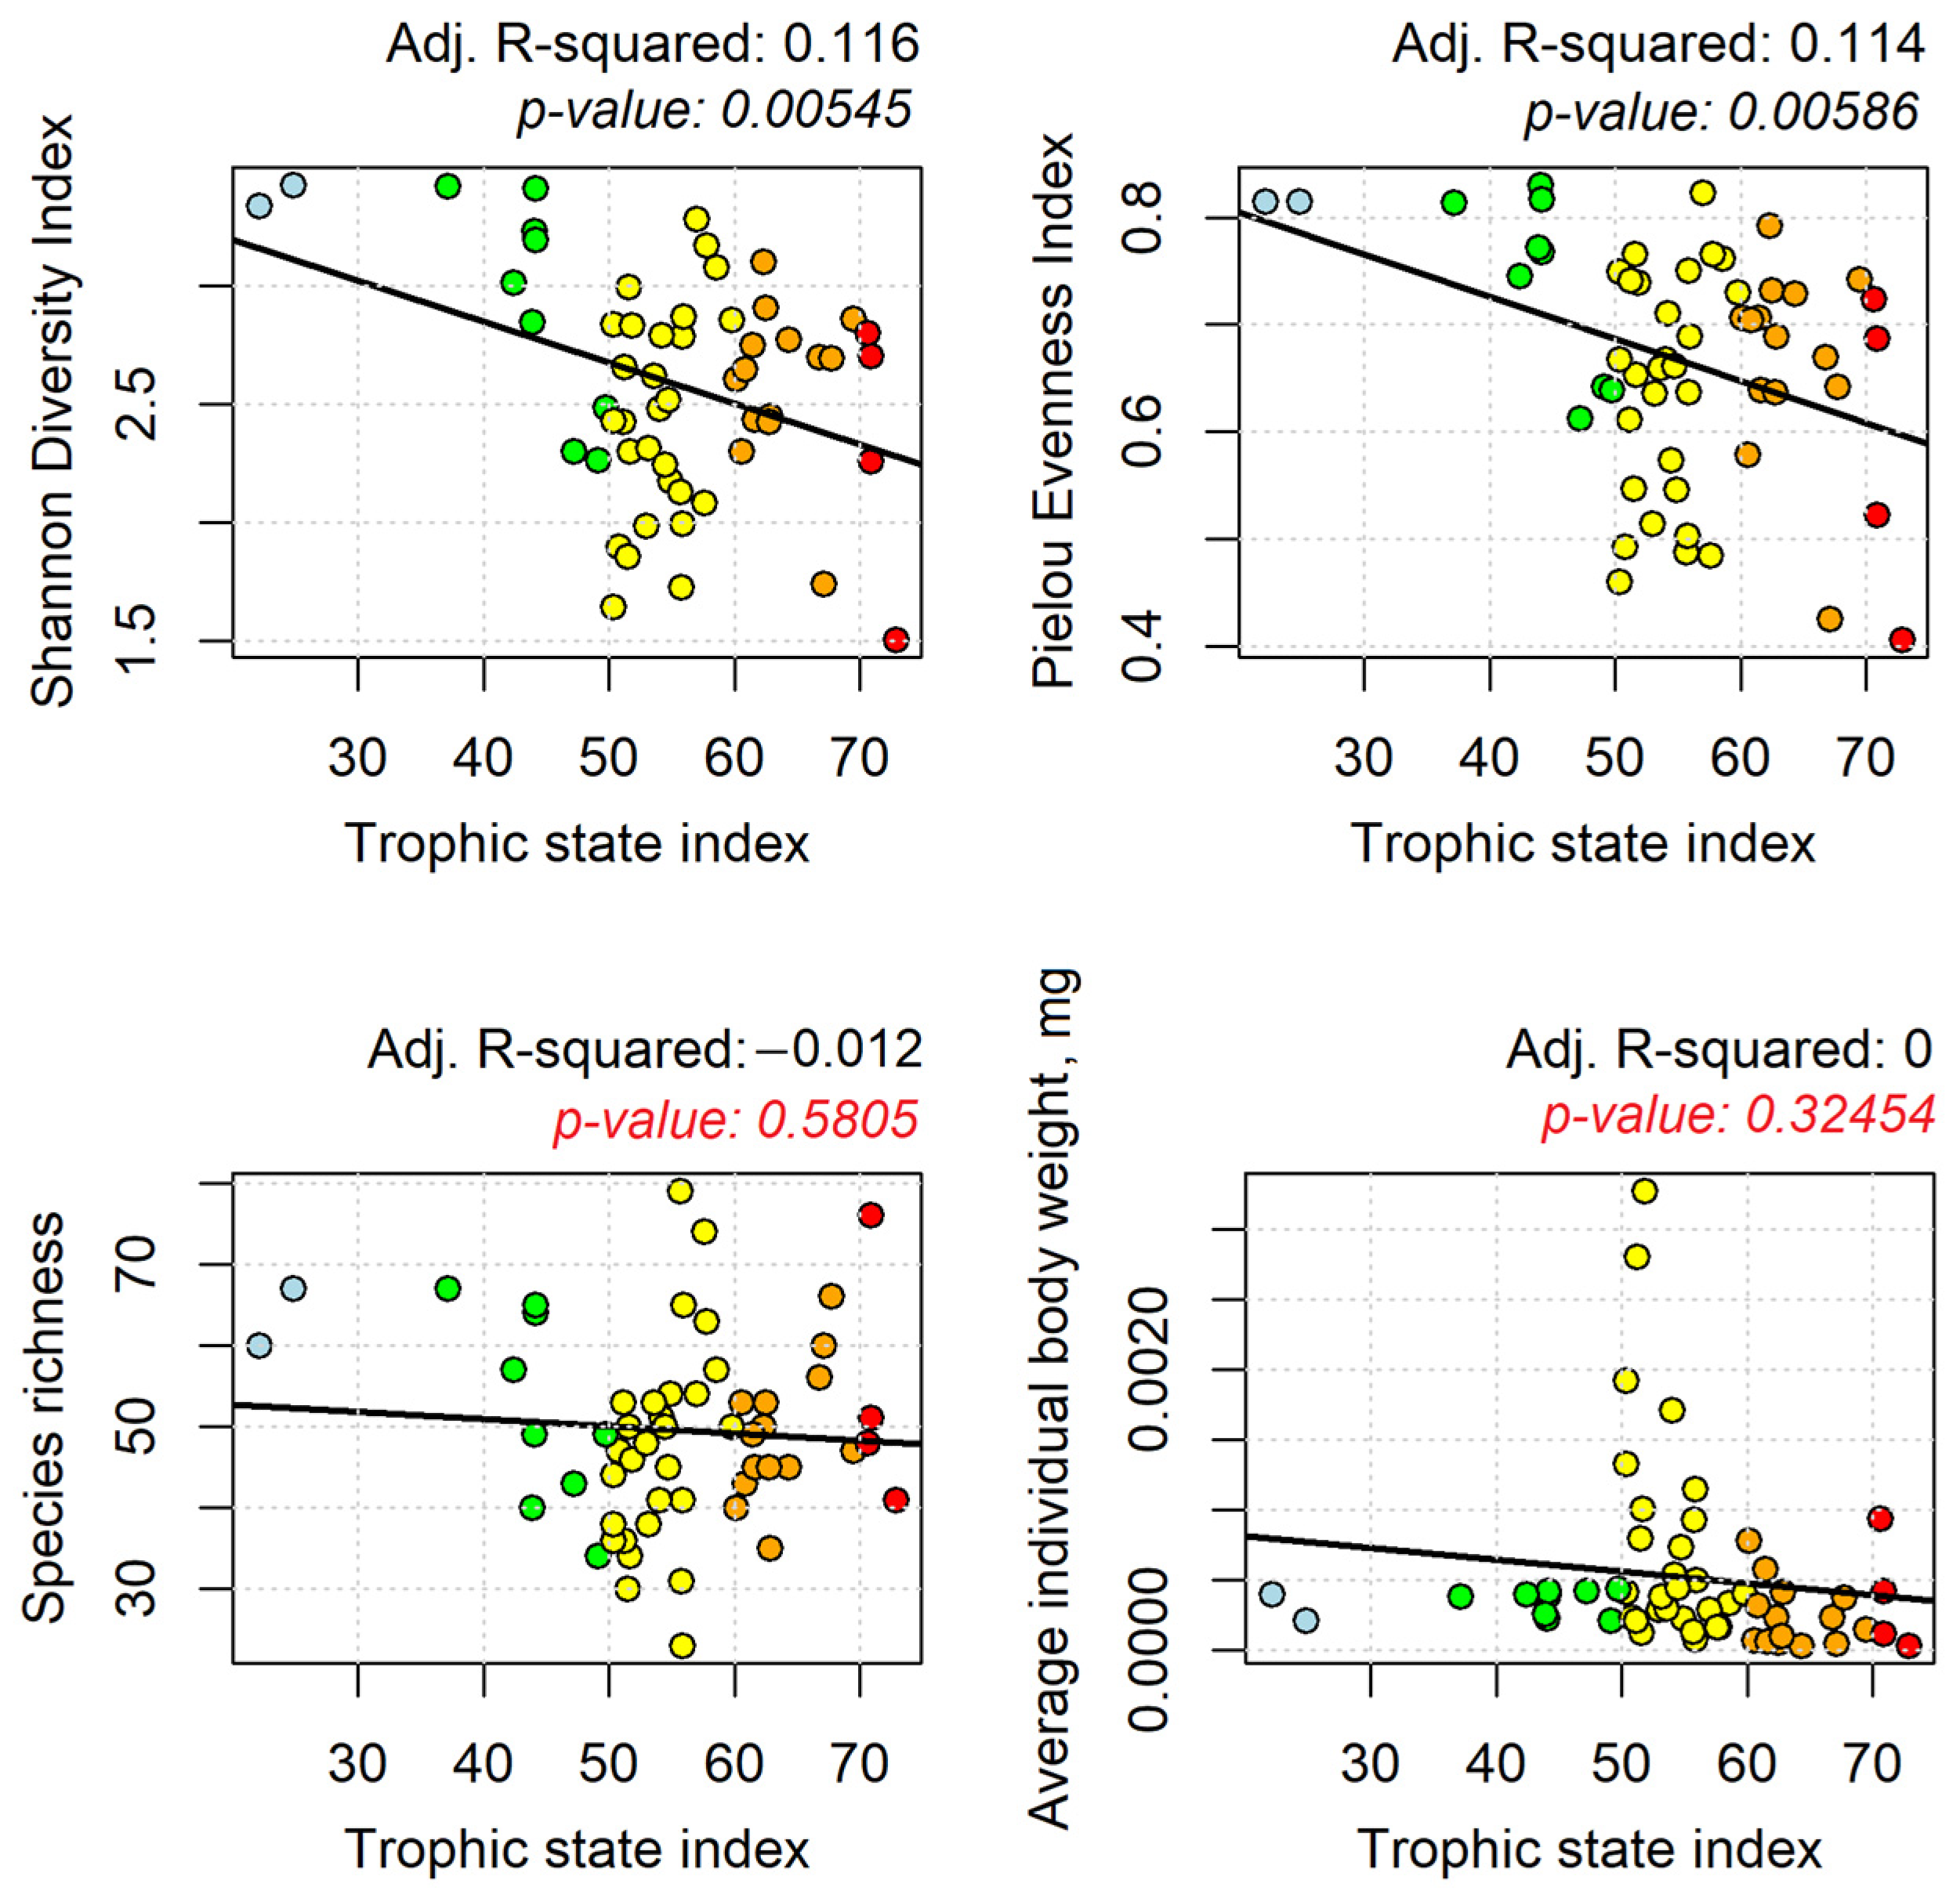
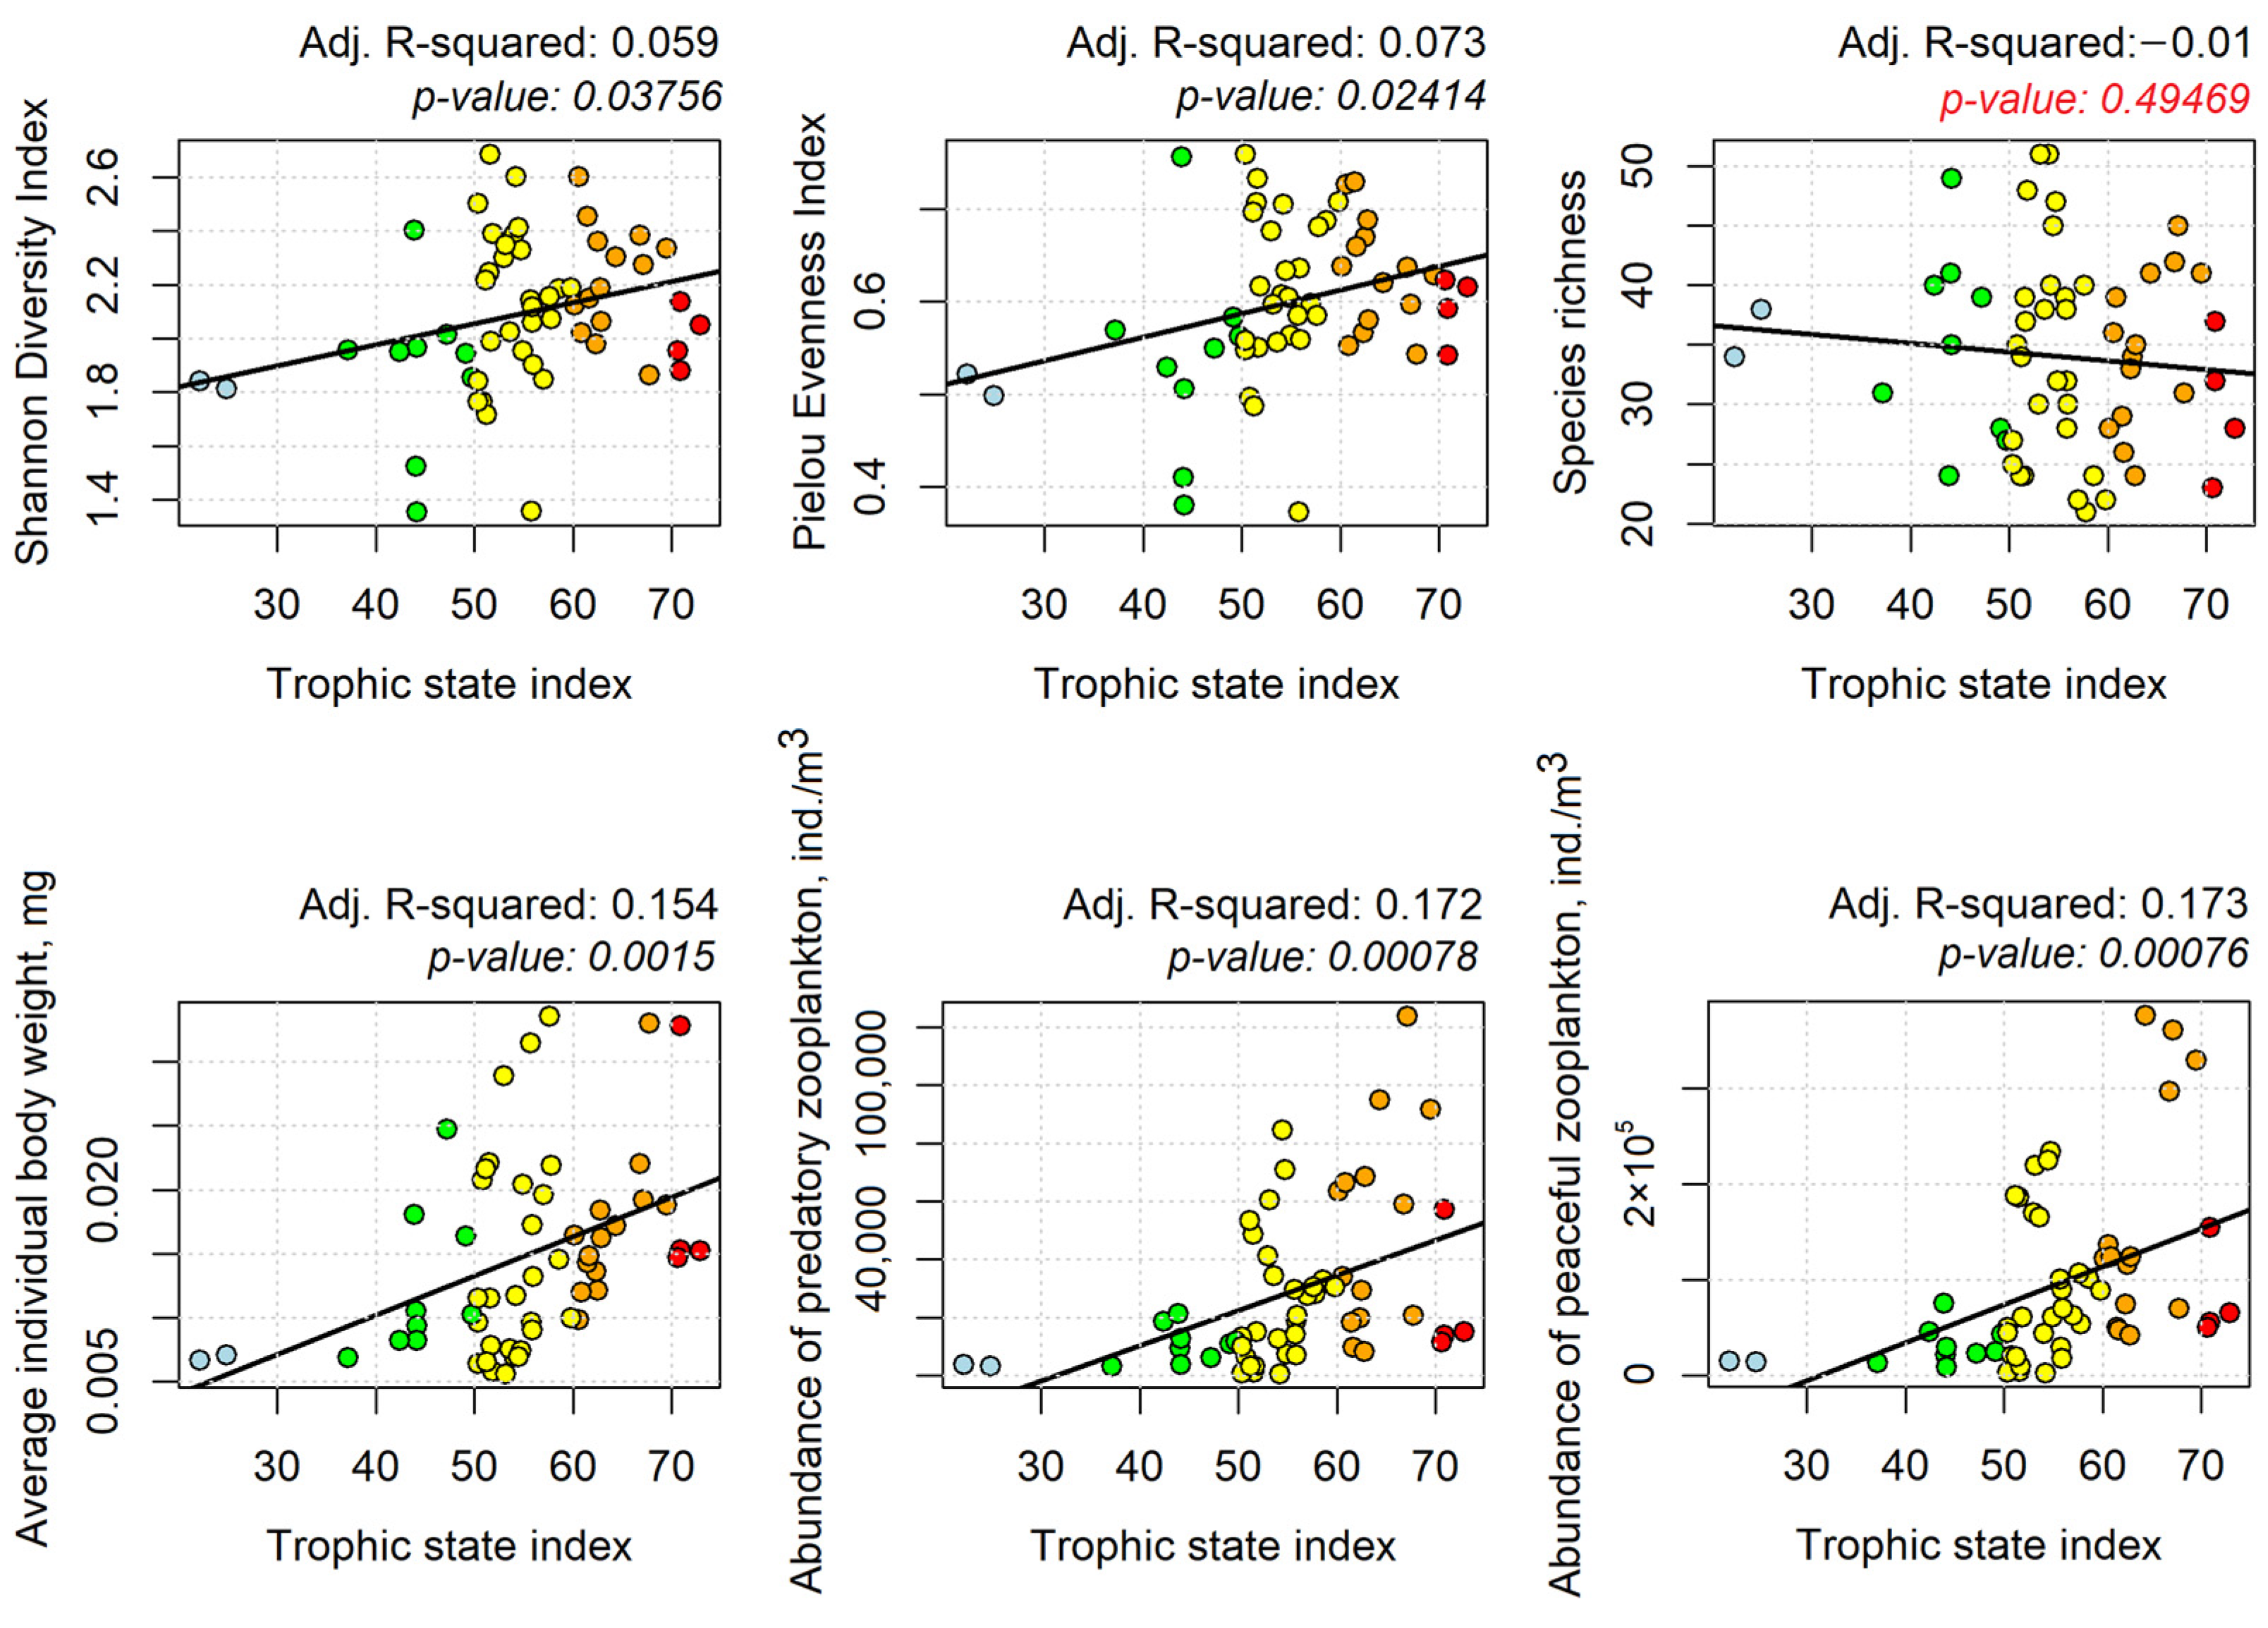
3.4. Correlation between Phyto- and Zooplankton Diversity Indicators and TSI

The Shannon’s Diversity Index and Pielou’s Evenness Index for phytoplankton values were correlated with the TSI and shown as having a negative linear relationship (Figure 2). The values of phytoplankton species richness and phytoplankton average individual mass did not have a statistically significant correlation with the TSI (Figure 2). The maximum values of diversity and phytoplankton evenness were recorded under oligotrophic and mesotrophic conditions (Figure 2).
The Shannon’s Diversity Index, Pielou’s Evenness Index, average individual body weight, abundance of predatory and filtrating zooplankton values were correlated with the TSI as having a negative linear relationship (Figure 3). The values of zooplankton species richness did not have a statistically significant correlation with the TSI (Figure 3). The maximum values diversity and zooplankton evenness were recorded under slightly eutrophic conditions (Figure 3).

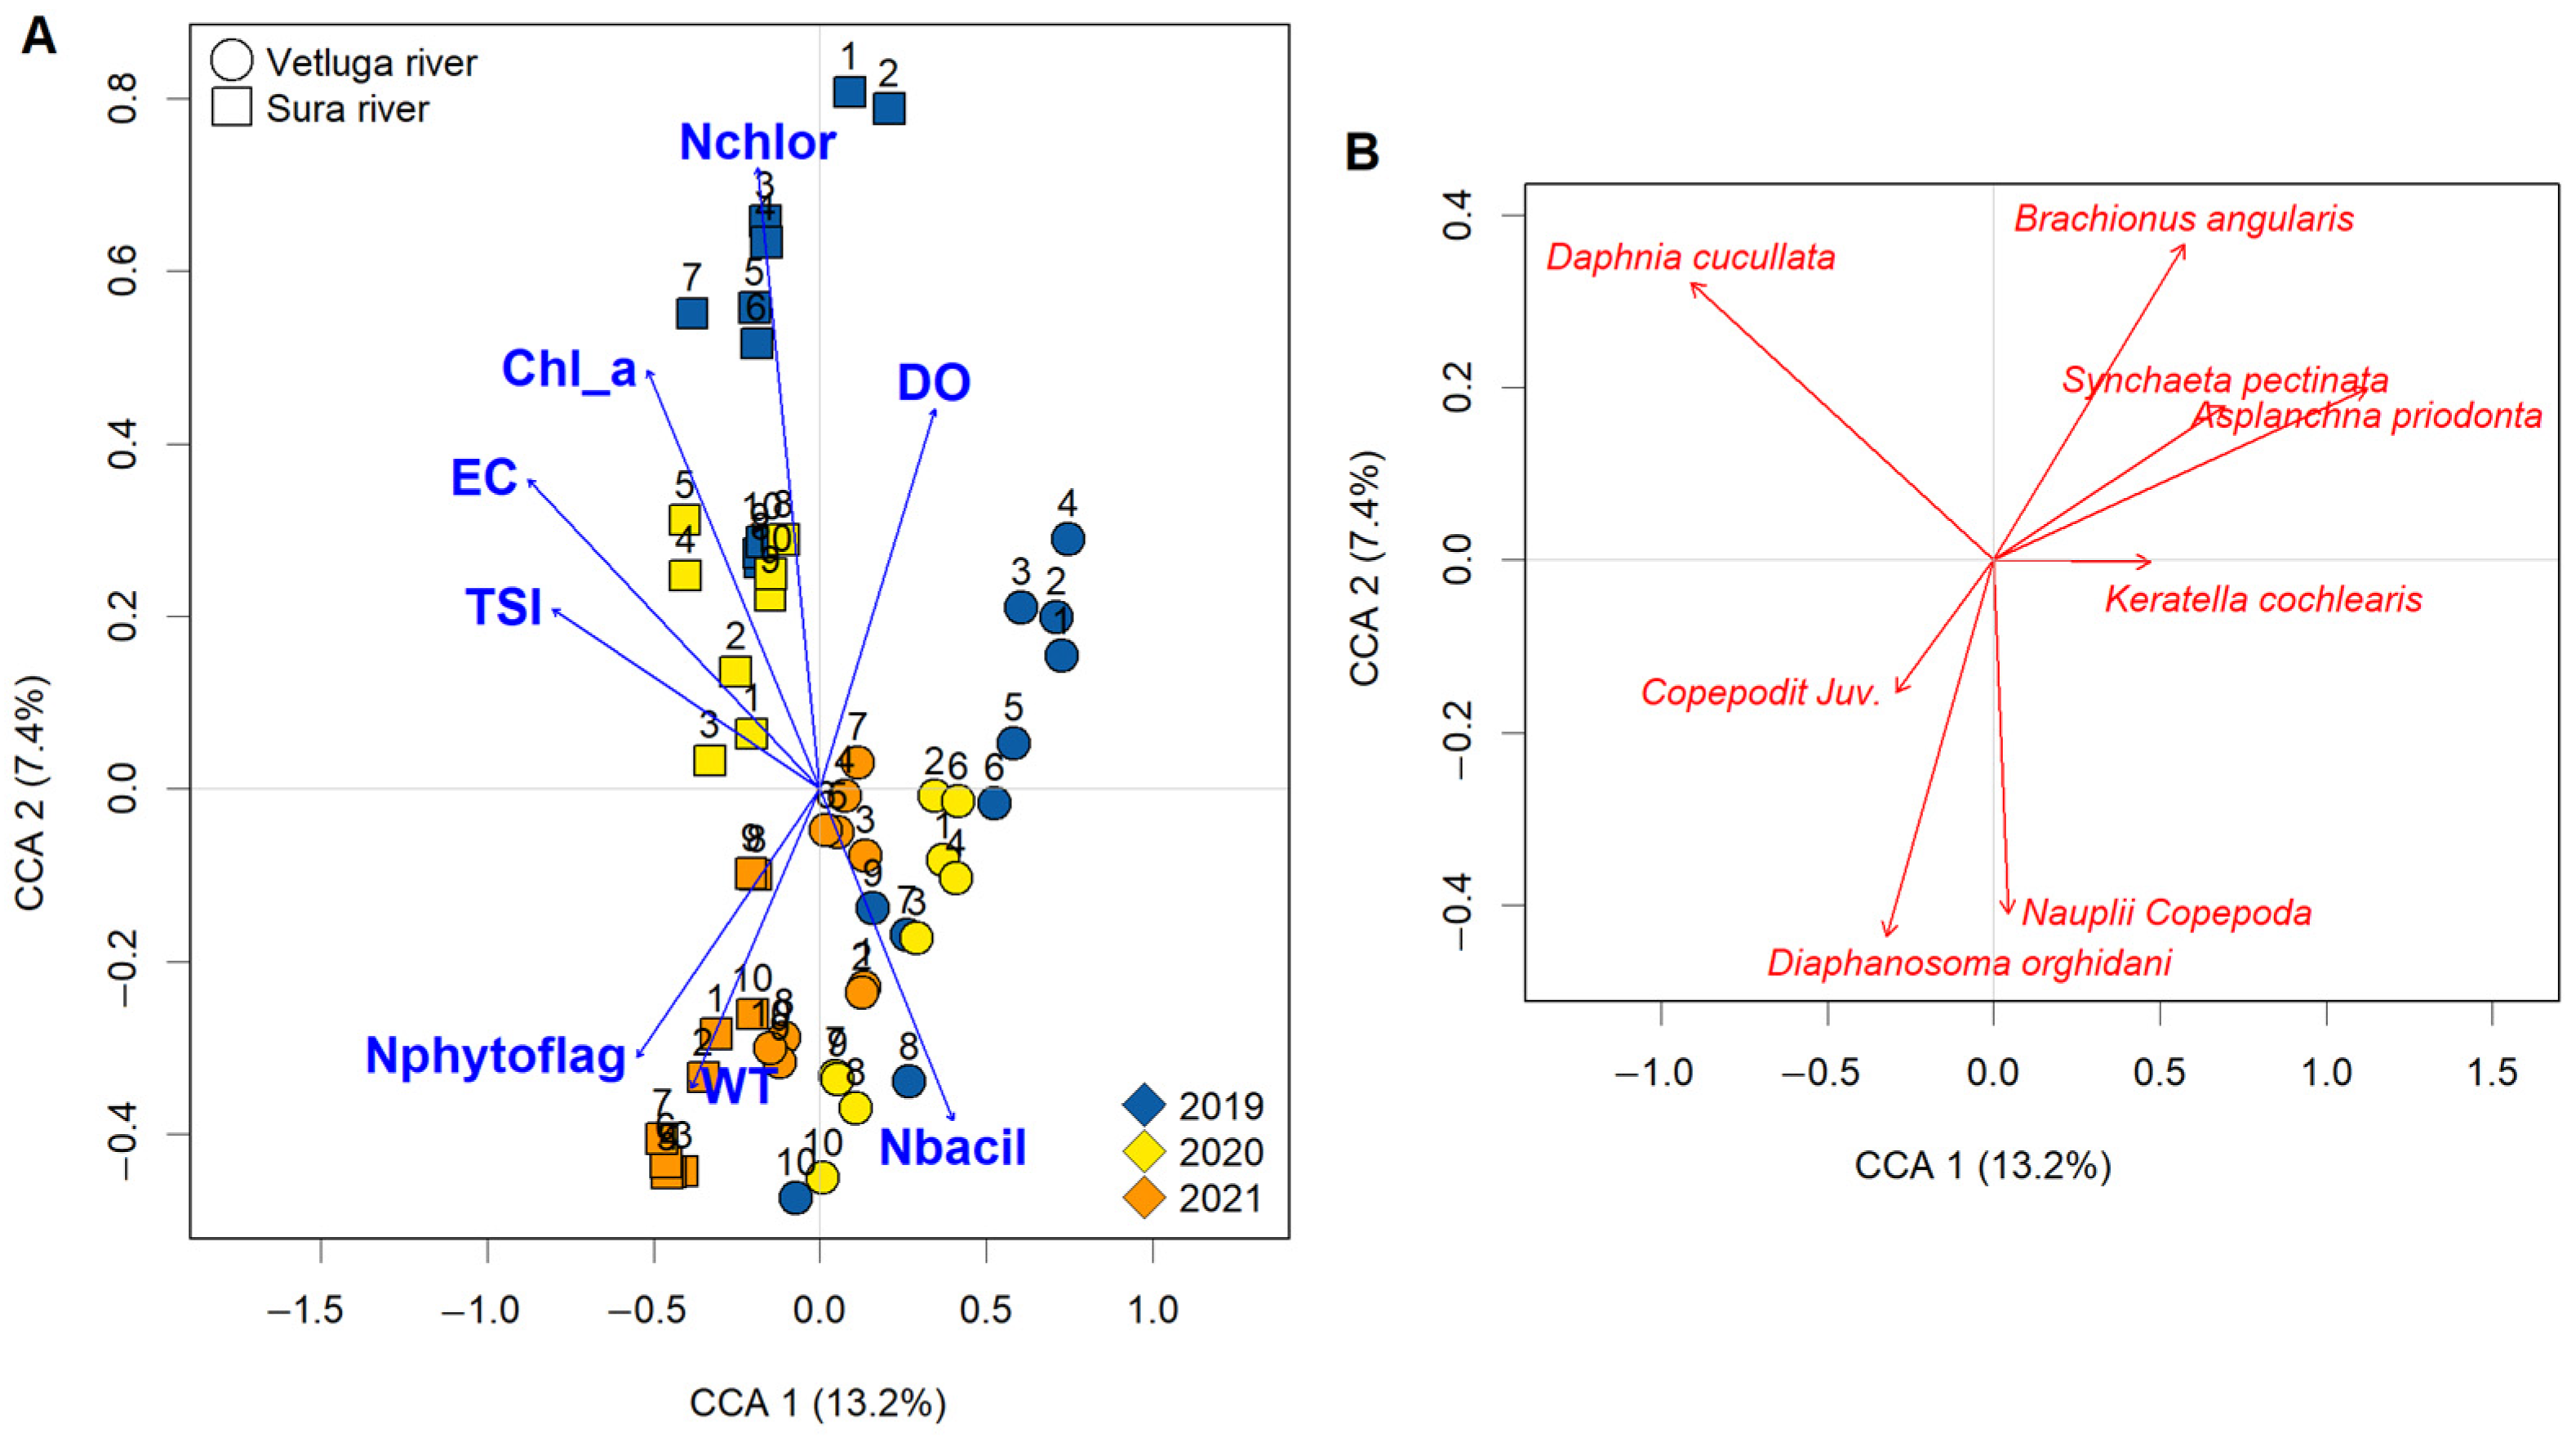
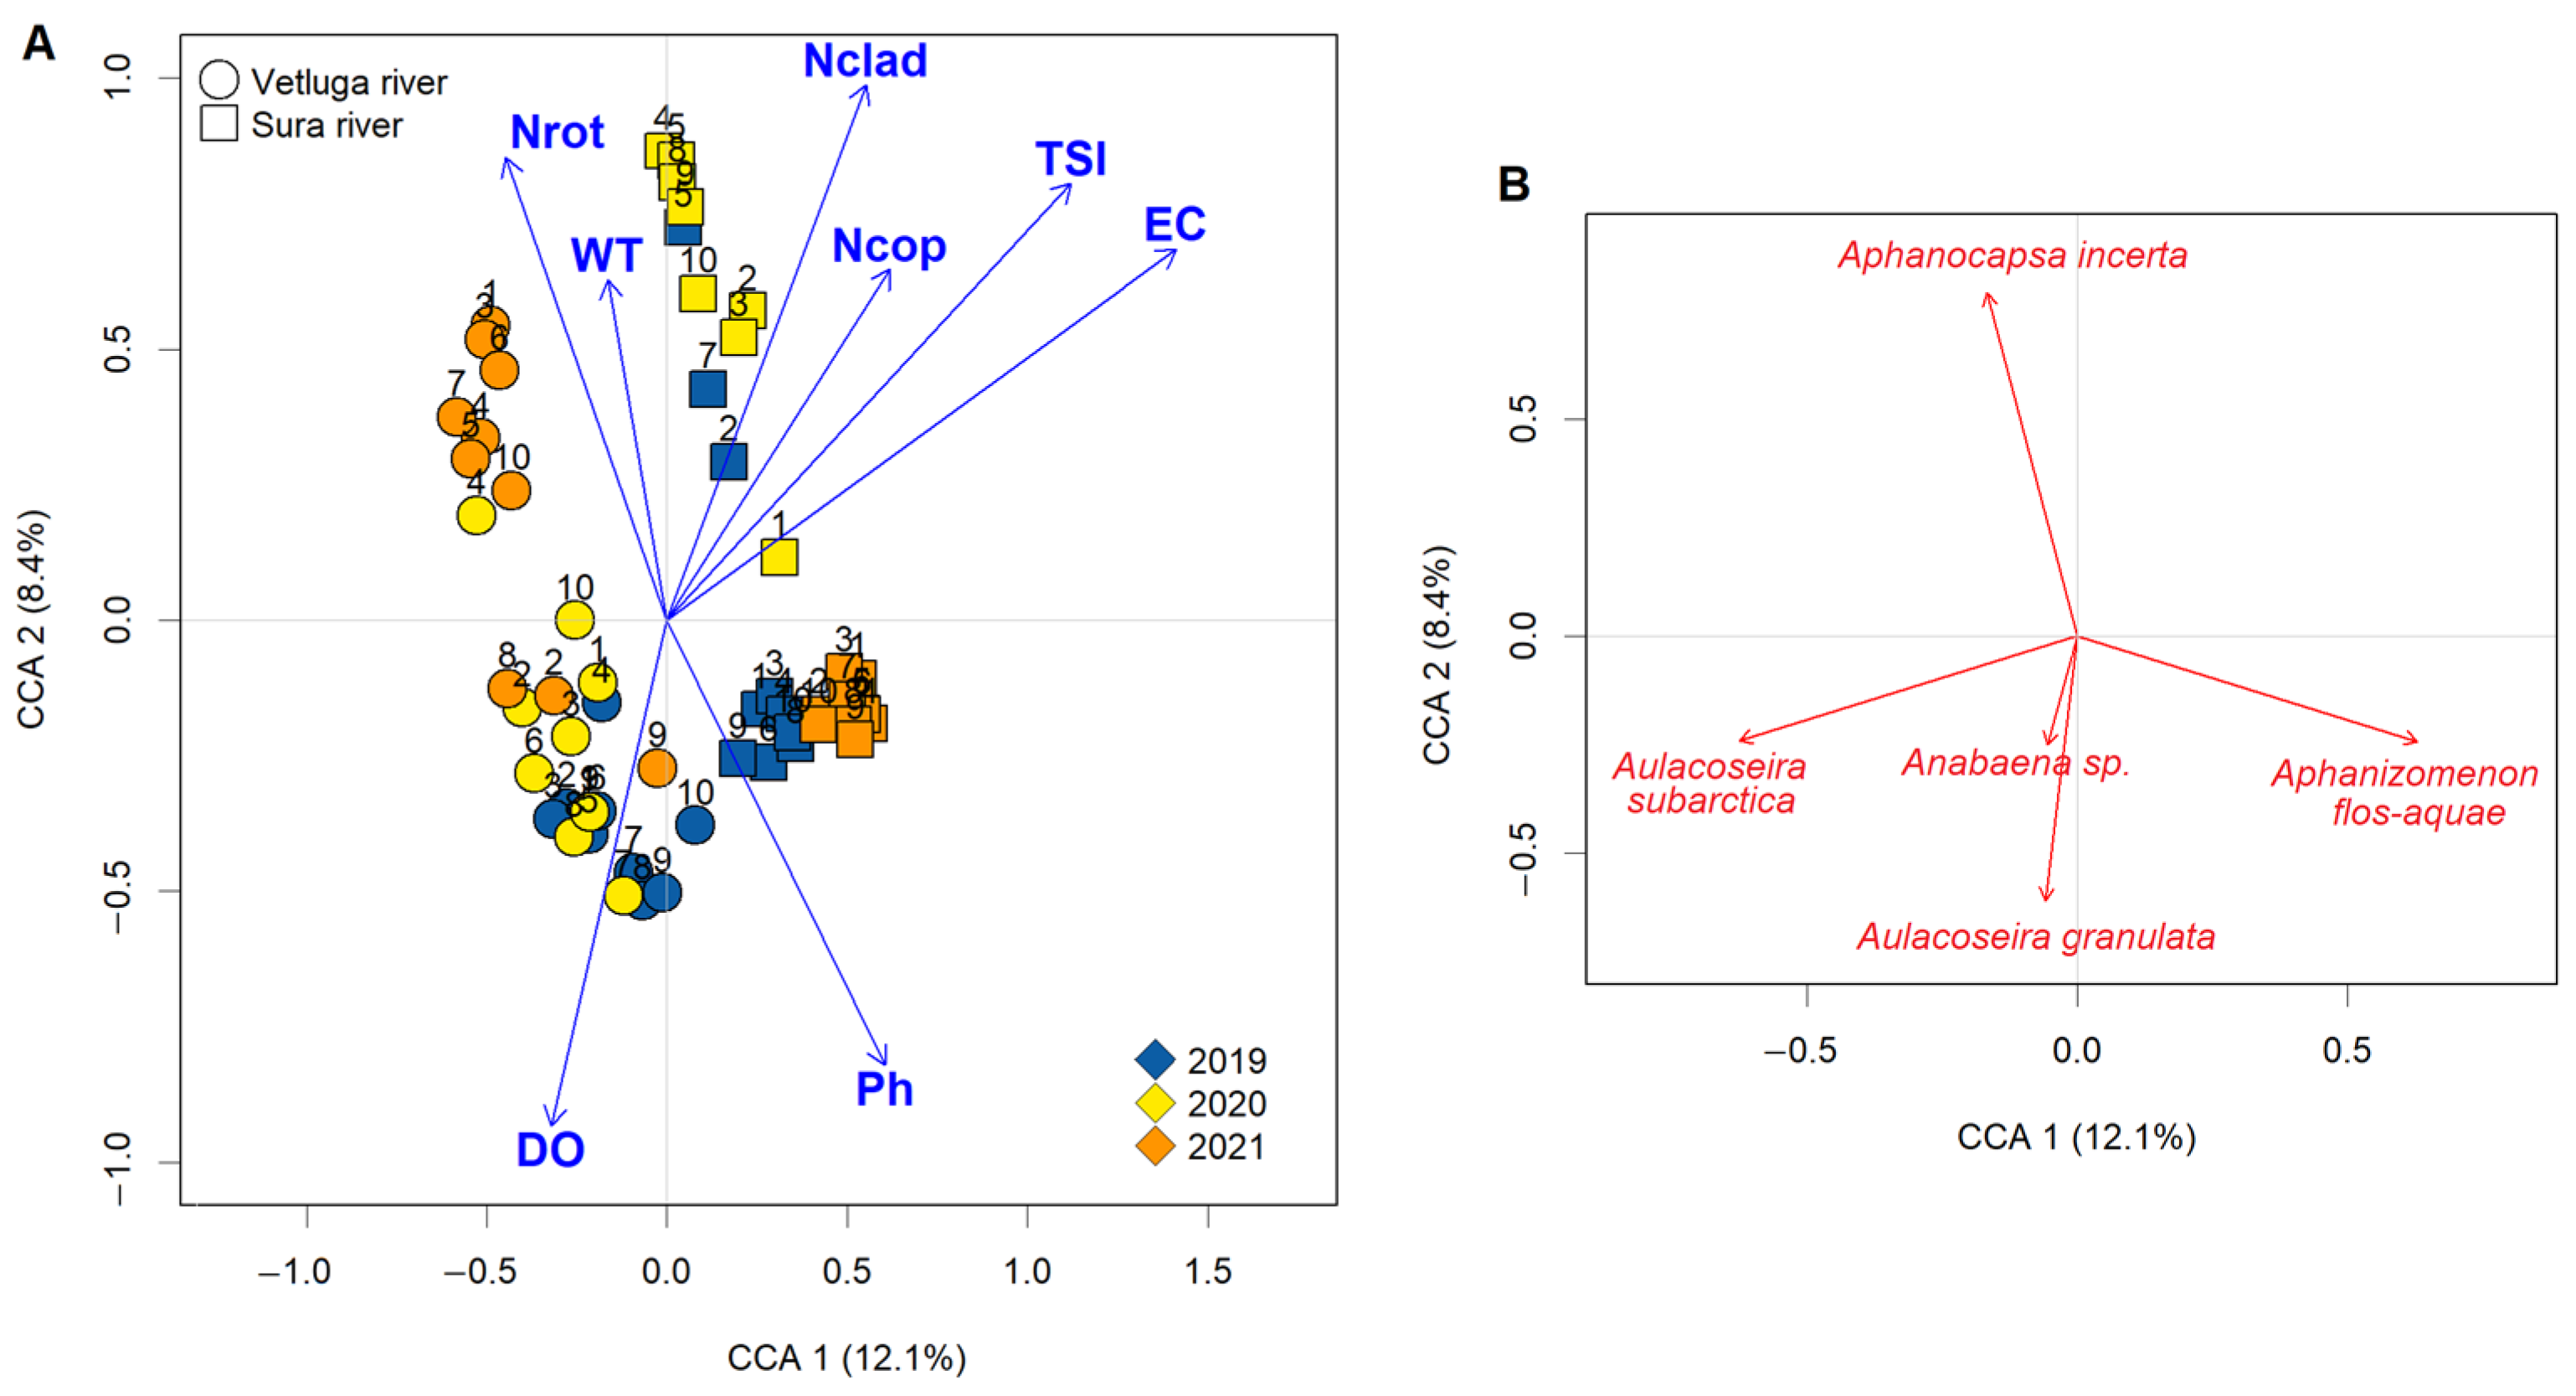
3.5. CCA of the Species Structure and Variation Partitioning

Canonical correspondence analysis (CCA) was used to test the relationships between the TSI and the plankton data. Each variable was tested independently to see its connection with the species structure of phyto- and zooplankton communities (Table 4).
We included the abundance of phytoplankton groups as factors for zooplankton structure, and groups of zooplankton as factors for algae. All tested models significantly explained changes in the structure of plankton communities (p-value < 0.05), although the adjusted R2 (adjusted proportion of variance, explained by a variable) had low values. Thus, the TSI explained 3.0% of the variance in the phytoplankton community species structure (Table 4). For communities of zooplankton, the TSI explained 7.8% of the total variance (Table 4). The most valuable factor for both communities was electrical conductivity (4.8% for phytoplankton and 8.6% for zooplankton).
Two models, including all significant predictors, were constructed for both plankton communities. The model for zooplankton explained 33.8% (p-value < 0.001) of the total variance (Figure 4). The model for phytoplankton explained 32.0% (p-value < 0.001) of the variability in the species structure (Figure 5). The first two axes in both models were statistically significant.
We found approximately the same arrangement of samples for both phytoplankton and zooplankton CCA ordination plots. Since the samples corresponding to the two studied watercourses were located along the x-axis, in both cases, this axis represents the difference in the plankton community’s species structure between the Vetluga and the Sura rivers. The position of samples along the vertical axis (CCA2) was associated with interannual changes in the species structure of plankton communities.
Also, it was found that in our data, TSI values had some variance in the interannual aspect. While in the Sura River significant changes in TSI along the time were not registered (Figure 6a), in the Vetluga River, the TSI had significantly higher values (ANOVA, p-value < 0.001) in 2020 and 2021 in comparison with 2019 (Figure 6b). As for the studied tributaries in general, the trophic conditions of the mouth areas of the Vetluga and the Sura rivers differed quite a lot. It was found that in the mouth area of the Sura River, the TSI values were statistically significantly (ANOVA, p-value < 0.001) higher than in the mouth area of the Vetluga River (Figure 6c).
According to the CCA plots, the abundance of Copepoda, Cladocera and phytoflagellates (Cryptophyta and Miozoa) are positively correlated with the TSI, while Bacillariophyta slightly negatively correlated with the trophic index values. The abundance of Chlorophyta and Rotifera seemed not to be significantly correlated with the trophic state index. We also showed on the CCA plots the dominant taxa of different trophic conditions, which we discussed above (Figure 4B and Figure 5B). For zooplankton, the abundance of crustaceans such as Diaphanosoma orghidani, nauplius and copepodite stages and, especially, Daphnia cucullata were positively correlated with higher TSI values. In contrast, the rotifers Synchaeta pectinata, Asplanchna priodonta and Keratella cochlearis seem to prefer lower TSI values. As for phytoplankton, the abundance of Anabaena sp., Aphanizomenon flos-aquae and, to a lesser extent, Aphanocapsa incerta had a positive correlation with more eutrophic conditions. A negative correlation with the TSI was noted for Aulacoseira subarctica, and to a lesser degree for Aulacoseira granulata.
Additionally, on the plots, we can observe some relationships between the two plankton communities. For example, the abundance of Daphnia cucullata highly correlates with the abundance of Cyanobacteria, and the abundance of their representative—Anabaena sp.—correlated with the cladocerans in general.

4. Discussion

The gradient of trophic conditions at the mouth of a river is created due to changes in hydrological [66,67] and hydrochemical characteristics—the concentration of nutrients (total nitrogen and phosphorus) and chlorophyll-a [68,69,70] along the channel rivers. Such changes in environmental conditions, which are formed during the creation of reservoirs, contribute to the transformation of the zooplankton communities living here from rheophilic to limnophilic ones. [71,72,73]. The main phytoplankton and zooplankton community indicators had a different relationship with the trophic state and environmental indicators gradient (Figure 2 and Figure 3). However, the trophic status was a significant ecological structure-forming factor for both phytoplankton and zooplankton (Figure 4 and Figure 5; Table 4).
In the studied rivers, the species richness of phytoplankton turned out to be similar. A noticeable predominance of Chlorophyta was noted, while the second position in the phytoplankton species list was occupied by diatoms. The same proportion of large taxa (divisions) of algae was recorded in the majority of large rivers in the temperate zone [74]. In the mouth of the Sura River, being of a higher trophic status, the proportion of green algae was higher (53% of the total list) than in the Vetluga (42%). It is known that an increase in green algae taxonomic diversity and a gradual decrease in relative diatoms species richness are general trends associated with both the processes of anthropogenic eutrophication and the transformation of the hydrological conditions [10,33,34,75].
Currently, some researchers assume that eutrophication in estuaries can be considered a result not only of nutrient enrichment but also of multiple factors, among them climate changes and the introduction of alien species [6]. Alien species included representatives of benthic (Plagiotropis lepidoptera (W. Gregory) Kuntze) and planktonic diatoms (Skeletonema subsalsum (A. Cl.) Bethge), as well as dinoflagellates (Unrhuhdinium kevei) [43,76,77]. All these species were recorded at the mouth of the Vetluga River, while only U. kevei was found in the Sura River. As was shown earlier [48], the absolute and relative values of the U. kevei development turned out to be higher in the Sura River compared to those noted in the left-bank Volga tributaries. This may indicate a preference of eutrophic conditions for this species. The ecology of alien microscopic organisms is still insufficiently studied, as well as the assessment of the impact of such species on the environment [78].
Trophic conditions have a greater effect on the composition of dominant species than on the species composition of phytoplankton as a whole [10]. The general succession schemes of the dominant diatom species, as a main potamoplankton component of the large rivers, under eutrophication are known [75]. It consists in the replacement of communities of the oligotrophic–mesotrophic stage (Asterionella, some Aulacoseira (A. subarctica, A. ambigua), etc.)) by complexes of the mesotrophic–eutrophic stage (Aulacoseira (A. ambigua, A. granulata), Melosira varians, Synedra, Stephanodicus, etc.) to communities of the eutrophic–hypertrophic stage (Stephanodiscus hantzchii, Cyclotella, Sceletonema, Cyclostephanus). Regulation of the river discharge provides favorable conditions for the development of cyanobacteria species (Aphanocapsa spp., Microcystis (M. aeruginosa), Aphanizomenon etc.), which are not typical for rivers with a natural hydrology [32]. Depending on the reservoir morphometry, the proportion of green coccoid algae and some phytoflagellates may also increase along the trophic state [34,35,79]. We found that the variation in dominant phytoplankton species in the mouth areas of large Cheboksary Reservoir tributaries generally corresponded to the well-known patterns of algal species succession in the gradient of trophic conditions (Table 2).
Diversity indices involving species richness and evenness are often viewed as directly reflecting the variation in phytoplankton community structure; thus, they can more closely mirror the response of an entire aquatic ecosystem to a change in trophic state [80,81,82]. In our studies, estimated Shannon’s Diversity Indices were correlated with the TSI, having a negative linear relationship. According to some references, the response of phytoplankton structural parameters to trophic state changes varies. Thus, in the large eutrophic Chinese Lake Chaohu, the total trophic state index (TSI) exhibited a significant negative correlation with the Peilou index but a significant positive correlation with the Shannon–Wiener index [10]. In reservoirs and rivers, the reverse trend was more often observed. For example, in the Volga reservoirs [83], the lowest diversity values were in more eutrophic water bodies. In estuarine sections of some China rivers [84] and some water bodies of Brazil [43], negatively significant correlation between Shannon and Pielou indices with the TSI were found, which was similar to our studies. It is probable that, under highly eutrophic conditions and significant hydrological regime changes, the dominance of species adapted to organic substances concentration increased. As a result, this would have reduced the species evenness in communities and their diversity.
According to the results of canonical correspondence analysis in the mouth zones of the studied rivers, an increase in the abundance of cyanobacteria was noted with the trophic state growth. This result effectively confirms the fact that eutrophication contributes to the dominance of cyanobacteria in the different water bodies despite their regional, latitudinal, altitudinal, and climatic differences [36,37,38]. It was also noted that flagellate algae (cryptomonads and dinoflagellates) were more abundant in eutrophic conditions, while diatoms were the opposite. Similar opposite trends in assessing the role of diatoms and dinoflagellates were demonstrated in phytoplankton communities of coastal East China Sea ecosystems [80]. According to this research, both the effect of warming, resulting in a nutrient decline as a consequence of increasing stratification, and the effect of increasing the terrestrial nutrient input as a result of eutrophication promote dinoflagellates over diatoms. Currently there is a clear trend towards the increasing role of the phytoflagellates in phytoplankton communities in various water bodies [82,83], including the majority of the Volga reservoirs [34,74] as a result of progressing eutrophication and climate change.
The species richness of zooplankton in the studied rivers was, on the whole, quite high, both in comparison with other tributaries of the Volga reservoirs and with water bodies of Europe [79]. The main share of species richness was formed by Rotifera (50% of the species composition), which is typical for river ecosystems. Among crustaceans, Cladocera had the highest species richness (38%), and Copepoda had the lowest species richness (12%). Most of the discovered species were cosmopolitan and typical for water bodies and streams of European Russia [19,22].
With regards to the transition from the river part to the water backwater zone, the reorganization of the rheophilic zooplankton community into a limnophilic one was noted, which, against the background of changes in the trophic status, was accompanied by typical changes in the composition of dominant species. We have previously already demonstrated similar changes in the dominant complexes in zooplankton communities on a larger scale in the Cheboksary Reservoir [12,13].
Transcontinental alien species Kellicottia bostoniensis (Rousselet, 1908) and Acanthocyclops americanus (Marsh, 1893) were found in both the Sura and Vetluga rivers mouth areas. The rotifer K. bostoniensis is a eurybiont species, while the crustacean A. americanus had the highest abundance (more than 12 thousand ind./m3) in the more eutrophic mouth area of the Sura River. This correlates well with ideas about its ecological preferences. It is known that during the period of distribution of this species in Europe, it inhabited mainly highly eutrophic water bodies and even became the main component of zooplankton communities in these water bodies [43,54,55]. The tropical Asian species Keratella tropica (Apstein, 1907) and Thermocyclops taihokuensis Harada, 1931 were found in 2019 and 2020 and had the largest abundance precisely in the highly eutrophic and warmer mouth area of the Sura River. In 2021, during a period of high water temperature in the mouth area of the Vetluga River, the Asian crustacean T. taihokuensis was recorded for the first time in this river. The construction of dams and an increase in shipping traffic provoked the dispersal of Caspian copepods Eurytemora caspica Sukhikh and Alekseev, 2013 and Eurytemora velox (Lilljeborg, 1853). New, more favorable conditions caused the appearance of E. caspica and E. velox, first in the Cheboksary Reservoir, and then in the mouth areas of a number of its tributaries and in parts of the Sura and Vetluga rivers [43].
A similar increase in diversity and evenness (Figure 3) in the zooplankton community was noted in Polish water bodies [79]. However, it is important to note that the mouth area of the river is a dynamic system. It combines the features of a watercourse and a reservoir, but often with a predominance of rheophilic features. That is why our results are also consistent with the data obtained in the study of the Paranapanema River (Southeast Brazil) [82]. The increase in diversity in the trophic gradient of the mouth areas of the Sura and the Vetluga rivers is apparently associated with the transformation of food webs in the mouth area. There is a change from a rheophilic cenosis, with a high abundance and a large number of species, to a limnophilic one, with a decrease in the number of species and the emergence of leading roles of individual filtrators, which are capable of feeding on objects that cause “blooming” under conditions of high eutrophication.
Against the background of an increase in trophicity, the abundance of filtrating and predatory zooplankton species increased (Figure 3). The abundance of filtrating species mostly increased due to the development of the filter-feeding crustaceans D. cucullata and D. orghidani with an increase in the dominance of cyanobacteria. The number of predators naturally increased against the background of an increase in the quantity and improvement in the quality of food for them. The basis of the predatory plankton of the mouth areas and reservoirs is formed by large crustaceans of the genera Bythotrephes Leydig, 1860; Leptodora Lilljeborg, 1861 and Cyclops Müller O.F., 1785. As a result, as eutrophication increased and the plankton community transformed, the average individual mass of each zooplankton organism increased.
The results of canonical correspondence analysis of zooplankton community relationships (Figure 4B) confirm that the degree of eutrophication is a significant abiotic factor for the structural organization of zooplankton communities. Along with trophicity, the quantitative development of individual groups of phytoplankton and electrical conductivity (EC) are important biotic factor (Figure 4B). Our studies confirmed the classical patterns of food chains in freshwater planktonic communities.
It has been established that more eutrophic conditions in the mouth areas of the studied rivers provide a background for the mass development of cyanobacteria and, in particular, Anabaena sp., A. flos-aquae, A. incerta; the cladoceran D. cucullata and D. orghidani; as well as nauplius and the copepodite stages (Figure 4). D. cucullata and D. orghidani are typical planktonic filter feeders that feed by straining food particles on the filters of III and IV of the thoracic limbs [84]. This species also feeds on representatives of the genus Anabaena by crushing their threads. Thus, under more eutrophic conditions, the response of the phytoplankton community is expressed in an increase in the abundance of cyanobacteria, which, in turn, apparently triggers a restructuring in the zooplankton community and the emergence of species capable of using cyanobacteria as food. In oligotrophic and mesotrophic conditions, diatoms develop in mass, which are the object of nutrition for rotifers. A similar classical picture of food relations can be traced in our research.
The cascade effect, which is apparently formed due to the massive development of cyanobacteria and manifested in a regular change in the dominant zooplankton complexes, is also reflected in a change in diversity and evenness in both phyto- and zooplankton communities. A decrease in the phytoplankton diversity with an increase in eutrophication is a consequence of the increase in monodominance and the leading by one species of cyanobacteria. Against this background, there is an increase in the diversity of zooplankton, which is expressed in polydominance in the zooplankton community. Leading roles are played by several species, primarily filter feeders, which are capable of feeding on cyanobacteria.

5. Conclusions

Mouth areas of large rivers with a pronounced trophic gradient can serve as good model objects for assessing the degree of influence on various plankton communities under conditions of boundary zones. We found that the diversity and evenness of phytoplankton were characterized by a negative relationship with eutrophication, whereas those of zooplankton were positive. The results of CCA of plankton community relationships confirms that the degree of eutrophication is a significant ecological structure-forming factor for both phytoplankton and zooplankton communities in the studied tributaries, as well as the electrical conductivity of the water. In the mouth river zones, the variation of the dominant phytoplankton and zooplankton species in the gradient of trophic states generally coincided with the well-known succession of dominants in river ecosystems under progressive eutrophication and hydrological regime changes. The results demonstrate the presence of a cascade effect in planktonic food chains—a change in phytoplankton dominants provokes a replacement in zooplankton dominants, which, in turn, triggers a restructuring in the zooplankton community, mainly by changing the ratio of zoophages and species capturing. Our findings also highlight the necessity of studying border zones of freshwater ecosystems and the need for an integrated approach with the study ecological dynamics in phytoplankton–zooplankton interactions. We believe that this work will be helpful in aiding reservoir management by providing scientific information.

Author Contributions

V.Z. and E.V. contributed substantially to the study’s conception, data acquisition, analysis and translation of the manuscript; I.K. performed statistical analysis; D.G. gathered and analyzed data for the study; N.S. and P.K. designed the figures; O.E. and M.T. performed the hydrochemical analysis of samples; A.O. and G.S. contributed substantially to drafting the manuscript. All authors have read and agreed to the published version of the manuscript.

Funding

The federal academic leadership program Priority 2030 funded this research. Most of the fieldwork for this study was supported by the Russian Geographical Society («The Floating University of the Volga Basin», project no. 02/2019-P, 07/2020-p, 17/2021-P, 17-2022-P).

Data Availability Statement

The datasets generated during and/or analyzed during the current study are available from the corresponding author on available upon request.

Conflicts of Interest

The authors declare no conflict of interest. The funders had no role in the design of the study; in the collection, analyses, or interpretation of data; in the writing of the manuscript, or in the decision to publish the results.

References

  1. Chaurasia, S.; Gupta, R. Study on trophic state index of River Mandakini at Chitrakoot, India. Int. J. Adv. Res. Eng. Appl. Sci. 2016, 5, 34–43. [Google Scholar]
  2. Loreau, M.; Naeem, S.; Inchausti, P.; Bengtsson, J.; Grime, J.P.; Hector, A.; Hooper, D.U.; Huston, M.A.; Raffaelli, D.; Schmid, B.; et al. Ecology: Biodiversity and ecosystem functioning: Current knowledge and future challenges. Science 2001, 294, 804–808. [Google Scholar] [CrossRef] [Green Version]
  3. Naeem, S.; Duffy, J.E.; Zavaleta, E. The functions of biological diversity in an age of extinction. Science 2012, 336, 1401–1406. [Google Scholar] [CrossRef] [Green Version]
  4. Gagic, V.; Bartomeus, I.; Jonsson, T.; Taylor, A.; Winqvist, C.; Fischer, C.; Slade, E.M.; Steffan-Dewenter, I.; Emmerson, M.; Potts, S.G.; et al. Functional identity and diversity of animals predict ecosystem functioning better than species-based indices. P. Roy. Soc. B-Biol. Sci. 2015, 282, 0142620. [Google Scholar] [CrossRef] [Green Version]
  5. Cloern, J.E. Our evolving conceptual model of the coastal eutrophication problem. Mar. Ecol. Prog. Ser. 2001, 210, 223–253. [Google Scholar] [CrossRef] [Green Version]
  6. Costa, L.S.; Huszar, V.L.M.; Ovalle, A.R. Phytoplankton functional groups in a tropical estuary: Hydrological control and nutrient limitation. Estuar. Coasts. 2009, 32, 508–521. [Google Scholar] [CrossRef]
  7. Felipe-Lucia, M.R.; Soliveres, S.; Penone, C.; Fischer, M.; Ammer, C.; Boch, S.; Boeddinghaus, R.S.; Bonkowski, M.; Buscot, F.; Fiore-Donno, A.M.; et al. Land-use intensity alters networks between biodiversity, ecosystem functions, and services. Proc. Natl. Acad. Sci. USA 2020, 117, 28140–28149. [Google Scholar] [CrossRef]
  8. Padisák, J.; Reynolds, C.S. Selection of phytoplankton associations in Lake Balaton, Hungary, in response to eutrophication and restoration measures, with special reference to the cyanoprokaryotes. Hydrobiologia 1998, 384, 41–53. [Google Scholar] [CrossRef]
  9. Karadžić, V.; Subakov-Simić, G.; Krizmanić, J.; Natić, D. Phytoplankton and eutrophication development in the water supply reservoirs Garaši and Bukulja (Serbia). Desalination 2010, 255, 91–96. [Google Scholar] [CrossRef]
  10. Yang, B.; Jiang, Y.; He, W.; Liu, W.; Kong, X.; Jorgensen, S.E.; Xu, F. The tempo-spatial variations of phytoplankton diversities and their correlation with trophic state levels in a large eutrophic Chinese lake. Ecol. Ind. 2016, 66, 153–162. [Google Scholar] [CrossRef] [Green Version]
  11. Yuan, L.L.; Pollard, A.I. Changes in the relationship between zooplankton and phytoplankton biomasses across a eutrophication gradient. Limnol. Oceanogr. 2018, 63, 2493–2507. [Google Scholar] [CrossRef]
  12. Shurganova, G.V.; Kudrin, I.A.; Yakimov, V.N.; Gavrilko, D.E.; Zhikharev, V.S.; Zolotareva, T.V. Spatial Distribution of Zooplankton on the Upper Part of the Cheboksary Reservoir. Inland Water Biol. 2018, 11, 317–325. [Google Scholar] [CrossRef]
  13. Shurganova, G.V.; Zhikharev, V.S.; Gavrilko, D.E.; Kudrin, I.A.; Zolotareva, T.V.; Yakimov, B.N.; Erina, O.N.; Tereshina, M.A. Zooplankton communities of the middle river part of the Cheboksary Reservoir and factors influencing their species structure. Pov. J. Ecol. 2019, 3, 384–395. [Google Scholar]
  14. Afonina, E.Y.; Tashlykova, N.A. Fluctuations in plankton community structure of endorheic soda lakes of southeastern Transbaikalia (Russia). Hydrobiologia 2020, 847, 1383–1398. [Google Scholar] [CrossRef]
  15. Frossard, V.; Aleya, L.; Henry, P.; Vallet, A.; Charlier, J.B. Impacts of nitrogen loads on the water and biota in a karst river (Loue River, France). Hydrobiologia 2020, 847, 2433–2448. [Google Scholar] [CrossRef]
  16. Liang, D.; Wang, Q.; Wei, N.; Tang, C.; Sun, X.; Yang, Y. Biological indicators of ecological quality in typical urban river-lake ecosystems: The planktonic rotifer community and its response to environmental factors. Ecol. Indic. 2020, 112, 106127. [Google Scholar] [CrossRef]
  17. Krupa, E.; Barinova, S.; Romanova, S.; Aubakirova, M.; Ainabaeva, N. Planktonic Invertebrates in the Assessment of Long-Term Change in Water Quality of the Sorbulak Wastewater Disposal System (Kazakhstan). Water 2020, 12, 3409. [Google Scholar] [CrossRef]
  18. Waite, I.R.; Pan, Y.; Edwards, P.M. Assessment of multi-stressors on compositional turnover of diatom, invertebrate and fish assemblages along an urban gradient in Pacific Northwest streams (USA). Ecol. Indic. 2020, 112, 106047. [Google Scholar] [CrossRef] [Green Version]
  19. Zhikharev, V.S.; Gavrilko, D.E.; Shurganova, G.V. Zooplankton community structure in mouth areas of different rivers (tributaries of the lowland Cheboksary Reservoir, European Russia). IOP Conf. Series Earth Environ. Sci. 2021, 834, 012063. [Google Scholar] [CrossRef]
  20. Telesh, I.V.; Khlebovich, V.V. Principal processes within the estuarine salinity gradient: A review. Mar. Pollut. Bull. 2010, 61, 149–155. [Google Scholar] [CrossRef]
  21. Gabyshev, V.A.; Ivanova, A.P.; Tsarenko, P.M. Diversity and features of the spatial structure of algal communities of water bodies and watercourses in the Lena River estuary. Inland Water Biol. 2019, 12, 1–9. [Google Scholar] [CrossRef]
  22. Krylov, A.V.; Tsvetkov, A.I.; Malin, M.I.; Romanenko, A.V.; Poddubnii, S.A.; Otjukova, N.G. Communities of hydrobionts and the physical-chemical characteristics of the estuary area of inflow of a flat water basin. Inland Water Biol. 2010, 3, 59–69. [Google Scholar] [CrossRef]
  23. Sakharova, E.G. Phytoplankton of Ecotone Zones of the Rybinsk Reservoir; Extended Abstract of Cand. Sci. (Biol.). Ph.D. Thesis, Papanin Institute for Biology of Inland Waters Russian Academy of Sciences, Borok, Russia, 25 May 2017; p. 23. (In Russian). [Google Scholar]
  24. Grabowska, M.; Ejsmont-Karabin, J.; Karpowicz, M. Reservoir-river relationships in lowland, shallow, eutrophic systems: An impact of zooplankton from hypertrophic reservoir on river zooplankton. Pol. J. Ecol. 2013, 4, 759–768. [Google Scholar]
  25. Tews, J.; Brose, U.; Grimm, V.; Tielborger, K.; Wichmann, M.C.; Schwager, M.; Jeltsch, F. Animal species diversity driven by habitat heterogeneity/diversity: The importance of keystone structures. J. Biogeogr. 2004, 31, 79–92. [Google Scholar] [CrossRef] [Green Version]
  26. Heino, J.; Melo, A.S.; Siqueira, T.; Soininen, J.; Valanko, S.; Bini, L.M. Metacommunity organisation, spatial extent and dispersal in aquatic systems: Patterns, processes and prospects. Freshw. Biol. 2015, 60, 845–869. [Google Scholar] [CrossRef]
  27. Maishanu, H.M.; Mainarasa, M.; Magami, I.M. Assessment of productivity status using Carlson’s TSI and fish diversity of Gorongo Dam, Sokoto State, Nigeria. Path Sci. 2018, 4, 2001–2006. [Google Scholar] [CrossRef] [Green Version]
  28. Özen, A.; Sorf, M.; Trochine, C.; Liboriussen, L.; Beklioglu, M.; Søndergaard, M.; Lauridsen, T.L.; Johansson, L.S.; Jeppesen, E. Long-term effects of warming and nutrients on microbes and other plankton in mesocosms. Freshw. Biol. 2013, 58, 483–493. [Google Scholar] [CrossRef]
  29. Jeppesen, E.; Nõges, P.; Davidson, T.A.; Haberman, J.; Nõges, T.; Blank, K.; Lauridsen, T.L.; Søndergaard, M.; Sayer, C.; Laugaste, R.; et al. Zooplankton as indicators in lakes: A scientific-based plea for including zooplankton in the ecological quality assessment of lakes according to the European Water Framework Directive (WFD). Hydrobiologia 2011, 676, 279–297. [Google Scholar] [CrossRef]
  30. Rall, B.C.; Guill, C.; Brose, U. Food-web connectance and predator interference dampen the paradox of enrichment. Oikos 2008, 117, 202–213. [Google Scholar] [CrossRef] [Green Version]
  31. Rip, J.M.K.; McCann, K.S. Cross-ecosystem differences in stability and the principle of energy flux. Ecol. Lett. 2011, 14, 733–740. [Google Scholar] [CrossRef]
  32. Okhapkin, A.G.; Yulova, G.A.; Startseva, N.A. Composition and structure of phytoplankton from certain flood-plain lakes of the cultural landscape (as exemplified by Nizhniy Novgorod). Bot. Zh. 2002, 87, 78–88. [Google Scholar]
  33. Reynolds, C.S. Ecology of Phytoplankton; Cambrige University Press: New York, NY, USA, 2006; p. 551. [Google Scholar]
  34. Korneva, L.G. Phytoplankton of Volga River Basin Reservoirs; Kostroma Printing House: Kostroma, Russia, 2015; p. 284. (In Russian) [Google Scholar]
  35. Chislock, M.F.; Doster, E.; Zitomer, R.A.; Wilson, A.E. Eutrophication: Causes, Consequences, and Controls in Aquatic Ecosystems. Nat. Educ. Knowl. 2013, 4, 10. [Google Scholar]
  36. Tian, W.; Zhang, H.; Zhao, L.; Xiong, Y.; Huang, H. Effects of Environmental Factors on the Temporal Stability of Phytoplankton Biomass in a Eutrophic Man-Made Lake. Water 2016, 8, 582. [Google Scholar] [CrossRef] [Green Version]
  37. Meng, F.; Li, Z.; Li, L.; Lu, F.; Liu, Y.; Lu, H.; Fan, Y. Phytoplankton alpha diversity indices response the trophic state variation in hydrologically connected aquatic habitats in the Harbin Section of the Songhua River. Sci. Rep. 2020, 10, 21337. [Google Scholar] [CrossRef]
  38. Dunck, B.; Felisberto, S.A.; Nogueira, I.D. Effects of freshwater eutrophication on species and functional beta diversity of periphytic algae. Hydrobiologia 2019, 837, 195–204. [Google Scholar] [CrossRef]
  39. Li, Y.; Mengdie, G.; Jinlei, Y.; Yingxun, D.; Min, X.; Weizhen, Z.; Jianjun, W.; Haojie, S.; Rong, W.; Feizhou, C. Eutrophication decrease compositional dissimilarity in freshwater plankton communities. Sci. Total Environ. 2022, 821, 153434. [Google Scholar] [CrossRef]
  40. Suchora, M.; Szczurowska, A.; Niedźwiecki, M. Trophic state indexes and phytoplankton in the trophic status assessment of waters of a small retention reservoir at an early stage of operation. J. Ecol. Eng. 2017, 18, 209–215. [Google Scholar] [CrossRef] [Green Version]
  41. Carvalho, L.; Poikane, S.; Lyche Solheim, A.; Phillips, G.; Borics, G.; Catalan, J.; Hoyos, C.D.; Drakare, S.; Dudley, B.J.; Järvinen, M.; et al. Strength and uncertainty of phytoplankton metrics for assessing eutrophication impacts in lakes. Hydrobiologia 2013, 704, 127–140. [Google Scholar] [CrossRef] [Green Version]
  42. Machado, K.B.; Bini, L.M.; Melo, A.S.; De Andrade, A.T.; De Almeida, M.F.; Carvalho, P.; Teresa, F.B.; De Oliveira Roque, F.; Bortolini, J.C.; Padial, A.A.; et al. Functional and taxonomic diversities are better early indicators of eutrophication than composition of freshwater phytoplankton. Hydrobiologia 2022. [Google Scholar] [CrossRef]
  43. Mineeva, N.; Lazareva, V.; Livinov, A.; Stepanova, I.; Chuiko, G.; Papchenkov, V.; Korneva, L.; Shcherbina, G.; Pryanichnikova, E.; Perova, S.; et al. Chapter 2. The Volga River. In Rivers of Europe; Elsevier: Amsterdam, The Netherlands, 2021; pp. 27–79. [Google Scholar]
  44. Krylov, A. (Ed.) Hydroecology of Lowland Water Reservoir Tributaries Mouth; Filigran: Yaroslavl, Russia, 2015; p. 466. (In Russian) [Google Scholar]
  45. Guidance on the Chemical Analysis of Sea and Fresh Water in the Ecological Monitoring of Fishery Water Bodies and the Environment of the World Ocean That Is Promising for Fishing; RFRIFO: Moscow, Russia, 2003.
  46. Borics, G.; Abonyi, A.; Salmaso, N.; Ptacnik, R. Freshwater phytoplankton diversity: Models, drivers and implications for ecosystem properties. Hydrobiologia 2021, 848, 53–75. [Google Scholar] [CrossRef]
  47. Malashenkov, D.V.; Dashkova, V.; Zhakupova, K.; Vorobjev, I.A.; Barteneva, N.S. Comparative analysis of freshwater phytoplankton communities in two lakes of Burabay National Park using morphological and molecular approaches. Sci. Rep. 2021, 11, 16130. [Google Scholar] [CrossRef] [PubMed]
  48. Vodeneeva, E.L.; Kulizin, P.V. Algae of the Mordovian Nature Reserve. In Annotated List of Species; Flora and Fauna of Nature Reserves: Moscow, Russia, 2019; Volume 134, p. 62. (In Russian) [Google Scholar]
  49. Guiry, M.D.; Guiry, G.M. AlgaeBase. World-Wide Electronic Publication; National University of Ireland: Galway, Ireland, 2021; Available online: http://www.algaebase.org (accessed on 29 July 2021).
  50. Okhapkin, A.; Sharagina, E.; Kulizin, P.; Startseva, N.; Vodeneeva, E. Phytoplankton community structure in highly-mineralized small gypsum karst lake (Russia). Microorganisms 2022, 10, 386. [Google Scholar] [CrossRef] [PubMed]
  51. De Paggi, S.J. New data on the distribution of Kellicottia bostoniensis (Rousselet, 1908) (Rotifera: Monogononta: Brachionidae): Its presence in Argentina. Zool. Anz. 2002, 241, 363–368. [Google Scholar] [CrossRef]
  52. Monchenko, V.I. Redescription of the oriental species Thermocyclops taihokuensis (Harada) (Copepoda: Cyclopoida) from its western most population. Zool. Middle East 2008, 43, 99–104. [Google Scholar] [CrossRef]
  53. Sukhikh, N.M.; Alekseev, V.R. Eurytemora caspica sp. nov. from the Caspian Sea—One more new species within the E. affinis complex (Copepoda: Calanoida, Temoridae). Proc. Zool. Inst. Russ. Acad. Sci. 2013, 317, 85–100. [Google Scholar] [CrossRef]
  54. Alekseev, V.R. Confusing invader: Acanthocyclops americanus (Copepoda: Cyclopoida) and its biological, anthropogenic and climate-dependent mechanisms of rapid distribution in Eurasia. Water 2021, 13, 1423. [Google Scholar] [CrossRef]
  55. Alonso, M. Fauna Iberica 7. In Crustacea Branchiopoda; Museo Nacional de Ciencias Naturales: Madrid, Spain, 1996; p. 486. [Google Scholar]
  56. Hudec, I. Anomopoda, Ctenopoda, Haplopoda, Onychopoda (Crustacea: Branchiopoda). Fauna Slovenska III; VEDA: Bratislava, Slovakia, 2010; p. 496. [Google Scholar]
  57. Błędzki, L.A.; Rybak, J.I. Freshwater Crustacean Zooplankton of Europe. Cladocera & Copepoda (Calanoida, Cyclopoida); Key to Species Identification, with Notes on Ecology, Distribution, Methods and Introduction to Data Analysis; Springer International Publishing: Cham, Switzerland, 2016; p. 918. [Google Scholar]
  58. Rogers, D.C.; Thorp, J.H. Thorp and Covich’s Freshwater Invertebrates: Volume 4: Keys to Palaearctic Fauna; Academic Press: Oxford, UK, 2019; p. 920. [Google Scholar]
  59. Rogers, D.C.; Thorp, J.H.K. (Eds.) Keys to Zooplankton and Zoobenthos of Fresh Waters of European Russia, Volume 1: Zooplankton; Tovarishchestvo Nauchn. Izd. KMK: Moscow, Russia, 2010. [Google Scholar]
  60. Jing, H.W.; Hua, L.; Sun, C.H.; Guo, J. Analysis on urban lakes’ eutrophication status in Beijing. Sci. Limnol. Sin. 2008, 20, 357–363. [Google Scholar]
  61. Zhang, Y.L.; Zhou, Y.Q.; Shi, K.; Qin, B.Q.; Yao, X.L.; Zhang, Y.B. Optical properties and composition changes in chromophoric dissolved organic matter along trophic gradients: Implications for monitoring and assessing lake eutrophication. Water Res. 2018, 131, 255–263. [Google Scholar] [CrossRef]
  62. Legendre, P.; Legendre, L. Numerical Ecology, 3rd ed.; Elsevier: Oxford, UK, 2012. [Google Scholar]
  63. Borcard, D.; Gillet, F.; Legendre, P. Numerical Ecology with R; Springer: New York, NY, USA, 2011. [Google Scholar]
  64. R Core Team. R: A Language and Environment for Statistical Computing; R Core Team: Vienna, Austria, 2020; Available online: http://www.R–project.org/ (accessed on 10 November 2022).
  65. Oksanen, J.; Simpson, G.; Blanchet, F.; Kindt, R.; Legendre, P.; Minchin, P.; O’Hara, R.; Solymos, P.; Stevens, M.; Szoecs, E.; et al. vegan: Community Ecology Package. R Package Version 2.6-2. 2022. Available online: https://CRAN.R-project.org/package=vegan (accessed on 11 November 2022).
  66. Maselli, V.; Pellegrini, C.; Del Bianco, F.; Mercorella, A.; Nones, M.; Crose, L.; Guerrero, M.; Nittrouer, J.A. River morphodynamic evolution under dam-induced backwater: An example from the Po River (Italy). J. Sediment. Res. 2018, 88, 1190–1204. [Google Scholar] [CrossRef] [Green Version]
  67. Liro, M. Dam reservoir backwater as a field-scale laboratory of human-induced changes in river biogeomorphology: A review focused on gravel-bed rivers. Sci. Total Environ. 2019, 651, 2899–2912. [Google Scholar] [CrossRef]
  68. McCabe, D.J. Rivers and Streams: Life in Flowing Water. Nat. Educ. Knowl. 2010, 1, 4. [Google Scholar]
  69. Deng, A.; Ye, C.; Liu, W. Spatial and seasonal patterns of nutrients and heavy metals in twenty-seven rivers draining into the South China Sea. Water 2018, 10, 50. [Google Scholar] [CrossRef] [Green Version]
  70. Jayme-Torres, G.; Hansen, A.M. Nutrient loads in the river mouth of the Río Verde basin in Jalisco, Mexico: How to prevent eutrophication in the future reservoir? Environ. Sci. Pollut. Res. Int. 2018, 25, 20497–20509. [Google Scholar] [CrossRef] [PubMed]
  71. Tockner, K.; Baumgartner, C.; Schiemer, F.; Ward, J.V. Biodiversity of a Danubian Floodplain: Structural, Functional and Compositional Aspects. In Biodiversity in Wetlands: Assessment, Function and Conservation; Backhuys Publishers: Leiden, The Netherlands, 2000. [Google Scholar]
  72. Guti, G. Significance of side-tributaries and floodplains for the Danubian fish populations. Arch. Hydrobiol. Suppl. 2002, 13, 151–163. [Google Scholar] [CrossRef] [Green Version]
  73. Bazarova, B.B.; Tashlykova, N.A.; Afonina, E.Y.; Kuklin, A.P.; Matafonov, P.V.; Tsybekmitova, G.T. Biodiversity of the Ingoda River ecosystem. IOP Conf. Ser. Earth Environ. Sci. 2022, 962, 012006. [Google Scholar] [CrossRef]
  74. Okhapkin, A.G.; Genkal, S.I.; Scharagina, E.M.; Vodeneeva, E.L. Structure and dynamics of phytoplankton in the Oka River mouth at the beginning of the 21st century. Inland Water Biol. 2014, 7, 357–365. [Google Scholar] [CrossRef]
  75. Meng, X.; Zhang, W.; Baoqing, S. Distribution of nitrogen and phosphorus and estimation of nutrient fluxes in the water and sediments of Liangzi Lake, China. Environ. Sci. Pollut. Res. Int. 2020, 27, 7096–7104. [Google Scholar] [CrossRef]
  76. Korneva, L.G. Invasions of alien species of planktonic microalgae into the fresh waters of Holarctic (Review). Russ. J. Biol. Invasions 2014, 5, 65–81. [Google Scholar] [CrossRef]
  77. Kulizin, P.V.; Gusev, E.S.; Vodeneeva, E.L.; Okhapkin, A.G. Taxonomic composition and morphology of silica-scaled Chrysophytes of some left-bank Volga tributaries. Inland Water Biol. 2021, 14, 357–367. [Google Scholar] [CrossRef]
  78. Kaštovský, J.; Hauer, T.; Mareš, J.; Krautová, M.; Bešta, T.; Komárek, J.; Desortová, B.; Heteša, B.; Hindáková, A.; Houk, V.; et al. A review of the alien and expansive species of freshwater cyanobacteria and algae in the Czech Republic. Biol. Invasions 2010, 12, 3599–3625. [Google Scholar] [CrossRef]
  79. Krztoń, W.; Kosiba, J.; Pociecha, A.; Wilk-Woźniak, E. The effect of cyanobacterial blooms on bio- and functional diversity of zooplankton communities. Biodivers. Conserv. 2019, 28, 1815–1835. [Google Scholar] [CrossRef] [Green Version]
  80. Pinel-Alloul, B.; Chemli, A.; Taranu, Z.E.; Bertolo, A. Using the diversity, taxonomic and functional attributes of a zooplankton community to determine lake environmental typology in the natural southern boreal lakes (Québec, Canada). Water 2022, 13, 578. [Google Scholar] [CrossRef]
  81. Sługocki, L.; Czerniawski, R. Trophic state (TSISD) and mixing type significantly influence pelagic zooplankton biodiversity in temperate lakes (NW Poland). PeerJ 2018, 6, e5731. [Google Scholar] [CrossRef] [Green Version]
  82. Pomari, J.; Kane, D.D.; Nogueira, M.G. Application of multiple-use indices to assess reservoirs water quality and the use of plankton community data for biomonitoring purposes. Int. J. of Hyd. 2018, 2, 168–179. [Google Scholar] [CrossRef] [Green Version]
  83. Hoffmann, M.; Dodson, S. Land use, primary productivity, and lake area as descriptors of zooplankton diversity. Ecology 2005, 86, 255–261. [Google Scholar] [CrossRef]
  84. Monakov, A.V. Feeding of Freshwater Invertebrates; Kenobi Productions: Ghent, Belgium, 2003. [Google Scholar]
Figure 1. Map showing the location of the sampling stations in the Vetluga and the Sura rivers (tributaries of the Cheboksary Reservoir, Middle Volga basin, European Russia).
Water 15 00074 g001
Figure 2. Scatter plots of Shannon’s Diversity and Pielou’s Evenness indices, species richness and average individual body weight for phytoplankton in the river mouth; the solid line indicates the linear regression, color-coding means trophic status (blue—oligotrophic, green—mesotrophic, yellow—slightly eutrophic, orange—medium eutrophic, red—highly eutrophic).
Water 15 00074 g002
Figure 3. Scatter plots of Shannon’s Diversity and Pielou’s Evenness indices, species richness, average individual body weight for zooplankton and abundance of predatory and filtrating zooplankton in the river mouth areas; the solid line indicates the linear regression, color-coding means trophic status (blue—oligotrophic, green—mesotrophic, yellow—slightly eutrophic, orange—medium eutrophic, red—highly eutrophic).
Water 15 00074 g003
Figure 4. Zooplankton communities’ CCA ordination plots ((A)—samples and factors; (B)—dominant zooplankton species). The decoding of the factors is presented in Table 4.
Water 15 00074 g004
Figure 5. Phytoplankton communities’ CCA ordination plots ((A)—samples and factors; (B)—dominant zooplankton species). The decoding of the factors is presented in Table 4.
Water 15 00074 g005
Figure 6. Boxplots of changes in the TSI in different periods (interannual variation) of the study in Sura River (a), Vetluga River (b) and in general for the entire period of the study (c) for mouth areas of the Sura River and the Vetluga River. Red dots—underlying distribution of the data.
Water 15 00074 g006
Table 1. Environmental indicators (mean ± SD) measured in the mouth areas of the Sura and Vetluga rivers (2019–2021).
Environmental Indicators201920202021
Sura RiverVetluga RiverSura RiverVetluga RiverSura RiverVetluga River
Transparency (SD), m1.1 ± 0.11.1 ± 0.10.8 ± 0.10.9 ± 0.041.0 ± 0.10.9 ± 0.03
Dissolved oxygen (DO), mg/L11.9 ± 0.58.7 ± 0.13.5 ± 0.048.5 ± 0.36.2 ± 0.38.3 ± 0.3
pH9.3 ± 0.18.8 ± 0.017.8 ± 0.037.9 ± 0.18.5 ± 0.038.4 ± 0.04
Elect. conductivity (EC), µS/cm630.6 ± 37.0203.4 ± 11.8693.9 ± 3.5234.7 ± 10.0701.3 ± 16.2239.7 ± 3.8
Water temperature (WT), °C22.2 ± 0.221.1 ± 0.121.8 ± 0.0521.2 ± 0.124.5 ± 0.126.3 ± 0.3
Chlorophyll-a (Chl-a), mg/L26.7 ± 2.66.3 ± 1.015.0 ± 2.510.4 ± 1.117.9 ± 2.511.8 ± 0.9
Total phosphorus (TP), µg/L0.2 ± 0.040.04 ± 0.010.2 ± 0.040.1 ± 0.010.2 ± 0.030.1 ± 0.002
Table 2. Dominant taxa of phytoplankton in different trophic conditions.
Trophic StatusDominant Taxa
oligotrophicAulacoseira subarctica (O. Müll.) E.Y. Haw.—22.6%;
Aulacoseira granulata (Ehrenb.) Simonsen—10.1%
mesotrophicAulacoseira subarctica (O. Müll.) E.Y. Haw.—16.1%;
Aulacoseira granulata (Ehrenb.) Simonsen—15.1%
slightly eutrophicAphanocapsa incerta (Lemmermann) G. Cronberg & Komárek—13.4%; Anabaena sp.—11.7%
medium eutrophicAphanocapsa incerta (Lemmermann) G. Cronberg & Komárek—15.2%;
Aphanizomenon flos-aquae Ralfs ex Bornet & Flahault—10.9%
highly eutrophicAphanocapsa incerta (Lemmermann) G. Cronberg & Komárek—18.9%
Table 3. Dominant taxa of zooplankton in different trophic conditions.
Trophic StatusDominant Taxa
oligotrophicSynchaeta pectinata Ehrenberg, 1832—35.3%;
Asplanchna priodonta Gosse, 1850—20.3%; Keratella cochlearis (Gosse, 1851)—11.9%
mesotrophicNauplius Copepoda—18.2%; Copepodite stages—13.0%;
Brachionus angularis Gosse, 1851—10.9%; Asplanchna priodonta Gosse, 1850—10.0%
slightly eutrophicNauplius Copepoda—16.9%; Brachionus angularis Gosse, 1851—12.8%; Copepodite stages—11.8%
medium eutrophicNauplius Copepoda—14.7%; Brachionus angularis Gosse, 1851—14.1%;
Copepodite stages—11.5%; Daphnia (Daphnia) cucullata Sars, 1862—11.4%
highly eutrophicNauplius Copepoda—19.3%; Brachionus angularis Gosse, 1851—17.6%;
Daphnia (Daphnia) cucullata Sars, 1862—15.1%; Diaphanosoma orghidani Negrea, 1982—11.4%
Table 4. Permutation tests results for canonical correspondence analysis (CCA) models, constructed for each variable in the Sura River and the Vetluga River mouth areas in 2019–2021.
FactorsAdjusted R2FP
PhytoplanktonRotifera abundance (Nrot)0.0151.880.001 *
Cladocera abundance (Nclad)0.0151.830.002 *
Copepoda abundance (Ncop)0.0081.440.008 *
Dissolved oxygen (DO)0.0232.320.001 *
Hydrogen indicator (pH)0.0222.250.001 *
Electrical conductivity (EC)0.0483.810.001 *
Water temperature (WT)0.0172.000.001 *
Trophic State Index (TSI)0.0302.700.001 *
ZooplanktonBacillariophyta abundance (Nbacil)0.0353.020.001 *
Chlorophyta abundance (Nchlor)0.0342.940.003 *
Phytoflagellate abundance (Nphytoflag)0.0282.610.002 *
Chlorophyll-a (Chl_a)0.0272.570.001 *
Electrical conductivity (EC)0.0866.250.001 *
Water temperature (WT)0.0423.490.001 *
Dissolved oxygen (DO)0.0463.690.002 *
Trophic State Index (TSI)0.0785.750.001 *
Notes: Adjusted R2—the adjusted proportion of variability which explains each factor; pseudo-F—the test statistic of permutation test; P—probability of random influence of a factor; *—significant factors, p-value < 0.05. The table lists only factors that have a statistically significant effect.
Disclaimer/Publisher’s Note: The statements, opinions and data contained in all publications are solely those of the individual author(s) and contributor(s) and not of MDPI and/or the editor(s). MDPI and/or the editor(s) disclaim responsibility for any injury to people or property resulting from any ideas, methods, instructions or products referred to in the content.

