
Heavy Metal Estimation and Quality Assurance Parameters for Water Resources in the Northern Region of Pakistan


 ,
,  ,
,
Abstract
:1. Introduction
2. Geology of the Studied Area
3. Materials and Methods
3.1. Sampling Area
3.2. Sampling and Analysis
4. Results
4.1. Physical Parameters
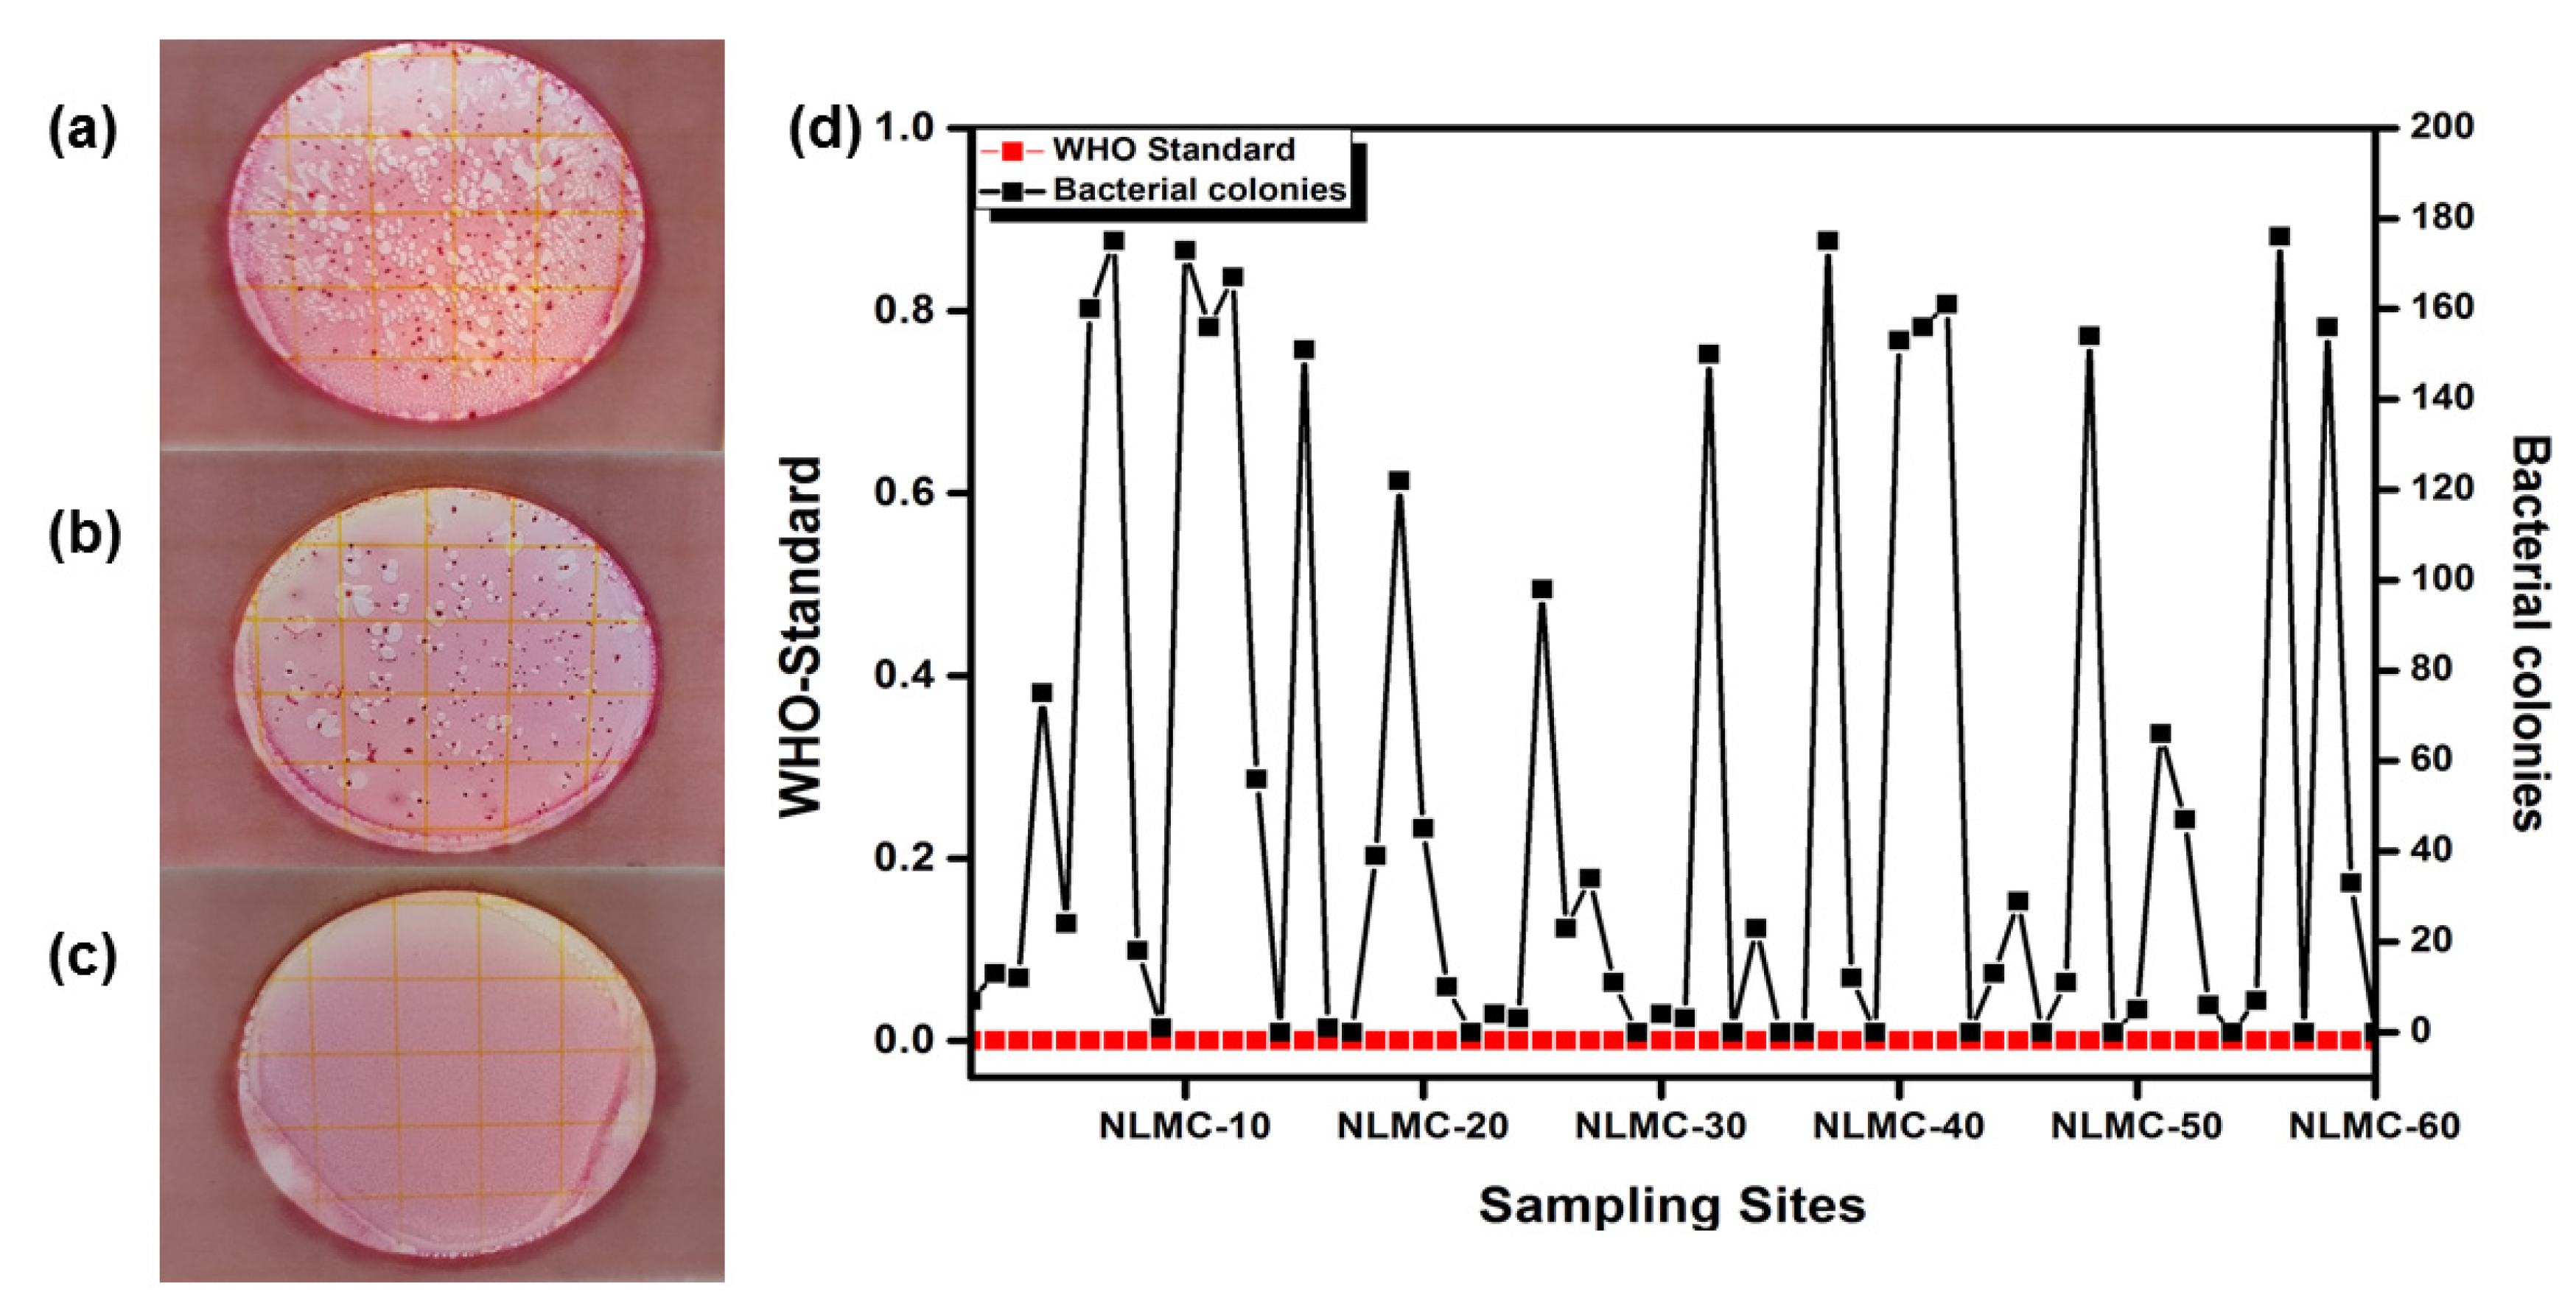
4.2. Bacterial Analysis
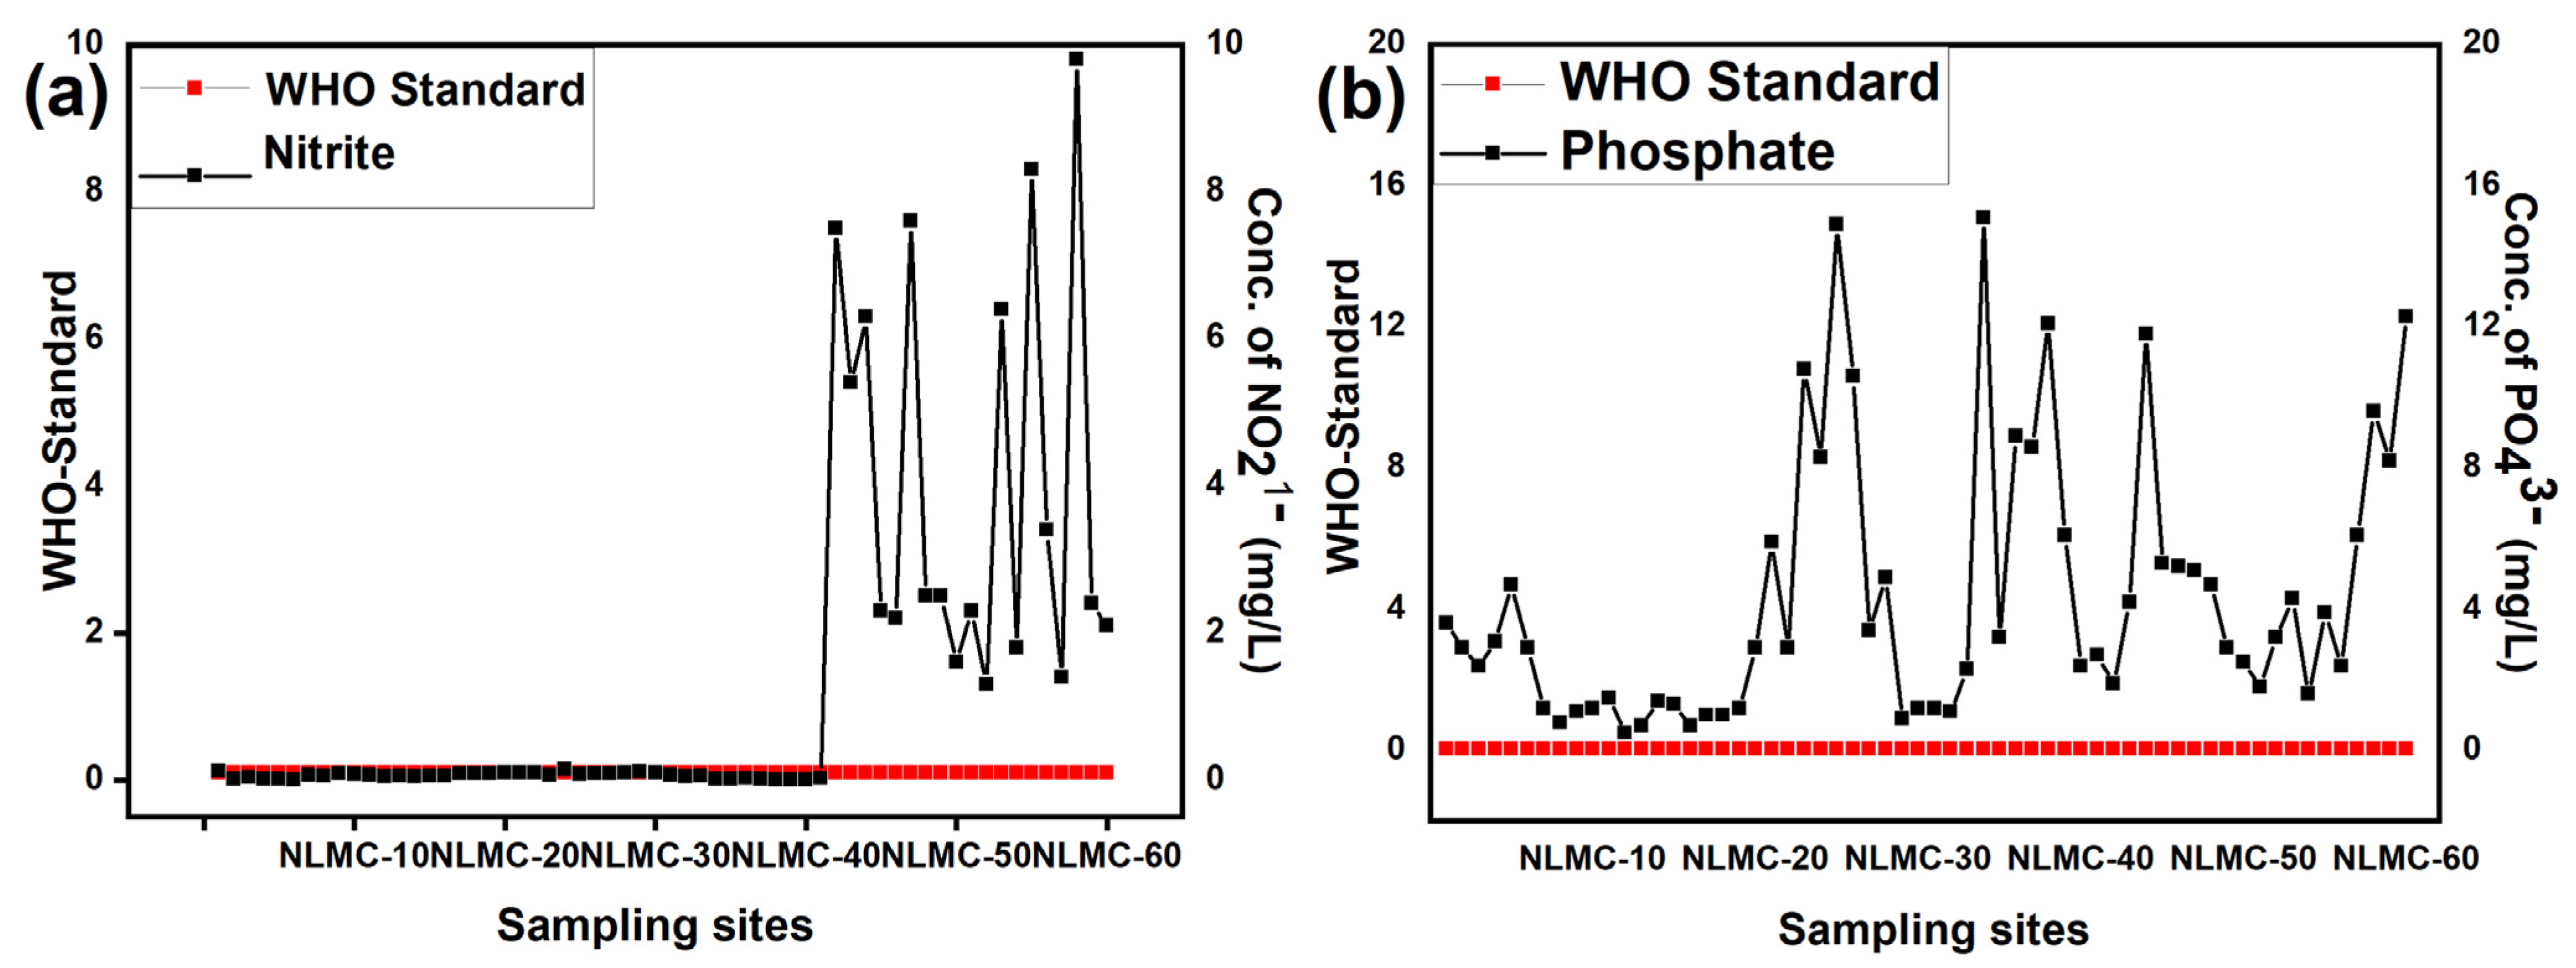
4.3. Anions
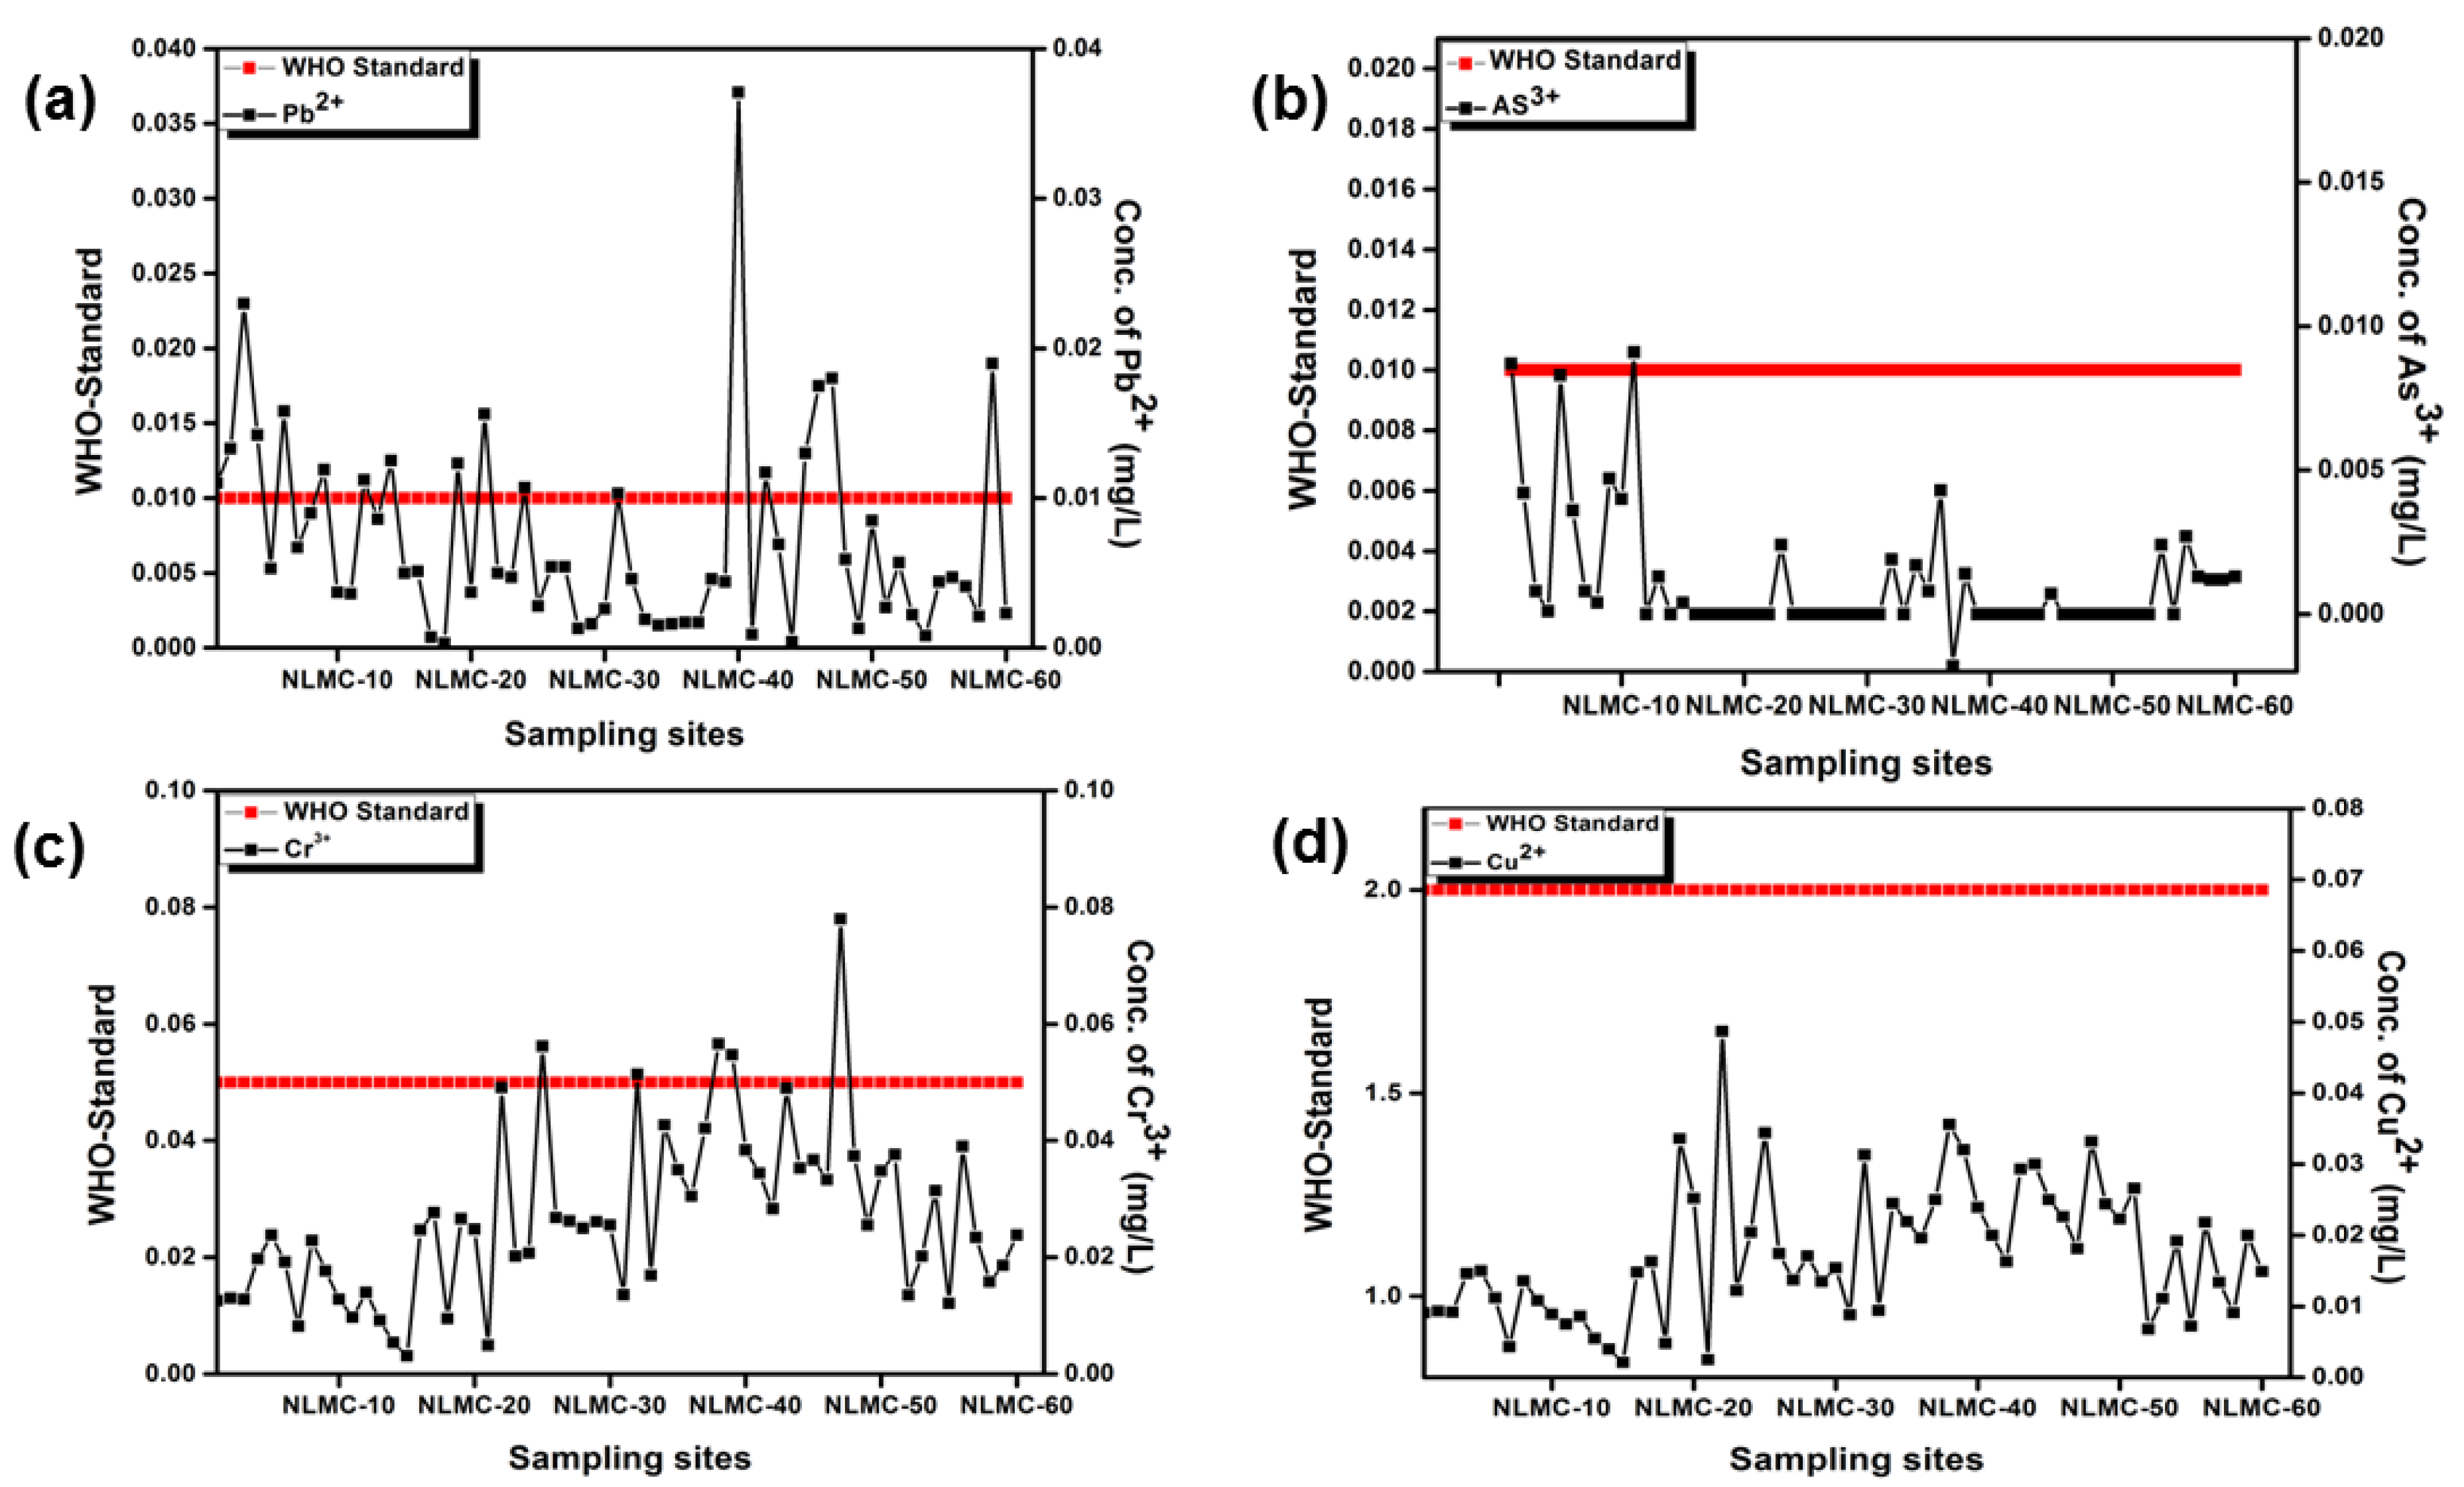
4.4. Metal Cations
5. Discussion
6. Conclusions
Supplementary Materials
Author Contributions
Funding
Data Availability Statement
Acknowledgments
Conflicts of Interest
References
- Vega, M.; Pardo, R.; Barrado, E.; Debán, L. Assessment of seasonal and polluting effects on the quality of river water by exploratory data analysis. Water Res. 1998, 32, 3581–3592. [Google Scholar] [CrossRef]
- Norris, R.H.; Thoms, M.C. What is river health? Freshw. Biol. 1999, 41, 197–209. [Google Scholar] [CrossRef] [Green Version]
- Suding, K.N.; Collins, S.L.; Gough, L.; Clark, C.; Cleland, E.E.; Gross, K.L.; Milchunas, D.G.; Pennings, S.J. Functional-and abundance-based mechanisms explain diversity loss due to N fertilization. Proc. Natl. Acad. Sci. USA 2005, 102, 4387–4392. [Google Scholar] [CrossRef] [PubMed] [Green Version]
- Chai, F.; Wang, C.; Wang, T.; Li, L.; Su, Z. Colorimetric detection of Pb2+ using glutathione functionalized gold nanoparticles. ACS Appl. Mater. Interfaces 2010, 2, 1466–1470. [Google Scholar] [CrossRef] [PubMed]
- Brookes, P.J.B. The use of microbial parameters in monitoring soil pollution by heavy metals. Biol. Fertil. Soils 1995, 19, 269–279. [Google Scholar] [CrossRef]
- Inglezakis, V.; Poulopoulos, S. Adsorption, Ion Exchange and Catalysis; Elsevier: Amsterdam, The Netherlands, 2006; Volume 3. [Google Scholar]
- Selvakumar, S.; Chandrasekar, N.; Kumar, G. Industry. Hydrogeochemical characteristics and groundwater contamination in the rapid urban development areas of Coimbatore, India. Water Res. 2017, 17, 26–33. [Google Scholar]
- Jacobson, M.Z. Review of solutions to global warming, air pollution, and energy security. Energy Environ. Sci. 2009, 2, 148–173. [Google Scholar] [CrossRef]
- Delaire, C.; Peletz, R.; Kumpel, E.; Kisiangani, J.; Bain, R.; Khush, R.J. How much will it cost to monitor microbial drinking water quality in sub-Saharan Africa? Environ. Sci. Technol. 2017, 51, 5869–5878. [Google Scholar] [CrossRef] [Green Version]
- Eckner, K.F. Comparison of membrane filtration and multiple-tube fermentation by the Colilert and Enterolert methods for detection of waterborne coliform bacteria, Escherichia coli, and enterococci used in drinking and bathing water quality monitoring in southern Sweden. Appl. Environ. Microbiol. 1998, 64, 3079–3083. [Google Scholar]
- Byappanahalli, M.N.; Nevers, M.B.; Korajkic, A.; Staley, Z.R.; Harwood, V.J.J.M. Enterococci in the environment. Microbiol. Mol. Biol. 2012, 76, 685–706. [Google Scholar] [CrossRef] [Green Version]
- Payment, P.; Franco, E. Clostridium perfringens and somatic coliphages as indicators of the efficiency of drinking water treatment for viruses and protozoan cysts. Appl. Environ. Microbiol. 1993, 59, 2418–2424. [Google Scholar] [CrossRef] [PubMed] [Green Version]
- Suthar, S.; Chhimpa, V.; Singh, S. assessment. Bacterial contamination in drinking water: A case study in rural areas of northern Rajasthan, India. Environ. Monit. Assess. 2009, 159, 43–50. [Google Scholar] [CrossRef] [PubMed]
- Kapembo, M.L.; Mukeba, F.B.; Sivalingam, P.; Mukoko, J.B.; Bokolo, M.K.; Mulaji, C.K.; Mpiana, P.T.; Poté, J.W. Survey of water supply and assessment of groundwater quality in the suburban communes of Selembao and Kimbanseke, Kinshasa in Democratic Republic of the Congo. Sustain. Water Resour. Manag. 2022, 8, 3. [Google Scholar] [CrossRef] [PubMed]
- Nabi, G.; Ali, M.; Khan, S.; Kumar, S. The crisis of water shortage and pollution in Pakistan: Risk to public health, biodiversity, and ecosystem. Environ. Sci. Pollut. Res. 2019, 26, 10443–10445. [Google Scholar] [CrossRef] [PubMed] [Green Version]
- Hamad, A.A.; Sharaf, M.; Hamza, M.A.; Selim, S.; Hetta, H.F.; El-Kazzaz, W. Investigation of the Bacterial Contamination and Antibiotic Susceptibility Profile of Bacteria Isolated from Bottled Drinking Water. Microbiol. Spectr. 2022, 10, e0151621. [Google Scholar] [CrossRef] [PubMed]
- Tarr, C.L.; Patel, J.S.; Puhr, N.D.; Sowers, E.G.; Bopp, C.A.; Strockbine, N.A. Identification of Vibrio isolates by a multiplex PCR assay and rpoB sequence determination. J. Clin. Microbiol. 2007, 45, 134–140. [Google Scholar] [CrossRef] [Green Version]
- Endt, K.; Stecher, B.; Chaffron, S.; Slack, E.; Tchitchek, N.; Benecke, A.; Van Maele, L.; Sirard, J.-C.; Mueller, A.J.; Heikenwalder, M. The microbiota mediates pathogen clearance from the gut lumen after non-typhoidal Salmonella diarrhea. PLoS Pathog. 2010, 6, e1001097. [Google Scholar] [CrossRef] [Green Version]
- Kotloff, K.L.; Riddle, M.S.; Platts-Mills, J.A.; Pavlinac, P.; Zaidi, A.K. Shigellosis. Lancet 2018, 391, 801–812. [Google Scholar] [CrossRef]
- Li, T.-C.; Yuan, C.-S.; Huang, H.-C.; Lee, C.-L.; Wu, S.-P.; Tong, C. Inter-comparison of seasonal variation, chemical characteristics, and source identification of atmospheric fine particles on both sides of the Taiwan Strait. Sci. Rep. 2016, 6, 22956. [Google Scholar] [CrossRef] [Green Version]
- Djam, S.; Najafi, M.; Ahmadi, H.; Shoeibi, S. Assessment of Significant Anions of Nitrite, Nitrate, Fluoride, Chloride, Sulfate and Phosphate in Mineral and Drinking Bottled Waters and Their Roles in Contamination %J Nutrition and Food Sciences Research. Nutr. Food Sci. Res. 2022, 9, 17–21. [Google Scholar]
- Khan, M.R.; Samdani, M.S.; Azam, M.; Ouladsmane, M. UPLC-ESI/MS analysis of disinfection by-products (perchlorate, bromate, nitrate, nitrite and sulfite) in micro-filtered drinking water obtained from spring, well and tap water (desalinated) sources. J. King Saud Univ.-Sci. 2021, 33, 101408. [Google Scholar] [CrossRef]
- Ahsan, M.A.; Siddique, M.A.B.; Munni, M.A.; Akbor, M.A.; Akter, S.; Mia, M.Y. Analysis of physicochemical parameters, anions and major heavy metals of the Dhaleshwari River water, Tangail, Bangladesh. Am. J. Environ. Prot. 2018, 7, 29–39. [Google Scholar]
- Gustine, D.L. Aliphatic Nitro Compounds in Crownvetch: A Review. Crop Sci. 1979, 19, 197–203. [Google Scholar] [CrossRef]
- Grirrane, A.; Corma, A.; Garcia, H. Preparation of symmetric and asymmetric aromatic azo compounds from aromatic amines or nitro compounds using supported gold catalysts. Nat. Protoc. 2010, 5, 429–438. [Google Scholar] [CrossRef]
- Camargo, J.A.; Alonso, Á. Ecological and toxicological effects of inorganic nitrogen pollution in aquatic ecosystems: A global assessment. Environ. Int. 2006, 32, 831–849. [Google Scholar] [CrossRef]
- Järup, L. Hazards of heavy metal contamination. Br. Med. Bull. 2003, 68, 167–182. [Google Scholar] [CrossRef] [Green Version]
- Kumar, S.; Islam, A.R.M.T.; Islam, H.T.; Hasanuzzaman, M.; Ongoma, V.; Khan, R.; Mallick, J. Water resources pollution associated with risks of heavy metals from Vatukoula Goldmine region, Fiji. J. Environ. Manag. 2021, 293, 112868. [Google Scholar] [CrossRef]
- Abd Byty, A.; Gharbi, M.; Assaf, A. Estimation of the Concentration of some heavy metals in groundwater in Rutba City. Proc. IOP Conf. Ser. Earth Environ. Sci. 2021, 904, 012009. [Google Scholar] [CrossRef]
- Gad, M.; Saleh, A.H.; Hussein, H.; Farouk, M.; Elsayed, S. Appraisal of surface water quality of nile river using water quality indices, spectral signature and multivariate modeling. Water 2022, 14, 1131. [Google Scholar] [CrossRef]
- Gad, M.; Abou El-Safa, M.M.; Farouk, M.; Hussein, H.; Alnemari, A.M.; Elsayed, S.; Khalifa, M.M.; Moghanm, F.S.; Eid, E.M.; Saleh, A.H. Integration of water quality indices and multivariate modeling for assessing surface water quality in Qaroun Lake, Egypt. Water 2021, 13, 2258. [Google Scholar] [CrossRef]
- Singh, U.K.; Kumar, B. Pathways of heavy metals contamination and associated human health risk in Ajay River basin, India. Chemosphere 2017, 174, 183–199. [Google Scholar] [CrossRef] [PubMed]
- Alonso, M.L.; Montaña, F.P.; Miranda, M.; Castillo, C.; Hernández, J.; Benedito, J.L. Interactions between toxic (As, Cd, Hg and Pb) and nutritional essential (Ca, Co, Cr, Cu, Fe, Mn, Mo, Ni, Se, Zn) elements in the tissues of cattle from NW Spain. Biometals 2004, 17, 389–397. [Google Scholar] [CrossRef] [PubMed]
- Archer, D.R.; Fowler, H.J. Using meteorological data to forecast seasonal runoff on the River Jhelum, Pakistan. J. Hydrol. 2008, 361, 10–23. [Google Scholar] [CrossRef]
- Ahmad, K.S.; Hamid, A.; Nawaz, F.; Hameed, M.; Ahmad, F.; Deng, J.; Akhtar, N.; Wazarat, A.; Mahroof, S.J. ethnomedicine. Ethnopharmacological studies of indigenous plants in Kel village, Neelum valley, Azad Kashmir, Pakistan. J. Ethnobiol. Ethnomedicine 2017, 13, 68. [Google Scholar] [CrossRef] [PubMed]
- Abbasi, M.K.; Zafar, M.; Khan, S.R. Influence of different land-cover types on the changes of selected soil properties in the mountain region of Rawalakot Azad Jammu and Kashmir. Nutr. Cycl. Agroecosystems 2007, 78, 97–110. [Google Scholar] [CrossRef]
- Rafique, M.; Rahman, S.U.; Mahmood, T.; Rahman, S.; Rehman, S.U. Radon exhalation rate from soil, sand, bricks, and sedimentary samples collected from Azad Kashmir, Pakistan. Russ. Geol. Geophys. 2011, 52, 450–457. [Google Scholar] [CrossRef]
- Ahmad, K.S.; Hameed, M.; Fatima, S.; Ashraf, M.; Ahmad, F.; Naseer, M.; Akhtar, N. Morpho-anatomical and physiological adaptations to high altitude in some Aveneae grasses from Neelum Valley, Western Himalayan Kashmir. Acta Physiol. Plant. 2016, 38, 39. [Google Scholar] [CrossRef]
- Malkani, M.S. Mineral Resources of Gilgit Baltistan and Azad Kashmir, Pakistan: An Update. Open J. Geol. 2020, 10, 661–702. [Google Scholar] [CrossRef]
- Puls, R.W.; Barcelona, M.J. Low-Flow (Minimal Drawdown) Ground-Water Sampling Procedures; US Environmental Protection Agency, Office of Research and Development: Washington, DC, USA, 1996.
- Yoder, L.J.I.; Chemistry, E. Adaptation of the Mohr volumetric method to general determinations of chlorine. Ind. Eng. Chem. 1919, 11, 755. [Google Scholar] [CrossRef] [Green Version]
- Kuppan, C.; Sangadi, P. Hydro-geochemical evaluation and health risk assessment of groundwater in coastal regions: A case study of eastern Andhra Pradesh, South India. Arab. J. Geosci. 2021, 14, 1125. [Google Scholar] [CrossRef]
- Othman, M.R.; Hassan, M.A.; Shirai, Y.; Baharuddin, A.S.; Ali, A.A.M.; Idris, J. Treatment of effluents from palm oil mill process to achieve river water quality for reuse as recycled water in a zero emission system. J. Clean. Prod. 2014, 67, 58–61. [Google Scholar] [CrossRef]
- Kumar, P.; Meena, N.K.; Mahajan, A.K. Major ion chemistry, catchment weathering and water quality of Renuka Lake, north-west Himalaya, India. Environ. Earth Sci. 2019, 78, 319. [Google Scholar] [CrossRef]
- dos Santos Silva, E.; Correia, L.O.; dos Santos, L.O.; dos Santos Vieira, E.V.; Lemos, V.A. Dispersive liquid-liquid microextraction for simultaneous determination of cadmium, cobalt, lead and nickel in water samples by inductively coupled plasma optical emission spectrometry. Microchim. Acta 2012, 178, 269–275. [Google Scholar] [CrossRef]
- Taulo, S.; Wetlesen, A.; Abrahamsen, R.; Kululanga, G.; Mkakosya, R.; Grimason, A. Microbiological hazard identification and exposure assessment of food prepared and served in rural households of Lungwena, Malawi. Int. J. Food Microbiol. 2008, 125, 111–116. [Google Scholar] [CrossRef] [PubMed]
- Akter, J.; Islam, M.; Kibria, K.Q. Adsorption of phosphate ions on chicken feather hydrochar and hydrochar-soil mixtures. Water Air Soil Pollut. 2021, 232, 413. [Google Scholar] [CrossRef]
- Lu, Y.; Song, S.; Wang, R.; Liu, Z.; Meng, J.; Sweetman, A.J.; Jenkins, A.; Ferrier, R.C.; Li, H.; Luo, W. Impacts of soil and water pollution on food safety and health risks in China. Environ. Int. 2015, 77, 5–15. [Google Scholar] [CrossRef] [Green Version]
- Liu, L.; Bilal, M.; Duan, X.; Iqbal, H.M. Mitigation of environmental pollution by genetically engineered bacteria—Current challenges and future perspectives. Sci. Total Environ. 2019, 667, 444–454. [Google Scholar] [CrossRef]
- Edberg, S.; Rice, E.; Karlin, R.; Allen, M.J. Escherichia coli: The best biological drinking water indicator for public health protection. J. Appl. Microbiol. 2000, 88, 106S–116S. [Google Scholar] [CrossRef]
- Grabow, W. Waterborne diseases: Update on water quality assessment and control. Water Sa 1996, 22, 193–202. [Google Scholar]
- Ochsenkühn, M.A.; Fei, C.; Bayaara, O.; Romeo, E.; Amosa, P.; Idaghdour, Y.; Goldstein, G.; Bromage, T.G.; Amin, S.A. Microbial Contamination Survey of Environmental Fresh and Saltwater Resources of Upolu Island, Samoa. Environments 2021, 8, 112. [Google Scholar] [CrossRef]
- Castaneda-Villanueva, A.A.; Lopez-Becerra, J. Determination of bacteriological contamination in surface water bodies: The highlands south of jalisco, mexico. Quantum J. Eng. Sci. Technol. 2022, 3, 31–48. [Google Scholar]
- Escamilla-Rodríguez, A.; Carlos-Hernández, S.; Díaz-Jiménez, L. Evidence of Resistance of Heavy Metals from Bacteria Isolated from Natural Waters of a Mining Area in Mexico. Water 2021, 13, 2766. [Google Scholar] [CrossRef]
- Ye, X.Y.; Ming, X.; Zhang, Y.L.; Xiao, W.Q.; Huang, X.N.; Cao, Y.G.; Gu, K.D. Real-time PCR detection of enteric viruses in source water and treated drinking water in Wuhan, China. Curr. Microbiol. 2012, 65, 244–253. [Google Scholar] [CrossRef]
- Karanis, P.; Schoenen, D.; Seitz, H. Distribution and removal of Giardia and Cryptosporidium in water supplies in Germany. Water Sci. Technol. 1998, 37, 9–18. [Google Scholar] [CrossRef]
- Lujan, H.D.; Svärd, S. Giardia: A Model Organism; Springer: Berlin/Heidelberg, Germany, 2011. [Google Scholar]
- Dhagat, S.; Jujjavarapu, S.E. Microbial Pathogenesis: Mechanism and Recent Updates on Microbial Diversity of Pathogens. In Antimicrobial Resistance; Springer: Berlin/Heidelberg, Germany, 2022; pp. 71–111. [Google Scholar]
- Severini, E.; Bartoli, M.; Pinardi, M.; Celico, F. Short-Term Effects of the EU Nitrate Directive Reintroduction: Reduced N Loads to River from an Alluvial Aquifer in Northern Italy. Hydrology 2022, 9, 44. [Google Scholar] [CrossRef]
- Picetti, R.; Deeney, M.; Pastorino, S.; Miller, M.R.; Shah, A.; Leon, D.A.; Dangour, A.D.; Green, R. Nitrate and nitrite contamination in drinking water and cancer risk: A systematic review with meta-analysis. Environ. Res. 2022, 210, 112988. [Google Scholar] [CrossRef] [PubMed]
- Mirvish, S.S.; Wallcave, L.; Eagen, M.; Shubik, P. Ascorbate-nitrite reaction: Possible means of blocking the formation of carcinogenic N-nitroso compounds. Science 1972, 177, 65–68. [Google Scholar] [CrossRef]
- McClendon, J.F. Inverse relation between Iodin in food and drink and Goiter, Simple and Exophthalmic. J. Am. Med. Assoc. 1924, 82, 1668–1672. [Google Scholar] [CrossRef]
- Cozzolino, M.; Dusso, A.S.; Slatopolsky, E. Role of calcium-phosphate product and bone-associated proteins on vascular calcification in renal failure. J. Am. Soc. Nephrol. 2001, 12, 2511–2516. [Google Scholar] [CrossRef]
- Nagajyoti, P.C.; Lee, K.D.; Sreekanth, T. Heavy metals, occurrence and toxicity for plants: A review. Environ. Chem. Lett. 2010, 8, 199–216. [Google Scholar] [CrossRef]
- Dong, D.; Nelson, Y.M.; Lion, L.W.; Shuler, M.L.; Ghiorse, W.C. Adsorption of Pb and Cd onto metal oxides and organic material in natural surface coatings as determined by selective extractions: New evidence for the importance of Mn and Fe oxides. Water Res. 2000, 34, 427–436. [Google Scholar] [CrossRef] [Green Version]
- Calmuc, V.A.; Calmuc, M.; Arseni, M.; Topa, C.M.; Timofti, M.; Burada, A.; Iticescu, C.; Georgescu, L.P. Assessment of heavy metal pollution levels in sediments and of ecological risk by quality indices, applying a case study: The Lower Danube River, Romania. Water 2021, 13, 1801. [Google Scholar] [CrossRef]
- Zhou, Q.; Yang, N.; Li, Y.; Ren, B.; Ding, X.; Bian, H.; Yao, X. Total concentrations and sources of heavy metal pollution in global river and lake water bodies from 1972 to 2017. Glob. Ecol. Conserv. 2020, 22, e00925. [Google Scholar] [CrossRef]
- Nickson, R.; McArthur, J.; Shrestha, B.; Kyaw-Myint, T.; Lowry, D. Arsenic and other drinking water quality issues, Muzaffargarh District, Pakistan. Appl. Geochem. 2005, 20, 55–68. [Google Scholar] [CrossRef]
- Yong, A.; Hough, S.E.; Abrams, M.J.; Wills, C.J. Preliminary results for a semi-automated quantification of site effects using geomorphometry and ASTER satellite data for Mozambique, Pakistan and Turkey. J. Earth Syst. Sci. 2008, 117, 797–808. [Google Scholar] [CrossRef]
- Shahid, M.; Rahman, K.U.; Balkhair, K.S.; Nabi, A. Impact assessment of land use and climate changes on the variation of runoff in Margalla Hills watersheds, Pakistan. Arab. J. Geosci. 2020, 13, 239. [Google Scholar] [CrossRef]
- Alipour, H.; Pourkhabbaz, A.; Hassanpour, M. Estimation of potential health risks for some metallic elements by consumption of fish. Water Qual. Expo. Health 2015, 7, 179–185. [Google Scholar] [CrossRef]
- Muhammad, S.; Shah, M.T.; Khan, S. Health risk assessment of heavy metals and their source apportionment in drinking water of Kohistan region, northern Pakistan. Microchem. J. 2011, 98, 334–343. [Google Scholar] [CrossRef]
- Ali, U.; Batool, A.; Ghufran, M.; Asad-Ghufran, M.; Sabahat-Kazmi, S.; Hina-Fatimah, S. Assessment of heavy metal contamination in the drinking water of muzaffarabad, Azad Jammu and Kashmir, Pakistan. Int. J. Hydrog. 2019, 3, 331–337. [Google Scholar]
- Melnyk, B.M.; Alpert-Gillis, L.; Feinstein, N.F.; Crean, H.F.; Johnson, J.; Fairbanks, E.; Small, L.; Rubenstein, J.; Slota, M.; Corbo-Richert, B. Creating opportunities for parent empowerment: Program effects on the mental health/coping outcomes of critically ill young children and their mothers. Pediatrics 2004, 113, e597–e607. [Google Scholar] [CrossRef] [Green Version]
- Pinstrup-Andersen, P. Food security: Definition and measurement. Food Secur. 2009, 1, 5–7. [Google Scholar] [CrossRef]
- Clarke, R. Water: The International Crisis; Routledge: London, UK, 2013. [Google Scholar]
- Foster, J.E. Plasma-based water purification: Challenges and prospects for the future. Phys. Plasmas 2017, 24, 055501. [Google Scholar] [CrossRef]
- Boix, G.; Troyano, J.; Garzon-Tovar, L.; Camur, C.; Bermejo, N.; Yazdi, A.; Piella, J.; Bastus, N.G.; Puntes, V.F.; Imaz, I.; et al. MOF-beads containing inorganic nanoparticles for the simultaneous removal of multiple heavy metals from water. ACS Appl. Mater. Interfaces 2020, 12, 10554–10562. [Google Scholar] [CrossRef]
- Prathna, T.; Sharma, S.K.; Kennedy, M. Nanoparticles in household level water treatment: An overview. Sep. Purif. Technol. 2018, 199, 260–270. [Google Scholar]
- Godiya, C.B.; Cheng, X.; Li, D.; Chen, Z.; Lu, X. Carboxymethyl cellulose/polyacrylamide composite hydrogel for cascaded treatment/reuse of heavy metal ions in wastewater. J. Hazard. Mater. 2019, 364, 28–38. [Google Scholar] [CrossRef]
- Yang, X.; Wan, Y.; Zheng, Y.; He, F.; Yu, Z.; Huang, J.; Wang, H.; Ok, Y.S.; Jiang, Y.; Gao, B. Surface functional groups of carbon-based adsorbents and their roles in the removal of heavy metals from aqueous solutions: A critical review. Chem. Eng. J. 2019, 366, 608–621. [Google Scholar] [CrossRef]
- Li, W.; Feng, W.; Wu, S.; Wang, W.; Yu, D. Synergy of photothermal effect in integrated 0D Ti2O3 nanoparticles/1D carboxylated carbon nanotubes for multifunctional water purification. Sep. Purif. Technol. 2022, 292, 120989. [Google Scholar] [CrossRef]
- Yang, Y.; Xiong, Z.; Wang, Z.; Liu, Y.; He, Z.; Cao, A.; Zhou, L.; Zhu, L.; Zhao, S. Super-adsorptive and photo-regenerable carbon nanotube based membrane for highly efficient water purification. J. Membr. Sci. 2021, 621, 119000. [Google Scholar] [CrossRef]
- Scharlemann, J.P.; Brock, R.C.; Balfour, N.; Brown, C.; Burgess, N.D.; Guth, M.K.; Ingram, D.J.; Lane, R.; Martin, J.G.; Wicander, S. Towards understanding interactions between Sustainable Development Goals: The role of environment–human linkages. Sustain. Sci. 2020, 15, 1573–1584. [Google Scholar] [CrossRef] [Green Version]
- Bibi, I.; Shahid, M.; Niazi, N.K.; Younas, F.; Naqvi, S.R.; Shaheen, S.M.; Imran, M.; Wang, H.; Hussaini, K.M.; Zhang, H.J.J.o.H.M. Hydrogeochemical and health risk evaluation of arsenic in shallow and deep aquifers along the different floodplains of Punjab, Pakistan. J. Hazard. Mater. 2021, 402, 124074. [Google Scholar]
- Junk, W.J.; da Cunha, N.; Thomaz, S.M.; Agostinho, A.A.; Ferreira, F.A.; de Souza Filho, E.E.; Stevaux, J.C.; da Silva, J.C.B.; Rocha, P.C.; Kawakita, K. Macrohabitat classification of wetlands as a powerful tool for management and protection: The example of the Paraná River floodplain, Brazil. Ecohydrol. Hydrobiol. 2021, 21, 411–424. [Google Scholar] [CrossRef]
- Tonhá, M.S.; Araújo, D.F.; Araújo, R.; Cunha, B.C.; Machado, W.; Portela, J.F.; Souza, J.P.; Carvalho, H.K.; Dantas, E.L.; Roig, H.L. Trace metal dynamics in an industrialized Brazilian river: A combined application of Zn isotopes, geochemical partitioning, and multivariate statistics. J. Environ. Sci. 2021, 101, 313–325. [Google Scholar] [CrossRef] [PubMed]


| Parameter | Number of Samples | Minimum | Maximum | Mean | Std. Deviation |
|---|---|---|---|---|---|
| EC (µS/cm) | 60.0 | 6.60 | 974.6 | 200.1 | 79.10 |
| Temp (°C) | 60.0 | 9.00 | 27.00 | 17.79 | 3.400 |
| pH | 60.0 | 5.10 | 9.900 | 7.471 | 0.400 |
| TDS (mg/L) | 60.0 | 0.07 | 912.1 | 184.0 | 115.2 |
| Turbidity (NTU) | 60.0 | 0.00 | 8.300 | 0.970 | 0.801 |
| Hardness (mg/L) | 60.0 | 49.0 | 488.3 | 198.4 | 0.802 |
| NO2 | 60.0 | 0.00 | 9.800 | 1.320 | 108.7 |
| NO3 | 60.0 | 0.01 | >15.0 | 3.060 | 6.930 |
| F | 60.0 | 0.01 | 4.500 | 0.410 | 0.531 |
| Cl | 60.0 | 0.27 | 30.00 | 8.720 | 9.373 |
| SO4 | 60.0 | 8.00 | 270.0 | 56.75 | 20.55 |
| PO4 | 60.0 | 0.50 | 15.10 | 4.340 | 20.55 |
| As | 60.0 | 0.00 | 0.009 | 0.0008 | 0.002 |
| Cr | 60.0 | 0.003 | 0.057 | 0.0007 | 0.003 |
| Cu | 60.0 | 0.002 | 0.048 | 0.0029 | 0.009 |
| Pb | 60.0 | 0.0003 | 0.037 | 0.0070 | 0.005 |
| Contaminant | WHO limits |
|---|---|
| PH | 6.5–8.5 |
| EC | 400 µS/cm |
| TDS | 300–900 mg/L |
| Turbidity | 1 NTU |
| Hardness | 60–120 (mg/L) |
| Cl | 250.0 (mg/L) |
| F | 2.19 (mg/L) |
| NO2 | 0.1 (mg/L) |
| NO3 | 10.0 (mg/L) |
| SO4 | 250.0 (mg/L) |
| PO4 | 0.1 (mg/L) |
| As | 0.01 (mg/L) |
| Cr | 0.05(mg/L) |
| Cu | 2.0 (mg/L) |
| Pb | 0.01 (mg/L) |
| Bacteria | - |
Disclaimer/Publisher’s Note: The statements, opinions and data contained in all publications are solely those of the individual author(s) and contributor(s) and not of MDPI and/or the editor(s). MDPI and/or the editor(s) disclaim responsibility for any injury to people or property resulting from any ideas, methods, instructions or products referred to in the content. |
© 2022 by the authors. Licensee MDPI, Basel, Switzerland. This article is an open access article distributed under the terms and conditions of the Creative Commons Attribution (CC BY) license (https://creativecommons.org/licenses/by/4.0/).
Share and Cite
Hayder, R.; Hafeez, M.; Ahmad, P.; Memon, N.; Khandaker, M.U.; Elqahtani, Z.M.; Al-Buriahi, M.S.; Mahmoud, Z.M.M.; Ahmed, M.N. Heavy Metal Estimation and Quality Assurance Parameters for Water Resources in the Northern Region of Pakistan. Water 2023, 15, 77. https://doi.org/10.3390/w15010077
Hayder R, Hafeez M, Ahmad P, Memon N, Khandaker MU, Elqahtani ZM, Al-Buriahi MS, Mahmoud ZMM, Ahmed MN. Heavy Metal Estimation and Quality Assurance Parameters for Water Resources in the Northern Region of Pakistan. Water. 2023; 15(1):77. https://doi.org/10.3390/w15010077
Chicago/Turabian StyleHayder, Rizwan, Muhammad Hafeez, Pervaiz Ahmad, Najma Memon, Mayeen Uddin Khandaker, Zainab Mufarreh Elqahtani, M. S. Al-Buriahi, Zakaria M. M. Mahmoud, and Muhammad Naeem Ahmed. 2023. "Heavy Metal Estimation and Quality Assurance Parameters for Water Resources in the Northern Region of Pakistan" Water 15, no. 1: 77. https://doi.org/10.3390/w15010077