

Study of the Internal Cyclonic Flow Characteristics of Cyclones with Different Guide Vane Heights
College of Water Resource Science and Engineering, Taiyuan University of Technology, Taiyuan 030024, China
*
Author to whom correspondence should be addressed.
Water 2023, 15(1), 78; https://doi.org/10.3390/w15010078
Submission received: 17 November 2022
/
Revised: 15 December 2022
/
Accepted: 23 December 2022
/
Published: 26 December 2022
(This article belongs to the Section Water-Energy Nexus)
Abstract
:To investigate the influence of the guide vane height on the cyclonic flow characteristics of guide vane cyclones, this paper mainly adopts a combination of numerical simulation and physical experiments, taking the guide vane height as the research object, analysing the internal spiral flow generation law through the flow velocity distribution in each section of the cyclone and the change trend along the course and comparing the tangential velocity, radial velocity and axial velocity characteristics of the cyclone at different guide vane heights. The results show that the tangential velocity increases with the increase in the guide vane height on the cyclone and then decreases. When the ratio between the height of the guide vane and the inner radius of the cyclone is in the range of 0.5–0.7, a higher−strength and more stable spiral flow can be produced, and the tangential velocity reaches the maximum when the guide vane height is 30 mm and the height−to−diameter ratio is around 0.6. As the height of the guide vane increases, the radial velocity area towards the wall of the tube increases, while the radial velocity area towards the tube axis decreases. The overall distribution of axial flow velocity is similar to that of turbulent flow in a circular tube, and the velocity increases with increasing height of the guide vane. The conclusion of this paper provides a theoretical basis for further optimisation of the cyclone structure parameters.
1. Introduction
The sediment content of rivers in many areas of China is high [1], and reservoirs built on these rivers are prone to sedimentation problems, which can reduce the effective reservoir capacity and affect economic benefits [2,3], so effective sand removal and desilting measures need to be taken. For important sand drainage equipment [4], it is important to improve the efficiency of sand transport. The spiral flow movement of the circular tube is a synthesis of the axial flow of the tube and the circumferential rotational flow with a horizontal axis. When the circumferential velocity reaches a certain value, all the sediment in the water flow enters the suspension movement, which reduces the resistance of the sediment between travels and avoids clogging of the sediment in the circular tube. It has been found that circular tube cyclone conveying can achieve a higher concentration and a lower flow rate of solids conveying, which is now widely used in sand transport. To further improve the efficiency of circular tube cyclone conveying, a lot of research has been carried out on spiral flow generation devices.
In 1933, Parshall discussed vortex tube sand drainage measures. Subsequently, Parshall [5], Robinson [6] and others conducted experiments on vortex tube sand drainage and found that when the water flow in the section where the vortex tube is located meets the Froude number around 0.8 and the angle between the vortex tube and the direction of the water flow is around 45°, a spiral flow with good conditions can be produced. Kreith [7], Kitoh [8] and others analysed the decay characteristics of spiral flow from the theoretical point of view based on experiments, and the results showed that the decay coefficient of spiral flow is greater and decays faster in the range of strong spiral flow. In the 1960s, vortex tube sand drainage technology was applied in Japan, India, Pakistan and other countries [9]. The research on vortex tube sand drainage technology also began in China in the 1970s. Wang [10] was an early researcher of vortex tube spiral flow sand drainage technology, and he analysed the influence of several factors, such as the specific drop of the river bottom, the average flow velocity and the flow rate, on the intensity of cyclonic flow and the effect of sand drainage. Chen [11] and others studied the mechanism of vortex tube sand drainage and found that when sand−bearing water enters the reservoir area, the sediment particle gradation readjusts and the sand content changes in a gradient along the water depth. Wang [12,13] et al. summarised the current state of research on the flow characteristics of spiral flow in horizontal tubes and concluded that the study of the velocity distribution of spiral flow is an important means to understand its internal flow field and is fundamental to the study of pressure drop characteristics and decay characteristics. Zhang [14] et al. researched the flow velocity distribution characteristics of cyclones with different guide vane placement angles using a self−circulating experimental device and concluded that the flow conditions are better when the guide vane placement angle is 15° or 45°. In the experiments on horizontal axis circular tube spiral flow with guide vanes installed, Sun [15] et al. studied the resistance and efficiency of cyclones and found that the cyclonic efficiency can be improved by reducing the resistance coefficient of the starter and the relative length of the starter and increasing the angular velocity of water rotation. Wu [16] conducted an experimental study on the energy consumption of sand−trapped spiral tube flow and found that the sand−trapping capacity of spiral flow is much greater than that of flat tube flow under the same energy slope. Li [17,18,19] used a combination of theoretical analysis and model experiments to investigate the cyclonic flow characteristics inside a local cyclone, and the results showed that the parameters of the guide vane have an important influence on the flow velocity and vortex fields inside the cyclone.
It can be seen that the selection of guide vane parameters in a cyclone directly affects the effect of circular tube cyclone conveying, and a reasonable parameter value can effectively improve the efficiency of cyclone sand conveying. The main objective of this study is to investigate the influence of the guide vane height on the cyclonic flow characteristics in cyclones and analyse the internal spiral flow generation law through the trend of flow velocity along the cyclone sections in order to optimise the structure parameters of cyclones.
2. Construction of a Mathematical Model of Guide Vane Cyclones
2.1. Geometric Modelling
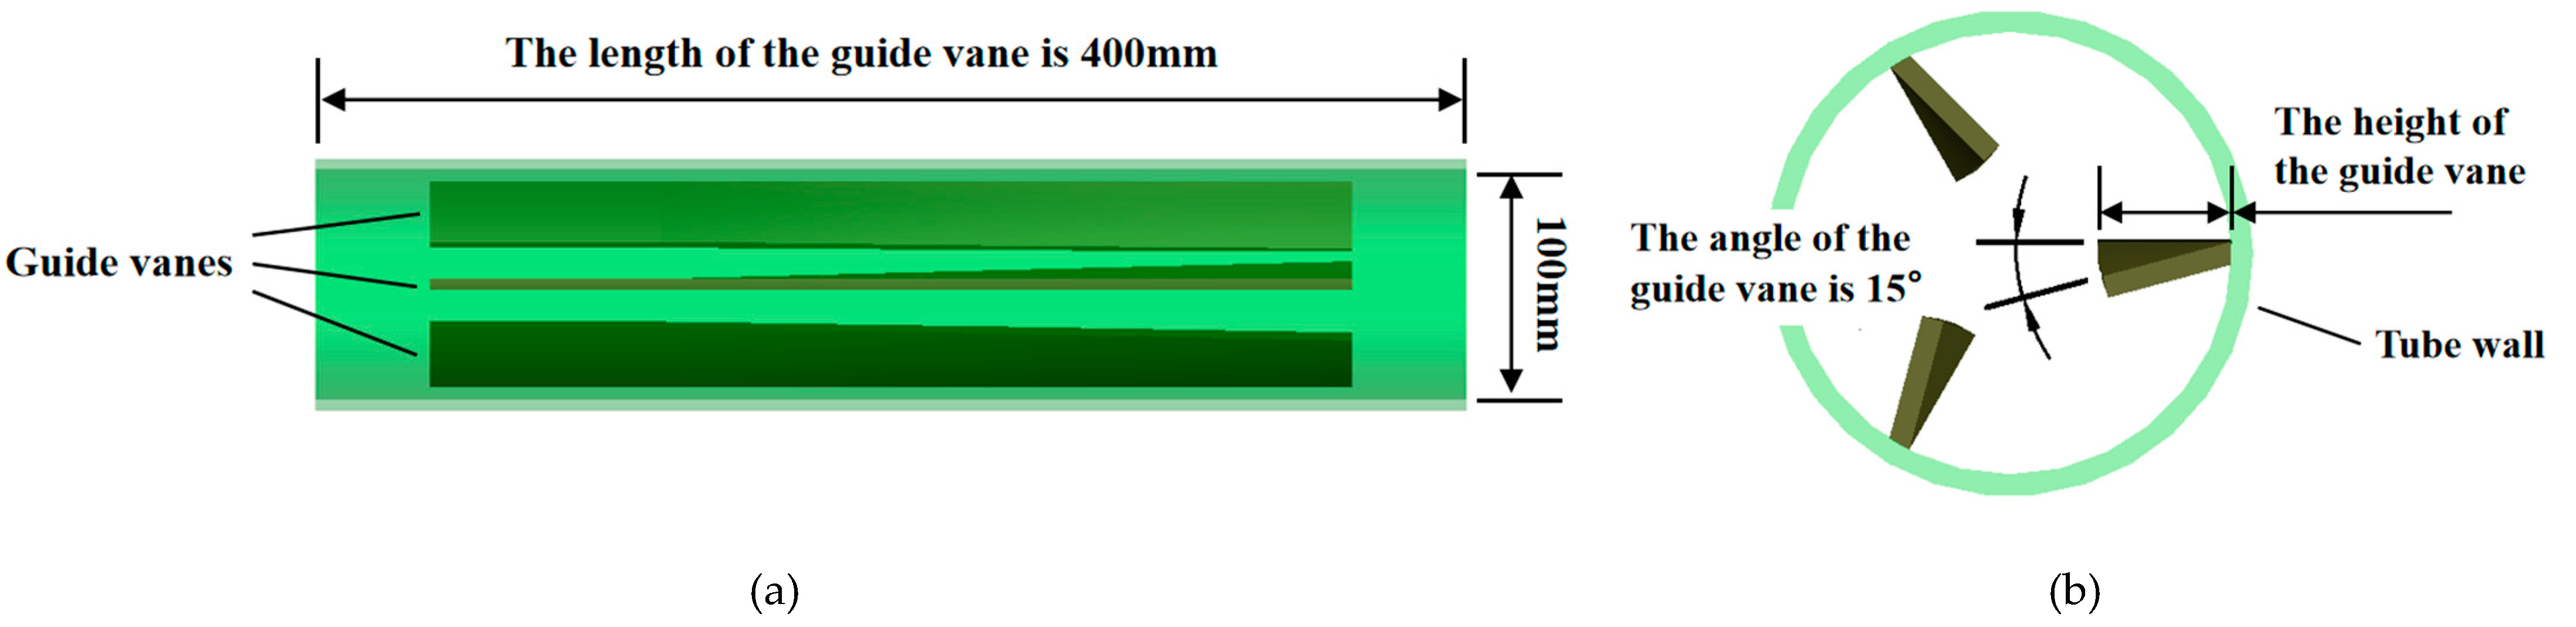
Three guide vanes, a cyclone wall and a downstream tube were made separately by surface domain, sweeping and twisting operations and then put together to obtain a complete model of a guide-vane-type cyclone. The geometry model is shown in Figure 1.
2.2. Mesh Division
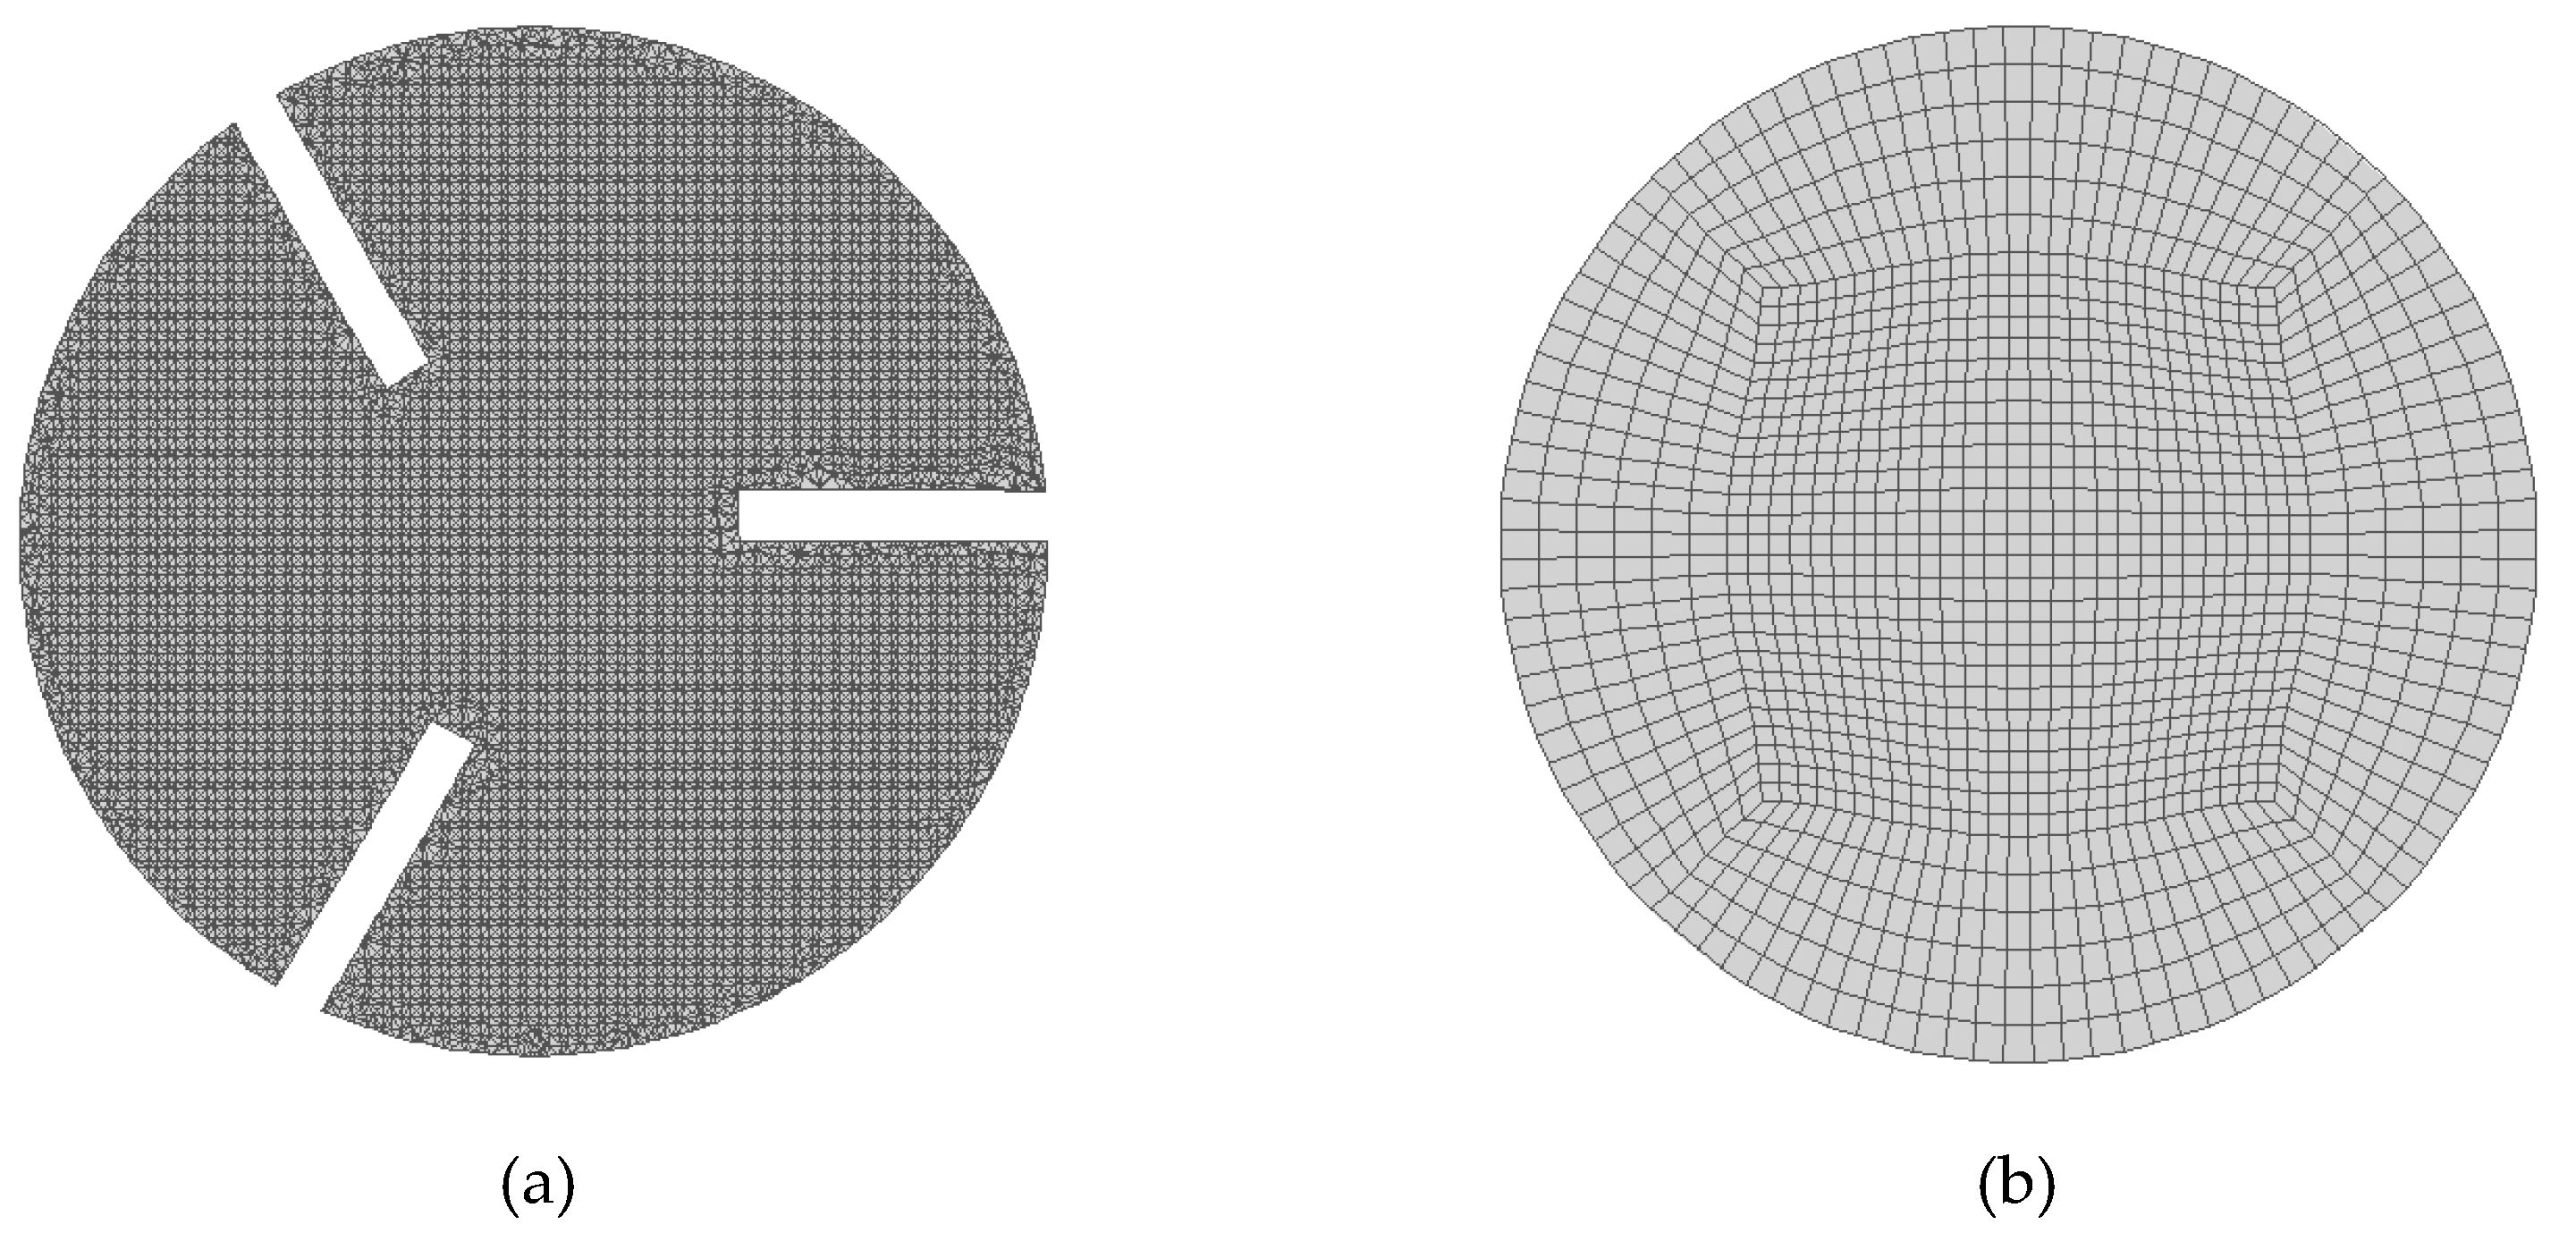
The model was imported into ICEM CFD to mesh the computational domain. In the meshing, the unstructured mesh was generated because of the complex structure of the cyclone region. The downstream area was a standard cylinder with a simple structure, so a structured mesh was generated. Figure 2 shows the schematic diagram of meshing. After generating the mesh, the validity of the mesh was checked, and it was found that the quality of the mesh was greater than 0.3 and the minimum angle was greater than 18°, so the quality of the mesh was good.
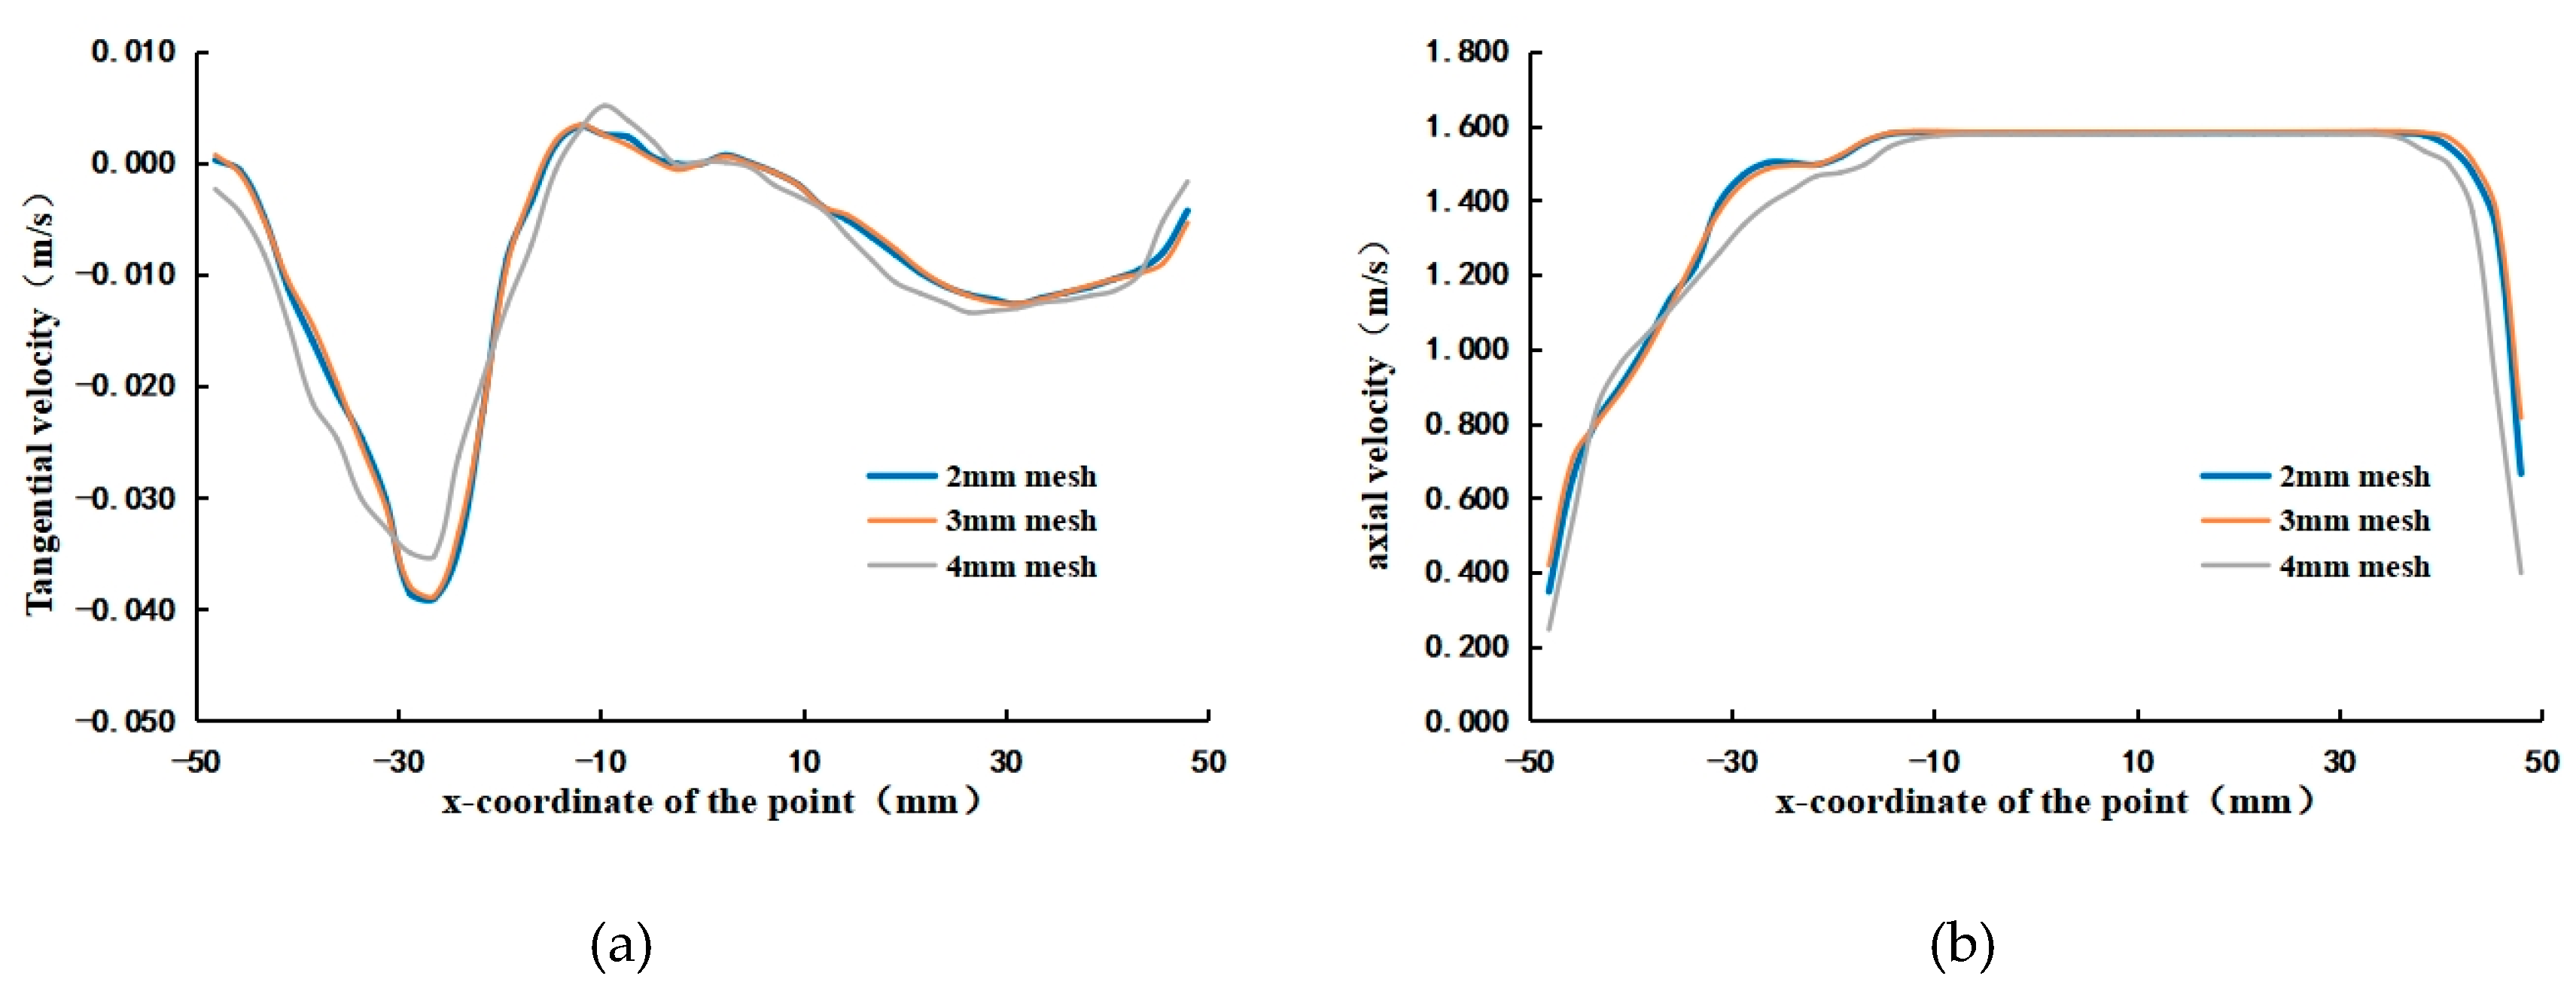
To ensure the accuracy of the simulation and improve the efficiency of the calculation, it was necessary to select a suitable maximum mesh size and to verify the irrelevance of the mesh size to ensure that the size of the mesh did not affect the results of the simulation. A cyclone model with a guide vane height of 30 mm was selected for verification at three mesh sizes of 2 mm, 3 mm and 4 mm. Simulations were carried out at a flow rate of 40 m3/h. Figure 3 shows the distribution of tangential velocity and axial velocity along the diameter for the three mesh−size models at the Z = 500 mm section. As can be seen from the graphs, the deviation of the results for the 2 mm and 3 mm mesh−size models was small, basically less than 1%, and the size of the mesh hardly affected the calculation results. It can be seen that a maximum mesh size of 3 mm is sufficient for accurate simulations, so the maximum mesh size was set to 3 mm for this simulation.
2.3. Model Selection and Its Control Equations
We used Fluent software to simulate the cyclonic flow characteristics inside the cyclone. The k-ε turbulence model was chosen for the simulations. k-ε models include standard k-ε, RNG k-ε and realisable k-ε [20]. Their advantages and disadvantages are shown in Table 1.
In the vicinity of the cyclone guide vane, especially at the trailing edge of the guide vane and at the connection between the guide vane and the inner wall of the tube, the flow pattern is complex and the flow line changes dramatically. The RNG k-ε model has certain advantages in simulating moderately complex flows, such as separation flows and cyclonic flows, and the computational efficiency is higher than that of the realisable k-ε model. Therefore, we chose the RNG k-ε model for the simulations. The basic control equations for this model are as follows.
Continuity equation:
Momentum equation:
Turbulent kinetic energy k equation:
Dissipation rate equation:
Among them,
,
In the formula, t is time; i and j = 1, 2, and 3; ui is the velocity component in the xi direction; ρ is the density of the volume fraction weighted average; p is the modified pressure; is the volume fraction weighted average molecular viscosity coefficient; and are the Prandtl number at turbulent kinetic energy k and the dissipation rate ε, respectively; is the turbulent viscosity coefficient; and Gk is the turbulent kinetic energy generation term due to the average velocity gradient.
The boundary conditions were set by setting the velocity at the inlet boundary and the pressure at the outlet boundary. The velocity at the inlet boundary was calculated from the experimentally designed flow rate, which was 40 m3/h, corresponding to an initial velocity of 1.415 m/s. Due to the free outflow at the outlet, an atmospheric pressure of 101,000 Pa was chosen as the outlet pressure.
3. Research Programme
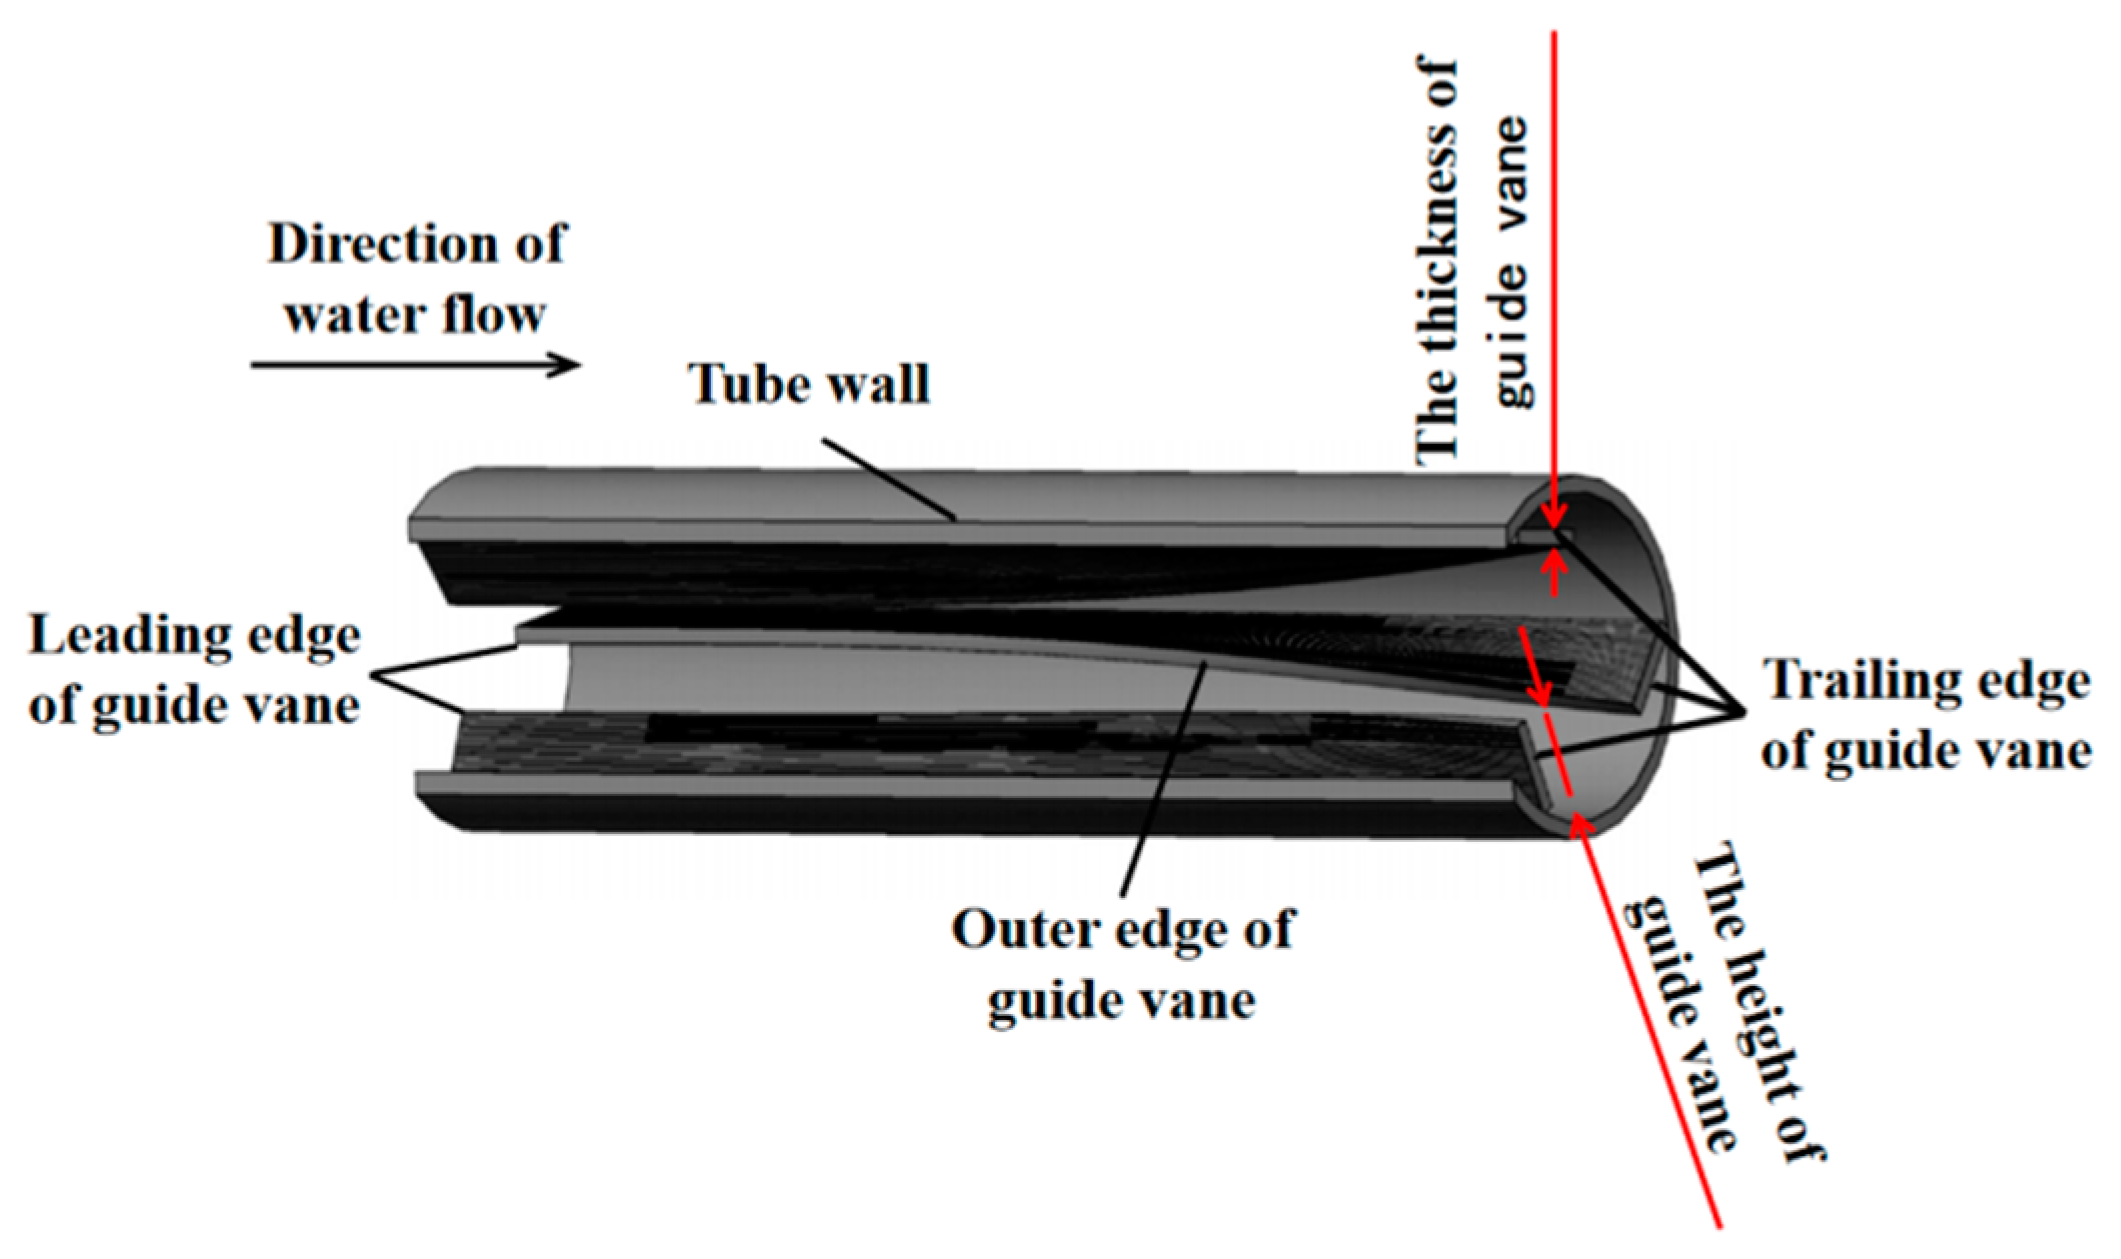
To research the effect of different guide vane heights on the cyclonic flow characteristics inside the cyclone, the guide vane height h was taken as a single variable in this simulation, with values of 20 mm, 25 mm, 30 mm, 35 mm and 40 mm. The rest of the parameters were the same, such as the internal radius of the cyclone was 50 mm, the length of the guide vane was 400 mm (of which, the length of the straight section of the guide vane was 100 mm, the length of the curved section was 300 mm, the distance from both ends of the cyclone was 50 mm), the thickness of the guide vane was 5 mm, the number of guide vanes was 3, the angle of the guide vane was 15°, the length of the downstream tube section was 4000 mm and the flow rate was 40 m3/h. The schematic diagram of the cyclone structure is shown in Figure 4.
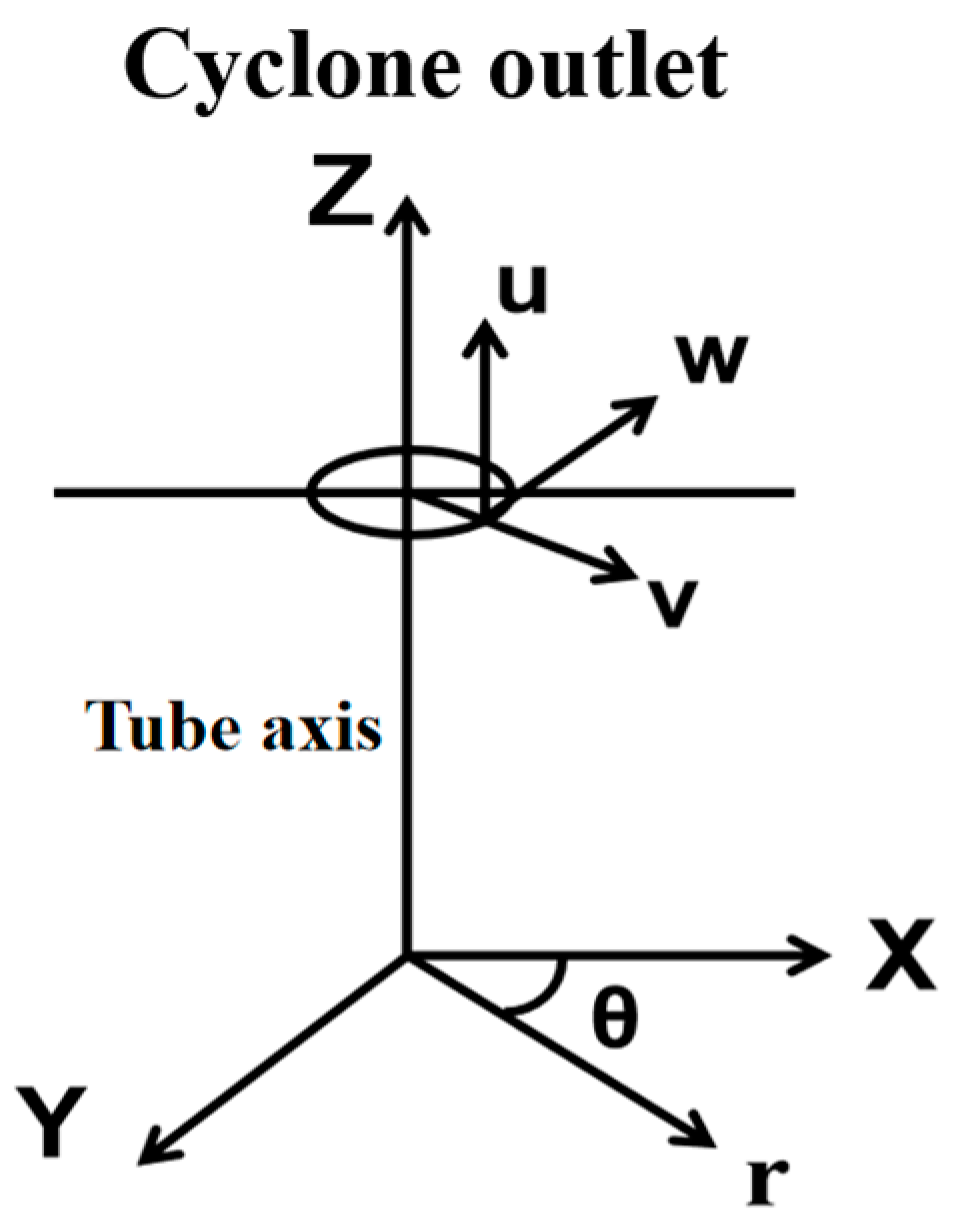
In this paper, the tangential velocity w was anticlockwise as positive and clockwise as negative, the radial velocity ν was positive if it was away from the tube axis and negative if it was towards the pipe axis and the axial velocity u was positive if it was in the direction of the water flow and negative if it was in the opposite direction. In the analysis of hydraulic characteristics, the column coordinate system was used for analysis; the r, θ axis was located in the plane of the tube section; and the Z axis was the pipe axis, pointing to the direction of the water flow. Figure 5 shows the schematic diagram of the column coordinate system.
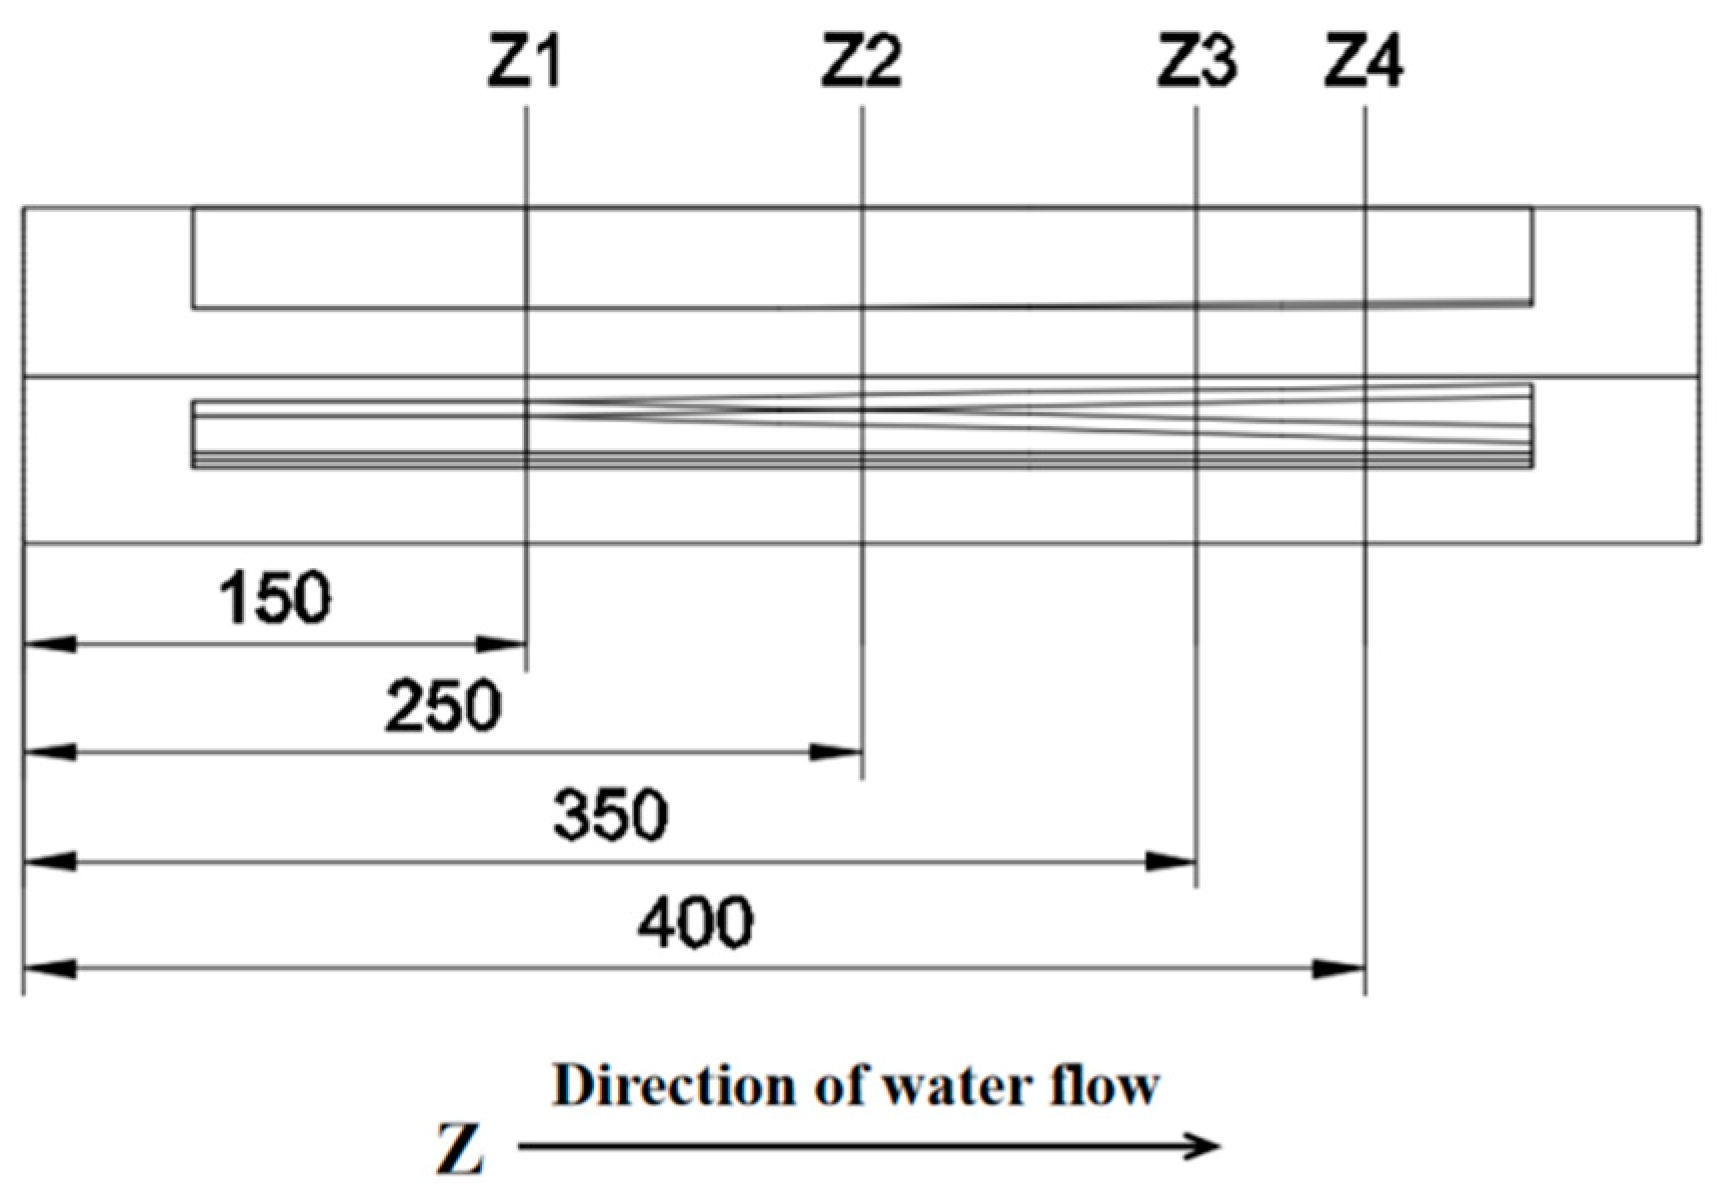
When analysing the flow velocity distribution inside the cyclone, we selected four sections for analysis, and the distance from the inlet section of the cyclone was Z1 = 150 mm, Z2 = 250 mm, Z3 = 350 mm and Z4 = 400 mm. The section layout is shown in Figure 6.
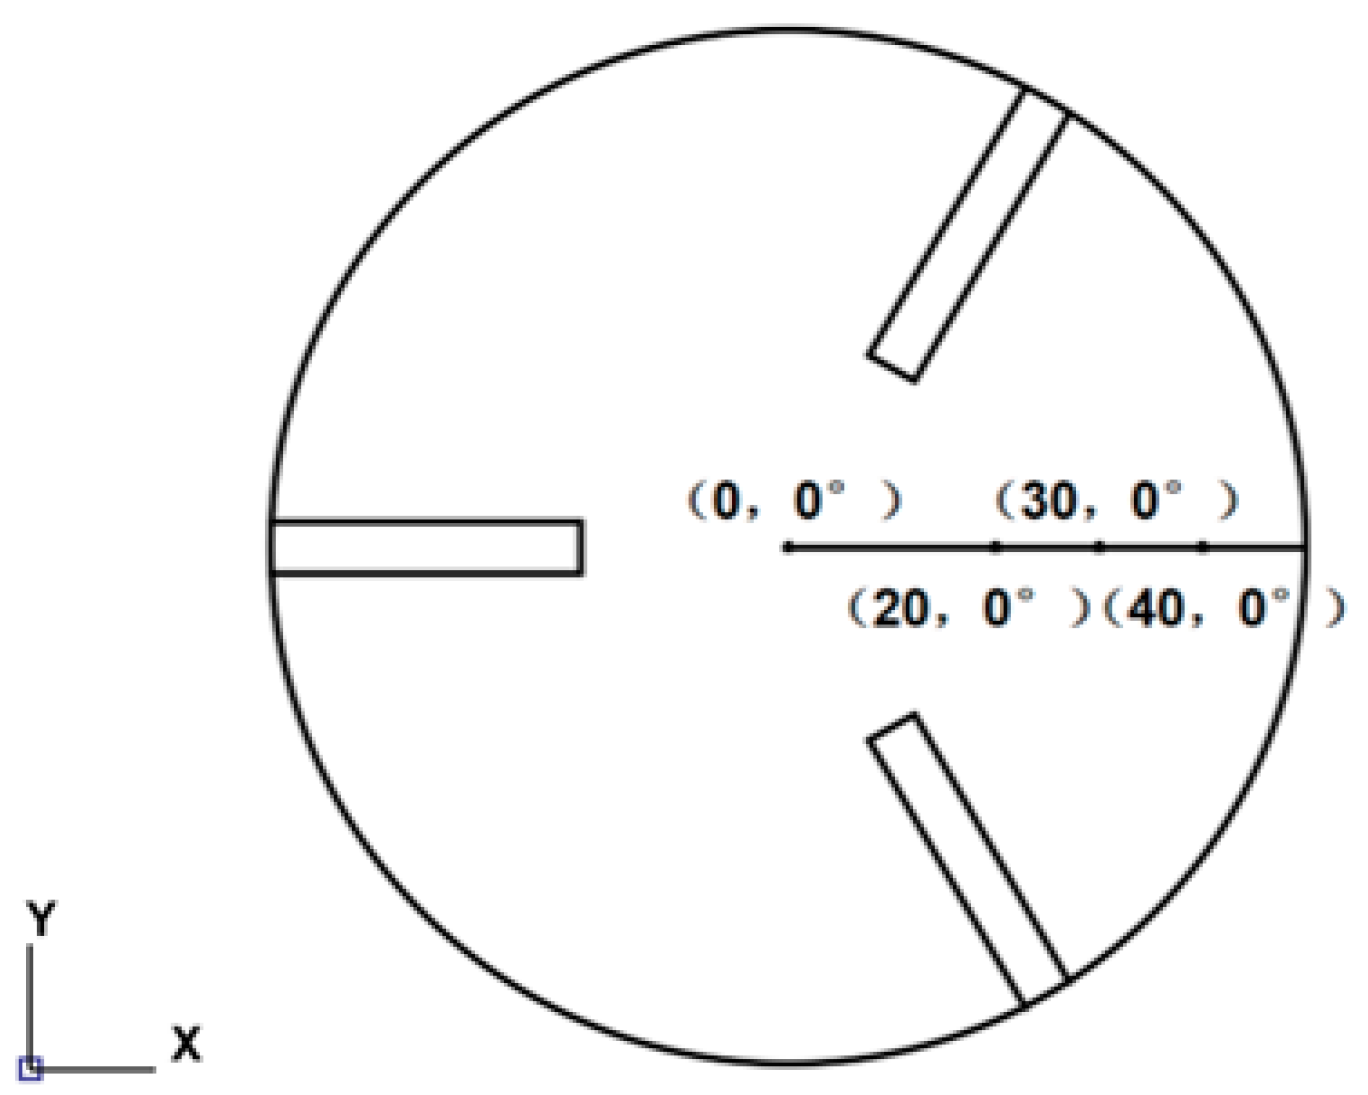
When analysing the along−course variation of the flow velocity, we selected four characteristic locations to analyse. The polar coordinates of the four characteristic locations were (0, 0°), (20, 0°), (30, 0°) and (40, 0°), and the distance from the cyclone inlet section was taken to be between 100 mm and 400 mm, with one measuring point every 10 mm, for a total of 31 measuring points. Figure 7 shows the layout of the measurement points at the characteristic locations.
4. Experimental Verification of Simulation Results
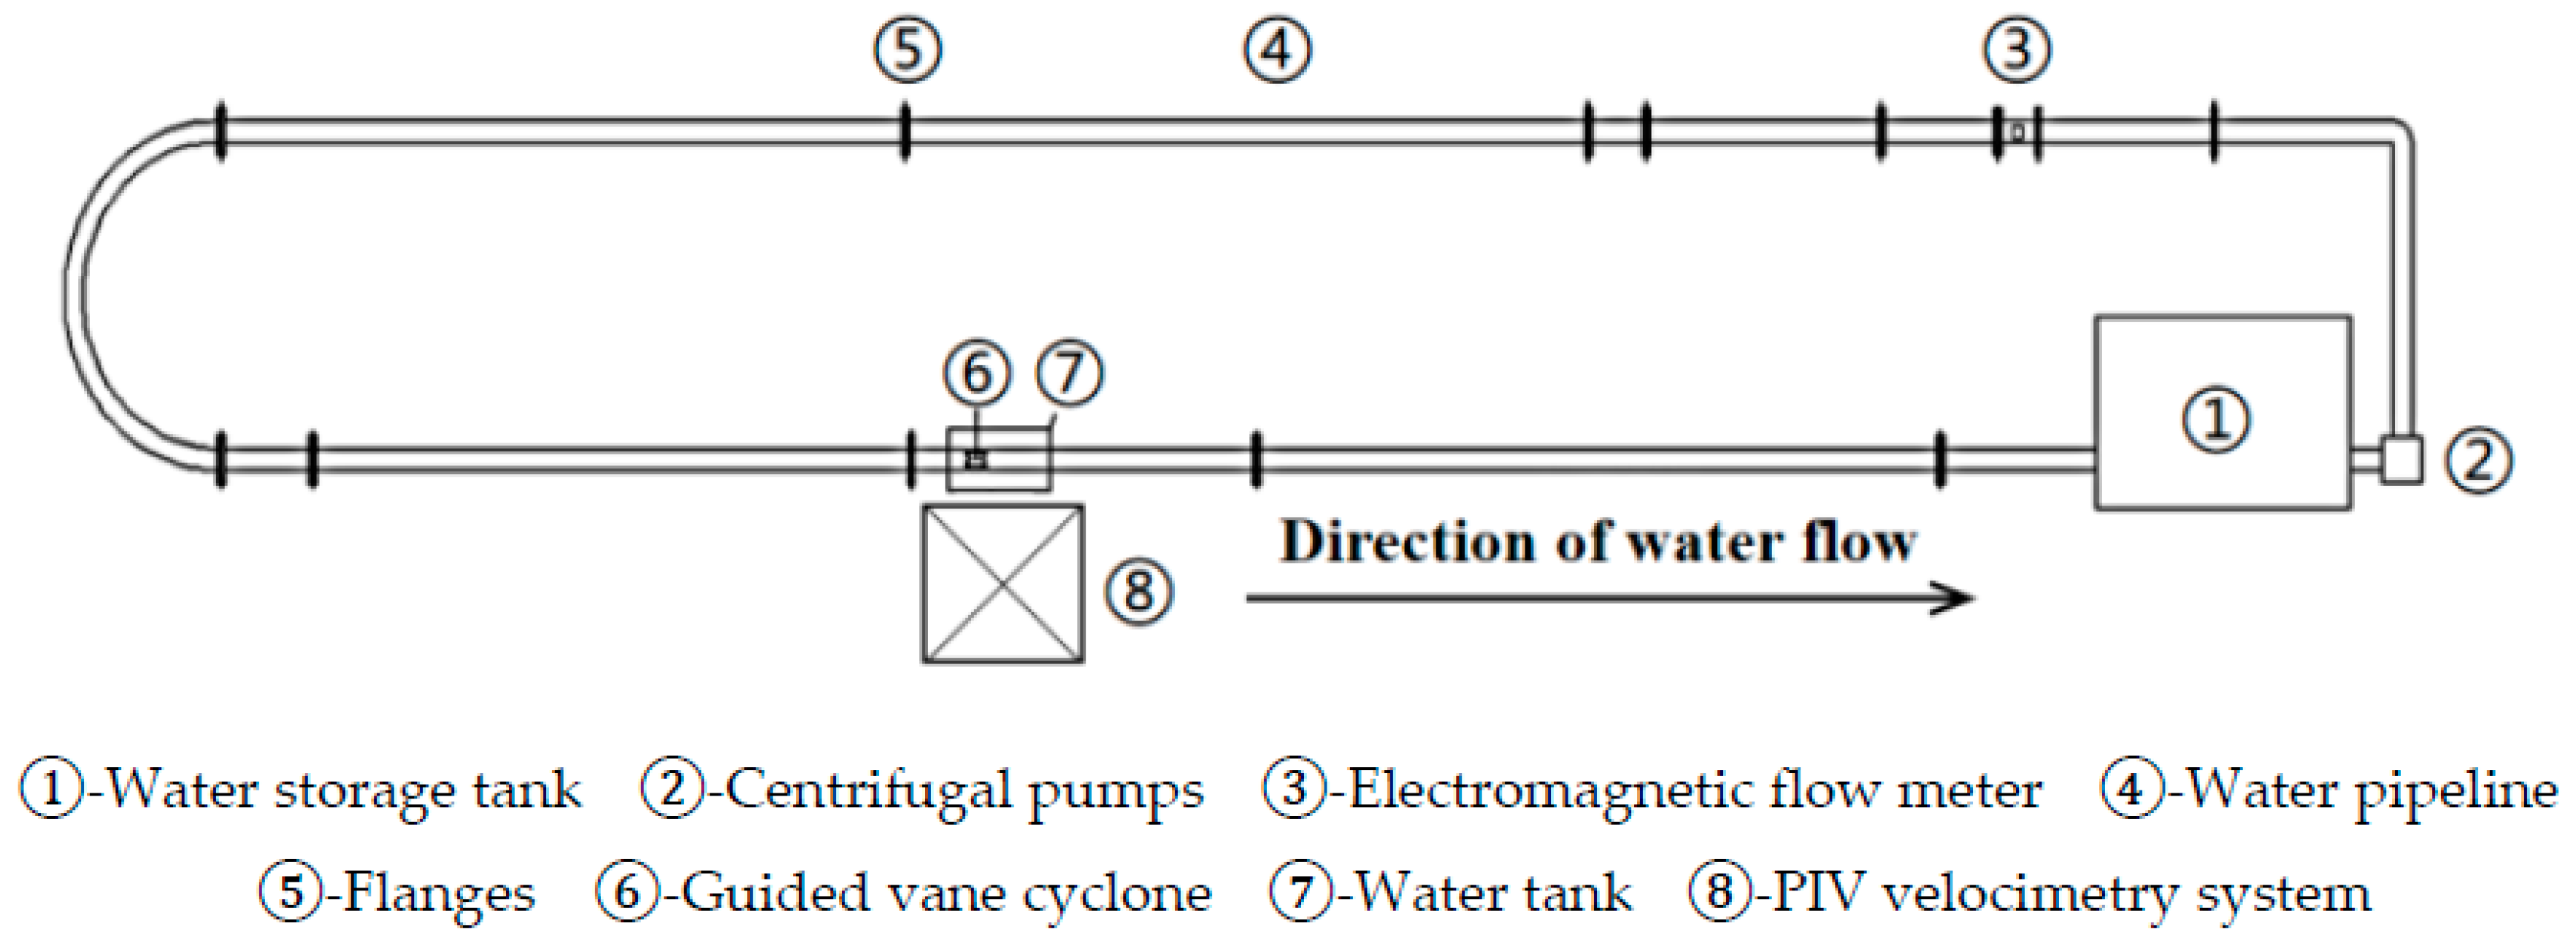
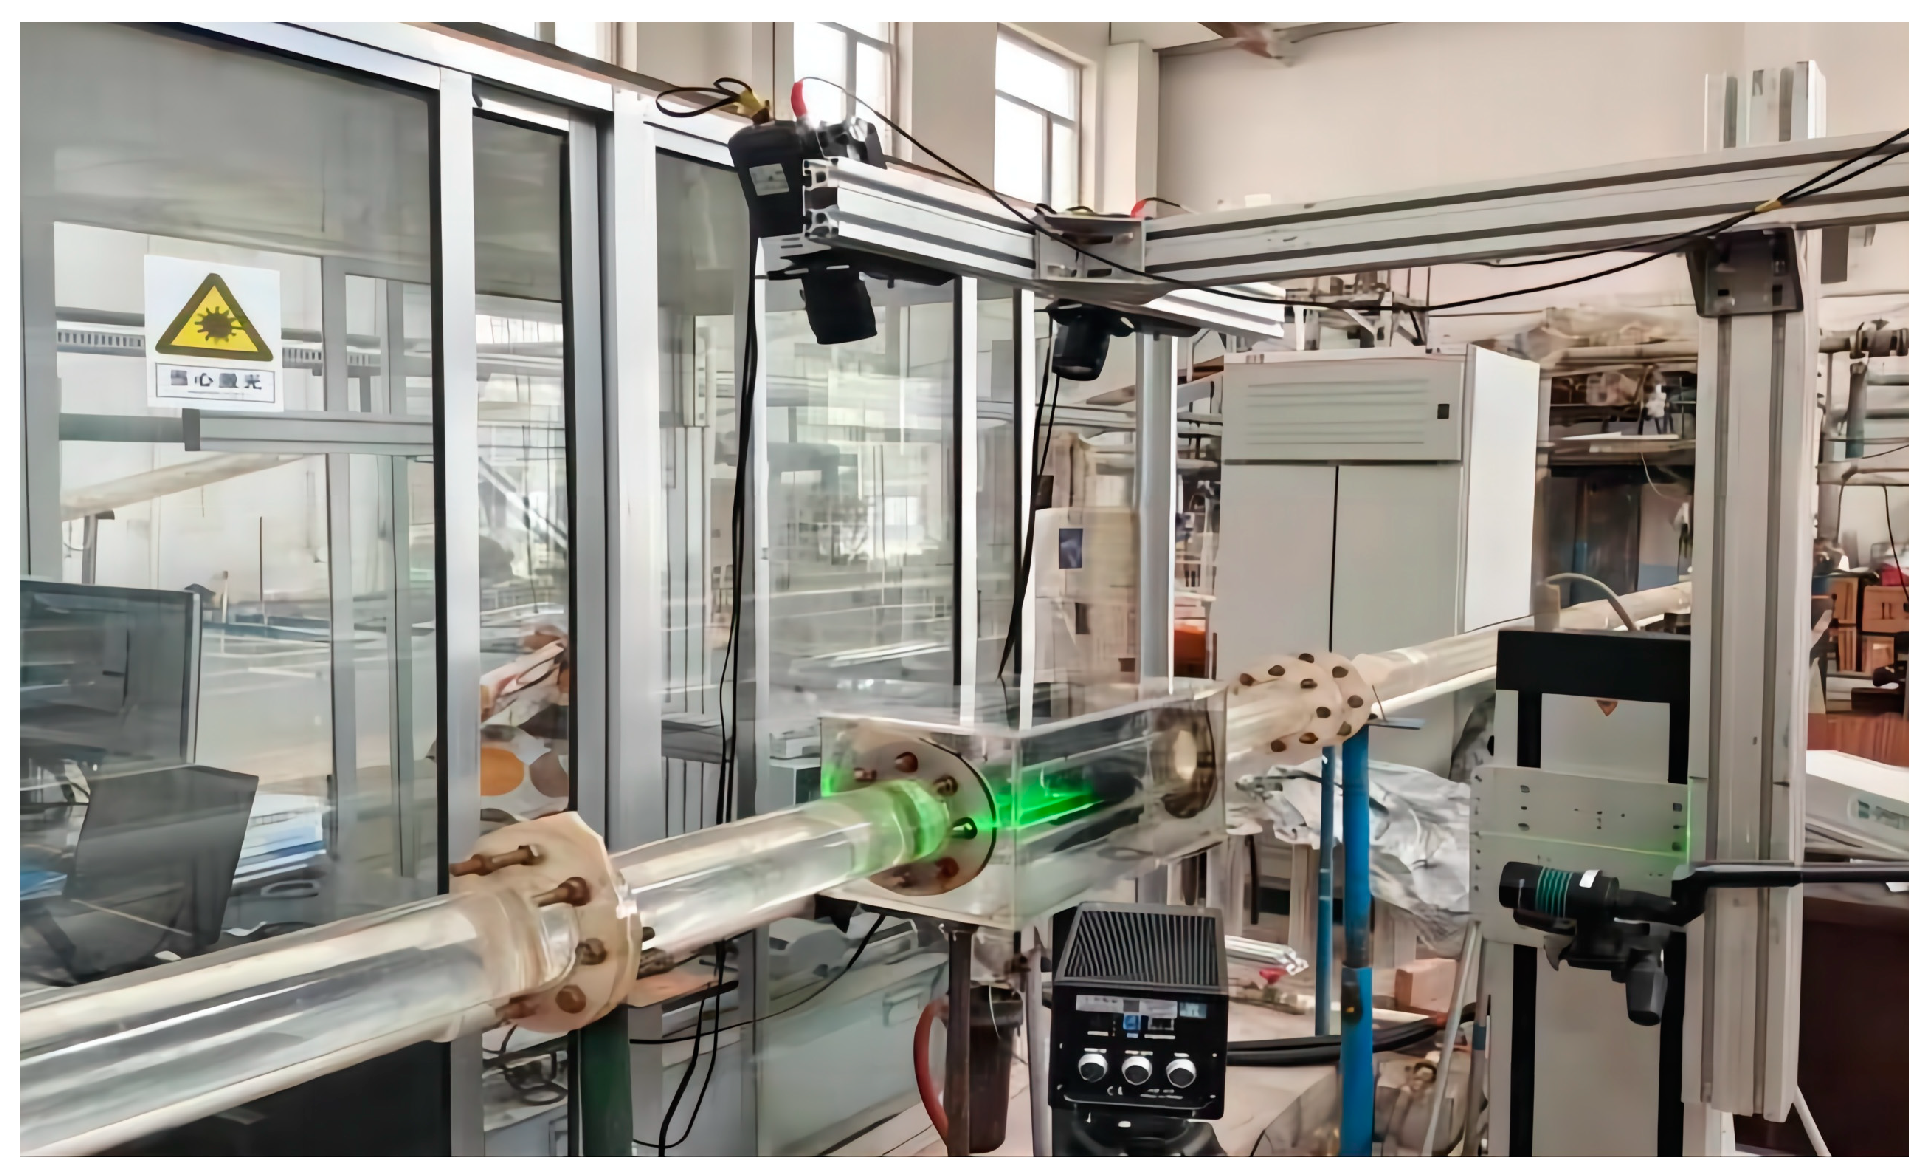
To verify the accuracy and reasonableness of the numerical simulation results of the spiral flow velocity characteristics generated by the cyclone with different guide vane heights, we measured the spiral flow velocity characteristics inside the cyclone using a 2D−2C PIV device and compared the simulation results with the experimental measurement results. The layout of the test system is shown in Figure 8.
The test system mainly comprised four parts: a power system, a regulating system, a circulating pipeline system and a measuring system. The power system is mainly a centrifugal pump, which pumps the water in the storage tank into the experimental pipeline, and the water flows back into the storage tank through the pipeline. The regulating system mainly includes an electromagnetic flow meter and a regulating gate valve, which can control the flow size, and the specific value of the flow can be displayed in the electromagnetic flow meter. The circulating pipeline system mainly consists of a water storage tank and a water pipeline, the water pipeline is arranged horizontally, the pipe sections are connected with flanges and the flanges are connected with rubber gaskets to stop water. The measuring system is mainly the PIV system. To reduce the measurement error caused by laser refraction, a square water tank was installed in the test section. For the experiments, the camera resolution used was 1280 pixels × 1280 pixels, the tracer particle size was 30 μm, the sampling frequency of the PIV was set to 50 Hz and the laser wavelength was 539 nm. Figure 9 shows the diagram of the PIV system in use.
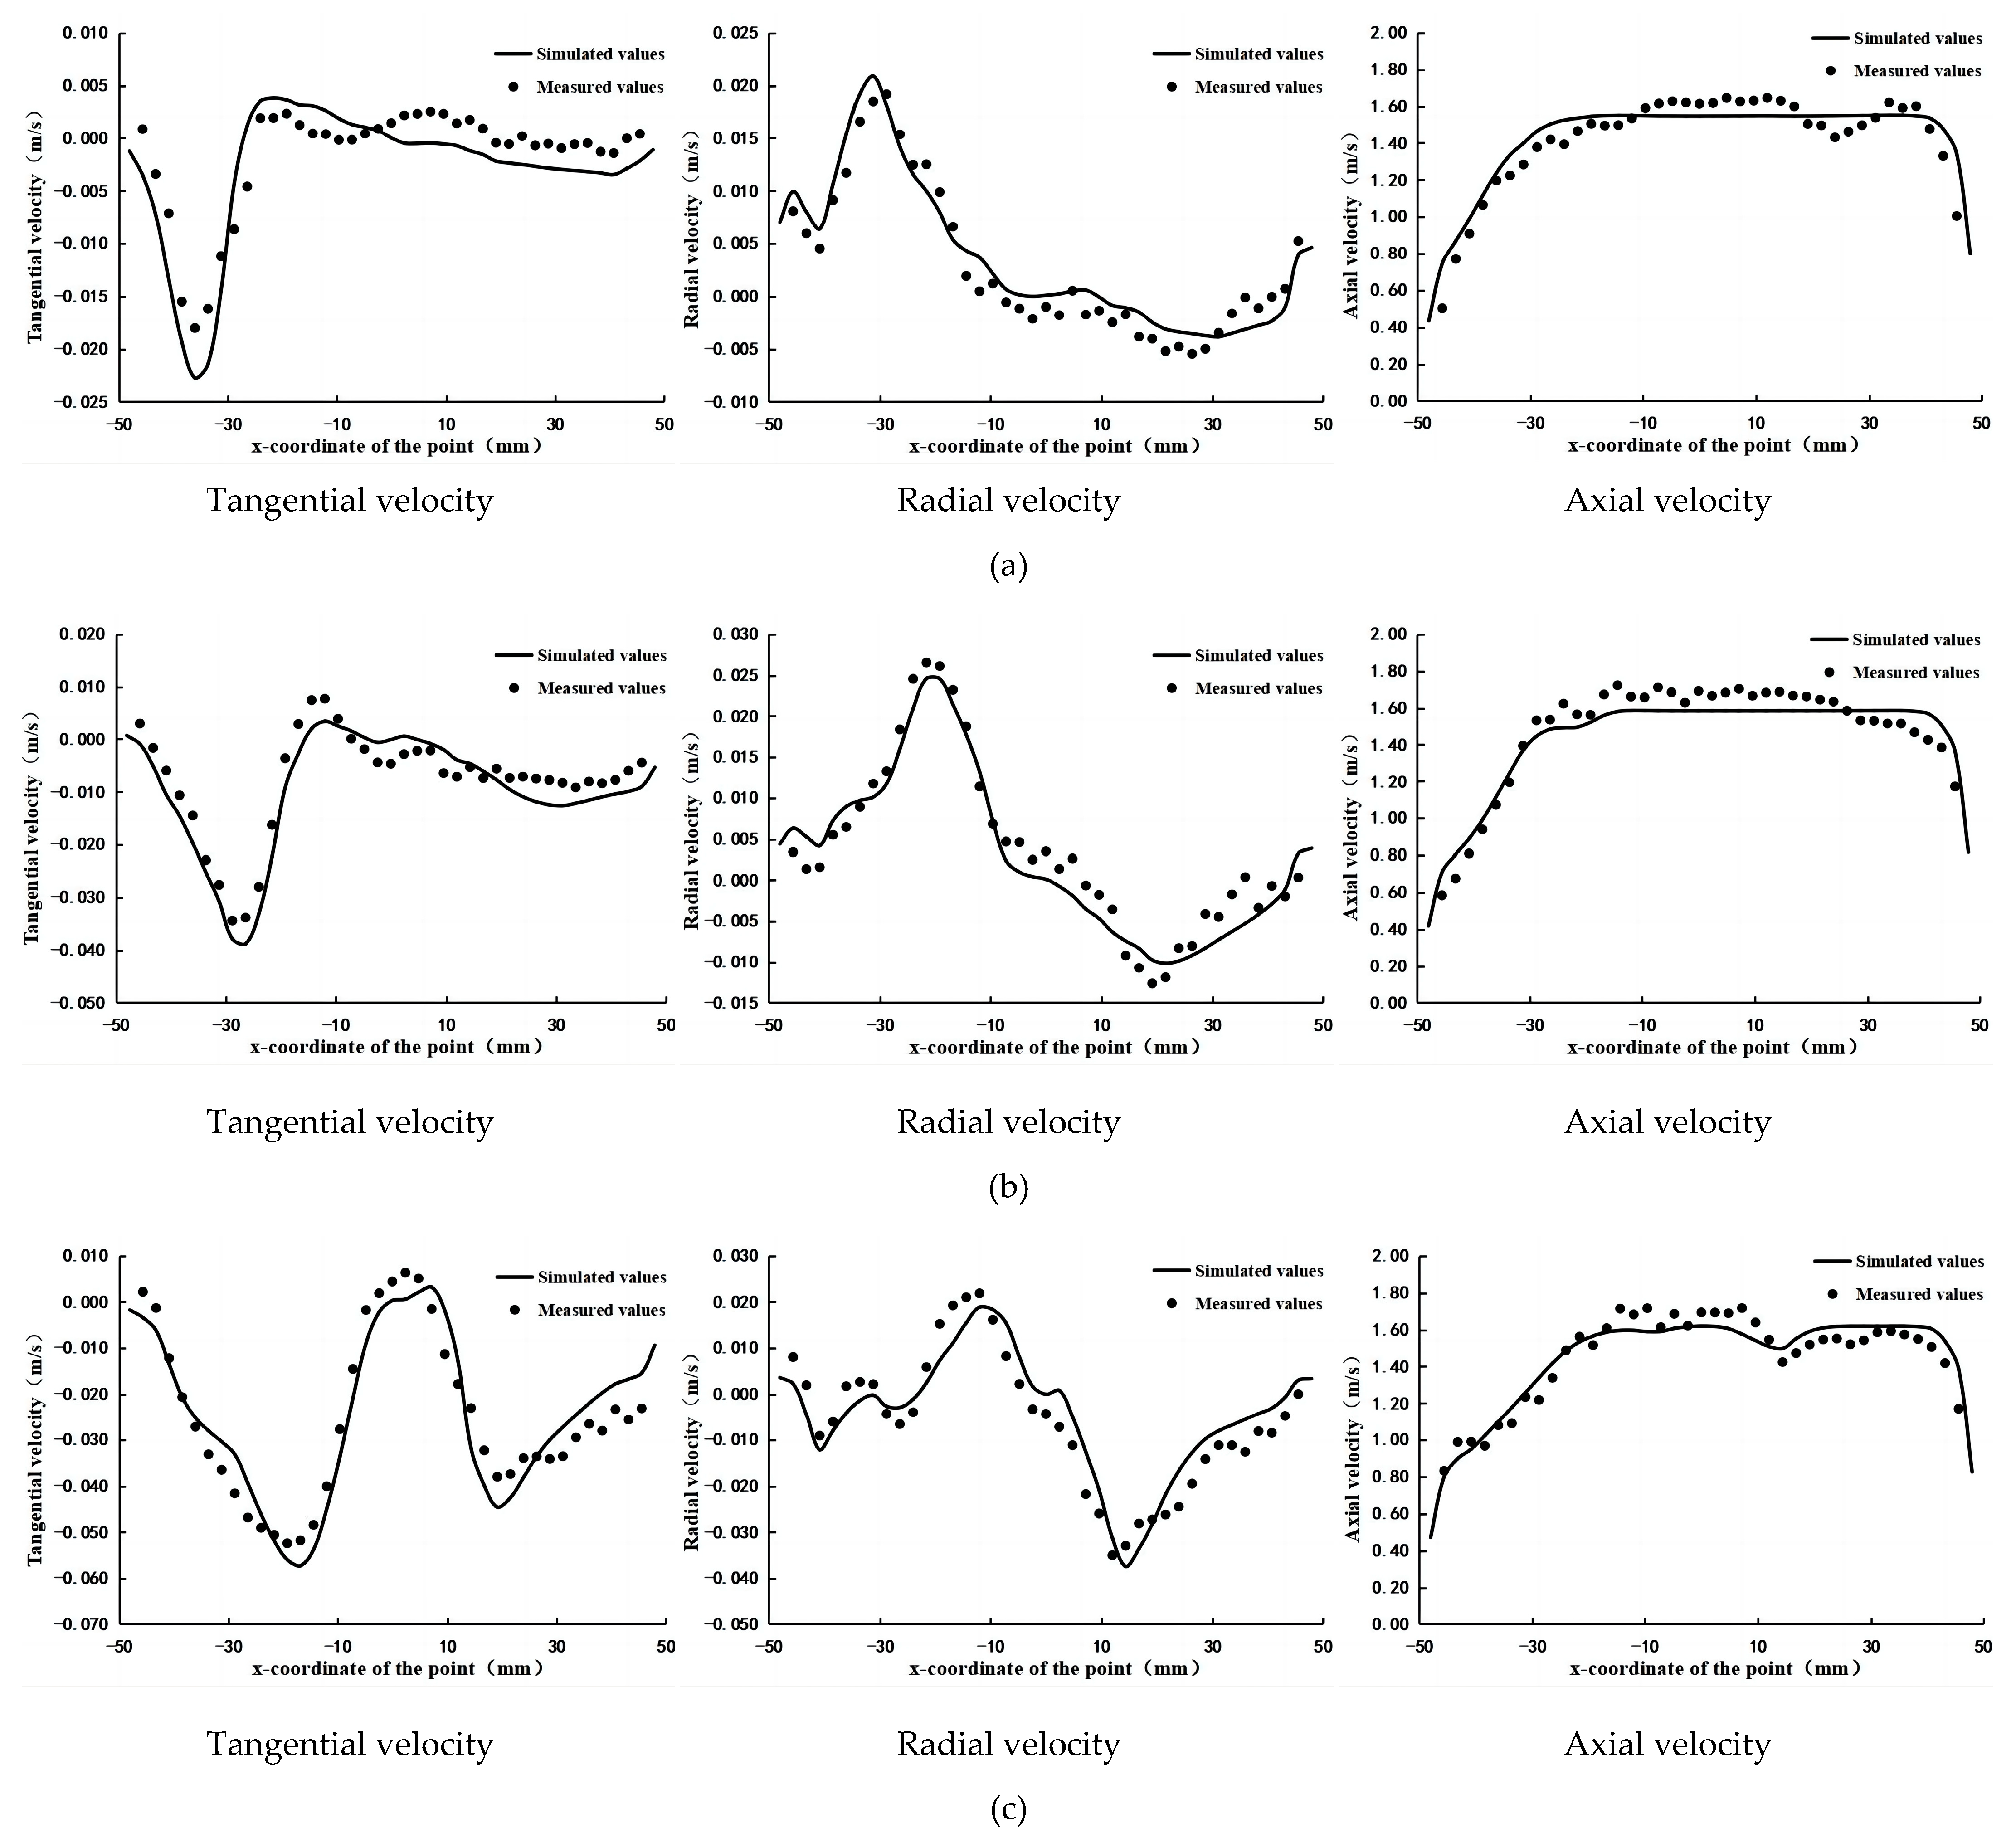
Cyclones with guide vane heights of H = 20 mm, H = 30 mm and H = 40 mm were selected for installation in the pipeline, and the three−dimensional flow velocities of the test sections were measured at a flow rate of 40 m3/h. Considering the masking effect of the guide vane, we selected a section with a horizontal diameter of Z = 500 mm for measurement and compared the measured results for tangential, radial and axial velocities with the simulated values. The results of the comparison are shown in Figure 10. It can be seen from the figure that the simulated values did not differ significantly from the measured values of the physical tests, and the trend of variation along the course was basically the same. The average absolute error of the axial velocity was calculated to be no more than 0.08 m/s, the average absolute error of the radial velocity was no more than 0.006 m/s and the average absolute error of the tangential velocity was no more than 0.008 m/s. The error may be due to the fact that the model applies the Reynolds averaging algorithm to obtain the flow velocity as a time−averaged quantity, while the presence of pulsating velocities during the test makes the two results deviate to a lesser extent. The overall error remained within a plausible range, indicating that the results of the numerical simulations are credible and that it is feasible to use the numerical simulation approach to investigate the flow characteristics of spiral flows generated by cyclones.
5. Simulation Results and Analysis
5.1. Analysis of the Internal Tangential Velocity Characteristics of Cyclones with Different Guide Vane Heights
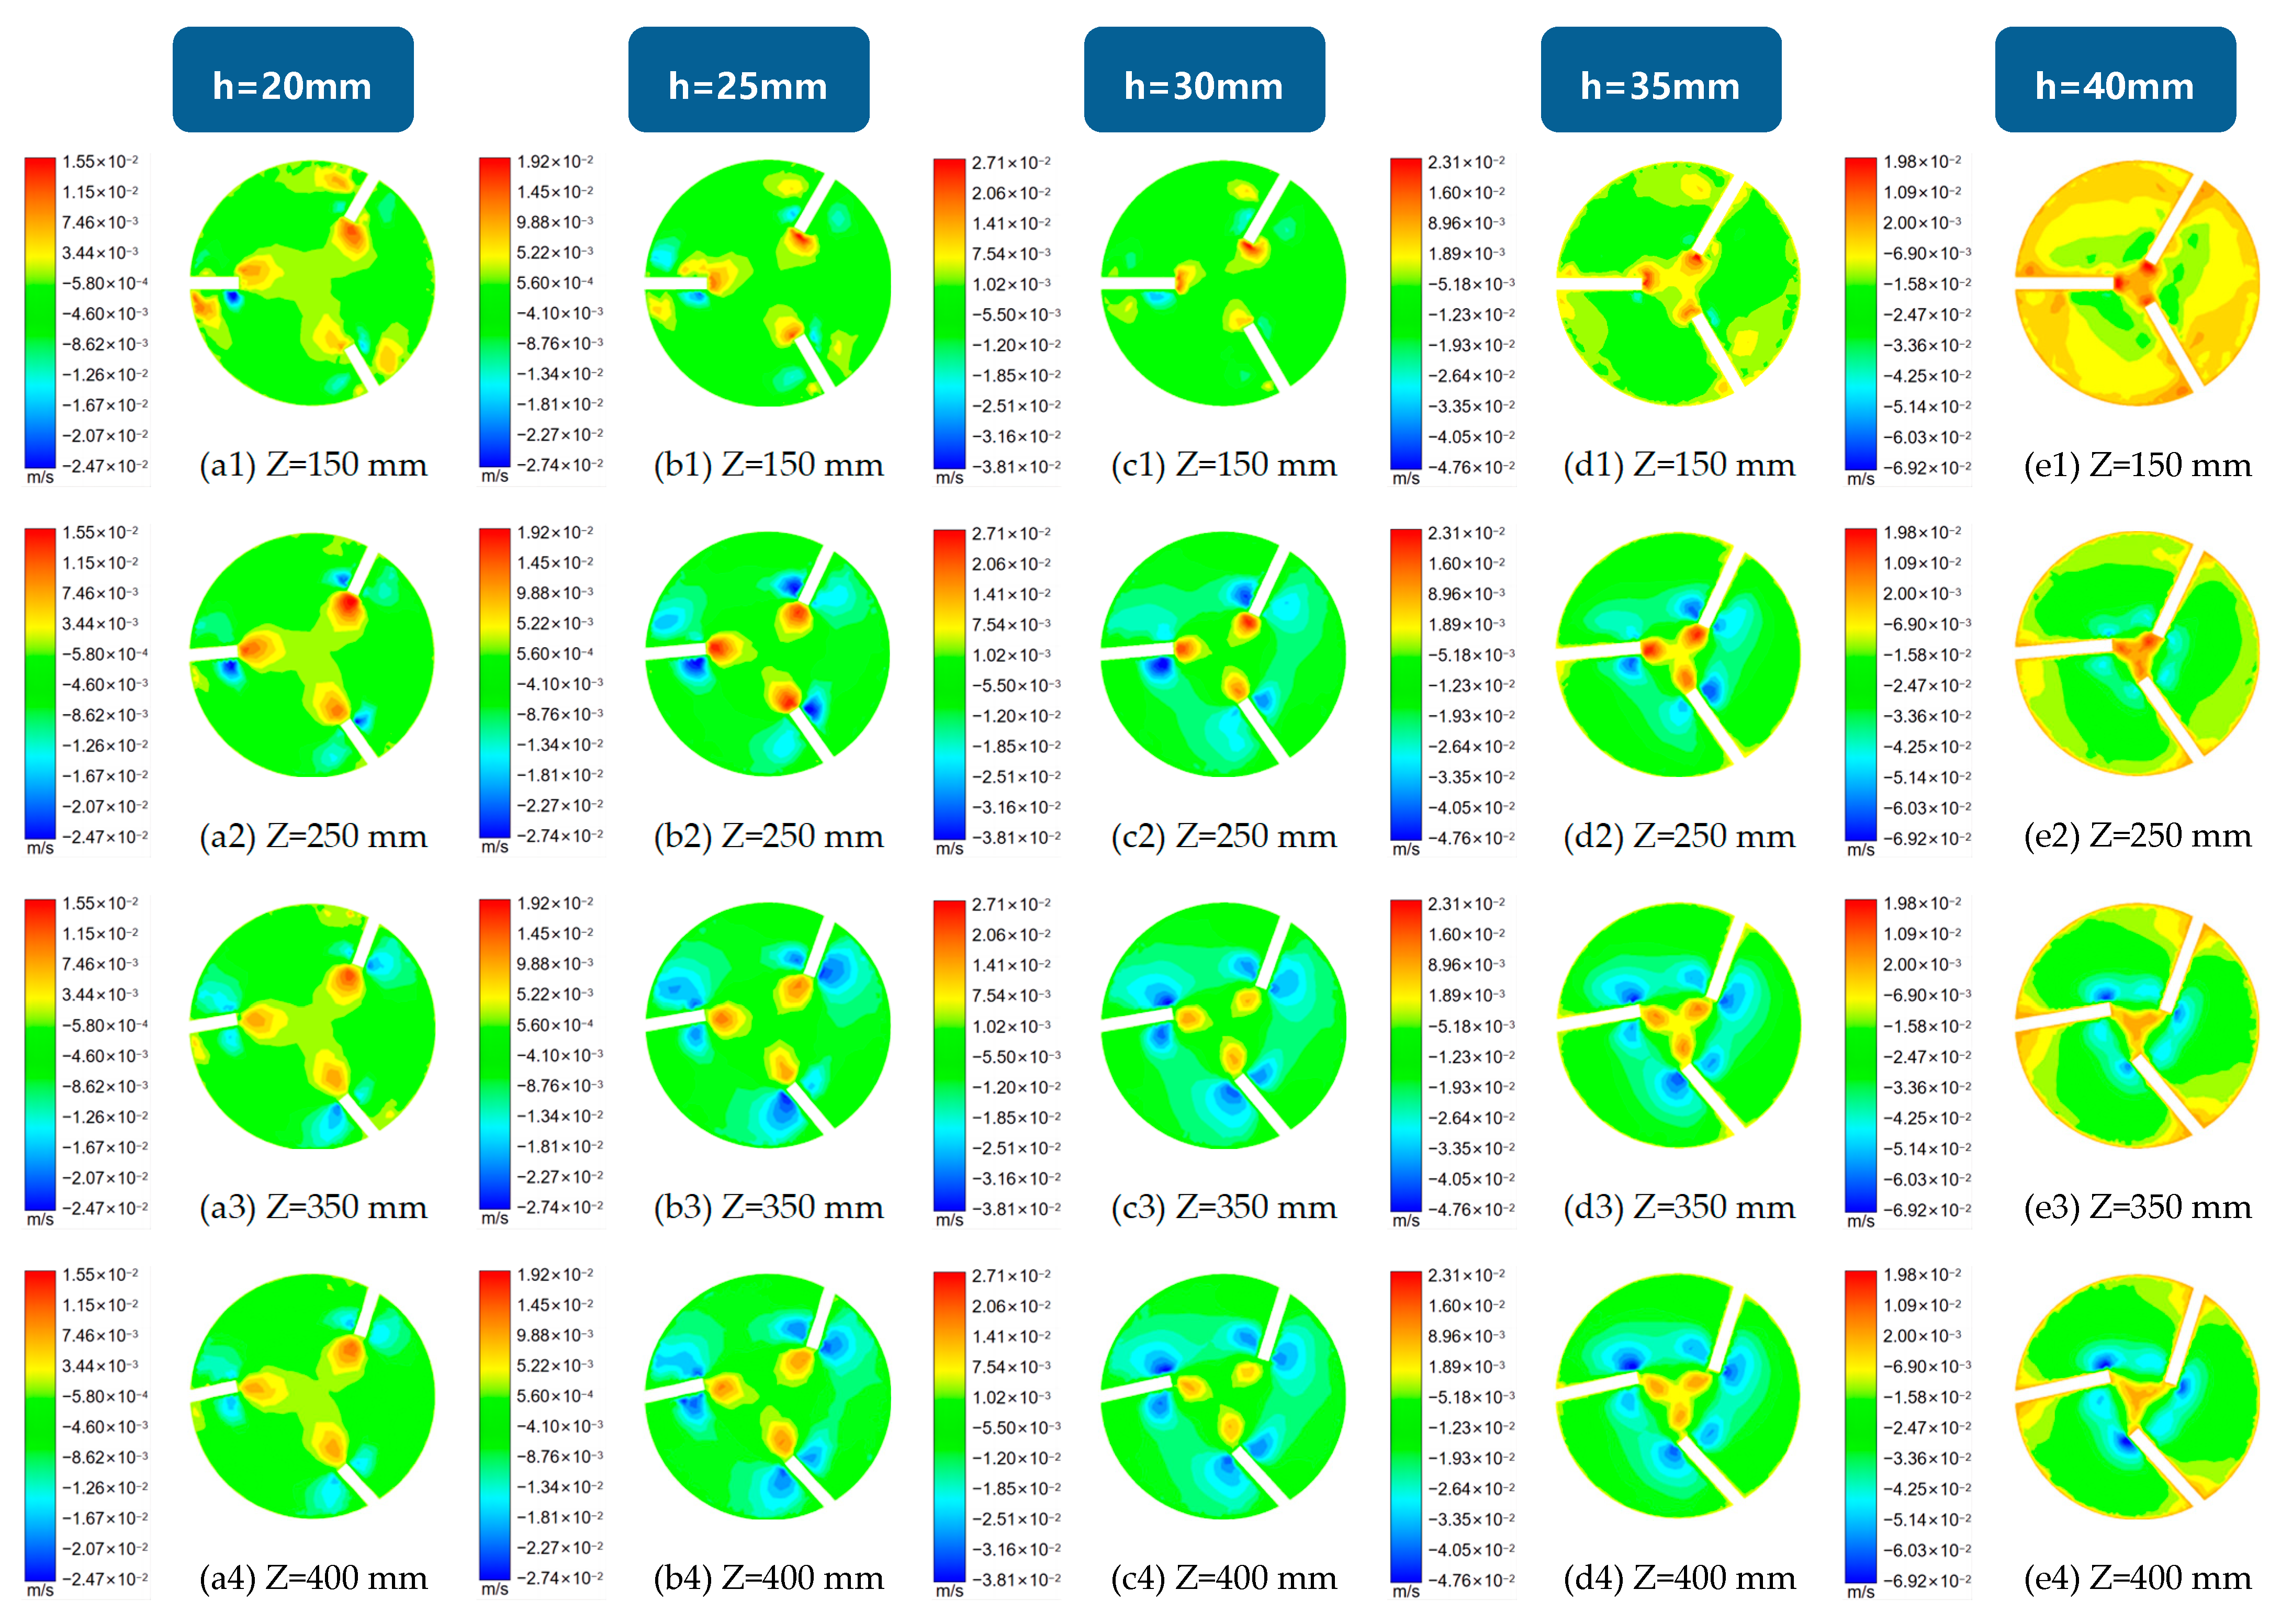
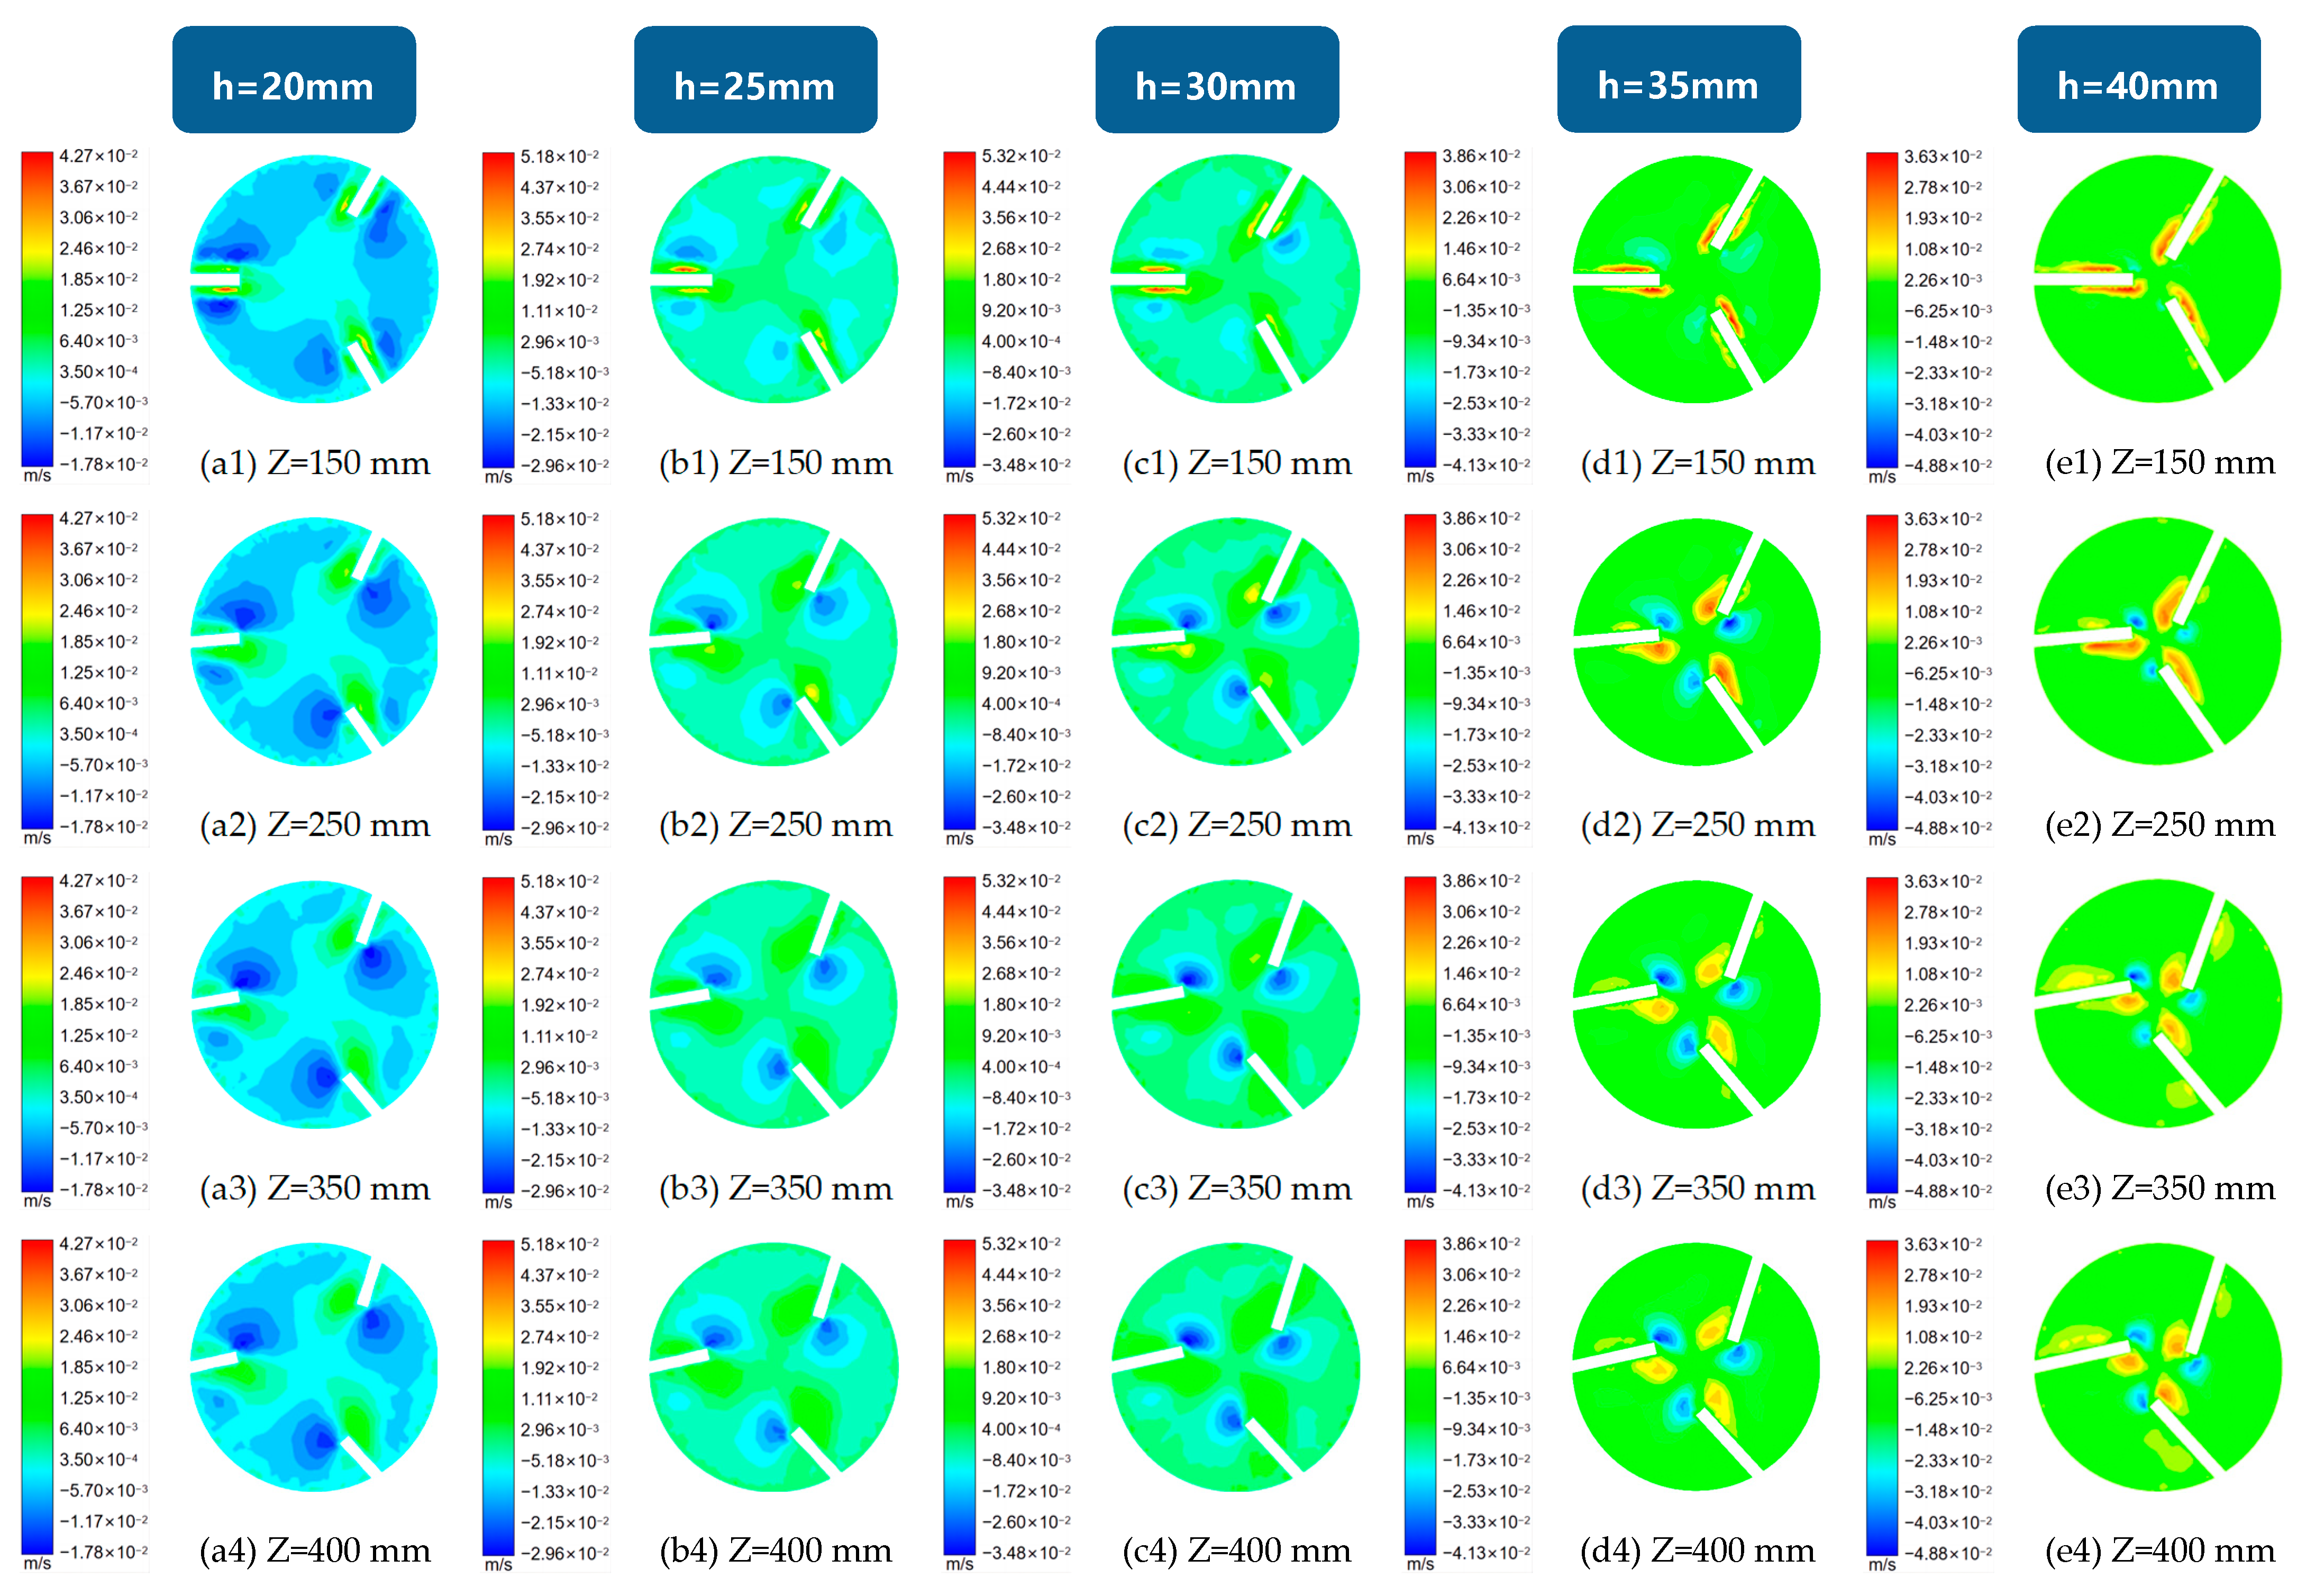
Four sections with Z = 150 mm, 250 mm, 350 mm and 400 mm were selected for the tangential velocity analysis. Figure 11 shows the tangential velocity distribution of the cyclone internal sections at different guide vane heights at a flow rate of 40 m3/h. It can be seen that when the guide vane height was 25 mm, 30 mm and 35 mm, there were three obvious areas in the centre of the pipe where the tangential velocity was anticlockwise, while on both sides of the three guide vanes, there was a region where the tangential velocity was clockwise on each side. However, when the guide vane height was 20 mm and 40 mm, the distribution of these areas was not obvious. When the height of the guide vane was too low, the spiral flow formed is low, and when the height of the guide vane is too high, the central area of the pipe is small and the water flow guided by the guide vane interferes with each other, which is not conducive to the formation of a stable spiral flow. It can be seen that the height of the guide vane is either too high or too low for the formation of a spiral flow, and only when the height of the guide vane is moderate can a more stable spiral flow be formed quickly.
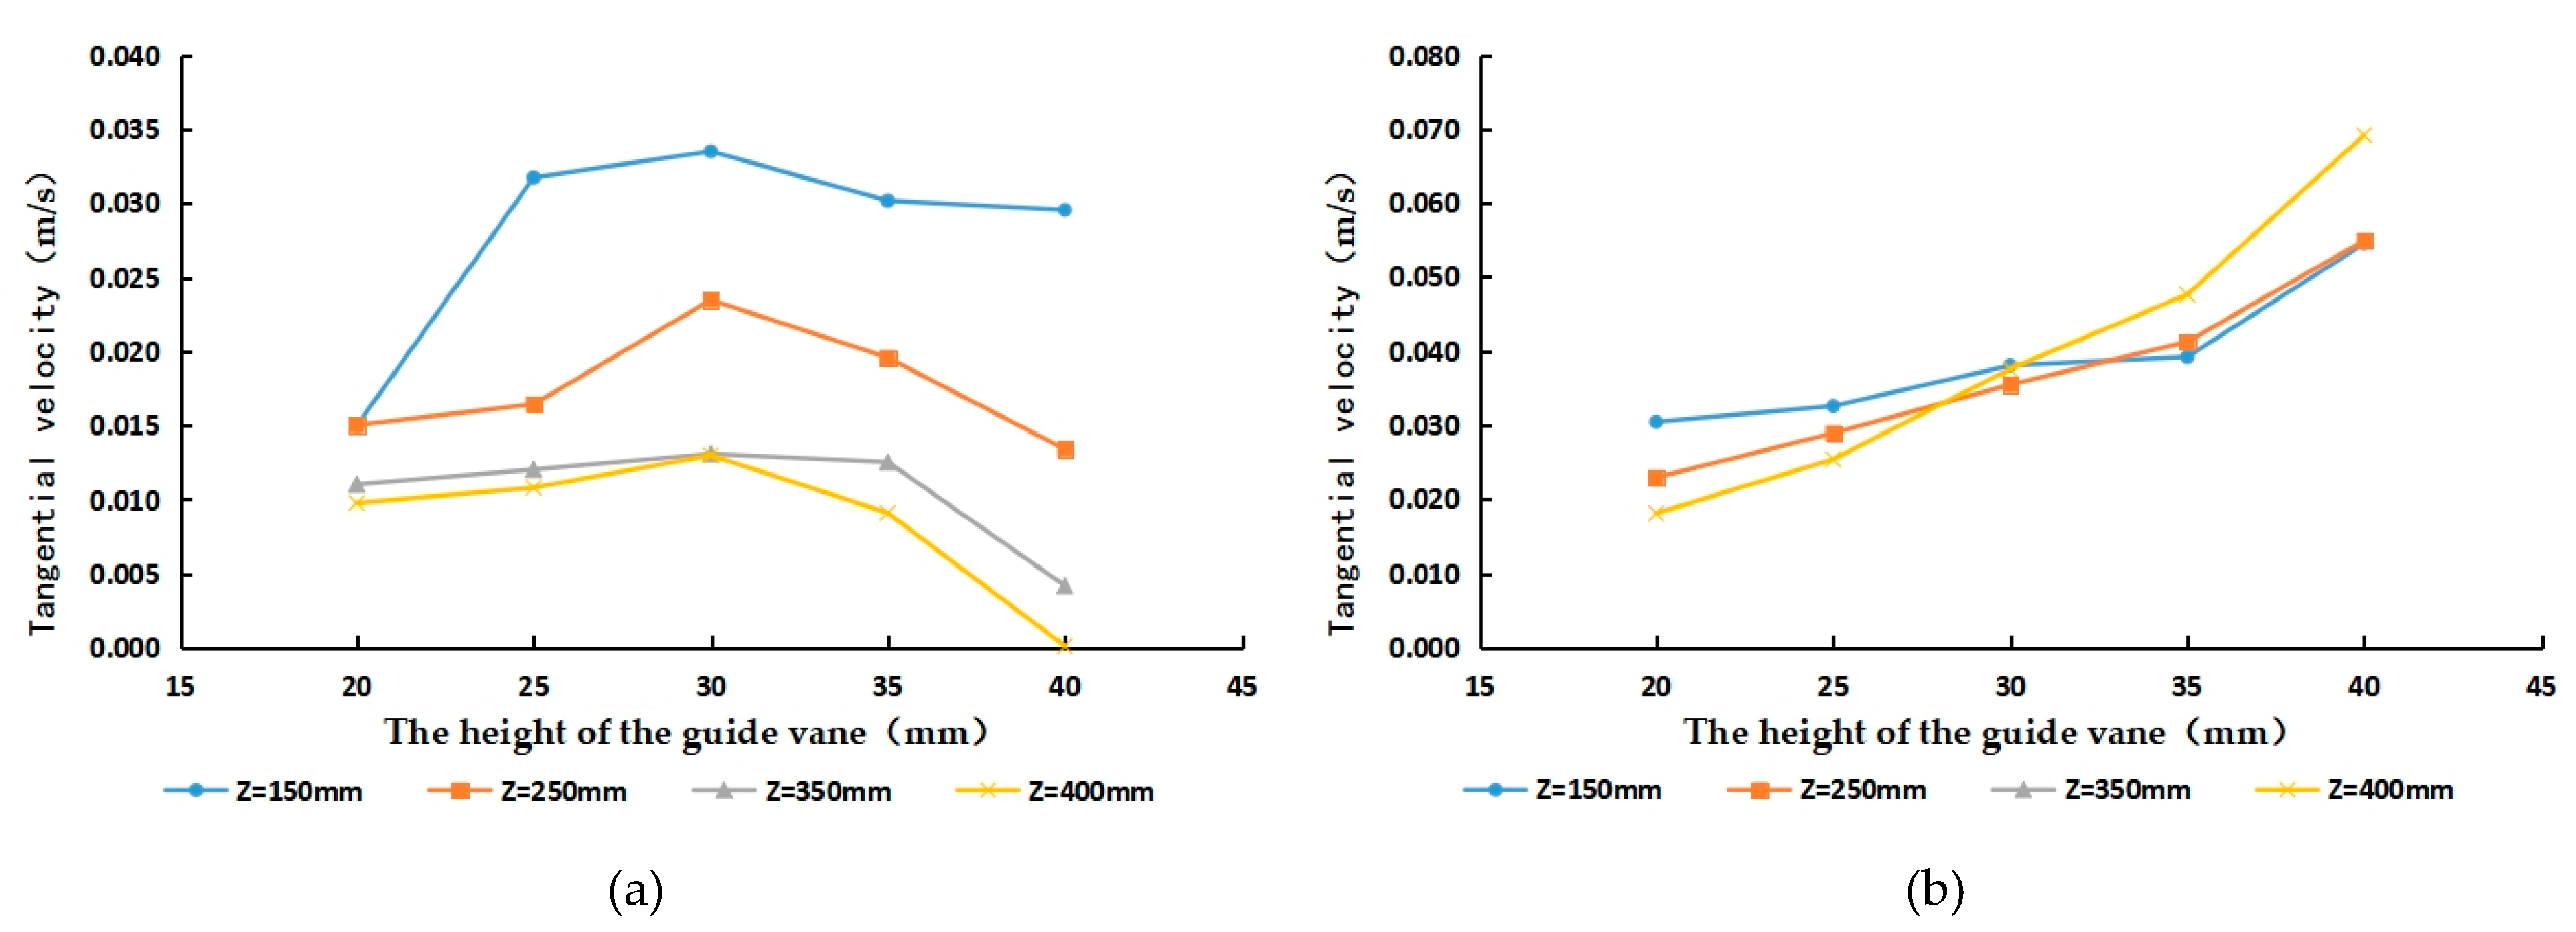
To further investigate the influence of the guide vane height on the tangential velocity, a line graph of the maximum tangential velocity with the height of guide vane for each section was made, as shown in Figure 12. As can be seen from the graph, at a flow rate of Q = 40 m3/h, the maximum anticlockwise tangential velocity of the same section inside the cyclone with different guide vane heights increased with the increase in the guide vane height and then decreased. The anticlockwise tangential velocity basically reached the maximum when the guide vane height was 30 mm and the height−to−diameter ratio was 0.6, while the maximum clockwise tangential velocity basically increased with the increase in the guide vane height.
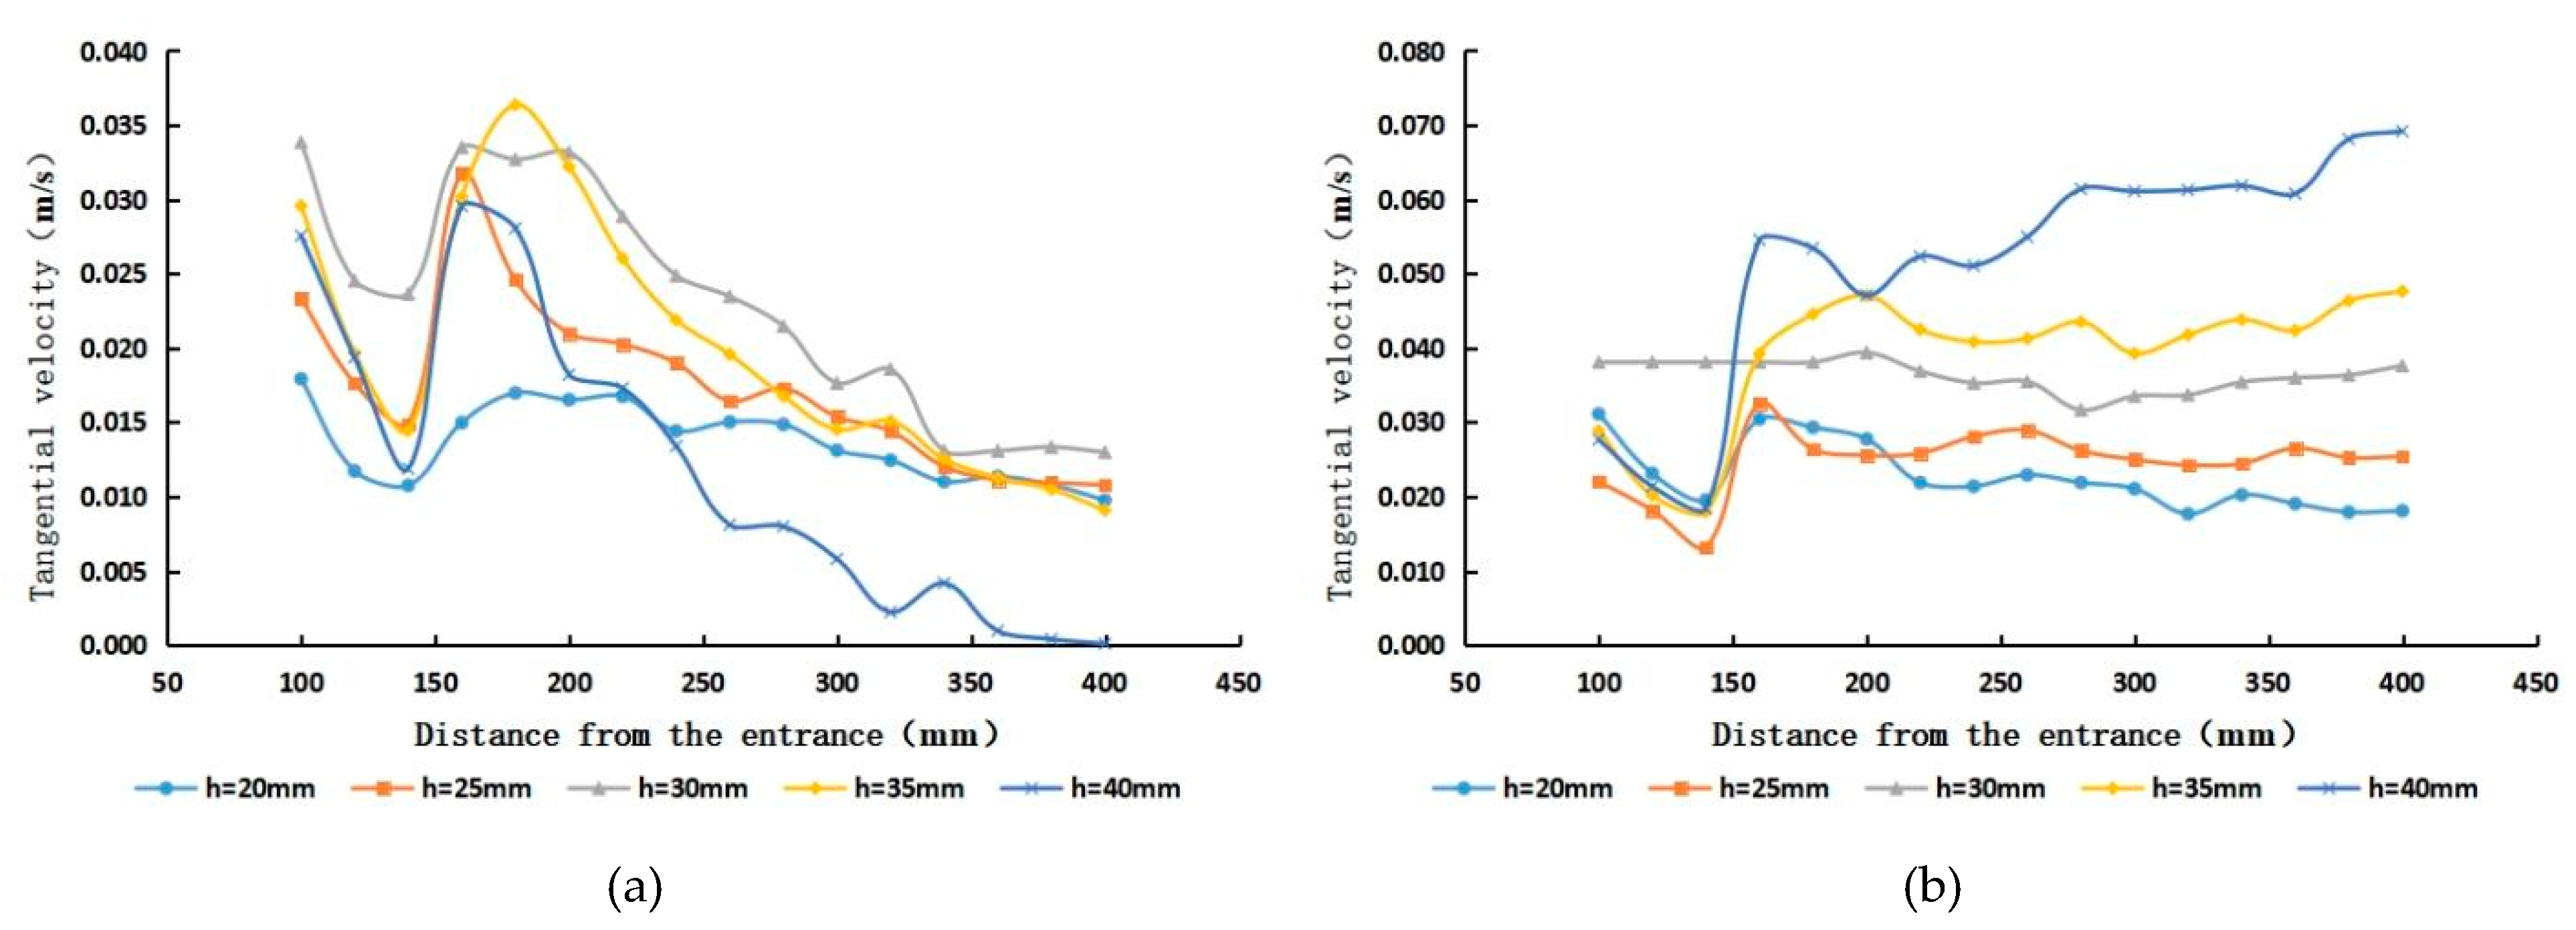
To analyse the trend of tangential velocity along the course in the cyclone with different guide vane heights, the maximum anticlockwise tangential velocity and the maximum clockwise tangential velocity were selected for analysis, which are shown in Figure 13. It was found that the anticlockwise tangential velocity tended to decay along the range, and the higher the height of the guide vane, the faster the decay rate. This shows that when the height of the guide vane is too high, the spiral flow in the centre of the pipe decays rapidly until it tends to zero. Especially when the height of the guide vane was 40 mm, at the Z = 400 mm section, the maximum anticlockwise circumferential flow velocity tended to zero, which shows that when the height of the guide vane is too high, the spiral flow along the central area of the pipe quickly decays until it tends to zero, which shows that the design of the height of the guide vane in the cyclone should not be too high.
In summary, when the ratio of the guide vane height to the cyclone inner diameter is in the range of 0.5–0.7, a strong and stable spiral flow can be produced. The anticlockwise circumferential flow velocity reaches its maximum at a height-to-diameter ratio of around 0.6, when the spiral flow was the strongest.
5.2. Analysis of the Internal Radial Velocity Characteristics of Cyclones with Different Guide Vane Heights
Four sections with Z = 150 mm, 250 mm, 350 mm and 400 mm were also selected for radial velocity analysis. Figure 14 shows the radial velocity distribution of the internal sections of the cyclone at different guide vane heights at a flow rate of 40 m3/h. It can be seen that as the height of the guide vane increased, the radial velocity area pointing to the tube wall increased, while the radial velocity area pointing to the tube axis decreased. When the height of the guide vane was 35 mm or 40 mm, there was a clear area of radial velocity pointing towards the tube wall on the waterward side of the outer edge of the guide vane, while at a guide vane height of 20 mm, 25 mm and 30 mm, the radial velocity pointing towards the tube wall was not obvious. This is due to the fact that with the deflection of the guide vane, the water tends to move in a circular motion under the action of the guide vane, which generates a centrifugal force in the outward direction, and under the action of this force, the water flow at some locations produces a flow velocity away from the centre of the circle. When the height of the guide vane is small, the outer edge of the guide vane produces little flow away from the centre of the circle. As the height of the guide vane increases, this deflecting effect becomes more pronounced, so the radial velocity region pointing towards the tube wall becomes larger as the height of the guide vane increases.
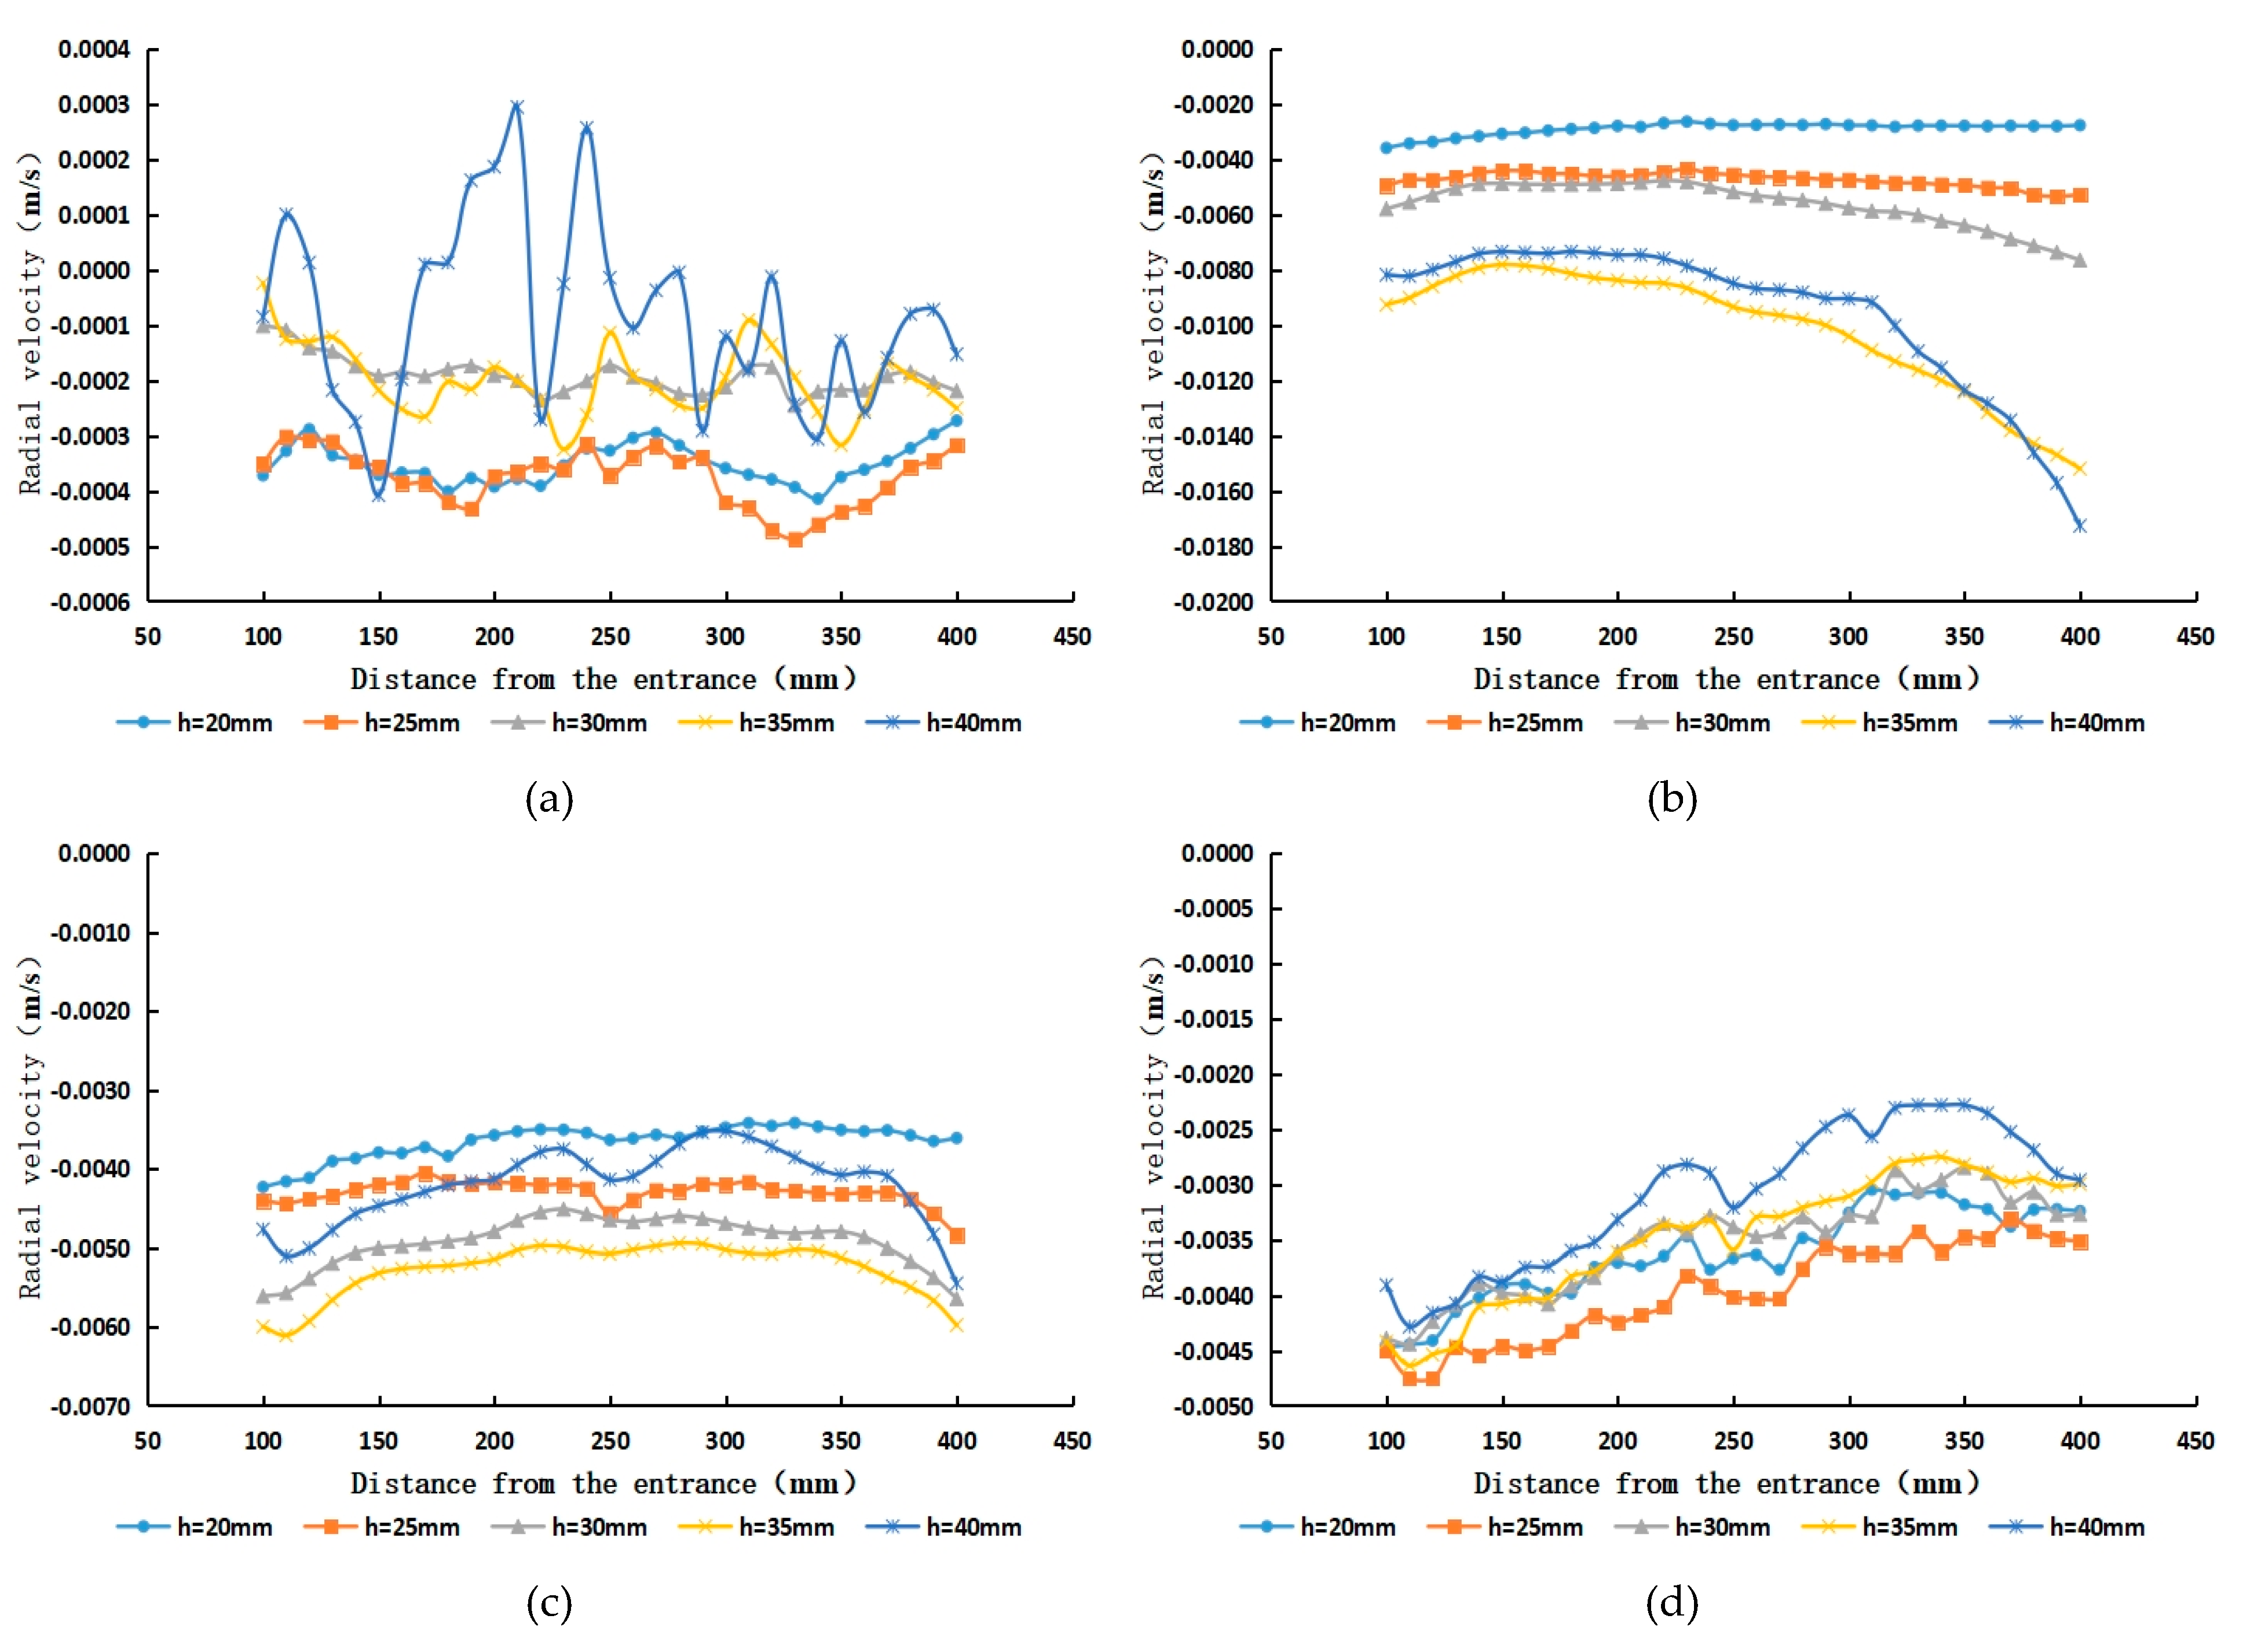
To analyse the trend of radial velocity along the course in the cyclone at different guide vane heights, we selected four characteristic locations (0, 0°), (20, 0°), (30, 0°) and (40, 0°) for analysis, which are shown in Figure 15. At the characteristic points (0, 0°), (30, 0°) and (40, 0°), the values of the radial velocity were small, of the order of 0.01 m/s or less, and there was no significant relationship between the magnitude of the radial velocity and the height of the guide vane, which indicates that the influence of different heights of the guide vane on the position of these three characteristic points is small. At the characteristic point (20, 0°), the magnitude of the radial velocity increased with the height of the guide vane, especially at 35 mm and 40 mm, where the radial velocity tended to increase significantly along the course.
5.3. Analysis of the Internal Axial Velocity Characteristics of Cyclones with Different Guide Vane Heights
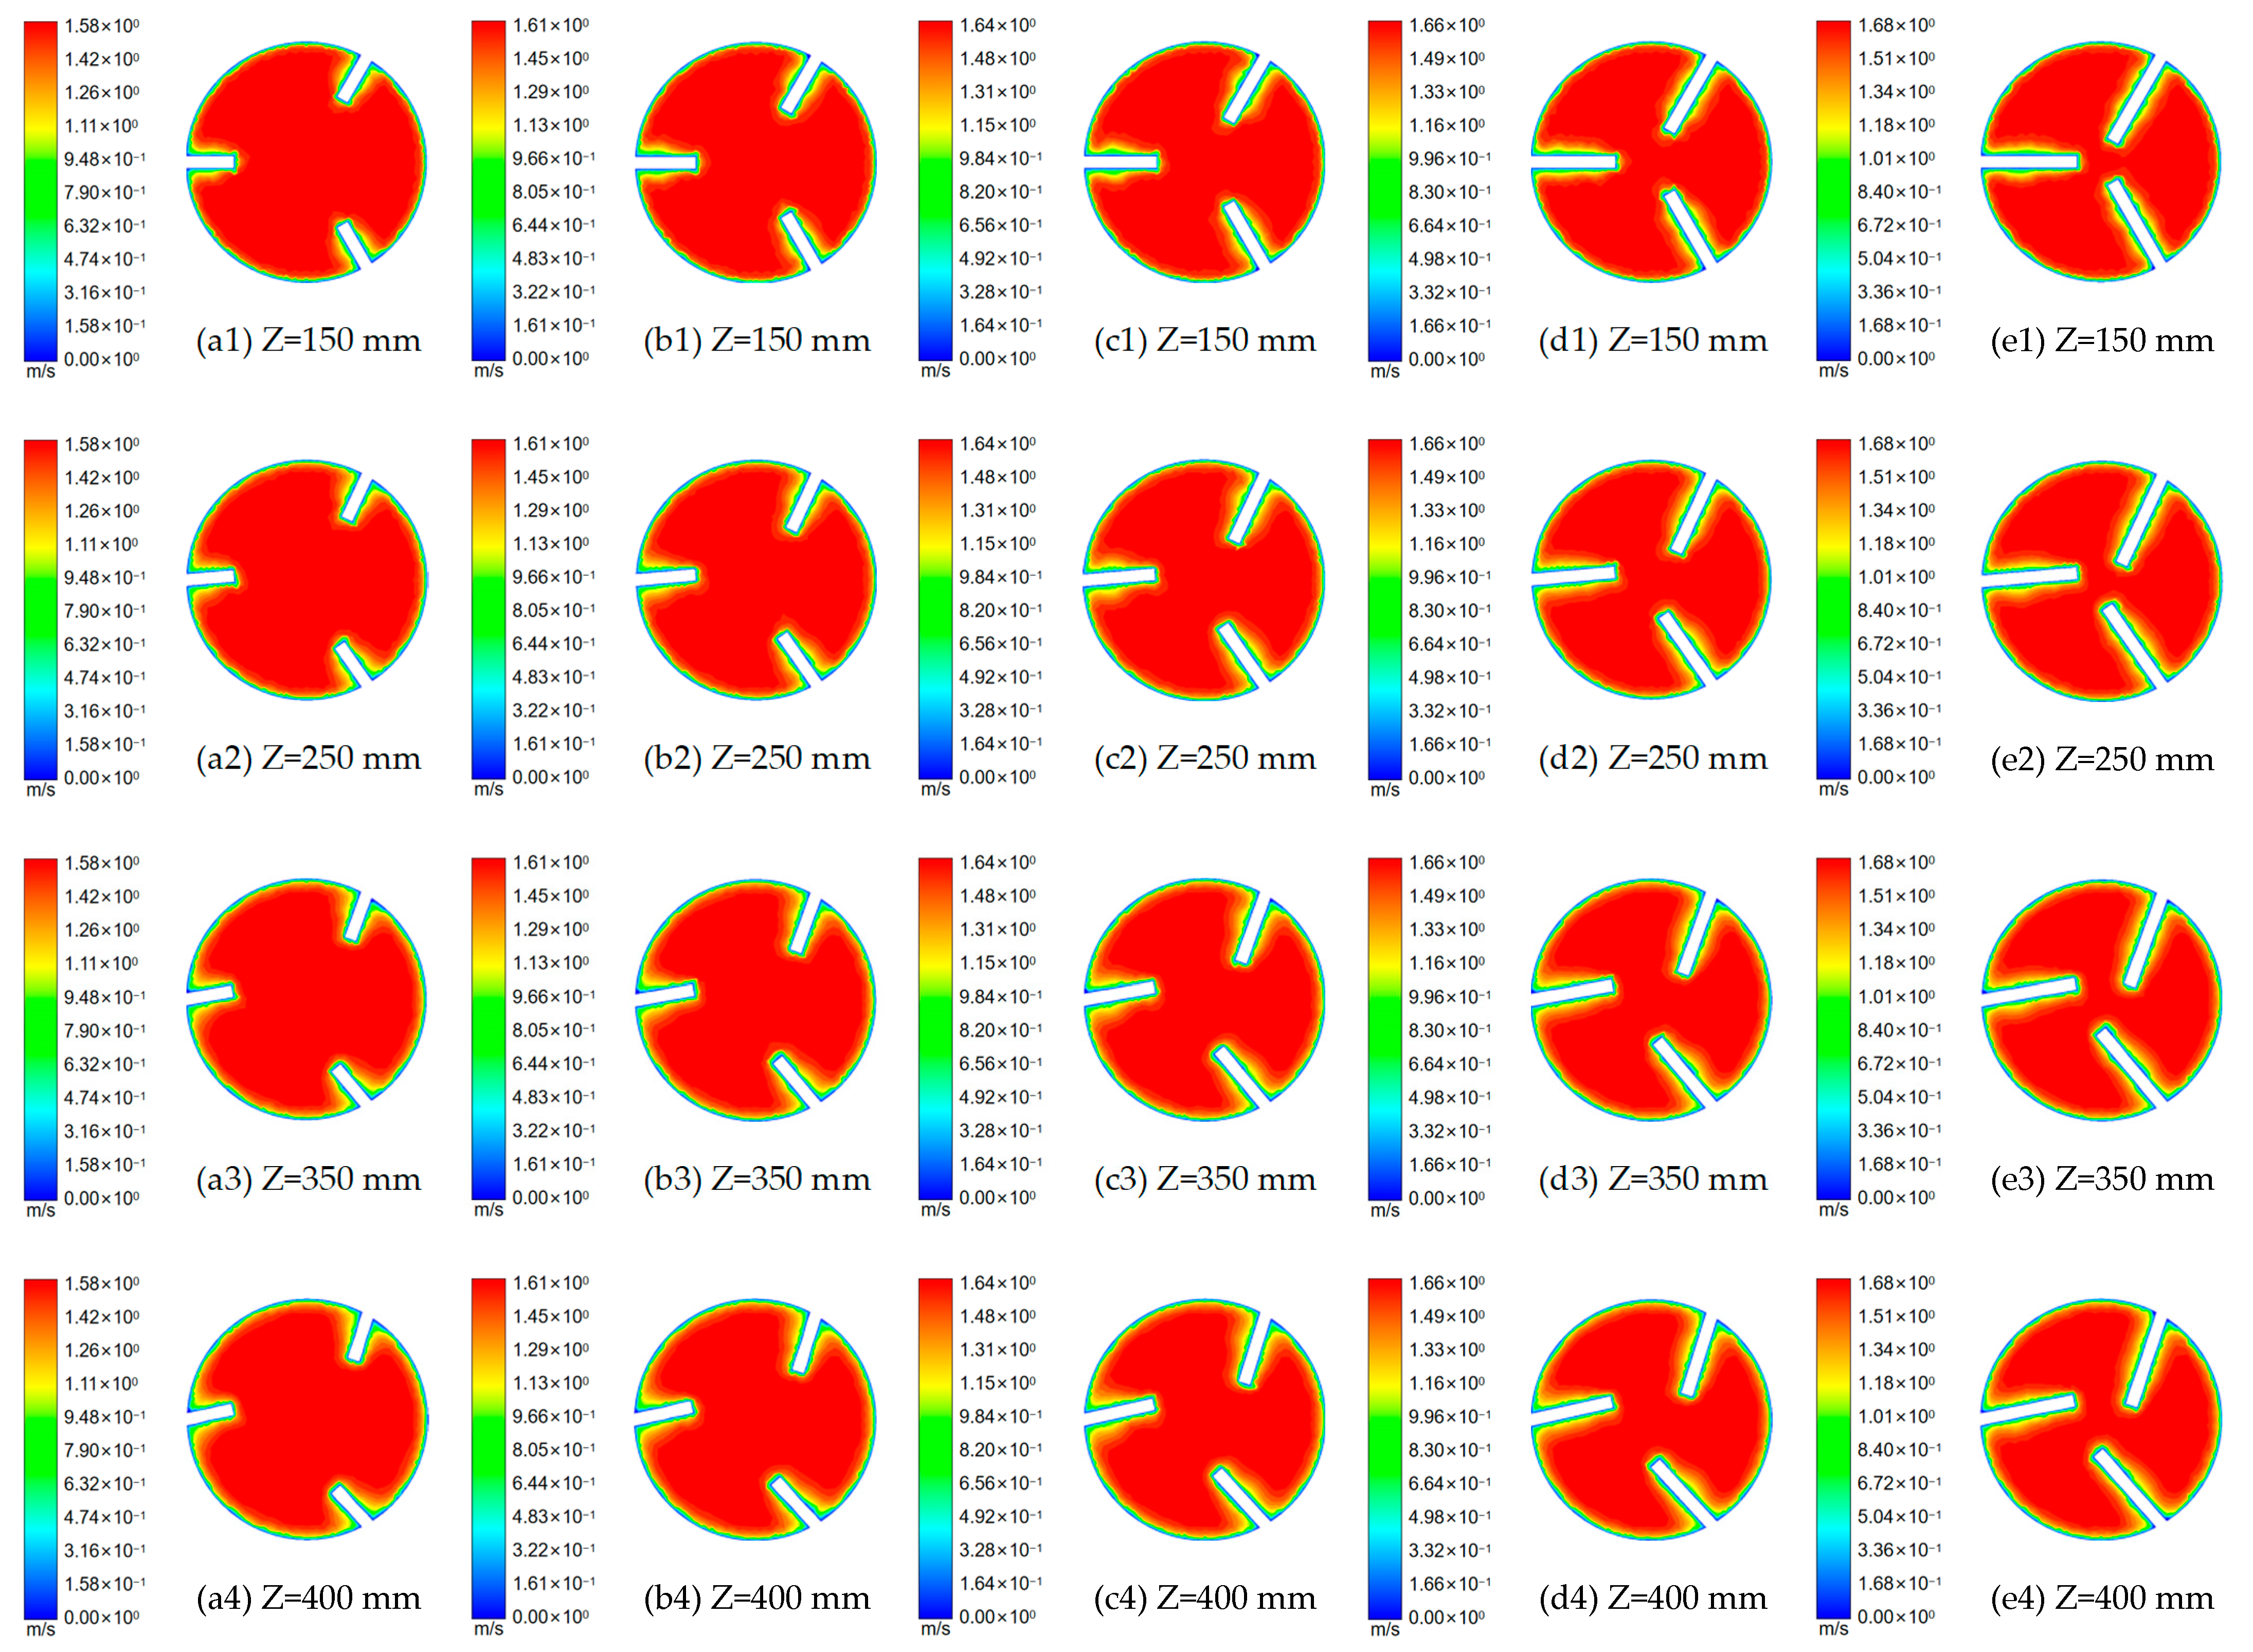
Four sections with Z = 150 mm, 250 mm, 350 mm and 400 mm were also selected for axial velocity analysis. Figure 16 shows the axial flow velocity distribution of the cyclone internal sections at different guide vane heights at a flow rate of 40 m3/h. It can be seen that the overall distribution of the axial flow velocity varied similarly to the turbulent flow velocity distribution of a circular tube, due to the viscosity of the liquid. The axial flow velocity in the area near the axis of the pipe was large and the flow velocity gradient was small, while near the pipe wall and guide vane, the axial flow velocity dropped sharply and the flow velocity gradient was large.
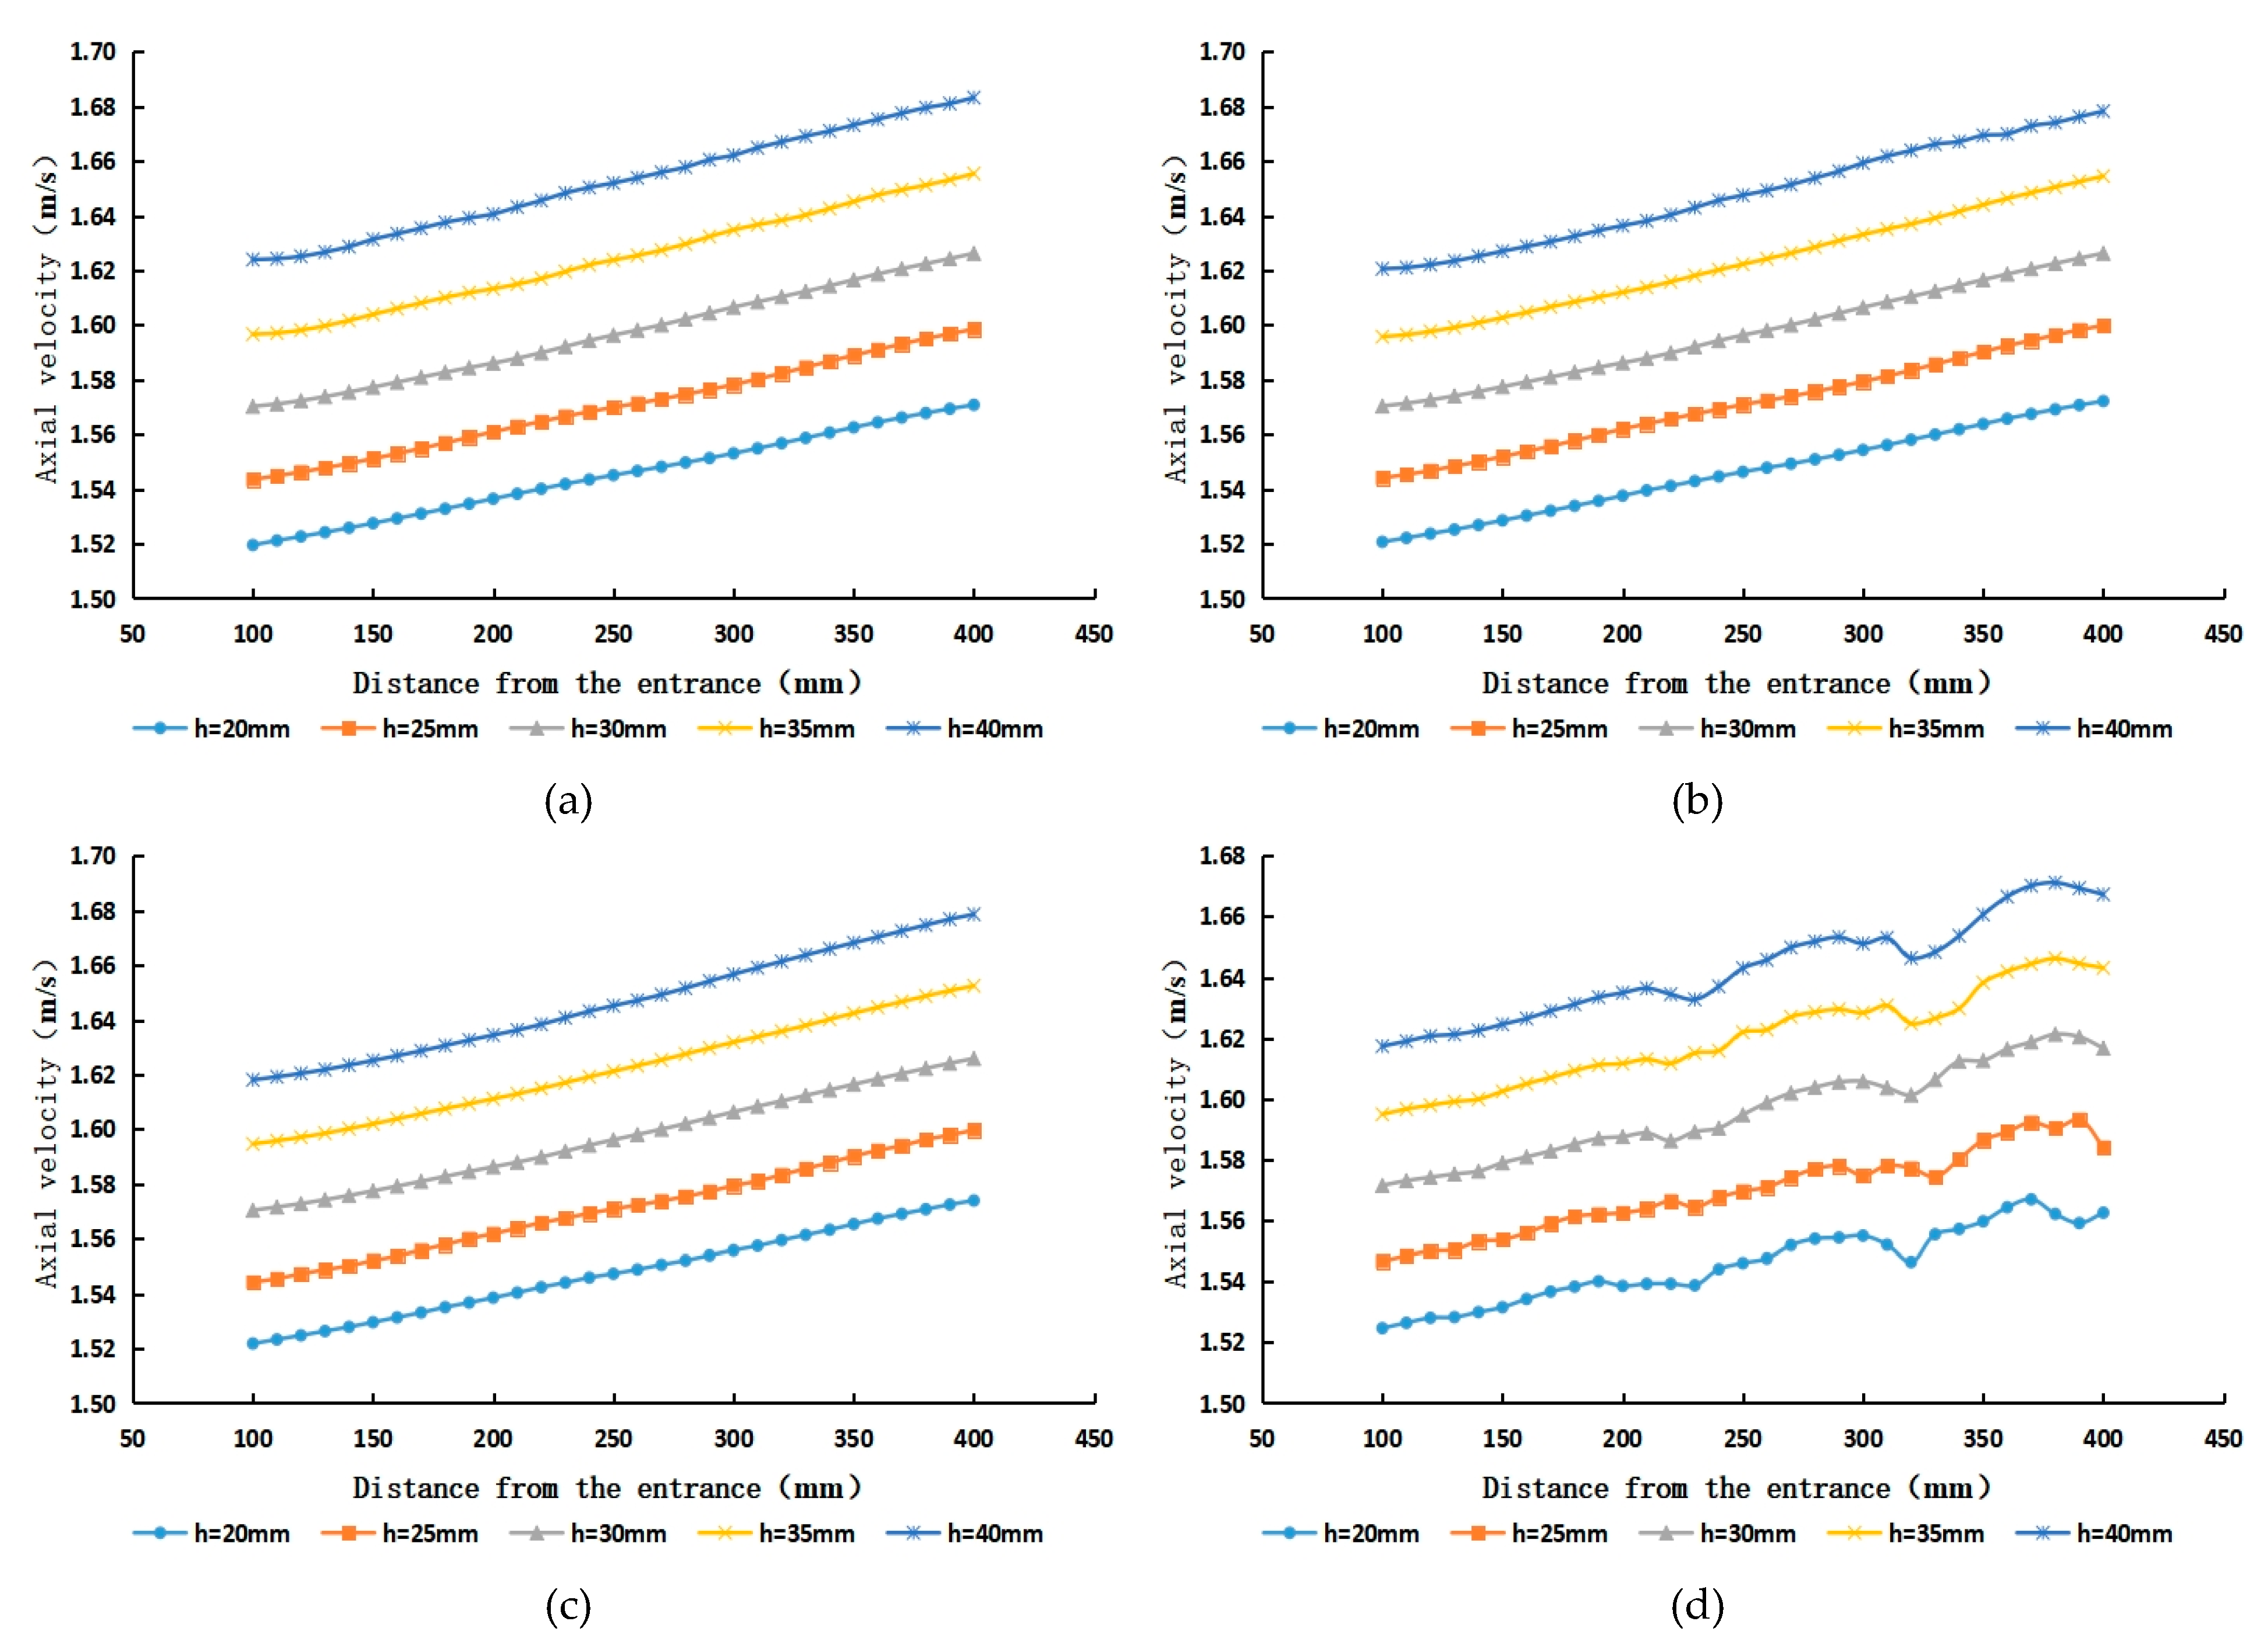
To analyse the trend of the axial velocity along the course in the cyclone at different guide vane heights, we selected four characteristic positions (0, 0°), (20, 0°), (30, 0°) and (40, 0°) for analysis, which are shown in Figure 17. It can be seen that the axial flow velocity of the water inside the cyclone gradually increased along the course, which is due to the twisting of the guide vane at Z = 150 mm, and the water−retaining area of the guide vane in the axial direction gradually became larger along the course. When the height of the guide vane increased, the maximum axial flow velocity at each section increased due to the larger water−retaining area of the guide vane, which reduced the water−crossing area. Comparing the axial velocity along the course at different characteristic points, we found that when the characteristic point from the pipe axis to the pipe wall, the distribution of axial flow velocity remained almost constant along the course; only at (40, 0°), a characteristic point position closer to the tube wall, did smaller fluctuations occur. This indicates that the axial velocity in most areas of the pipe is less affected by the guide vane and is more evenly distributed in the same section, with only the flow near the pipe wall and guide vane being slowed by resistance.
6. Discussion and Conclusions
- The tangential velocity in the centre of the cyclone pipe is mainly in the anticlockwise direction, and the flow velocity increases with the increase in the guide vane height and then decreases. When the ratio between the height of the guide vane and the inner diameter of the cyclone is in the range of 0.5 to 0.7, it can produce a high−strength and more stable spiral flow. When the height of the guide vane is 30 mm and the height−to−diameter ratio is near 0.6, the tangential velocity reaches its maximum and the intensity of the spiral flow generated is the highest, which enables more particle of different sizes to enter the suspended flow at this time and provides a better sand removal effect.
- The radial velocity increases as the height of the guide vane increases, and the radial velocity region pointing towards the tube wall increases, while the radial velocity region pointing towards the tube axis decreases.
- The overall distribution of axial flow velocity is similar to that of turbulent flow in a circular tube. The axial flow velocity inside the cyclone increases gradually along the course due to the influence of the water−retaining area of the guide vane and increases accordingly when the height of the guide vane increases.
Author Contributions
Writing—review and editing, S.T.; resources, Y.L.; software, X.S.; supervision, J.Z. All authors have read and agreed to the published version of the manuscript.
Funding
This research was funded by the National Natural Science Foundation of China (51179116) and the Natural Science Foundation of Shanxi province (202303021211141).
Data Availability Statement
Not applicable.
Conflicts of Interest
The authors declare no conflict of interest.
References
- Deng, A.; Chen, J.; Hu, H.; Zhang, G. Analysis of reservoir siltation in China. J. Hydraul. Eng. 2022, 53, 325–332. [Google Scholar]
- Cao, W.; Liu, C. Advance and prospect in research on reservoir sediment control and functional restoration. J. Hydraul. Eng. 2018, 49, 1079–1086. [Google Scholar]
- Liu, J.; Zhang, Z. Evaluation and countermeasure analysis of the impact of sedimentation in reservoir. Shaanxi Water Resour. 2018, 49, 1079–1086. [Google Scholar]
- Yan, Z.; Wang, Y.; Jiang, S. An Overview of Reservoir Siltation Control Techniques. In Proceedings of the Inaugural Meeting of the Professional Committee on Reservoir Sediment Treatment and Resource Utilization Technology of the Chinese Society of Dam Engineering; 2017; pp. 119–126. [Google Scholar]
- Parshall, R.L. Model and prototype studies of sand traps. Trans. Am. Soc. Civ. Eng. 1952, 117, 204–212. [Google Scholar] [CrossRef]
- Robinson, A.R. Vortex tube sand trap. Trans. Am. Soc. Civ. Eng. 1962, 127, 391–425. [Google Scholar] [CrossRef]
- Kreith, F.; Sonju, O.K. The decay of a turbulent swirl in a pipe. J. Fluid Mech. 1965, 22, 257–271. [Google Scholar] [CrossRef]
- Kitoh, O. Experimental study of turbulent swirling flow in a straight pipe. J. Fluid Mech. 1991, 225, 445–479. [Google Scholar] [CrossRef]
- Atkinson, E. Vortex-tube sediment extractors. I: Trapping efficiency. J. Hydraul. Eng. 1994, 120, 1110–1125. [Google Scholar] [CrossRef]
- Wang, Q. Experimental Study on Development of Secondary Flow and its Sediment Sluicing Effect. Yellow River 1987, 5, 12–17. [Google Scholar]
- Chen, Y.; Guo, T.; Gao, E. Mechanistic study of reservoir sediment removal by vortex flow pipes. Water Resour. Hydropower Eng. 1993, 53–56. [Google Scholar]
- Wang, S.; Rao, Y.; Zhang, L.; Ma, W.; Zhao, S. Research Situation and Progress on Flow Characteristics of Spiral Flow in Horizontal Pipe. J. Tai Yuan Univ. Technol. 2013, 44, 232–236. [Google Scholar]
- Wang, S.; Rao, Y.; Wu, Y.; Wang, B. Experimental Research on Gas-Liquid Two-Phase Spiral Flow in a Horizontal Pipe. J. Exp. Mech. 2013, 14, 77–86. [Google Scholar]
- Zhang, Y.; Zhang, Q.; Zhang, L. Experimental Study on Inlet Velocity Field of the Spiral Flow Desiltor. Pearl River 2019, 40, 111–115, 145. [Google Scholar]
- Xihuan, S.; Wenyan, W.; Pengling, W. Outlet cross-section velocity distribution and rotation efficiency of spiral pipe flow generator. J. Northwest AF Univ. 2000, 28, 37–41. [Google Scholar]
- Wu, P. Experimental Study on Energy Gradient of Sediment Transportation in Spiral Pipe Flow. Trans. Chin. Soc. Agric. Eng. (Trans. CSAE) 2002, 18, 60–63. [Google Scholar]
- Li, Y.; Sun, X.; Yan, Q. Experimental study on the characteristics of spiral flow in a local generator. J. Hydroelectr. Eng. 2011, 30, 72–77. [Google Scholar]
- Li, Y.; Gao, Y.; Jia, X.; Lu, Y.; Sun, X.; Zhang, X.; Li, J. Velocity characteristics of spiral flow in downstream section of guide vane cyclone. J. Drain. Irrig. Mach. Eng. 2020, 38, 807–813. [Google Scholar]
- Li, Y.; Zhang, T.; Li, F. Study on Hydraulic Characteristics of Hydrocyclones with Different Guide Vane Heights in Motion. J. Taiyuan Univ. Technol. 2020, 51, 706–711. [Google Scholar]
- Zhou, F.; Wang, C.; Qiu, X. Numerical Simulation of Flow around Standard Model of High-rise Building. Sci. Technol. Eng. 2022, 22, 5852–5859. [Google Scholar]
Figure 1.
Schematic diagram of the geometric model of a guide vane cyclone: (a) Front view and (b) side view.
Figure 1.
Schematic diagram of the geometric model of a guide vane cyclone: (a) Front view and (b) side view.

Figure 2.
Schematic diagram of meshing: (a) unstructured grid of the cyclone and (b) structured grid of the downstream area.
Figure 2.
Schematic diagram of meshing: (a) unstructured grid of the cyclone and (b) structured grid of the downstream area.

Figure 3.
Comparison of the results of numerical simulations of three mesh−size models: (a) tangential velocity and (b) axial velocity.
Figure 3.
Comparison of the results of numerical simulations of three mesh−size models: (a) tangential velocity and (b) axial velocity.

Figure 4.
Schematic diagram of the cyclone structure.

Figure 5.
Schematic diagram of the column coordinate system.

Figure 6.
Section arrangement of the simulation experiment (unit: mm).

Figure 7.
Arrangement of feature locations (unit: mm).

Figure 8.
Layout of the test system.

Figure 9.
Schematic diagram of the PIV system in use.

Figure 10.
Comparison of measured and simulated values of the along—stream velocity inside a cyclone: (a) H = 20 mm, (b) H = 30 mm, and (c) H = 40 mm.
Figure 10.
Comparison of measured and simulated values of the along—stream velocity inside a cyclone: (a) H = 20 mm, (b) H = 30 mm, and (c) H = 40 mm.

Figure 11.
Tangential velocity distribution of cyclone internal sections at different guide vane heights: (a) h = 20 mm, (b) h = 25 mm, (c) h = 30 mm, (d) h = 35 mm and (e) h = 40 mm.
Figure 11.
Tangential velocity distribution of cyclone internal sections at different guide vane heights: (a) h = 20 mm, (b) h = 25 mm, (c) h = 30 mm, (d) h = 35 mm and (e) h = 40 mm.

Figure 12.
Plot of maximum tangential velocity with the height of the guide vane for each section: (a) anticlockwise tangential velocity and (b) clockwise tangential velocity.
Figure 12.
Plot of maximum tangential velocity with the height of the guide vane for each section: (a) anticlockwise tangential velocity and (b) clockwise tangential velocity.

Figure 13.
Plot of maximum tangential velocity along the course for different guide vane heights: (a) anticlockwise tangential velocity; (b) Clockwise tangential velocity.
Figure 13.
Plot of maximum tangential velocity along the course for different guide vane heights: (a) anticlockwise tangential velocity; (b) Clockwise tangential velocity.

Figure 14.
Radial velocity distribution of cyclone internal sections at different guide vane heights: (a) h = 20 mm, (b) h = 25 mm,(c) h = 30 mm,(d) h = 35 mm and (e) h = 40 mm.
Figure 14.
Radial velocity distribution of cyclone internal sections at different guide vane heights: (a) h = 20 mm, (b) h = 25 mm,(c) h = 30 mm,(d) h = 35 mm and (e) h = 40 mm.

Figure 15.
Variation curves along the course of radial velocity at characteristic positions inside the cyclone: (a) feature position (0, 0°), (b) feature position (20, 0°), (c) feature position (30, 0°), and (d) feature position (40, 0°).
Figure 15.
Variation curves along the course of radial velocity at characteristic positions inside the cyclone: (a) feature position (0, 0°), (b) feature position (20, 0°), (c) feature position (30, 0°), and (d) feature position (40, 0°).

Figure 16.
Axial velocity distribution of cyclone internal sections at different guide vane heights: (a) h = 20 mm, (b) h = 25 mm, (c) h = 30 mm, (d) h = 35 mm and (e) h = 40 mm.
Figure 16.
Axial velocity distribution of cyclone internal sections at different guide vane heights: (a) h = 20 mm, (b) h = 25 mm, (c) h = 30 mm, (d) h = 35 mm and (e) h = 40 mm.


Figure 17.
Variation curves along the course of axial velocity at characteristic positions inside the cyclone: (a) feature position (0, 0°), (b) feature position (20, 0°), (c) feature position (30, 0°), and (d) feature position (40, 0°).
Figure 17.
Variation curves along the course of axial velocity at characteristic positions inside the cyclone: (a) feature position (0, 0°), (b) feature position (20, 0°), (c) feature position (30, 0°), and (d) feature position (40, 0°).


Table 1.
Comparison of the advantages and shortcomings of k-ε models.
| Computational Models | Advantages | Disadvantages |
|---|---|---|
| Standard k-ε | Wide range of application, economic and reasonable, with high accuracy; its convergence and calculation accuracy can meet general engineering calculation requirements; suitable for design selection and parameter study. | Poor simulation of complex flows with high curvature and sharp changes in pressure gradients; deficiencies in the simulation of cyclonic and bypass flows. |
| RNG k-ε | Moderately complex flows, such as separation flows, secondary flows and cyclonic flows, can be simulated for complex shear flows involving fast strains and moderate vortices. | The strong cyclonic processes cannot be predicted due to the limitations of the vortex viscous homogeneity assumption. |
| Realisable k-ε | Similar to the RNG, the calculation is more accurate than the RNG and allows for better simulation of circular jets. | Strong cyclonic processes cannot be predicted due to the limitations of the vortex viscous homogeneity assumption. Turbulent eddy viscosity coefficients are strain rate dependent and therefore less efficient to calculate. |
Disclaimer/Publisher’s Note: The statements, opinions and data contained in all publications are solely those of the individual author(s) and contributor(s) and not of MDPI and/or the editor(s). MDPI and/or the editor(s) disclaim responsibility for any injury to people or property resulting from any ideas, methods, instructions or products referred to in the content. |
© 2022 by the authors. Licensee MDPI, Basel, Switzerland. This article is an open access article distributed under the terms and conditions of the Creative Commons Attribution (CC BY) license (https://creativecommons.org/licenses/by/4.0/).
Share and Cite
MDPI and ACS Style
Tao, S.; Li, Y.; Song, X.; Zhang, J. Study of the Internal Cyclonic Flow Characteristics of Cyclones with Different Guide Vane Heights. Water 2023, 15, 78. https://doi.org/10.3390/w15010078
AMA Style
Tao S, Li Y, Song X, Zhang J. Study of the Internal Cyclonic Flow Characteristics of Cyclones with Different Guide Vane Heights. Water. 2023; 15(1):78. https://doi.org/10.3390/w15010078
Chicago/Turabian StyleTao, Siyuan, Yongye Li, Xiaoteng Song, and Jiaxuan Zhang. 2023. "Study of the Internal Cyclonic Flow Characteristics of Cyclones with Different Guide Vane Heights" Water 15, no. 1: 78. https://doi.org/10.3390/w15010078
Note that from the first issue of 2016, this journal uses article numbers instead of page numbers. See further details here.