
Climate Change Impacts on Water Resources in the Danube River Basin: A Hydrological Modelling Study Using EURO-CORDEX Climate Scenarios

Department of Geography, Ludwig-Maximilians-Universität München (LMU), Luisenstraße 37, 80333 Munich, Germany
*
Author to whom correspondence should be addressed.
Water 2023, 15(1), 8; https://doi.org/10.3390/w15010008
Submission received: 19 November 2022
/
Revised: 9 December 2022
/
Accepted: 13 December 2022
/
Published: 21 December 2022
(This article belongs to the Special Issue Impacts of Climate Change on Hydrology and Water Resources)
Abstract
:Climate change affects the hydrological cycle of river basins and strongly impacts water resource availability. The mechanistic hydrological model PROMET was driven with an ensemble of EURO-CORDEX regional climate model projections under the emission scenarios RCP2.6 and RCP8.5 to analyze changes in temperature, precipitation, soil water content, plant water stress, snow water equivalent (SWE) and runoff dynamics in the Danube River Basin (DRB) in the near (2031–2060) and far future (2071–2100) compared to the historical reference (1971–2000). Climate change impacts remain moderate for RCP2.6 and become severe for RCP8.5, exhibiting strong year-round warming trends in the far future with wetter winters in the Upper Danube and drier summers in the Lower Danube, leading to decreasing summer soil water contents, increasing plant water stress and decreasing SWE. Discharge seasonality of the Danube River shifts toward increasing winter runoff and decreasing summer runoff, while the risk of high flows increases along the entire Danube mainstream and the risk of low flows increases along the Lower Danube River. Our results reveal increasing climate change-induced discrepancies between water surplus and demand in space and time, likely leading to intensified upstream–downstream and inter-sectoral water competition in the DRB under climate change.
1. Introduction
River basins are complex hydrological systems, in which hydrological processes are highly interconnected and highly susceptible to climate change. The recently published Sixth Assessment Report (AR6) of the Intergovernmental Panel on Climate Change (IPCC) stated that the global surface temperature has already increased by +1.09 °C (+0.95 °C to +1.20 °C) in 2011–2020 compared to 1850–1900 [1]. This recent development is already quite rapidly reducing the remaining scope for further greenhouse gas emissions in light of the Paris Agreement targets of limiting the global surface temperature increase to well below +2 °C and preferably below +1.5 °C above pre-industrial levels [2].
A global average temperature increase is not equivalent to a uniform temperature increase across the globe, but rather to a heterogeneous spatial distribution with hot and cold spots of temperature increase [3,4,5]. For the Danube River Basin (DRB), for example, the results from the IPCC AR6 suggested that a global average temperature increase of +2 °C compared to the pre-industrial level would translate into a median temperature increase of +2.7 °C on spatial average across the basin [6,7].
Large and densely inhabited transboundary watersheds, such as the DRB, are especially susceptible to climate change, which directly and indirectly affects water resource availability [8]. With the International Commission for the Protection of the Danube River (ICPDR) founded in 1998, the DRB has a long tradition of transboundary water management with the main goal of achieving sustainable water resource management in line with the EU Water Framework Directive (WFD). Moreover, the ICPDR has developed and pursues a climate change adaptation strategy [9] based on recent results in climate change impact research.
Based on an extensive review of numerous climate change case studies in the DRB [10], the ICPDR anticipates an increase in the mean annual temperature of 4.0 °C to 5.0 °C until 2100 in the DRB, under the Representative Concentration Pathway (RCP) emission scenario RCP8.5 [9]. Moreover, the ICPDR identified overarching spatial and seasonal precipitation trends, according to which wet regions tend to become wetter, dry regions tend to become drier and precipitation seasonality tends to shift toward wetter winters and drier summers [9].
In the literature, few hydrological climate change impact modelling studies exist which consider the whole DRB. They have mostly relied on general circulation models (GCMs) of coarser resolution rather than regional climate models (RCMs), or on GCM-RCM combinations of former generations. Stagl and Hattermann [11] investigated river discharge in the DRB by using the process-based watershed model SWIM [12] driven with ENSEMBLES GCM-RCM combinations under SRES (Special Report on Emissions Scenarios) [13] based on the Coupled Model Intercomparison Project Phase 3 (CMIP3) [14]. Subsequently, Stagl and Hattermann [15] investigated discharge in the DRB by driving SWIM with a GCM ensemble of CMIP5 [16] under different RCPs. Here, coarse-resolution GCMs were directly used as the meteorological driver instead of high-resolution RCMs. However, hydrological climate change impact assessment requires higher-resolution meteorological drivers such as RCMs, since GCMs cannot resolve circulation patterns down to the finer scales on which hydrological processes occur [17]. Bisselink et al. [18] investigated water scarcity in the DRB by using the process-based hydrological model LISFLOOD [19,20] driven by a EURO-CORDEX [21] GCM-RCM ensemble under a 2 °C global mean temperature increase according to the RCP8.5 scenario. The analyzed future periods were not uniformly selected for the entire ensemble, but were centered on the year of exceeding 2 °C global mean temperature for each single GCM [18].
To the best of our knowledge, a systematic and comparative hydrological modelling study using the (to date) latest-generation high-resolution EURO-CORDEX [21] GCM-RCM simulations under different RCPs and uniformly selected future periods for the entire ensemble—enabling to directly compare the development of different components of the water cycle (e.g., precipitation, soil and snow water, discharge) in a near and far future time frame—is not yet available for the whole DRB.
We present a hydrological climate change impact modelling study for the DRB, using the process-based hydrological model PROMET [22], which interlinks dynamic vegetation and hydrological modelling and was chosen due to its strong physical basis and predictive power. Probst and Mauser [23] successfully applied PROMET in the DRB, driven with meteorological reanalysis data to analyze the influence of different climatologies used for bias correction on the quality of the simulated spatial discharge. They fully validated the PROMET model in the DRB using the observed daily discharge at major sub-basin gauges [23].
In this study, we evaluated future projections of temperature and of different components of the hydrological cycle, namely precipitation, soil water content, snow water equivalent, the resulting river runoff dynamics as well as plant water stress as a water-related vegetation variable and their respective interdependencies in the DRB. These variables are of direct relevance for water resource availability, and they address the dynamic response of vegetation development to climate change in the DRB. For this, we analyzed simulations of the PROMET hydrological model (30″ spatial resolution) driven by a selected high-resolution GCM-RCM ensemble of the (to date) most recent and most high-resolution regional climate change projections for Europe from the EURO-CORDEX initiative [21]. Within EURO-CORDEX, GCM simulations from the CMIP5 initiative were dynamically regionalized by RCMs. For each variable, we compared the results of the ensemble mean of the GCM-RCM-driven simulations for the historical period (1971–2000) with the results of the ensemble means of the GCM-RCM-driven simulations under the two emission scenarios RCP2.6 and RCP8.5 for both the near future (2031–2060) and the far future (2071–2100). By comparing RCP2.6 and RCP8.5, we highlighted the differences between two very different future projections for the DRB: (i) a scenario aiming to keep global warming likely below 2 °C above pre-industrial levels (RCP2.6); (ii) a high-end scenario with very high greenhouse gas emissions (RCP8.5) [24].
2. Materials and Methods
2.1. The Danube River Basin
The DRB is the second largest river basin in Europe, covering an area of ~817,000 km2 [25]. From its source in the Black Forest to its mouth in the Black Sea, the Danube’s river length amounts to 2857 km [26]. The DRB is a complex watershed, featuring heterogeneous natural characteristics in terms of topography and climate, which strongly influences basin-wide hydrology. The watershed comprises snow-and ice-covered high mountain ranges, forest-covered low mountain ranges, sparsely vegetated karst regions, plateaus with river valleys and wide agricultural plains [26] (Figure 1).
The DRB is located in a transition zone between three Köppen–Geiger climate types. It mainly lies in the humid continental climate (Dfb, Dfa) zone, with influences of the humid subtropical climate (Cfa) around the Dinarides and the semi-arid steppe climate (BSk) at the Danube delta [32]. Since the DRB closely borders the oceanic climate (Cfb) at the very western Upper Danube and the Mediterranean climate (Csa, Csb) in the southern DRB [32], influences of these two climate zones are found along the peripheries of the basin [33]. The current complex interference of the different climate zones in the DRB roughly results in a gradient of decreasing mean annual precipitation and increasing mean annual temperature from the north-west to the south-east.
The DRB is divided into three parts: the Upper Danube, extending from the Danube’s source to the Devín Gate in the Little Carpathians near the Austrian–Slovakian border [25] (in some sources, the Upper Danube extends down to gauge Achleiten [34]), the subsequent Middle Danube, extending to the Iron Gate at the Serbian–Romanian border and the following Lower Danube, extending down to the mouth in the Black Sea [25]. Hence, the DRB comprises sub-basins with the full range of hydrological characteristics from mountain to lowland watersheds. In Table 1, we show the main morphological and hydrographic characteristics of the Upper, Middle and Lower Danube.
2.2. The Mechanistic Hydrological Model PROMET
The mechanistic hydrological model PROMET (Processes of Radiation, Mass and Energy Transfer) is a physically-based land surface process model developed by Mauser and Bach [22], interlinking dynamic vegetation and hydrological modelling. It simulates spatially distributed fluxes of water, carbon and energy on hourly time steps while strictly adhering to the law of conservation of mass and energy in space and time [22]. A detailed description of the model theory can be found in Mauser and Bach [22], Hank et al. [36], Mauser et al. [37] and Zabel et al. [38]. PROMET is structured in modules (e.g., meteorology, land surface, vegetation, soil, groundwater, runoff formation and routing), with the individual modules steadily exchanging information.
The dynamic vegetation module follows the approaches of Farquhar et al. [39], Chen et al. [40] and Ball et al. [41] to simulate the net primary production and canopy conductivity. Stomatal conductance of the canopy is primarily regulated by water supply, which is determined from the water content in the rooted soil zone [36]. According to the approach of Jarvis and Morison [42], the inhibition of the stomatal conductance is calculated from the soil suction in the rooted zone [36]. In PROMET, this inhibition can be interpreted as a plant-specific water stress variable, given as a percentage reduction of potential transpiration. It ranges from 0% to 100% inhibition of transpiration and primary production. A water stress value of 0% thereby stands for completely absent water stress, meaning that the plant’s stomata are fully open. In this case, the actual transpiration equals the potential transpiration. In contrast, a water stress value of 100% stands for the maximum water stress, meaning that the plant’s stomata remain fully closed. The dynamic process description in the vegetation module allows for a full consideration of the alterations in plant growth resulting from a changing climate.
The routing module, transferring water through the basin’s channel network, follows the approach of Cunge [43] and Todini [44]. Due to PROMET’s strong physical basis and predictive power, a classical calibration of the PROMET parameters to fit observed discharge is not appropriate [22,23]. Instead, literature sources and measurements are used for the parametrization of the initial values within PROMET, maintaining the model’s physical consistency [22].
PROMET is driven with hourly time series of spatially distributed meteorological variables, which are downscaled and disaggregated within the PROMET meteorology module in space and time (30″ and 1 h in this study) according to Marke et al. [45]. Simultaneously, temperature and precipitation are linearly (and spatially distributed) bias-corrected using long-term climatologies as a reference [23].
The fully validated PROMET model setup of Probst and Mauser [23] (30″ spatial resolution) served as the basis for this study. Here, topographical information was taken from the SRTM (Shuttle Radar Topography Mission) digital elevation model [27], soil property data were derived from the Harmonized World Soil Database (HWSD) [46] and watershed topography information was taken from the HydroSHEDS database [28]. For land use information, we used the first existing consolidated land use map for the DRB of Probst and Mauser [23] including the spatial distribution of agricultural crops, which is based on a mosaic of the CORINE Land Cover 2012 [47] and the ESA CCI Land Cover 2015 [48] augmented by cultivation statistics [49]. The described input datasets are harmonized datasets covering the entire DRB, which allows for a physically consistent and uniform parametrization of the PROMET input parameters for soil, vegetation and hydrology all over the DRB. This comprehensive parametrization had successfully been validated within the DRB [23]. All gridded input data come with a spatial resolution of 30″ (~0.00833333°).
2.3. Regional Climate Models as Meteorological Drivers
2.3.1. Selection of Appropriate Climate Models
In this study, we drove PROMET with EUR-11 GCM-RCM simulations from the ensemble for Europe within the World Climate Research Program Coordinated Regional Downscaling Experiment (EURO-CORDEX) [21]. From the EURO-CORDEX simulations, we selected an appropriate ensemble of different combinations of RCMs driven by GCMs.
For this, we consulted the literature, such as the ensemble audit from the Bavarian State Office for Environment authored by Zier et al. [50], in which the EURO-CORDEX ensemble was checked for plausibility concerning circulation patterns and climate processes within the hydrological region of Bavaria (which covers the entire Upper Danube basin). Zier et al. [50] assessed a set of four indicators for temperature and precipitation to identify possible biases or shifts between the GCM-RCM simulation results and the KliRef2014 temperature and precipitation reference climatologies, which were created by the authors based on interpolated observations. The indicators assessed by Zier et al. [50] were (i) the deviation of the mean annual values (“quantity indicator”); (ii) the deviation of the mean monthly values (“quantity indicator with seasonality reference”); (iii) the deviation of the seasonality of the mean monthly values (“seasonality indicator”); (iv) the deviation of the spatial distribution of the mean annual values (“pattern indicator”) from the climatologies. Zier et al. [50] rated models as implausible, particularly when a spatial offset of precipitation due to drift effects or insufficient and inverse annual dynamics had been encountered. The authors considered it unlikely that these biases can be reliably removed by bias correction, which makes the respective models inappropriate for hydrological impact modelling in Bavarian watersheds and downstream [50]. GCM-RCM simulations with a uniform bias were considered appropriate, since this indicates that the climatic processes are represented correctly in the climate model, but merely with an incorrect order of magnitude that can be compensated with a bias correction [50].
Furthermore, the selected GCM-RCM ensemble had to meet a set of technical requirements. These were (i) 0.11° spatial resolution (EUR-11); (ii) at least 3 h temporal resolution; (iii) availability of the “historical”, “RCP2.6” and “RCP8.5” experiments; (iv) availability of the required PROMET meteorological input variables (total cloud cover [%], wind speed (10 m height) [m/s], air temperature (2 m height) [K], dew point temperature (2 m height) [K], surface pressure [Pa], total precipitation [mm], downward surface solar radiation [W/m2] and downward surface thermal radiation [W/m2]).
Based on these considerations, we selected three suitable EURO-CORDEX GCM-RCM combinations for this study:
- RACMO22Ev1 (RCM) driven with ICHEC-EC-EARTH (r12) (GCM) (denoted as ICHEC-RACMO in this study);
- RCA4v1 (RCM) driven with ICHEC-EC-EARTH (r12) (GCM) (denoted as ICHEC-RCA4 in this study);
- RCA4v1a (RCM) driven with MPI-M-MPI-ESM-LR (r1) (GCM) (denoted as MPI-RCA4 in this study).
These three GCM-RCM combinations have also been considered plausible and without serious biases in other study regions within the DRB, e.g., in the Alps [51] or in the Pannonian Basin [52]. Moreover, the RCMs involved have been found to be amongst the better-performing in the Carpathian region [53].
For each of the three GCM-RCM combinations, we used the historical experiment for the reference period (1971–2000) (the time frame was selected due to EURO-CORDEX data availability) as well as the RCP2.6 and RCP8.5 experiments for both the near future (2031–2060) and the far future (2071–2100) as drivers for the PROMET hydrological simulations.
2.3.2. Bias Correction of Climate Model Simulations
Climate model simulations typically exhibit systematic biases in climate variables [54], which introduce additional uncertainties to future climate projections. Hence, we applied a spatially distributed linear bias correction of temperature and precipitation based on reference climatologies to the downscaled (30″ spatial resolution) and disaggregated (1 h temporal resolution) climate model forcing data. As reference climatologies, we used the compiled climatologies (30″ spatial resolution) from Probst and Mauser [23], which had already been used for the generation of the historical ERA5-GPW forcing dataset [23] and had been successfully validated within the PROMET setup for the DRB in the mentioned study. The compiled climatologies are: (i) the global WorldClim 2 temperature climatology [55] for the bias correction of temperature; (ii) a mosaic of the global WorldClim 2 precipitation climatology [55] and the Alpine precipitation climatologies GLOWA (Globaler Wandel; engl. Global Change) [56] and PRISM (Parameter-elevation Regression on Independent Slope Model) [57] for the bias correction of precipitation. These climatologies are based on interpolated observations, whereby the two Alpine precipitation climatologies, GLOWA and PRISM, are derived from a particularly high-resolution station density [23]. The other meteorological variables apart from temperature and precipitation were not bias-corrected.
The hindcast in Figure 2 shows the performance of the bias correction. Here, we show the long-term mean monthly temperature and precipitation (1980–2000) on spatial average over the DRB and the resulting long-term mean monthly discharge (1980–2000) at the outlet gauge Ceatal Izmail. The simulations driven by the three bias-corrected GCM-RCM ensemble members (ICHEC-RACMO, ICHEC-RCA4 and MPI-RCA4) were compared with the simulation driven by the ERA5-GPW forcing dataset of Probst and Mauser [23]. As can be seen, the correspondence between ERA5-GPW long-term temperature and precipitation seasonalities with their counterparts from the bias-corrected GCM-RCM simulations is very high. The same holds true for discharge: the long-term discharge seasonalities of the simulations driven by the bias-corrected GCM-RCM ensemble members are in good agreement to the long-term discharge seasonality of the ERA5-GPW-driven simulation.
3. Results
3.1. Temperature and Precipitation
3.1.1. Basin-Wide and Regional Trends
The interplay between temperature and precipitation is one of the main determinants of the hydrological cycle in a watershed. Climate change-induced alterations in temperature and precipitation are major drivers for changes in the hydrological cycle and water resource availability in both space and time. In Figure 3, we show the development of the mean annual temperature and precipitation on spatial average over the whole DRB as a result of the following simulations: the simulation driven with the historical ERA5-GPW forcing dataset [23], the historical GCM-RCM-driven simulations (ensemble mean) and the GCM-RCM-driven simulations (ensemble mean) under RCP2.6 and RCP8.5 for the near and far future.
In Table 2, we additionally show the changes in the long-term mean annual and seasonal temperature and precipitation on spatial average for the Upper, Middle and Lower Danube as well as for the Danube overall according to the GCM-RCM-driven simulations (ensemble mean) under RCP2.6 and RCP8.5 for the near and far future compared to the historical GCM-RCM-driven simulations (ensemble mean).
While Figure 3 shows that the historical mean annual temperature and precipitation developments from the ERA5-GPW-driven simulation and from the historical GCM-RCM-driven simulations are in good agreement, the future developments under RCP2.6 and RCP8.5 reveal very different trends. In particular, basin-wide temperatures differ significantly between RCP2.6 and RCP8.5. While temperature rise remains on a relatively low and constant level under RCP2.6 (+1.2 °C on long-term basin-wide average for both the near and far future compared to the historical period; Table 2), the RCP8.5 temperature rise features a significant increasing trend especially for the far future (+2.2 °C and +4.3 °C on long-term basin-wide average for the near and far future compared to the historical period; Table 2), culminating in a temperature rise of +5.1 °C by 2100. Concerning annual precipitation, we identified no such clear trends as for temperature. For both RCP2.6 and RCP8.5, a slight increase in annual precipitation can be observed (RCP2.6: +4.5% and +7.2% on long-term basin-wide average for the near and far future compared to the historical period; RCP8.5: +4.9% and +5.9% on long-term basin-wide average for the near and far future compared to the historical period; Table 2). In addition to the long-term average increase in precipitation, strong variability is visible in Figure 3.
In Figure 4, we show regional differences in temperature and precipitation. Here, we show boxplots of annual temperature and precipitation change for the Upper, Middle and Lower Danube according to the simulations driven by the three individual GCM-RCM ensemble members under RCP2.6 and RCP8.5 for the near and far future compared to the historical reference.
According to Figure 4, the future temperature development uniformly points to an increase in median temperature for both emission scenarios, both future periods, and for all three Danube sub regions. Especially the RCP8.5 median temperature increase (far future) points to high values of +4.2 °C to +4.5 °C across the sub regions. While for RCP2.6 (near and far future) and RCP8.5 (near future), single colder years still occur in which annual temperature is lower than the long-term mean annual temperature of the historical period, no single colder year occurs for RCP8.5 (far future). The future precipitation development points to a slight to negligible increase in median annual precipitation for both emission scenarios and both future periods in all sub regions, with a range that extends from +0.2% (RCP8.5 far future, Lower Danube) to +11.0% (RCP2.6 far future, Lower Danube). In the Lower Danube, median annual precipitation under RCP8.5 remains nearly unchanged for both the near and far future. At the same time, the variability of the annual precipitation is especially large for the Lower Danube compared to the Upper and Middle Danube.
3.1.2. Changes in Seasonality
To thoroughly assess the impacts of climate change, it is also necessary to take a closer look at possible seasonal changes. In Figure 5, we show seasonality plots of the long-term mean monthly developments of temperature and precipitation on spatial average for the Upper, Middle and Lower Danube. Here, we compared the ensemble mean results from the historical GCM-RCM-driven simulations and the GCM-RCM-driven simulations under RCP2.6 and RCP8.5 for the near and far future.
Figure 5 shows that the future temperature increases more or less evenly throughout the year in the Upper, Middle and Lower Danube without shifts in seasonality. In all sub regions, however, a greater warming trend occurs in the winter season than during the rest of the year in all scenarios (e.g., RCP8.5, near future: +2.5 °C to +2.6 °C in the winter season versus +1.9 °C to +2.4 °C during the other seasons) (Table 2). Especially the warming trend according to RCP8.5 (far future) is stronger in the winter season (+4.6 °C to +4.8 °C) and the summer season (+4.3 °C to +4.8 °C) in all sub regions than during the other seasons (+3.8 °C to +4.3 °C) (Table 2).
For precipitation, the plots reveal more distinct shifts in seasonality: for the Upper Danube, the increase in the mean annual precipitation under RCP2.6 and RCP8.5 (near and far future; Figure 5 and Table 2) is mainly attributable to an above-average increase in the winter and spring season. For RCP8.5 (far future), for example, the long-term mean seasonal precipitation is projected to change by +23.8% and +16.2% in the winter and spring season, versus −2.4% and +11.1% in the summer and autumn season in the Upper Danube. In addition, a shift of peak precipitation in the Upper Danube from July to June is projected in both RCP2.6 and RCP8.5 (near and far future), which is associated with a shift of the summer precipitation regime forward by one month. For the Lower Danube, there is an increase in precipitation visible in the summer season for RCP2.6 (+6.6% and +7.8% for the near and far future), but a moderate to strong decrease throughout summer (May–September) for RCP8.5 (e.g., −6.5% and −12.6% in the summer season for the near and far future). For the winter season, the simulations point to an increase in precipitation in the Lower Danube for all scenarios and all future periods, ranging from +11.8% (RCP2.6 far future) to +19.8% (RCP8.5 far future). For the Middle Danube, the major trends from the Upper Danube (especially the increase in winter precipitation) and the Lower Danube (especially the decrease in summer precipitation) blend, particularly under RCP8.5 (far future).
3.1.3. Changes in Spatial Patterns
Given the natural heterogeneity of the DRB, it is expected that climate change effects will also be spatially distributed in a very heterogeneous manner. In Figure 6 and Figure 7, we show maps of the long-term mean seasonal temperature and precipitation (ensemble mean) in the DRB according to the historical GCM-RCM-driven simulations as well as the mean seasonal (absolute or relative) changes (ensemble mean) according to the GCM-RCM-driven simulations under RCP2.6 and RCP8.5 for the near and far future.
Figure 6 shows a relatively uniform spatial distribution of the mean seasonal temperature rise under RCP2.6 and RCP8.5 for both the near and far future. Especially for RCP8.5 (far future), however, the spatial patterns hint at a relatively stronger temperature increase in the mountains (e.g., +6 °C up to +8 °C during the winter season) compared to the basin overall (e.g., +4.7 °C on spatial average during the winter season). The historical simulations show that the highest long-term mean temperatures in the summer season occur in the basins of the Middle and Lower Danube (e.g., the Romanian Plain with an average summer temperature of >22 °C). For RCP8.5 (far future), a particular hot spot of summer temperature rise of +5 °C and beyond lies in the Lower Danube, additionally amplifying hot summer temperatures.
Figure 7 shows a gradient of decreasing mean seasonal precipitation, roughly from the north-west to the south-east of the DRB. The change maps show different spatial hot spots of precipitation increase or decrease depending on the scenario. For RCP2.6 (near and far future), precipitation increases in almost every season nearly throughout the basin, ranging from −1% (RCP2.6 near future, autumn season) to +14% (RCP2.6 far future, winter season) on spatial average. For RCP8.5 (near and far future), precipitation generally increases in the winter season and decreases in the summer season in large parts of the basin, ranging from −9% (RCP8.5 far future, summer season) to +26% (RCP8.5 far future, winter season) on spatial average. For RCP8.5 (near future), a tendency of increasing winter precipitation in the Upper Danube basin, across the northern Carpathian ridge and in the Moldovan Plain of +20% up to +40% and decreasing summer precipitation in the southern Lower Danube basin of −20% down to −26% is visible. For RCP8.5 (far future), the winter precipitation increase extends almost over the entire DRB (with hot spots of up to +57%) and the summer precipitation decrease intensifies and extends over large southern parts of the Middle and Lower Danube basin with −20% down to −36%, additionally amplifying drier summers in this region.
3.2. Soil Water Content, Plant Water Stress and Snow Water Equivalent
3.2.1. Changes in Seasonality
In Figure 8, we show seasonality plots of the long-term mean monthly developments of available soil water content in the rooted zone, plant water stress and snow water equivalent (SWE) on spatial average for the Upper, Middle and Lower Danube. The developments result from the historical GCM-RCM-driven simulations (ensemble mean) and the GCM-RCM-driven simulations (ensemble mean) under RCP2.6 and RCP8.5 for the near and far future.
Figure 8 shows that the long-term mean monthly soil water content decreases in late summer and early autumn in both the Upper and Middle Danube for all scenarios and particularly strong for RCP8.5 (far future), with the most severe percentage soil water reduction occurring in September. For RCP8.5 (far future), for example, soil water reduction in September amounts to −28 mm (−10.2%) in the Upper Danube and −25 mm (−9.6%) in the Middle Danube. In the Lower Danube, soil water decreases more or less uniformly throughout the year with a likewise considerable reduction for RCP8.5 (far future) and the comparatively strongest percentage reduction in July with −30 mm (−9.4%) for RCP8.5 (far future).
The depleting soil water storages directly translate into rising water stress experienced by vegetation (especially agricultural crops, grasslands and forests) in the DRB. Our simulations show that the long-term mean monthly plant water stress intensifies in the Upper, Middle and Lower Danube, especially during the summer and autumn months of diminished soil water toward the end of the period of maximum forest transpiration and toward the end of the vegetation period of dominant agricultural summer crops such as maize, sunflower, soybean, potatoes and sugar beet. The historical simulations show the maximum monthly plant water stress values in late summer for all the sub regions, resulting in 3% for the Upper Danube in September, 13% for the Middle Danube in August and 14% for the Lower Danube in August. For RCP8.5 (far future), plant water stress intensifies to maximum values of 9% for the Upper Danube, 22% for the Middle Danube and 22% for the Lower Danube in the same months.
Furthermore, the simulations show a reduction in the long-term mean monthly SWE, which indicates that the amount of water stored in snow decreases for all scenarios and especially for RCP8.5 (far future). In the winter season (DJF), simulated future SWE decreases all over the DRB, with SWE reductions of −14.7 mm (−80%) in the Upper Danube, −5.9 mm (−85%) in the Middle Danube and −3.2 mm (−78%) in the Lower Danube on spatial average for RCP8.5 (far future). Summer snow cover in the high mountain ranges of the Alps in the Upper Danube vanishes almost completely for RCP8.5 (far future).
3.2.2. Changes in Spatial Patterns
In Figure 9, Figure 10 and Figure 11, we show maps of the long-term mean seasonal soil water content in the rooted zone, plant water stress and SWE in the DRB according to the historical GCM-RCM-driven simulations (ensemble mean) as well as the mean seasonal values or changes according to the GCM-RCM-driven simulations (ensemble mean) under RCP2.6 and RCP8.5 for the near and far future.
Figure 9 reveals that almost all scenarios and future periods (except for RCP2.6 far future in the winter and spring season) show negative changes in soil water on spatial average for the four seasons. For RCP2.6 (near and far future), the seasonal soil water change ranges between −8 mm (RCP2.6, near future) in the autumn season and +2 mm (RCP2.6, far future) in the winter season. Here, the change maps only show local alterations of soil water, with a concentration of refilling soil water storages around the Pannonian Basin in winter and spring and depleting soil water storages in some forested areas of Transylvania in summer and autumn. For RCP8.5 (near and far future), the seasonal soil water change ranges between −3 mm (RCP8.5, near future) in the winter and spring season and −22 mm (RCP8.5, far future) in the summer season. For RCP8.5, hot spots of more significant changes can be encountered, in which the soil water particularly increases in the Pannonian Basin during winter and spring and decreases in the forested areas of Transylvania, the Carpathian foothills and the southern Dinarides during summer and autumn (near and far future).
Figure 10 shows that the patterns of increasing plant water stress follow the patterns of depleting soil water storages. Long-term mean seasonal plant water stress is largely restricted to the summer and autumn season. In the historical simulations, the mean plant water stress amounts to 7.1% on spatial average during both summer and autumn. During summer, the extensive croplands in the lowlands of the Middle and Lower Danube are especially affected by water stress values of >25%, which can be interpreted as serious water shortages reducing agricultural yields. During autumn, hot spots of the plant water stress shift to areas of deciduous forests, with values of >30%. For all scenarios and future periods, summer and autumn water stress intensifies on spatial average. Especially for RCP8.5 (far future), the maps point to a more widespread and more intense plant water stress of 13.8% during summer and 11.0% during autumn on spatial average. Distinct hot spots occur in the Pannonian Basin, the Romanian Plain (water stress values of >40% for agricultural crops in the summer season) and around the Carpathian foothills (water stress values of >50% for deciduous forests in the autumn season).
Figure 11 shows that the long-term mean seasonal SWE concentrates in the mountain regions during winter and spring. For the historical period, the long-term mean SWE in the winter season amounts to 7.35 mm on spatial average, with SWE values of >100 mm in the Alpine mountain ranges. The change maps reveal significant reductions in the seasonal SWE for all scenarios all over the DRB. The strongest reduction is again projected for RCP8.5 (far future), for which the SWE decreases considerably in the Alps, Carpathians and Dinarides during autumn (from 0.89 mm to 0.08 mm), winter (from 7.35 mm to 1.28 mm) and spring (from 3.62 mm to 0.83 mm), and almost completely vanishes during summer (from 0.65 mm to 0.05 mm).
3.3. Discharge
3.3.1. Annual and Seasonal Trends in Danube Sub-Basins
The future projections of the temperature and the components of the hydrological cycle, such as precipitation, soil water and snow water, hold direct consequences for the runoff dynamics in the DRB. In Table 3, we show the changes in the long-term mean annual and seasonal mean discharge (MQ) in the entire DRB and its major sub-basins (Figure 1) according to the GCM-RCM-driven simulations (ensemble mean) under RCP2.6 and RCP8.5 for the near and far future compared to the historical simulations (ensemble mean).
Table 3 shows that the trends of the future MQ changes (increasing or decreasing) generally follow the precipitation development, although some time lag is visible. Surprisingly, despite the decreasing soil water content in the root zone and the increasing plant water stress, the long-term mean annual MQ increases for all scenarios and all future periods at the Danube outlet gauge in Ceatal Izmail (+2.8% and +10.7% for RCP2.6 in the near and far future; +3.1% and +5.2% for RCP8.5 in the near and far future). For RCP2.6 (near future), the MQ tends to increase in winter and spring, and to decrease in summer and autumn across a majority of sub-basins. Interestingly, for RCP2.6 (far future), in contrast, the MQ increases in all seasons for almost all sub-basins. For RCP8.5 (near and far future), Table 3 hints at a clear dichotomy: on the one hand, the MQ increases for all seasons in the Upper Danube, Middle Danube (Bezdan) and Drava basin (e.g., +22.5% and +26.4% for winter MQ in the Upper Danube for RCP8.5 in the near and far future). On the other hand, the MQ increases for the winter and spring season (+0.5% to +19.1%) and decreases in the summer and autumn season (−1.5% to −17.1%) in the downstream sub-basins (Sava, Mures, Tisza, Siret and the Lower Danube). Hereby, the reduction in the seasonal MQ according to RCP8.5 is more severe for the Sava, Tisza and Lower Danube basin for the far future. Concerning the annual MQ, the increase in the winter and spring MQ over-compensates for the decrease in the summer and autumn MQ in most sub-basins. At the Danube outlet, the winter and spring surplus outweighs the summer and autumn deficit for all scenarios.
In Figure 12, we show seasonality plots of the long-term mean monthly developments of discharge for the Upper Danube (gauge Achleiten), Middle Danube (gauge Iron Gate) and Lower Danube (gauge Ceatal Izmail). The developments result from the historical GCM-RCM-driven simulations (ensemble mean) and the GCM-RCM-driven simulations (ensemble mean) under RCP2.6 and RCP8.5 for the near and far future.
The changes in the future discharge regimes are a direct response to the changes in the precipitation regimes. In the Upper Danube, the increase in winter precipitation, the slight decrease in summer precipitation (especially for RCP8.5, far future) and the forward shift of the precipitation peak directly translates into corresponding changes in seasonal discharge regimes at gauge Achleiten. Here, the long-term mean monthly MQ at gauge Achleiten increases by +26.4% on average in the winter season and decreases by −7.1% during August and September (RCP8.5, far future). The same tendencies can be observed for the Middle Danube (gauge Iron Gate) and Lower Danube (gauge Ceatal Izmail), where especially the strong decrease in summer precipitation (RCP8.5, far future) translates into a decrease in the summer discharge. Here, the long-term mean monthly MQ increases by +21.9% at gauge Iron Gate and +19.1% at gauge Ceatal Izmail in the winter season and decreases by −12.1% at gauge Iron Gate and −11.3% at gauge Ceatal Izmail during August and September. However, the decrease in summer discharge blends with the discharge changes of the Upper Danube (especially with the increase in winter discharge) that are transferred to downstream reaches.
3.3.2. Changes in Spatial Patterns
In terms of discharge, smaller tributary rivers in drier regions are expected to be particularly affected by climate change. In Figure 13, we show maps of the changes in the long-term mean seasonal MQ in the DRB according to the GCM-RCM-driven simulations (ensemble mean) under RCP2.6 and RCP8.5 for the near and far future compared to the historical GCM-RCM-driven simulations (ensemble mean).
Figure 13 shows that the changes in the long-term mean seasonal MQ under different scenarios and future periods are very heterogeneously distributed across the DRB. On basin-wide average, the range of seasonal MQ change varies between −8% (RCP8.5, far future, summer season) and +19% (RCP8.5, far future, winter season). An interesting finding for the MQ changes under RCP2.6 is that negative MQ changes occur much more frequently for the near future than for the far future. Shortages in water resource availability in rivers under the RCP2.6 scenario are more frequently projected in the near future and are compensated by higher precipitation in the far future. For RCP2.6 (near future), the mean seasonal MQ change ranges from −3% (autumn) to +5% (winter) on basin-wide average. Here, local hot spots of runoff reductions are especially found in the Pannonian Basin and the Tisza basin in winter, summer and autumn. Cold spots (regions with runoff increase) are particularly found in the Alps in the winter season and the Danube delta region in autumn and winter. For RCP2.6 (far future), the mean seasonal MQ change ranges from +8% (summer) to +18% (winter) on basin-wide average. Here, cold spots of an increasing MQ predominate the map, especially in the Pannonian Basin (all year), the Upper Danube (winter season) and the Danube delta region with the Romanian and Moldovan Plain (autumn and winter).
For the RCP8.5 scenario though, significantly greater reductions in the MQ occur throughout the basin. For RCP8.5 (near future), the mean seasonal MQ change ranges from −5% (summer and autumn) to +12% (winter) on basin-wide average. Here, widespread hot spots of an MQ decrease can be found in the entire Lower Danube and the Sava basin in summer and autumn. Simultaneously, winter precipitation and thus, MQ is increasing in the Upper Danube, especially in the Alpine region. For RCP8.5 (far future), the mean seasonal MQ change ranges from −8% (summer) to +19% (winter) on basin-wide average. Here, severe decreases in the MQ (changes of up to −50%) can be observed for smaller tributary rivers scattered almost all over the basin in summer and autumn. Around the Carpathian Mountains, the MQ decreases all over the year. Likewise, winter precipitation and thus, MQ increases in the Upper Danube (especially in the Alps) and the Pannonian Basin, and spring precipitation and thus, MQ increases in the Pannonian Basin.
3.3.3. Changes in the Risk of High and Low Flows
To thoroughly analyze the impacts of climate change on runoff dynamics, it is also necessary to take a closer look on the development of high and low flows. In Figure 14, we show flow duration curves for the Upper Danube (gauge Achleiten), the Middle Danube (gauges Bezdan and Iron Gate) and the Lower Danube (gauge Ceatal Izmail) (sub panels a–d). The flow duration curves show the average number of days in a year, in which the discharge values are exceeded. The colored curves in Figure 14 refer to the ensemble mean of the historical GCM-RCM-driven simulations as well as to the ensemble mean of the GCM-RCM-driven simulations under RCP2.6 and RCP8.5 for the near and far future. Figure 14 additionally zooms into the flow duration curves of the respective gauges in two intervals: (i) the interval of the flow duration curves near the historical long-term mean annual low flow (MNQ) values (thereby showing the number of undershoot days; sub panels e–h); (ii) the interval of the flow duration curves near the historical long-term mean annual high flow (MHQ) values (thereby showing the number of exceedance days; sub panels i–l) at the respective gauges.
According to Figure 14, the parts of the flow duration curves that lie beyond the historical long-term mean annual MQ values show a distinct trend: the curves from the future GCM-RCM-driven simulations generally lie above the curves from the historical simulations. This means that on average, a selected discharge value is exceeded on more days in a year. This points to a development, in which a greater water volume is in the river system on an increasing number of days in a year. The zoomed-in plots near the historical MNQ values and near the historical MHQ values at the respective gauges provide insight into the development of low and high flows. For the Upper Danube (gauge Achleiten) and the Middle Danube (gauge Bezdan), the historical MNQ values (631 m3/s and 1216 m3/s) are on average not undershot in an average year according to all scenarios and future periods (RCP2.6 and RCP8.5, near and far future). For the Middle Danube (gauge Iron Gate) and the Lower Danube (gauge Ceatal Izmail), the historical MNQ is on average undershot on some days of the year according to most scenarios and future periods. For example, the historical MNQ values at gauges Iron Gate and Ceatal Izmail (2948 m3/s and 3689 m3/s) are undershot on 6 and 11 days (RCP8.5, far future). This means that low flow conditions along the Middle and Lower Danube River are projected to become more frequent in the future.
For all considered gauges of the Danube River (gauges Achleiten, Bezdan, Iron Gate and Ceatal Izmail), the historical MHQ is on average overshot on some days of the year according to all scenarios and future periods. For example, the historical MHQ values at the gauges Achleiten, Bezdan, Iron Gate and Ceatal Izmail (3081 m3/s, 4611 m3/s, 10,612 m3/s and 11,907 m3/s) are overshot on 8, 20, 11 and 11 days (RCP8.5, far future). This means that high flow conditions all along the Danube main course are projected to become more frequent in the future.
4. Discussion
4.1. The Big Picture
4.1.1. Trends of Temperature and Precipitation
On basin-wide average, we find a very significant and continuous warming trend with rising mean annual temperatures for RCP8.5, which begins in the near future and continues to strengthen in the far future (Figure 3 and Table 2). For RCP2.6, the temperature slightly increases from the historical baseline but soon saturates at a constant level in both the near and far future (Figure 3 and Table 2). The maps of the temperature increase under RCP2.6 and RCP8.5 in the near and far future (Figure 6), as simulated by the GCM-RCM ensemble, are very similar in their magnitude to the corresponding maps of Stagl and Hattermann [15], as simulated by a GCM ensemble. However, our maps show a much stronger spatial differentiation, especially in mountainous terrain, due to the higher spatial resolution of the RCMs used in this study. Especially for RCP8.5 (far future), we found a relatively stronger temperature increase in the mountains compared to the remaining basin. These findings are in agreement with a widely recognized phenomenon of elevation-dependent warming, according to which mountain areas are subject to (in most cases) stronger or weaker warming trends than the surrounding lowlands [58]. This is due to the varying responses of different land covers to climate change and to the snow-albedo feedback, which accelerates warming where snow cover retreats, and thus exposes surfaces of lower albedo [58].
Concerning precipitation, our results show an increase in the basin-wide, mean annual precipitation for both RCP2.6 and RCP8.5 in the near and far future (Figure 3 and Table 2), which may be surprising at first glance. This finding is very much in line with the results of Bisselink et al. [59], who found a considerable increase in precipitation under RCP8.5 in the far future over large parts of the Upper and Middle Danube, and a large uncertainty of precipitation development in the Lower Danube, as simulated by a GCM-RCM ensemble. In fact, we find that the variability of future annual precipitation is considerable, especially for the Lower Danube (Figure 3 and Figure 4). This may add some degree of uncertainty to the precipitation projections.
Especially interesting is the future development of precipitation seasonality in the DRB. We find a general trend of winter precipitation increase, which is most pronounced in the Upper and Middle Danube, and a general trend of summer precipitation decrease, which is most pronounced in the Middle and Lower Danube (Figure 5). This is in line with the findings of Stagl and Hattermann [11] (ENSEMBLES near future) and Bisselink et al. [59] (RCP8.5, far future), who also identified more winter rainfall and less summer rainfall in a roughly north-western to south-eastern gradient in their future simulations in the DRB. Our findings are also in accordance with the key trends summarized by the International Commission for the Protection of the Danube River (ICPDR) [9], according to which wet regions will become wetter, dry regions will become drier and a seasonality shift will occur toward wetter winters and drier summers. In our simulations, the increase in winter precipitation outweighs the decrease in summer precipitation in the annual budget so that the mean annual precipitation on spatial average increases both basin-wide and over each of the different sub regions, namely the Upper, Middle and Lower Danube (Table 2).
This development can be traced back to the geographical location of the DRB in the transition zone between the humid continental climate dominated by the westerlies in the northern part, and the Mediterranean-influenced climate in the southern part, for each of which diverging climate change effects and impacts are predicted. According to IPCC-AR5 and AR6, (winter) rainfall is projected to increase for the DRB’s northern part of humid continental climate, whereas (summer) rainfall is projected to decrease in the DRB’s southern part of Mediterranean-influenced climate, leading to more frequent and intense summer droughts [6]. Case studies for the Mediterranean region find a very clear warming trend with, at the same time, equivocal trends for precipitation [60,61,62]. Between these two climate zones, and thus in large parts of the DRB, there is a broad transition zone, where even the sign of future precipitation change (positive or negative) is of high uncertainty [6].
4.1.2. Trends of Soil Water Content, Plant Water Stress and Snow Water Equivalent
Our simulation results for the soil water content are a direct consequence of the temperature and precipitation developments in the basin and hold direct implications for plant water stress. Although our results show an increase in the annual precipitation for both scenarios and future periods, the soil water content tends to decrease for both scenarios and future periods during the summer and autumn season in the Upper and Middle Danube, and during the whole year in the Lower Danube, especially for RCP8.5 (near and far future, Figure 8). Our projected strong increase in the winter MQ for the three gauges draining the Upper, Middle and Lower Danube (Figure 12) suggests that soil water storage does not benefit much from the increase in (especially winter) rainfall. In fact, much of this surplus water seems to be directly passed on to runoff formation without effectively refilling soil water storage (Figure 9). Furthermore, multiple interacting processes lead to the decrease in the soil water content, particularly in the late summer and early autumn: decreasing precipitation in the Middle and Lower Danube, which goes in line with decreasing cloud cover and increasing shortwave radiation input, the highest temperature (which increases particularly strongly for RCP8.5, far future), and thus, the highest saturation deficit, amplifying evapotranspiration. Collectively, these processes cause the soil water storage to continuously be drained by vegetation during the summer. By the late summer and early autumn, the soil water content drops to its seasonally lowest level due to high evapotranspiration rates, which are particularly observed for agricultural crops and forests during their most active phases in the vegetation period. Therefore, the projected decreasing soil water contents are particularly noticeable in agricultural or forested areas (Figure 9).
Directly related to the decreasing soil water content, we find an increasing tendency for plant water stress in the summer and early autumn months, which becomes most pronounced for RCP8.5 (far future) (Figure 8 and Figure 10). During summer, agricultural crops are particularly affected by water stress due to high (potential) transpiration rates. This development will most likely increase the pressure on expanding irrigation of staple crops throughout the Middle and Lower Danube, with adverse consequences on the volume of water available for runoff. During the late summer and autumn, deciduous and coniferous forests are affected by heavy water stress after they have drained the soil water storages through strong transpiration over the summer. This will most likely increase the risk of forest fires in the future.
Moreover, we find a severe basin-wide reduction in the SWE for all scenarios and future periods, but most significantly for RCP8.5 (far future) (Figure 8 and Figure 11). Most likely, this is attributable to the strong increase in (winter) temperature for all scenarios, especially for RCP8.5 (far future). Here, we find a stronger relative increase in winter temperatures in the mountains than in the remaining basin, leading to a reduced and delayed snow cover formation of likely shallower snow thicknesses and covers, as well as to an earlier and accelerated snowmelt. Consequently, the contribution of water from snowmelt might become increasingly insignificant for the runoff dynamics in mountain watersheds and for the water supply within the DRB, leading to a shift of river regimes from snow- to precipitation-dominated.
4.1.3. Trends of Discharge
Our projections of precipitation are directly reflected in the projections of discharge. Our results show a tendential increase in the mean annual MQ in the Upper Danube and the mountain watersheds of the Middle Danube in all scenarios and a decrease in the mean annual MQ in the lowland watersheds of the Middle and Lower Danube for RCP2.6 (near future) and RCP8.5 (near and far future) (Table 3). Following the precipitation trends with some time lag, we see a tendency of an increasing winter MQ (especially in the Upper and Middle Danube) and a decreasing summer and autumn MQ (especially in the Middle and Lower Danube) (Table 3 and Figure 12 and Figure 13). Our results show less severe decreases in the mean annual and seasonal MQ across the sub-basins than the results of Stagl and Hattermann [15], who simulated stronger decreases in the MQ across the sub-basins and seasons (except for the Upper Danube and the mountain watersheds of the Middle Danube, where the winter MQ increases). Our more moderate MQ decreases might be traced back to a generally wetter precipitation development, especially in winter. Our results are more in line with the findings of Bisselink et al. [59], who showed a basin-wide winter MQ increase for a 2 °C warmed-up climate and widespread uncertainties for the development in the other seasons. However, the spatial patterns of the MQ development in our maps for RCP2.6 and RCP8.5 in the near and far future (Figure 13) are quite similar to the corresponding maps of Stagl and Hattermann [15] and Bisselink et al. [59].
Our findings on low flows along the Danube main course, which become less frequent along the Upper Danube River and more frequent along the Middle and Lower Danube River (Figure 14), are only partly in line with the general tendency of the results of Stagl and Hattermann [15]. Instead, they projected decreasing low flow levels in the whole Danube for RCP8.5 (far future). In contrast, Bisselink et al. [59] projected rising low flow levels in the winter season for the whole basin, but indicated major uncertainties for the rest of the year (RCP8.5 far future; although here, the authors included the effects of changing land use and water demand in addition to climate change).
Our findings on more frequent high flows all along the Danube main course (Figure 14) confirm a general conclusion in hydrological climate change impact research that extremes are likely to become more frequent and more extreme with future climate change. However, our results contradict the results of Stagl and Hattermann [15], who projected decreasing high flow levels for the whole Danube for all scenarios. In contrast, Bisselink et al. [59] projected rising high flow levels in the winter half for the whole basin, with again, major uncertainties for the rest of the year (RCP8.5 far future).
Our results on more frequent low flows along the Middle and Lower Danube River have direct implications on the future seasonal navigability of rivers. This is of special interest for sectors such as the shipping industry, which are particularly susceptible to low flows. However, the increasing winter discharges expected from our results, together with the large installed hydropower plants, e.g., at the Iron Gate, might have the potential to stabilize future renewable energy systems in the region by increasing hydropower production in winter, when solar potentials are and will remain low.
4.2. Sources of Uncertainties
As models provide a simplified representation of reality, modelling studies are inevitably subject to uncertainties. Uncertainties in hydrological modelling studies on climate change impacts on water resources typically arise from (amongst others) the GCMs, the RCMs and the hydrological model itself [63]. Uncertainties due to the hydrological model are related to the model’s structure, the parametrization and the input data used [63]. Uncertainties due to the climate models are related to the many degrees of freedom in the modelling of feedbacks between the atmosphere and the hydrosphere [64]. In climate change impact studies, the influence of the sources of uncertainties varies according to the future period considered. In the near future (roughly until the middle of the 21st century), uncertainties due to the climate models may overweigh, whereas in the far future (roughly until the end of the 21st century), uncertainties due to the selected RCP scenarios may be more influential [15,63]. In general, uncertainties arising from the climate models are viewed to override uncertainties arising from the hydrological model [64].
Strategies to reduce uncertainties arising from the hydrological model imply a proper validation of the model, which is a prerequisite for hydrological climate change impact modelling [63]. We used the fully validated PROMET model setup for the DRB described in Probst and Mauser [23]. Here, we took full advantage of the physical consistency of PROMET, which—assuming that hydrological processes will remain unchanged under climate change—should equally predict both the present and future states of hydrological systems [22]. Therefore, we did not calibrate the hydrological model using historical discharges to avoid distortions of the model’s predictive power, but rather we used a comprehensive and proven parametrization based on measurements and values within the literature [22,23].
Strategies to reduce climate model uncertainties imply a wise selection of appropriate GCM-RCM drivers and their bias correction. We chose a selected ensemble of EURO-CORDEX climate change projections, consisting of three GCM-RCM combinations, which meet the criterion of realistic model dynamics in the mountain watersheds of Bavaria [50], in the entire Alpine region [51], in the Carpathians [53] and in the Pannonian Basin [52]. Especially the Bavarian watersheds completely cover the Upper Danube, with a significant part located in the Alps. We argue that it is of particular importance to represent the hydrological processes and runoff dynamics in these mountain (head) watersheds as correctly as feasible. However, correctly representing the atmospheric dynamics and small-scale circulation patterns in mountains such as the Alps is challenging, and mountain hydrology is especially sensitive to biases introduced by the meteorological inputs such as temperature or precipitation.
Among the GCM-RCM combinations that were approved as plausible and used in this study, no GCM-RCM combination is completely bias-free. Kotlarski et al. [54] found a cold bias of temperature for the reanalysis-driven RCMs RCA4 and RACMO across Europe during winter and summer (at least, winter cold biases are quite common among RCMs) and a cold bias exceeding −3 °C in the winter temperature across the Alpine ridge for RCA4 and RACMO. Additionally, RCA4 typically features wet precipitation biases across Europe during the winter season [54]. However, since these biases are comparatively small and occur uniformly throughout the year without compromising the seasonal dynamics, this can be compensated with a bias correction [50]. The hindcast of temperature, precipitation and discharge in the DRB (Figure 2) demonstrates the effectiveness of the applied bias correction.
5. Conclusions
In this study, we performed a detailed hydrological climate change impact modelling study on different components of the hydrological cycle in the DRB, for which the future developments of temperature and precipitation are the main drivers. For this, we analyzed the future projections of temperature and different components of the water cycle, namely precipitation, soil water content, snow water equivalent and river discharge, as well as plant water stress, using the mechanistic hydrological model PROMET. The PROMET model was driven by a selected ensemble of EURO-CORDEX GCM-RCM combinations under the emission scenarios RCP2.6 and RCP8.5 for the near future (2031–2060) and the far future (2071–2100). The results were compared to the GCM-RCM-driven simulation results of the historical reference period (1971–2000).
The basin-wide mean annual temperature is projected to rise considerably in the DRB (RCP2.6: +1.2 °C in near and far future; RCP8.5: +2.2 °C and +4.3 °C in near and far future) with the Lower Danube and the mountain regions experiencing the strongest temperature rise. The strongest seasonal temperature rise is projected in the winter and summer season. The basin-wide mean annual precipitation is projected to slightly increase (RCP2.6: +4.5% and +7.2% in near and far future; RCP8.5: +4.9% and +5.9% in near and far future), although strong variability can be observed. The rise of the mean annual precipitation is the combined effect of a temperature rise and a significant shift in precipitation seasonality with rising winter rainfall and declining summer rainfall, with the winter surplus slightly over-compensating for the summer loss. This seasonality shift follows a north-western to south-eastern gradient, with the highest winter rainfall increase occurring in the Upper Danube and the highest summer rainfall decrease occurring in the Lower Danube. For RCP8.5, this development intensifies in comparison to RCP2.6.
However, increasing precipitation is not capable to refill the soil water storage in winter, as much of the water goes directly into runoff. Soil water content is projected to decrease particularly in summer and autumn, due to the combined effect of decreasing precipitation, increasing temperature and thus, increasing saturation deficits. Therefore, soil water storage is depleted by the amplified evapotranspiration, particularly by forests, grasslands and crops, which increases the plant water stress risk. The role of snow water storage for water resources in the DRB, however, is declining sharply, due to the rising winter temperatures, especially in the mountains.
The mean annual MQ at the Danube outlet is projected to slightly rise (RCP2.6: +2.8% and +10.7% in near and far future; RCP8.5: +3.1% and +5.2% in near and far future), but the picture varies for different sub-basins and seasons. Generally, the winter MQ tends to rise in the Upper Danube and the mountain watersheds of the Middle Danube (e.g., Drava, Sava), whereas the summer and autumn MQ tends to fall in the lowland and low mountain watersheds of the Middle Danube (e.g., Mures, Tisza) and the Lower Danube (e.g., Siret). This holds direct consequences for the risk of low flows in the DRB, which is of special interest along the main course of the Danube for navigability reasons. Along the Upper and Middle Danube River (gauges Achleiten and Bezdan), low flows become less frequent in an average year, whereas along the Middle and Lower Danube River (gauges Iron Gate and Ceatal Izmail), low flows become more frequent in an average year. In the future, this development is expected to hamper shipping along the Lower Danube River on more days of the year, presumably during dry episodes in the summer and autumn seasons. In contrast, the risk of high flows is projected to rise, as high flows become more frequent in an average year, all along the Danube main course.
Our results show that the hydrological impacts of climate change will not follow national borders, but are of a transboundary nature, connecting the downstream with the upstream regions of the Danube. Hence, they are highly relevant for formulating and updating state-of-the-art basin-wide climate change adaptation strategies for the DRB under the leadership of a coordinating water management entity, such as the ICPDR. Climate change trends in the DRB can indeed be broken down to a simplified tendency, according to which temperature increases strongly, wet regions become wetter and dry regions become drier [9]. More winter rainfall in the Upper Danube and less summer rainfall in the Middle and Lower Danube will lead to an increasing discrepancy between the largest water surplus and the largest water demand—which is mainly due to agriculture—in space and time. Thus, the present water competition between upstream and downstream countries and between different sectors is very likely to increase with intensifying water shortages.
Further research needs to be undertaken to assess the dynamics of the upstream–downstream and inter-sectoral water competition in the present, and under climate change scenarios, to provide important insights for future-oriented basin-wide water resource management in the DRB.
Author Contributions
Conceptualization, E.P. and W.M.; Methodology, E.P. and W.M.; Software, E.P. and W.M.; Validation, E.P.; Formal analysis, E.P.; Investigation, E.P.; Resources, W.M.; Data curation, E.P.; Writing—original draft preparation, E.P.; Writing—review and editing, E.P. and W.M.; Visualization, E.P.; Supervision, W.M.; Project administration, W.M.; Funding acquisition, W.M. All authors have read and agreed to the published version of the manuscript.
Funding
This research was funded by the Federal Ministry of Education and Research (BMBF) in the frame of the ViWA project within the research initiative “Global Resource Water (GRoW)”, grant number 02WGR1423A.
Data Availability Statement
The data will be provided upon request.
Conflicts of Interest
The authors declare no conflict of interest.
References
- Intergovernmental Panel on Climate Change (IPCC). Summary for Policymakers. In Climate Change 2021: The Physical Science Basis. Contribution of Working Group I to the Sixth Assessment Report of the Intergovernmental Panel on Climate Change; Masson-Delmotte, V., Zhai, P., Pirani, A., Connors, S.L., Péan, C., Berger, S., Caud, N., Chen, Y., Goldfarb, L., Gomis, M.I., et al., Eds.; Cambridge University Press: Cambridge, UK; New York, NY, USA, 2021; pp. 3–32. [Google Scholar]
- United Nations Framework Convention on Climate Change (UNFCCC). Adoption of the Paris Agreement, 21st Conference of the Parties; United Nations: Paris, France, 2015. [Google Scholar]
- Arias, P.A.; Bellouin, N.; Coppola, E.; Jones, R.G.; Krinner, G.; Marotzke, J.; Naik, V.; Palmer, M.D.; Plattner, G.-K.; Rogelj, J.; et al. Technical Summary. In Climate Change 2021: The Physical Science Basis. Contribution of Working Group I to the Sixth Assessment Report of the Intergovernmental Panel on Climate Change; Masson-Delmotte, V., Zhai, P., Pirani, A., Connors, S.L., Péan, C., Berger, S., Caud, N., Chen, Y., Goldfarb, L., Gomis, M.I., et al., Eds.; Cambridge University Press: Cambridge, UK; New York, NY, USA, 2021; pp. 33–144. [Google Scholar]
- Doblas-Reyes, F.J.; Sörensson, A.A.; Almazroui, M.; Dosio, A.; Gutowski, W.J.; Haarsma, R.; Hamdi, R.; Hewitson, B.; Kwon, W.-T.; Lamptey, B.L.; et al. Linking Global to Regional Climate Change. In Climate Change 2021: The Physical Science Basis. Contribution of Working Group I to the Sixth Assessment Report of the Intergovernmental Panel on Climate Change; Masson-Delmotte, V., Zhai, P., Pirani, A., Connors, S.L., Péan, C., Berger, S., Caud, N., Chen, Y., Goldfarb, L., Gomis, M.I., et al., Eds.; Cambridge University Press: Cambridge, UK; New York, NY, USA, 2021; pp. 1363–1512. [Google Scholar]
- Kjellström, E.; Nikulin, G.; Strandberg, G.; Christensen, O.B.; Jacob, D.; Keuler, K.; Lenderink, G.; van Meijgaard, E.; Schär, C.; Somot, S.; et al. European climate change at global mean temperature increases of 1.5 and 2 °C above pre-industrial conditions as simulated by the EURO-CORDEX regional climate models. Earth Syst. Dynam. 2018, 9, 459–478. [Google Scholar] [CrossRef] [Green Version]
- Iturbide, M.; Fernández, J.; Gutiérrez, J.M.; Bedia, J.; Cimadevilla, E.; Díez-Sierra, J.; Manzanas, R.; Casanueva, A.; Baño-Medina, J.; Milovac, J.; et al. Repository Supporting the Implementation of FAIR Principles in the IPCC-WG1 Atlas. 2021. Available online: https://github.com/IPCC-WG1/Atlas (accessed on 14 November 2022).
- Gutiérrez, J.M.; Jones, R.G.; Narisma, G.T.; Alves, L.M.; Amjad, M.; Gorodetskaya, I.V.; Grose, M.; Klutse, N.A.B.; Krakovska, S.; Li, J.; et al. Atlas; Cambridge University Press: Cambridge, UK; New York, NY, USA, 2021. [Google Scholar]
- Dogaru, D.; Mauser, W.; Balteanu, D.; Krimly, T.; Lippert, C.; Sima, M.; Szolgay, J.; Kohnova, S.; Hanel, M.; Nikolova, M.; et al. Irrigation Water Use in the Danube Basin: Facts, Governance and Approach to Sustainability. J. Environ. Geogr. 2019, 12, 1–12. [Google Scholar] [CrossRef] [Green Version]
- International Commission for the Protection of the Danube River (ICPDR). Climate Change Adaptation Strategy; ICPDR: Vienna, Austria, 2019. [Google Scholar]
- ICPDR/LMU. Revision and Update of the Danube Study. Integrating and Editing New Scientific Results in Climate Change Research and the Resulting Impacts on Water Availability to Revise the Existing Adaptation Strategies in the Danube River Basin; Ludwig-Maximilians-Universität: Munich, Germany, 2018. [Google Scholar]
- Stagl, J.C.; Hattermann, F.F. Impacts of Climate Change on the Hydrological Regime of the Danube River and Its Tributaries Using an Ensemble of Climate Scenarios. Water 2015, 7, 6139–6172. [Google Scholar] [CrossRef]
- Krysanova, V.; Hattermann, F.; Wechsung, F. Development of the ecohydrological model SWIM for regional impact studies and vulnerability assessment. Hydrol. Process. 2005, 19, 763–783. [Google Scholar] [CrossRef]
- Van der Linden, P.; Mitchell, J.F.B. ENSEMBLES: Climate Change and Its Impacts: Summary of Research and Results from the ENSEMBLES Project; Met Office Hadley Centre: Exeter, UK, 2009; p. 160.
- Meehl, G.A.; Covey, C.; Delworth, T.; Latif, M.; McAvaney, B.; Mitchell, J.F.B.; Stouffer, R.J.; Taylor, K.E. THE WCRP CMIP3 Multimodel Dataset: A New Era in Climate Change Research. Bull. Am. Meteorol. Soc. 2007, 88, 1383–1394. [Google Scholar] [CrossRef] [Green Version]
- Stagl, J.C.; Hattermann, F.F. Impacts of Climate Change on Riverine Ecosystems: Alterations of Ecologically Relevant Flow Dynamics in the Danube River and Its Major Tributaries. Water 2016, 8, 566. [Google Scholar] [CrossRef] [Green Version]
- Taylor, K.E.; Stouffer, R.J.; Meehl, G.A. An Overview of CMIP5 and the Experiment Design. Bull. Am. Meteorol. Soc. 2012, 93, 485–498. [Google Scholar] [CrossRef] [Green Version]
- Maraun, D.; Wetterhall, F.; Ireson, A.M.; Chandler, R.E.; Kendon, E.J.; Widmann, M.; Brienen, S.; Rust, H.W.; Sauter, T.; Themeßl, M.; et al. Precipitation downscaling under climate change: Recent developments to bridge the gap between dynamical models and the end user. Rev. Geophys. 2010, 48, 1–34. [Google Scholar] [CrossRef] [Green Version]
- Bisselink, B.; Roo, A.d.; Bernhard, J.; Gelati, E. Future projections of water scarcity in the Danube River Basin due to land use, water demand and climate change. J. Environ. Geogr. 2018, 11, 25–36. [Google Scholar] [CrossRef] [Green Version]
- De Roo, A.P.J.; Wesseling, C.G.; Van Deursen, W.P.A. Physically based river basin modelling within a GIS: The LISFLOOD model. Hydrol. Process. 2000, 14, 1981–1992. [Google Scholar] [CrossRef]
- Van Der Knijff, J.M.; Younis, J.; De Roo, A.P.J. LISFLOOD: A GIS-based distributed model for river basin scale water balance and flood simulation. Int. J. Geogr. Inf. Sci. 2010, 24, 189–212. [Google Scholar] [CrossRef]
- Jacob, D.; Petersen, J.; Eggert, B.; Alias, A.; Christensen, O.B.; Bouwer, L.M.; Braun, A.; Colette, A.; Déqué, M.; Georgievski, G.; et al. EURO-CORDEX: New high-resolution climate change projections for European impact research. Reg. Environ. Change 2014, 14, 563–578. [Google Scholar] [CrossRef]
- Mauser, W.; Bach, H. PROMET—Large scale distributed hydrological modelling to study the impact of climate change on the water flows of mountain watersheds. J. Hydrol. 2009, 376, 362–377. [Google Scholar] [CrossRef]
- Probst, E.; Mauser, W. Evaluation of ERA5 and WFDE5 forcing data for hydrological modelling and the impact of bias correction with regional climatologies: A case study in the Danube River Basin. J. Hydrol. Reg. Stud. 2022, 40, 101023. [Google Scholar] [CrossRef]
- Intergovernmental Panel on Climate Change (IPCC). Summary for Policymakers. In Climate Change 2014: Synthesis Report. Contribution of Working Groups I, II and III to the Fifth Assessment Report of the Intergovernmental Panel on Climate Change; Core Writing Team, Pachauri, R.K., Meyer, L.A.E., Eds.; IPCC: Geneva, Switzerland, 2014; p. 151. [Google Scholar]
- Jungwirth, M.; Haidvogl, G.; Hohensinner, S.; Waidbacher, H.; Zauner, G. Österreichs Donau. Landschaft—Fisch—Geschichte; Institut für Hydrobiologie u. Gewässermanagement, BOKU: Vienna, Austria, 2014; p. 420. [Google Scholar]
- Schiller, H.; Miklós, D.; Sass, J. Chapter 2. The Danube River and its Basin Physical Characteristics, Water Regime and Water Balance. In Hydrological Processes of the Danube River Basin; Brilly, M., Ed.; Springer: Dordrecht, The Netherlands; Heidelberg, Germany; London, UK; New York, NY, USA, 2010; pp. 25–77. [Google Scholar]
- Farr, T.G.; Rosen, P.A.; Caro, E.; Crippen, R.; Duren, R.; Hensley, S.; Kobrick, M.; Paller, M.; Rodriguez, E.; Roth, L.; et al. The Shuttle Radar Topography Mission. Rev. Geophys. 2007, 45, 1–33. [Google Scholar] [CrossRef] [Green Version]
- Lehner, B.; Verdin, K.; Jarvis, A. New Global Hydrography Derived from Spaceborne Elevation Data. Eos 2008, 89, 93–94. [Google Scholar] [CrossRef]
- Global Runoff Data Centre (GRDC). The Global Runoff Data Centre. 2019. Available online: https://grdc.bafg.de (accessed on 14 November 2022).
- International Commission for the Protection of the Danube River (ICPDR). Danube River Basin Water Quality Database. 2021. Available online: https://www.icpdr.org/wq-db/ (accessed on 14 November 2022).
- Esri. “World Imagery” [basemap]. Scale Not Given. “World Imagery”, 8 November 2022. 2009. Available online: https://www.arcgis.com/home/item.html?id=10df2279f9684e4a9f6a7f08febac2a9 (accessed on 18 November 2022).
- Beck, H.E.; Zimmermann, N.E.; McVicar, T.R.; Vergopolan, N.; Berg, A.; Wood, E.F. Present and future Köppen-Geiger climate classification maps at 1-km resolution. Sci. Data 2018, 5, 180214. [Google Scholar] [CrossRef] [Green Version]
- Kovács, P. Chapter 5. Characterization of the Runoff Regime and Its Stability in the Danube Catchment. In Hydrological Processes of the Danube River Basin; Brilly, M., Ed.; Springer: Dordrecht, The Netherlands; Heidelberg, Germany; London, UK; New York, NY, USA, 2010; pp. 143–173. [Google Scholar]
- Mauser, W.; Prasch, M.; Weidinger, R.; Stöber, S. GLOWA-Danube. In Regional Assessment of Global Change Impacts: The Project GLOWA-Danube; Mauser, W., Prasch, M., Eds.; Springer International Publishing: Cham, Germany, 2016; pp. 3–18. [Google Scholar]
- Regionale Zusammenarbeit der Donauländer (RZD). Die Donau und ihr Einzugsgebiet. Eine hydrologische Monographie. Teil 1: Texte; Bayerisches Landesamt für Wasserwirtschaft: Munich, Germany, 1986; p. 377. [Google Scholar]
- Hank, T.B.; Bach, H.; Mauser, W. Using a Remote Sensing-Supported Hydro-Agroecological Model for Field-Scale Simulation of Heterogeneous Crop Growth and Yield: Application for Wheat in Central Europe. Remote Sens. 2015, 7, 3934–3965. [Google Scholar] [CrossRef] [Green Version]
- Mauser, W.; Klepper, G.; Zabel, F.; Delzeit, R.; Hank, T.; Putzenlechner, B.; Calzadilla, A. Global biomass production potentials exceed expected future demand without the need for cropland expansion. Nat. Commun. 2015, 6, 8946. [Google Scholar] [CrossRef] [Green Version]
- Zabel, F.; Putzenlechner, B.; Mauser, W. Global Agricultural Land Resources—A High Resolution Suitability Evaluation and Its Perspectives until 2100 under Climate Change Conditions. PLoS ONE 2014, 9, e107522. [Google Scholar] [CrossRef]
- Farquhar, G.D.; von Caemmerer, S.; Berry, J.A. A biochemical model of photosynthetic CO2 assimilation in leaves of C3 species. Planta 1980, 149, 78–90. [Google Scholar] [CrossRef] [Green Version]
- Chen, D.-X.; Coughenour, M.B.; Knapp, A.K.; Owensby, C.E. Mathematical simulation of C4 grass photosynthesis in ambient and elevated CO2. Ecol. Modell. 1994, 73, 63–80. [Google Scholar] [CrossRef]
- Ball, J.T.; Woodrow, I.E.; Berry, J.A. A model predicting stomatal conductance and its contribution to the control of photosynthesis under different environmental conditions. In Progress in Photosynthesis Research. Proceedings of the VIIth International Congress on Photosynthesis, Providence, RI, USA, 10–15 August 1986; Biggins, J., Ed.; Springer Science+Business Media: Dordrecht, The Netherlands, 1987; pp. 221–224. [Google Scholar]
- Jarvis, P.G.; Morison, J.I.L. The control of transpiration and photosynthesis by stomata. In Stomatal Physiology; Jarvis, P.G., Mansfield, T.A., Eds.; Cambridge University Press: Cambridge, UK, 1981; pp. 247–279. [Google Scholar]
- Cunge, J.A. On the Subject of a Flood Propagation Computation Method (Muskingum Method). J. Hydraul. Res. 1969, 7, 205–230. [Google Scholar] [CrossRef]
- Todini, E. A mass conservative and water storage consistent variable parameter Muskingum-Cunge approach. Hydrol. Earth Syst. Sci. 2007, 11, 1645–1659. [Google Scholar] [CrossRef] [Green Version]
- Marke, T.; Mauser, W.; Pfeiffer, A.; Zängl, G.; Jacob, D.; Strasser, U. Application of a hydrometeorological model chain to investigate the effect of global boundaries and downscaling on simulated river discharge. Environ. Earth Sci. 2014, 71, 4849–4868. [Google Scholar] [CrossRef]
- FAO/IIASA/ISRIC/ISSCAS/JRC. Harmonized World Soil Database (Version 1.2). 2012. Available online: http://www.fao.org/soils-portal/soil-survey/soil-maps-and-databases/harmonized-world-soil-database-v12/en/ (accessed on 14 November 2022).
- European Environmental Agency (EEA). CORINE Land Cover (CLC2012). 2012. Available online: https://land.copernicus.eu/pan-european/corine-land-cover/clc-2012 (accessed on 14 November 2022).
- European Space Agency (ESA). Land Cover CCI Product User Guide Version 2 Technical Report 2015. Available online: http://maps.elie.ucl.ac.be/CCI/viewer/download/ESACCI-LC-Ph2-PUGv2_2.0.pdf (accessed on 14 November 2022).
- EUROSTAT. Crops by Classes of Utilised Agricultural Area in Number of Farms and Hectare by NUTS 2 Regions (ef_lus_allcrops). 2013. Available online: https://ec.europa.eu/eurostat/web/agriculture/data/database (accessed on 14 November 2022).
- Zier, C.; Müller, C.; Komischke, H.; Steinbauer, A.; Bäse, F. Das Bayerische Klimaprojektionsensemble—Audit und Ensemblebildung; Bayerisches Landesamt für Umwelt (LfU): Augsburg, Germany, 2020; p. 55. [Google Scholar]
- Smiatek, G.; Kunstmann, H.; Senatore, A. EURO-CORDEX regional climate model analysis for the Greater Alpine Region: Performance and expected future change. J. Geophys. Res. Atmos. 2016, 121, 7710–7728. [Google Scholar] [CrossRef] [Green Version]
- Lazić, I.; Tošić, M.; Djurdjević, V. Verification of the EURO-CORDEX RCM Historical Run Results over the Pannonian Basin for the Summer Season. Atmosphere 2021, 12, 714. [Google Scholar] [CrossRef]
- Torma, C.Z. Detailed validation of EURO-CORDEX and Med-CORDEX regional climate model ensembles over the Carpathian Region. Idojaras 2019, 123, 217–240. [Google Scholar] [CrossRef]
- Kotlarski, S.; Keuler, K.; Christensen, O.B.; Colette, A.; Déqué, M.; Gobiet, A.; Goergen, K.; Jacob, D.; Lüthi, D.; van Meijgaard, E.; et al. Regional climate modeling on European scales: A joint standard evaluation of the EURO-CORDEX RCM ensemble. Geosci. Model Dev. 2014, 7, 1297–1333. [Google Scholar] [CrossRef] [Green Version]
- Fick, S.E.; Hijmans, R.J. WorldClim 2: New 1-km spatial resolution climate surfaces for global land areas. Int. J. Climatol. 2017, 37, 4302–4315. [Google Scholar] [CrossRef]
- Früh, B.; Schipper, H.; Pfeiffer, A.; Wirth, V. A pragmatic approach for downscaling precipitation in alpine-scale complex terrain. Meteorol. Z. 2006, 15, 631–646. [Google Scholar] [CrossRef]
- Frei, C.; Schär, C. A precipitation climatology of the Alps from high-resolution rain-gauge observations. Int. J. Climatol. 1998, 18, 873–900. [Google Scholar] [CrossRef]
- Pepin, N.C.; Arnone, E.; Gobiet, A.; Haslinger, K.; Kotlarski, S.; Notarnicola, C.; Palazzi, E.; Seibert, P.; Serafin, S.; Schöner, W.; et al. Climate Changes and Their Elevational Patterns in the Mountains of the World. Rev. Geophys. 2022, 60, e2020RG000730. [Google Scholar] [CrossRef]
- Bisselink, B.; Bernhard, J.; Gelati, E.; Jacobs, C.; Adamovic, M.; Mentaschi, L.; Lavalle, C.; de Roo, A. Impact of a Changing Climate, Land Use, and Water Usage on Water Resources in the Danube River Basin; EUR 29228 EN; Publications Office of the European Union: Luxembourg, Luxembourg, 2018. [Google Scholar] [CrossRef]
- Todaro, V.; D’Oria, M.; Secci, D.; Zanini, A.; Tanda, M.G. Climate Change over the Mediterranean Region: Local Temperature and Precipitation Variations at Five Pilot Sites. Water 2022, 14, 2499. [Google Scholar] [CrossRef]
- Mersin, D.; Tayfur, G.; Vaheddoost, B.; Safari, M.J.S. Historical Trends Associated with Annual Temperature and Precipitation in Aegean Turkey, Where Are We Heading? Sustainability 2022, 14, 13380. [Google Scholar] [CrossRef]
- Kastridis, A.; Kamperidou, V.; Stathis, D. Dendroclimatological Analysis of Fir (A. borisii-regis) in Greece in the frame of Climate Change Investigation. Forests 2022, 13, 879. [Google Scholar] [CrossRef]
- Kundzewicz, Z.W.; Krysanova, V.; Benestad, R.E.; Hov, Ø.; Piniewski, M.; Otto, I.M. Uncertainty in climate change impacts on water resources. Environ. Sci. Policy 2018, 79, 1–8. [Google Scholar] [CrossRef]
- Vetter, T.; Huang, S.; Aich, V.; Yang, T.; Wang, X.; Krysanova, V.; Hattermann, F. Multi-model climate impact assessment and intercomparison for three large-scale river basins on three continents. Earth Syst. Dynam. 2015, 6, 17–43. [Google Scholar] [CrossRef]
Figure 1.
Map of the Danube River Basin with its river network, major gauges and the subdivision into Upper, Middle and Lower Danube. Major sub-basins (gauges in parentheses): Upper Danube (Achleiten), Middle Danube (Bezdan and Iron Gate), Drava (Dravaszabolcs), Sava (Sremska Mitrovica), Mures (Nagylak), Tisza (Senta), Siret (Lungoci) and the Lower Danube (Ceatal Izmail). Major gauges along the Danube main course: Achleiten, Bezdan, Iron Gate, Ceatal Izmail. Data sources: Farr et al. [27], Lehner et al. [28], Global Runoff Data Centre (GRDC) [29], International Commission for the Protection of the Danube River (ICPDR) [30] and Esri [31].

Figure 2.
Hindcast of long-term mean monthly temperature [°C] (a) and precipitation [mm] (b) (1980–2000) on spatial average over the Danube River Basin as well as long-term mean monthly discharge [m3/s] (c) at outlet gauge Ceatal Izmail (1980–2000). The simulations driven by the bias-corrected GCM-RCM ensemble members ICHEC-RACMO, ICHEC-RCA4 and MPI-RCA4 were compared with the ERA5-GPW-driven simulation of Probst and Mauser [23].

Figure 3.
Mean annual temperature [°C] (a) and precipitation [mm] (b) according to the historical ERA5-GPW-driven simulation (1980–2000) [23] (green) and to the historical GCM-RCM-driven simulations (ensemble mean; 1971–2000) (black) as well as according to the GCM-RCM-driven simulations (ensemble mean) under RCP2.6 (blue) and RCP8.5 (red) for the near future (2031–2060) and the far future (2071–2100) on spatial average over the whole Danube River Basin. Lines: ensemble mean; shadings: standard deviation of the ensemble.

Figure 4.
Boxplots of the annual temperature change [°C] (a–c) and the annual precipitation change [%] (d–f) on spatial average for the Upper, Middle and Lower Danube according to the simulations driven by the three individual GCM-RCM ensemble members under RCP2.6 and RCP8.5 for the near future (2031–2060) and the far future (2071–2100) compared to the long-term mean of the GCM-RCM-driven simulations for the historical period (1971–2000). The boxplots show yearly simulation results of the three individual GCM-RCM ensemble members. Whiskers: 1.5-fold interquartile range; black dots: minimum and maximum values.

Figure 5.
Long-term mean monthly developments of temperature [°C] (a–c) and precipitation [mm] (d–f) according to the historical GCM-RCM-driven simulations (ensemble mean, 1971–2000) and the GCM-RCM-driven simulations (ensemble mean) under RCP2.6 and RCP8.5 for the near future (2031–2060) and the far future (2071–2100) on spatial average for the Upper, Middle and Lower Danube.

Figure 6.
Maps of the long-term mean seasonal temperature [°C] for the historical GCM-RCM-driven simulations (ensemble mean, 1971–2000) as well as the long-term mean seasonal temperature change [°C] according to the GCM-RCM-driven simulations (ensemble mean) under RCP2.6 and RCP8.5 for the near future (2031–2060) and the far future (2071–2100) in the Danube River Basin.

Figure 7.
Maps of the long-term mean seasonal precipitation [mm] for the historical GCM-RCM-driven simulations (ensemble mean, 1971–2000) as well as the long-term mean seasonal precipitation change [%] according to the GCM-RCM-driven simulations (ensemble mean) under RCP2.6 and RCP8.5 for the near future (2031–2060) and the far future (2071–2100) in the Danube River Basin.

Figure 8.
Long-term mean monthly developments of soil water content in the rooted zone [mm] (a–c), plant water stress [% reduction of potential transpiration] (d–f) and snow water equivalent [mm] (g–i) according to the historical GCM-RCM-driven simulations (ensemble mean, 1971–2000) and the GCM-RCM-driven simulations (ensemble mean) under RCP2.6 and RCP8.5 for the near future (2031–2060) and the far future (2071–2100) on spatial average over the Upper, Middle and Lower Danube.

Figure 9.
Maps of the long-term mean seasonal soil water content in the rooted zone [mm] for the historical GCM-RCM-driven simulations (ensemble mean, 1971–2000) as well as the long-term mean seasonal soil water change [mm] according to the GCM-RCM-driven simulations (ensemble mean) under RCP2.6 and RCP8.5 for the near future (2031–2060) and the far future (2071–2100) in the Danube River Basin.

Figure 10.
Maps of the long-term mean seasonal plant water stress [% reduction of potential transpiration] for the historical GCM-RCM-driven simulations (ensemble mean, 1971–2000) as well as for the GCM-RCM-driven simulations (ensemble mean) under RCP2.6 and RCP8.5 for the near future (2031–2060) and the far future (2071–2100) in the Danube River Basin.

Figure 11.
Maps of the long-term mean seasonal snow water equivalent (SWE) [mm] for the historical GCM-RCM-driven simulations (ensemble mean, 1971–2000) as well as for the GCM-RCM-driven simulations (ensemble mean) under RCP2.6 and RCP8.5 for the near future (2031–2060) and the far future (2071–2100) in the Danube River Basin.

Figure 12.
Long-term mean monthly developments of discharge [m3/s] according to the historical GCM-RCM-driven simulations (ensemble mean, 1971–2000) and the GCM-RCM-driven simulations (ensemble mean) under RCP2.6 and RCP8.5 for the near future (2031–2060) and the far future (2071–2100) for the Upper Danube at gauge Achleiten, the Middle Danube at gauge Iron Gate and the Lower Danube at gauge Ceatal Izmail.

Figure 13.
Maps of the long-term mean seasonal MQ change [%] in the Danube River Basin according to the GCM-RCM-driven simulations (ensemble mean) under RCP2.6 and RCP8.5 for the near future (2031–2060) and the far future (2071–2100) compared to the historical GCM-RCM-driven simulations (ensemble mean, 1971–2000).

Figure 14.
Flow duration curves for different gauges along the main course of the Danube (gauges Achleiten, Bezdan, Iron Gate and Ceatal Izmail) for the historical GCM-RCM-driven simulations (ensemble mean, 1971–2000) as well as for the GCM-RCM-driven simulations (ensemble mean) under RCP2.6 and RCP8.5 for the near future (2031–2060) and the far future (2071–2100). The graphs in subplots (a–d) show the average number of days in a year in which the daily discharge values are exceeded. The graphs in subplots (e–h) are zoomed-in near the historical long-term mean annual low flow (MNQ) values and the graphs in subplots (i–l) are zoomed-in near the historical long-term mean annual high flow (MHQ) values at the respective gauges.


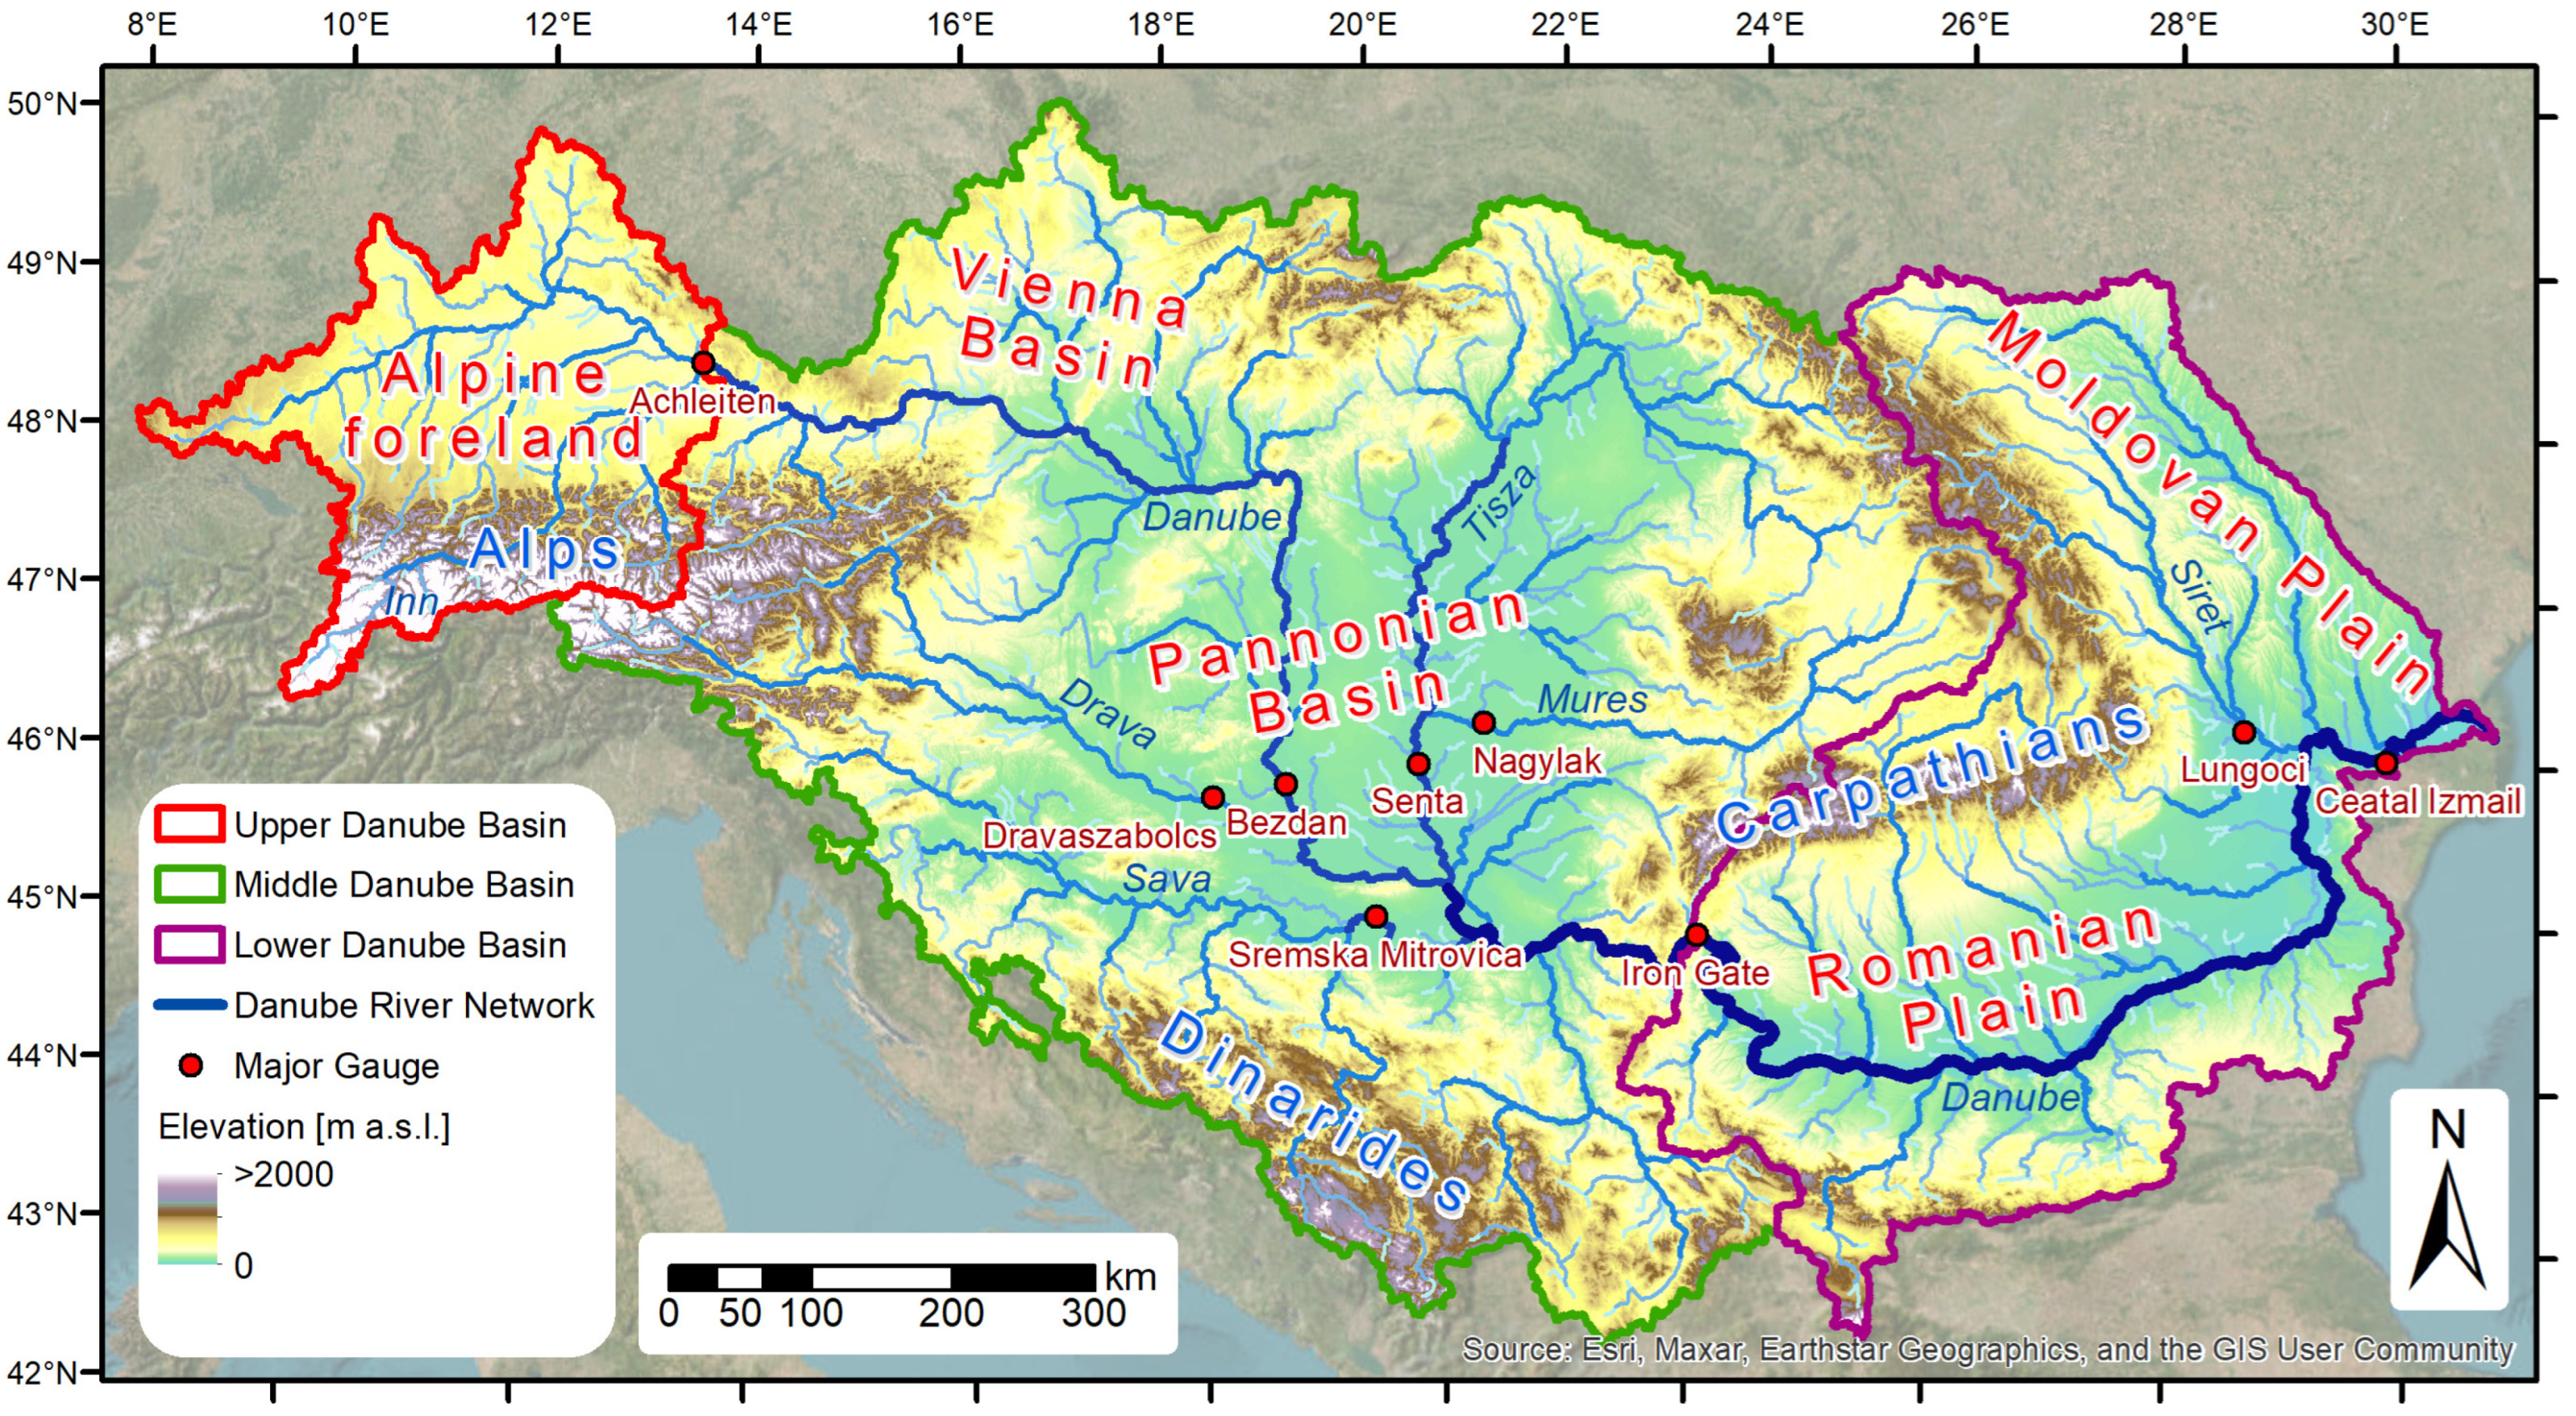
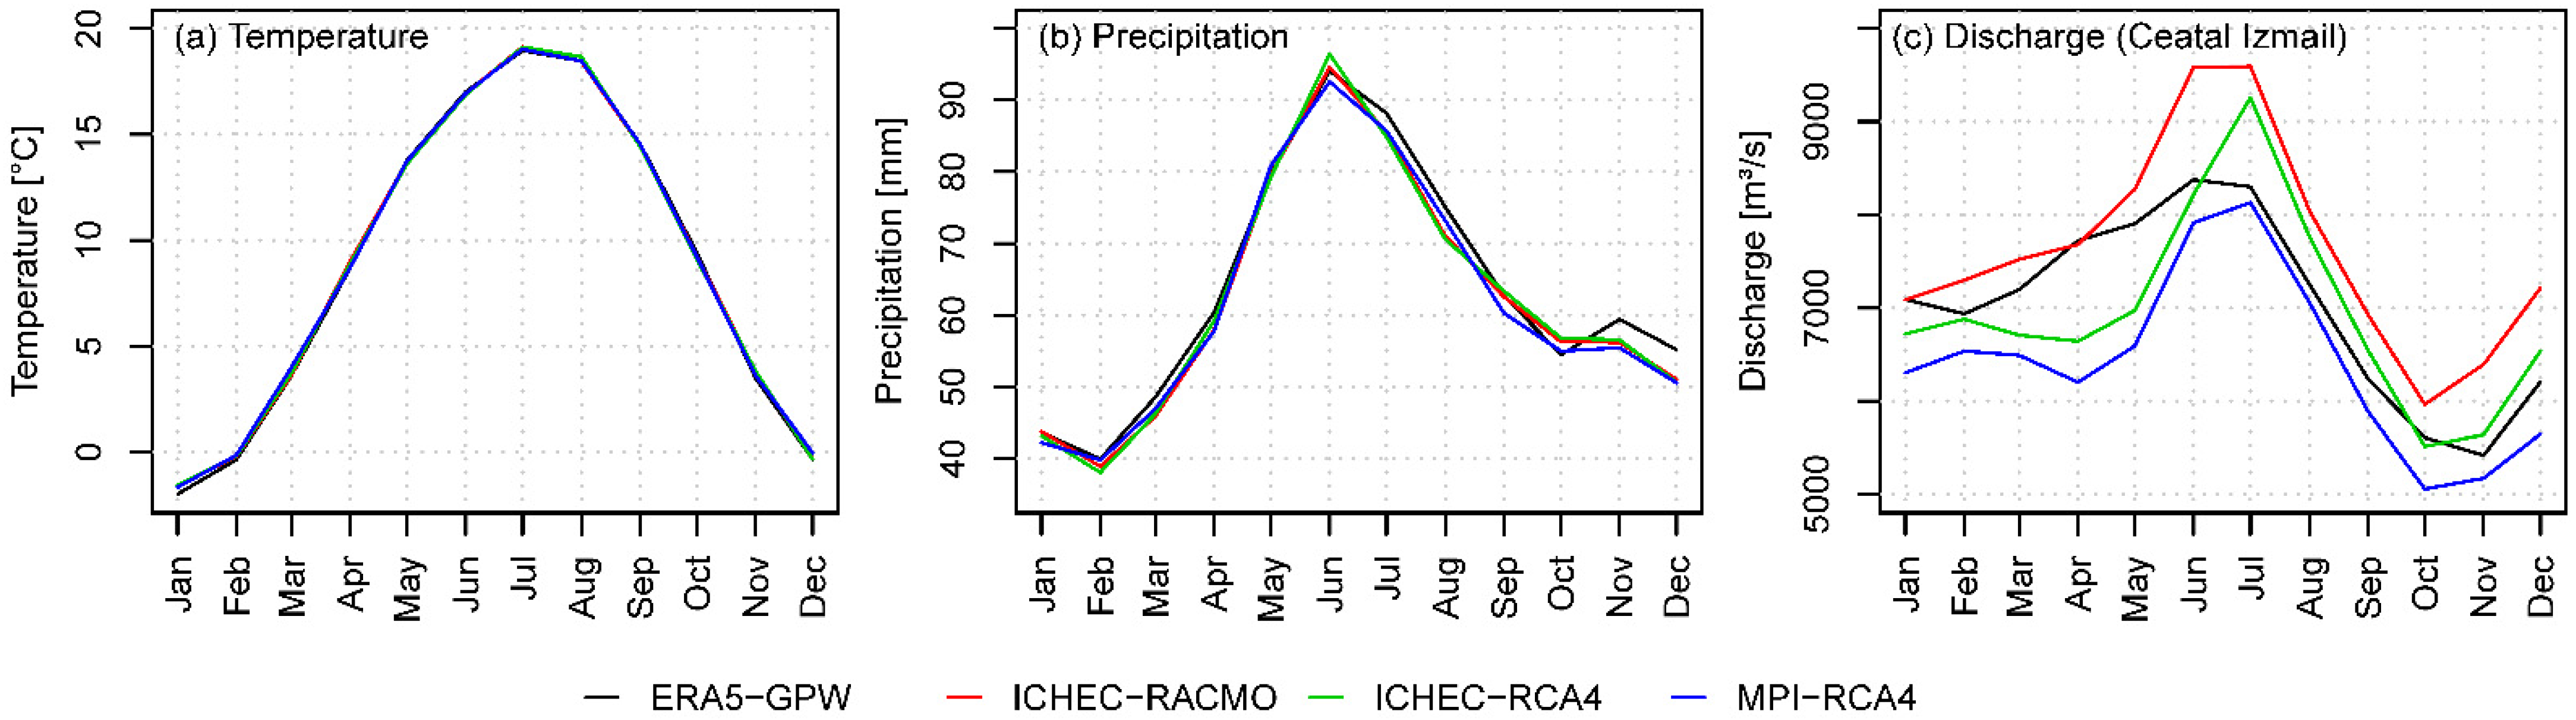
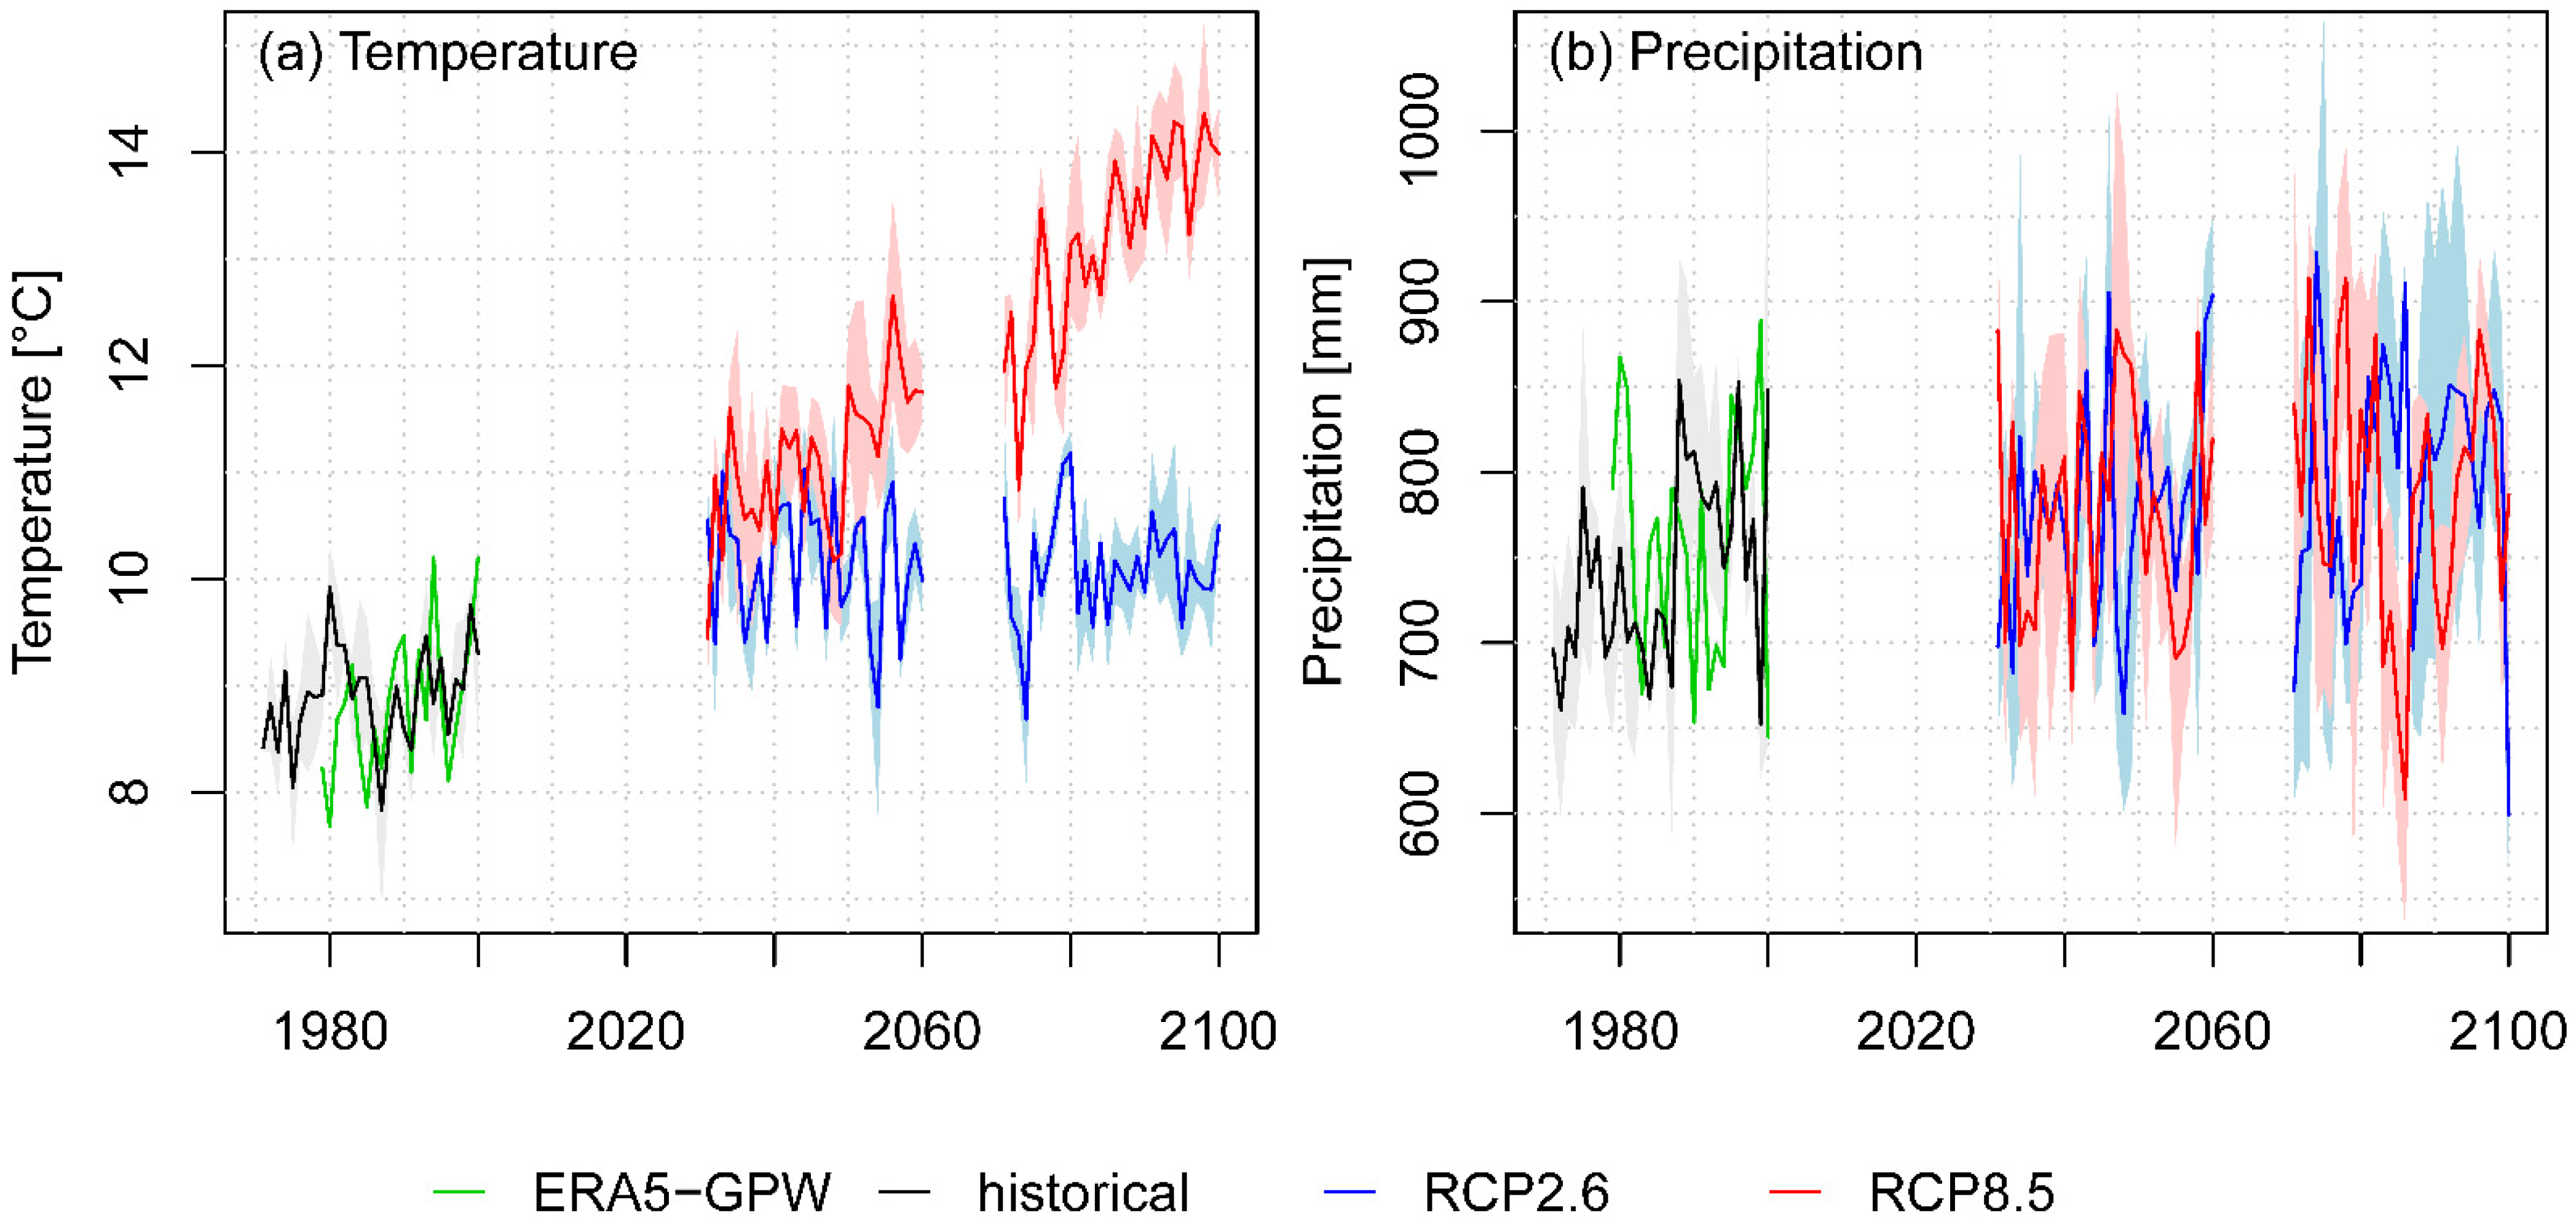
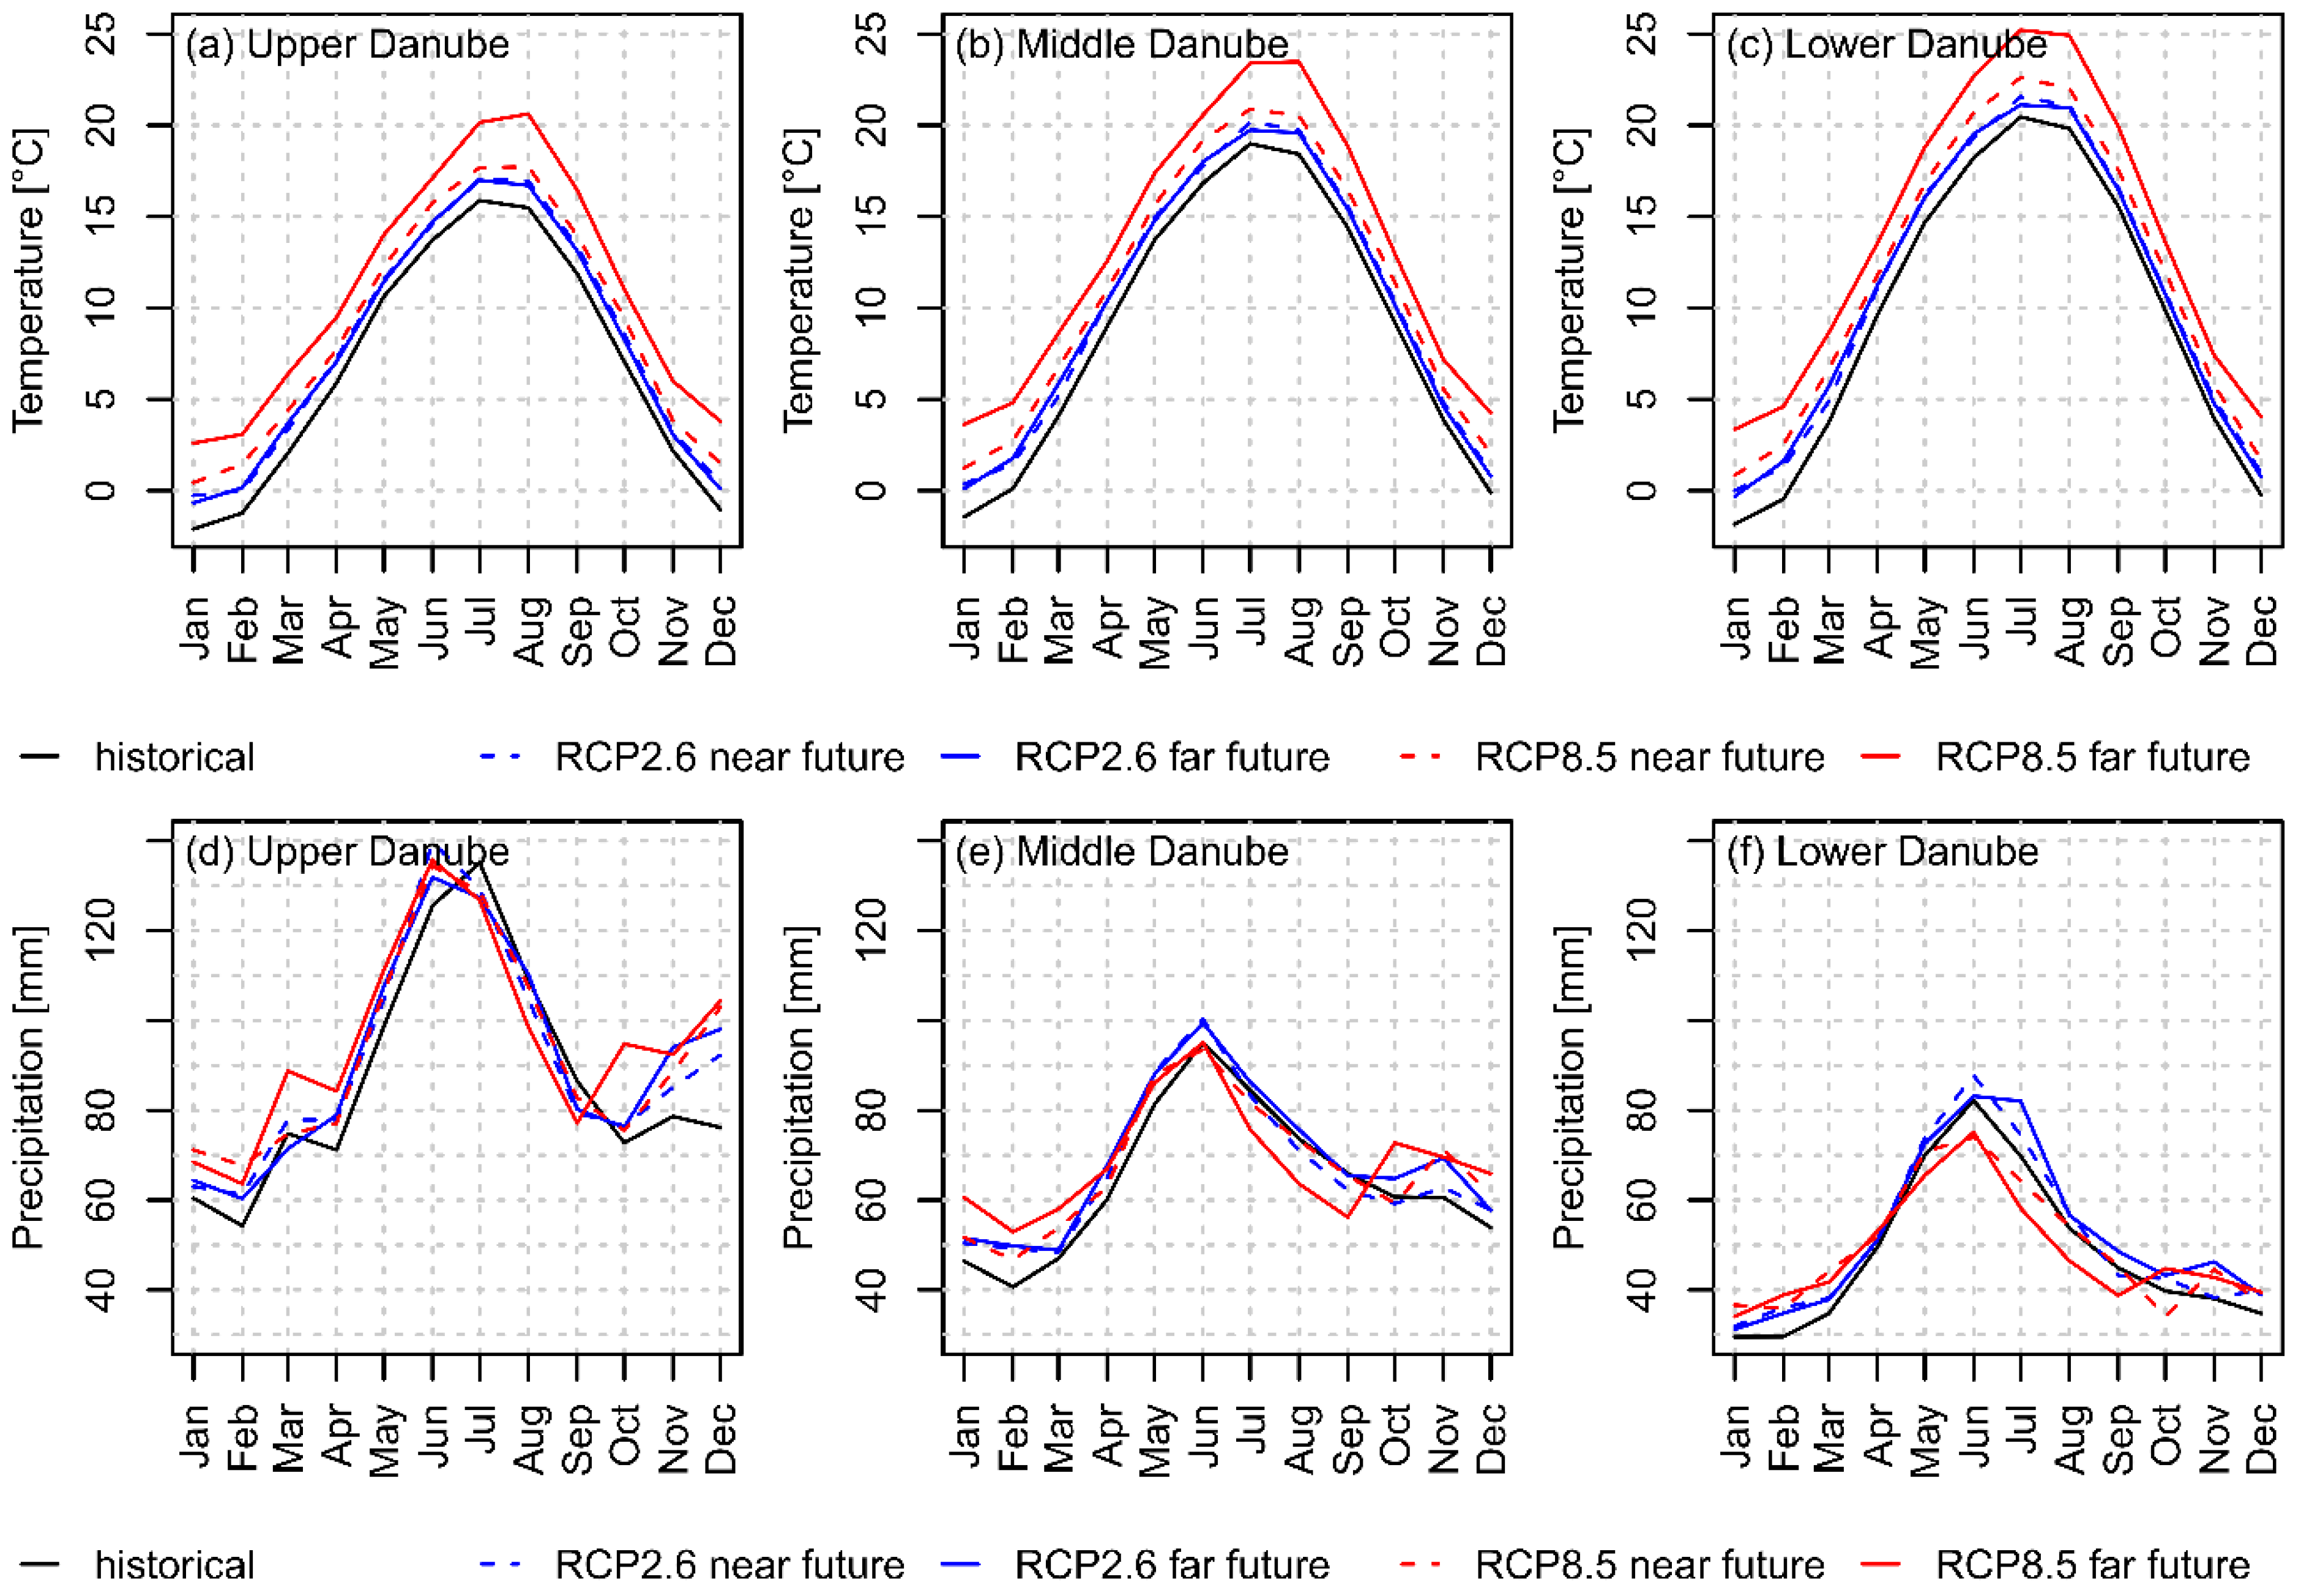
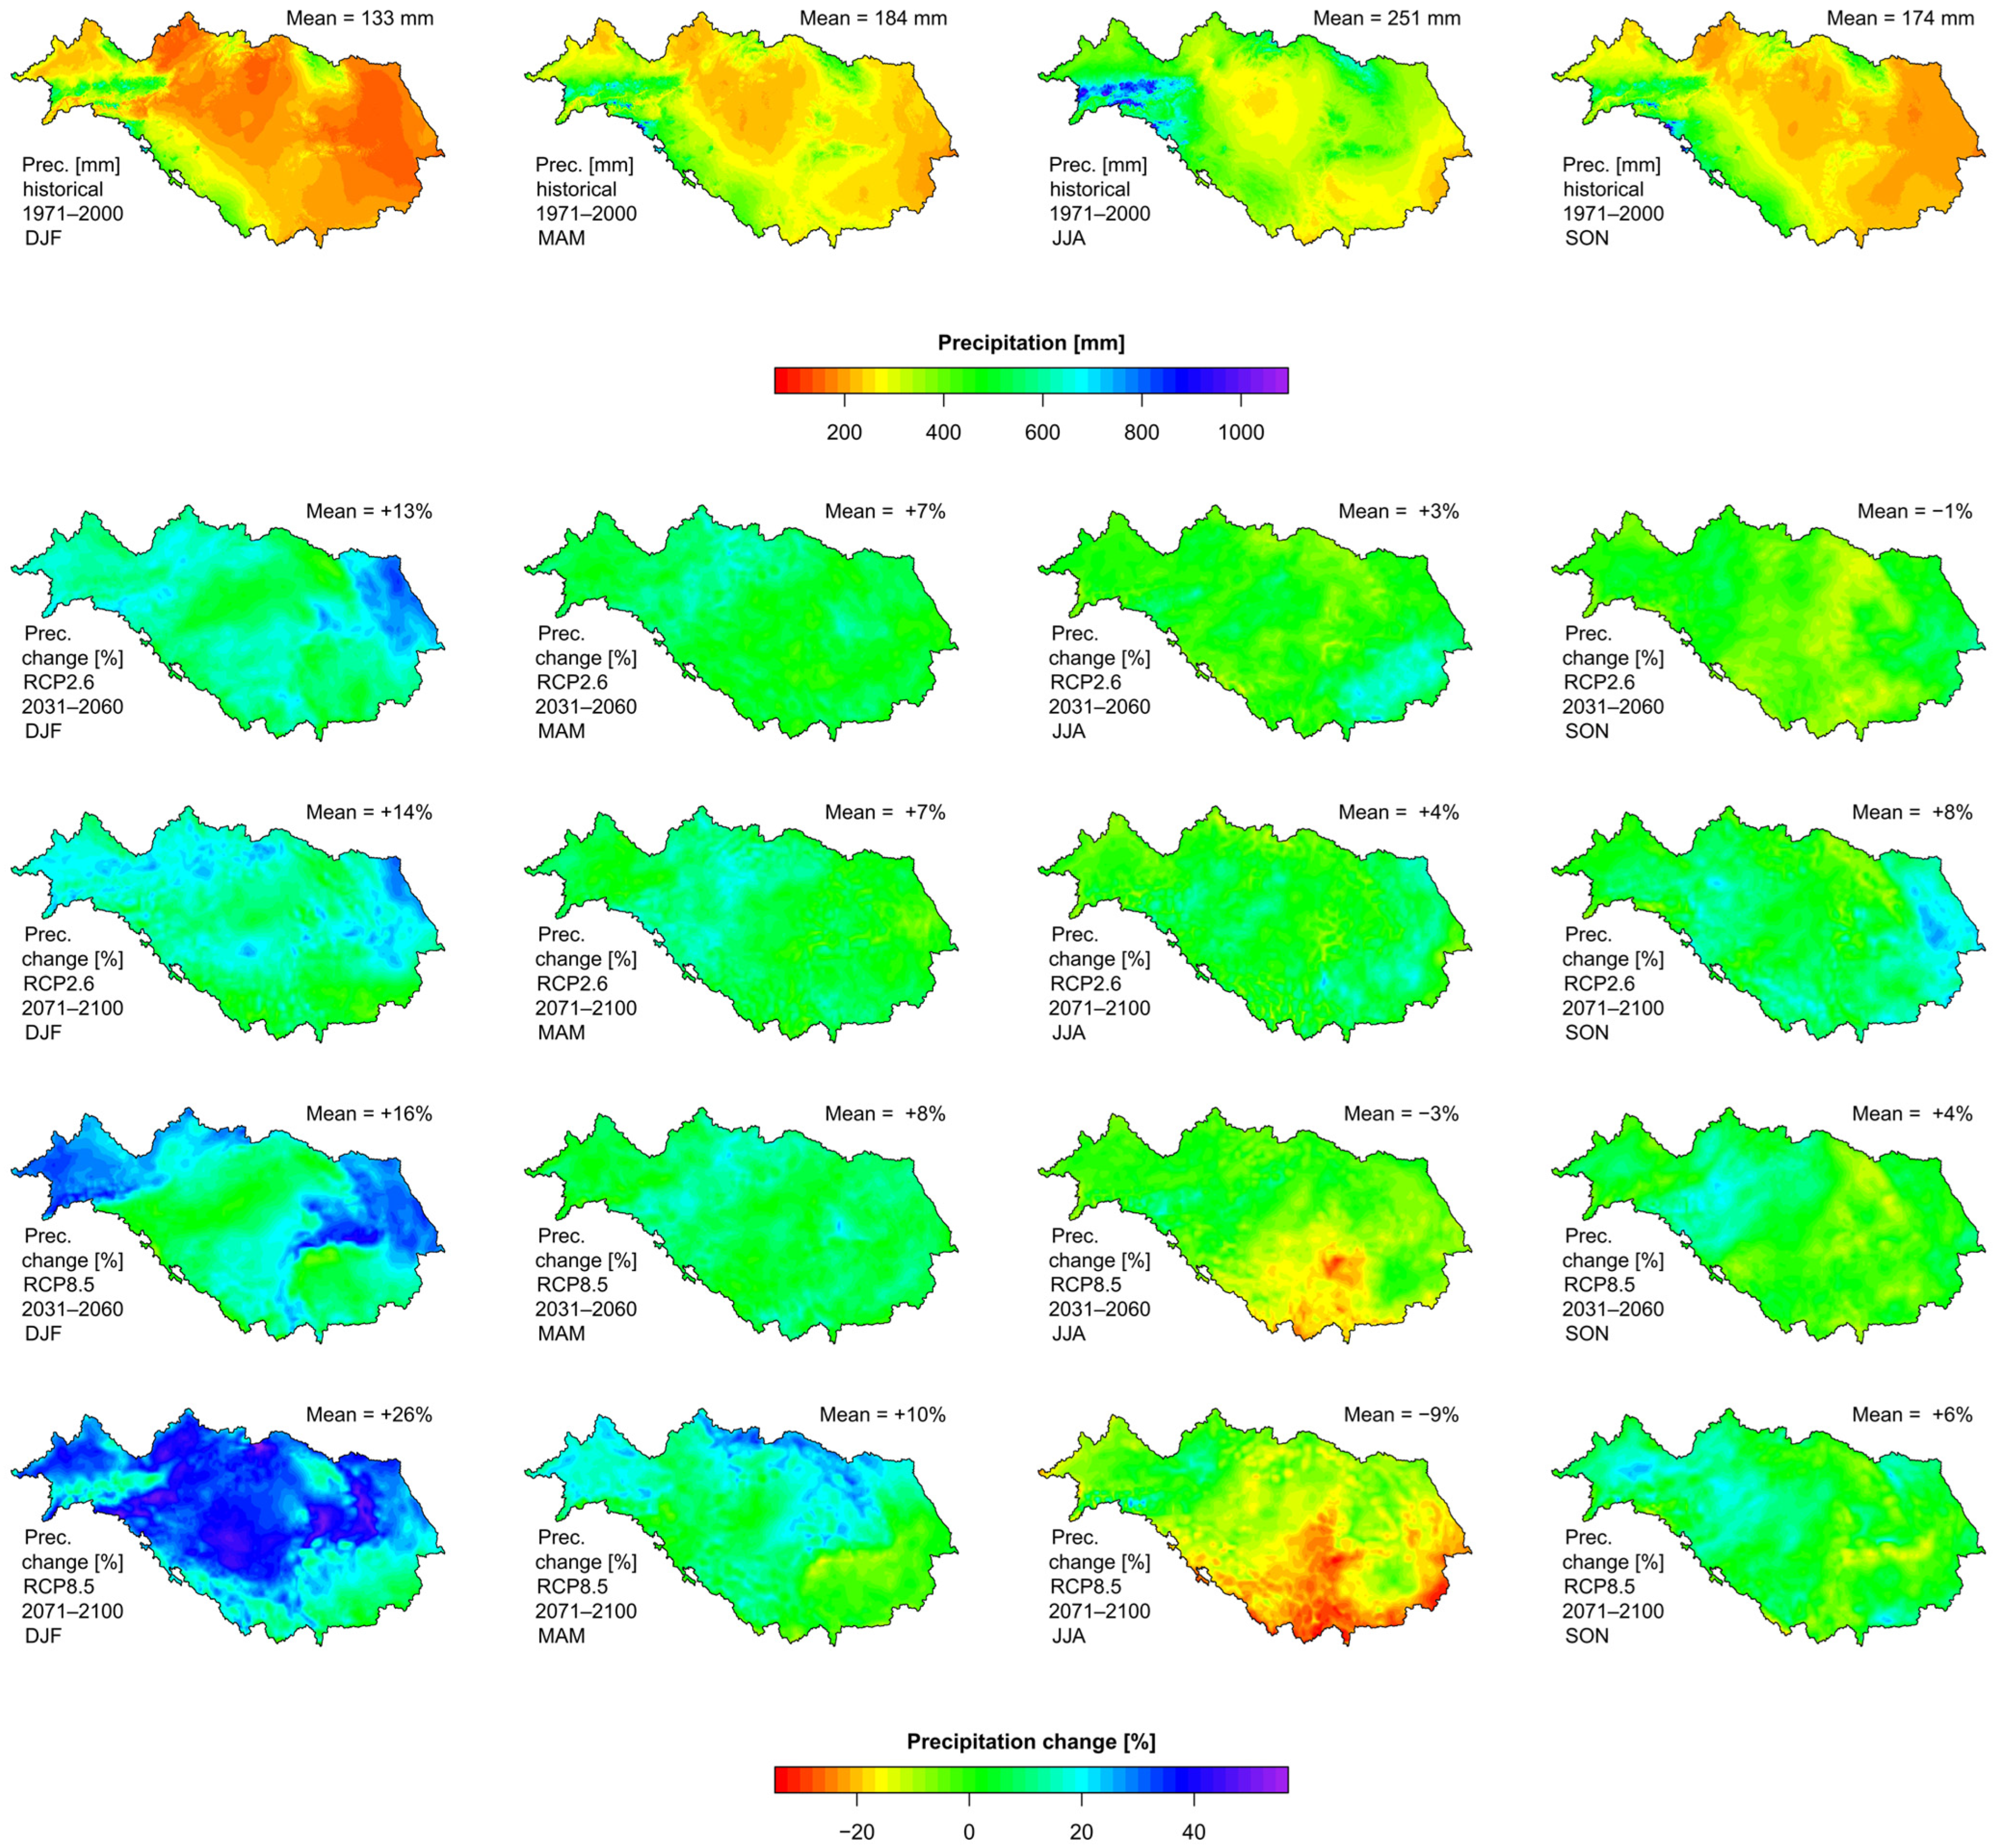
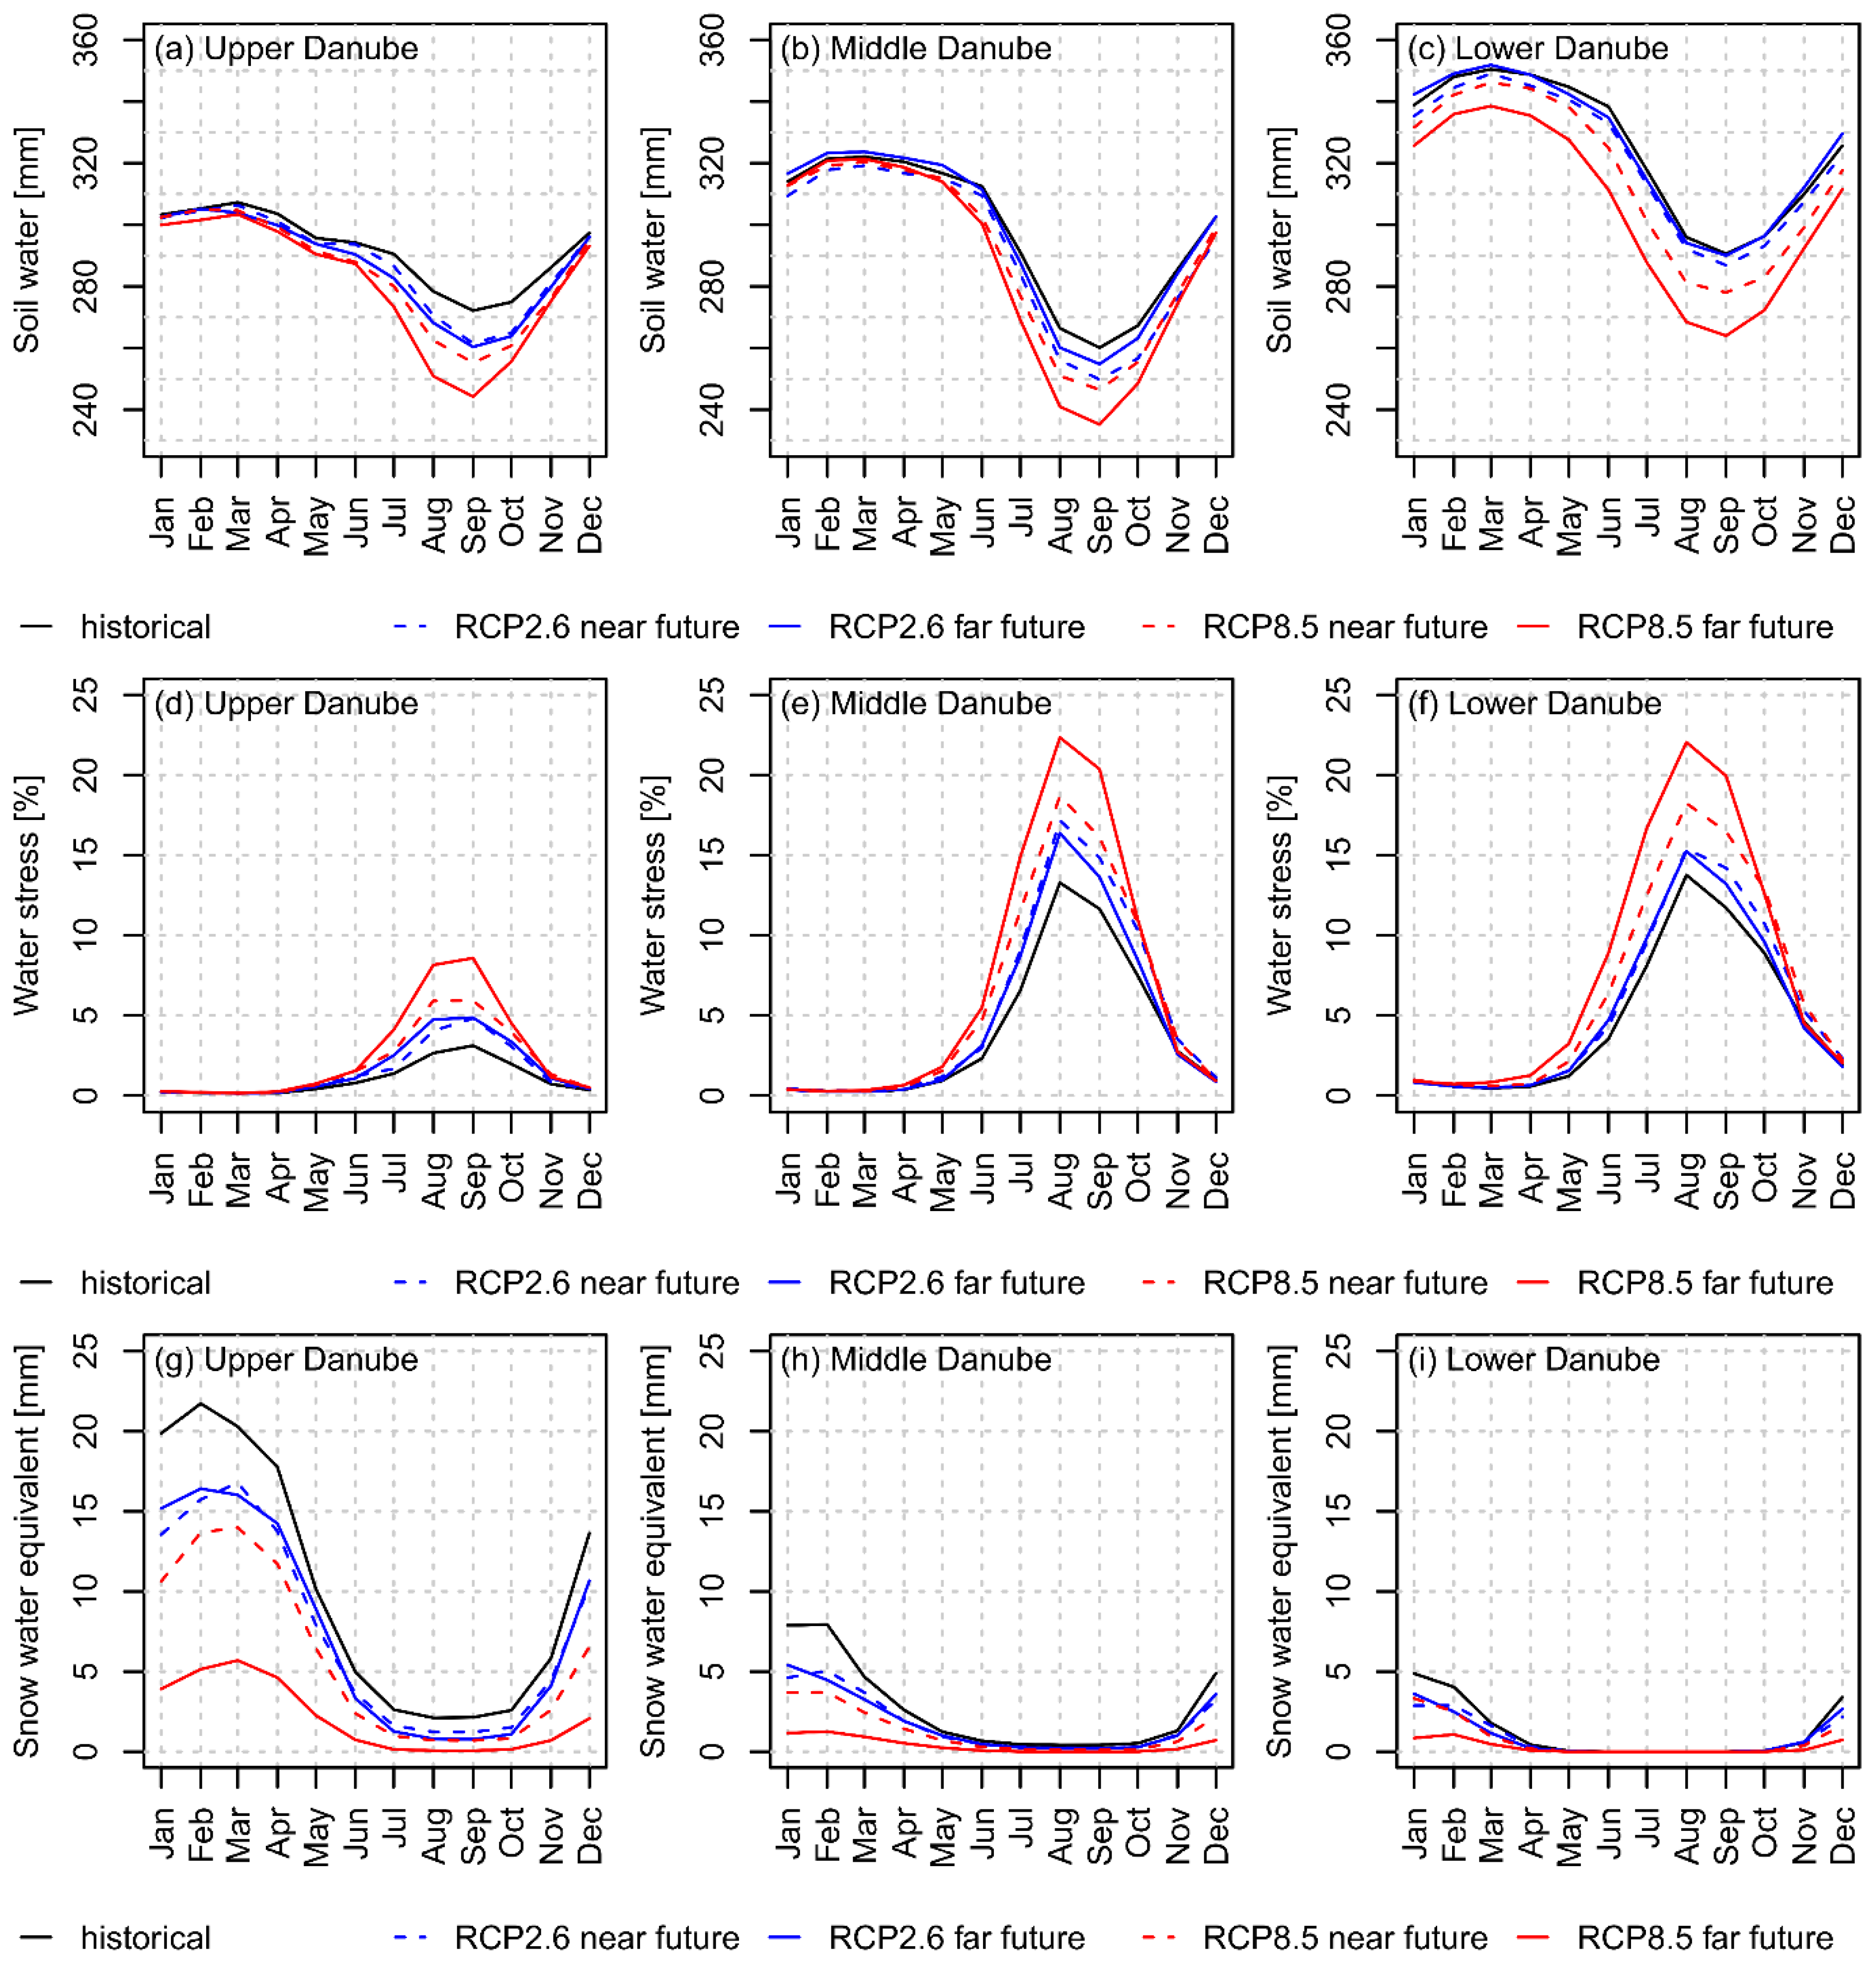
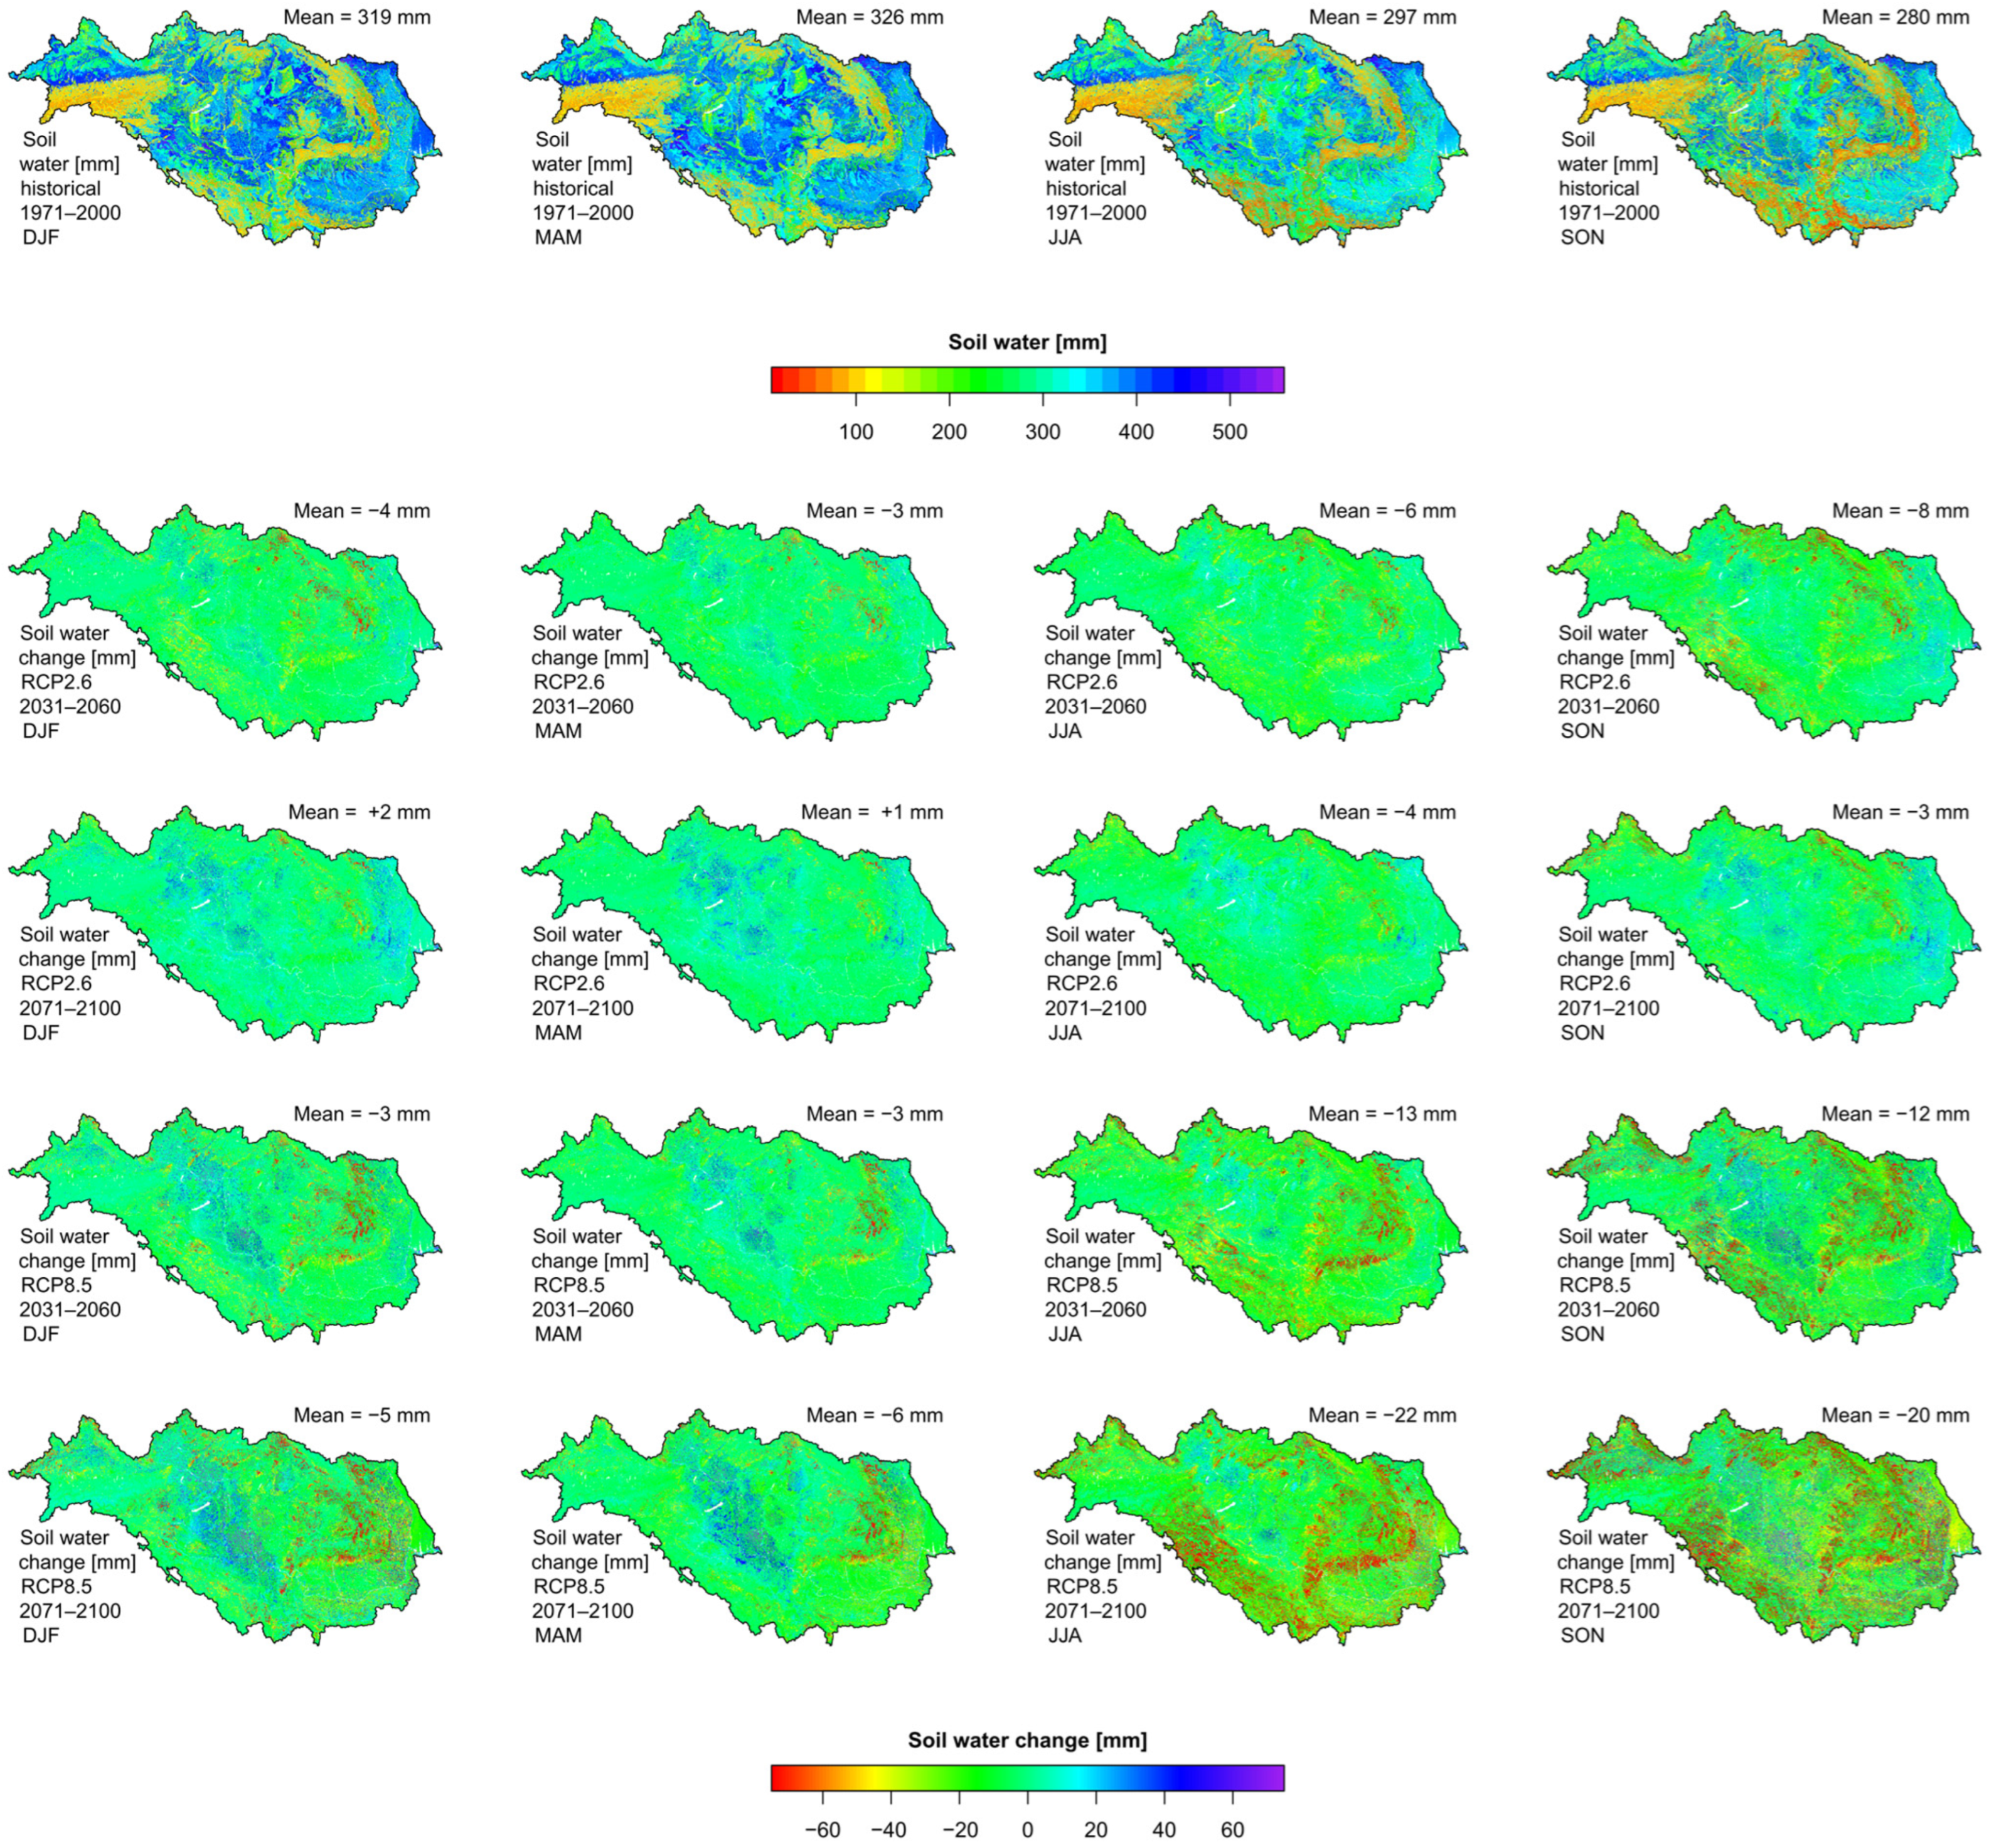
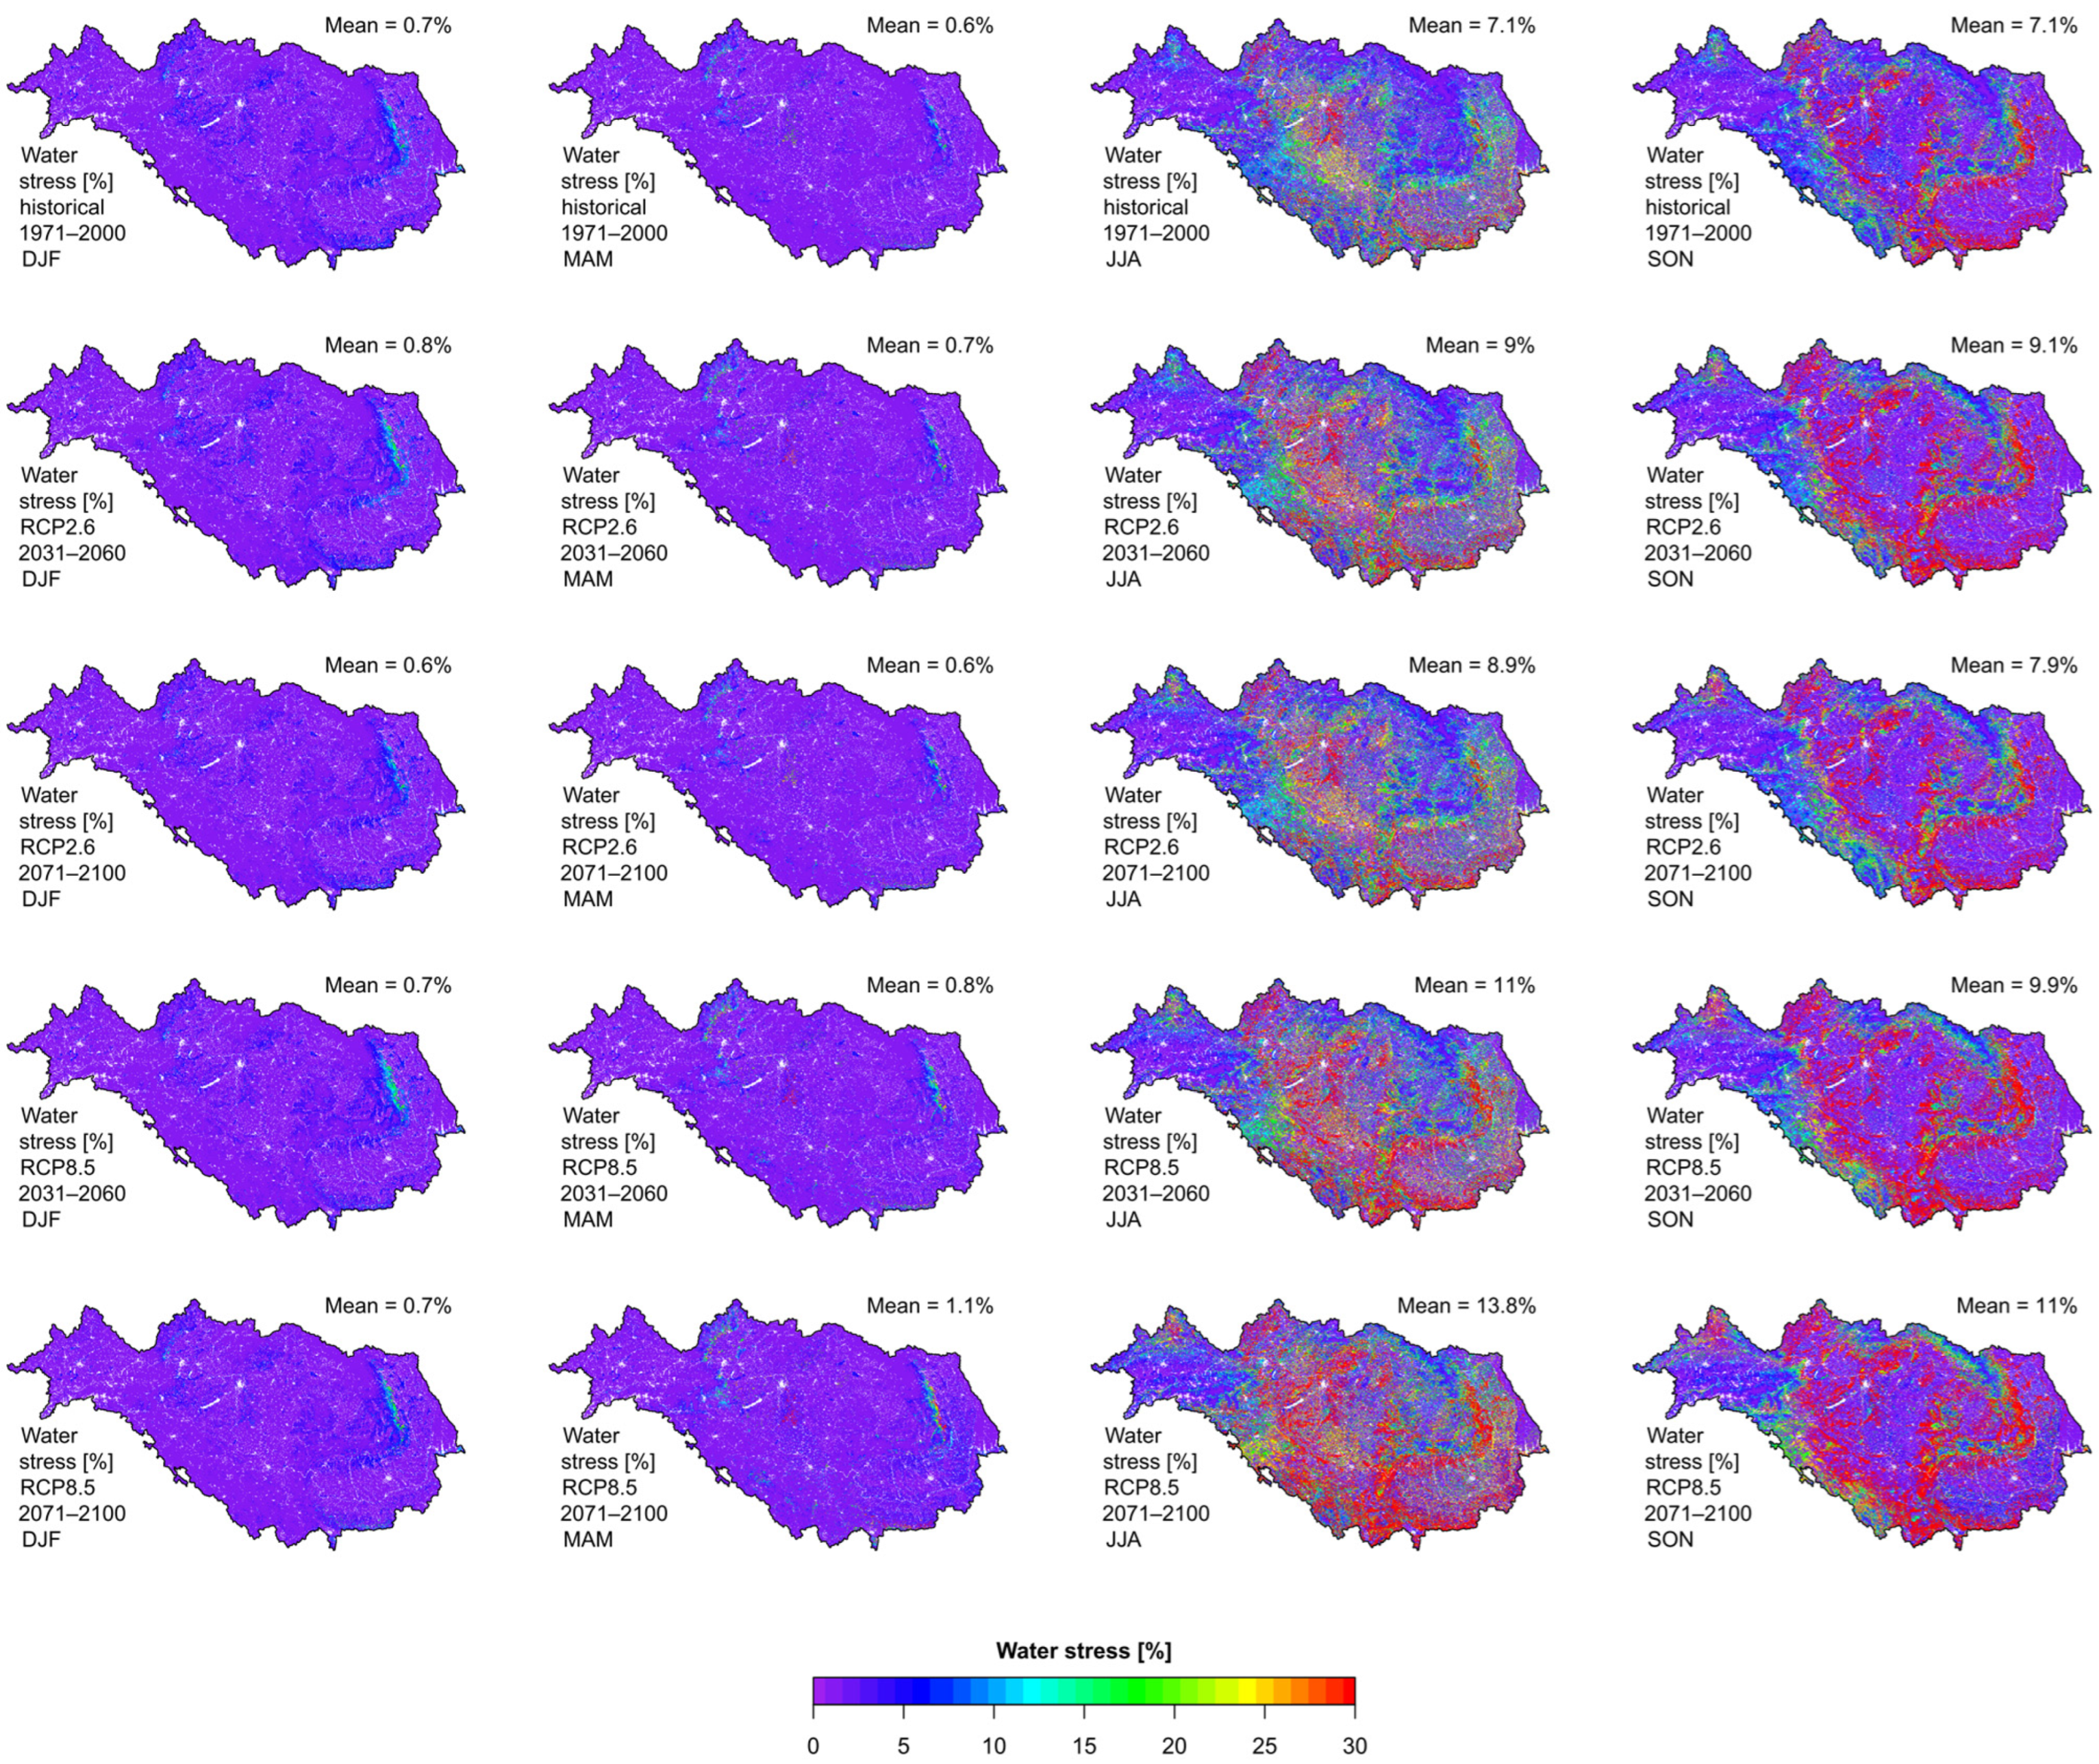
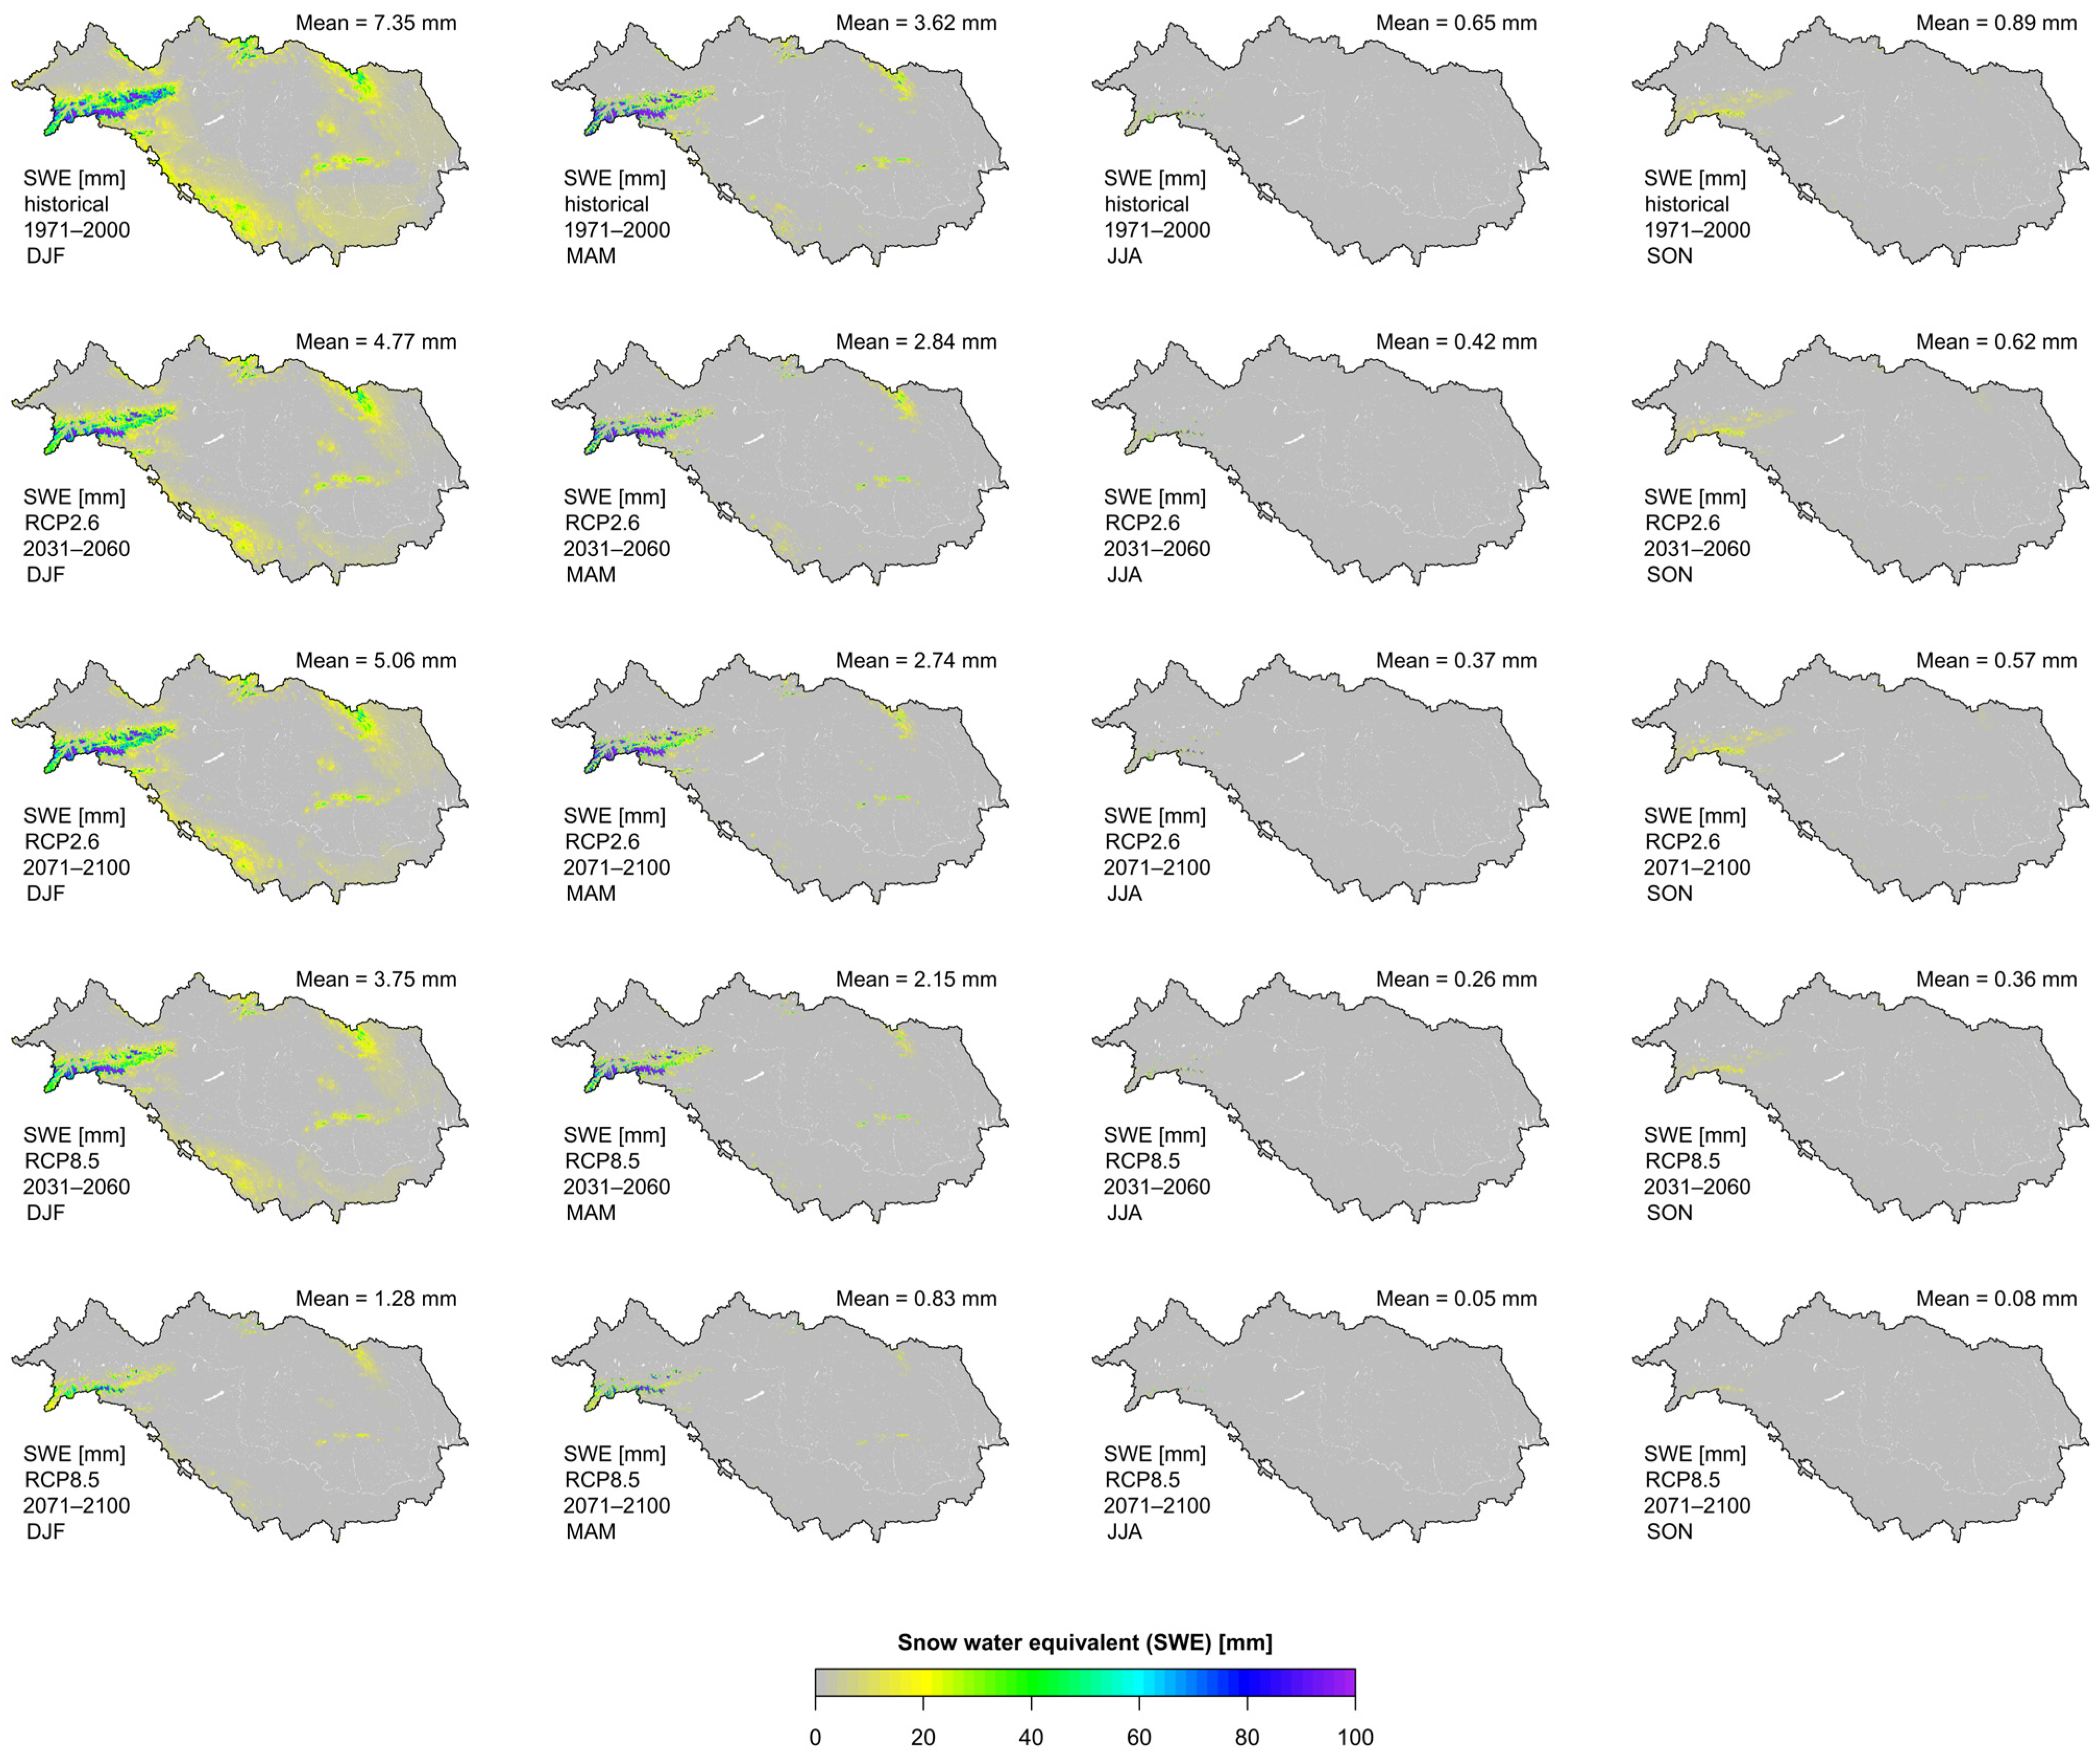
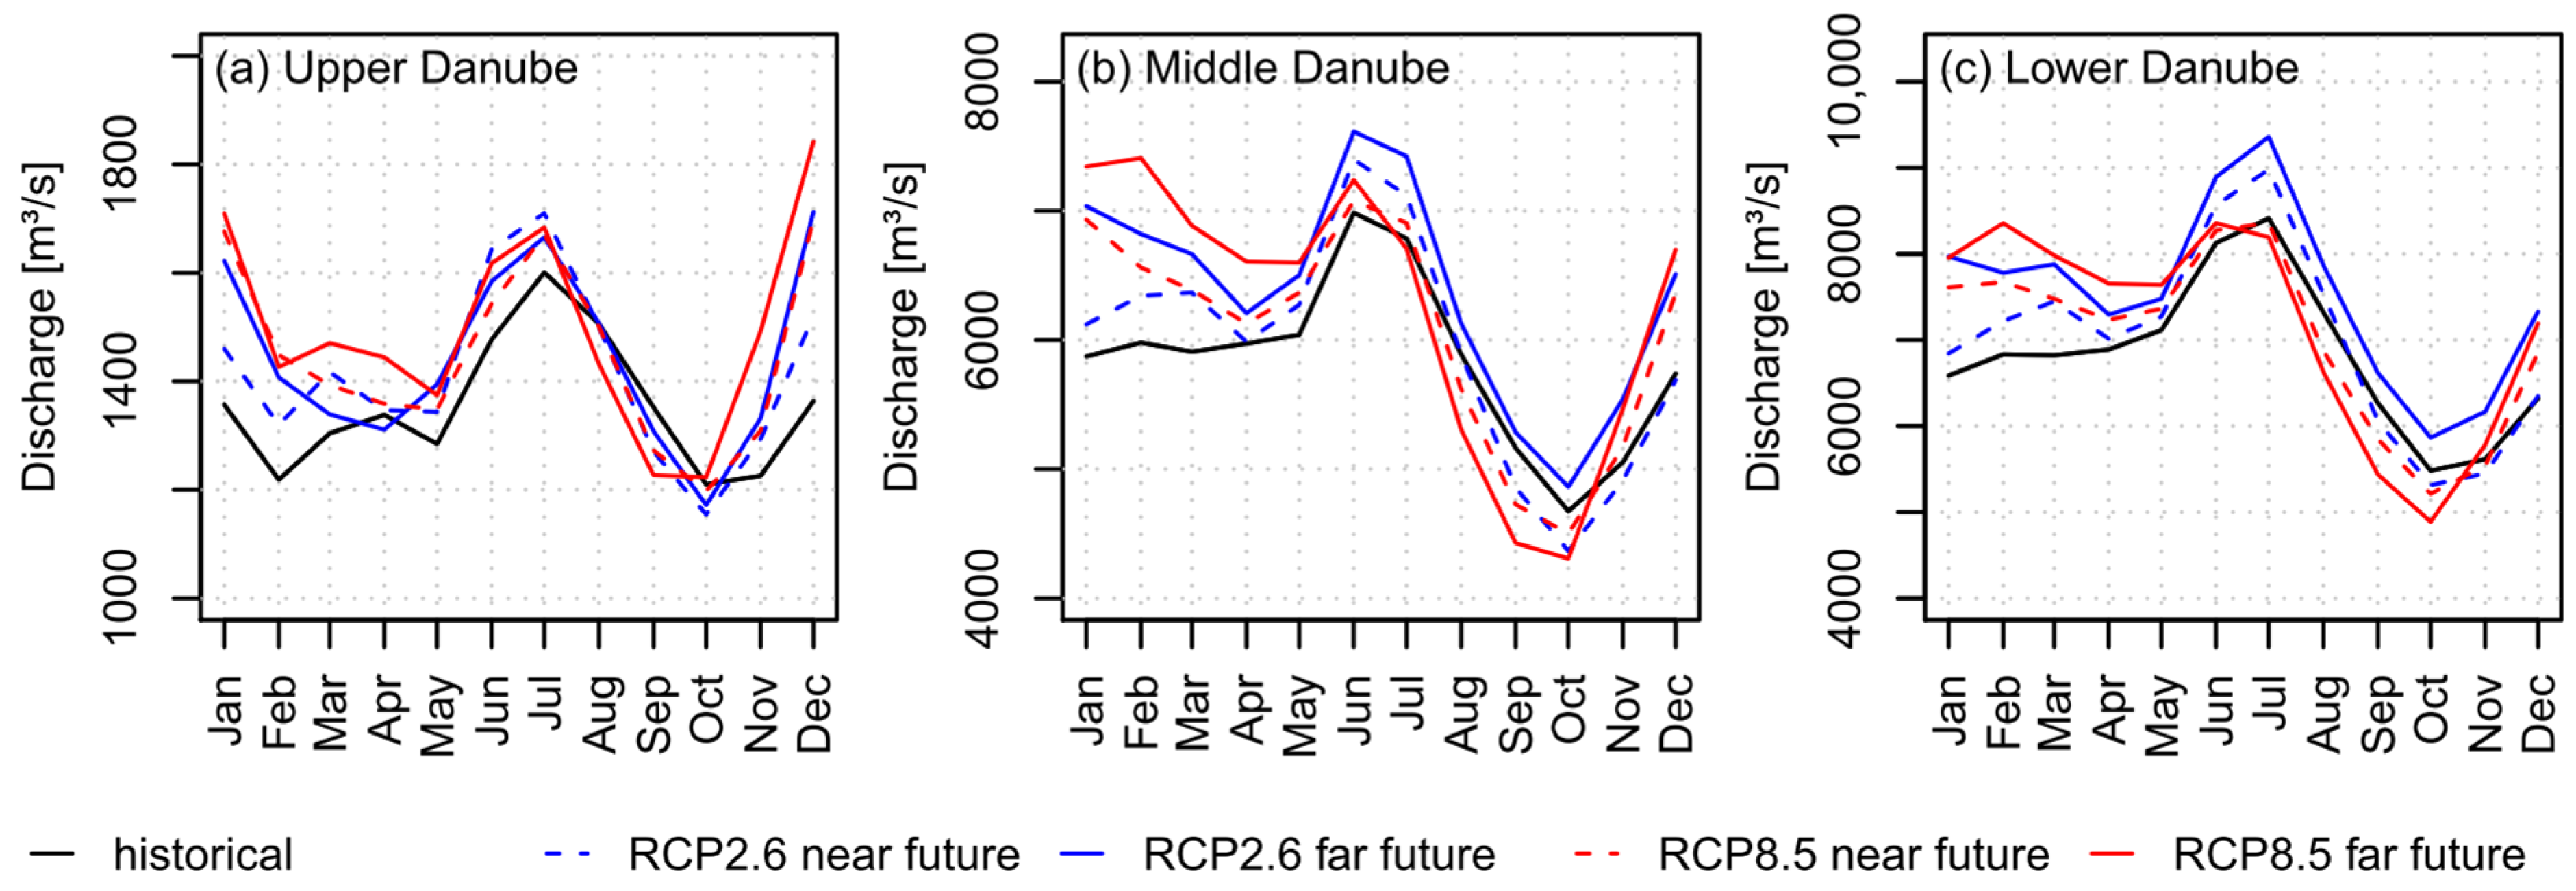
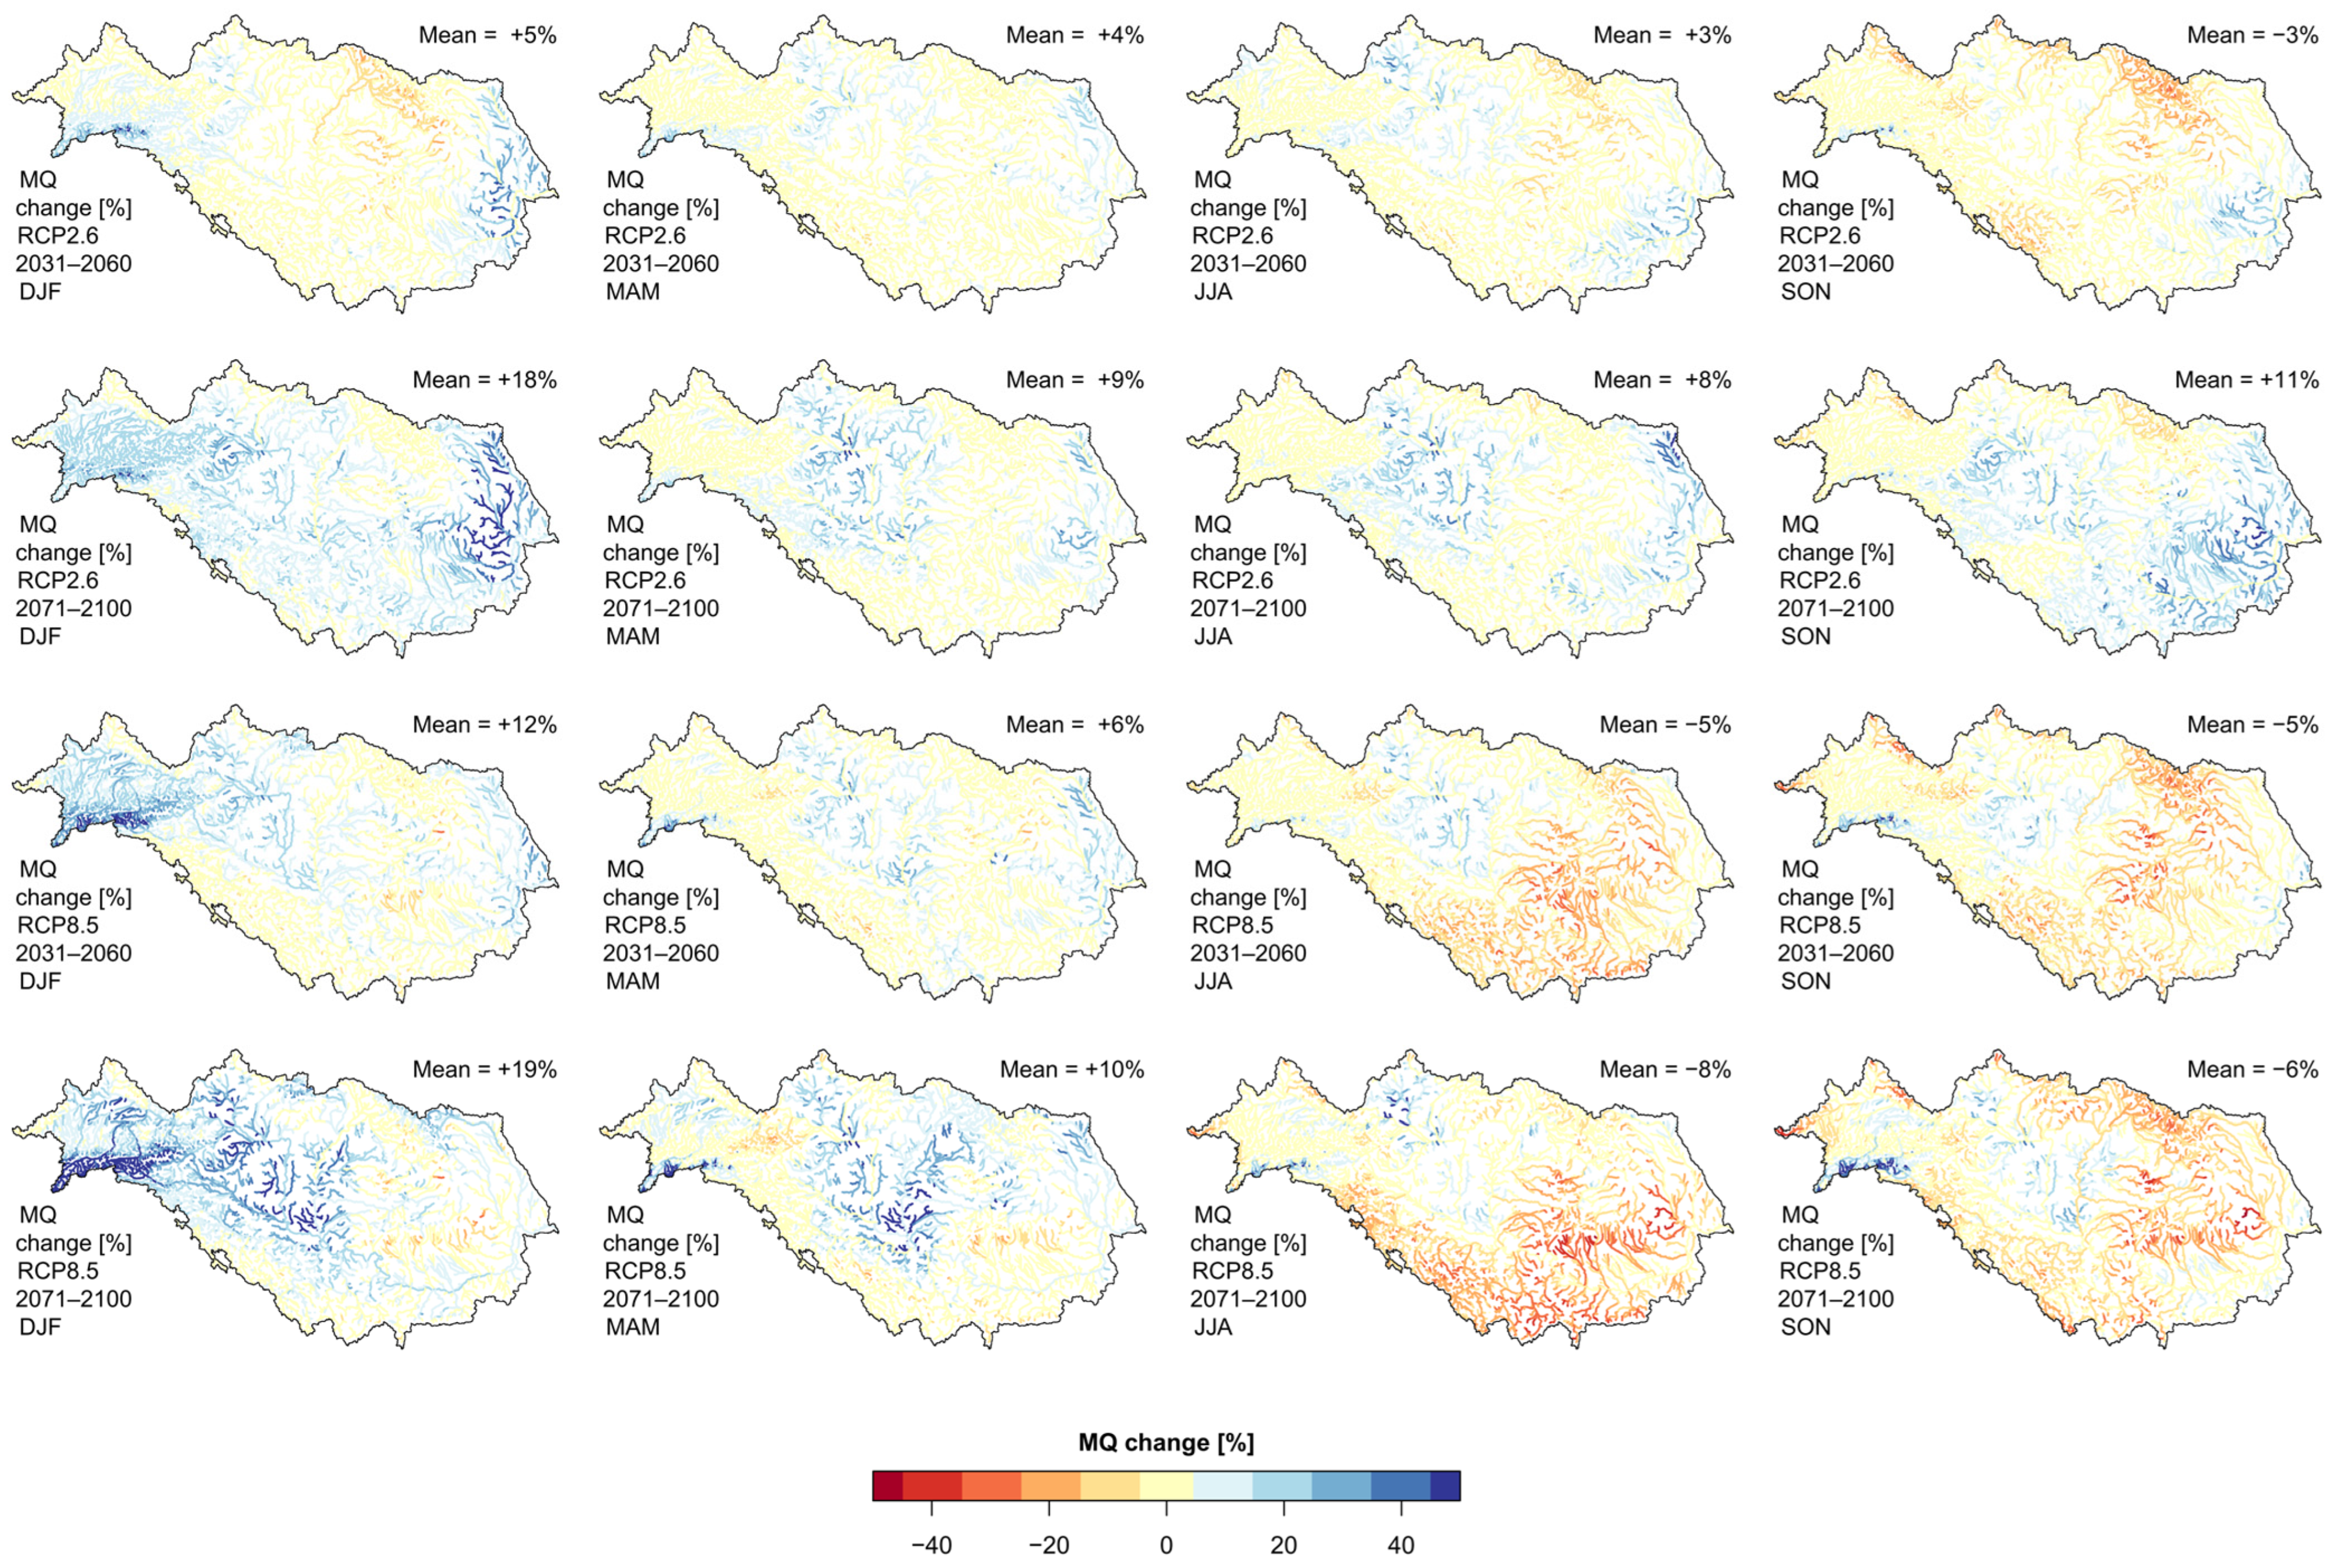
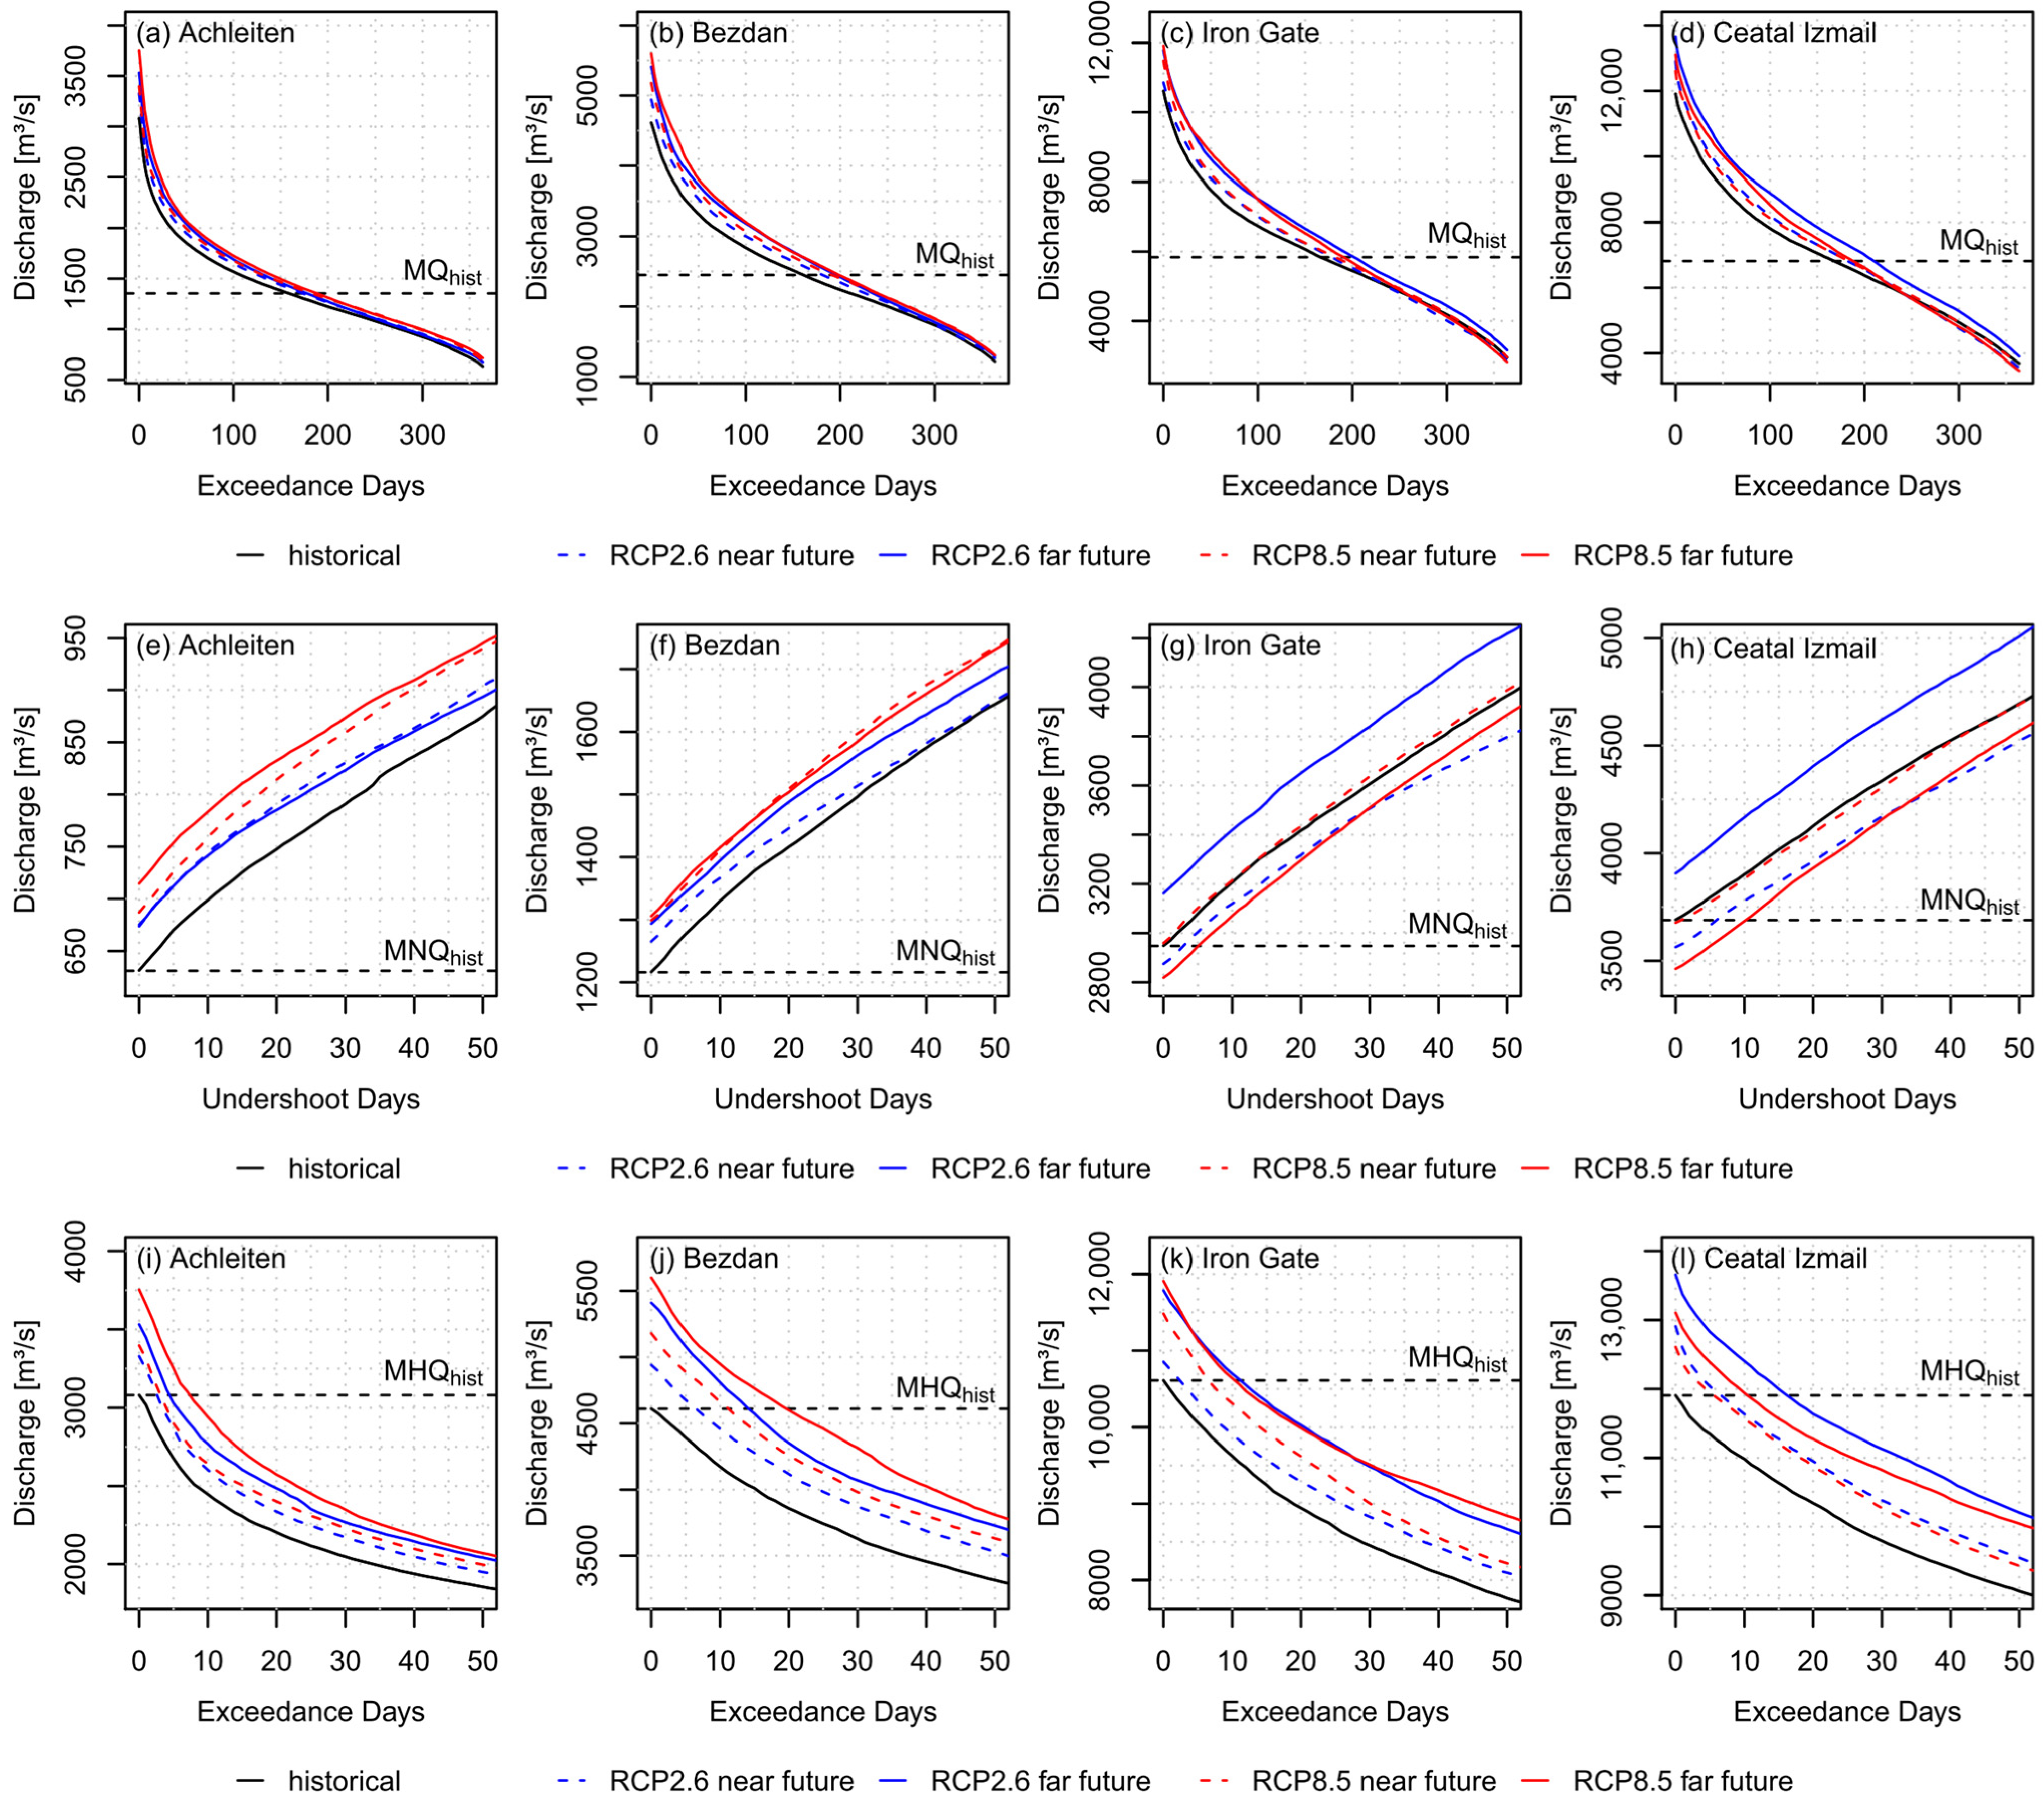
Table 1.
Main morphological and hydrographic characteristics of the Upper, Middle and Lower Danube (data sources: Schiller et al. [26], Regionale Zusammenarbeit der Donauländer (RZD) [35], Farr et al. [27] and Global Runoff Data Centre (GRDC) [29]).
| Characteristics | Upper Danube | Middle Danube | Lower Danube |
|---|---|---|---|
| Major geomorphological units (not exhaustive) | Swabian/Franconian Alb, Bavarian Forest, Bohemian–Moravian Highland, Alpine Foreland, Northern Calcareous and Central Alps | Carpathians, Carnic Alps, Karawanks, Julian Alps, Dinarides, Pannonian Basin, Transylvanian Plateau | Carpathians, Balkans, Romanian/Bulgarian Plain, Dobrogea Hills, Moldavian Plateau |
| Terrain height range [m a.s.l.] | 303–3676 | 35–3449 | −2–2683 |
| Sub region area [km2] | 76,653 | 576,232 | 807,000 |
| Major tributary rivers (>20,000 km2 basin area) | Inn | Morava, Drava, Tisza, Sava, Velika Morava, | Olt, Siret, Prut |
| Outlet gauge | Achleiten | Iron Gate/Orsova | Ceatal Izmail |
| 287.7 | 44.0 | 0.6 |
| 2223 | 955 | 72 |
| 1417 | 5430 | 6401 |
| 659 | 2075 | 3045 |
| 3821 | 10,636 | 11,104 |
Notes: * MQ: mean flow; MNQ: mean low flow; MHQ: mean high flow. ** Orsova: MQ, MNQ, MHQ are calculated for 1971–1990, due to end of records in 1990.
Table 2.
Changes in the long-term mean annual and seasonal temperature [°C] and precipitation [%] on spatial average for the Upper, Middle and Lower Danube as well as for the Danube overall according to the GCM-RCM-driven simulations (ensemble mean) under RCP2.6 and RCP8.5 for the near future (2031–2060) and the far future (2071–2100) compared to the historical GCM-RCM-driven simulations (ensemble mean, 1971–2000).
| Temperature [°C] | Precipitation [%] | |||||||
|---|---|---|---|---|---|---|---|---|
| Emission Scenario | Upper Danube | Middle Danube | Lower Danube | Danube Overall | Upper Danube | Middle Danube | Lower Danube | Danube Overall |
| RCP2.6 (2031–2060) | ||||||||
| Annual | +1.3 | +1.2 | +1.3 | +1.2 | +4.6% | +3.7% | +6.5% | +4.5% |
| DJF * | +1.5 | +1.4 | +1.6 | +1.5 | +13.4% | +11.7% | +15.0% | +12.6% |
| MAM * | +1.2 | +1.2 | +1.4 | +1.3 | +6.4% | +7.2% | +5.6% | +6.7% |
| JJA * | +1.2 | +1.1 | +1.1 | +1.1 | +1.1% | +0.6% | +6.6% | +2.1% |
| SON * | +1.3 | +1.1 | +1.0 | +1.1 | +1.4% | −1.6% | +1.1% | −0.7% |
| RCP2.6 (2071–2100) | ||||||||
| Annual | +1.2 | +1.2 | +1.3 | +1.2 | +5.5% | +7.1% | +8.6% | +7.2% |
| DJF | +1.3 | +1.4 | +1.5 | +1.4 | +16.7% | +12.9% | +11.8% | +13.2% |
| MAM | +1.2 | +1.4 | +1.6 | +1.4 | +5.4% | +8.6% | +4.7% | +7.3% |
| JJA | +1.1 | +1.0 | +1.0 | +1.0 | −0.1% | +3.3% | +7.8% | +3.8% |
| SON | +1.1 | +0.9 | +0.9 | +0.9 | +5.3% | +6.6% | +12.5% | +7.6% |
| RCP8.5 (2031–2060) | ||||||||
| Annual | +2.1 | +2.2 | +2.3 | +2.2 | +7.1% | +5.1% | +2.8% | +4.9% |
| DJF | +2.6 | +2.5 | +2.5 | +2.5 | +26.6% | +13.3% | +16.9% | +15.9% |
| MAM | +1.9 | +2.2 | +2.4 | +2.2 | +5.5% | +8.6% | +8.2% | +8.1% |
| JJA | +2.0 | +2.1 | +2.3 | +2.2 | +0.2% | −1.9% | −6.5% | −2.6% |
| SON | +2.0 | +2.0 | +2.0 | +2.0 | +3.8% | +4.7% | +1.0% | +3.8% |
| RCP8.5 (2071–2100) | ||||||||
| Annual | +4.2 | +4.2 | +4.4 | +4.3 | +9.8% | +7.0% | +0.4% | +5.9% |
| DJF | +4.6 | +4.7 | +4.8 | +4.7 | +23.8% | +27.3% | +19.8% | +25.3% |
| MAM | +3.8 | +3.9 | +4.3 | +4.0 | +16.2% | +12.0% | +3.9% | +10.7% |
| JJA | +4.3 | +4.4 | +4.8 | +4.5 | −2.4% | −7.4% | −12.6% | −7.9% |
| SON | +4.1 | +3.8 | +3.9 | +3.9 | +11.1% | +6.0% | +2.9% | +6.1% |
Notes: * DJF: December, January, February; MAM: March, April, May; JJA: June, July, August; SON: September, October, November.
Table 3.
Changes in the long-term mean annual and seasonal mean discharge (MQ) [%] in the Danube River Basin and its major sub-basins (at respective gauges in parentheses) according to the GCM-RCM-driven simulations (ensemble mean) under RCP2.6 and RCP8.5 for the near future (2031–2060) and the far future (2071–2100) compared to the historical GCM-RCM-driven simulations (ensemble mean, 1971–2000).
| Emission Scenario | Upper Danube (Achleiten) | Middle Danube (Bezdan) | Drava (Dravasza-bolcs) | Sava (Sremska Mitrovica) | Mures (Nagylak) | Tisza (Senta) | Siret (Lungoci) | Lower Danube (Ceatal Izmail) |
|---|---|---|---|---|---|---|---|---|
| RCP2.6 (2031–2060) | ||||||||
| Annual | +4.6% | +4.8% | +6.4% | −0.9% | −0.8% | −4.0% | +4.4% | +2.8% |
| DJF * | +9.2% | +7.8% | +11.6% | +2.1% | −1.8% | −8.3% | +16.3% | +3.4% |
| MAM * | +4.6% | +5.5% | +7.4% | +0.6% | +5.0% | +2.5% | +9.5% | +4.4% |
| JJA * | +5.9% | +7.9% | +8.9% | −0.3% | −2.8% | −2.5% | −0.8% | +5.1% |
| SON * | −1.8% | −3.1% | −1.9% | −8.0% | −3.3% | −9.3% | +0.5% | −3.1% |
| RCP2.6 (2071–2100) | ||||||||
| Annual | +6.9% | +9.5% | +12.7% | +9.6% | +7.4% | +5.6% | +20.0% | +10.7% |
| DJF | +20.4% | +20.2% | +16.6% | +13.5% | +14.7% | +7.8% | +37.6% | +16.9% |
| MAM | +3.0% | +6.8% | +10.7% | +8.0% | +7.1% | +8.1% | +11.6% | +8.8% |
| JJA | +3.8% | +7.8% | +13.0% | +8.5% | −0.2% | +3.5% | +16.0% | +9.5% |
| SON | +0.6% | +2.8% | +10.9% | +7.4% | +14.9% | +3.3% | +23.9% | +7.4% |
| RCP8.5 (2031–2060) | ||||||||
| Annual | +7.2% | +8.1% | +9.0% | −2.0% | −3.9% | +0.1% | −4.3% | +3.1% |
| DJF | +22.5% | +21.1% | +17.3% | +3.1% | +9.8% | +5.7% | +11.5% | +12.1% |
| MAM | +4.4% | +6.2% | +6.1% | +0.5% | +7.2% | +5.4% | +13.0% | +6.0% |
| JJA | +2.8% | +4.7% | +5.9% | −7.1% | −13.5% | −2.7% | −16.5% | −1.5% |
| SON | −0.2% | +0.0% | +8.1% | −6.7% | −14.1% | −9.2% | −10.6% | −4.4% |
| RCP8.5 (2071–2100) | ||||||||
| Annual | +10.5% | +11.5% | +9.4% | −0.2% | +0.6% | +4.5% | −5.2% | +5.2% |
| DJF | +26.4% | +27.7% | +33.3% | +14.7% | +13.2% | +13.1% | +9.5% | +19.1% |
| MAM | +9.2% | +10.0% | +8.5% | +7.4% | +17.3% | +18.3% | +13.0% | +11.8% |
| JJA | +3.3% | +6.2% | +0.8% | −16.7% | −11.1% | −3.5% | −14.7% | −2.9% |
| SON | +4.1% | +2.0% | +0.6% | −11.9% | −11.5% | −10.8% | −17.1% | −7.2% |
Notes: * DJF: December, January, February; MAM: March, April, May; JJA: June, July, August; SON: September, October, November.
Disclaimer/Publisher’s Note: The statements, opinions and data contained in all publications are solely those of the individual author(s) and contributor(s) and not of MDPI and/or the editor(s). MDPI and/or the editor(s) disclaim responsibility for any injury to people or property resulting from any ideas, methods, instructions or products referred to in the content. |
© 2022 by the authors. Licensee MDPI, Basel, Switzerland. This article is an open access article distributed under the terms and conditions of the Creative Commons Attribution (CC BY) license (https://creativecommons.org/licenses/by/4.0/).
Share and Cite
MDPI and ACS Style
Probst, E.; Mauser, W. Climate Change Impacts on Water Resources in the Danube River Basin: A Hydrological Modelling Study Using EURO-CORDEX Climate Scenarios. Water 2023, 15, 8. https://doi.org/10.3390/w15010008
AMA Style
Probst E, Mauser W. Climate Change Impacts on Water Resources in the Danube River Basin: A Hydrological Modelling Study Using EURO-CORDEX Climate Scenarios. Water. 2023; 15(1):8. https://doi.org/10.3390/w15010008
Chicago/Turabian StyleProbst, Elisabeth, and Wolfram Mauser. 2023. "Climate Change Impacts on Water Resources in the Danube River Basin: A Hydrological Modelling Study Using EURO-CORDEX Climate Scenarios" Water 15, no. 1: 8. https://doi.org/10.3390/w15010008
Note that from the first issue of 2016, this journal uses article numbers instead of page numbers. See further details here.