Article

Origin of Groundwater Salinity in the Draa Sfar Polymetallic Mine Area Using Conservative Elements (Morocco)

by
Anasse Ait Lemkademe
1,2,*,
Jean-Luc Michelot
1,
Abdelfattah Benkaddour
3,
Lahoucine Hanich
3 and
Ouissal Heddoun
2
1
Lab. Géosciences Paris-Saclay, Paris-Saclay University, 91400 Orsay, France
2
Geology and Sustainable Mining Institute, Mohammed VI Polytechnic University, Benguerir 43150, Morocco
3
Lab. Géoressources, Cadi Ayyad University, Marrakech 40001, Morocco
*
Author to whom correspondence should be addressed.
Water 2023, 15(1), 82; https://doi.org/10.3390/w15010082
Submission received: 22 November 2022 / Revised: 15 December 2022 / Accepted: 20 December 2022 / Published: 26 December 2022
(This article belongs to the Special Issue Advances on the Dynamics of Groundwater Salinization)

Abstract

:
In the Marrakech region of Morocco, where water resources are particularly limited, excessive salinity has been measured in the water from some wells intended for human consumption and irrigation. Moreover, the start-up of a mine for the exploitation of a polymetallic sulfide deposit and the progress of the exploitation work have revealed the existence of very saline deep groundwater with a total mineralization of over 80 g/L. The hydrogeochemical study using conservative elements has helped to understand the origin of the groundwater salinity in the Draa Sfar mine and to assess the contribution of the deep salinity source to the high salinities observed in the mine. The groundwater of the shallow aquifer shows almost constant Br/Cl and Na+/Cl ratios, independent of the chloride content. The constant ratios of these conservative elements indicate a single autochthonous origin of Cl, Br and Na+, and groundwater salinity is diluted by recharge water containing low concentrations of these elements. Regarding the mine groundwater, the high Li+/Cl ratio and Br/Cl ratios in the range measured on the leachates of the rocks extracted from the mine indicate that the pore water is the reservoir for dissolved chloride and the salinity of the mine’s groundwater results from a mixture between these pore waters and fresh meteoric water that seeps in from the surface and recharges the entire aquifer. This porewater would be a remnant of the hydrothermal fluids that formed the sulfide deposit.

1. Introduction

In the Marrakech region, where water resources are particularly limited, excessive salinity has been measured in the water of some wells intended for human consumption and irrigation [1]. These boreholes are implanted in Plioquaternary sediments, but due to the limited thickness of this Plioquaternary layer, they could reach the underlying bedrock schists through an altered layer. On the other hand, the start-up of a mine to exploit a polymetallic sulfide deposit in these shales and the progress of the exploitation work have revealed the existence of very saline deep aquifers with a total mineralization of more than 80 g/L. The presence of highly concentrated Na-Ca-Cl solutions in crystalline and metamorphic basements is not uncommon. Their origin is controversial, and several explanations have been proposed, which can be grouped according to two main hypotheses: the intervention of rock-internal sources such as water–rock interactions and/or the intervention of external sources such as brine from sediments or hydrothermal processes.
Therefore, an origin of water mineralization through fluid–silicate–mineral interactions has been proposed by [2,3,4,5] to explain the high salinity of groundwater in the Canadian Shield. Water–rock interactions have also been suggested as the origin of the saline water encountered in the two KTB boreholes in the Bohemian Massif, Germany [6] and in the Carnemellis granite [7]. Ref. [8] proposed fluid inclusions as the origin of saline water in the Stripa granite in Sweden and showed that the maximum amount of chloride that could be released into groundwater by the release of fluid inclusions would be 20 g/L. However, this requires extremely restrictive conditions, such as low porosity and low water renewal. Mass balance calculations [9] performed on various granite massifs show that fluid inclusion release cannot be the main source of salinity when it is high in deep waters. The authors of [10] explain the brines within the Siberian platform as the result of a long process of water–rock interactions, while chloride-calcium brines originate from buried bittern connate waters.
In contrast, [11] or [12] identified ancient evaporated seawater as the origin of the Canadian Shield brines. The same origin has been attributed to the brines of the Siberian platform in Russia [13], both the saline waters of the Vienne granite system [14] and the crystalline Armorican basement [15] in France, and those found in the Precambrian basement of Asp, Sweden [16]. In siliciclastic rocks of the Ibbenbren Carboniferous in Germany, [17] showed that halite dissolution is the most common source of groundwater salinity. However, even when considering seawater as a precursor to chloride solutions, these authors do not minimize the importance of water–rock interactions in explaining the concentrations of certain elements, such as the high bromide concentrations in the groundwater of the Siberian platform, the calcium concentrations in the groundwater of the Canadian Shield, and the 87Sr/86Sr ratios of the Ibbenbren Carboniferous rock.
Saline groundwater near sulfide deposits has been identified in a Zn mine in the Atacama Desert in Chile [18] and in Zn and Pb mines in Canada (Restigouche, Bathurst Mining Camp and Northern New Brunswick) [19]. In the case of the Canadian mines, the dominant ions are still sodium and chloride, but nevertheless, the Restigouche brines are relatively less mineralized (with a TDS of 21 g/L) than those of Bathurst Mining Camp and Northern New Brunswick (TDS between 22 g/L and 45g/L). In the Canadian deposits, water mineralization was associated with water–rock interactions. In the case of the Atacama mine, however, mixing with deeper, more saline water could explain the high water concentrations and examine the possible contribution of the deep salinity source that will have been determined in the mine to the high salinities found in the shallow Plio-Quaternary aquifer observed near the mine.
The aim of the present work is to understand the origin of the groundwater salinity in the Draa Sfar mine and to investigate the potential contribution of the deep salinity source that will have been characterized in the mine to the high salinities observed in the shallow Plio-Quaternary aquifers around the mine.

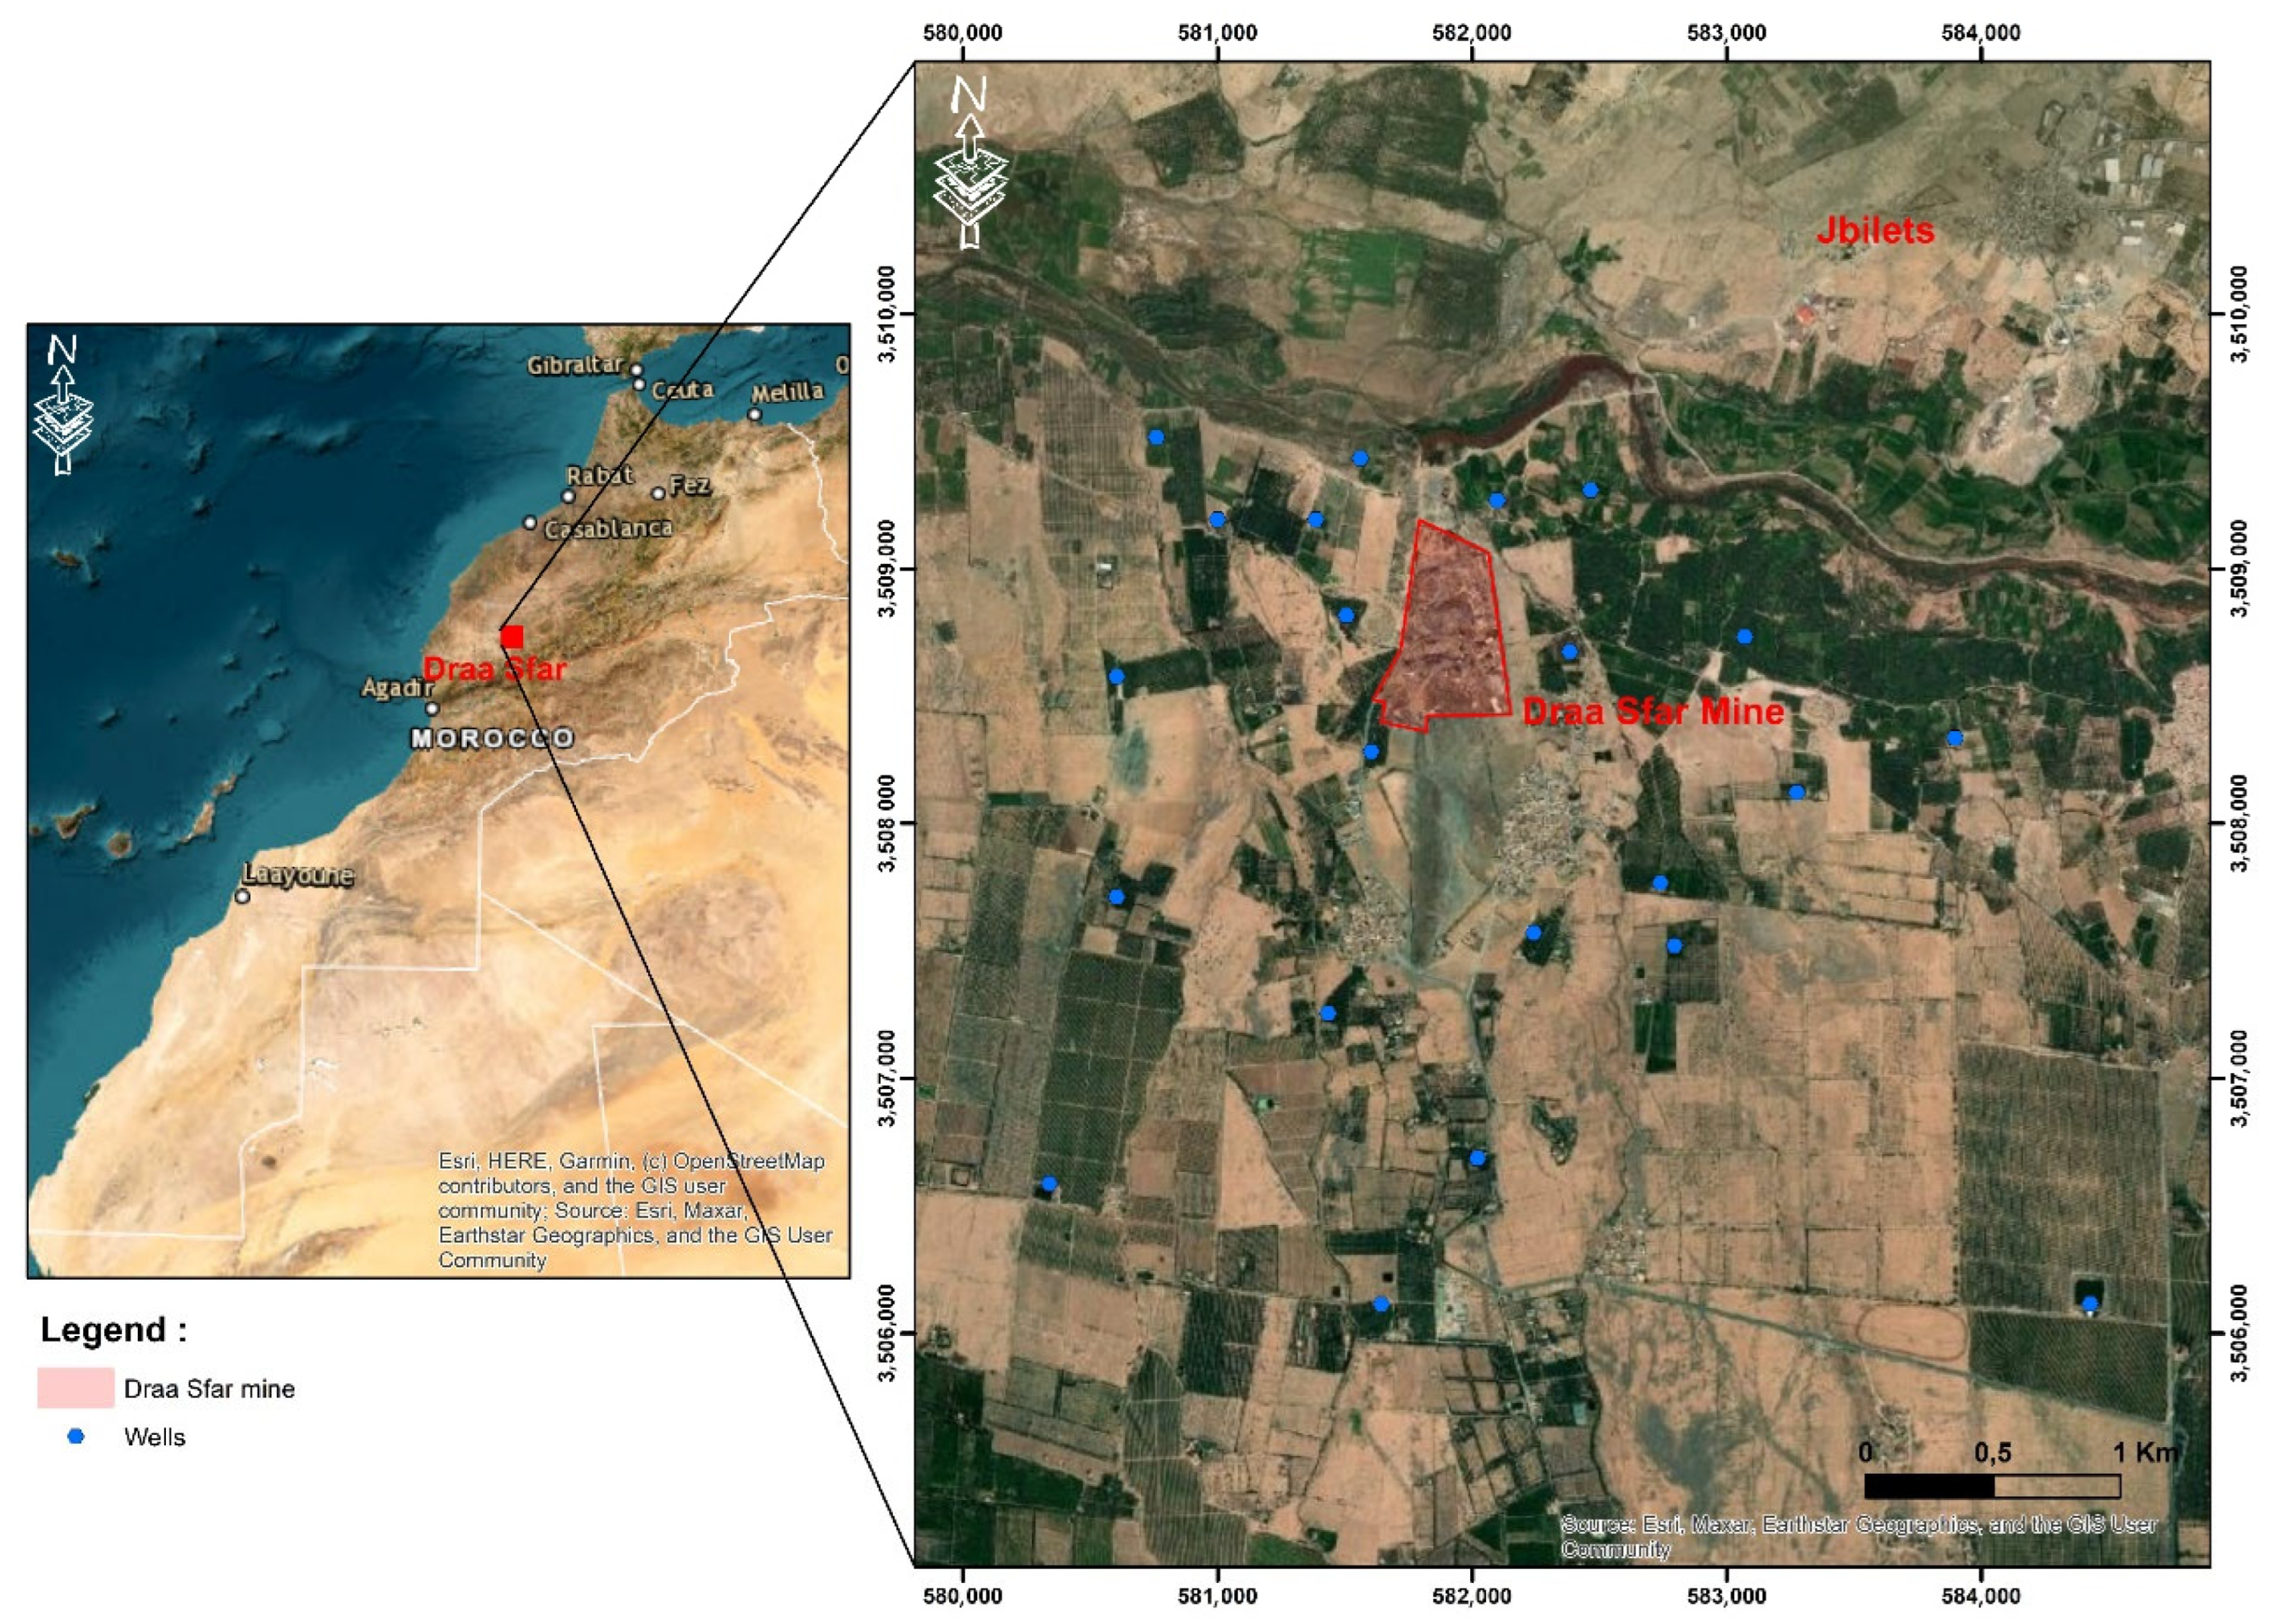
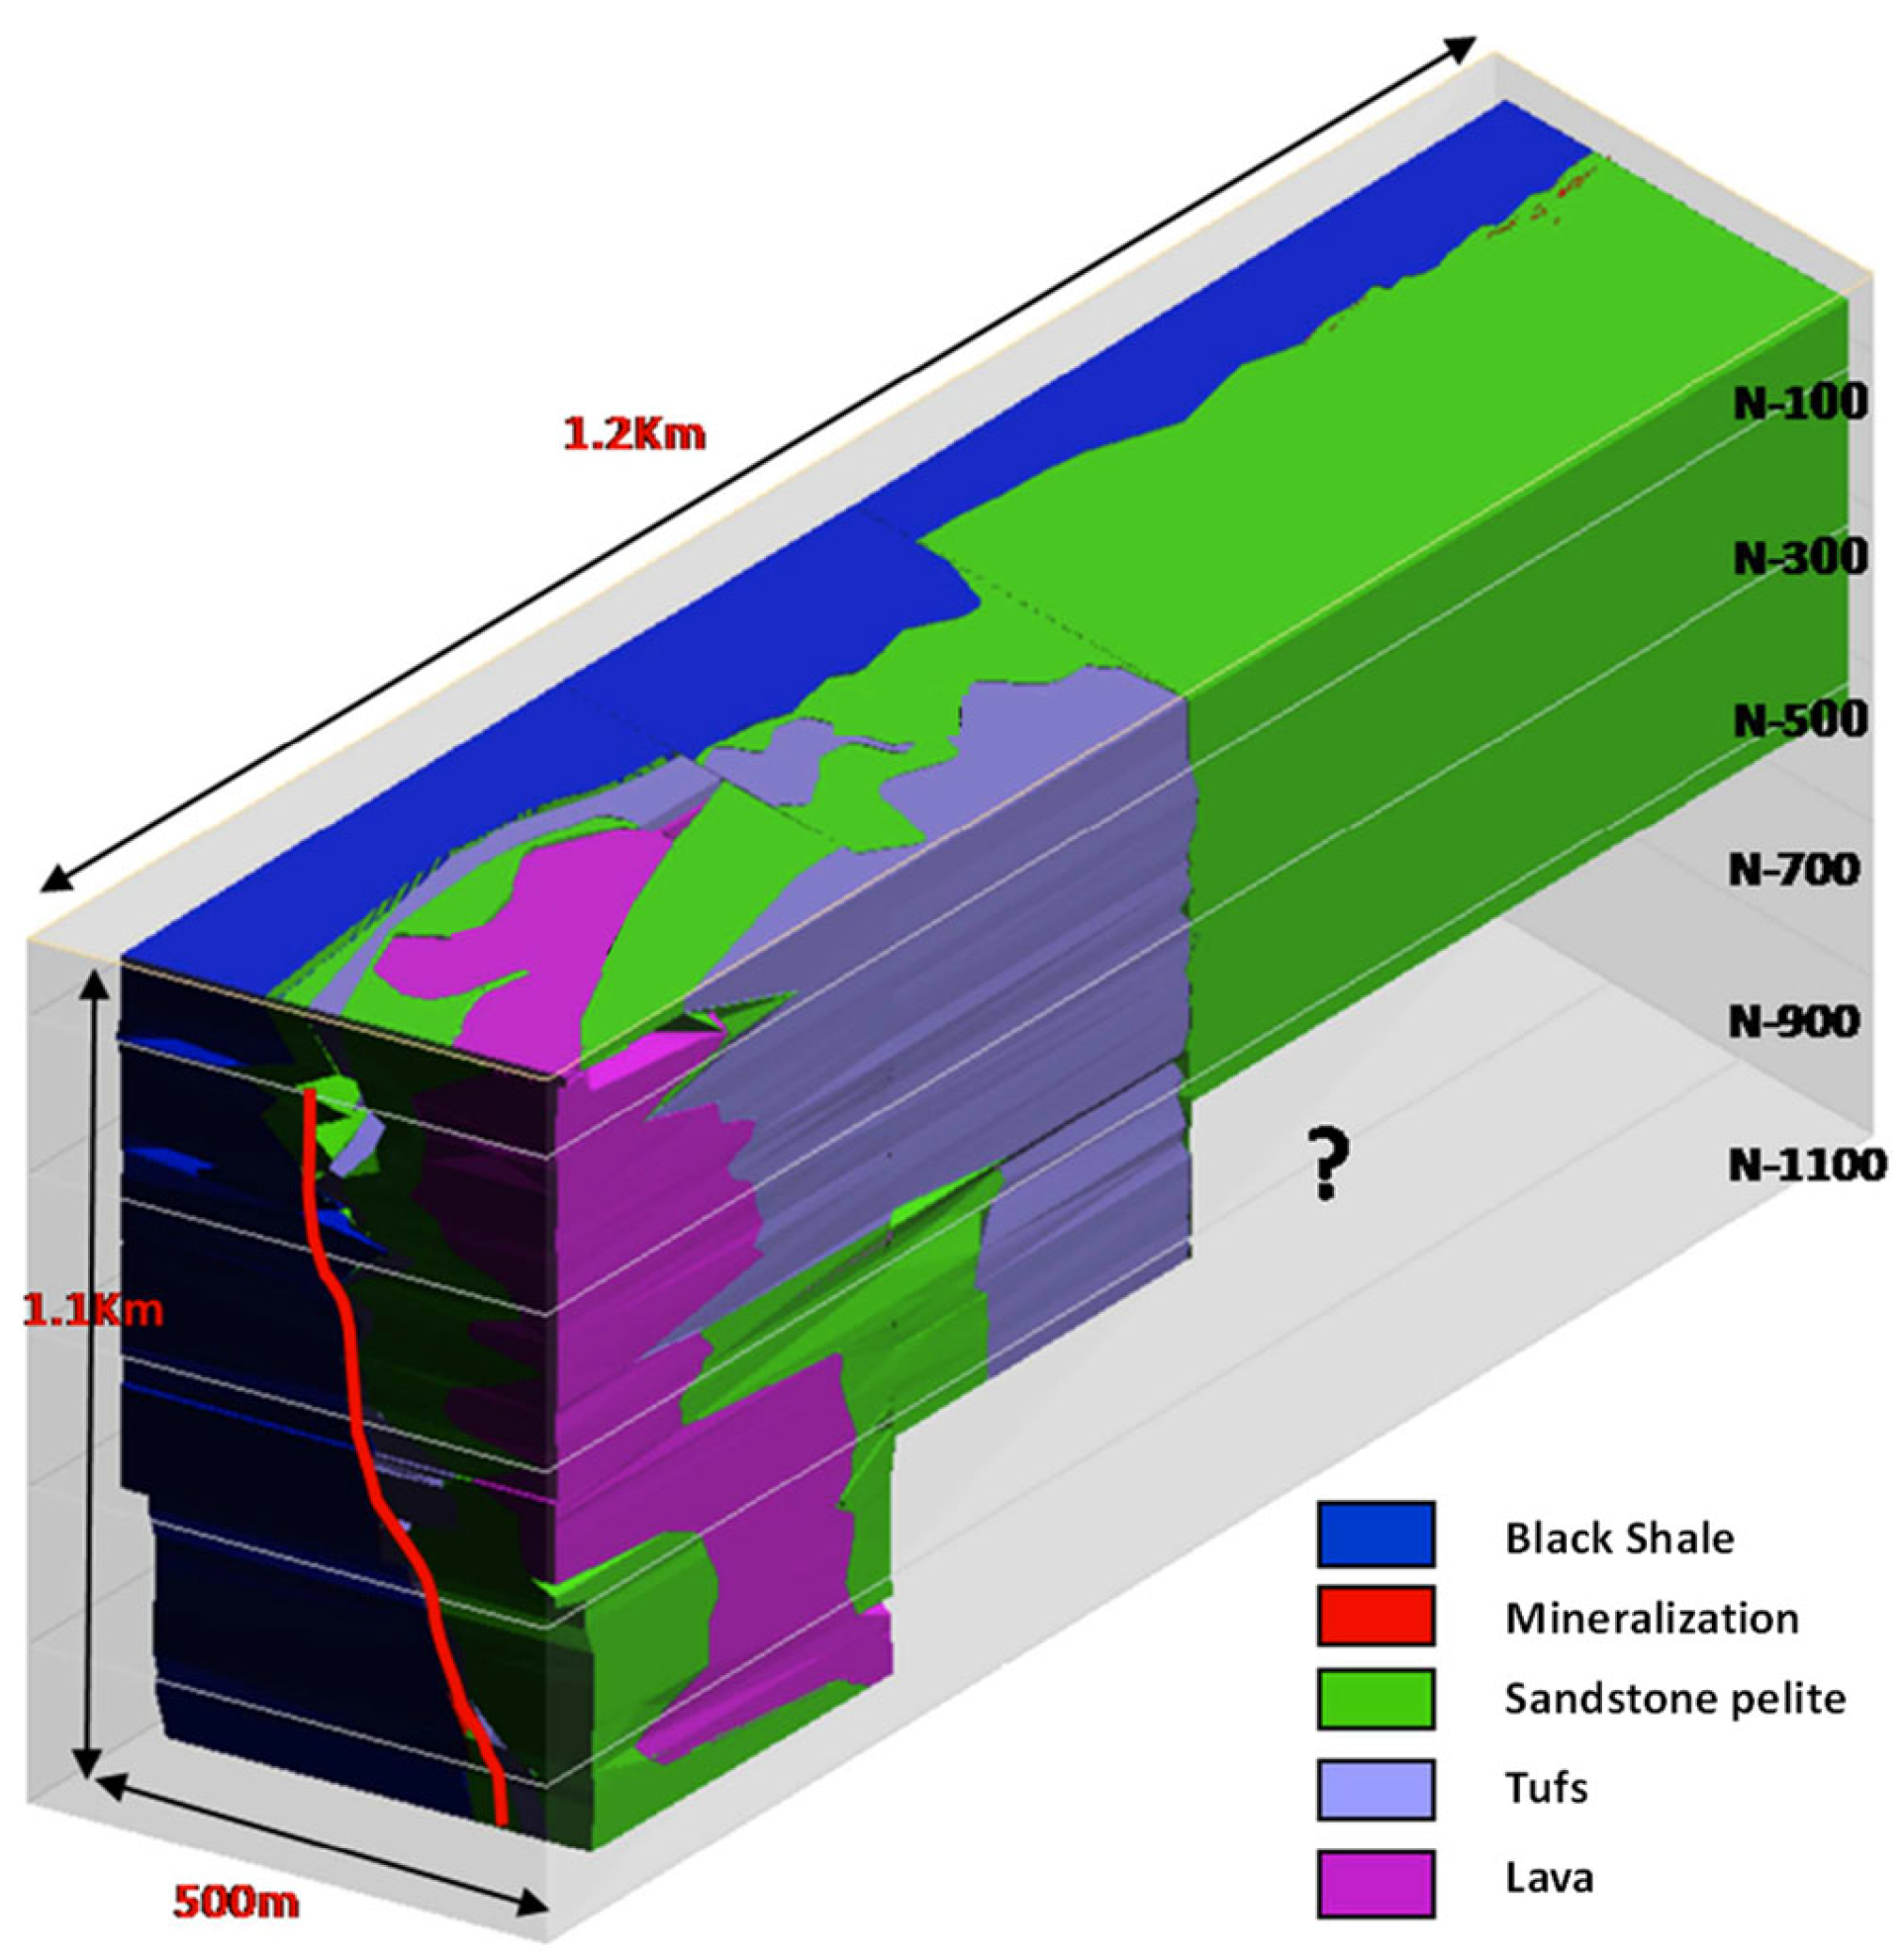
2. Geological Framework

The study area lies in the north of the Tensift Basin and on the southern edge of the central Jbilets massif (Figure 1). The Tensift Basin is a tectonic basin formed between the Atlas and Jbilets after a series of fractures and flexures during the High Atlas uprising. Large detritic formations have accumulated in the Neogene and Quaternary sediments in this basin. In the study area, this sedimentary series is thin compared to the center of the basin, with a thickness of no more than 20 m. It is underlain by the Carboniferous marine metasediments (Visen-Namurien), known as the Sarhlef Shists, which form the central Jbilets. These shists contain lenticular limestone or sandstone beds [20,21]. The settlement of the shales was associated with intense magmatism, including lava and sills (gabbros and rhyolite) and alternating acidic and basic volcanic tuffs. This unit hosts sulfide ore bodies, including those from Draa Sfar (Figure 2).

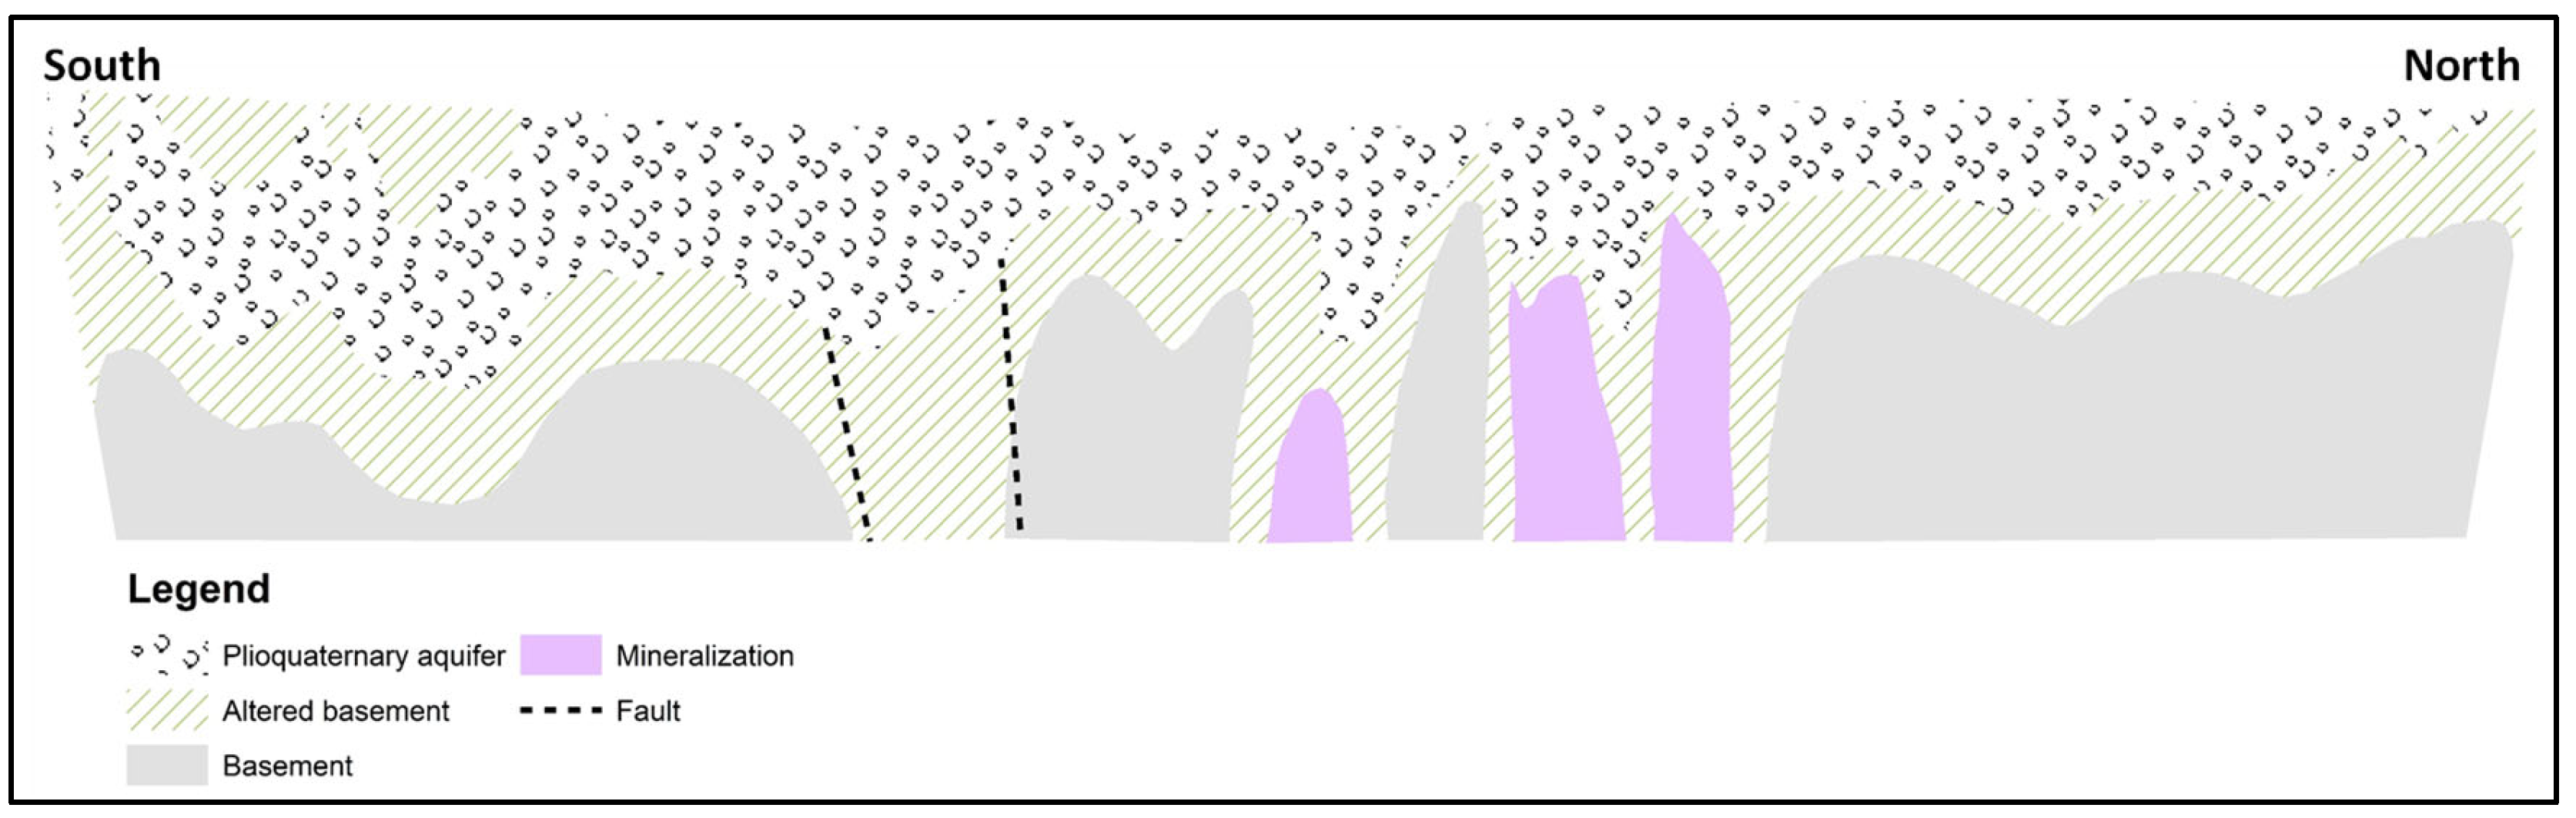
3. Hydrogeological Framework

There are two aquifer systems in the study area (Figure 3). On the one hand, there is the shallow aquifer in which the Haouz groundwater circulates. This extends over about 6000 km2; it is bounded by the Atlas Mountains to the south and the Jbilets to the north. Groundwater flows from the southeast to the northwest in the Miocene and Plioquaternary alluvium with Oued Tensift as an outlet [23]. The thickness of the aquifer is variable: it can reach 80 m in the south and 10 m in the north. The groundwater level of the aquifer is on average 30 m below the ground; it becomes shallow toward Oued Tensift in the north. At the study area level, the Plioquaternary aquifer is approximately 20 m thick. It lies on an important layer of altered basement. The groundwater table is at an average depth of 18 m above the ground surface. This aquifer is mainly used by the population for water supply through traditional wells, the depth of which does not exceed 25 m. On the other hand, the deep aquifer consists mainly of schists (Sarhlef Shists). Its upper part, in contact with the Haouz Aquifer, is altered, semi-permeable, capacitive and of variable thickness. In the non-altered part of the basement, the groundwater mainly flows within the fissures and faults. The volume of mine water generated by the Draa Sfar mine varies between 50 and 80 m3/day.

4. Materials and Methods

4.1. Water Analysis

A total of 37 groundwater samples were taken for this study. Sampling included water strikes within the underground mine and water wells around the mine area. Physico-chemical parameters, such as pH, conductivity and temperature, were measured in the field. Cation and trace element analyses were performed by ICP-MS, and anions by ion chromatography (Table 1). The validation of the results was ensured by analyzing the sample twice and cross-checking the values with the standards. Subsequently, the geochemical data were converted into their equivalent or milli equivalence units for interpretation. Next, calculations were made to find the difference between the sum of major cations (Σ cation) and anions (Σ anions), then divided by the sum of all major ions to provide the charge balance error. The acceptable percentage of error for water analysis ranges between ±1% and ±10%.

4.2. Rock Analysis

To characterize the rocks from the study area and to identify their role in groundwater salinization, 31 rock samples were collected from the mine for leach testing and to provide petrophysical parameters (porosity and grain density). All lithologies were sampled, namely tuff, lava, sandstone and black pelite, also referred to as black schist by [20] or black argillite by [24]. Sampling was conducted at various mine levels at depths ranging from 110 m to 700 m.

4.2.1. Porosity

To determine the porosity, we used the oil (Kerdane) method. This has the properties of being non-volatile, immiscible with water and not dissolving possible salts present in the porosity. The measurements were carried out in the Study of Transfers in the Soil and Subsoil Laboratory at the Institute for Radiation Protection and Nuclear Safety (IRSN). Rock fragments were weighed and immersed in Kerdane until saturation was reached. The samples were then collected, and the excess Kerdane on the surface of the samples was removed with a tissue. Then the samples were weighed in air and in the Kerdane to determine the volume of each sample.
The formula to determine the total volume is:
V t o t = m s s a m s s a   ×   ( ρ l i q     ρ a i r ) ( m s s a     m s s l )   ×   ρ h c o r + ρ a i r
with
  • mssa: mass of the solid in saturated air (g)
  • mssl: mass of the solid in the saturated liquid (g)
  • Vtot: total volume of the solid (cm3)
  • ρliq: liquid density (Kerdane) (g/cm3)
  • ρair: air density (0.0012 g/cm3)
  • Phcor: corrected buoyancy (0.99983)
Finally, the samples were placed in an oven at 150 °C and weighed a final time to determine their dry mass.

4.2.2. Density

To determine the density of the grains, we used a Micromeritics Accupyc II 1340 helium pycnometer. The device measures the volume of the sample (volume of solid grains). The pycnometer was programmed to take 10 measurements for each sample. Knowing the mass of the sample, we calculate its density, which is equal to the density of the grains.

4.2.3. Leaching Tests

Rock samples representing the lithologies present in the mine (tuff, lava, sandstone and black shale) were crushed first, and no particle size was preferred. For each sample, 100 g of rock was placed in 50 mL of distilled water and left for 15 days. After centrifuging the samples, the recovered water was analyzed for chloride and bromide by ion chromatography in the IDES laboratory.

5. Results

5.1. Water Analysis

The concentration of Na+ and Cl (Figure 4) shows that the groundwater from the shallow aquifer is below the halite dissolution and seawater dilution lines, indicating an excess of Cl compared to Na+. Regarding the mine groundwater, the high salinity samples project onto the seawater evaporation line, while the less saline samples show a similar signature to the saline shallow aquifer groundwater. Figure 5 shows that the Na+/Cl ratio of groundwater in shallow aquifers decreases slightly with increasing chloride concentration and remains quite low, while the Na+/Cl ratio of mine groundwater increases with increasing chloride concentration.
The relationship between the Br/Cl ratio and 1/Cl (Figure 6) shows that almost all the Br/Cl ratios of the groundwater samples are between those of seawater and those of primary marine halite. However, as with the Na+/Cl ratio, two distinct behaviors are observed. The Br/Cl ratio of mine groundwater is high in saline groundwater and decreases towards groundwater with lower chloride concentrations. While in the groundwater of the shallow aquifer, all samples show a slightly higher Br/Cl ratio than the primary marine halite, this ratio remains almost constant and independent of the chloride concentration except for two samples with primary marine halite ratios.
Like sodium, lithium can be considered a relatively well conserved element in solution: it is highly soluble and independent of Ph/oxidation conditions [25]. It does not precipitate in any mineral phase and is not controlled by any biological process. However, it is retained by clay minerals and can even be exchanged with sodium and potassium if the temperature is sufficient to release it from the matrix [26,27]. Its concentration also depends on rock-water interactions and has been used by [28] as an indicator of groundwater residence time. In this case, in contrast to the Br/Cl and Na+/Cl ratios, the Li+/Cl ratio of shallow aquifer groundwater decreases with increasing Cl concentration (Figure 7). On the other hand, Li+/Cl in mine water increases with salinity, like Br/Cl and Na+/Cl. In addition, the high Li+/Cl ratio in mine groundwater indicates that the origin of the salinity is in the aqueous form.

5.2. Porosity and Leaching Tests

Table 2 shows the results of the porosity measurements and calculations. The porosity of the rock is very low: it varies between 0.41% and 1.12%. This is consistent with the geological history of the area, as the basement has experienced multiple phases of compression during the Hercynian and Alpine orogenies. In ascending order, the lavas are the least porous, then the tuffs and finally the black shales, where the maximum porosity has been measured.
As mentioned above, leaching tests were conducted to assess the rock’s contribution to groundwater salinity. The results are shown in Table 3, and Figure 8 shows Br/Cl versus 1/Cl. The leaching tests show large fluctuations in Cl and Br concentrations, ranging from 47 mg/L to almost 1 g/L for Cl and from 0 mg/L to over 2 mg/L for Br. The Br/Cl ratio of the leaching is between that of primary marine halite and that of seawater, as in the sampled groundwater.
The concentrations of chloride and bromide in this porewater were then calculated using the porosities of the rock samples and assuming (based on the high concentrations of Li+) that Cl and Br are present in the aqueous (dissolved) phase in the porewater.
Since the leaching tests were performed using 50 mL of water per 100 g of rock:
[Cl]R = [Cl]leach × 50.10−3 L
VR = 100/dR
VE = VR × porosity
The concentration of dissolved chloride in the pore water obtained by leaching is:
[Cl]T = [Cl]R/VE
with:
  • [Cl]leach: chloride concentration in the leach solution
  • [Cl]R: chloride concentration in 100 g of the rock
  • [Cl]T: chloride concentration in the porosity if all was liquid
  • VR: rock volume
  • VE: water volume or pore volume
  • dR: grain density g/cm3
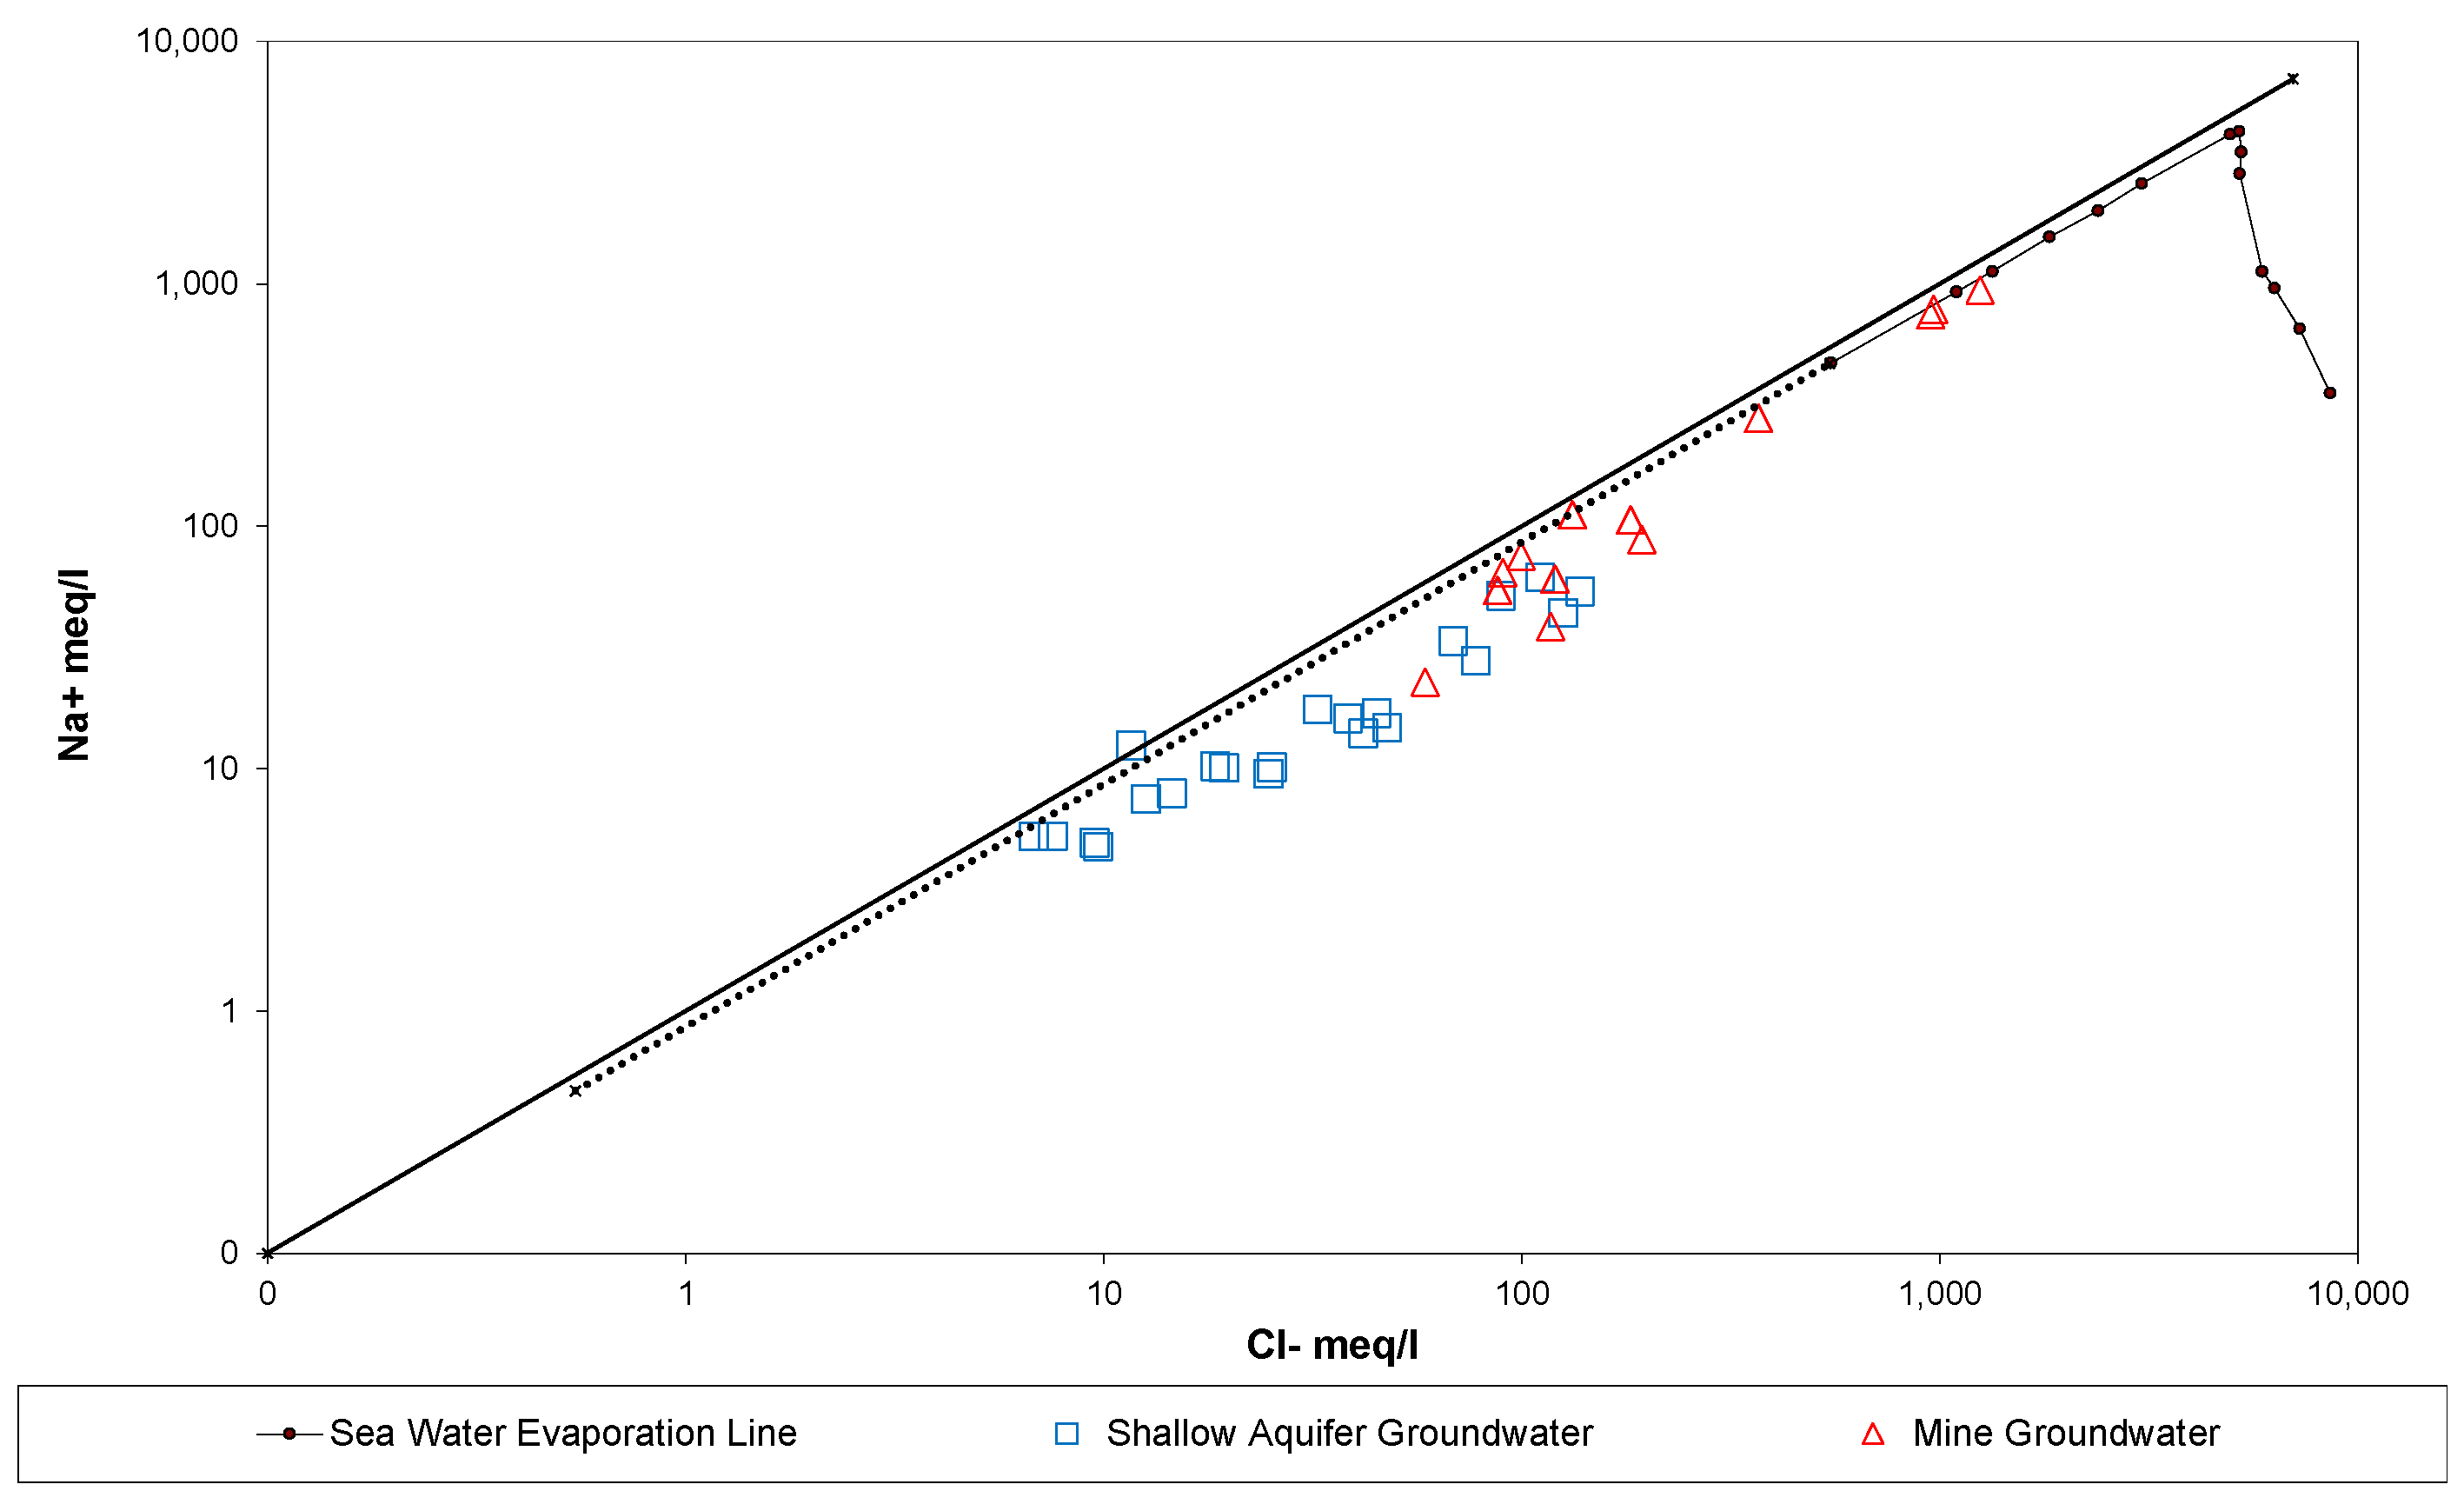
The same formulas were used to calculate bromide concentrations. In addition, the maximum concentrations of Cl and Br corresponding to the minimum porosity and their minimum concentrations corresponding to the maximum porosity were calculated. The results of these calculations (Table 4) show a wide range of Cl and Br concentrations in the pore water. With high porosity, the Cl concentration can reach 150 g/L, and with a low Cl concentration, it can exceed 250 g/L.
In order to confirm whether Cl is dissolved in the rock porosity, it was assumed that the chloride is completely balanced by sodium from the cationic point of view, with the halite NaCl being the least soluble of the chloride minerals. The amount of dissolved sodium was then calculated using the relationship: m(Cl)/M(Cl) = m(Na+)/M(Na+), and thus determined how much NaCl should be dissolved in the poral water to obtain the chloride concentrations measured by the leaching tests. The result of the calculation (Table 4) shows that the amount of NaCl varies according to the samples and the porosity. At maximum porosity, the NaCl concentration varies between 11 g/L and 243 g/L, while at minimum porosity it can double (13 to 427 g/L). It also shows that all but one sample (black shale) has a NaCl concentration below the solubility of halite (357 g/L at 0 °C and 391 g/L at 100 °C), confirming that Cl the pore water of the rock samples is dissolved in it.

6. Discussion

The groundwater from the shallow aquifer shows almost constant Br/Cl and Na+/Cl ratios, independent of the chloride content. The constant ratios of these conservative elements indicate a single origin for Cl, Br, and Na+ that is internal to the aquifer. This source of salinity is diluted by recharge water that contains low concentrations of these elements.
The least mineralized mine waters have similar Br/Cl, Na+/Cl and Li+/Cl ratios as the saline shallow aquifer groundwater. However, the most saline ones show different behavior, with ratios increasing with salinity. The groundwater collected in the mine, as well as shallow aquifer groundwater, has Br/Cl ratios in the range of those measured on the leachates of the rocks extracted from the mine (Figure 9), suggesting the existence of a connection between them. In fact, the porewaters may represent the reservoirs of dissolved chloride that cause salinity, and mine groundwater salinity results from a mixture between these porewaters and fresh, meteoric water infiltrating from the surface and recharging the shallow aquifer. Based on this hypothesis, the balance of Cl and Br in the mine groundwater sample that has the highest concentration of these two elements was used to calculate the mixing fraction:
[Cl] = α [Cl]m + (1 − α) [Cl]p
[Br] = α [Br]m + (1 − α) [Br]p
where:
  • High saline mine groundwater has [Cl] = 44 g/L; [Br] = 48.5 mg/L.
  • As pore water, the average of the two high saline pore waters has been used: [Cl]p = 240 g/L; [Br]p = 267 mg/L.
  • Meteoric water is assumed to contain negligible Cl and Br compared to pore waters: [Cl]m = 0 g/L; [Br]m = 0 mg/L.
The calculation of the mixing fraction shows that the pore water would contribute about 20% to the mine groundwater sample, with the remaining 80% being fresh meteoric water. The same percentage is obtained for bromide and chloride, reflecting the agreement of the Br/Cl ratio between the porewater and the mine groundwater sample. The same calculation was carried out for all mine groundwater samples in order to check the general validity of this balance for all water samples. The uncertainty in the concentration of the pore water (minimum/maximum) was taken into account in order to estimate the influence of this calculation uncertainty on the determination of the mixing proportions. The results are shown in Table 5. Overall, the results between Cl and Br agree for most mine groundwater. The mine’s least saline waters show a minimum mean contribution from meteoric water of about 97% and a slightly different maximum mean contribution of about 98%. The impact of uncertainty on porewater concentration is more evident for the mine’s highly saline water, as the minimum average contribution from the meteoric water is approximately 71%, while the maximum average contribution is approximately 82%.
Using the same balance calculation and assuming that it is primarily the mixtures that control chemical composition, the chemical composition of the salinity endmember was calculated. The calculation results are shown in Table 6.
[Na+]p = ([Na+] − α [Na+]m)/(1 − α)
[Ca2+]p = ([Ca2+] − α [Ca2+]m)/(1 − α)
[Mg2+]p = ([Mg2+] − α [Mg2+]m)/(1 − α)
[K+]p = ([K+] − α [K+]m)/(1 − α)
[SO42−]p = ([SO42−] − α [SO42−]m)/(1 − α)
Therefore, it would be a brine of the Na-Ca-Cl type, relatively rich in calcium and magnesium and low in potassium and sulfate.
The presence of this type of brine has been mentioned to explain the salinity of deep groundwater at many locations in the crystalline basement. Its origin is controversial, and several hypotheses have been proposed. These hypotheses fall into two groups: The first group considers salinity to be rock-internal, like water-rock interaction or connate water [10,18,29]. The second group considers that the salinity has an external origin, such as the dissolution of evaporite or the concentration of seawater before deep infiltration by hydrothermal fluid [6,6,11,17,30,31,32]. However, the Br/Cl ratio of the water present in the crystalline basements is particularly high compared to the water of the sedimentary basins. Similar and even higher Br/Cl ratios from Canadian Shield brines were also found in the deep, high saline groundwaters of the Siberian platform [13]. The total mineralization of this groundwater exceeds 300 g/L. These brines have been divided into three groups: the first has a Br/Cl ratio of the order of 0.02, which exceeds that of all the brines of marine origin described in the literature. This ratio would be the result of the evaporation of seawater (with a concentration factor of 30 to 128). The second group has a total mineralization of 44 g/L to 87 g/L. Compared to a marine evaporation solution, the groundwaters in this group are characterized by a low bromide concentration with a Br/Cl ratio of 0.0012. This relationship was explained by the dissolution of the evaporite minerals present between the layers. The last group, with a total salinity between 32 g/L and 110 g/L, has a Br/Cl ratio that is higher than the marine ratio and also higher than what would be expected in the case of simple evaporation of seawater. The salinity of this group was interpreted as the result of the mixing of groundwater from the first and second groups. The very high Br/Cl ratio of groundwaters in the first and third groups was explained by interactions between these waters and salts, which led to diffusive-selective and/or dissolution-precipitation processes of halite with increasing Br concentration. The authors of [10] showed, however, that the chloride and sodium brines of the Siberian platform arose as a result of the leaching of halogen-bearing rocks, while chloride-calcium brines originated from buried connate waters. In Germany, saline fluids from KTB drillings in the Bohemian Massif have a total mineralization of 61 g/L and 68 g/L, respectively [6]. These fluids have a Ca-Na-Cl composition and are characterized by a Br/Cl ratio greater than seawater, similar to that of Canadian Shield brines. The mineralization of these waters would be controlled by rock-water interactions. Chloride concentrations have been explained by geotectonic processes, and bromide may result from interactions with organic material. In Germany, [17] linked the origin of the brines from the Ibbenbren mine to the migration of groundwater from the surrounding Mesozoic sediments and the ongoing water–rock interaction of the evaporite-derived brines with the carboniferous siliciclastic rocks of the mine. The saline groundwater encountered at Stripa also has a high Br/Cl ratio (three times higher than the marine ratio) and is of the Na-Ca-Cl type. The origin of the salinity has been attributed by [8] to the fracturing and leakage of the fluid inclusions connected with microporosity, and by [33] to the intrusion of a sedimentary solution into the granitic system. In the Scandinavian Shield, the results of the investigations of the various borehole groundwater drilled into the crystalline bedrock of Finland show a clear stratification of the waters (fresh, brackish and salt water). The saline groundwater is of the Na-Ca-Cl type and is characterized by a higher Br/Cl ratio than seawater. The origin of the salinity, and thus of bromide and chloride, is debated. However, the two most likely origins are the interactions of rock water and/or salt remnants from the postglacial sea at Litorina [34]. For the Carnmenellis granite in England, the total mineralization of the groundwater has been found to exceed 30 g/L and the Br/Cl ratio is the same as that of seawater. However, the origin of the salinity has been attributed to water–rock interactions [7].
A comparison of the Br/Cl ratios of salt water in different crystalline basements in Europe and Canada shows that in almost all cases, this ratio is equal to or greater than that of sea water. In the case of the Draa Sfar mine, the deep saltwater is characterized by a different Br/Cl ratio as it is significantly lower than that of seawater while remaining higher than that of a primary marine halite.
One of the outstanding features of the Draa Sfar region is obviously its hydrothermal history. The Draa Sfar sulfide deposit is classified as a VMS (Volcanic Hosted Massive Sulfide) type [35,36]. Generally, the hydrothermal system giving rise to this type of deposit (rich in Fe, Zn and Cu) is referred to as the seawater hydrothermal system [37]. Hydrothermal fluids must be 3 to 10 times more saline than seawater to allow metal transport and sulfide precipitation (Solomon et al., 2002). Chloride is part of the metal transporter complex FeCl4-FeCl2−(Fe), CuCl2-CuCl32−(Cu), ZnCl42−(Zn) [35,38,39,40]. Ref. [35] indicate that due to the thick shear zone, other fluids may have integrated the previously embedded hydrothermal system. These hydrothermal and post-hydrothermal fluids could be the origin of the high salinities found in the pore water of the Draa Sfar mine rocks. Their Br/Cl ratio between that of seawater and a primary marine halite could correspond to that of seawater that has dissolved halite or is mixed with water that has dissolved halite. It is even possible that some of the dissolved chloride is provided by a contribution from magmatic fluids that are rich in chloride but relatively poor in bromide [40,41,42].

7. Conclusions

A hydrogeochemical study using conservative elements has helped to understand the origin of groundwater salinity at the Draa Sfar mine and to assess the contribution of the deep salinity source to the high salinities observed at the mine. The groundwater from the shallow aquifer shows almost constant Br/Cl and Na+/Cl ratios, independent of the chloride content, which indicate a single origin of Cl, Br and Na+ internal to the aquifer and are diluted by recharge water containing low concentrations of these elements. The groundwater collected from the mine, like shallow groundwater, has Br/Cl ratios in the range of those measured on the leachates of the rocks extracted from the mine, suggesting that the porewater may represent the reservoirs of dissolved chloride, which causes the high groundwater salinity, and the mine’s groundwater results from a mixture between these porewaters and fresh, meteoric water that infiltrates from the surface and recharges the shallow aquifer. In fact, this pore water would be a remnant of the hydrothermal fluids that formed the sulfide deposit.

Author Contributions

Conceptualization, A.A.L. and J.-L.M.; methodology, A.A.L. and J.-L.M.; validation, A.A.L., A.B. and L.H.; formal analysis, A.A.L.; investigation, A.A.L.; resources, A.A.L.; data curation, A.A.L.; writing—original draft preparation, A.A.L. and O.H.; writing—review and editing, A.A.L., A.B. and L.H.; visualization, A.A.L.; supervision, A.A.L.; project administration, A.A.L.; All authors have read and agreed to the published version of the manuscript.

Funding

This research received no external funding.

Institutional Review Board Statement

Not applicable.

Informed Consent Statement

Not applicable.

Data Availability Statement

Not applicable.

Conflicts of Interest

The authors declare no conflict of interest.

References

  1. Boujghad, A.; Bouabdli, A.; Baghdad, B. Groundwater Quality Evaluation in the Vicinity of the Draa Sfar Mine in Marrakesh, Morocco. Euro-Mediterr. J. Environ. Integr. 2019, 4, 12. [Google Scholar] [CrossRef]
  2. Frape, S.K.; Fritz, P. Geochemical Trends from Groundwaters from Canadian Shield. In Geological Association of Canada Special Paper; Geological Association of Canada: St. John’s, NL, Canada, 1987. [Google Scholar]
  3. Pearson, F.J. Models of Mineral Controls on the Composition of Saline Groundwaters of the Canadian Shield. In Geological Association of Canada Special Paper; Geological Association of Canada: St. John’s, NL, Canada, 1987; pp. 39–52. [Google Scholar]
  4. Kamineni, D.C. Halogen Bearing Minerals in Plutonic Rocks: A Possible Source of Chlorine in Saline Groundwater in the Canadian Shield. In Geological Association of Canada Special Paper; Geological Association of Canada: St. John’s, NL, Canada, 1987; pp. 69–80. [Google Scholar]
  5. Walter, J.; Chesnaux, R.; Cloutier, V.; Gaboury, D. The Influence of Water/Rock−Water/Clay Interactions and Mixing in the Salinization Processes of Groundwater. J. Hydrol. Reg. Stud. 2017, 13, 168–188. [Google Scholar] [CrossRef]
  6. Lodemann, M.; Fritz, P.; Wolf, M.; Ivanovich, M.; Hansen, B.T. On the Origin of Saline Fluids in the KTB (Continental Deep Drilling Project of Germany). Appl. Geochem. 1998, 13, 651–671. [Google Scholar] [CrossRef]
  7. Edmunds, W.M.; Kay, R.L.F.; McCartney, R.A. Origin of Saline Groundwaters in the Carnmenellis Granite (Cornwall, England): Natural Processes and Reaction during Hot Dry Rock Reservoir Circulation. Chem. Geol. 1985, 49, 287–301. [Google Scholar] [CrossRef]
  8. Nordstrom, D.; Olsson, T. Fluid Inclusions as a Source of Dissolved Salts in Deep Granitic Groundwaters. In Geological Association of Canada—Special Paper; Geological Association of Canada: St. John’s, NL, Canada, 1987; Volume 33, pp. 111–119. [Google Scholar]
  9. Savoye, S.; Aranyossy, J.-F.; Beaucaire, C.; Cathelineau, M.; Louvat, D.; Michelot, J.-L. Fluid Inclusions in Granites and Their Relationships with Present-Day Groundwater Chemistry. Eur. J. Miner. 1998, 10, 1215–1226. [Google Scholar] [CrossRef] [Green Version]
  10. Alexeev, S.V.; Alexeeva, L.P.; Vakhromeev, A.G. Brines of the Siberian Platform (Russia): Geochemistry and Processing Prospects. Appl. Geochem. 2020, 117, 104588. [Google Scholar] [CrossRef]
  11. Greene, S.; Battye, N.; Clark, I.; Kotzer, T.; Bottomley, D. Canadian Shield Brine from the Con Mine, Yellowknife, NT, Canada: Noble Gas Evidence for an Evaporated Palaeozoic Seawater Origin Mixed with Glacial Meltwater and Holocene Recharge. Geochim. Cosmochim. Acta 2008, 72, 4008–4019. [Google Scholar] [CrossRef]
  12. Bottomley, D.J.; Gregoire, D.C.; Raven, K.G. Saline Ground Waters and Brines in the Canadian Shield: Geochemical and Isotopic Evidence for a Residual Evaporite Brine Component. Geochim. Cosmochim. Acta 1994, 58, 1483–1498. [Google Scholar] [CrossRef]
  13. Shouakar-Stash, O.; Alexeev, S.V.; Frape, S.K.; Alexeeva, L.P.; Drimmie, R.J. Geochemistry and Stable Isotopic Signatures, Including Chlorine and Bromine Isotopes, of the Deep Groundwaters of the Siberian Platform, Russia. Appl. Geochem. 2007, 22, 589–605. [Google Scholar] [CrossRef]
  14. Michelot, J.L.; Beaucaire, C.; Kloppmann, W.; Louvat, D.; Matray, J.M.; Sacchi, E.; Savoye, S.; Trésonne, N. L’eau Du Système Granitique de La Vienne: Reconnaissance Hydrogéochimique et Isotopique. Actes Journées Sci. CNRS/ANDRA 1997, 181–201. [Google Scholar]
  15. Aquilina, L.; Landes, A.A.-L.; Ayraud-Vergnaud, V.; Labasque, T.; Roques, C.; Davy, P.; Pauwels, H.; Petelet-Giraud, E. Evidence for a Saline Component at Shallow Depth in the Crystalline Armorican Basement (W France). Procedia Earth Planet. Sci. 2013, 7, 19–22. [Google Scholar] [CrossRef]
  16. Louvat, D.; Michelot, J.L.; Franc, J. Origin and Residence Time of Salinity in the Äspö Groundwater System. Appl. Geochem. 1999, 14, 917–925. [Google Scholar] [CrossRef]
  17. Rinder, T.; Dietzel, M.; Stammeier, J.A.; Leis, A.; Bedoya-González, D.; Hilberg, S. Geochemistry of Coal Mine Drainage, Groundwater, and Brines from the Ibbenbüren Mine, Germany: A Coupled Elemental-Isotopic Approach. Appl. Geochem. 2020, 121, 104693. [Google Scholar] [CrossRef]
  18. Leybourne, M.I.; Goodfellow, W.D. Br/Cl Ratios and O, H, C, and B Isotopic Constraints on the Origin of Saline Waters from Eastern Canada. Geochim. Cosmochim. Acta 2007, 71, 2209–2223. [Google Scholar] [CrossRef]
  19. Leybourne, M.I.; Clark, I.D.; Goodfellow, W.D. Stable Isotope Geochemistry of Ground and Surface Waters Associated with Undisturbed Massive Sulfide Deposits; Constraints on Origin of Waters and Water–Rock Reactions. Chem. Geol. 2006, 231, 300–325. [Google Scholar] [CrossRef]
  20. Huvelin, P. Etude Géologique et Gitologique du Massif Hercynien des Jbilets (Maroc Occidental); Notes et Mémoires du Service Géologique; Service Géologique du Maroc: Rabat, Marroco, 1977.
  21. Marcoux, E.; Belkabir, A.; Gibson, H.L.; Lentz, D.; Ruffet, G. Draa Sfar, Morocco: A Visean (331 Ma) Pyrrhotite-Rich, Polymetallic Volcanogenic Massive Sulphide Deposit in a Hercynian Sediment-Dominant Terrane. Ore Geol. Rev. 2008, 33, 307–328. [Google Scholar] [CrossRef] [Green Version]
  22. Salama, L.; Mouguina, E.M.; Nahid, A.; Bachari, E.E.; Outhounjite, M.; Maacha, L.; Zouhair, M.; Naciri, A.E. Apport de la modélisation géologique 3D à l’exploration minière: Etude de cas du gisement de Draa Sfar (Jbilets centrales, Maroc). Int. J. Innov. Sci. Res. 2016, 22, 72–89. [Google Scholar]
  23. Hakkou, R.; Wahbi, M.; Bachnou, A.; Elamari, K.; Hanich, L.; Hibti, M. Impact de la décharge publique de Marrakech (Maroc) sur les ressources en eau. Bull. Eng. Geol. Environ. 2001, 60, 325–336. [Google Scholar] [CrossRef]
  24. Belkabir, A.; Gibson, H.L.; Marcoux, E.; Lentz, D.; Rziki, S. Geology and Wall Rock Alteration at the Hercynian Draa Sfar Zn–Pb–Cu Massive Sulphide Deposit, Morocco. Ore Geol. Rev. 2008, 33, 280–306. [Google Scholar] [CrossRef] [Green Version]
  25. Hogan, J.F.; Blum, J.D. Boron and Lithium Isotopes as Groundwater Tracers: A Study at the Fresh Kills Landfill, Staten Island, New York, USA. Appl. Geochem. 2003, 18, 615–627. [Google Scholar] [CrossRef]
  26. Paropkari, A.L. Geochemistry of Sediments from the Mangalore-Cochin Shelf and Upper Slope off Southwest India: Geological and Environmental Factors Controlling Dispersal of Elements. Chem. Geol. 1990, 81, 99–119. [Google Scholar] [CrossRef]
  27. Sanchez-Martos, F.; Pulido-Bosch, A.; Molina-Sanchez, L.; Vallejos-Izquierdo, A. Identification of the Origin of Salinization in Groundwater Using Minor Ions ž Lower Andarax, Southeast Spain. Sci. Total Environ. 2002, 297, 43–58. [Google Scholar] [CrossRef] [PubMed]
  28. Edmunds, W.M.; Smedley, P.L. Residence Time Indicators in Groundwater: The East Midlands Triassic Sandstone Aquifer. Appl. Geochem. 2000, 15, 737–752. [Google Scholar] [CrossRef]
  29. Leybourne, M.I.; Goodfellow, W.D.; Boyle, D.R. Hydrogeochemical, Isotopic, and Rare Earth Element Evidence for Contrasting Water–Rock Interactions at Two Undisturbed Zn–Pb Massive Sulphide Deposits, Bathurst Mining Camp, N.B., Canada. J. Geochem. Explor. 1998, 64, 237–261. [Google Scholar] [CrossRef]
  30. Bottomley, D.J.; Katz, A.; Chan, L.H.; Starinsky, A.; Douglas, M.; Clark, I.D.; Raven, K.G. The Origin and Evolution of Canadian Shield Brines: Evaporation or Freezing of Seawater? New Lithium Isotope and Geochemical Evidence from the Slave Craton. Chem. Geol. 1999, 155, 295–320. [Google Scholar] [CrossRef]
  31. Kloppmann, W.; Girard, J.-P.; Négrel, P. Exotic Stable Isotope Compositions of Saline Waters and Brines from the Crystalline Basement. Chem. Geol. 2002, 184, 49–70. [Google Scholar] [CrossRef]
  32. Möller, P.; Lüders, V.; De Lucia, M. Formation of Rotliegend Ca-Cl Brines in the North German Basin Compared to Analogues in the Geological Record. Chem. Geol. 2017, 459, 32–42. [Google Scholar] [CrossRef] [Green Version]
  33. Michelot, J.L. Hydrologie Isotopique Des Circulations Lentes En Milieu Cristallin Fracturé: Essai Méthodologique. Ph.D. Thesis, Université de Paris 11, Orsay, France, 1988. [Google Scholar]
  34. Karro, E.; Lahermo, P. Occurrence and Chemical Characteristics of Groundwater in Precambrian Bedrock in Finland. In Geological Survey of Finland, Special Paper 27; Geological Survey of Finland: Espoo, Finland, 1999. [Google Scholar]
  35. Essaifi, A.; Hibti, M. The Hydrothermal System of Central Jebilet (Variscan Belt, Morocco): A Genetic Association between Bimodal Plutonism and Massive Sulphide Deposits? J. Afr. Earth Sci. 2008, 50, 188–203. [Google Scholar] [CrossRef]
  36. Maacha, L.; Jaffal, M.; Jarni, A.; Kchikach, A.; Mouguina, E.M.; Zouhair, M.; Ennaciri, A.; Saddiqi, O. A Contribution of Airborne Magnetic, Gamma Ray Spectrometric Data in Understanding the Structure of the Central Jebilet Hercynian Massif and Implications for Mining. J. Afr. Earth Sci. 2017, 134, 389–403. [Google Scholar] [CrossRef]
  37. Cathles, L.M. An Analysis of the Hydrothermal System Responsible for Massive Sulfide Deposition in the Hokuroku Basin of Japan. In The Kuroko and Related Volcanogenic Massive Sulfide Deposits; Ohmoto, H., Skinner, B.J., Eds.; Society of Economic Geologists: Littleton, CO, USA, 1983; Volume 5, ISBN 978-1-62949-000-7. [Google Scholar]
  38. Wood, S.A.; Samson, I.M. Solubility of Ore Minerals and Complexation of Ore Metals in Hydrothermal Solutions. In Techniques in Hydrothermal Ore Deposits Geology; Richards, J.P., Larson, P.B., Eds.; Society of Economic Geologists: Littleton, CO, USA, 1998; Volume 10, ISBN 978-1-62949-017-5. [Google Scholar]
  39. Zhong, R.; Brugger, J.; Chen, Y.; Li, W. Contrasting Regimes of Cu, Zn and Pb Transport in Ore-Forming Hydrothermal Fluids. Chem. Geol. 2015, 395, 154–164. [Google Scholar] [CrossRef]
  40. Stewart, L.C.; Algar, C.K.; Fortunato, C.S.; Larson, B.I.; Vallino, J.J.; Huber, J.A.; Butterfield, D.A.; Holden, J.F. Fluid Geochemistry, Local Hydrology, and Metabolic Activity Define Methanogen Community Size and Composition in Deep-Sea Hydrothermal Vents. ISME J. 2019, 13, 1711–1721. [Google Scholar] [CrossRef] [PubMed] [Green Version]
  41. Jambon, A.; Déruelle, B.; Dreibus, G.; Pineau, F. Chlorine and Bromine Abundance in MORB: The Contrasting Behaviour of the Mid-Atlantic Ridge and East Pacific Rise and Implications for Chlorine Geodynamic Cycle. Chem. Geol. 1995, 126, 101–117. [Google Scholar] [CrossRef]
  42. Nahnybida, T.; Gleeson, S.A.; Rusk, B.G.; Wassenaar, L.I. Cl/Br Ratios and Stable Chlorine Isotope Analysis of Magmatic–Hydrothermal Fluid Inclusions from Butte, Montana and Bingham Canyon, Utah. Miner. Depos. 2009, 44, 837. [Google Scholar] [CrossRef]
Figure 1. Map showing the location of the study area and the Draa Sfar mine.
Water 15 00082 g001
Figure 2. 3D geological block diagram of the Draa Sfar deposit [22].
Water 15 00082 g002
Figure 3. Geohydrological conceptual model of the study area.
Water 15 00082 g003
Figure 4. Plot of sodium versus chloride of shallow aquifer and mine groundwater.
Water 15 00082 g004
Figure 5. Plot of Na+/Cl (meq/meq) versus 1/Cl of shallow aquifer and mine groundwater.
Water 15 00082 g005
Figure 6. Plot of Br/Cl (meq/meq) versus 1/Cl of shallow aquifer and mine groundwater.
Water 15 00082 g006
Figure 7. Plot of 1/Cl versus Li+/Cl (weighted) of shallow aquifer and mine groundwater.
Water 15 00082 g007
Figure 8. Plot of Br/Cl versus 1/Cl of rock leachate.
Water 15 00082 g008
Figure 9. Log-log plot of the calculated bromine and chloride of the poral water from leaching tests. In addition to the bromine and chloride of the shallow aquifer and mine groundwaters.
Water 15 00082 g009
Table 1. Conservative elements concentrations in shallow aquifer and mine groundwater.
LocationSampleT °CCE ms/cmpHNa+ mg/L Cl mg/L Li+ mg/L Br mg/L
Surface wellsPJ21.415.507.151011.64449.00.072.0
PK22.79.307.03776.32428.30.032.2
PN23.46.397.21389.91595.30.031.3
PC21.211.707.351189.13155.10.063.5
PI22.28.356.80121.0241.00.050.2
PG22.41.457.56220.0878.00.000.8
P 2622.73.407.04339.01686.00.25-
PV23.47.907.30114.0337.00.060.3
PK121.51.887.10371.01359.00.051.2
P X23.44.757.28183.0516.00.060.5
P 23 24.11.577.18323.01480.00.040.7
P425.23.666.93121.0268.00.070.2
P 2123.62.337.00173.0447.00.05-
PL122.22.867.18236.0654.00.050.6
P229.32.348.09288.0413.00.060.5
PI125.94.327.20404.01153.00.071.1
PP23.21.827.40110.0344.00.040.4
P 123.23.007.14232.0688.00.050.8
PB21.611.696.781420.03924.00.074.0
P ID22.314.306.641241.04887.00.104.7
PE24.28.626.69643.02753.00.052.5
PF24.03.477.00234.0895.00.020.9
Mine WaterNiv-6019.220.407.012029.06888.00.18-
N-6719.918.107.302443.06470.00.127.7
N-52028.312.756.901393.04268.00.114.2
N-6922.310.367.471482.03201.00.082.8
N-30026.56.566.90522.02082.00.082.4
DF1832.080.007.2017,150.033,700.01.5644.0
N -150-100.005.4521,689.044,313.02.48-
niv-67m19.49.567.481251.03106.00.10-
niv-80m 2311.907.371727.03545.00.12-
niv-240m -12.987.23889.04159.00.125.0
400mBure -14.677.502569.04694.00.20-
Taille380 S-S -34.406.746411.013,074.00.665.8
400mDF1833.083.005.7818,130.034,353.02.8242.9
Table 2. Weighing and porosity calculation results.
Rock Type/Sampling LevelMass
(g)
Mass in the Air after Saturation (g)Mass in the Kerdane (g)Mass after Drying at 150 °C (g)Grains Density (g/cm3)Total Porosity %
Lave Niv 64044.2344.2431.1144.222.670.4
Lave Niv 64017.5917.6012.3717.582.670.6
Tufs Niv 12028.0328.0620.2428.012.851.0
Tufs Niv 12019.4019.4114.0119.392.850.8
PN Niv 70017.1017.1212.1917.082.761.1
PN Niv 70016.5716.5711.8216.562.760.6
Table 3. Cl and Br concentrations in rock leachate.
Rock SampleCl mg/LBr mg/L
700 m/PN1084.80.99
Niv640/E26/PN6051.02
Niv500/E18/PN245.20.26
Niv610/E21/PN353.40.44
Niv110/E39/PN86.6-
Niv340/E8/tufs47.6-
Niv110/E33/Tufs450.80.54
Niv340/E7/Lave3370.34
Niv110/E38/Lave688.60.93
Niv150/E5/Lave257.6-
Niv640/E27/Pg867.82.05
Niv340/E9/Pg561.20.87
Niv420/E13/Pg161.40.2
Niv120/E1/Pg306.60.33
Niv340/E6/Pg4540.5
Table 4. Leaching Cl concentrations and maximum and minimum concentrations calculated from the porosity.
[Cl] Leach mg/L[Cl] R mg/LDensityMax Porosity[Cl] T g/L Min[Na] T g/L MinNaCl g/L MinMin Porosity[Cl] T g/L Max[Na] T g/L MaxNaCl Max
700 m/PN1084.854.22.760.011133.086.2219.20.006259.1167.9427.0
Niv640/E26/PN605.030.32.760.01174.248.1122.20.006144.593.6238.1
Niv500/E18/PN245.212.32.760.01130.119.549.50.00658.638.096.5
Niv610/E21/PN353.417.72.760.01143.328.171.40.00684.454.7139.1
Niv110/E39/PN86.64.32.760.01110.66.917.50.00620.713.434.1
Niv340/E8/tufs47.62.42.850.0107.04.611.60.0088.45.513.9
Niv110/E33/Tufs450.822.52.850.01066.743.2109.90.00879.951.8131.7
Niv340/E7/Lave337.016.92.670.00672.346.8119.10.004108.570.3178.9
Niv110/E38/Lave688.634.42.670.006147.695.7243.30.004221.8143.7365.5
Niv150/E5/Lave257.612.92.670.00655.235.891.00.00483.053.8136.7
Niv640/E27/Pg867.843.42.760.011106.468.9175.30.006207.3134.3341.6
Niv340/E9/Pg561.228.12.760.01168.844.6113.40.006134.186.9220.9
Niv420/E13/Pg161.48.12.760.01119.812.832.60.00638.625.063.5
Niv120/E1/Pg1306.615.32.760.01137.624.462.00.00673.247.5120.7
Niv340/E6/Pg454.022.72.760.01155.736.191.70.006108.470.3178.7
Table 5. Contributions of meteoric water for mine water calculated from Cl and Br.
Samples Cl g/LBr mg/Lα Min (Cl) (%)α Min Br (%)α Max Cl (%)α Max Br (%)
N-676.57.795.495.297.397.1
N-5204.34.297.097.498.298.4
N-693.22.897.798.398.799.0
N-3002.12.498.598.599.199.1
DF1833.744.075.972.586.083.5
N-15044.348.568.369.781.581.8
Niv-240 m 4.25.097.096.998.398.1
Niv-363 m 13.15.890.796.494.697.8
400mDF1834.442.975.573.285.783.9
Table 6. Chemical composition of salinity endmember.
ElementsConcentrations
Na+ g/L108.44
K+ g/L0.65
Mg2+ g/L7.25
Ca2+ g/L21.02
SO42− g/L1.74
Disclaimer/Publisher’s Note: The statements, opinions and data contained in all publications are solely those of the individual author(s) and contributor(s) and not of MDPI and/or the editor(s). MDPI and/or the editor(s) disclaim responsibility for any injury to people or property resulting from any ideas, methods, instructions or products referred to in the content.

