
Assessing the Effects of Urbanization on Water Flow and Flood Events Using the HEC-HMS Model in the Wirynka River Catchment, Poland

Department of Land Improvement, Environmental Development and Spatial Management, Poznań University of Life Sciences, Piątkowska 94, 60-649 Poznań, Poland
*
Author to whom correspondence should be addressed.
Water 2023, 15(1), 86; https://doi.org/10.3390/w15010086
Submission received: 17 November 2022
/
Revised: 20 December 2022
/
Accepted: 22 December 2022
/
Published: 27 December 2022
(This article belongs to the Special Issue Functional Urban Areas: A Key Challenge in Integrated Urban Water Management)
Abstract
:Floods are among the most devastating natural disasters in small urban watersheds resulting in loss of life and enormous damage to property and posing a serious threat to the economy. Appropriate modeling can be a useful tool to prevent and reduce such flood risks. It is currently important to use hydrological models to assess and predict the water availability of river basins due to climate change to develop a strategy to cope with the changing environment. The study used an integrated approach combining a geographic information system (GIS) and hydrological modeling to assess the impact of urbanization on flash floods in peri-urban developing areas. The modeling was carried out for two spatial aspects relating to 1990 and 2018. The model allowed simulation of the river water flow that can occur under different rainfall probabilities. The study showed that rapid urbanization adversely affects hydrological processes. Reduced infiltration capacity increases water runoff, thereby increasing the risk of flooding or waterlogging. Therefore, it is extremely important to properly manage rainwater in the area.
1. Introduction
Water is the source of life and is probably the most valuable natural asset in the world. Climate change is threatening the normal hydrological cycle of river catchments, due to rising temperatures because of the global warming effect, which is associated with a disturbance of the frequency and intensity of precipitation for a given climatic condition [1,2,3,4]. It is recognized that climate change is one of the main factors affecting high river flows, thereby increasing flood risk. Flood risk, on the other hand, depends on many factors, the most important of which are non-climatic factors (mainly changes in the catchment area and urbanization) [5,6,7,8,9,10]. In addition, model-based studies aimed at the assessment of the impact of future climate change on floods project a gradual increase in the magnitude and frequency of floods for a large part of the Central European region under the RCP8.5 scenario [11]. Due to ongoing socio-economic developments, the impact of floods in the coming decades could substantially increase [12,13]. IPCC projections in the context of urban development indicate a progressive expansion (urbanization) of 0.4–0.7% per year. The expansion concerning the growth of urbanized land is estimated to be ten times higher than the expansion of other types of use. This means that progressive urbanization will be a visible process in non-urban areas, including Poland [14]. Analyzing floods occurring in urban and suburban areas shows that they cause significant financial losses. So far, urban floods have been the main area of analysis, mainly because of their spatial scale as well as budget. However, it should be remembered that suburban areas are particularly important, developing areas. Although suburban areas have a local character, flooding that occurs there is equally important [15,16]. From a suburban flood point of view, it should be kept in mind that during urbanization, rainwater movement and storage in the ground surface within a local watershed are significantly altered by the changes in landscape from natural to man-made [17]. In the case of catchment areas located in suburban areas, extreme phenomena are an important problem, mainly torrential rains. In hydrology, extreme phenomena are those for which the probability of occurrence is less than 10%, i.e., the chance of their occurrence is once in at least 10 years. These are phenomena of high intensity and short duration. According to other authors, driving rain is when 40 mm falls in one hour or with an intensity of more than 20 mm in one hour [18,19,20]. To date, researchers have introduced a wide variety of modeling frameworks to model the hydrological process [21,22,23]. Modeling the flow, or runoff, in the river can be performed using various models. These models are divided into lumped, distributed, and semi-distributed models. In lumped modeling, the catchment is treated as a whole, modeling is carried out for the entire catchment without dividing it into sub-catchments, and the basin response is evaluated only at the outlet [24]. Distributed models, on the other hand, rely on spatial data and computational algorithms to model precipitation–runoff processes. These models are often based on a large amount of data, which are sometimes unavailable [25]. Semidistributed models, on the other hand, are modeled taking into account sub-catchments. This type of modeling does not require a large amount of data and is more detailed than solid models. An example of a model based on semi-distributed modeling is the HEC-HMS model [26]. The HEC-HMS model has been widely used, for example, in many hydrological studies because of its simplicity and capability to be used in common methods. The HEC-HMS model has been used successfully in river basins in different parts of the world for catchment modeling [27,28]. A proper understanding of the precipitation–runoff relationship occurring in the catchment for small sub-catchments is helpful in water resource management and flood control in the catchment area.
Hydrological models are also developed and used for simulation and forecasting tools that allow decision-makers to make the most effective decisions for planning and operations, taking into account the interactions of the physical, ecological, economic, and social aspects of the real-world system. In addition, real-time flood forecasting and warning, flood frequency forecasting, flood route, overflow forecasting, climate and land-use change, and impact assessments of integrated basin management are examples of other applications in which hydrological models are used [29]. Recently, the application of a geographic information system (GIS) has led to models which are able to more accurately represent different catchment processes. For hydrological modeling efforts, a GIS, especially through its capacity to process digital elevation models (DEMs), has afforded new platforms for data management and visualization. Further improvement was achieved by incorporating catchment models into GIS, which streamlines data input and provides enhanced interpretation of model outputs. In this work, modeling in the HEC-HMS program was performed using one of the possible modeling methods [30]. This paper’s main objective is to evaluate the use of the HEC-HMS model in order to investigate the rainfall–runoff interactions in the Wirynka catchment in the central part of Poland. Our method was to prepare input data with GIS techniques. The Soil Conservation Service Curve Number (SCS-CN) method (USDA-SCS 1972), which was used in the model, was chosen to determine the loss rate because it gave reliable hydrological results for small and large catchments [31].
2. Materials and Methods
2.1. Study Area
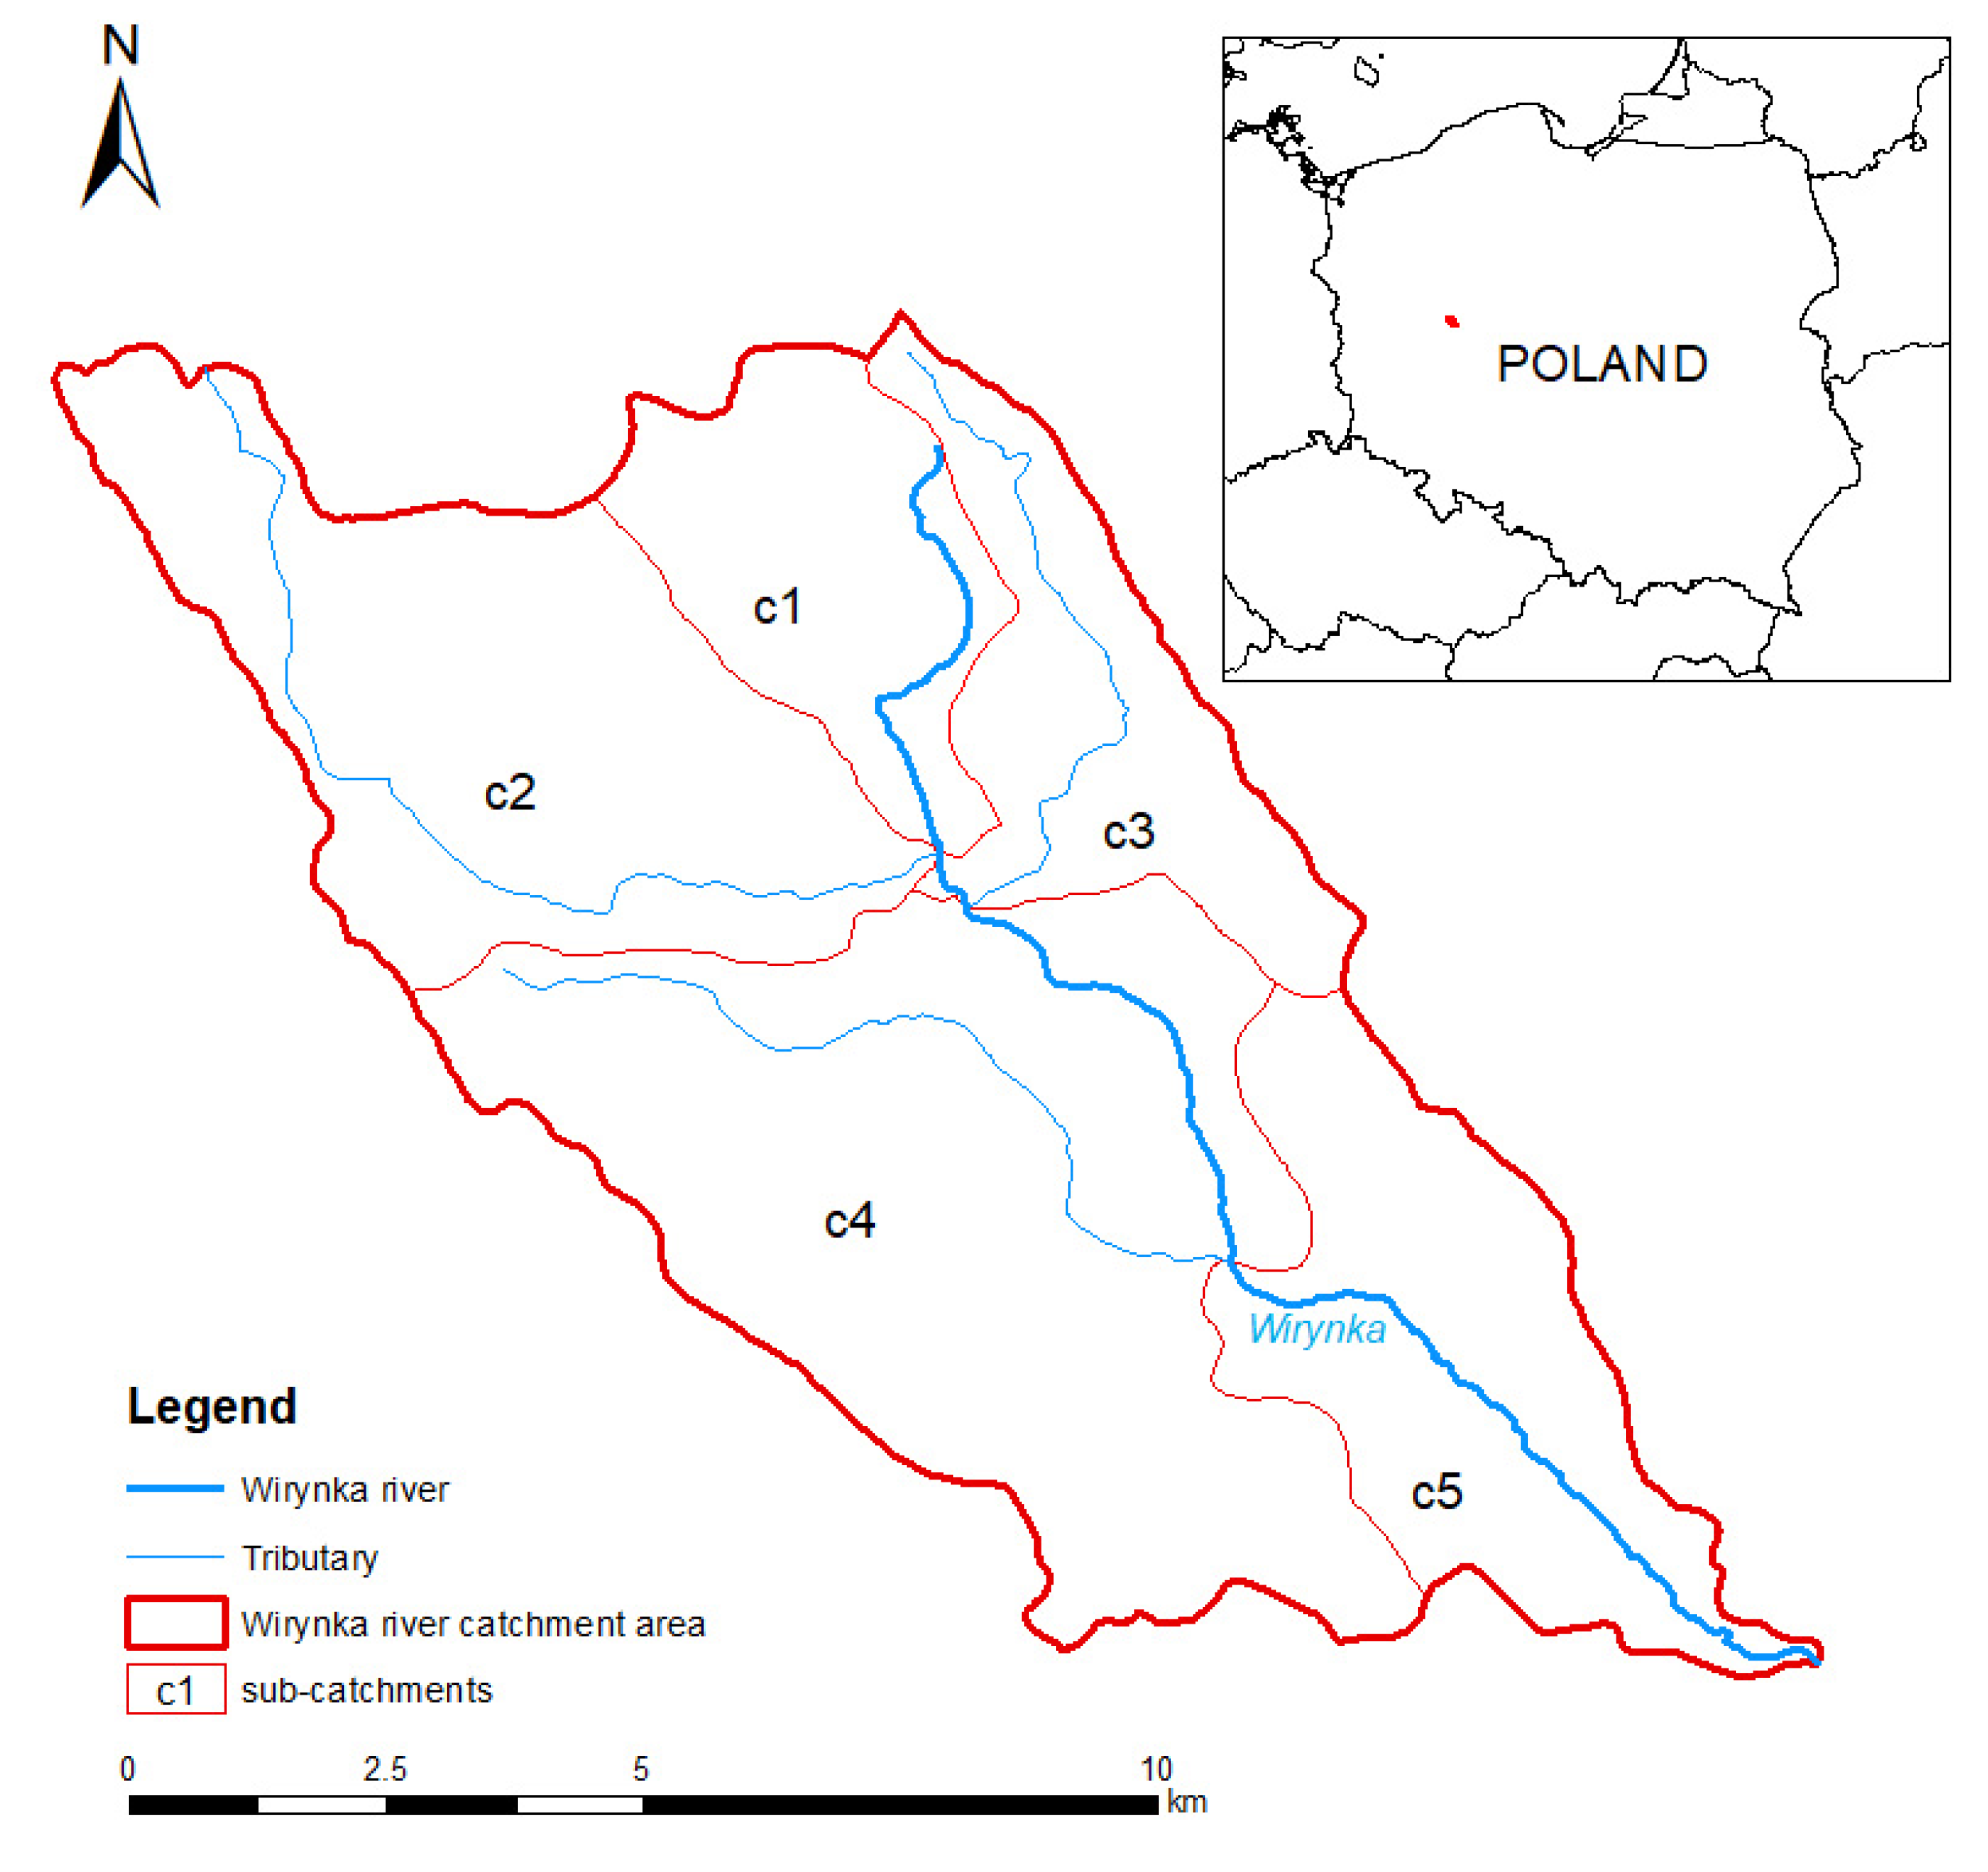
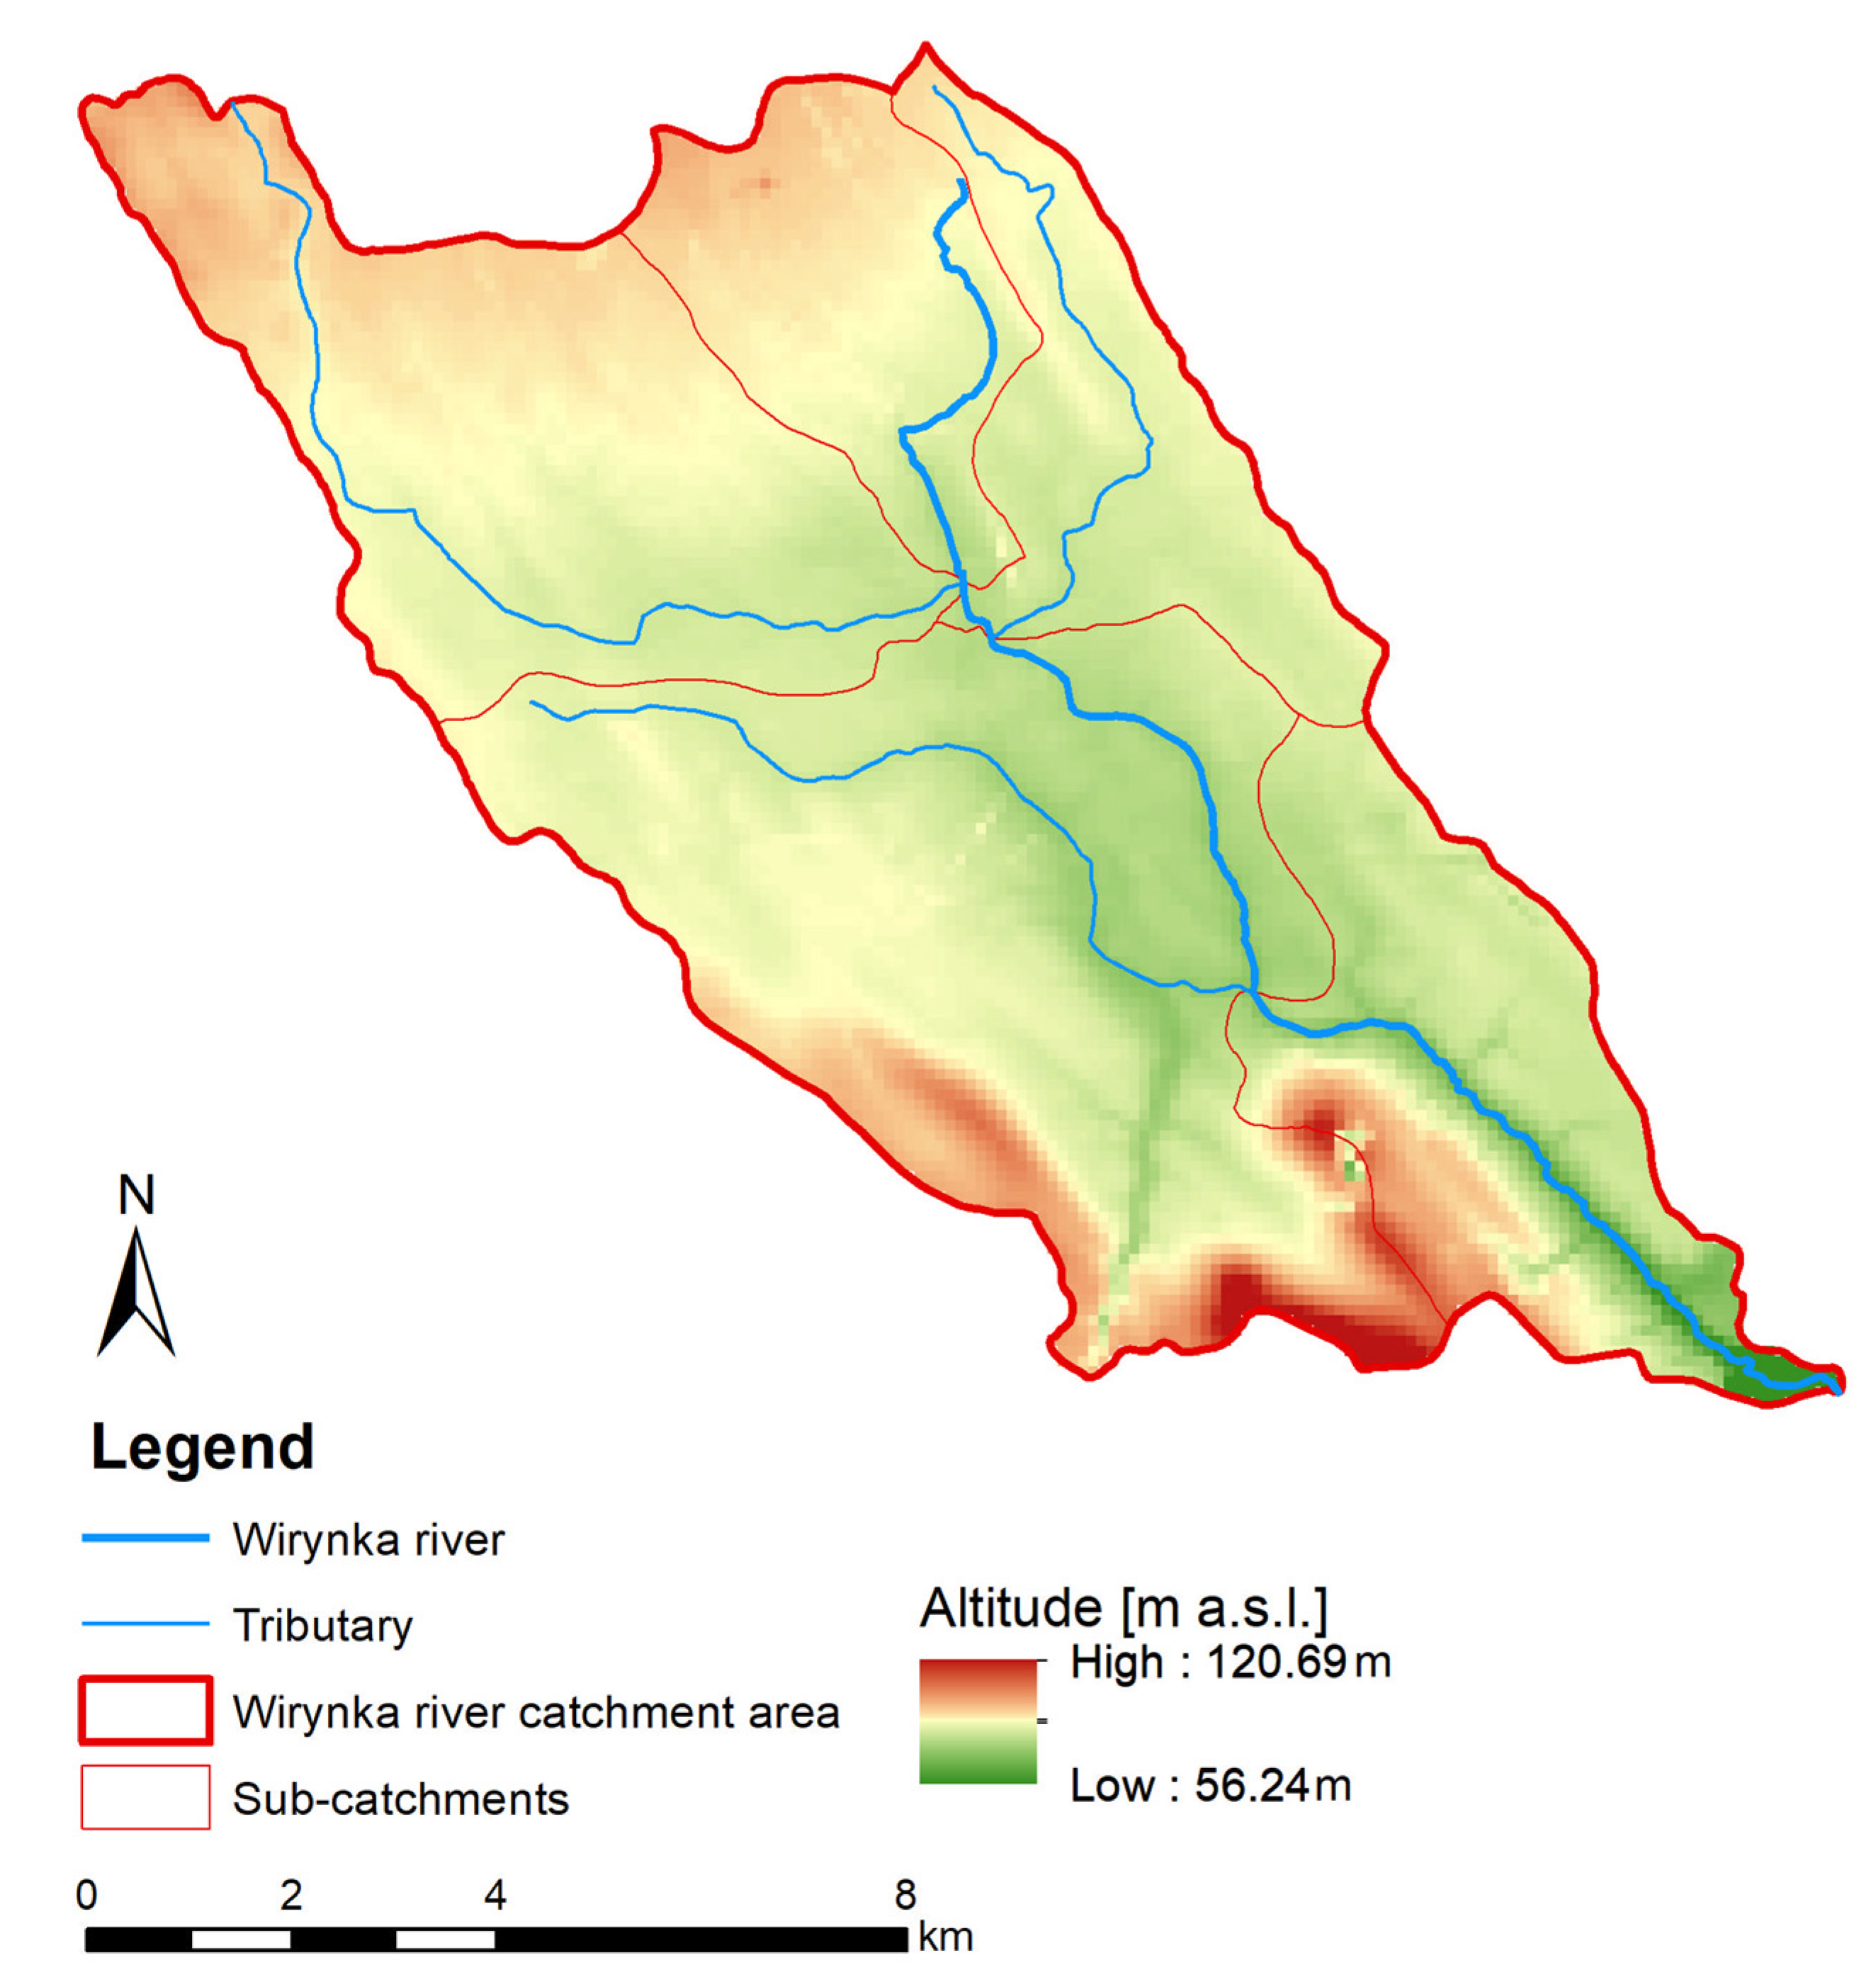
The present study was carried out for the catchment of a lowland river located in central Europe. This catchment has undergone large changes in land cover over the past 30 years and hence serves as an ideal site to evaluate the impact of land cover changes due to urbanization on the flow. The study area is the Wirynka river, located in the central-western part of Poland, in Greater Poland Province, on the outskirts of Poznań (52°24′33″ N, 16°45′19″ E) (Figure 1). With a length of 18.31 km, the Wirynka river is a tributary of the Warta River and joins it at the 257.7 km point. The Wirynka river is fed by two watercourses. It is an uncontrolled river in the middle and lower banks where the channel adopts a winding character. The average annual flow of the river is estimated at 0.3 m3·s−1. The Wirynka river is characterized by natural water flow and there are no devices with an accumulation height of more than 0.4 m. The total catchment area is 102.28 km2 and the altitude range is from 56.24 to 120.69 m above sea level (Figure 2). The Wirynka river catchment area, due to its attractive location, is subject to strong investment pressure and directly participates in the urbanization process. The dynamics of the changes taking place are best reflected in the ever-increasing number of residents. The catchment area of the Wirynka river is more than 95% within the administrative boundaries of the municipalities of Dopiewo and Komorniki. In the case of these municipalities, a 7-fold (Dopiewo) and 6-fold (Komorniki) increase in the number of people registered for permanent residence was observed between 1990 and 2018 [32].
2.2. Data
We obtained the following cartographic products that served as the basis for the study:
- -
- A map of the hydrographic division of Poland (scale 1:10,000),
- -
- A map of the hydrographic division of Poland (scale 1:10,000), and
- -
- Corine land cover (CLC) vector layers for 1990 and 2018.
Spatial data are in the form of a digital elevation model (DEM). A DEM was downloaded with a 5 m by 5 m resolution using LIDAR (light detection and ranging). We adopted a DEM to verify the boundaries of the Wirynka river catchment and to study the topography of the land surface.
2.3. Methodology
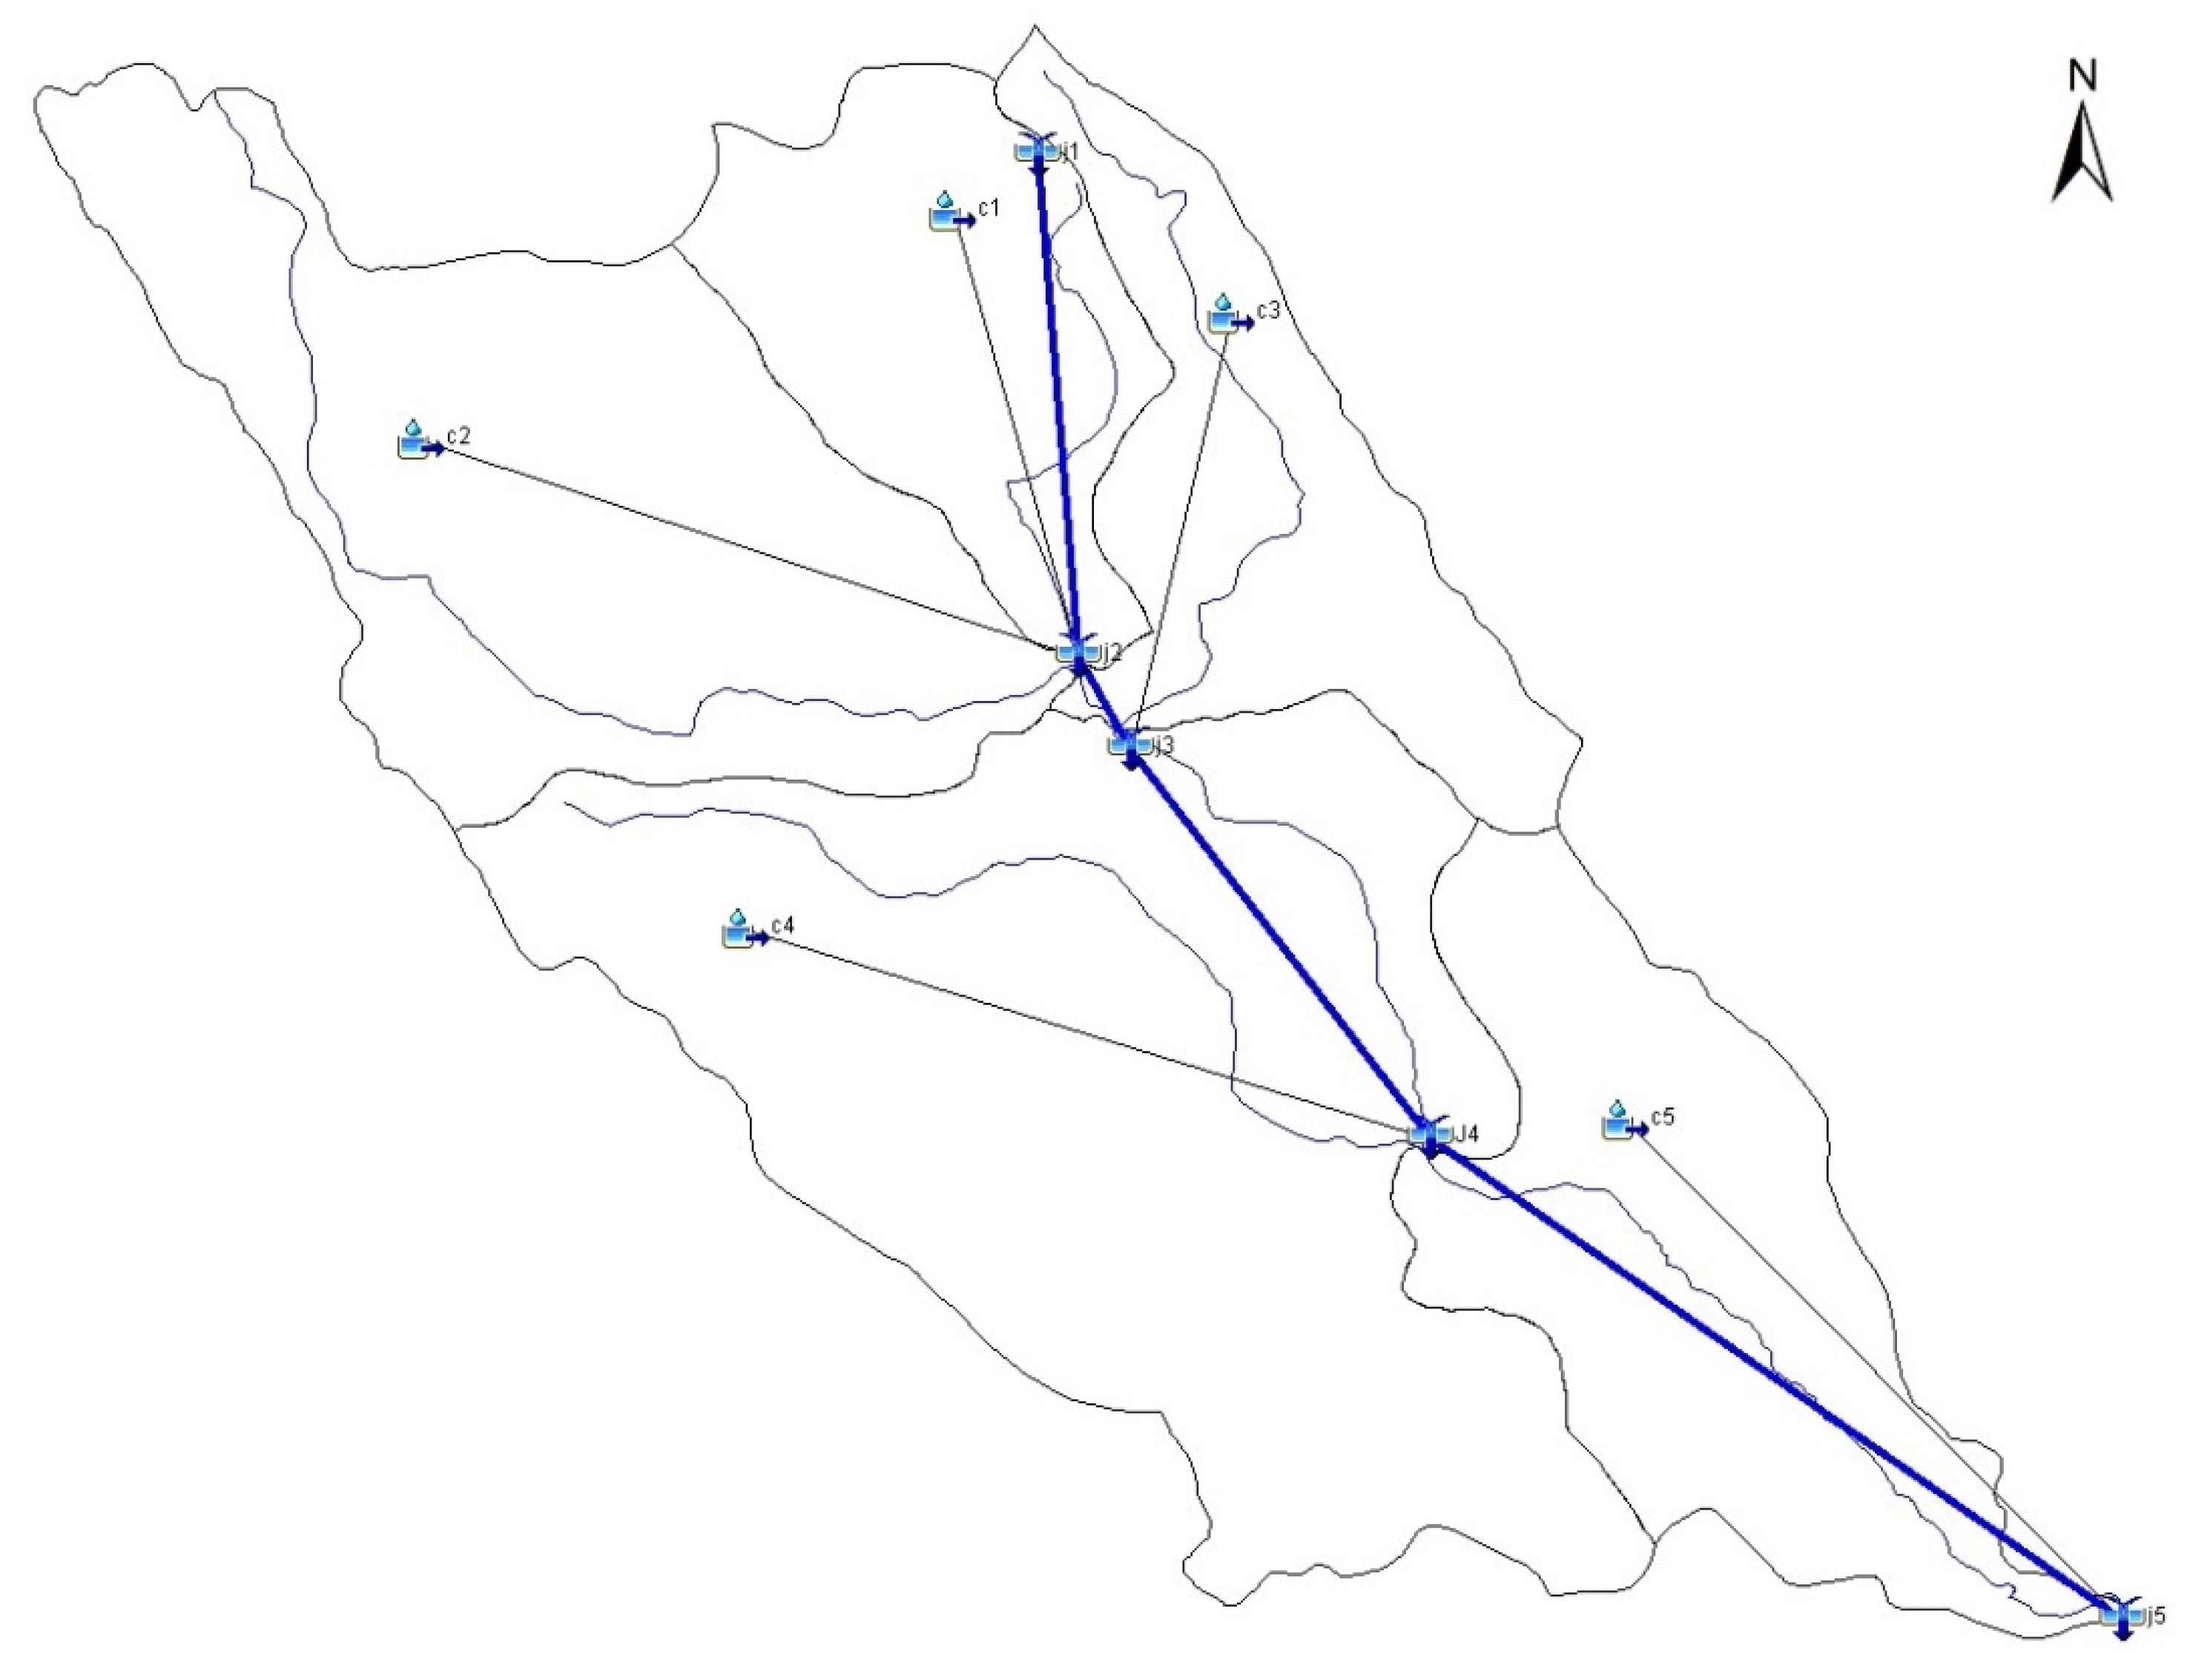
The catchment area was delineated in Arc GIS 10.7.1 software. In order to improve the performance of modeling, the catchment was subdivided into sub-catchments to use in the model as semi-distributed. The Wirynka catchment was divided into five sub-catchments (Figure 1). Spatial parameters and physiographic parameters of the catchment area were determined on the basis of information layers: a topographic map and a hydrographic map. The characterization of changes in the catchment’s land use from 1990 to 2018 was carried out on the basis of Corine land cover (CLC) vector layers for 1990 and 2018. The characterization of soil conditions in the catchment was carried out on the basis of a hydrographic map.
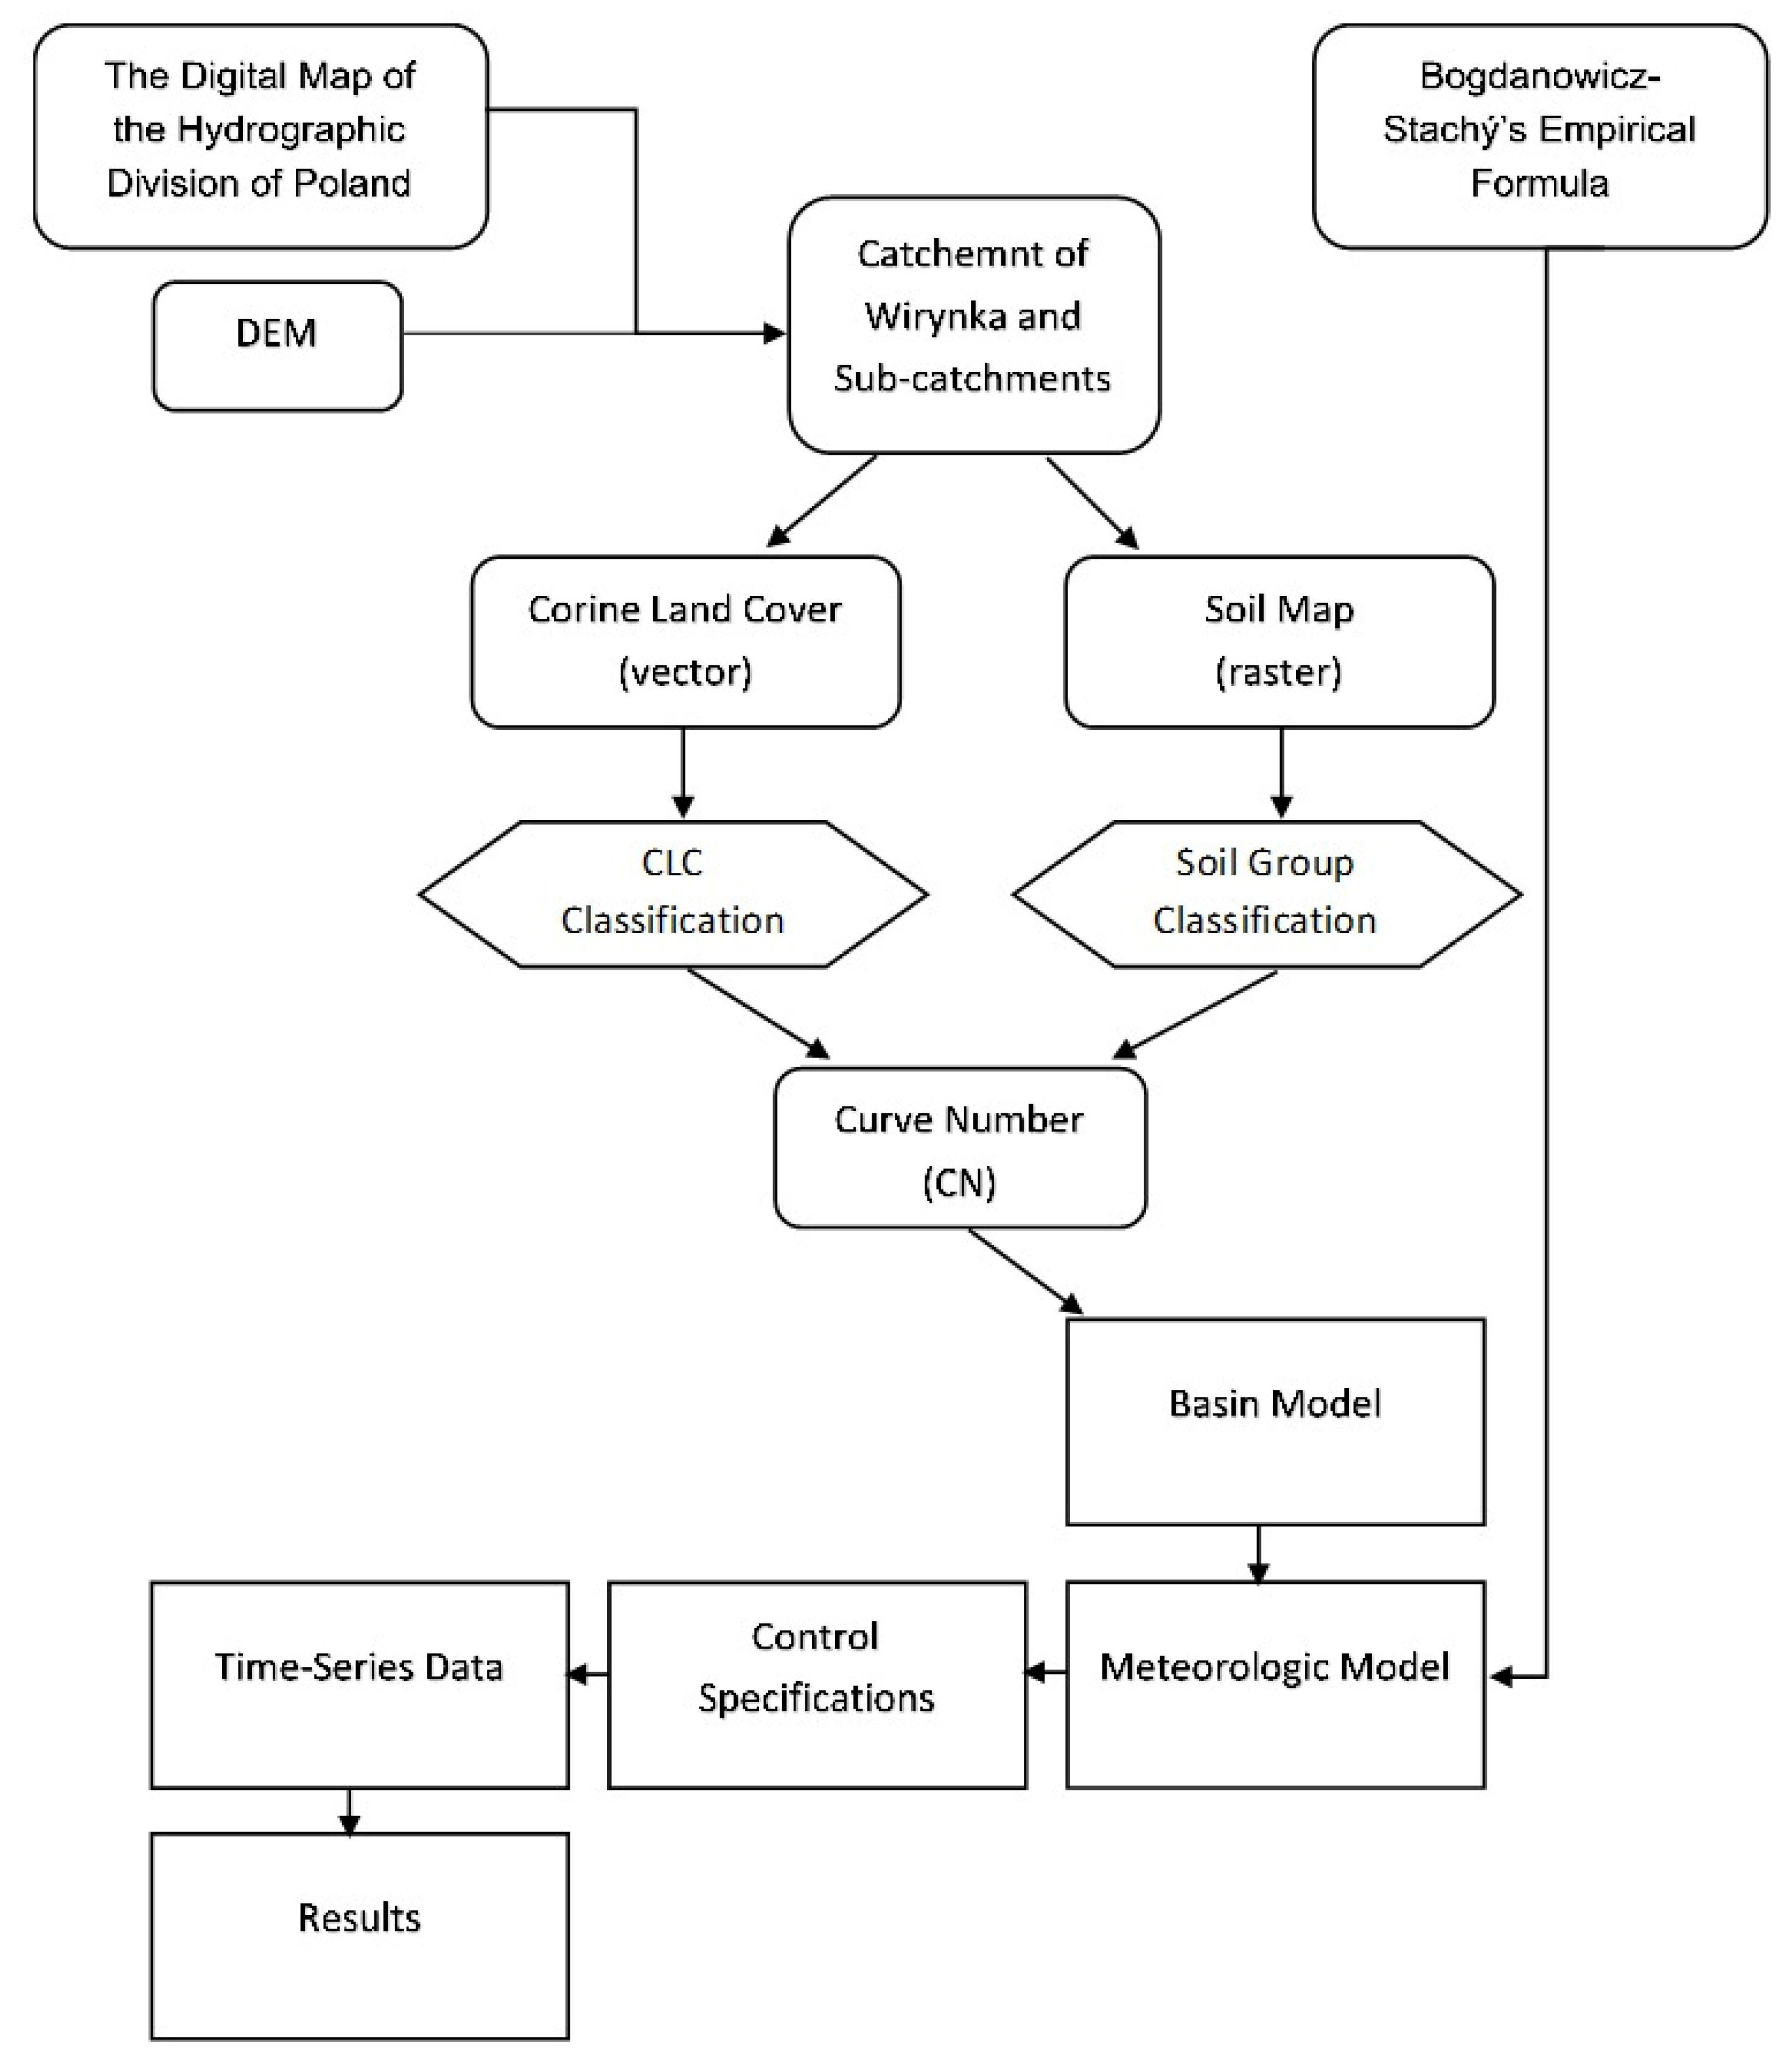
The cartographic materials collected in this way served as input material for the creation of a numerical database of the Wirynka river catchment. Then, with the help of the program HEC-HMS 4.8 using data on land use structure and soil species, the necessary parameters were automatically entered into the HEC-HMS model spatial parameters to simulate the impact of the land use structure on the outflow from the catchment. The simulation was carried out in two variants for the 1990 and 2018 land use (Figure 3).
In the first stage of the work, the amount of forecast precipitation (1) was assumed. The following input data variants were adopted for the model: the duration of the rain was defined as 1 h, while the probability of overtopping was used for three variants of 10%, 5%, and 1%. Calculations were made based on Bogdanowicz–Stachý’s empirical formula [33]. The Wirynka river catchment is a small uncontrolled catchment, so taking this into account, constant precipitation was assumed with the maximum intensity in the middle of its duration. Effective precipitation was determined using the SCS-CN method [34], which depends on three factors: soil species, land use, and soil moisture content prior to the occurrence of the considered precipitation. The interaction of factors is captured by the dimensionless CN parameter, which takes values from 0 to 100. The CN parameter (2) makes it possible to calculate the maximum potential retention of the catchment area S (3). In the next step, the transformation of effective precipitation into direct runoff was carried out using the HEC-HMS program (Figure 3):
where t is the duration of rain (min), α is a parameter that depends on the region and time, and p is the likelihood of precipitation, and:
where CNj is the value of the CN parameter for the j-th homogeneous surface characteristic for a given catchment cover, method of use, and type of soil, Aj is the area of the j-th homogeneous surface, A is the catchment area, and m is the number of homogeneous surfaces. The curve number (CN) is related to the potential maximum retention (S) (Equation (3)).
The Hydrologic Engineering Center’s Hydrologic Modeling System (HEC-HMS) is a hydrologic modeling software developed by the US Army Corps of Engineers of the Hydrologic Engineering Center (HEC). HEC-HMS is a semi-distributed conceptual hydrological model that simulates flow and runoff. The model requires spatial catchment data to simulate runoff. In addition, daily precipitation data and river flow data are required. The HEC-HMS model consists of a catchment model, a meteorological model, specifications, and input data (time-series data). Direct runoff is transformed to stream flow by a user-selected transform method. The transform options include several unit-hydrograph methods, the Clark time-area method, the kinematic wave method, ModClark, SCS Unit Hydrograph, and others. In this study, the elective method of transformation was the SCS Unit Hydrograph method because of the catchment data we had. The HEC-HMS model setup consists of four main model components: the basin model, the meteorological model, control specifications, and input data (time-series, paired data, and gridded data) [35,36,37] (Figure 3).
3. Results and Discussion
In this study, the scarcity of runoff recorded data is a serious problem for effective planning and sustainable management in the area. Considering the current problem of limited data, rainfall–runoff modeling was carried out in the Wirynka catchment.
3.1. Characteristics of the Catchment Area
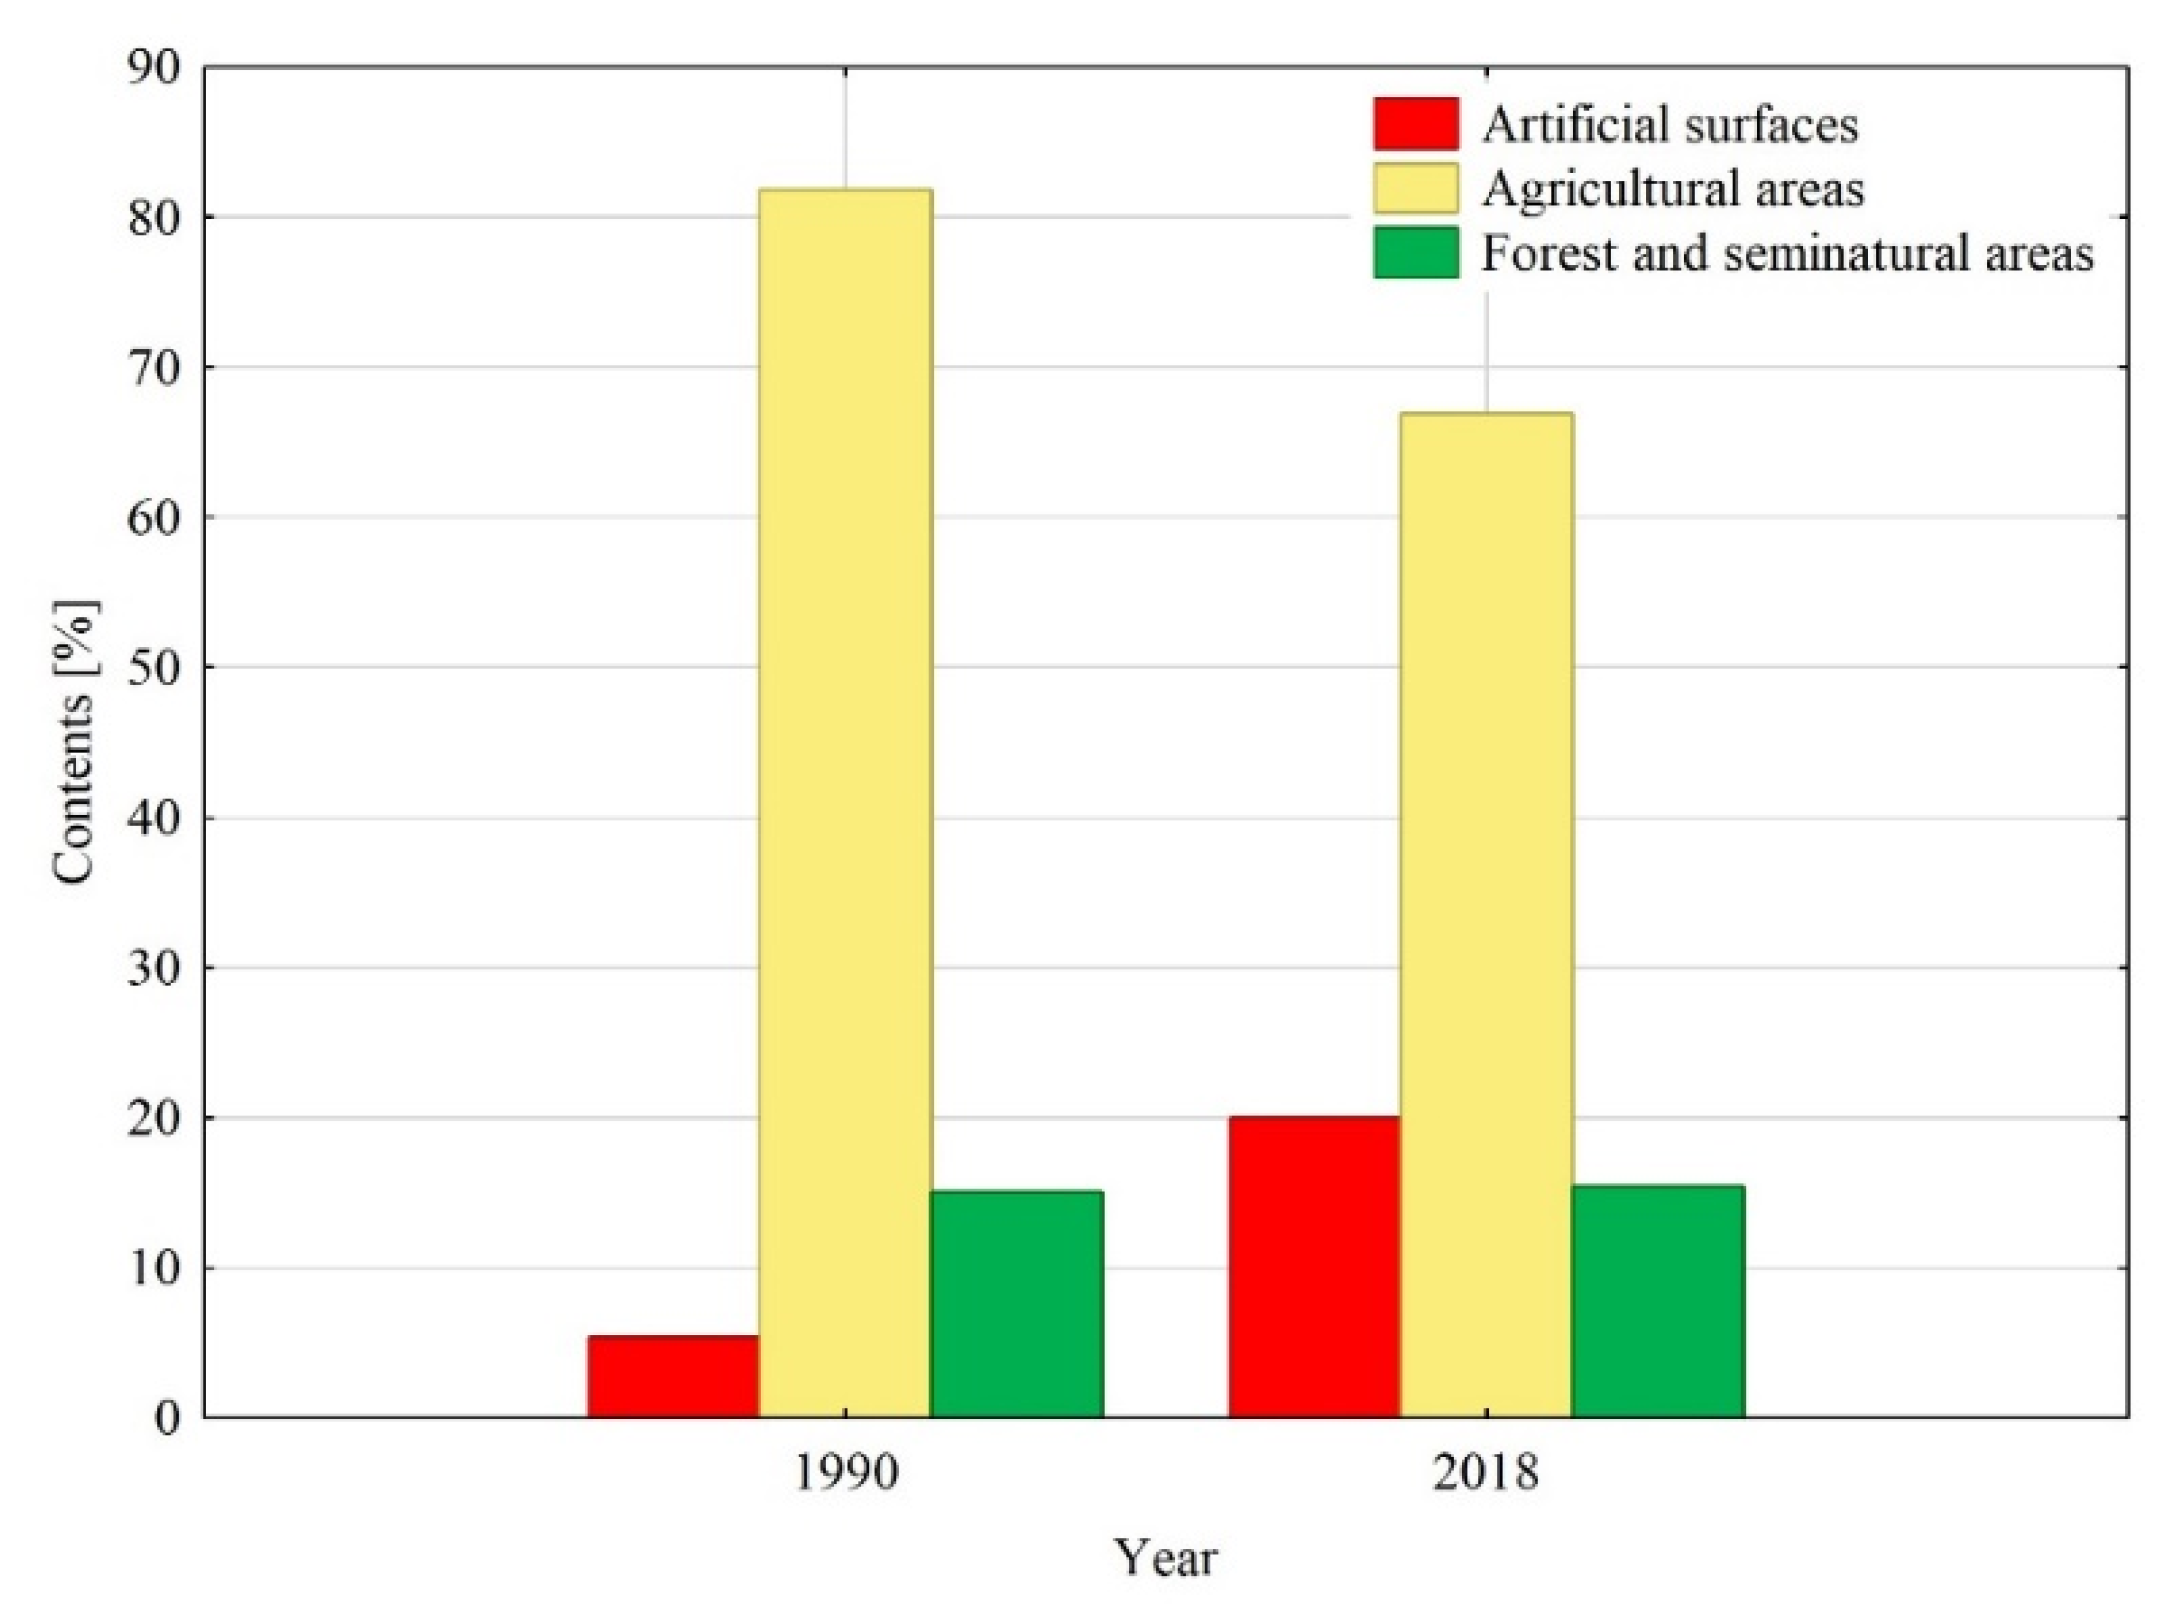
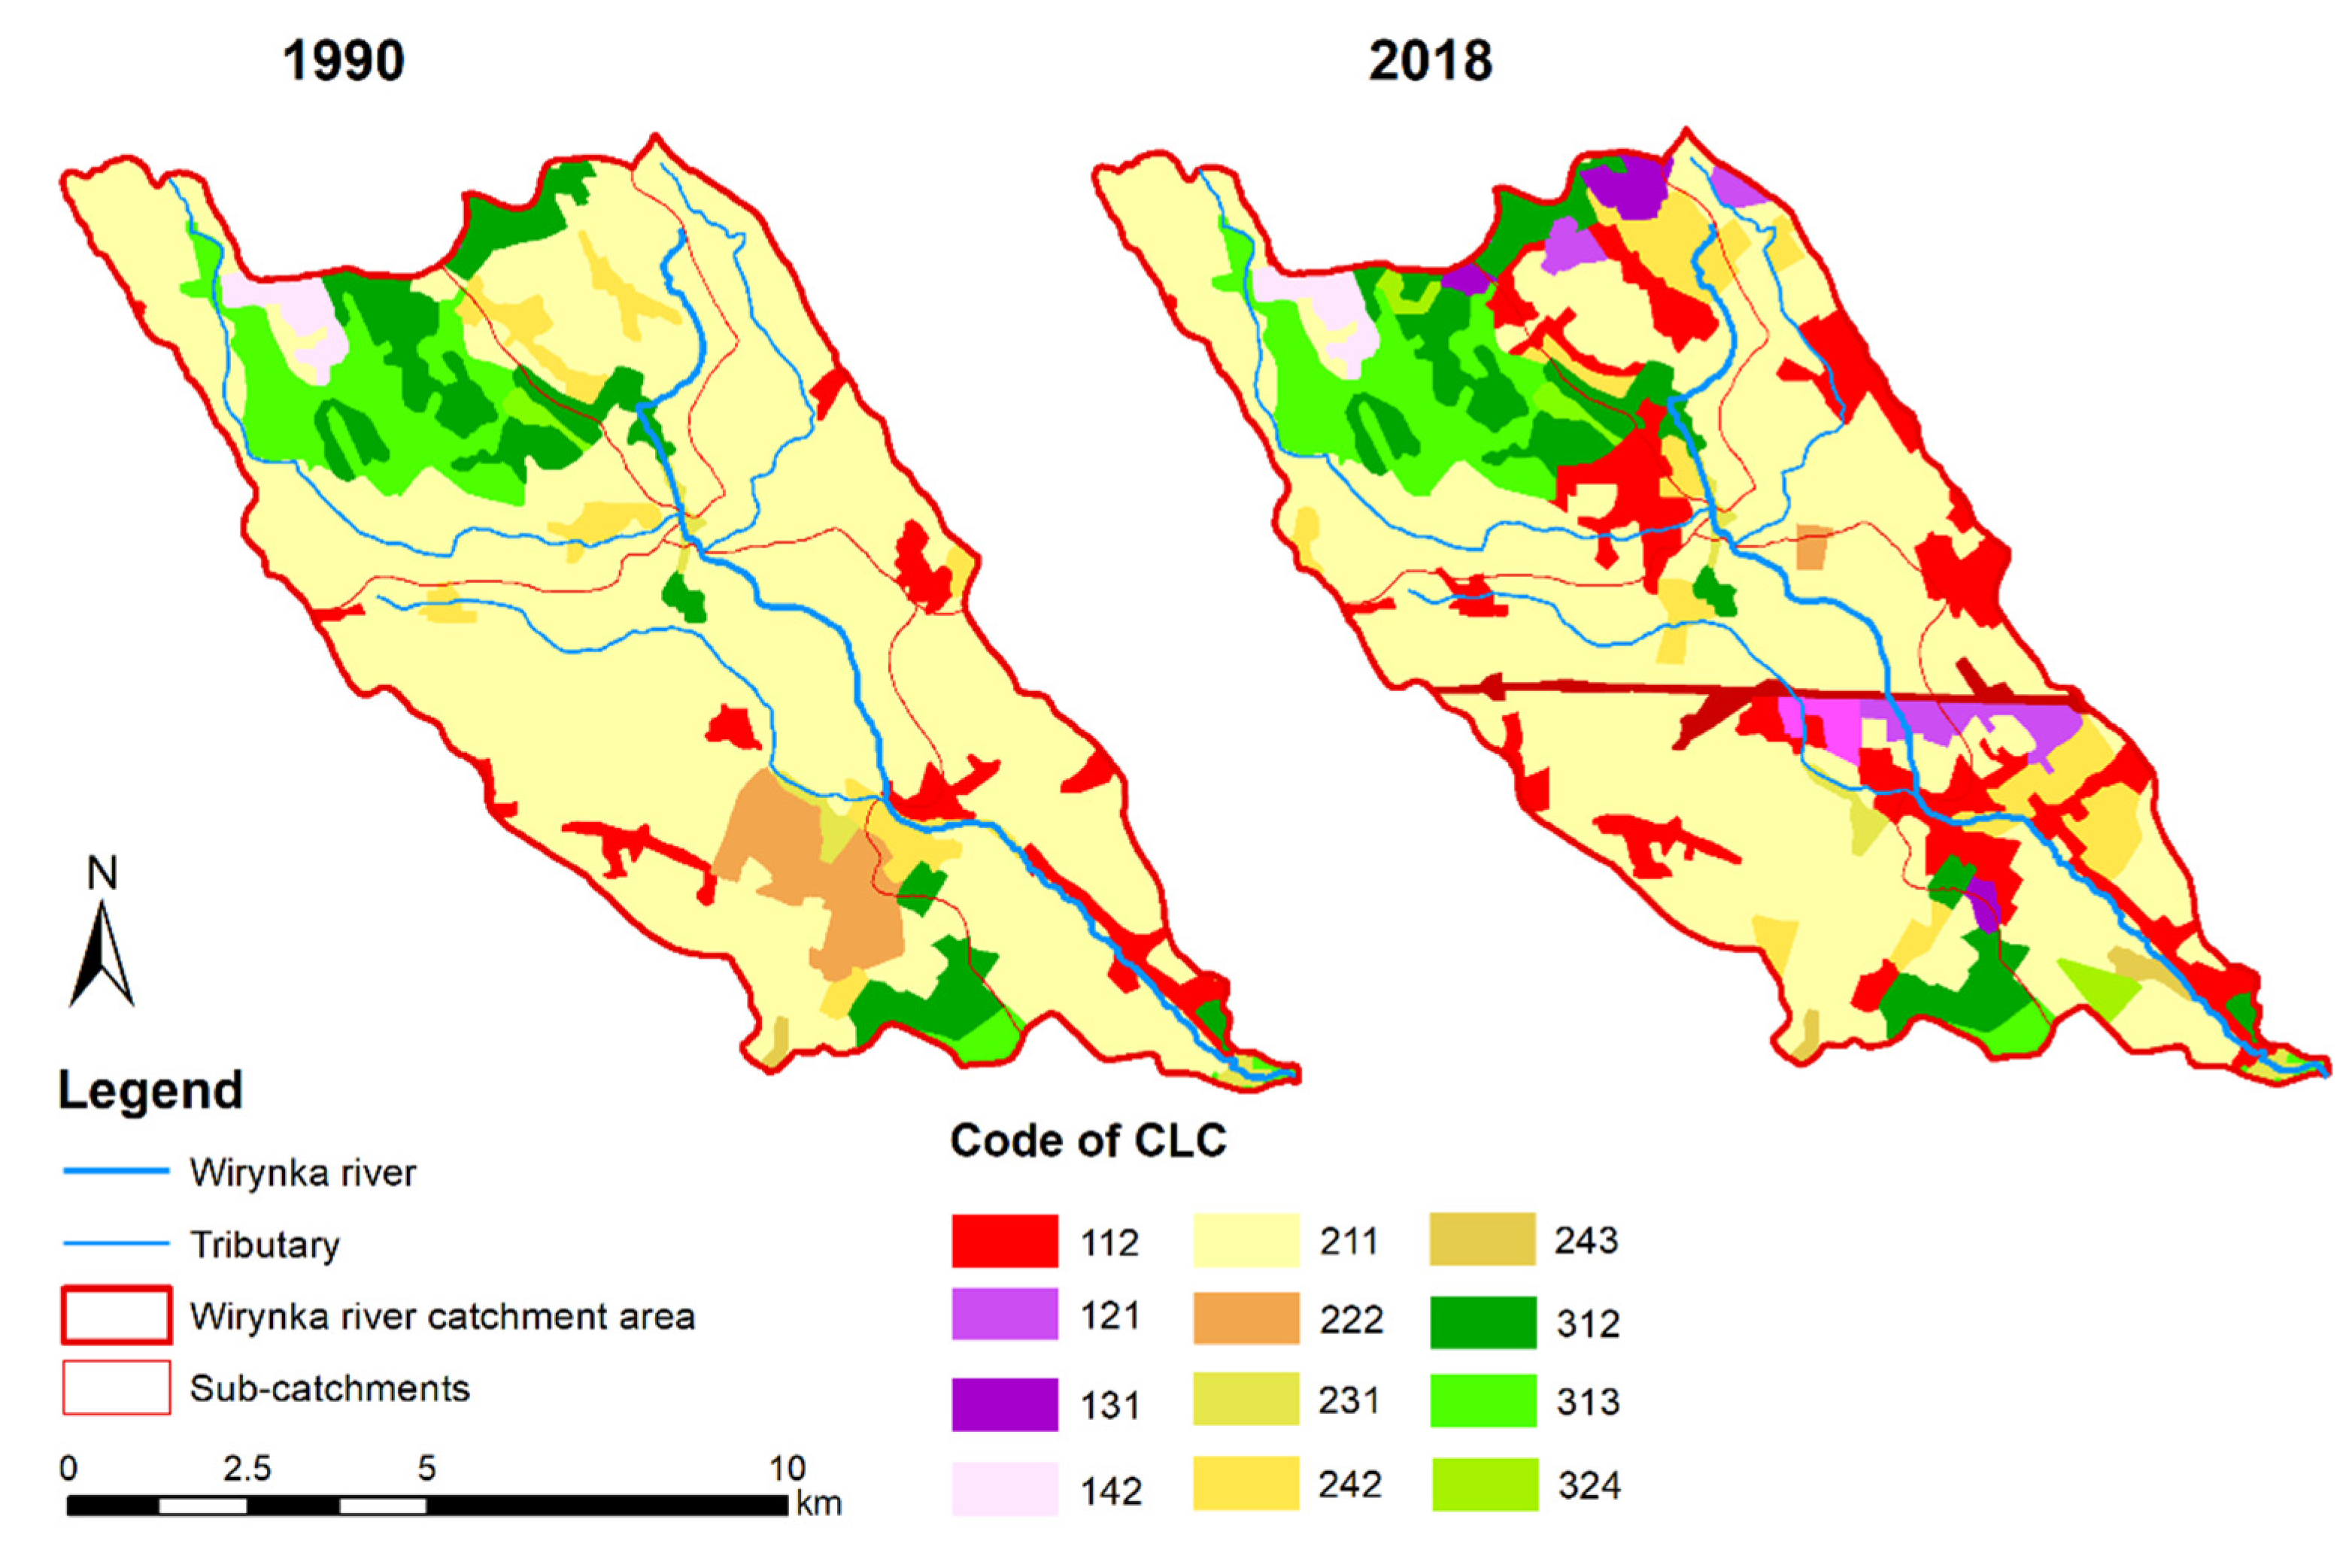
An analysis of the land use map of the Wirynka river catchment from 1990 showed that the catchment was typically agricultural in character. It was observed that the share of the predominant form of use of all elementary catchments was very high and exceeded 80% (except for sub-catchment c2, where the proportion of this form was more than 56%). In 1990, a low percentage was observed for artificial surfaces (urbanized areas), which did not exceed 12% at the scale of each sub-catchment (Figure 4 and Figure 5).
On the other hand, comparing the 1990 and 2018 CLCs, a change was observed in the land cover of the Wirynka river sub-catchment. The share of agricultural land decreased for each sub-catchment, on average by 17% compared to 1990. The largest increase in artificial areas was observed for sub-catchments c1 (24.7%) and c5 (21.8%). The source of the Wirynka river is located in sub-catchment c1, while the estuary of the river is located in sub-catchment c5, which may negatively affect the increased flow of water in the river (Figure 2). In addition, it was observed that the change in catchment use was related not only to a reduction in the proportion of agricultural land but also to a reduction in the proportion of forest land in the case of sub-catchments c2 and c5.
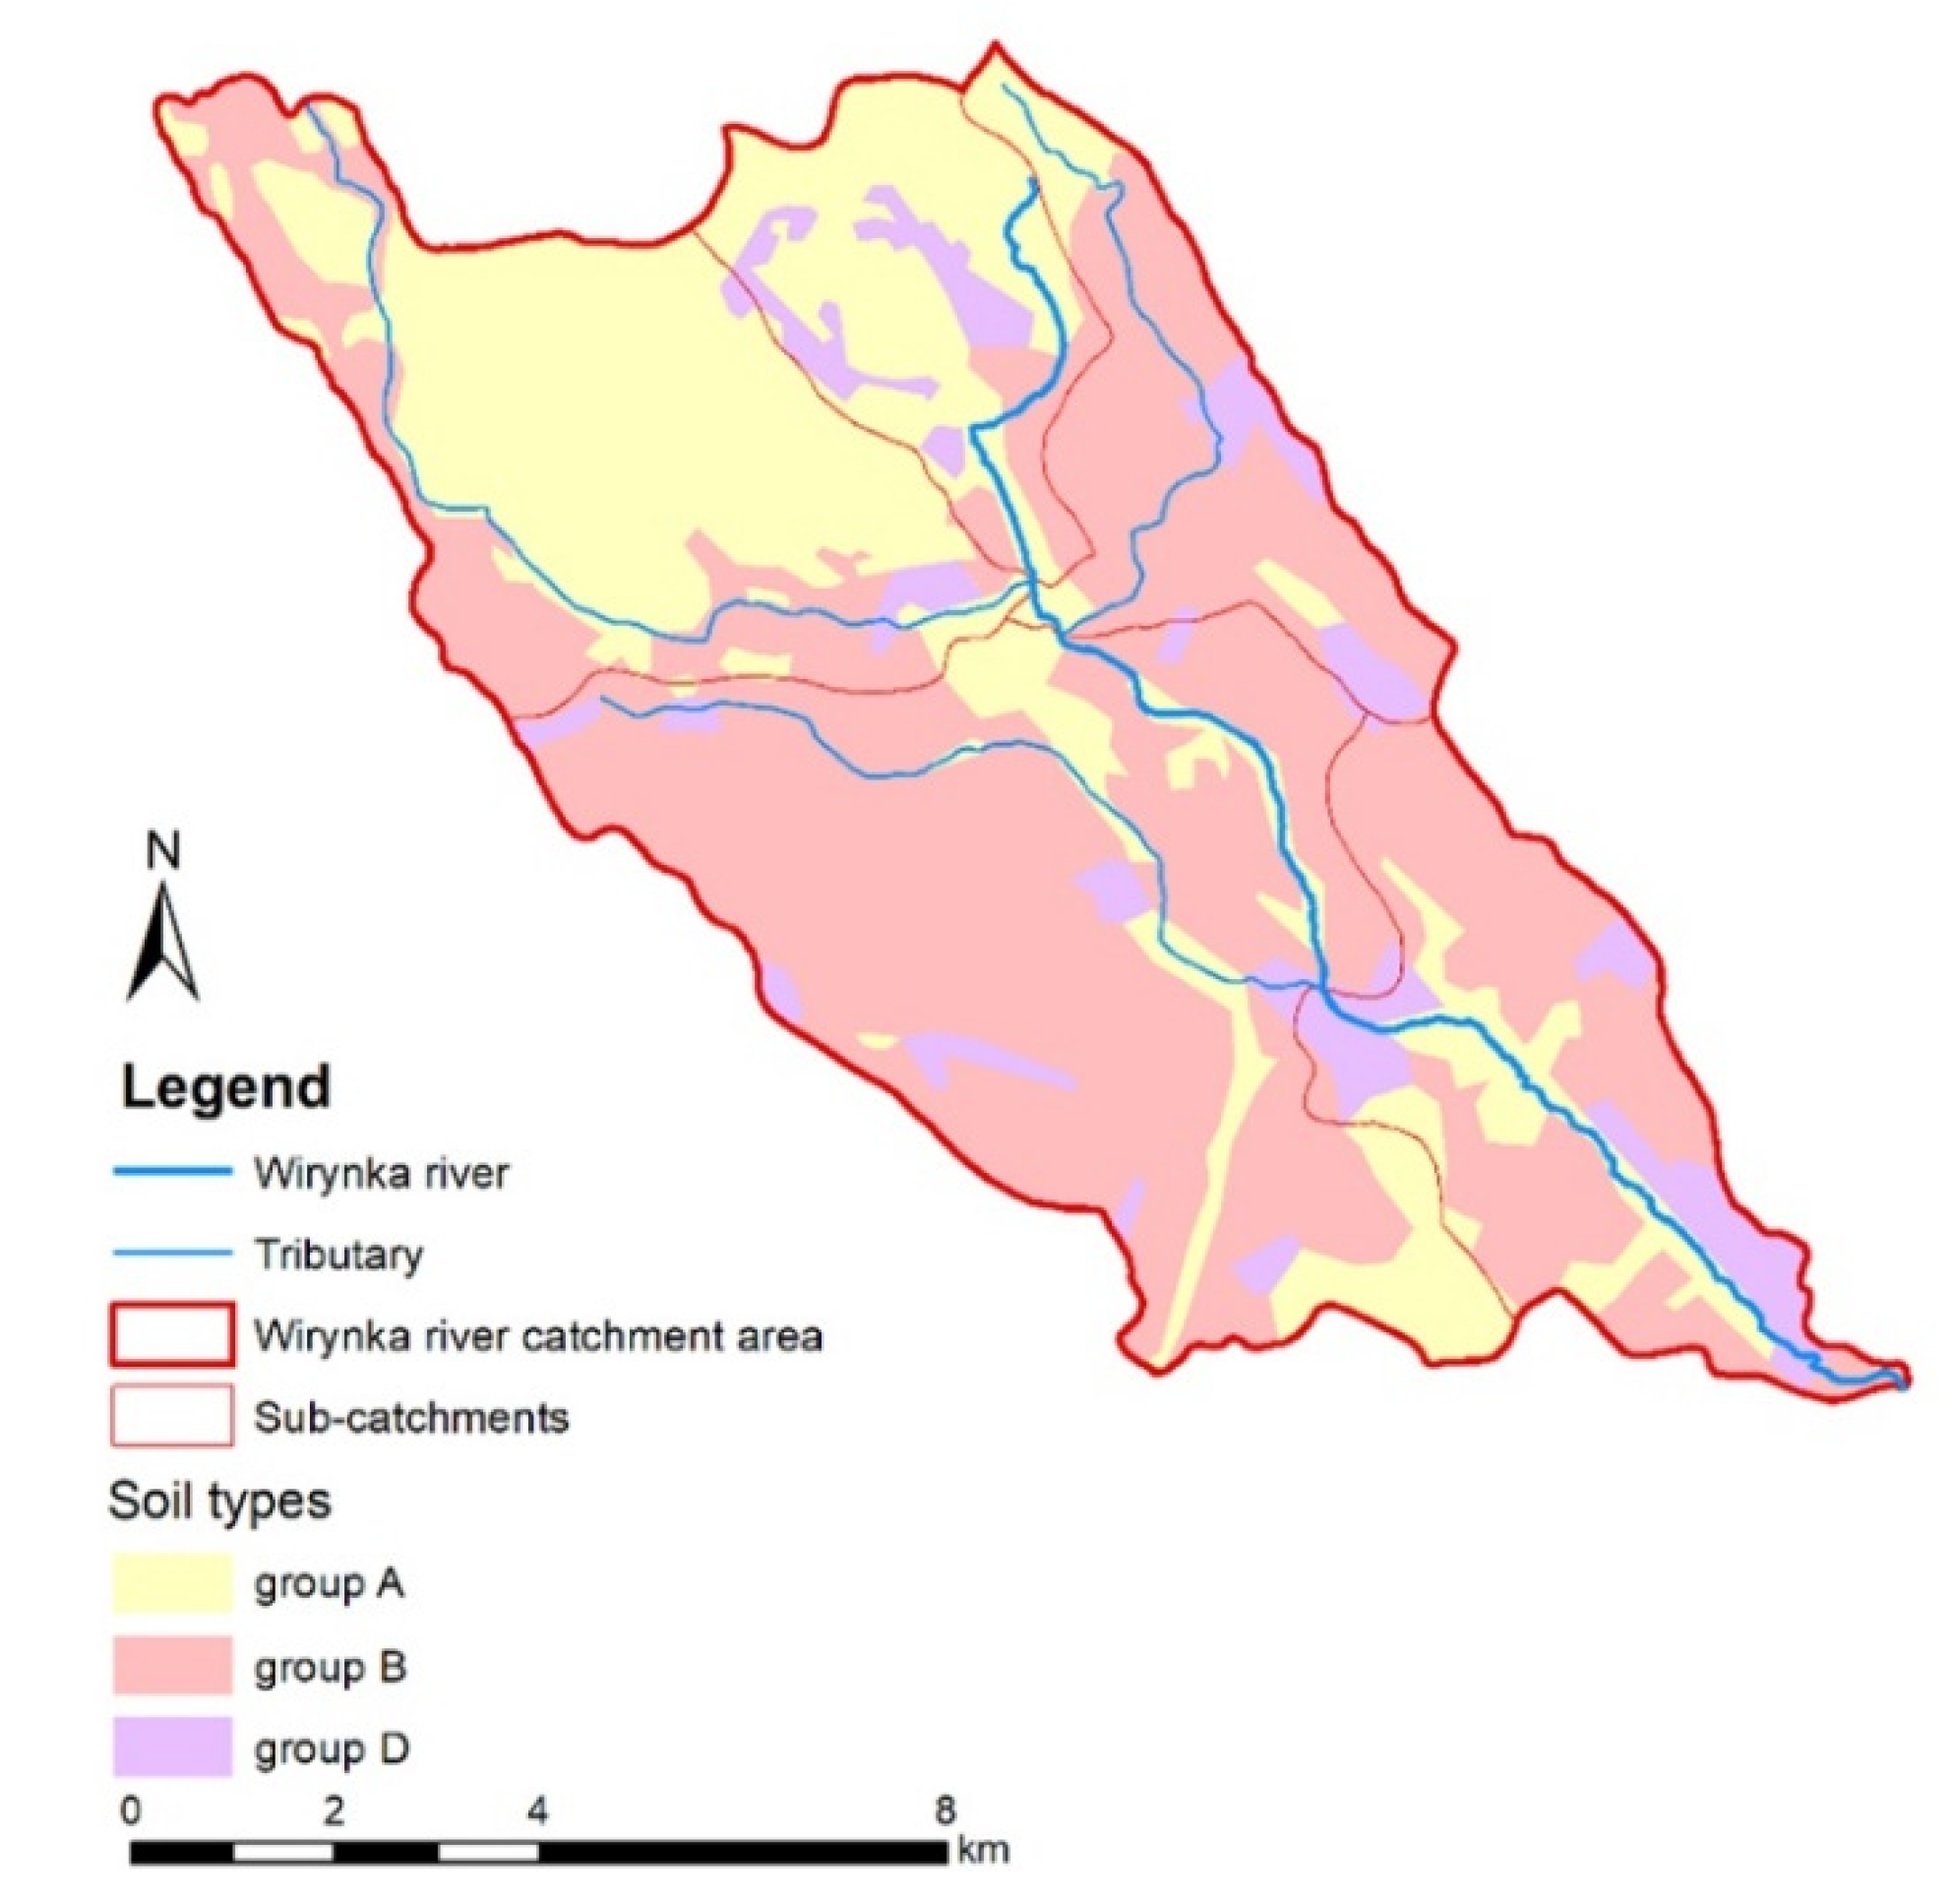
Analyzing the surficial geological structure of the Wirynka catchment in terms of water permeability, it was observed that the dominant soil type was type B, characterized by poor permeability (mainly clay and dust). The area included, to an insignificant extent, areas with high permeability (type A—sands and gravels) and varying permeability (type D—anthropogenic areas). There were no soils in the area classified as group C, i.e., with very poor permeability. The predominant soil type (group B) with poor permeability may contribute to increased rainwater runoff after precipitation events (Figure 6).
3.2. Input Parameters Necessary for Modeling
The analysis of the change in land use and soil types for the Wirynka river catchment showed that it had a direct impact on the value of the CN parameter. The value of the CN parameter for 1990 did not exceed 67 (for every sub-catchment) (Table 1). However, with the change in the use of the catchment, a significant increase in the CN parameter was observed in 2018. This increase was related to the change in land cover that occurred during this period. The largest increase in the CN parameter was observed in sub-catchment c3, where the increase in CN was 13.12. In the case of this sub-catchment, an increase in the proportion of urbanized areas was also observed at a level higher than the average variation in the increase in this parameter. In addition, the amount of retention on the two test dates also changed, which was significantly affected by the change in the CN parameter (for every sub-catchment). Similar observations were described by Sojka et al. [38], who observed, for a small catchment area of the Różany Potok river, an increase in the CN parameter in successive years as a result of a strong urbanization process. In contrast, Knebel et al. [39] observed the opposite situation, where as a result of a reduction in the CN parameter, an increase in the amount of water system recharged and thus a decrease in runoff was observed in the model.
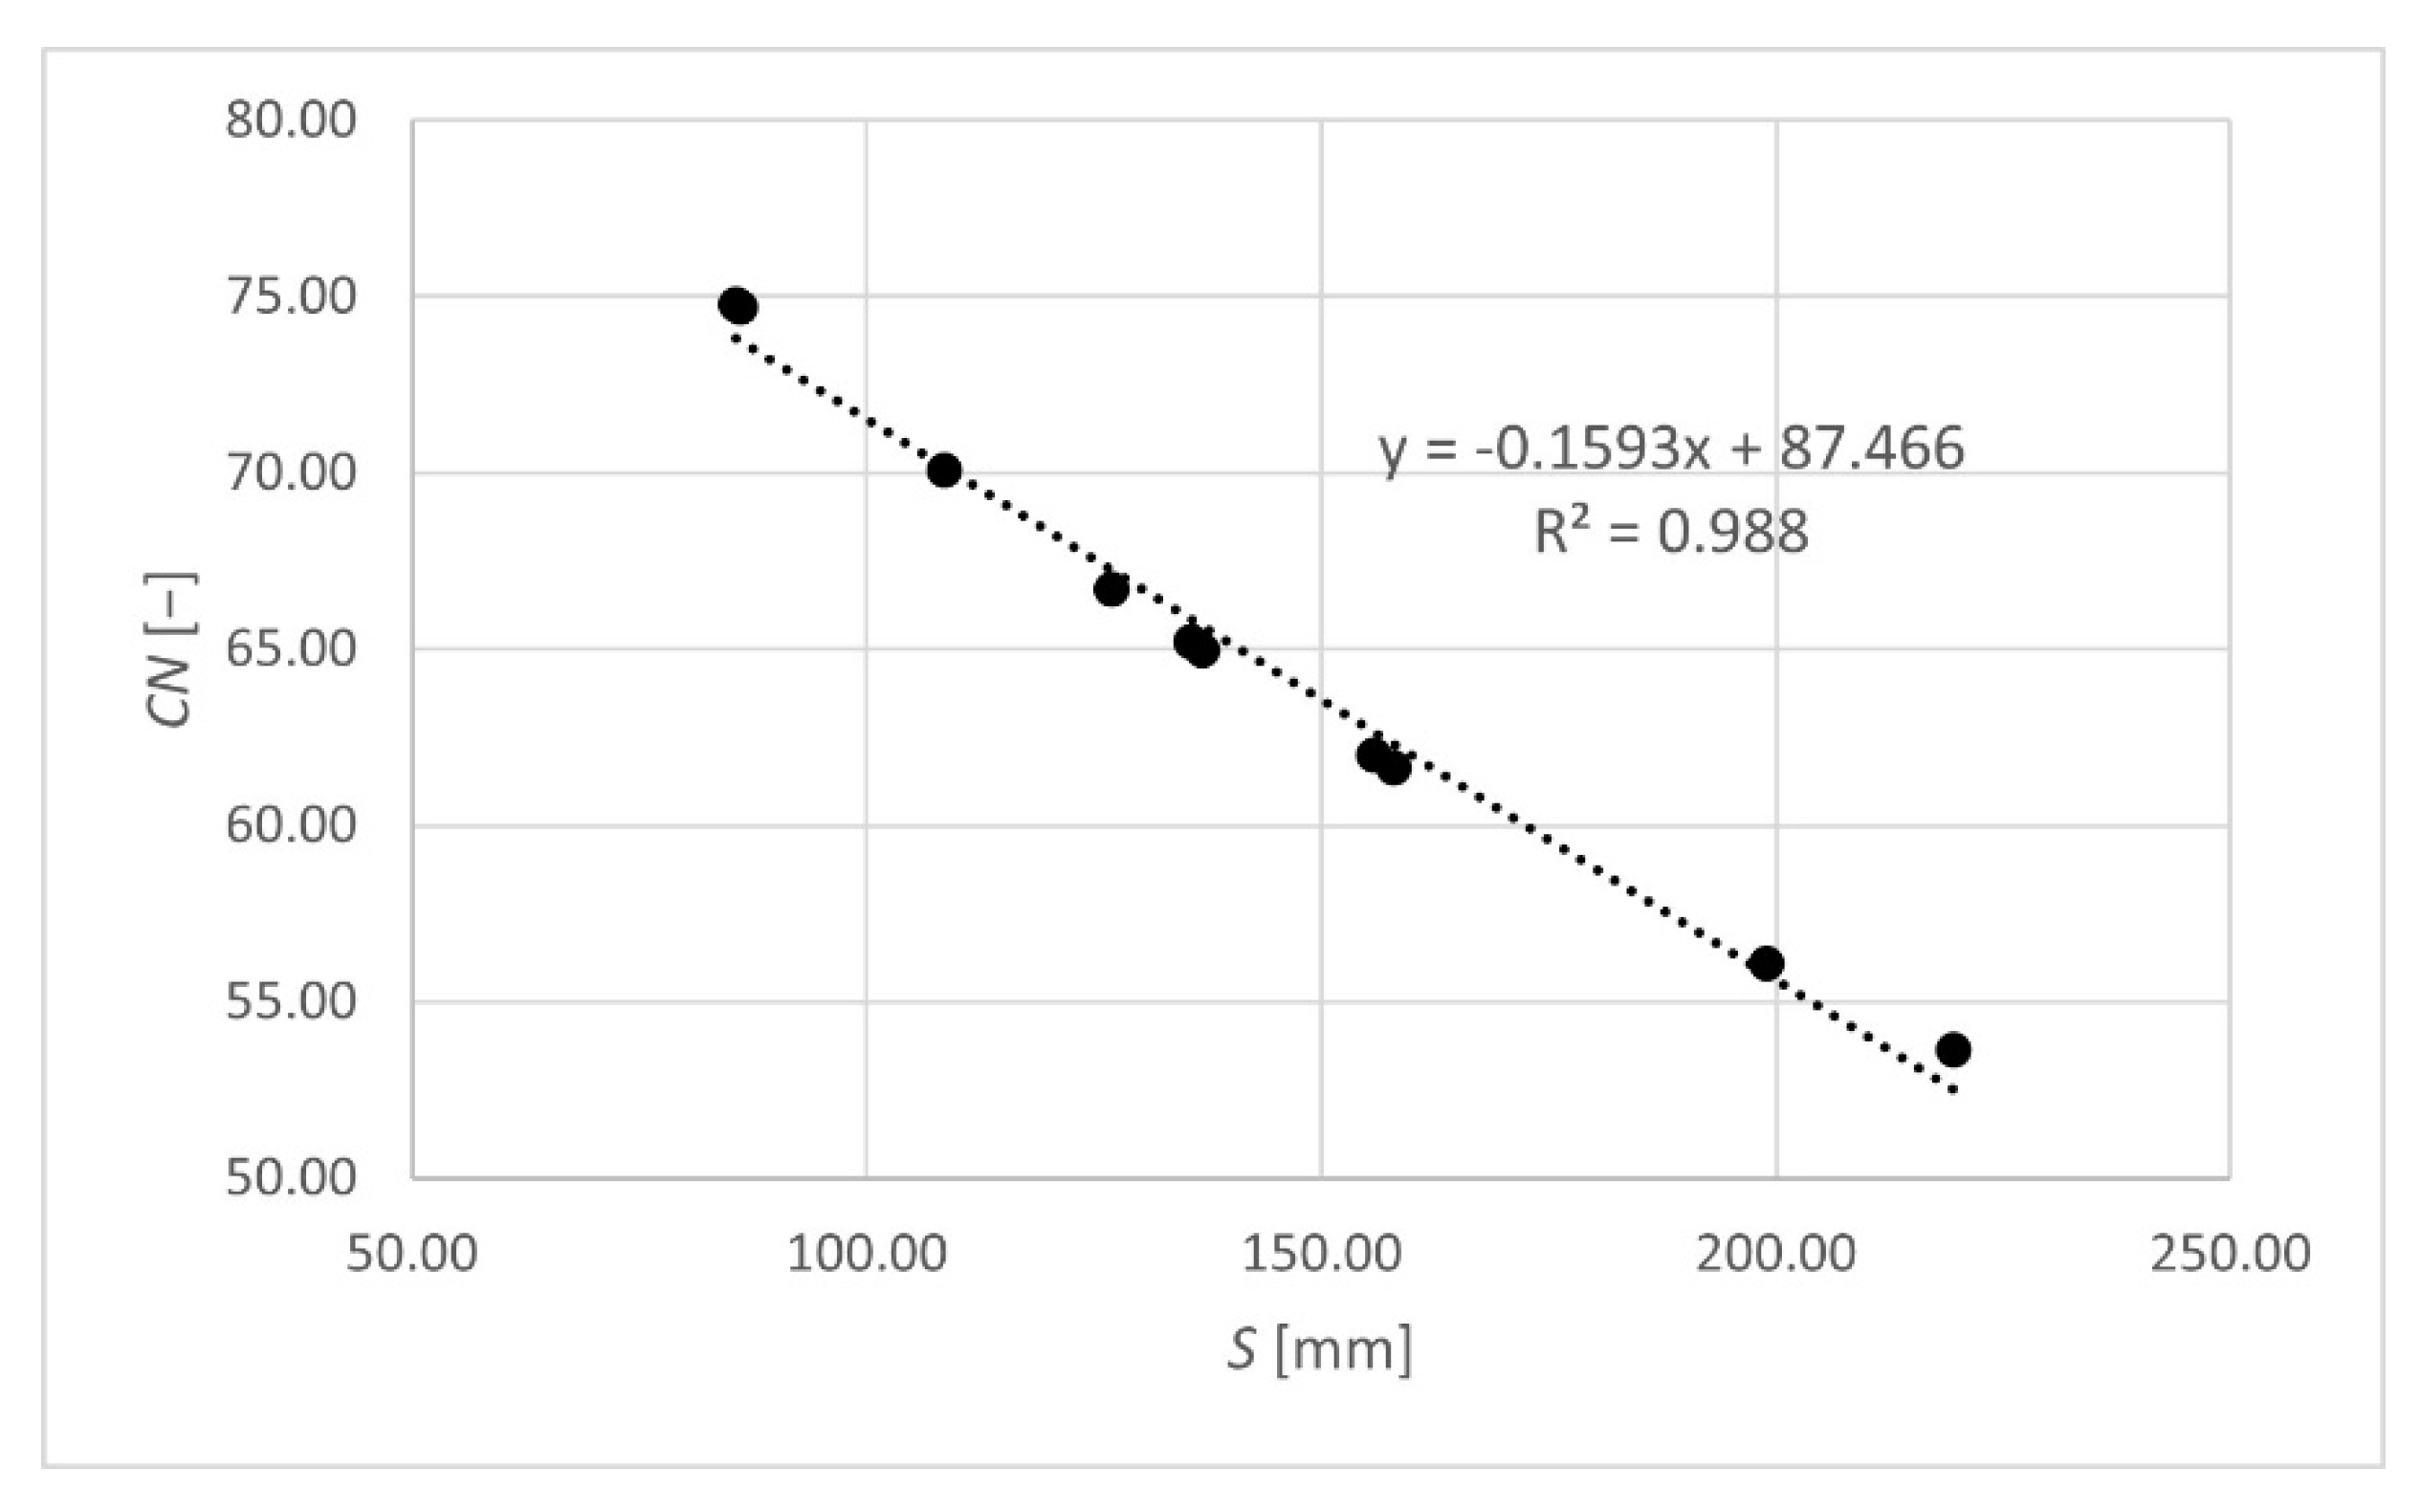
In addition, this study analyzed the relationship between CN and the amount of retention (S). The correlation coefficient between CN and S was 0.998 (Figure 7, Table 1). This means that as the CN parameter increases, we observe a decrease in retention, that is, a decrease in the amount of water that can be retained by soils in the area. Thus, further changes occurring in the suburban area of Poznań (urbanization) may contribute to a decrease in retention capacity. Thus, the increase in built-up areas may lead to an increase in surge flows and also increase the risk of local flooding and waterlogging, which could lead to large property losses. Kundzewicz and Pinskwar [40] highlight this problem in their research. They report that urban and flash floods, corresponding to the precipitation intensity exceeding the infiltration capacity and the conveying capacity of the drainage systems, are related to extreme precipitation. They also report that in July 2021, catastrophic floods with more than 200 fatalities and losses in excess of EUR 30 billion occurred in Germany and Belgium.
3.3. Modeling with HEC-HMS Software
According to the state of modern knowledge in the field of hydrology and a range of data on the elemental catchments of the Wirynka river catchment, hydrological modeling can be carried out. In world practice, the most widely used models are the Storm Water Management Model, HEC-HMS, and Mike [41,42,43]. The most popular of them from the point of view of free access and the possibility of entering spatial data seems to be HEC-HMS. In the present study, the spatial database of the Wirynka river catchment area, prepared on the basis of available cartographic materials, was entered into HEC-HMS.
The modeling performed was carried out for several variations (Figure 8). Firstly, the modeling was performed for the spatial conditions of 1990 and 2018. Secondly, for each period, the flow was simulated for three magnitudes of maximum precipitation (due to the probability of precipitation of 10%, 5%, and 1% and the duration of precipitation of 1 h).
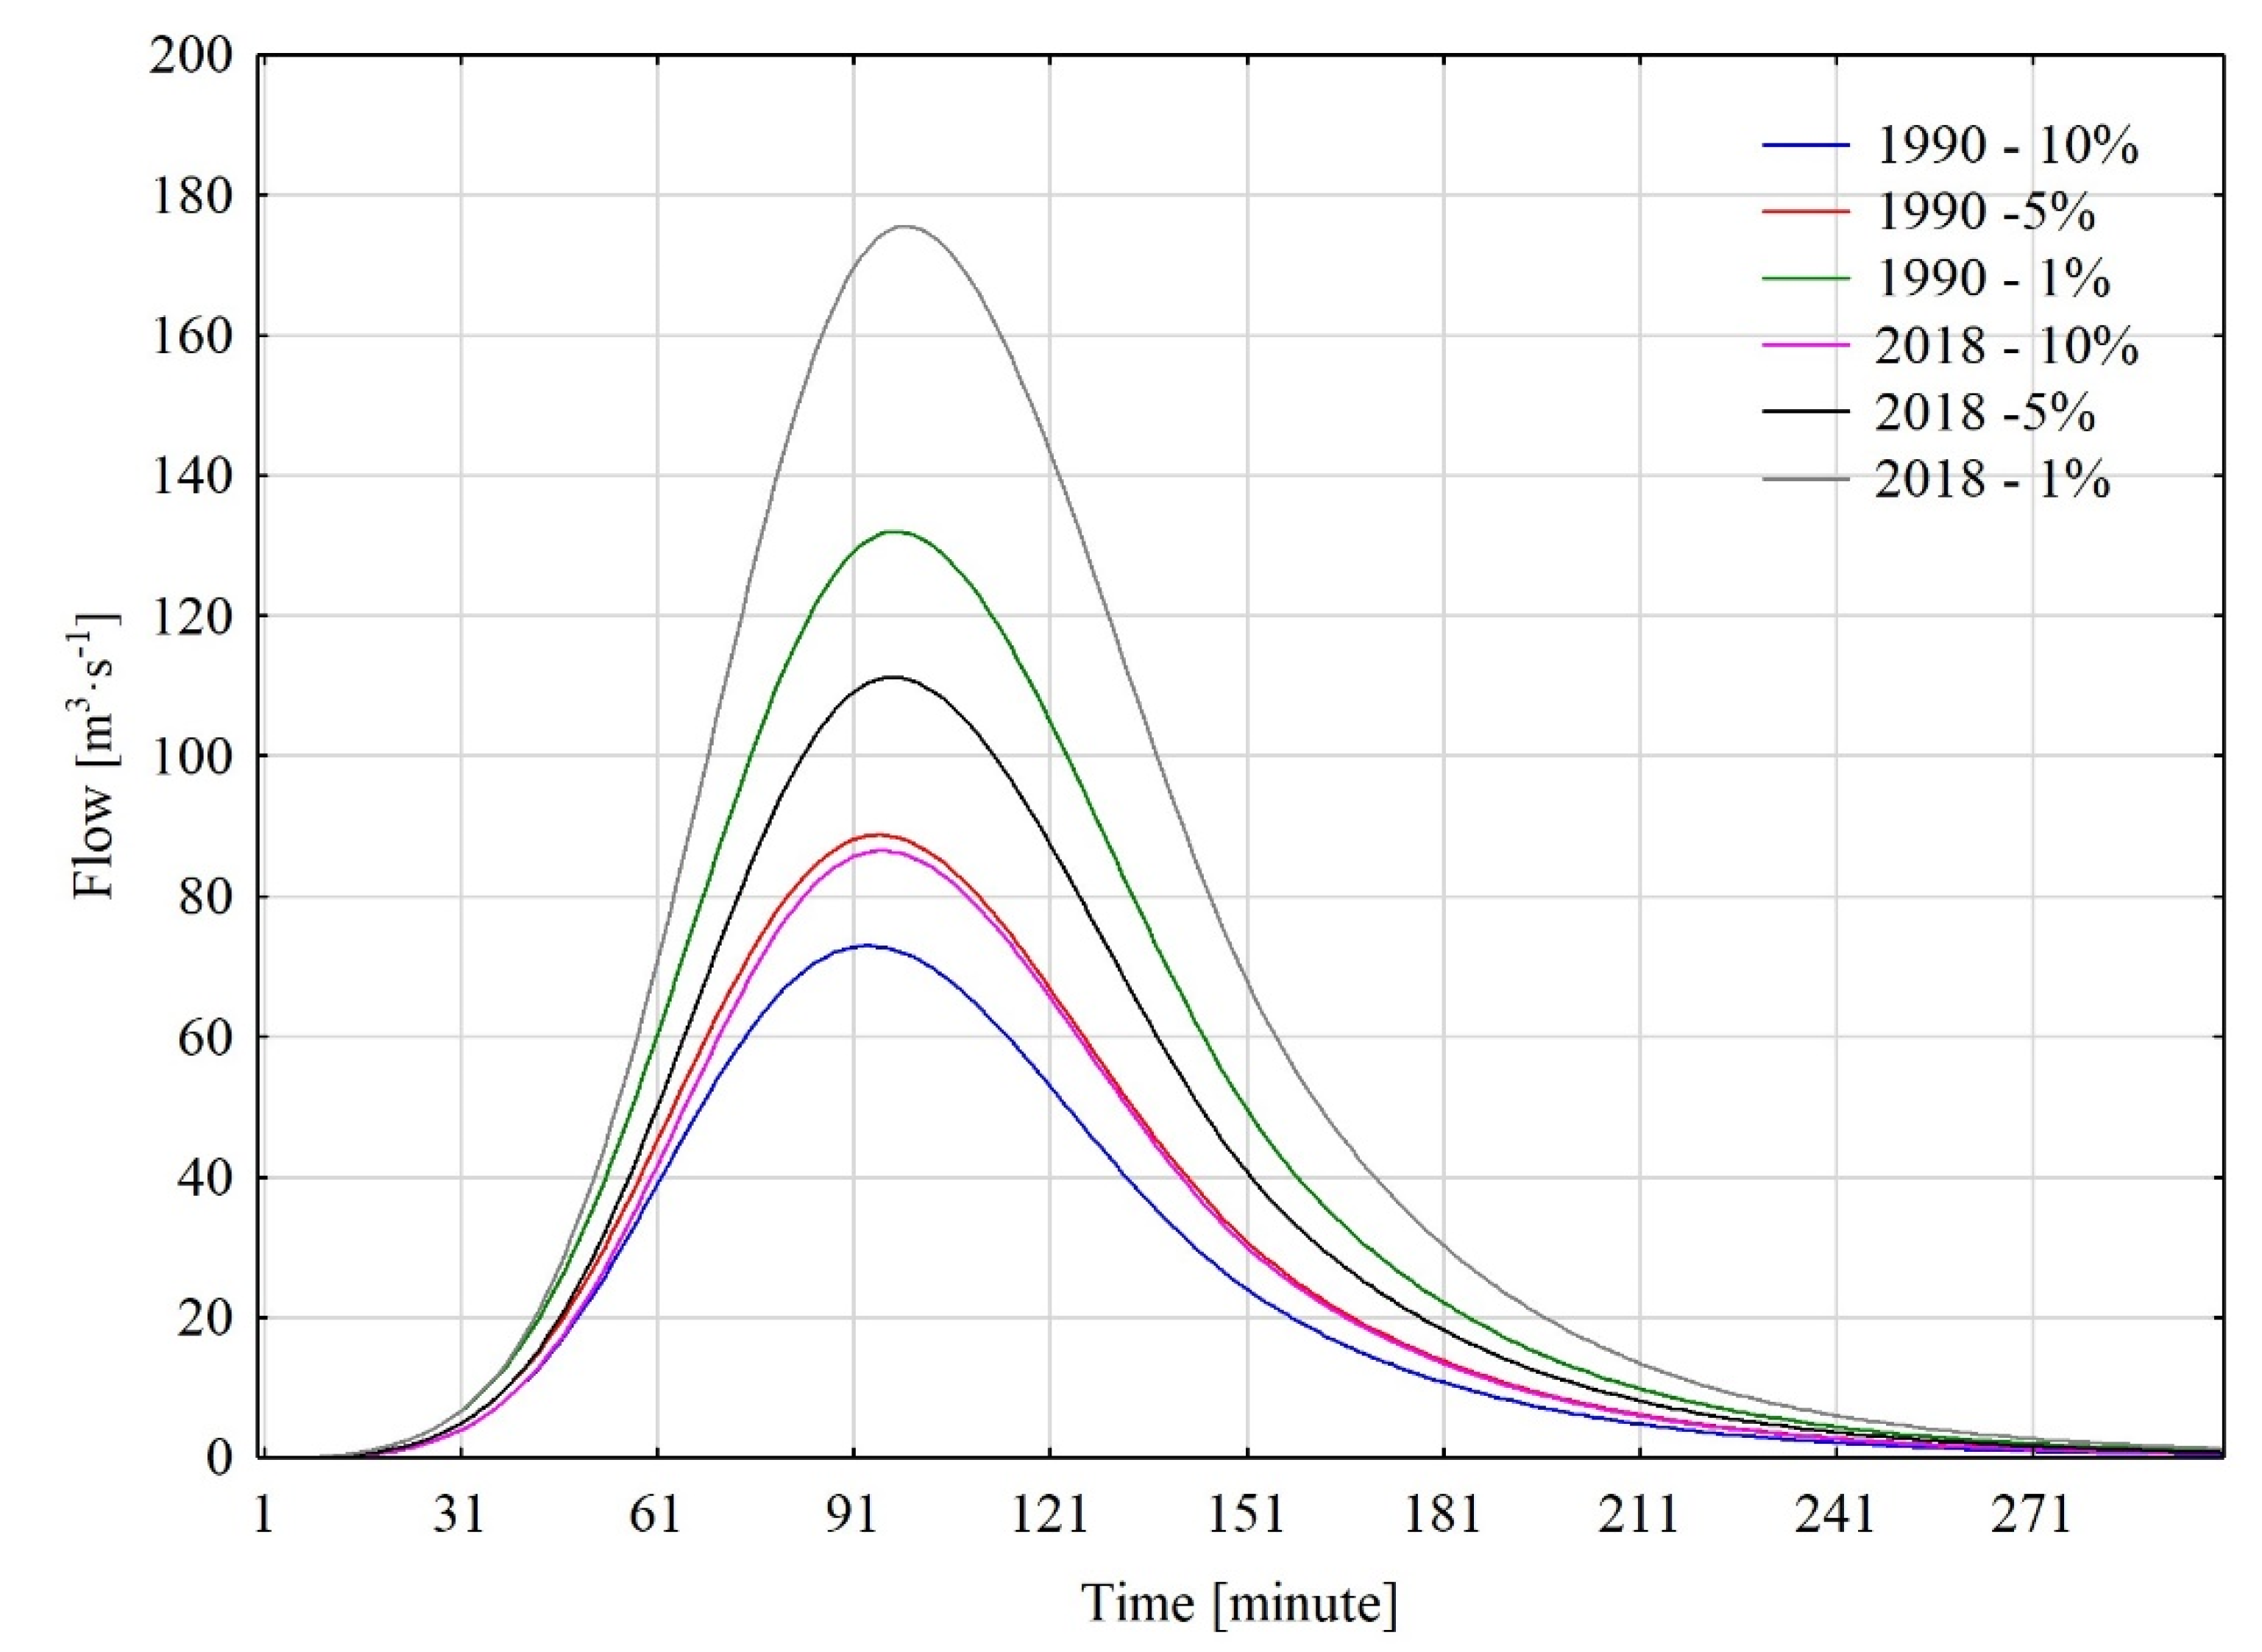
The performed modeling of the amount of water flow that can occur in the Wirynka river as a result of precipitation with probabilities of occurrence (10%, 5%, and 1%) differed between the two study years of 1990 and 2018 (Figure 9). The modeling revealed differences due to spatial changes. Namely, in the case of 2018, which was characterized by higher sealing of the catchment area, higher flows were observed than in 1990, which can occur as a result of the same amount of precipitation. The difference that arose during modeling for both years, at p = 10%, 5%, and 1%, was proportionally 13.5 m3·s−1, 22.4 m3·s−1, and 43.5 m3·s−1. The resulting difference is mainly due to the process of urbanization that has occurred in the catchment area. This is confirmed by Alfy’s research [44], which proved that the ongoing changes in the Wadi Al-Burdi basin also negatively affected the value of modeled and observed flows. For this catchment, an 8% increase in built-up areas was observed, with consequences in excessive river flows.
Despite the lack of daily observation data (an uncontrolled catchment), it can be expected that the modeled values of flow may be consistent with reality. Many researchers with both model and observational data for modeled catchments have shown that HEC-HMS modeling yields very high performance. An example is the study by Chathuranika et al. [45], who observed high efficiency between modeled and actual data. Moreover, according to Dukić and Erić [46], HEC-HMS modeling is suitable for uncontrolled catchments. The modeling procedure itself for such catchments has been used extensively.
4. Conclusions
For areas undergoing strong urbanization processes, reliable prediction is important for flood protection. This modeling can be performed effectively by combining GIS tools and hydrological modeling. This approach can be helpful in improving the understanding of flood probabilities. Hydrological influences and urbanization have a major impact on the timing, location, and severity of flash floods. The intensive process of urbanization contributes to accelerated runoff and increased maximum flows in local rivers. This process can have negative consequences for the catchment area, so it is recommended that the process of urbanization of land previously used for agriculture be preceded by a detailed analysis of the possibility of the effective functioning of existing water infrastructure under the changed conditions. One such possibility is to conduct hydrological modeling. According to the methodology, flow modeling was performed in the river for the years 1990 and 2018 (after urban expansion). Accelerated urban expansion in recent years has caused changes in catchment land use, increasing the CN parameter in all sub-catchments, and thus contributed to a reduction in the amount of possible retention. In addition, the model results show that rapid urbanization adversely affects hydrological processes. A reduction in the area of biologically active land and an increase in artificial areas (urbanized areas) can lead to large flood peaks and, therefore, an increase in the potential danger to people and property. The increase in the area of urbanized areas has a real impact on the change in the flow hydrogram. The use of mathematical models to describe the aforementioned phenomenon is a useful tool both in the context of current and future changes in the catchment. Changes in the flow hydrogram are particularly evident in the case of extreme phenomena. Thus, mathematical modeling with land use planning can be successfully used to reduce flood risk. With this in mind, it is recommended to build at least a few rainwater-harvesting small reservoirs in the catchment area. These catchments could provide protection against flooding but also serve as a source of water when water is in short supply. Given the declining water resources worldwide, managing excess water is a priority.
In addition, due to the nature of the catchment area (uncontrolled catchment), the project could be complemented by conducting field studies (installing a flowmeter) to compare model data with actual data, which is planned as the next step in this study area.
Author Contributions
Conceptualization, E.J. and J.K.; methodology, E.J. and J.K.; software, E.J.; validation, E.J.; formal analysis, E.J.; investigation, E.J.; resources, E.J. and J.K.; data curation, E.J.; writing—original draft preparation, E.J.; writing—review and editing, E.J.; visualization, E.J.; supervision, E.J. and J.K.; project administration, E.J.; funding acquisition, E.J. All authors have read and agreed to the published version of the manuscript.
Funding
The publication was co-financed/financed within the framework of the Ministry of Science and Higher Education program “Regional Initiative Excellence” in the years 2019–2022, project No. 005/RID/2018/19.
Data Availability Statement
The datasets used and analyzed during the current study are available from the corresponding authors upon reasonable request.
Conflicts of Interest
The authors declare no conflict of interest. The funders had no role in the design of the study; in the collection, analyses, or interpretation of data; in the writing of the manuscript; or in the decision to publish the results.
References
- Hoegh-Guldberg, O.; Jacob, D.; Taylor, M.; Bindi, M.; Brown, S.; Camilloni, I.; Diedhiou, A.; Djalante, R.; Ebi, K.; Engelbrecht, F.; et al. IPCC Impacts of 1.5 °C Global Warming on Natural and Human Systems. In Global Warming of 1.5 °C. An IPCC Special Report on the Impacts of Global Warming of 1.5 °C above Pre-Industrial Levels and Related Global Greenhouse Gas Emission Pathways, in the Context of Strengthening the Global Response to the Threat of Climate Change, Sustainable Development, and Efforts to Eradicate Poverty; Masson-Delmotte, V., Zhai, P., Pörtner, H.O., Roberts, D., Skea, J., Shukla, P.R., Pirani, A., Moufouma-Okia, W., Péan, C., Pidcock, R., et al., Eds.; IPCC: Geneva, Switzerland, 2022; pp. 175–312. [Google Scholar] [CrossRef]
- Field, C.B.; Barros, V.; Stocker, T.F.; Dahe, Q. Managing the Risks of Extreme Events and Disasters to Advance Climate Change Adaptation: Special Report of the Intergovernmental Panel on Climate Change; Cambridge University Press: New York, NY, USA, 2012; pp. 25–64. [Google Scholar]
- Blöschl, G.; Hall, J.; Viglione, A.; Perdigão, R.A.P.; Parajka, J.; Merz, B.; Lun, D.; Arheimer, B.; Aronica, G.T.; Bilibashi, A.; et al. Changing climate both increases and decreases European river floods. Nature 2019, 573, 108–111. [Google Scholar] [CrossRef] [PubMed]
- Wehner, M.; Seneviratne, S.; Zhang, X.; Adnan, M.; Badi, W.; Dereczynski, C.; Di Luca, A.; Ghosh, S.; Iskandar, I.; Kossin, J.; et al. Proceedings of the AGU Fall Meeting Abstracts; Weather and Climate Extreme Events in a Changing Climate, New Orleans, LA, USA, 13–17 December 2021.
- Norel, M.; Krawiec, K.; Kundzewicz, Z.W. Machine Learning Modeling of Climate Variability Impact on River Runoff. Water 2021, 13, 1177. [Google Scholar] [CrossRef]
- Kundzewicz, Z.W.; Su, B.; Wang, Y.; Wang, G.; Wang, G.; Huang, J.; Jiang, T. Flood risk in a range of spatial perspectives–from global to local scales. Nat. Hazards Earth Syst. Sci. 2019, 19, 1319–1328. [Google Scholar] [CrossRef] [Green Version]
- Mrozik, K.D. Problems of Local Flooding in Functional Urban Areas in Poland. Water 2022, 14, 2453. [Google Scholar] [CrossRef]
- Kvočka, D.; Falconer, R.A.; Bray, M. Flood hazard assessment for extreme flood events. Nat. Hazards 2016, 84, 1569–1599. [Google Scholar] [CrossRef] [Green Version]
- Ashmore, P.; Church, M. The impact of climate change on rivers and river processes in Canada. In Geological Survey of Canada, Bulletin 555; Geological Survey of Canada: Ottawa, ON, Canada, 2001. [Google Scholar] [CrossRef]
- Schultz, B. Flood management under rapid urbanisation and industrialisation in flood-prone areas: A need for serious consideration. Irrig. Drain. 2006, 55, S3–S8. [Google Scholar] [CrossRef]
- Alfieri, L.; Burek, P.; Feyen, L.; Forzieri, G. Global warming increases the frequency of river floods in Europe. Hydrol. Earth Syst. Sci. 2015, 19, 2247–2260. [Google Scholar] [CrossRef] [Green Version]
- Allaire, M. Socio-economic impacts of flooding: A review of the empirical literature. Water Secur. 2018, 3, 18–26. [Google Scholar] [CrossRef]
- Merz, B.; Blöschl, G.; Vorogushyn, S.; Dottori, F.; Aerts, J.C.J.H.; Bates, P.; Bertola, M.; Kemter, M.; Kreibich, H.; Lall, U.; et al. Causes, impacts and patterns of disastrous river floods. Nat. Rev. Earth Environ. 2021, 2, 592–609. [Google Scholar] [CrossRef]
- Nilsson, K.; Nielsen, T.S.; Aalbers, C.; Bell, S.; Boitier, B.; Chery, J.P.; Fertner, C.; Groschowski, M.; Haase, D.; Loibl, W.; et al. Strategies for Sustainable Urban Development and Urban Rural Linkages. Eur. J. Spat. Dev. 2014, 4, 1–26. Available online: https://archive.nordregio.se/Global/EJSD/Research%20briefings/article4.pdf (accessed on 28 October 2022).
- Seleem, O.; Heistermann, M.; Bronstert, A. Efficient Hazard Assessment for Pluvial Floods in Urban Environments: A Benchmarking Case Study for the City of Berlin, Germany. Water 2021, 13, 2476. [Google Scholar] [CrossRef]
- Benito, G.; Sanchez-Moya, Y.; Medialdea, A.; Barriendos, M.; Calle, M.; Rico, M.; Sopeña, A.; Machado, M.J. Extreme Floods in Small Mediterranean Catchments: Long-Term Response to Climate Variability and Change. Water 2020, 12, 1008. [Google Scholar] [CrossRef] [Green Version]
- Booth, D.B. Urbanization and the natural drainage system--impacts, solutions, and prognoses. Northwest Sci. 1991, 7, 93–118. [Google Scholar]
- Chomicz, K. The downpours and torrential rains in Poland. Wiad. Służby Hydrol. Meteor. 1951, 2, 5–88. (In Polish) [Google Scholar]
- Kotowski, A.; Kaźmierczak, B.; Dancewicz, A. Precipitation Modeling for Drainage Dimensioning; KILiW PAN (IPPT): Warsaw, PAN, Poland, 2010. (In Polish) [Google Scholar]
- Lorenc, H.; Olecka, A. Trends in the Occurrence of Heavy Precipitation in Poland. Contemporary Climate Problems in Poland—Facts and Uncertainties; Instytut Meteorologii i Gospodarki Wodnej: Warsaw, Poland, 2006; pp. 23–36. (In Polish) [Google Scholar]
- Sood, A.; Smakhtin, V. Global hydrological models: A review. Hydrol. Sci. J. 2015, 60, 549–565. [Google Scholar] [CrossRef]
- Dong, C. Remote sensing, hydrological modeling and in situ observations in snow cover research: A review. J. Hydrol. 2018, 561, 573–583. [Google Scholar] [CrossRef]
- Dhami, B.S.; Pandey, A. Comparative Review of Recently Developed Hydrologic Models. J. Indian Water Resour. Soc. 2013, 33, 34–41. [Google Scholar]
- Lastoria, B. Hydrological Processes on the Land Surface: A Survey of Modelling Approaches; FORALPS Technical Report 9 for University of Trento: Trento, Italy, March 2008; p. 56. [Google Scholar]
- Cunderlik, J. Hydrological model selection for CFCAS project In Assessment of Water Resource Risk and Vulnerability to Change in Climate Condition; University of Western Ontario: London, ON, Canada, 2004; p. 44. [Google Scholar]
- Orellana, B.; Pechlivanidi, I.G.; McIntyre, N.; Wheater, H.S.; Wagener, T. A Toolbox for the Identification of Parsimonious Semi-Distributed Rainfall-Runoff Models: Application to the Upper Lee Catchment. In Proceedings of the 4th Meeting iEMSs, Barcelona, Spain, 7–10 July 2008; pp. 670–677. [Google Scholar]
- Halwatura, D.; Najim, M. Application of the HEC-HMS model for runoff simulation in a tropical catchment. Environ. Model. Softw. 2013, 46, 155–162. [Google Scholar] [CrossRef]
- Hoogestraat, G.K. Flood Hydrology and Dam-Breach Hydraulic Analyses of Four Reservoirs in the Black Hills, South Dakota; Scientific Investigations Report for U.S. Geological Survey: Reston, VA, USA, 2011; p. 37. [Google Scholar] [CrossRef]
- Wurbs, R.A. Dissemination of Generalized Water Resources Models in the United States. Water Int. 1998, 23, 190–198. [Google Scholar] [CrossRef]
- Cuomo, A.; Guida, D. Hydro-Geomorphologic-Based Water Budget at Event Time-Scale in A Mediterranean Headwater Catchment (Southern Italy). Hydrology 2021, 8, 20. [Google Scholar] [CrossRef]
- Sui, D.Z.; Maggio, R.C. Integrating GIS with hydrological modeling: Practices, problems, and prospects. Comput. Environ. Urban Syst. 1999, 23, 33–51. [Google Scholar] [CrossRef]
- Statistics Poland (GUS). Local Data Bank. Available online: https://bdl.stat.gov.pl/BDL/start (accessed on 1 September 2022).
- Licznar, P.; Kotowski, A.; Siekanowicz-Grochowina, K.; Oktawiec, M.; Burszta-Adamiak, E. Empirical Verification of Bog-danowicz-Stachý’s Formula for Design Rainfall Intensity Calculations. Ochr. Środowiska 2018, 40, 21–28. (In Polish) [Google Scholar]
- Mishra, S.K.; Singh, V.P. SCS-CN Method. In Soil Conservation Service Curve Number (SCS-CN) Methodology; Springer Science & Business Media: Amsterdam, The Netherlands, 2003; Volume 42, pp. 84–146. [Google Scholar] [CrossRef]
- McColl, C.; Aggett, G. Land-use forecasting and hydrologic model integration for improved land-use decision support. J. Environ. Manag. 2007, 84, 494–512. [Google Scholar] [CrossRef] [PubMed]
- Yusop, Z.; Chan, C.H.; Katimon, A. Runoff characteristics and application of HEC-HMS for modelling stormflow hydrograph in an oil palm catchment. Water Sci. Technol. 2007, 56, 41–48. [Google Scholar] [CrossRef] [Green Version]
- Documentation HEC-HMS. Available online: https://www.hec.usace.army.mil/software/hec-hms/documentation.aspx (accessed on 8 October 2022).
- Sojka, M.; Murat-Błażejewska, S.; Wróżyński, R. Analysis of the possibility of using hydrological models in strategic environ-mental assessment of local spatial development plans. Inż. Ekologiczna 2014, 39, 176–186. (In Polish) [Google Scholar]
- Knebl, M.R.; Yang, Z.-L.; Hutchison, K.; Maidment, D.R. Regional scale flood modeling using NEXRAD rainfall, GIS, and HEC-HMS/RAS: A case study for the San Antonio River Basin Summer 2002 storm event. J. Environ. Manag. 2005, 75, 325–336. [Google Scholar] [CrossRef]
- Kundzewicz, Z.W.; Pińskwar, I. Are Pluvial and Fluvial Floods on the Rise? Water 2022, 14, 2612. [Google Scholar] [CrossRef]
- Huber, W.C.; Rossman, L.A.; Dickinson, R.E. EPA Storm Water Management Model, SWMM5. Watershed Models 2005, 338–359. [Google Scholar]
- Hydrologic Modelling System HEC-HMS. Available online: https://www.hec.usace.army.mil/software/hec-Hms/documentation/HEC-HMS_Users_Manual_4.0.pdf (accessed on 8 October 2022).
- Danish Hydraulic Institute (DHI). MIKE 21 Flow Model: Hydrodynamic Module User Guide; DHI Water and Environment: Hørsholm, Denmark, 2007. Available online: http://icoe.org.vn/upload/2009/06/10/MIKE21_HD_Step_By_Step.pdf (accessed on 8 October 2022).
- El Alfy, M. Assessing the impact of arid area urbanization on flash floods using GIS, remote sensing, and HEC-HMS rainfall–runoff modeling. Hydrol. Res. 2016, 47, 1142–1160. [Google Scholar] [CrossRef] [Green Version]
- Chathuranika, I.M.; Gunathilake, M.B.; Baddewela, P.K.; Sachinthanie, E.; Babel, M.S.; Shrestha, S.; Jha, M.K.; Rathnayake, U.S. Comparison of Two Hydrological Models, HEC-HMS and SWAT in Runoff Estimation: Application to Huai Bang Sai Tropical Watershed, Thailand. Fluids 2022, 7, 267. [Google Scholar] [CrossRef]
- Đukić, V.; Erić, R. SHETRAN and HEC HMS Model Evaluation for Runoff and Soil Moisture Simulation in the Jičinka River Catchment (Czech Republic). Water 2021, 13, 872. [Google Scholar] [CrossRef]
Figure 1.
Location of the Wirynka catchment with the division into sub-catchments.

Figure 2.
Digital elevation model (DEM) for the Wirynka catchment.

Figure 3.
Methodology flow chart for modeling.

Figure 4.
Land use of the Wirynka catchment for two years (1990 and 2018).

Figure 5.
Land use of the Wirynka sub-catchment for two years (1990 and 2018).

Figure 6.
Soil types for the Wirynka river catchment area.

Figure 7.
Correlation between the CN parameter and retention amount (S).

Figure 8.
HEC-HMS model for the Wirynka catchment area.

Figure 9.
Simulated hydrograph for years 1990 and 2018 with different probabilities of precipitation.
Figure 9.
Simulated hydrograph for years 1990 and 2018 with different probabilities of precipitation.


Table 1.
Values of CN and S parameters in sub-catchments for two years (1990 and 2018).
| Year | Catchment | Area [km2] | CN [−] | S [mm] |
|---|---|---|---|---|
| 1990 | c1 | 11.08 | 53.64 | 219.49 |
| c2 | 25.05 | 56.08 | 198.94 | |
| c3 | 11.4 | 61.66 | 157.96 | |
| c4 | 38.03 | 65.2 | 135.6 | |
| c5 | 16.71 | 66.69 | 126.88 | |
| 2018 | c1 | 11.08 | 64.98 | 136.88 |
| c2 | 25.05 | 61.98 | 155.79 | |
| c3 | 11.4 | 74.78 | 85.66 | |
| c4 | 38.03 | 70.08 | 108.45 | |
| c5 | 16.71 | 74.69 | 86.09 |
Table 2.
Amount of forecasted rainfall.
| hmax [mm] | ||
|---|---|---|
| p = 10% | p = 5% | p = 1% |
| 34.81 | 39.68 | 49.45 |
Disclaimer/Publisher’s Note: The statements, opinions and data contained in all publications are solely those of the individual author(s) and contributor(s) and not of MDPI and/or the editor(s). MDPI and/or the editor(s) disclaim responsibility for any injury to people or property resulting from any ideas, methods, instructions or products referred to in the content. |
© 2022 by the authors. Licensee MDPI, Basel, Switzerland. This article is an open access article distributed under the terms and conditions of the Creative Commons Attribution (CC BY) license (https://creativecommons.org/licenses/by/4.0/).
Share and Cite
MDPI and ACS Style
Janicka, E.; Kanclerz, J. Assessing the Effects of Urbanization on Water Flow and Flood Events Using the HEC-HMS Model in the Wirynka River Catchment, Poland. Water 2023, 15, 86. https://doi.org/10.3390/w15010086
AMA Style
Janicka E, Kanclerz J. Assessing the Effects of Urbanization on Water Flow and Flood Events Using the HEC-HMS Model in the Wirynka River Catchment, Poland. Water. 2023; 15(1):86. https://doi.org/10.3390/w15010086
Chicago/Turabian StyleJanicka, Ewelina, and Jolanta Kanclerz. 2023. "Assessing the Effects of Urbanization on Water Flow and Flood Events Using the HEC-HMS Model in the Wirynka River Catchment, Poland" Water 15, no. 1: 86. https://doi.org/10.3390/w15010086
Note that from the first issue of 2016, this journal uses article numbers instead of page numbers. See further details here.