
Hydrodynamic Characteristics of Diagonal Brush Fish Pass: Prototype Measurements

1
Civil Engineering Department, Hydraulics Division, Hacettepe University, Beytepe, 06810 Ankara, Turkey
2
Department of Basic Fisheries Sciences, University of Recep Tayyip Erdogan, 53100 Rize, Turkey
3
ETH Zurich, Laboratory of Hydraulics, Hydrology and Glaciology (VAW), HIA C 57, Hoenggerbergring 26, CH-8093 Zurich, Switzerland
*
Author to whom correspondence should be addressed.
Water 2023, 15(1), 88; https://doi.org/10.3390/w15010088
Submission received: 22 October 2022
/
Revised: 19 December 2022
/
Accepted: 20 December 2022
/
Published: 27 December 2022
(This article belongs to the Special Issue Fish Passage at Hydropower Dams 2.0)
Abstract
:The present study investigates the hydrodynamic characteristics of the diagonal brush upstream fishway at the Incirli run-of-river hydropower plant on Iyidere River in Turkey. Three-dimensional velocity measurements were conducted in the fish pass using a Micro acoustic Doppler velocimeter under real-time operation conditions. The diagonal arrangement of brush blocks creates favorable hydrodynamic conditions (i.e., lateral momentum exchange) that allow fish to minimize swimming energy. We found that the spatially averaged lateral component of Reynolds shear stress is 2.2 times higher than spatially averaged vertical component of Reynolds shear stress, which could be due to the lateral velocity gradient in the vicinity of brush blocks. It is shown that the low-velocity zones behind the brush blocks constitute important resting sites for fish. The monitoring data showed that inlet water levels have considerable effects on the turbulence quantities. The brushes become submerged with the increased reservoir water level from 102 m to 102.05 m above sea level. The maximum turbulent kinetic energy was increased by a factor of three compared to unsubmerged conditions. We found a strong relationship between the average energy dissipation rate per unit mass and the Reynolds number. On the other hand, the prototype data reveal the inverse relationship between the Darcy-Weissbach friction factor and the relative submergence of bristles. The present results allow the efficient design of diagonal fish passes.
1. Introduction
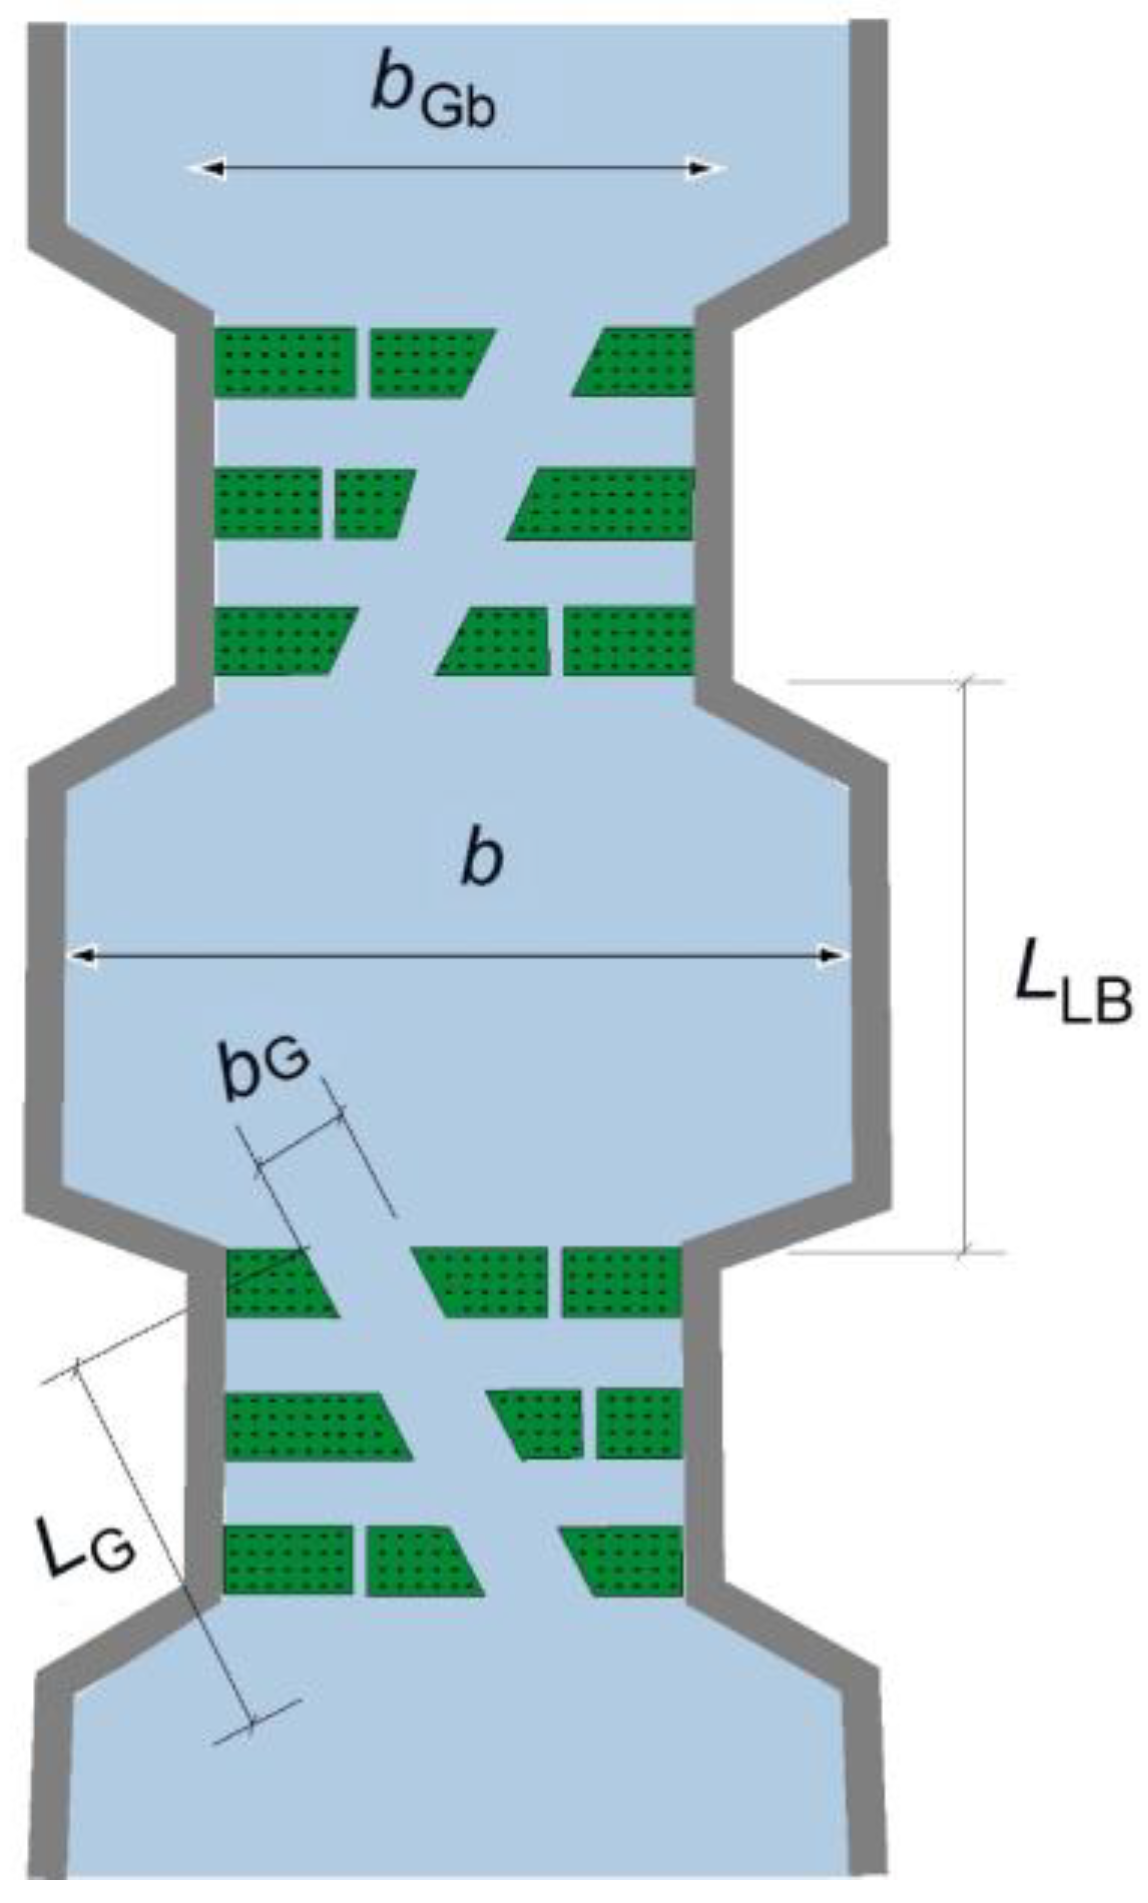
Brush-type fish passes consist of a sloping channel with fixed brush blocks (bristle packs); thus, they provide reduced velocities of less than 1 m/s to ease the upstream movement of fish. This type of upstream fish pass is known to have a variety of structures inside the water body, which provide low velocities and ample resting room for small or weak fish [1]. Brush blocks are attached on the base of a rectangular channel as roughness elements (Figure 1). The bristle packs consist of several bristle bundles, each containing five to eight individual elastic bristles. Until 2010, oval plastic bristles with a thickness of 4–6 mm (on average 5 mm) were used, but since 2011, round plastic bristles with a diameter of 6 mm have been in use. The bristle bundles are produced by inserting the bristle bundles into a perforated plastic plate. The carrier plate and, thus, the bristle packs are prepared from a standard base plate where a wide variety of shapes can be cut or welded together. The bristle packs are screwed directly onto the channel bottom or raised individual foundations (e.g., concrete bodies). The outflow in the channel occurs via passages between the bristle packs and through the bristles themselves [2,3,4]. A channel with brush blocks is principally considered a rough channel with individual distributed macro-roughness elements. Brush blocks affect the flow by forming a flow-through obstacle, deflecting flow, and enhancing form drag and skin friction. The flow in the channel, in which hydraulic elements have permeability, is a subcritical and quasi-uniform flow. In a brush fish pass, the energy dissipation is somewhat effective because many flow-induced vibrating bristles initiate strong energy dissipation [5,6,7]. Fish-passage monitoring studies in Germany [1,5] revealed that the brush fish pass works well, as designed, and has superior performance compared to other fish-pass types.
The literature provides several studies on the flow and turbulence characteristics of conventional fishways such as vertical-slot passes [8,9], pool-weir passes [10,11], and natural-like passes [12,13]. The common feature of those passes is that the hydraulic energy is mainly dissipated in an energy cascade process. In vertical slots, the turbulent jets plunge into the surrounding pools, and in the natural type, the wake behind the macro-roughness elements dissipates the excess energy. Most fish-pass designs neglect the swimming capacity of smaller and weaker fish. For instance, Chanson and Leng [14] suggested that a low-velocity zone, which should not exhibit strong recirculation or negative velocity, should be provided for the upstream passage of small-bodied fish. Several test results have shown that fish seek low-velocity zones to pass through the hydraulic structure [14]. The brush fish pass differs from conventional types of fish passages by providing a nearly optimal migration corridor under uniform and subcritical flow regimes for smaller and weaker fish [15].
The present study investigates the flow patterns, turbulence, and energy dissipation characteristics of a brush-type fish pass in a pilot hydropower project. Additionally, the effect of the inlet boundary conditions on these parameters, which was ignored in previous studies, is also investigated. Finally, the hydraulic performance of the fish pass is linked to the biological data obtained from the same fishway.
2. Materials and Methods
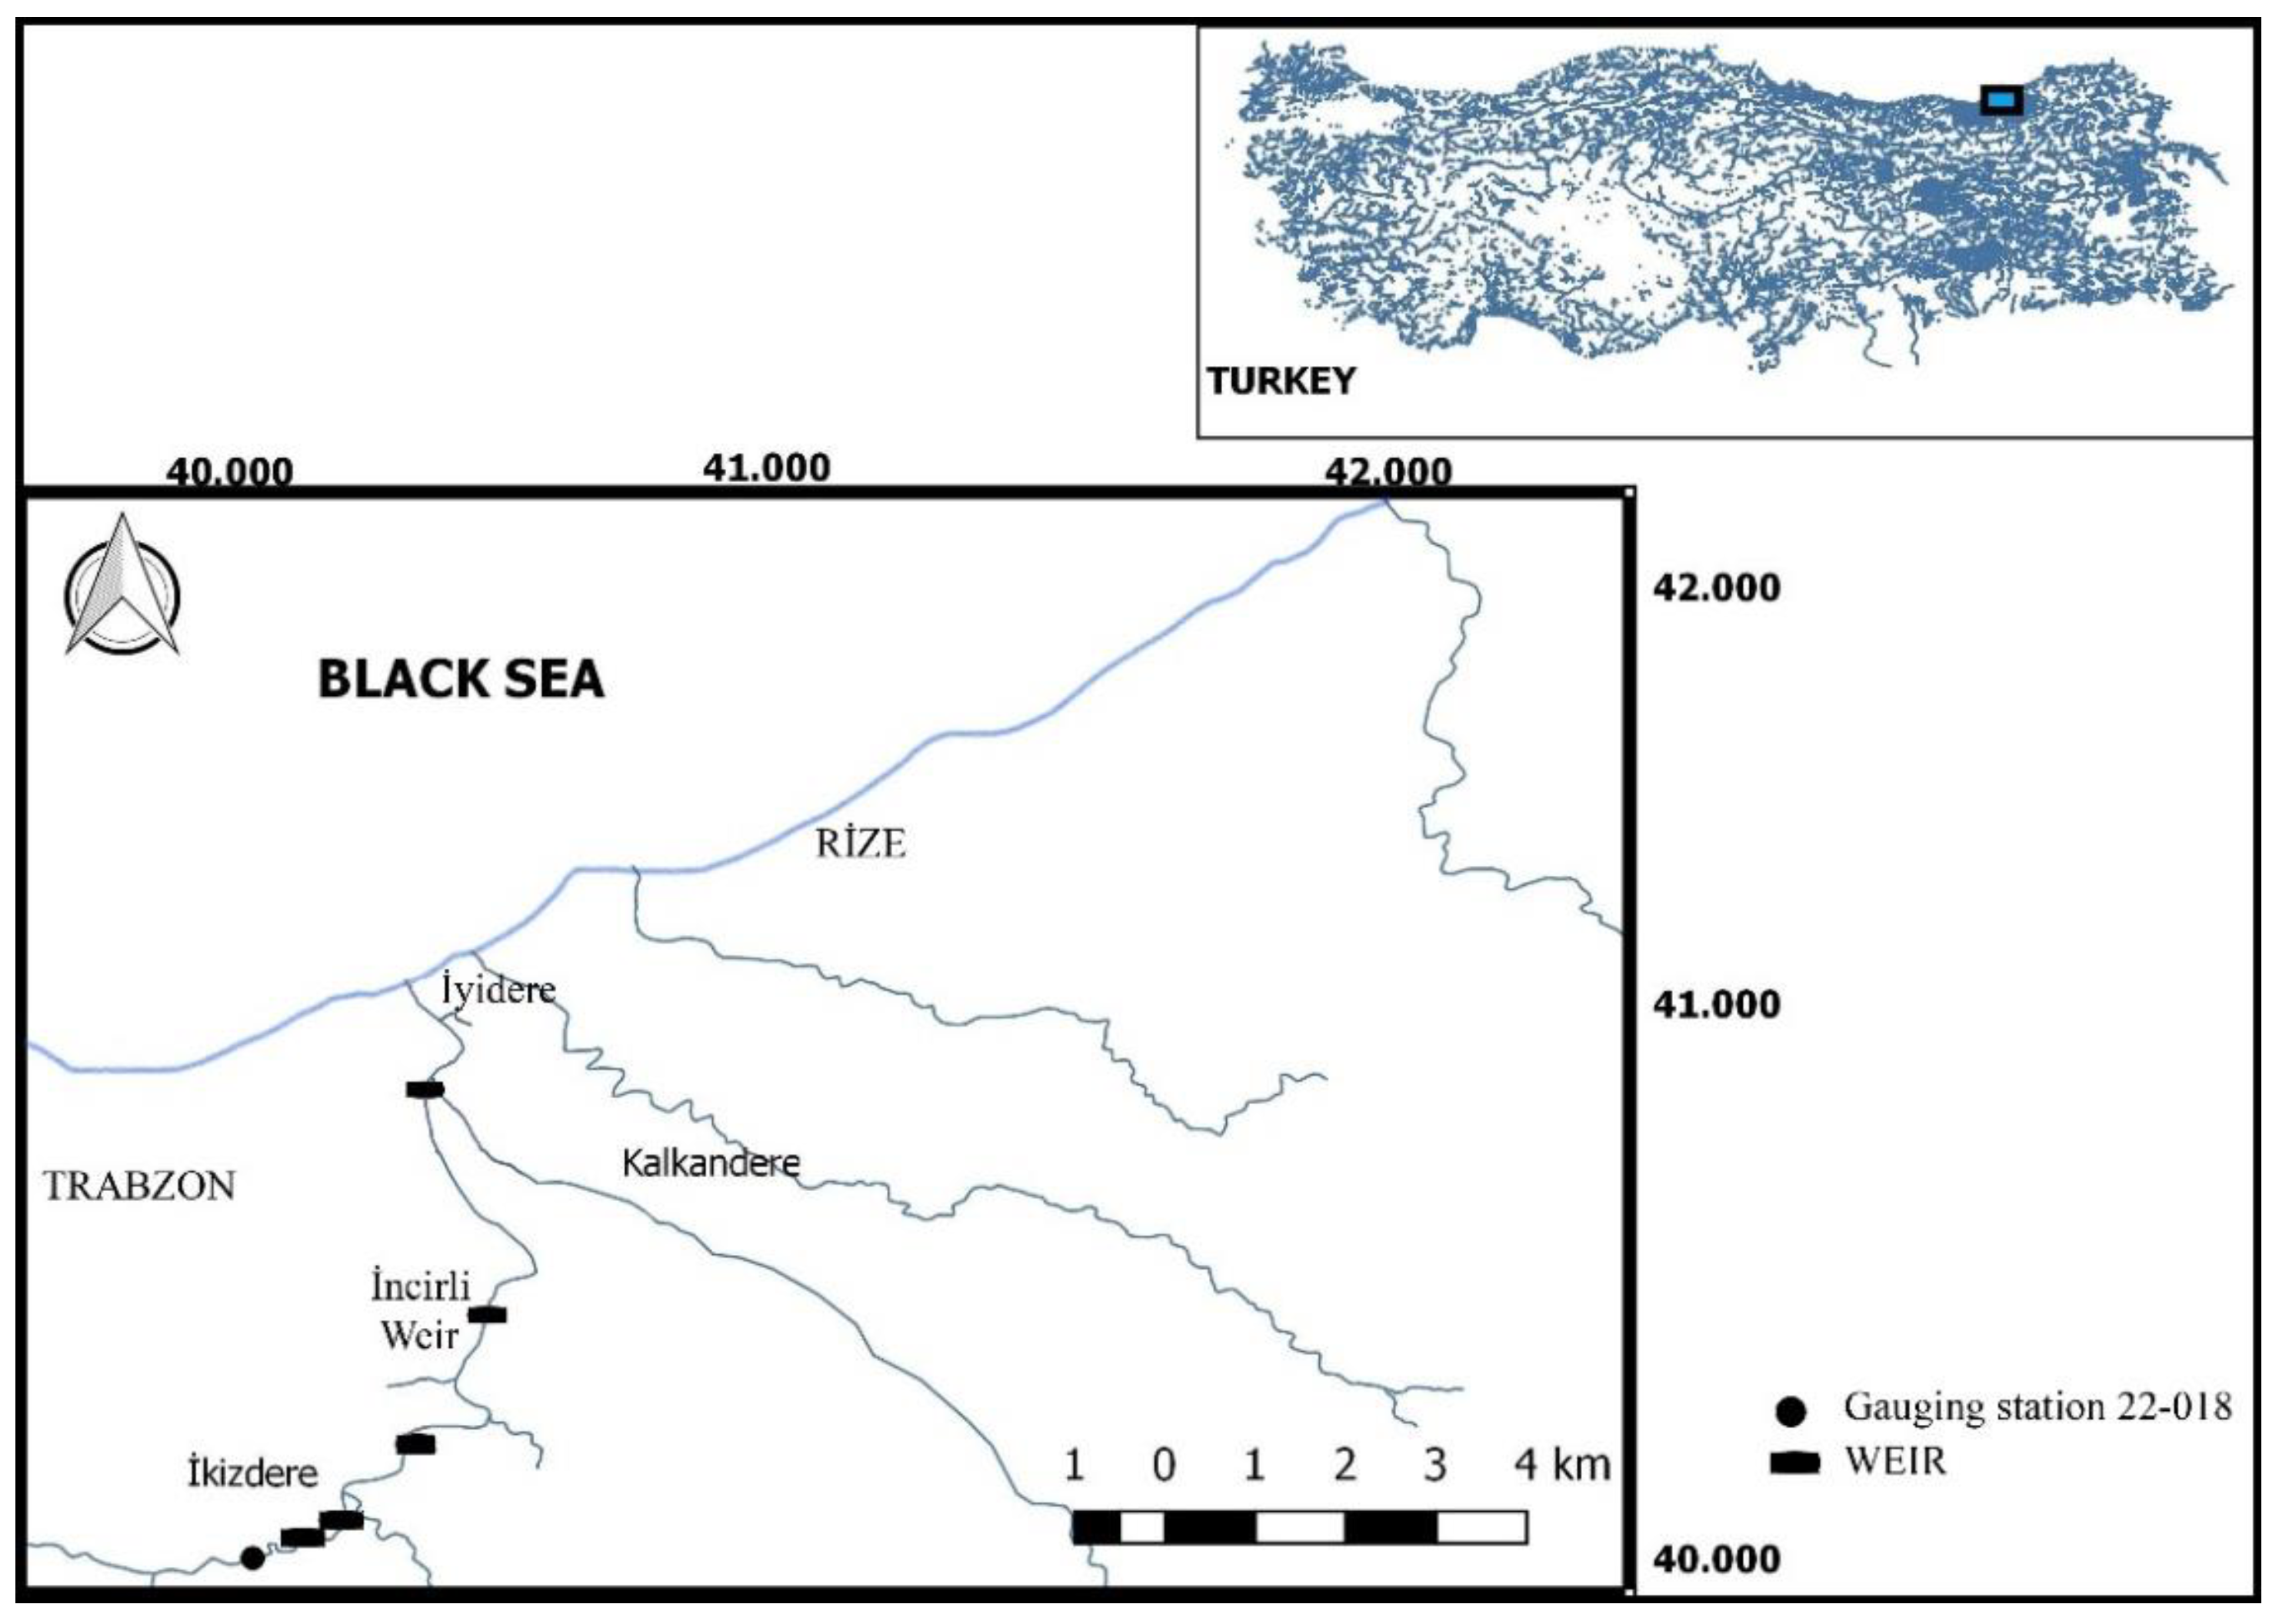
Hydrodynamic characteristics of a 46.2 m long, 1.1 m wide, and 1 m deep brush-type fish pass with a total head of 5 m were monitored at the case study hydropower plant (HPP) Incirli, which is located on the Iyidere River on the East Black Sea Region of Turkey. Iyidere River Basin is rich in biodiversity, with 13 fish species. Its catchment area is 1053 km2, and the annual average river discharge is 27.8 m3/s. In the river basin, a cascade-type hydropower system has been developed, and the Incirli HPP is the last HPP downstream of the river in the barbell zone (Figure 2). Incirli Weir has a catchment area of 895 km2. Incirli is a diversion-type HPP with a tunnel length of 5.85 km and a gross head of 63 m (net head = 47 m). The HPP is equipped with 3 vertical-axis Francis turbines, with a total output of 25.2 MW at a design discharge of Qd = 62 m3/s.
The characteristics of the studied fish species in the studied area are as follows: Alburnoides fasciatus inhabits streams and rivers in foothills with well-oxygenated, fast-flowing water, spawns in small groups, lays eggs deep into gravel with swift currents, and can attain a maximum body length of up to about 13.8 cm. Ponticola rizeensis is found in streams with fresh, running water and with streambeds covered with rounded pebbles, which are presently found only in the Iyidere stream. It is an endangered fish species. Capoeta banarescui inhabits swift-flowing waters with substrates of cobbles and pebbles at the bottom. It is reported to spawn between May and June and can attain a maximum body length of up to about 40 cm. Salmo coruhensis swims in clear and moderately swift-flowing waters with a substrate of sand and pebbles, spawns between October and November, migrates upstream in small groups, can attain a maximum body length of up to about 80 cm, and is a threatened fish species. Barbus tauricus inhabits various habitats, from mountain streams with strong currents to brackish estuaries; spawns on substrates of gravel or rock; can attain a maximum body length of up to about 70 cm; and is a vulnerable fish species.
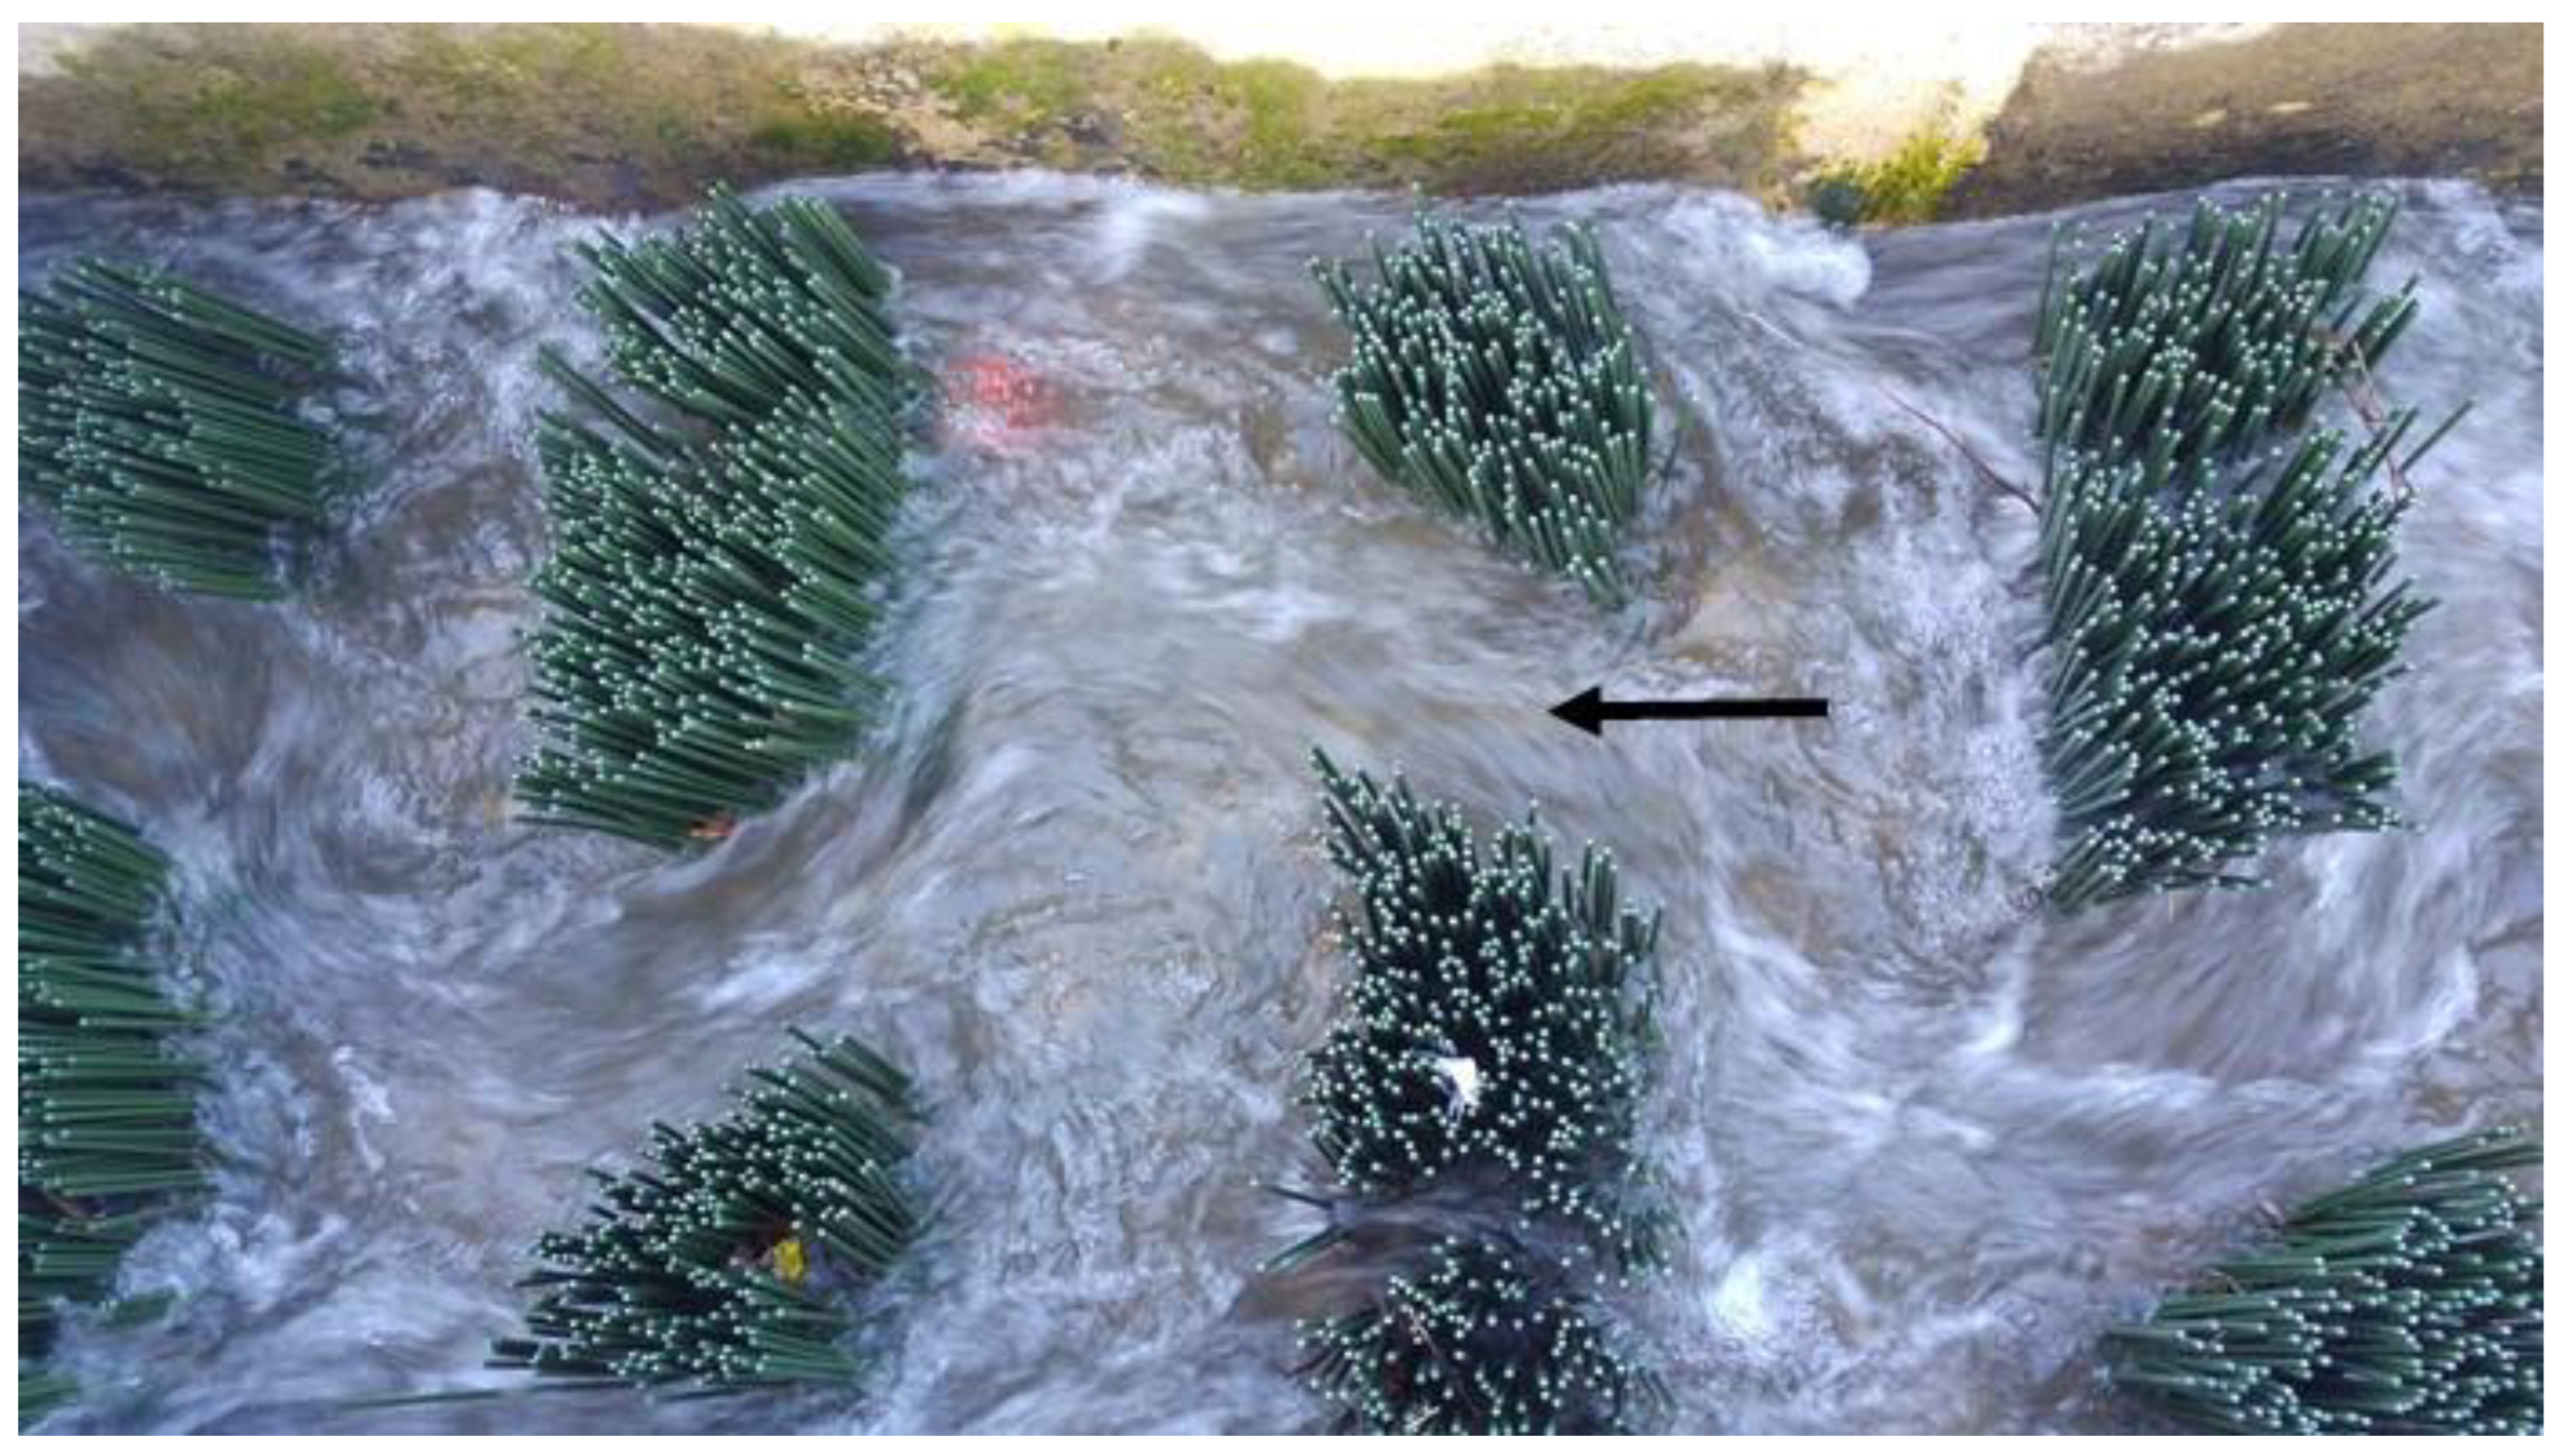
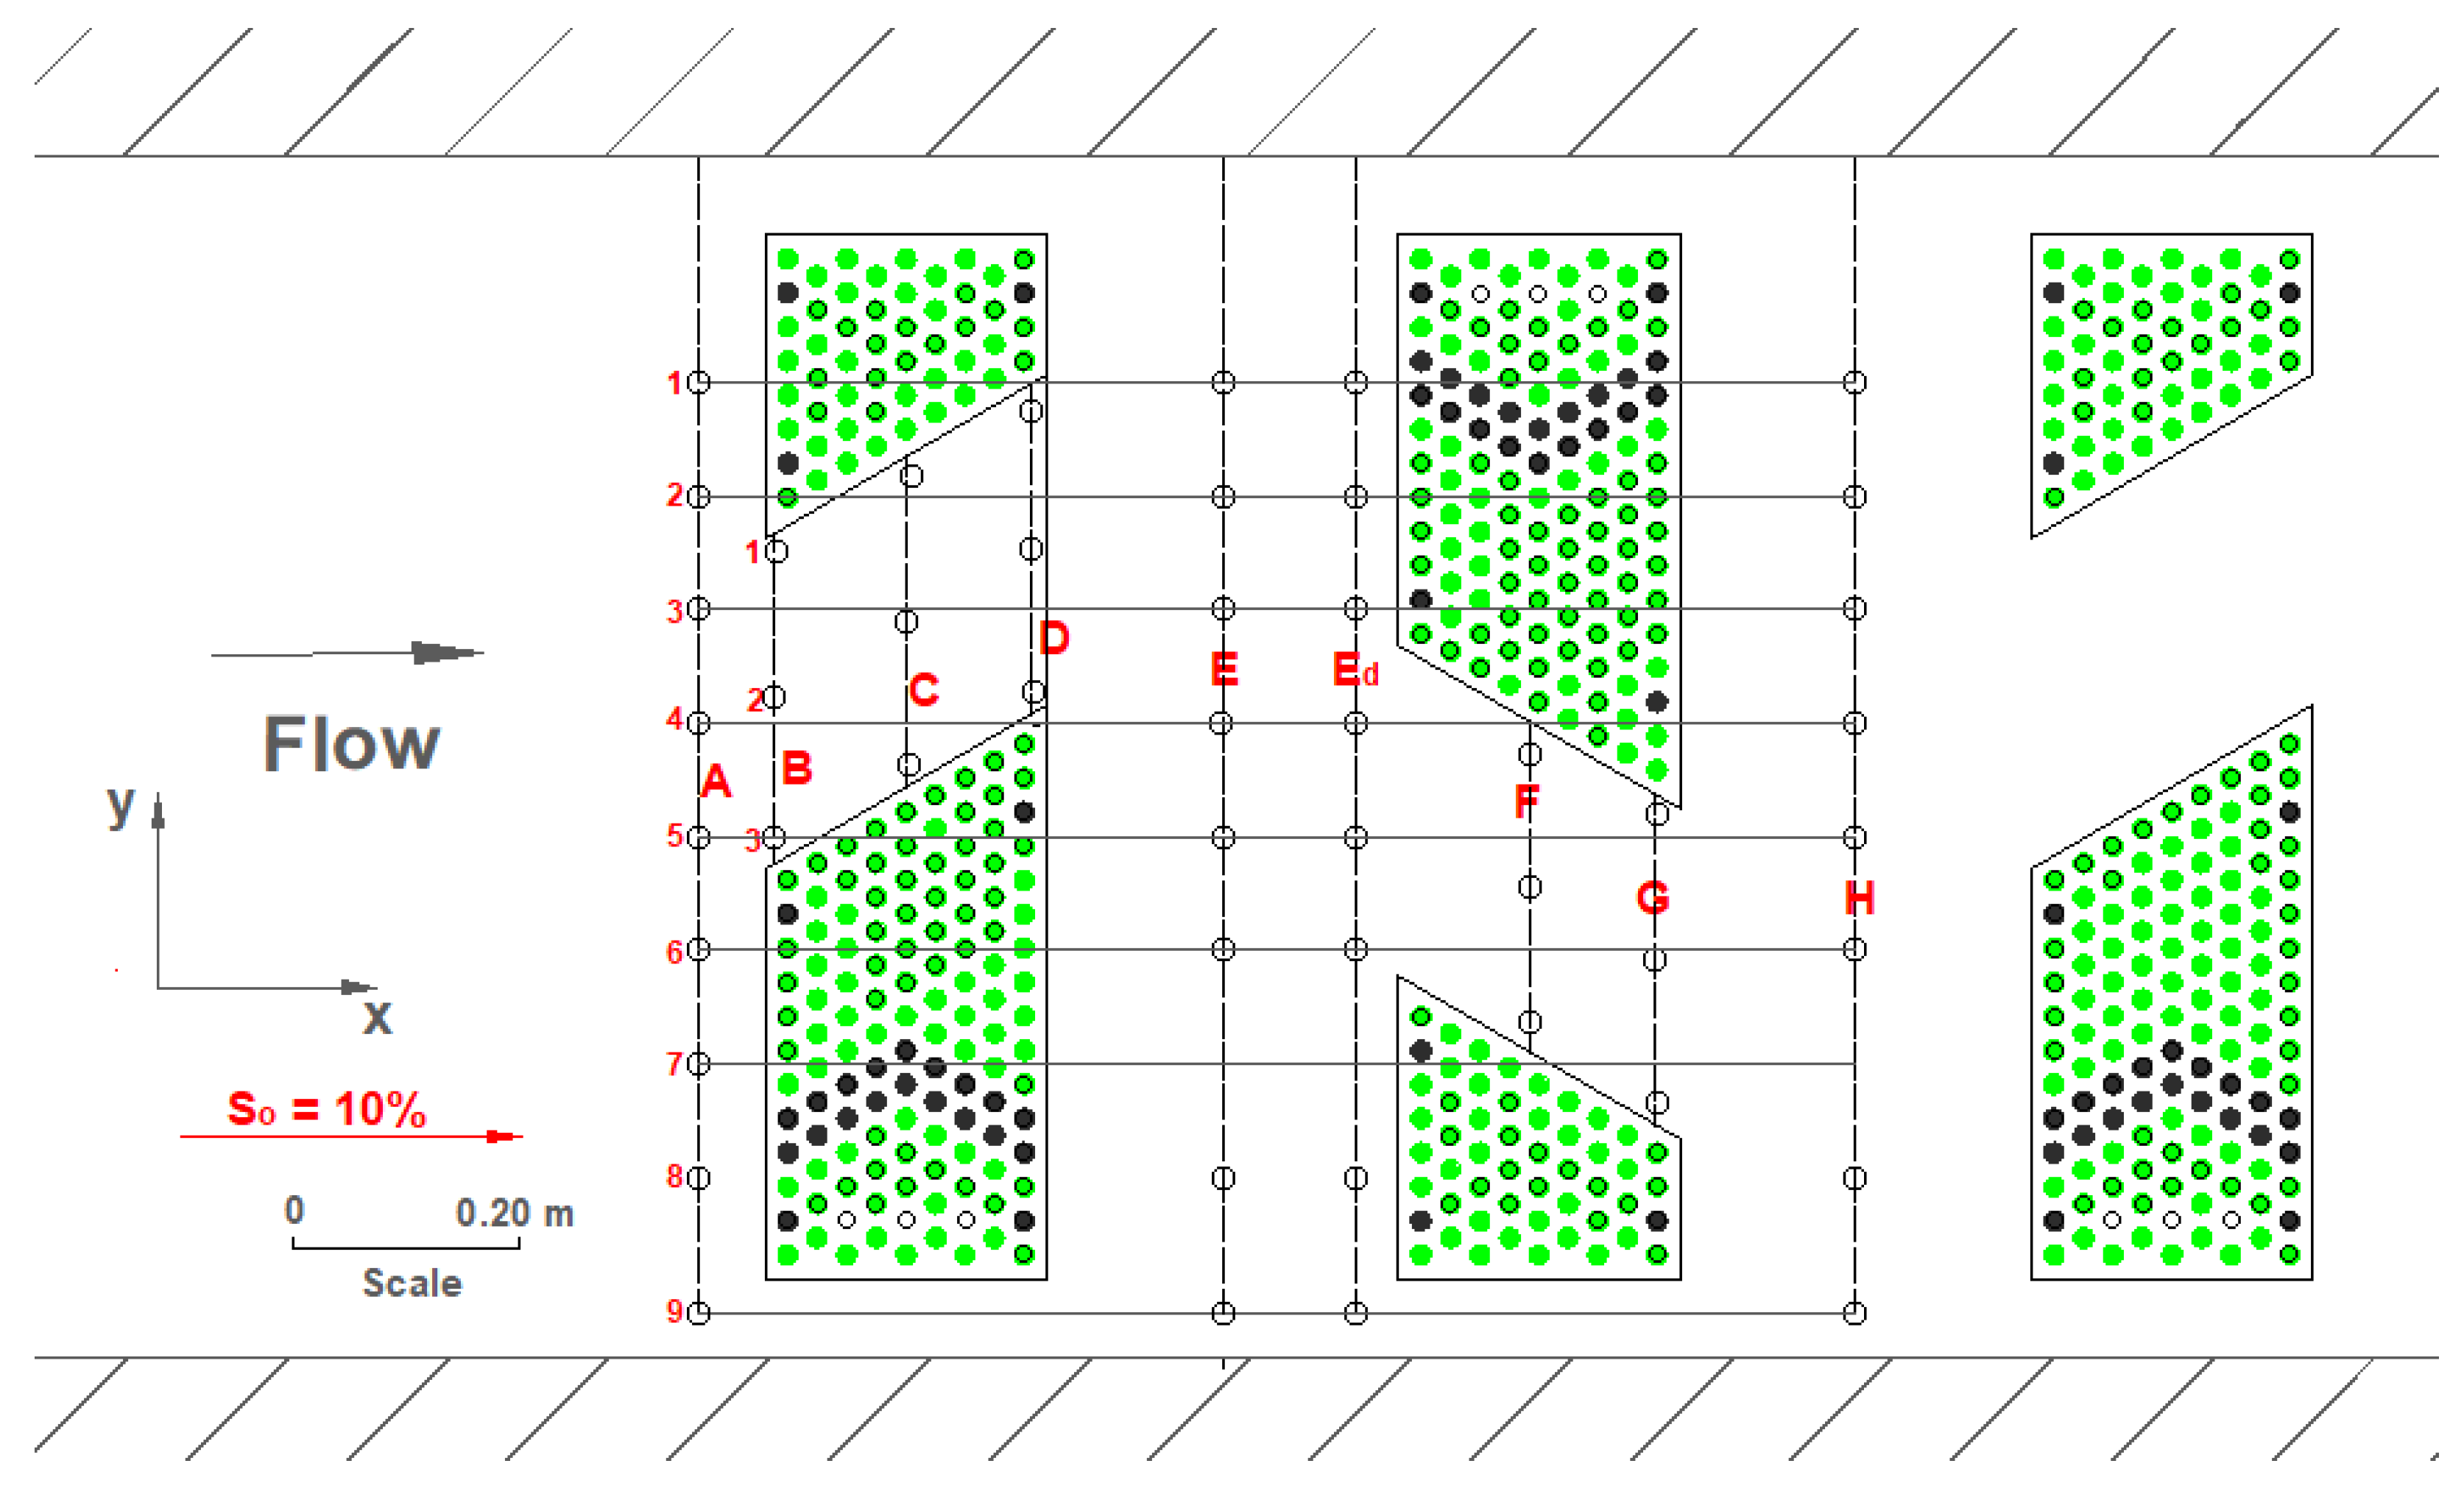
Figure 3 shows the arrangement of the brush blocks in the fish pass constructed in 2017. The grouping of the brush blocks causes pools to form between the groups. Such diagonal arrangement causes flow to cross-exchange constantly and lateral momentum transfer [16]. Rounded river stones (maximum diameter of 0.16 m) are placed on the channel bed (Figure 3). This benefits species with low swimming performance. An acoustic Doppler velocimeter (SonTek 16-MHz MicroADV, San Diego, CA, USA) was used to measure three instantaneous velocity components at a densely spaced grid in the fish pass. The employed ADV typically has three receivers and one emitter; its measurement volume is 0.05 m away from the emitter. The sampling frequency and duration were 50 Hz and 30 s, respectively. The employed ADV measures flow velocities from about 1mm/s up to 2.5 m/s with an accuracy of ±1%. Hydraulic conditions tend to have repeating patterns (Figure 3). Accordingly, a representative basin is selected for the flow and turbulence measurements. The representative basin is located about 6 m downstream from the fish-pass outlet (Figure 4).
Turbulent flows can be described in terms of their time-averaged value () at the point during the sampling period, the fluctuating part of the velocity , and the instantaneous velocity u as follows:
The root-mean-square of the instantaneous velocities in the longitudinal, lateral, and vertical directions, respectively, were calculated at each measurement point, and then the turbulence intensities in three directions were normalized as:
where U is the cross-sectional average flow velocity. The x, y, and z coordinates represent the streamwise, lateral, and vertical directions, respectively. Then, the Reynolds shear stresses in the vertical direction τxz and in the lateral direction τxy are computed from
where ρ is the density of water. The Reynolds shear stresses are induced by velocity fluctuations and affect momentum exchange and mixing processes [17]. The Reynolds shear stress represents fluid force that involves a velocity gradient and is, therefore, of major importance for fish passage studies. Fish may, therefore, experience shear stress when moving between two layers of different velocities. Reynolds shear stresses have also been shown to strongly affect fish swimming performance and stability [18,19]. Silva et al. [20] identified the Reynolds shear stress in the lateral direction as the key parameter which controls the movement of Iberian Barbel in the experimental flume. Turbulent kinetic energy per unit mass k is calculated as follows:
Turbulent kinetic energy, which corresponds to the kinetic energy associated with the fluctuating velocity at a given point, was shown to affect fish swimming performance by increasing energetic costs of swimming [19]. Gao et al. [21] identified turbulent kinetic energy as the single most important stimulus for fish trajectories. The average energy dissipation rate per unit mass for uniform flow, εa (m2/s3), is defined as:
Where So is the channel bed slope, U is the uniform velocity, and g is the acceleration due to gravity. Darcy-Weisbach friction factor, f, is calculated by using Equation (9):
in which Rh is the hydraulic radius (ratio of the cross-sectional area to the wetted perimeter). Therein, Reynolds Re and Froude number Fr are defined as:
where q is the unit discharge, ν is the kinematic viscosity of water, and d is the flow depth. Moreover, volumetric energy dissipation ∆P is computed as follows:
where Q is the discharge, γ is the specific weight of the water, and B is the channel width.
Quantifying fish movement is an essential task for evaluating fishway efficiency [16]. Hence, we installed two underwater GoPro Hero 5 video cameras in the fish pass to investigate fish movements. The cameras’ positions are at the corners of the second brush bar, which is consistent with Schweizer’s [22] study. Video recordings were carried out in July 2017.
3. Results
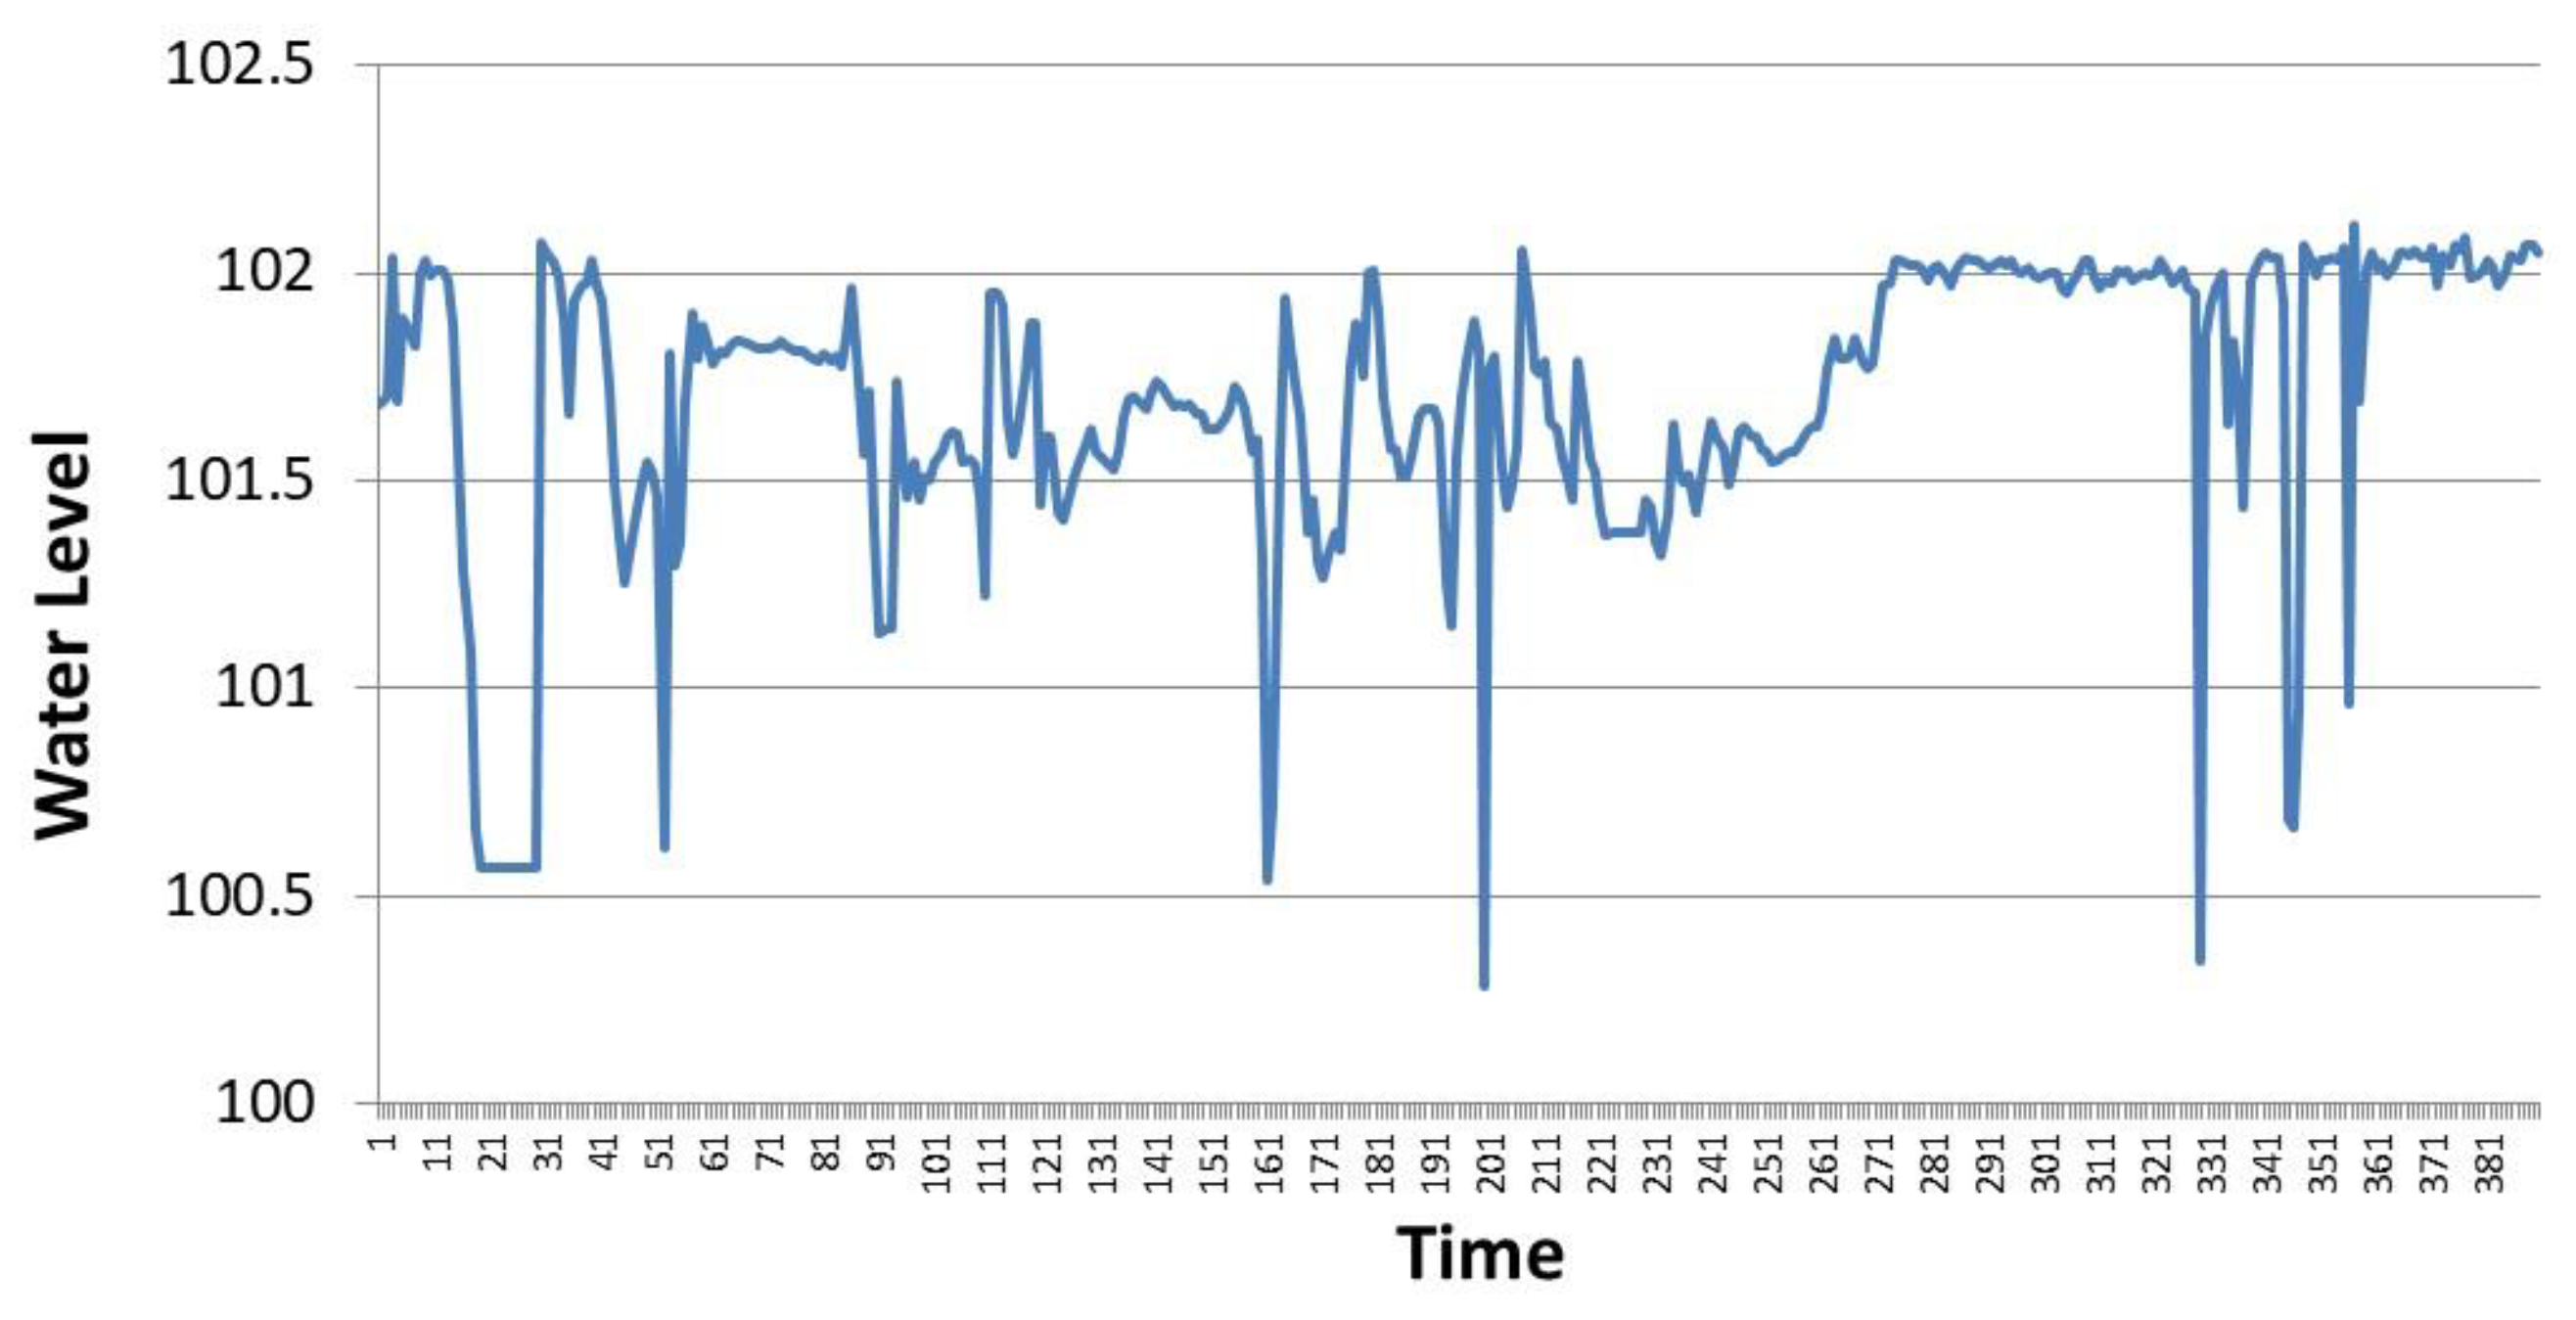
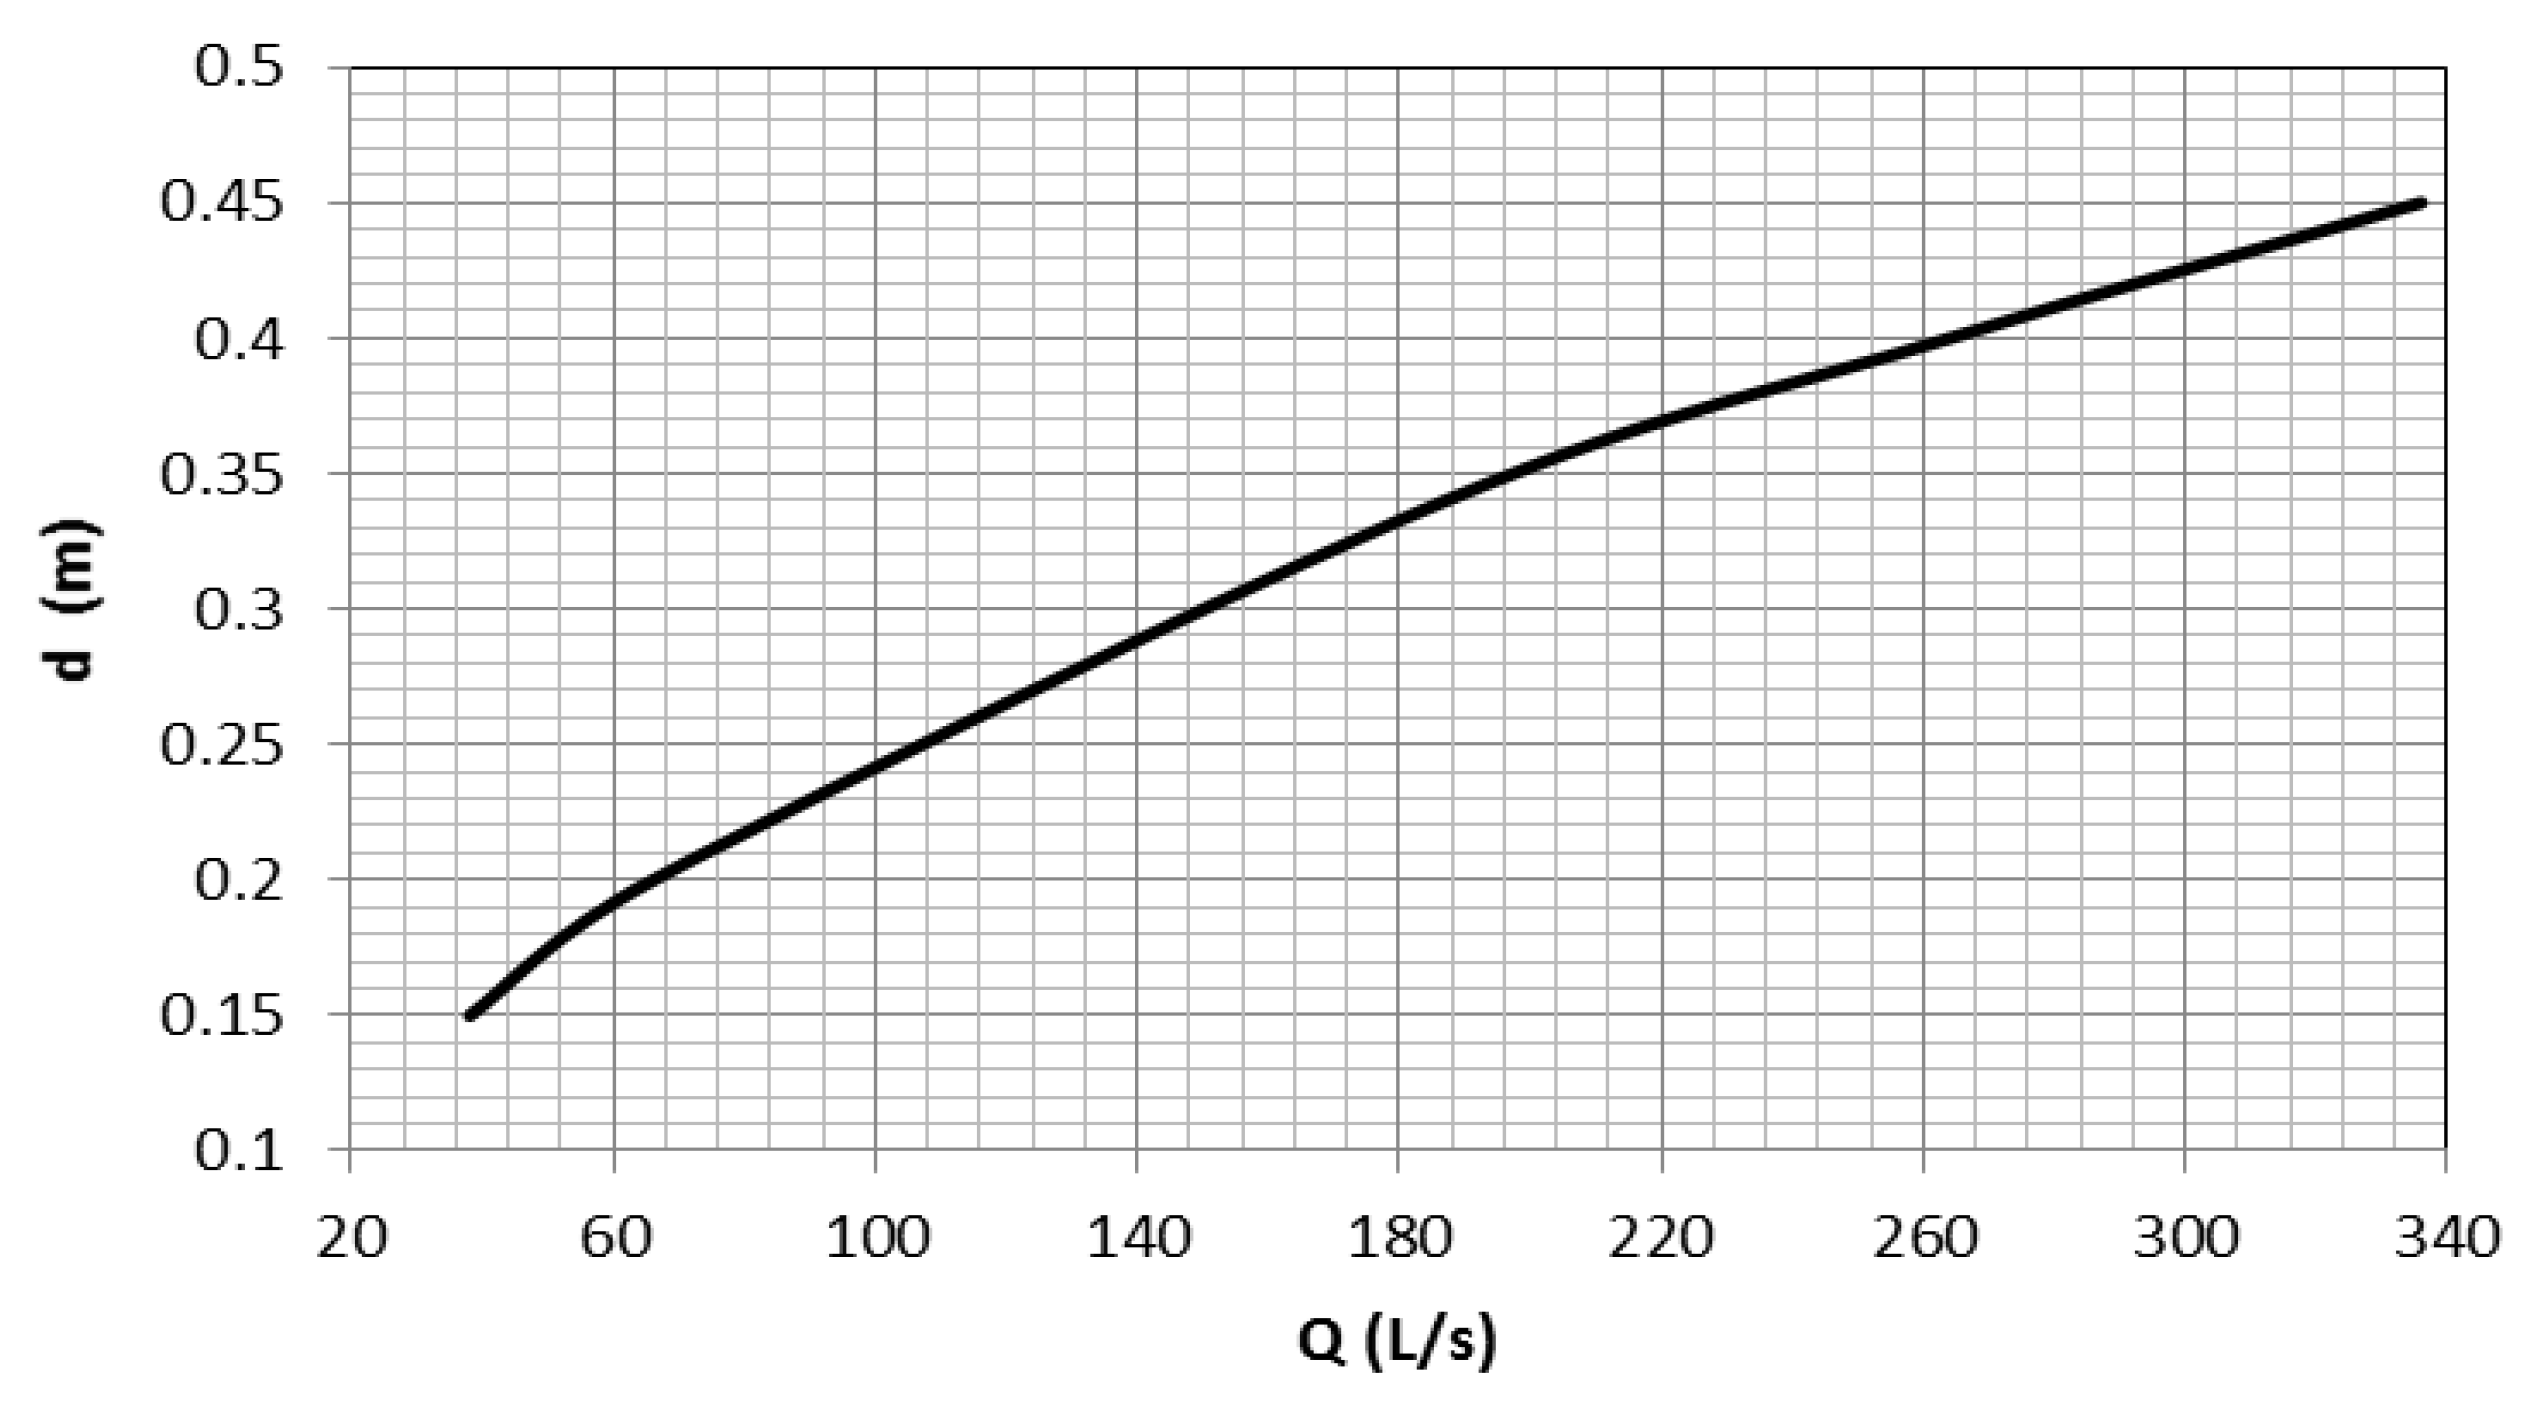
The time series of the water surface elevation of the Incirli HPP reservoir in May 2016 are shown in Figure 5. The data were taken from the SCADA system of the HPP during operation, with a temporal resolution of 15 min. As seen in Figure 5, the water surface elevation of the reservoir varies depending on the HPP operating conditions throughout the month. The fish pass receives water when the water surface elevation of the reservoir is higher than 101.20 m. For the fish pass to work effectively, the water surface elevation must be higher than 101.50 m. Overall, the flow rate in the fish pass depends on the reservoir water surface elevation and the geometry of the fish-pass entrance. A flow rating curve shown in Figure 6 was prepared for the Incirli fish pass based on the measurements made during the field study.
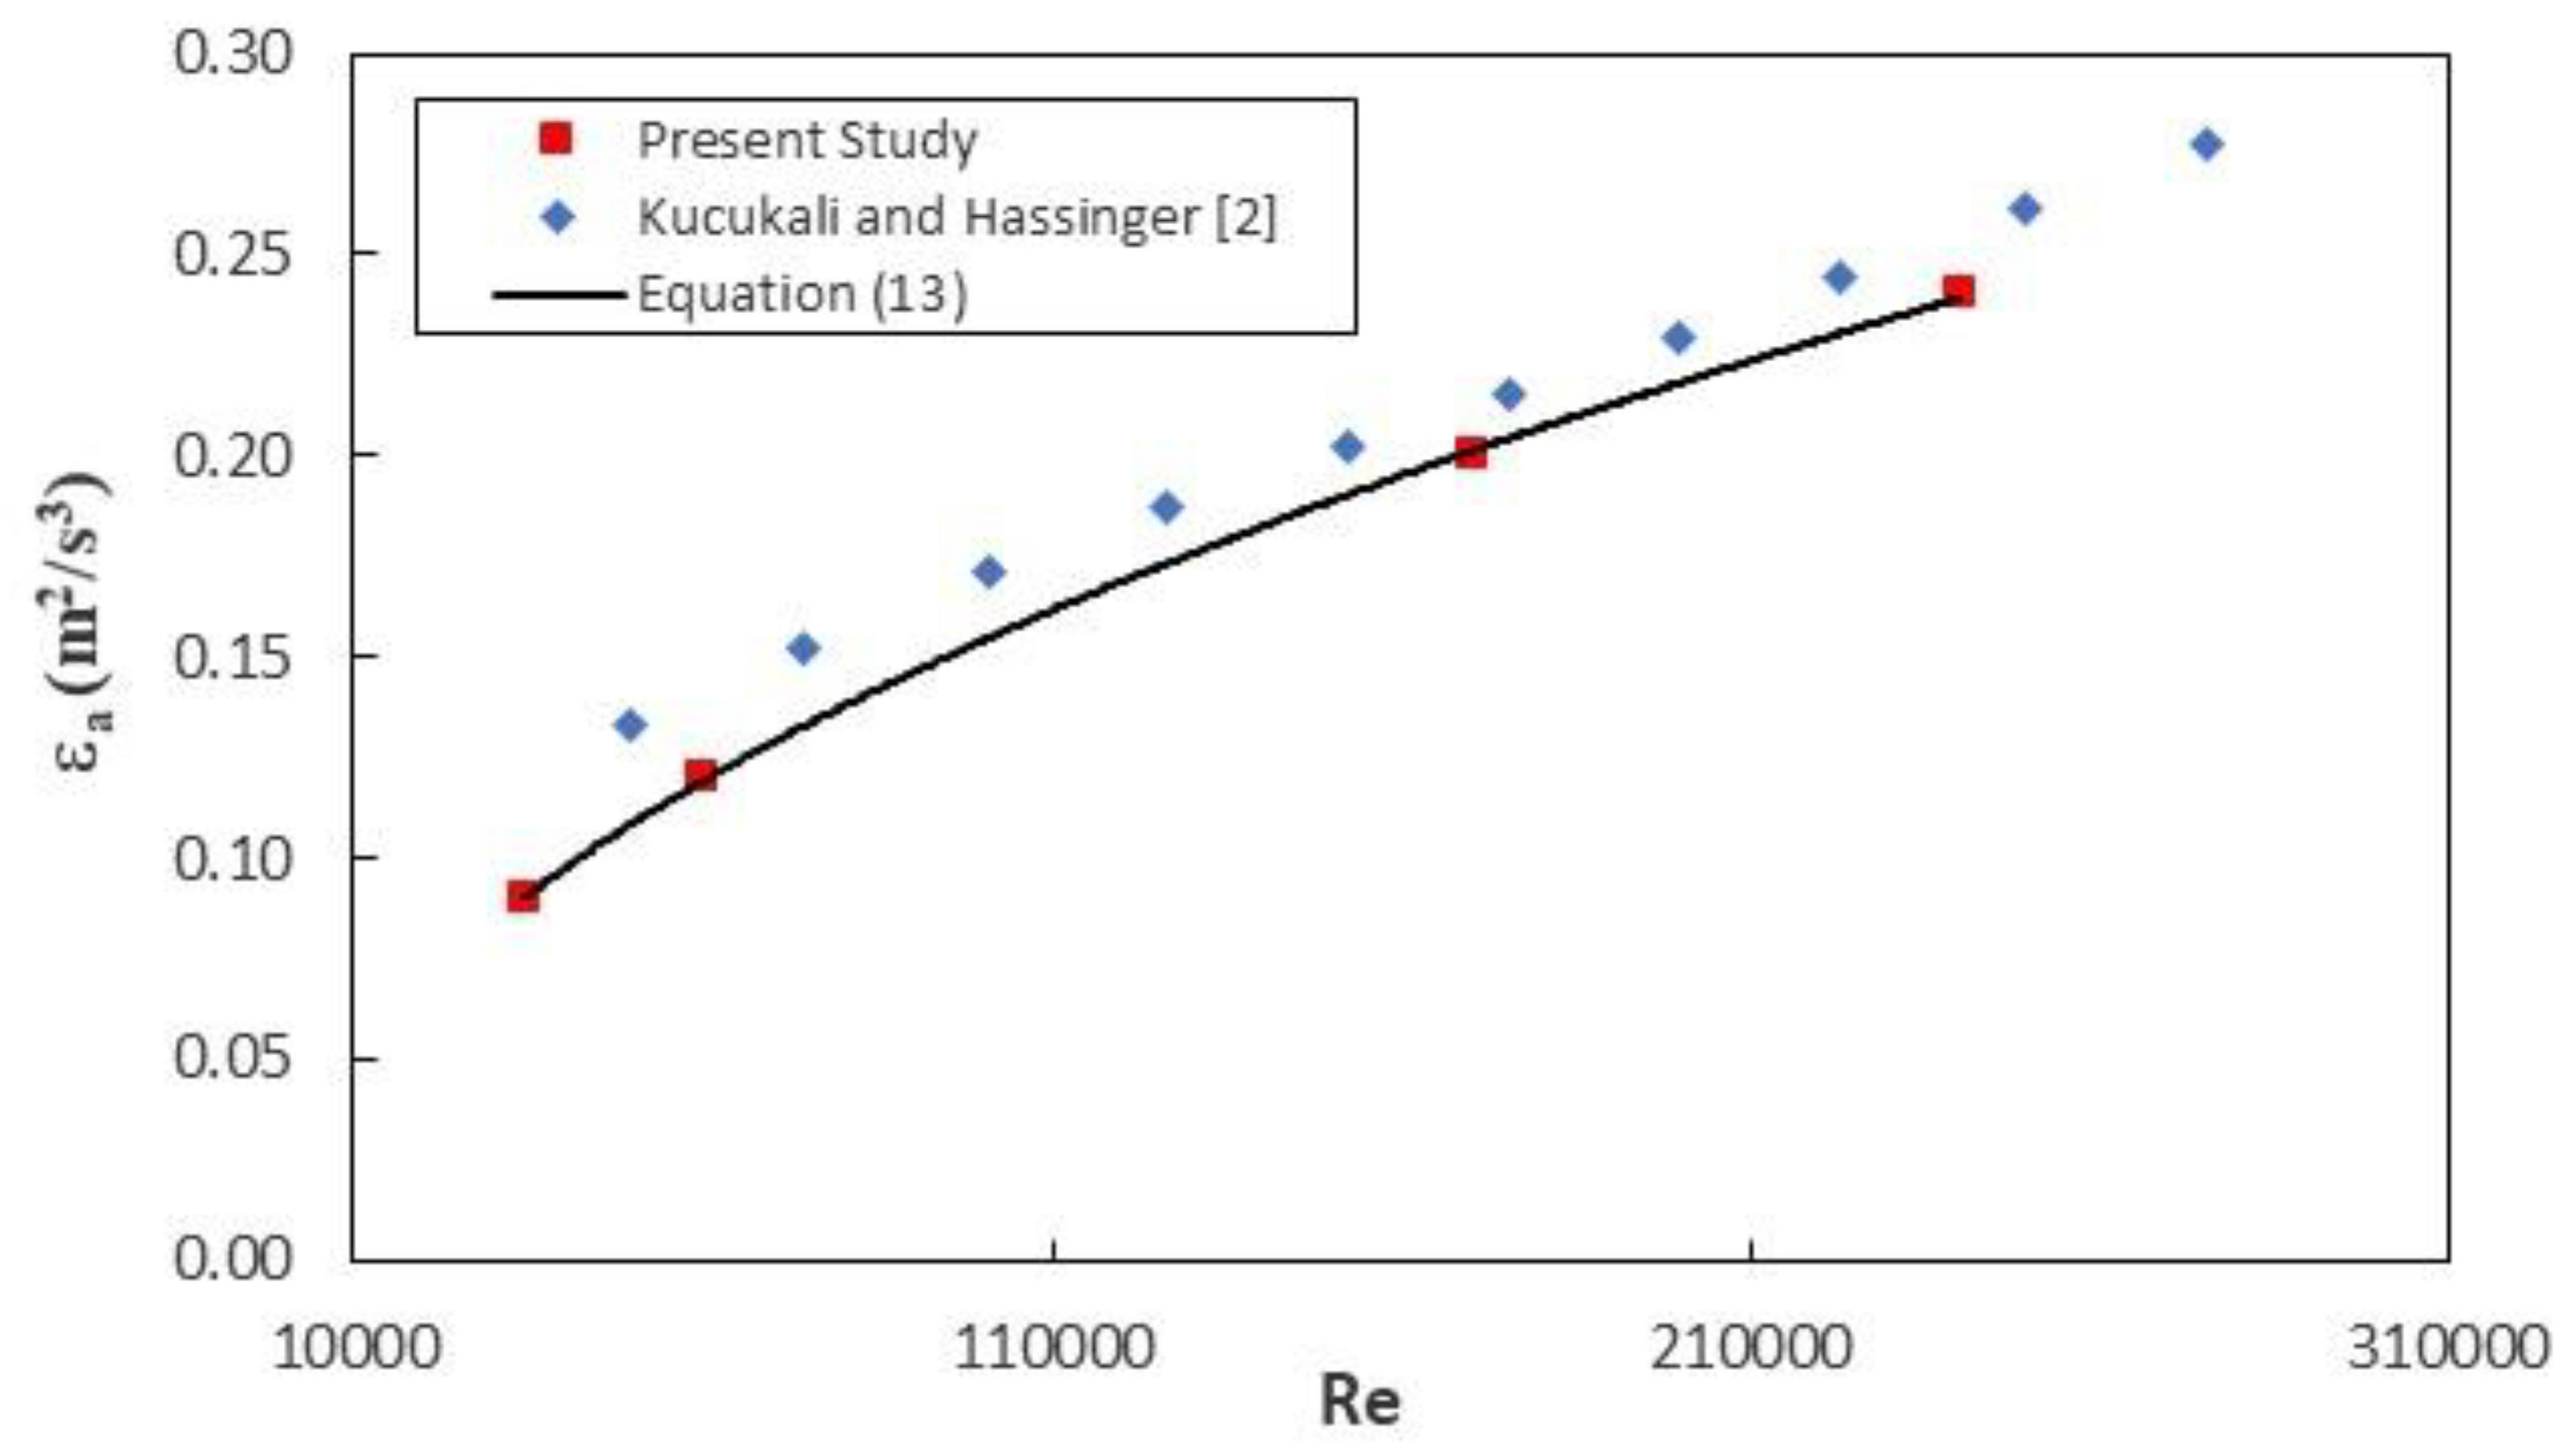
Figure 7 demonstrates the variation of the energy dissipation per unit mass as a function of the Reynolds number, including the data for the baffle-brush composite fish pass (Kucukali and Hassinger [2]). In both studies, the energy dissipation rises with the rise of the Reynolds number, and the difference between the fishway types is not significant. For Incirli data, the best fit regression equation is found as:
The R2 value of this equation is 0.99. This result is consistent with the findings of Yagci [23]’s experimental study of the pool-weir fish-pass type for the range of Re = 1.5 × 10⁴–5.4 × 10⁴, indicating that despite different fish-pass geometries, the Reynolds number has a significant effect on the amount of energy dissipation per unit mass.
The hydraulic data reveal an inverse relationship between the friction factor and the bristle’s relative submergence, d/h (flow depth/bristle height) (Figure 8). When d/h increases from 0.50 to 1.08, f declines from 6.98 to 2.03. In Figure 8, the friction factor is plotted as a function of the relative submergence of a bristle with an aerial density of 0.25, and a logarithmic function best fits this trend as:
The R2 value of this equation is 0.95. Equation (14) demonstrated the dependence of the friction factor on the relative submergence for the proposed fish-pass structure and tested flow conditions (d/h = 0.50–1.08). In Figure 8, the prototype data are compared with the brush-fish-pass physical model data from Kucukali [24] for three different bed slopes (2–6%). Figure 8 shows a direct relationship between the flow resistance and bed slope. Furthermore, Kucukali [24] reported that bed slope is one of the main parameters controlling the magnitudes of energy dissipation and TKE.
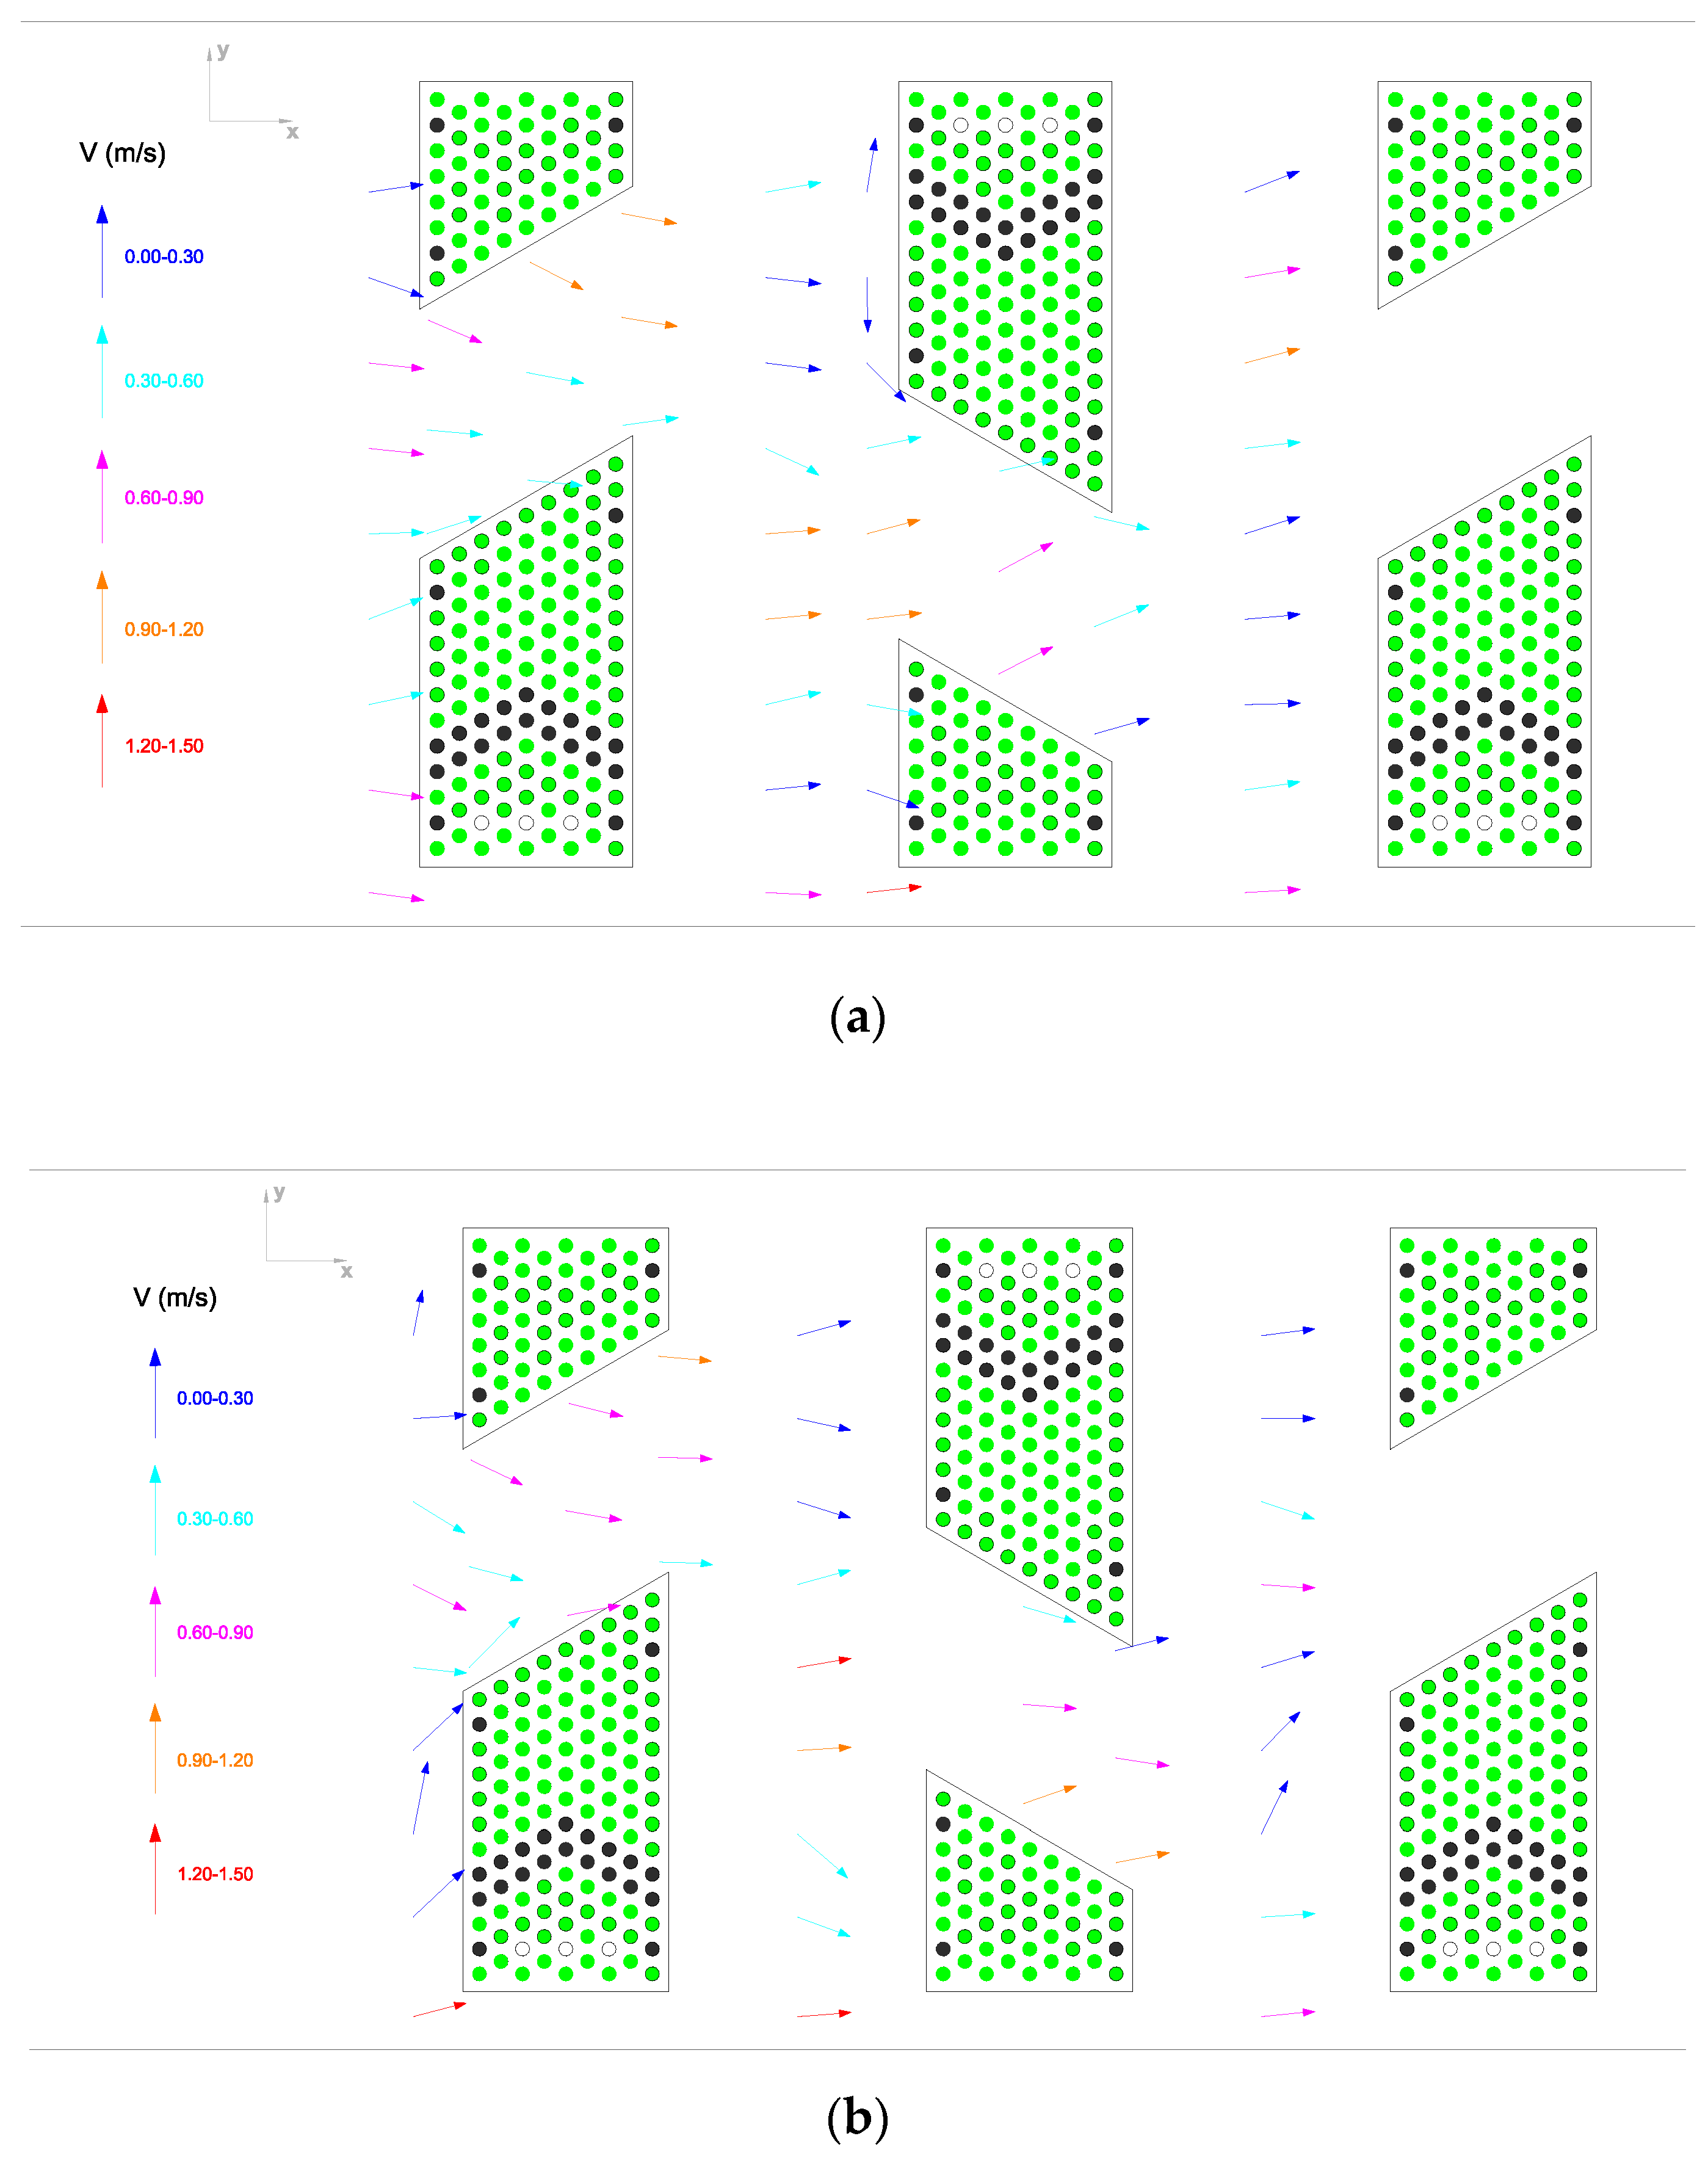
The spatial distribution of the temporally averaged 2D velocity vectors in the brush pass for a discharge of Q = 0.187 m3/s is shown in Figure 9. Flow velocities are high in the S flow (main flow) region. Immediately behind the brush block, the mean flow velocity is reduced by about 70%, but the flow does not separate, and no recirculation zone forms (Figure 9). However, it can still produce boundary layer separation and form resistance at each bristle scale [25], which cannot be seen in Figure 9. The flow resistance within the brush blocks includes the sum of all the bristles’ friction and drag forces.
In all measurements, the highest flow velocities are observed along the axis of number 9 beside the side wall (see points from A to H in Figure 4), where the free-water jet is formed. The flow velocities observed in the region of the free-water jet are in the order of 1.5 m/s. However, the free jet zone is reserved only for Salmo coruhensis, which has a high swimming capacity; it is not reserved for all fish species. Additionally, a comparison of the flow field at the bottom and mid-depths (Figure 9a,b) reveals that there is not a considerable difference between velocity distribution and magnitudes, indicating a two-dimensional flow structure.
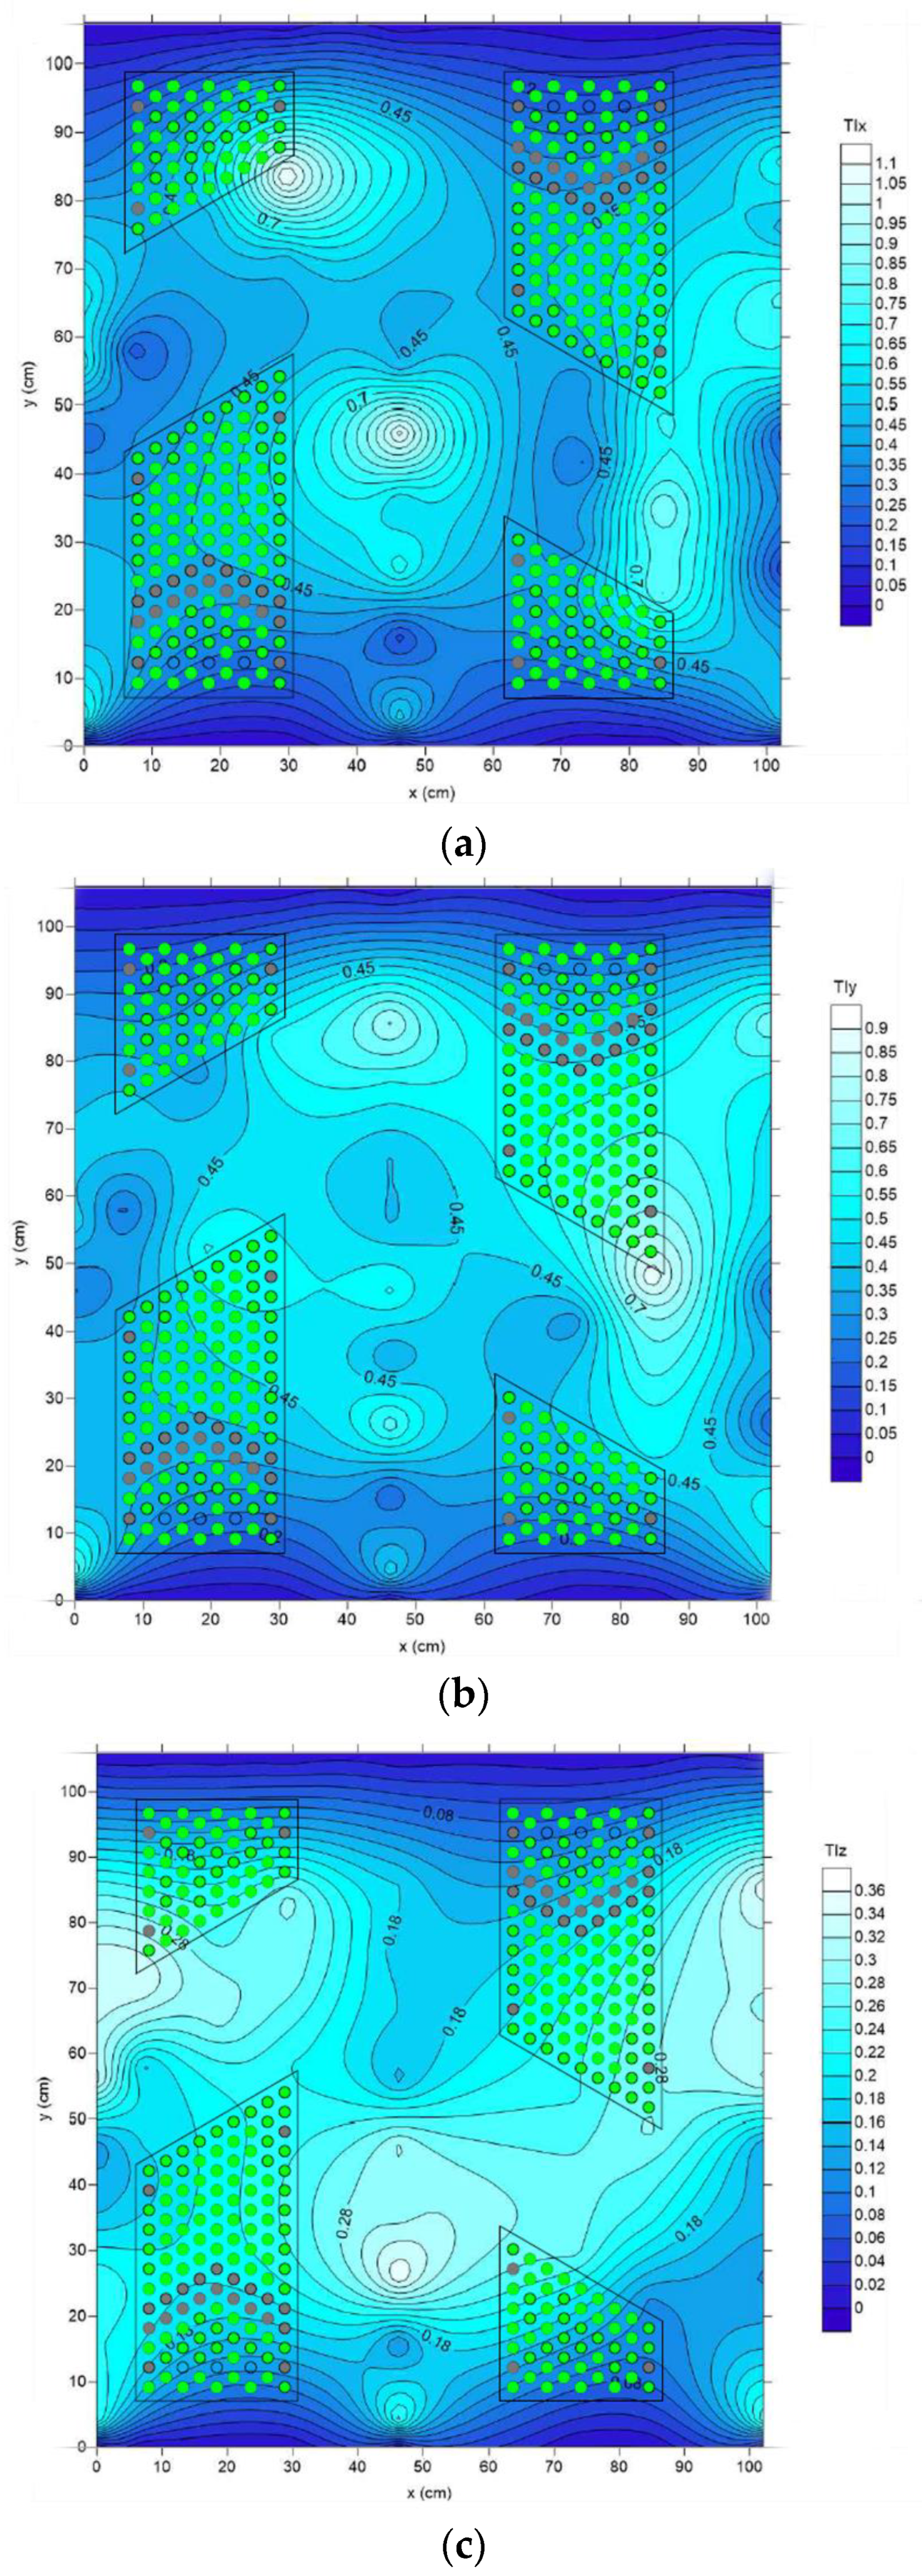
The distribution of streamwise (TIx), transverse (TIy), and vertical (TIz) turbulence intensities in the vicinity of the brush blocks is presented in Figure 10a, b, and c, respectively. Figure 10 clearly show that turbulence is not isotropic, and TIx values are higher than other directions. TIz distribution is similar to TIx but with much lower magnitude. Overall, TIy is responsible for 37% of the turbulent kinetic energy (TKE). Contributions to TKE from the streamwise and vertical components are 46% and 17%, respectively. In addition, Figure 10 highlights that high-velocity zones are associated with high turbulence intensity levels.
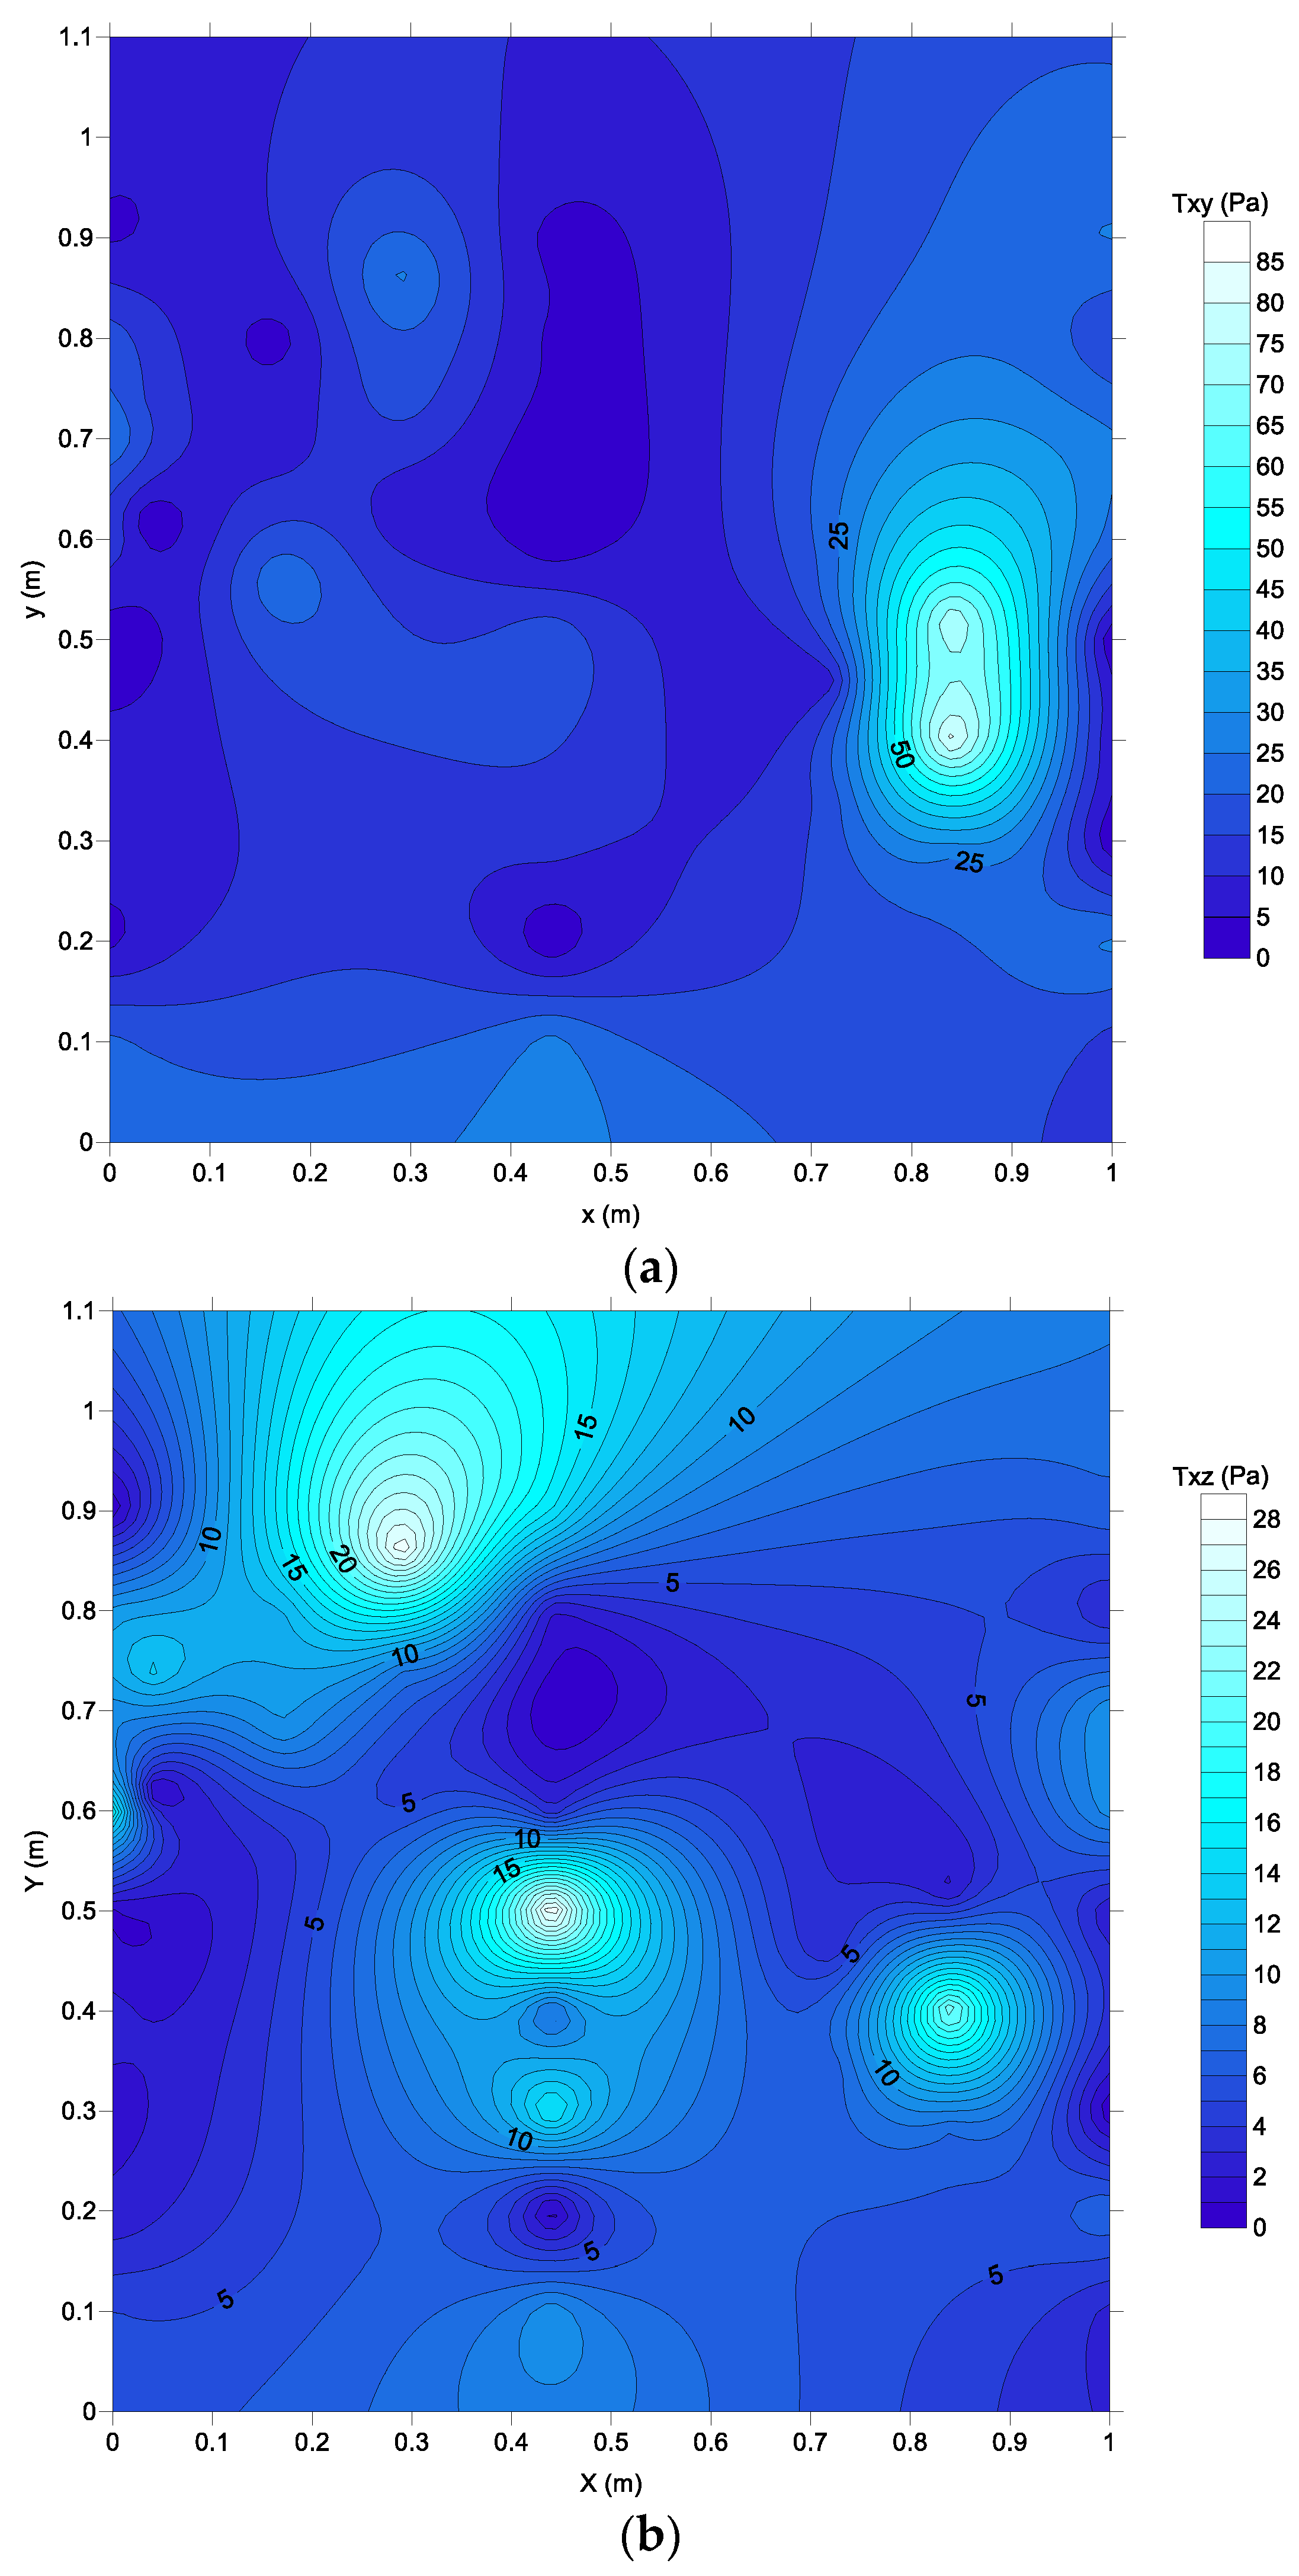
Figure 11 shows the distribution of Reynold shear stresses in vertical and lateral directions. Behind the brush blocks, shear stresses have lower values, while higher stress values are observed in the main flow region. It was found that the spatially averaged lateral component of Reynolds shear stress is higher than the vertical component of Reynolds shear stress by a factor of 2.2. The increase in the lateral component of Reynolds shear stress (τxy) can be explained due to the horizontal mixing in the vicinity of brush blocks. In brush fish pass, the lateral velocity distribution creates a transverse exchange of momentum. This flow pattern may have important implications for upstream fish migration.
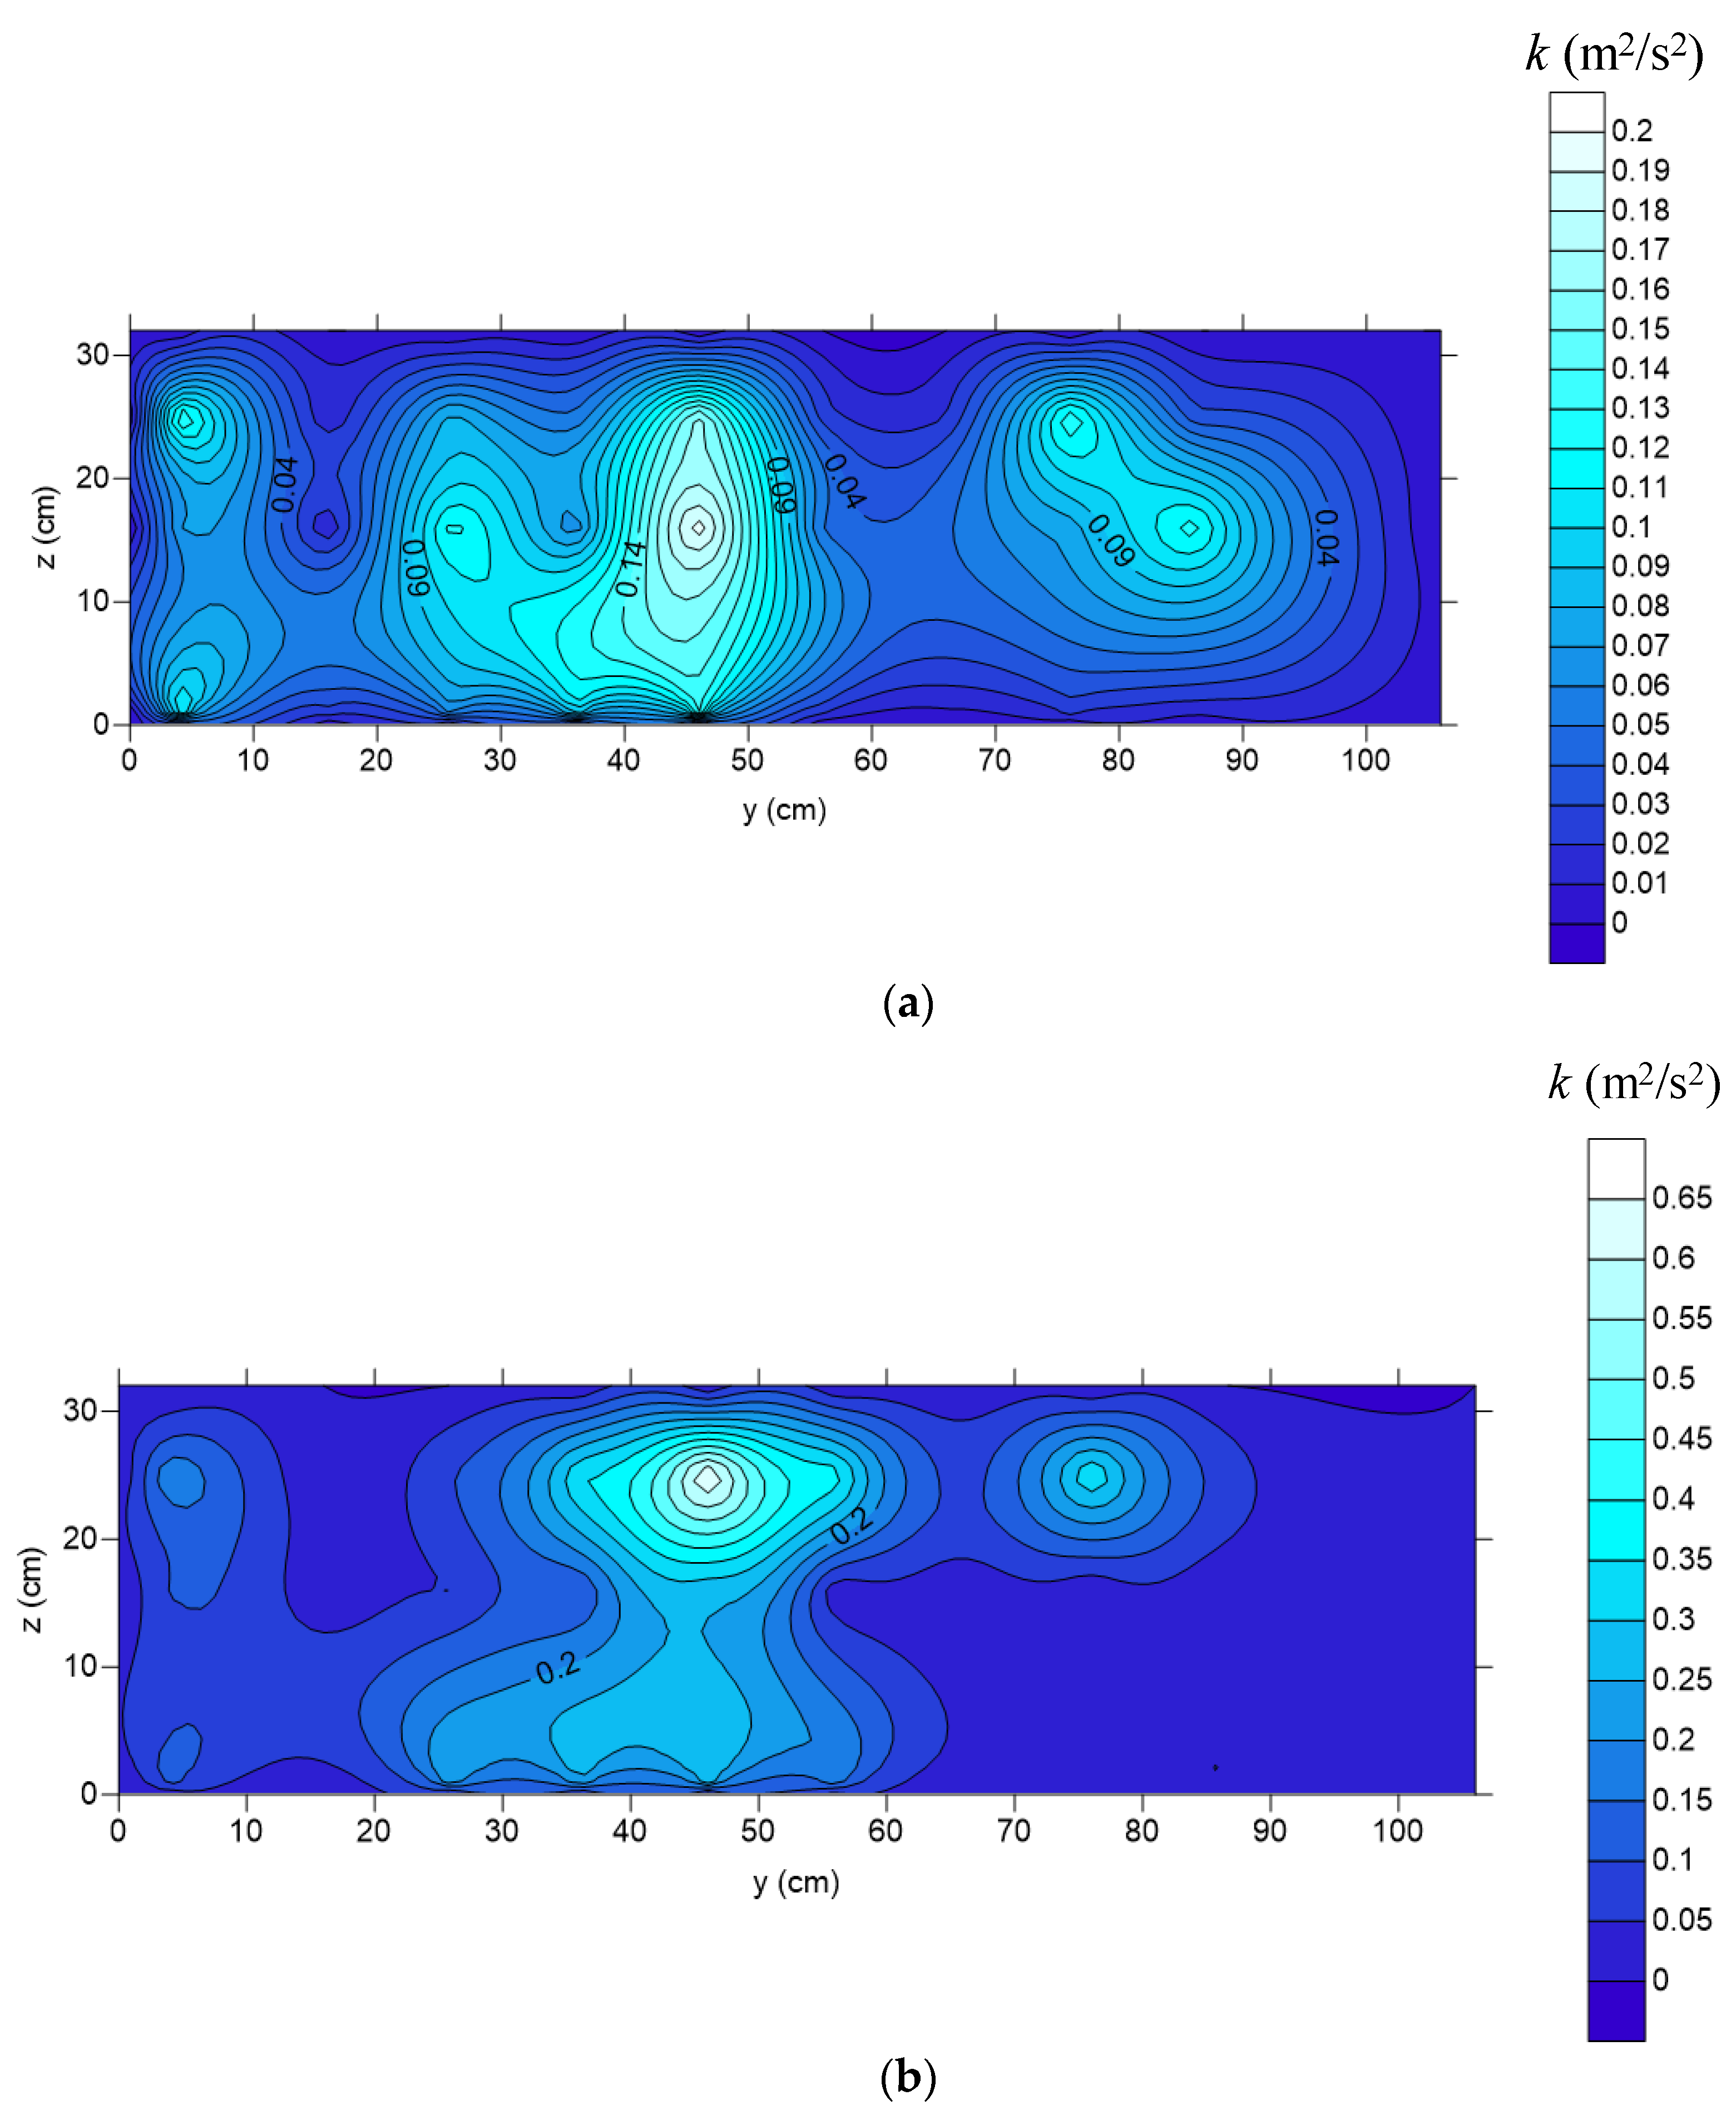
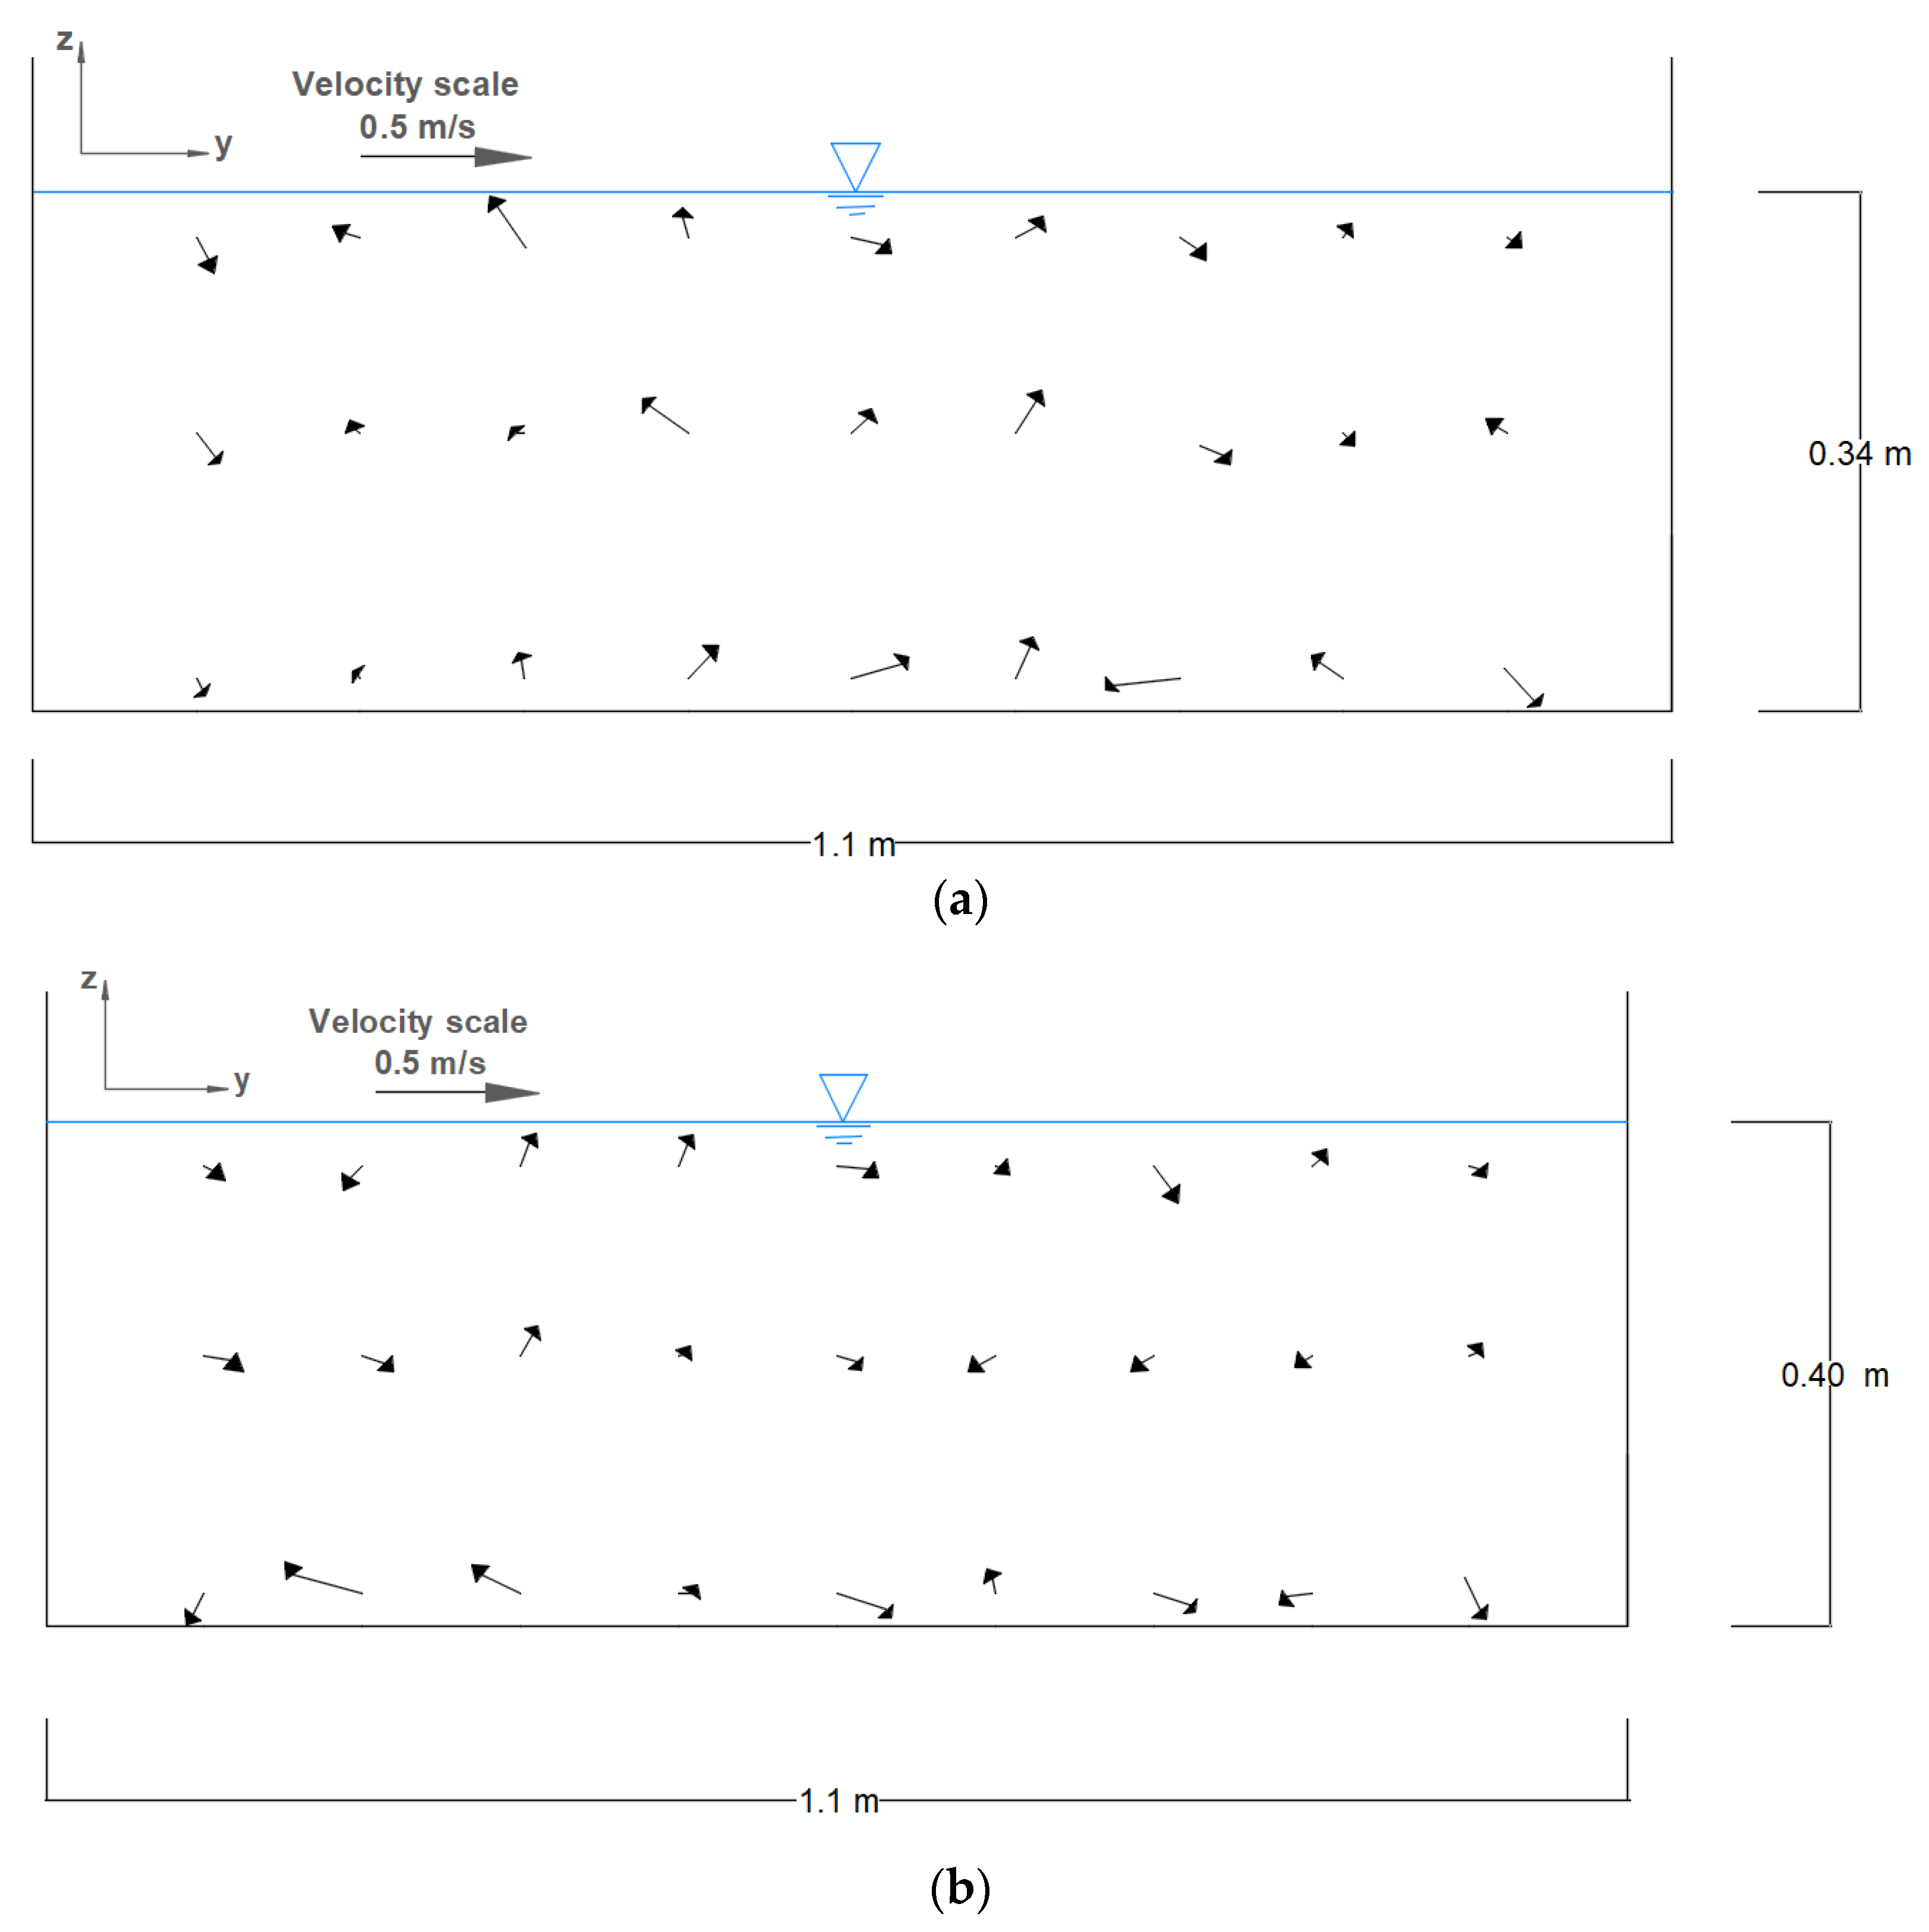
Figure 12 shows the cross-sectional distribution of turbulent kinetic energy at the streamwise location of E for relative submergences of d/h = 0.92 (unsubmerged) for Q = 0.187 m3/s and d/h = 1.08 (submerged) for Q = 0.264 m3/s. TKE has its maximum value of 0.2 m2/s2 in the outer region of the diagonal for d/h = 0.92 (Figure 12a). TKE values are significantly lower near the wall region than in the S flow region (main flow). Figure 12 shows that when the bristles are submerged, the maximum TKE is increased by a factor of three compared to unsubmerged conditions (Figure 12a). Figure 13 shows the distribution of the temporally averaged velocity vectors (Vy and Vz velocities) in the vertical section E just in front of the second brush bar for two different submergence ratios. Although there is a considerable difference between the order of TKE magnitudes in submerged and unsubmerged conditions (Figure 12), velocity magnitudes did not change considerably (Figure 13).
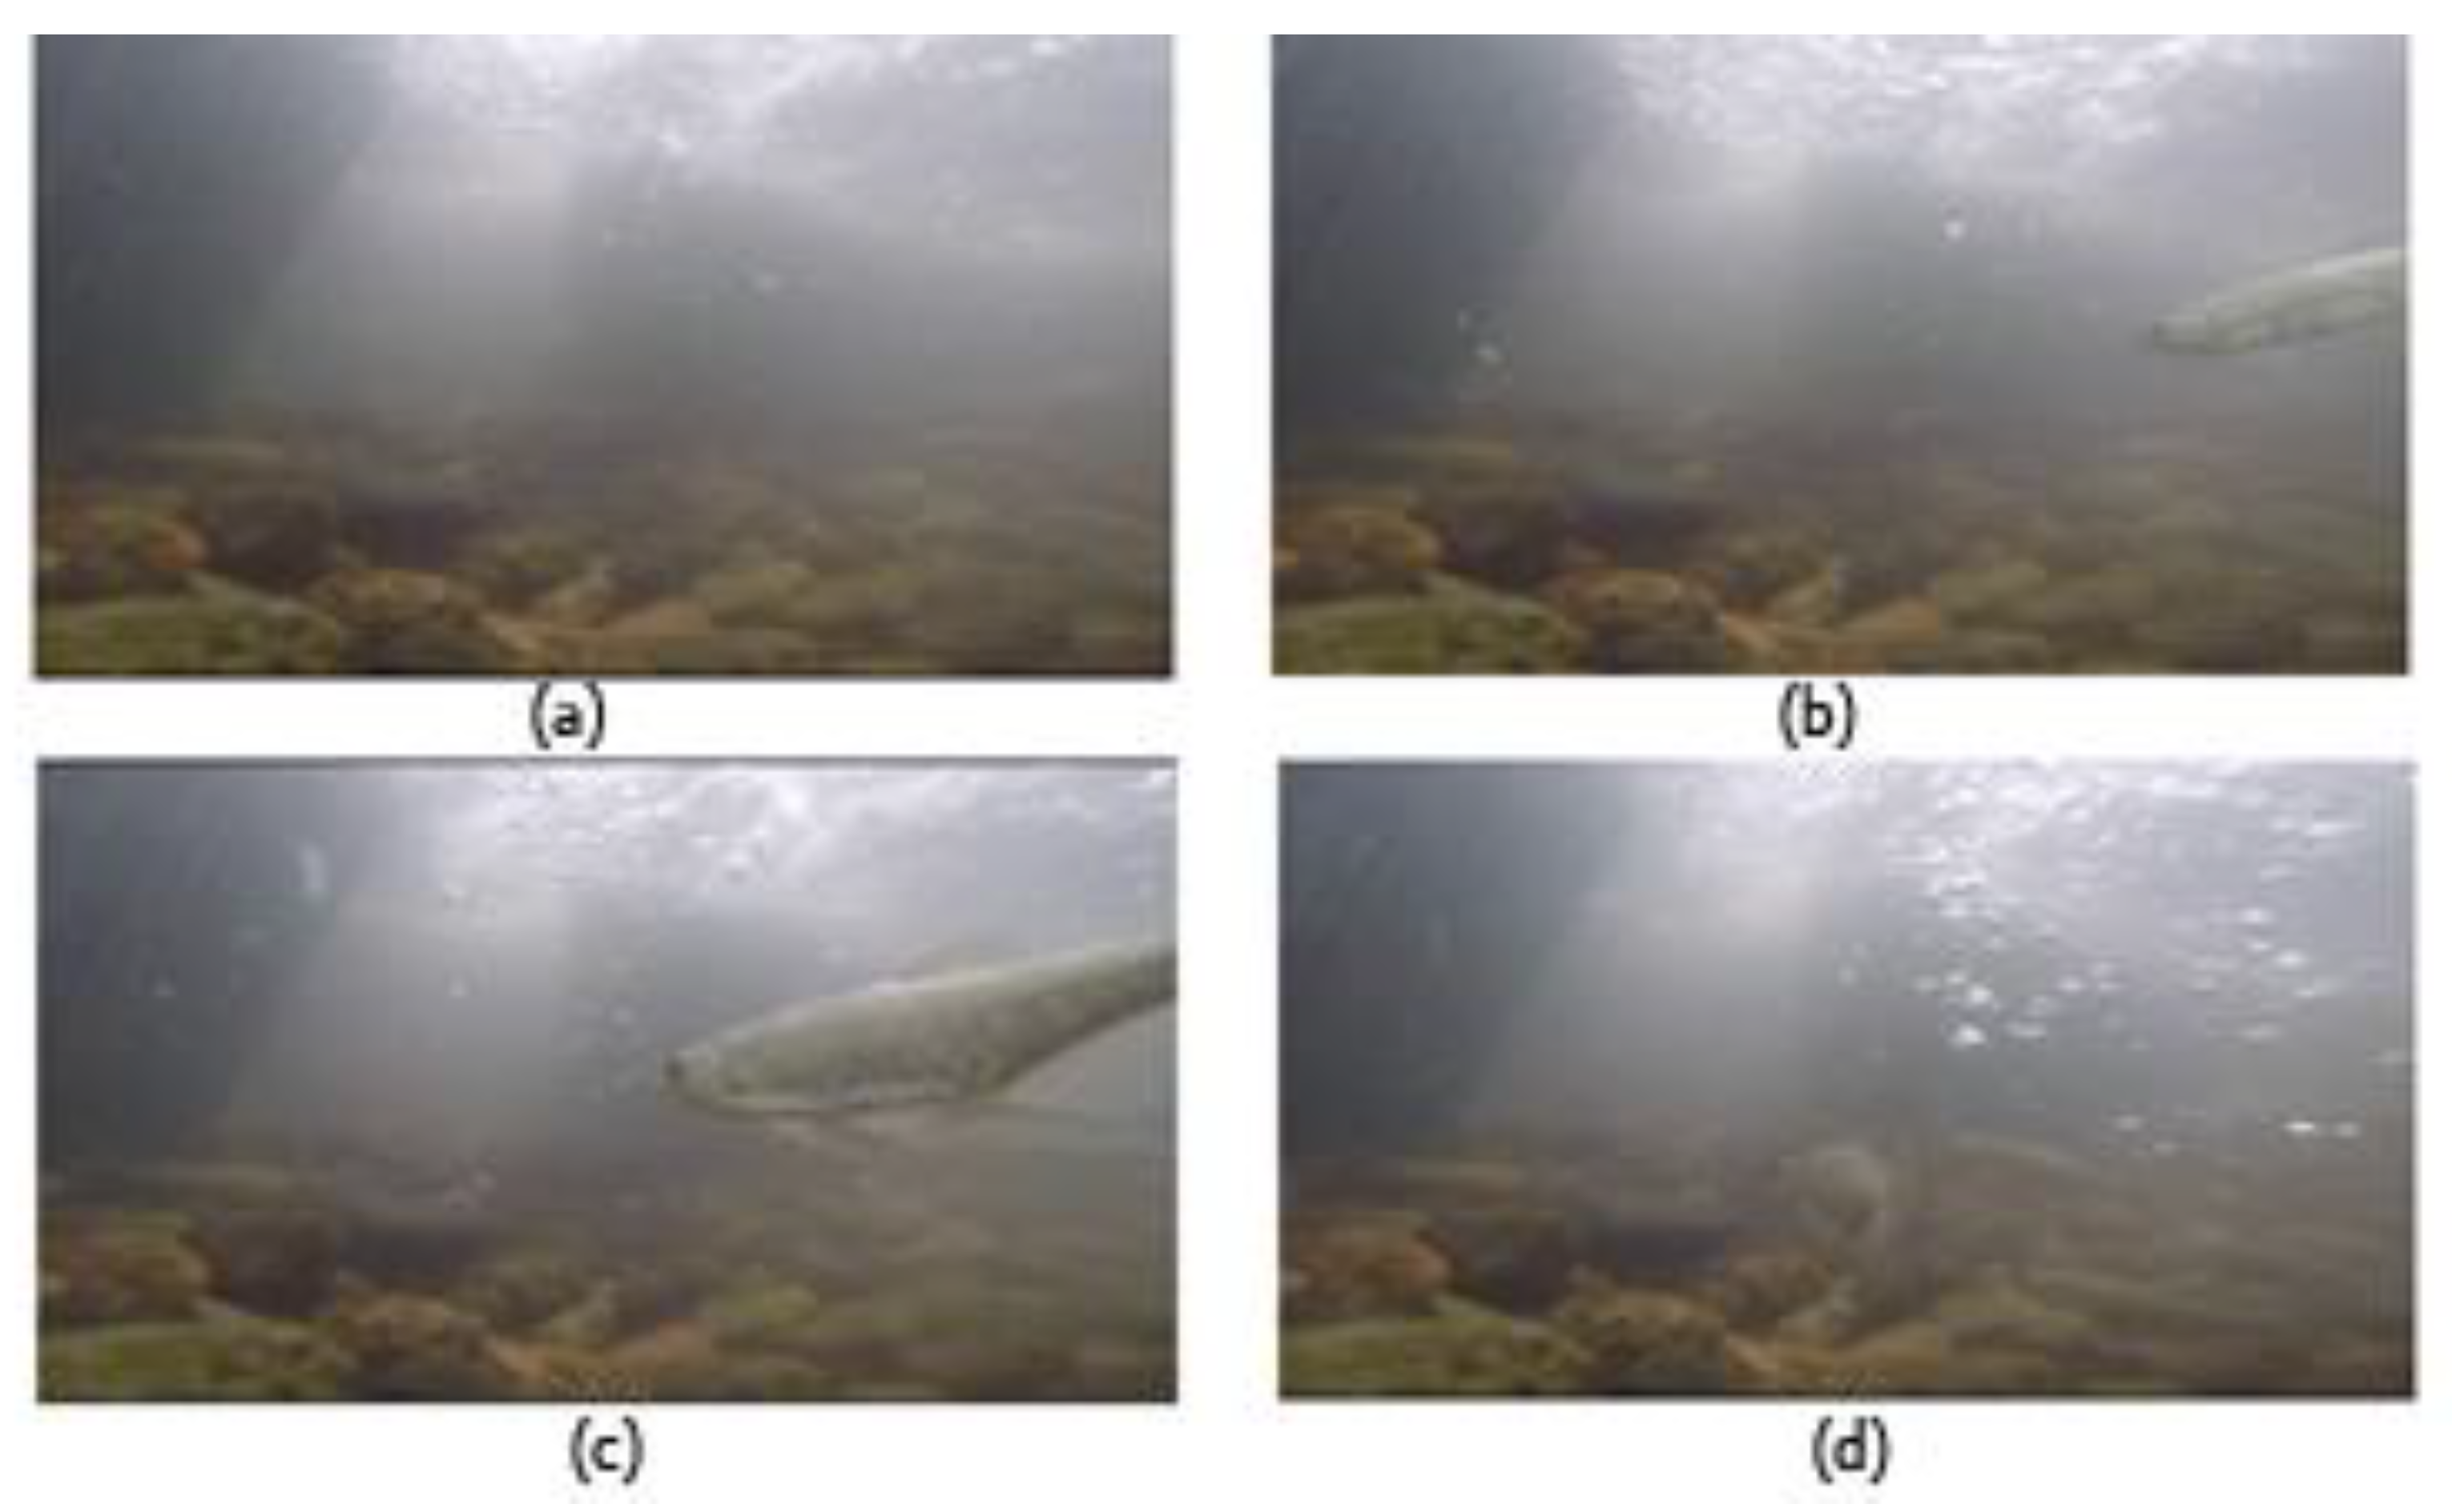
An analysis of the underwater video recordings revealed that a group of Alburnoides fasciatus followed the path of the first fish passing the brush block and proceeded with the schooling effect (Figure 14). The substrates and back of brush blocks create low-velocity zones and shelter for fish. Bottom substrates act as a refugee habitat, especially for fish with a weak swimming capacity (i.e., Ponticola rizeensis).
4. Discussion
During the monitoring study, the Reynolds number ranged between 3.45 × 10⁴ and 2.4 × 10⁵. In the present study, considering the high Reynolds number, the results are not affected by viscous scale effects. Since the formation of vortices and momentum transfer are an important part of the investigations, the Reynolds number is of prime importance. However, this issue, i.e., the effect of Re, was not addressed in some of the previous studies. For instance, Wu et al. [26] reported that the Reynolds number had no effect on the energy dissipation rate and the dissipated power density was directly proportional to the slope of the vertical-slot fish pass. However, in the present study, the energy dissipation per unit volume tends to increase with the increasing Reynolds number, from 226 to 589 W/m3. Moreover, the negative correlation of the flow characteristics with the relative submergence agrees with the previous studies [2,25,27].
The monitoring data revealed that a low-velocity zone is ensured for the upstream passage of small-bodied fish [16]. The maximum measured velocity of 1.5 m/s is well below the recommended value of maximum velocity of 2.0 m/s for fish passes [6]. Moreover, the present results have been also compared to those from the conventional fish-passage structures. In most of the international standards [6,7], it is recommended that ΔP should not exceed 200 W/m3. However, the findings reveal that this threshold value is not a relevant criterion for a brush fish pass because a significant amount of energy dissipation takes place in brush blocks with the displacement of bristles.
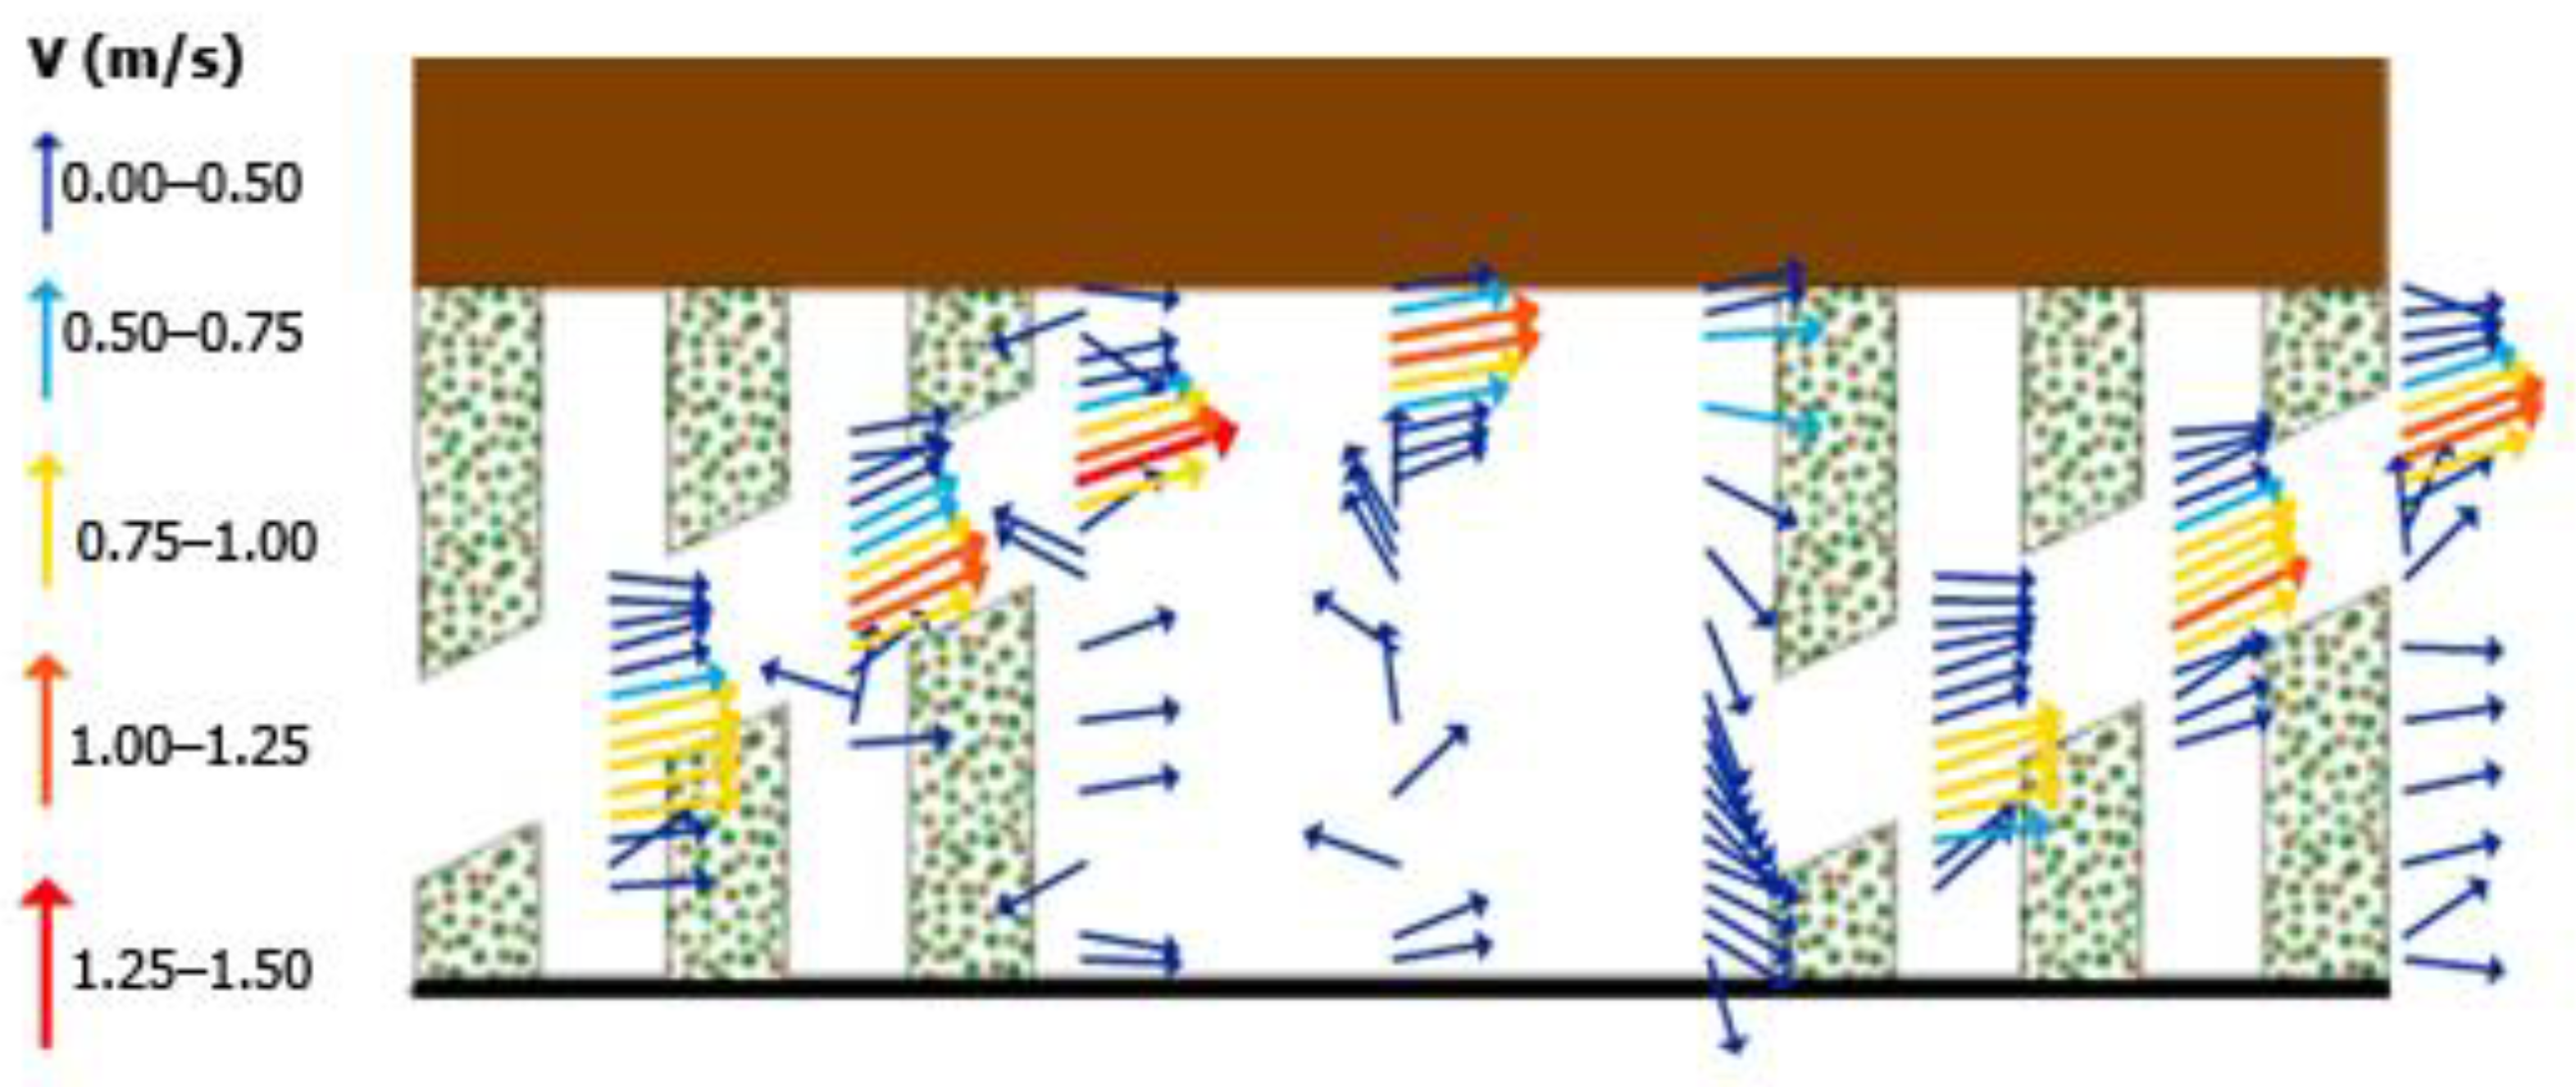
The present maximum measured velocities in the order of 1.5 m/s (Figure 9) are in good agreement with the findings from the laboratory measurements (Figure 15) made by Rahn [3]. Furthermore, the flow pattern with the higher velocities observed in the main flow region (S flow region) in the present study (Figure 9) is consistent with the physical model results (Figure 15). Brush blocks have permeability (i.e., it is like a porous media) and, hence, 50% of the flow passes through the brush blocks, which is consistent with the Rahn [3] laboratory measurements for diagonal brush fish passes. The absence of boundary layer separation behind flexible and permeable hydraulic elements is in line with observations by Nikora et al. [28] and Mosch [29]. Mixing and momentum transfer occur due to the velocity gradient in the lateral direction around the diagonal brush blocks. This flow structure prevents both excessive flow acceleration and the presence of high-velocity zones, favoring easy passage for small (i.e., Alburnoides fasciatus) and large fish (i.e., Salmo coruhensis). Such flow patterns may have important implications for upstream fish migration.
Kucukali et al. [16] conducted a fish-monitoring study at the fish pass of the present case study HPP and reported that the attraction efficiency of the fish pass was 21.98% for all studied fish species. In total, 55 of the 82 marked fish entering the fish pass ascended -the fish pass and were detected at the upstream antenna. Accordingly, the passage efficiency of the fish pass was calculated as 67.07% for all fish species. On a species basis, the attraction efficiency of the fish pass was the highest for Alburnoides fasciatus (33.33%) and the lowest for Ponticola rizeensis (12.31%). Passage efficiency was the highest for Capoeta banarescui (100%) and the lowest for Ponticola rizeensis (50.00%). The fact that the passage efficiency of Capoeta banarescui was the highest could be related to the low number of individuals of that species entering the fish passage. On the other hand, the lowest efficiency of Ponticola rizeensis, which is endemic to Iyidere, could be due to the weak swimming capacity of the fish. The flow velocities observed in the region of the free-water jet are in the order of 1.5 m/s. However, the free-jet zone is reserved only for Salmo coruhensis, which has a high swimming capacity, not for all fish species. The reported low attraction efficiency of the brush-type fish pass is more likely due to the habitat destruction of the river downstream and the release of the higher environmental flow below the gates of the weir in the order of 5 m3/s than at the entrance of the fish pass, indicating the importance of the downstream boundary conditions of the fish passage. The attraction efficiency of the fish pass, therefore, needs to be improved for an efficient upstream fish passage in the study river.
5. Conclusions
The brush fish pass represents a good option for fishways in small river basins. In a high-gradient channel with a bed slope of 10%, the maximum measured velocity of 1.5 m/s is 30% less than that of vertical-slot and pool-weir fishways. The flow regime is quasi-uniform, which is different from other fish-passage flow regimes (i.e. gradually varied), and acceleration is negligible. Flow behind the brush blocks is characterized by low-velocity zones which do not exhibit negative velocity. Behind the brush blocks, fish are not subject to considerable turbulent shear forces, and those regions are thought to be resting areas for fish. It is shown that the diagonal fish pass provides several migration corridors which are suitable for multiple fish species with different preferences. The proposed innovative design is cost-effective and easy to implement. Moreover, the findings demonstrated the importance of the reservoir operation boundary conditions and the bottom substrate inside the fish passage for the upstream migration performance of multiple fish species.
Author Contributions
All authors listed have contributed substantially to the manuscript to be included as authors. Conceptualization, S.K.; methodology, S.K., I.A. and B.V.; formal analysis S.K., I.A. and B.V.; investigation, S.K. and B.V.; resources, S.K. and B.V.; writing—original draft preparation S.K., I.A. and B.V.; writing—review and editing, S.K., I.A. and B.V.; supervision, S.K., I.A. and B.V.; funding acquisition, S.K. All authors have read and agreed to the published version of the manuscript.
Funding
This research was funded by the Turkish Scientific and Technological Council of Turkey (TUBITAK), with grant numbers 214M518 and 315M019.
Acknowledgments
We thank the Incirli Hydropower Plant operator for helping us during the field study.
Conflicts of Interest
The authors declare no conflict of interest.
References
- Schmalz, M.; Thürmer, K. Long term investigations at the small hydropower plant Döbritschen/Germany. In Proceedings of the Hidro Energia Conference, Wrocław, Poland, 23–26 May 2012. [Google Scholar]
- Kucukali, S.; Hassinger, R. Flow and turbulence structure in a baffle–brush fish pass. PI Civ. Eng.-Water Manag. 2018, 171, 6–17. [Google Scholar] [CrossRef]
- Rahn, S. Hydraulische Untersuchung der Strömungsverhältnisse in Borstenfischpässen mit Dreifachriegeln. Master’s Thesis, University of Kassel, Kassel, Germany, 2011. [Google Scholar]
- Mogdans, J.; Bleckmann, H. How fish use and process flow information. In Proceedings of the Fish Passage Conference 2015, Groningen, The Netherlands, 22–24 June 2015. [Google Scholar]
- LUA (Landesumweltamt Brandenburg). Erhaltung von Habitaten der Kleinen Flussmuschel (Unio Crassus) im Biosphärenreservat Spreewald durch Einrichtung von Borstenanlagen. In Studien und Tagungsberichte, Schriftenreihe; University of Kassel: Kassel, Germany, 2007. [Google Scholar]
- Fischaufstiegsanlagen und Fischpassierbare Bauwerke—Gestaltung, Bemessung, Qualitätssicherung. In Merkblatt DWA-M 509; DWA (German Association for Water, Wastewater and Waste): Hennef, Germany, 2014.
- Environment Agency. Environment Agency Fish Pass Manual. Available online: http://cdn.environment-agency.gov.uk/geho0910btbp-e-e.pdf (accessed on 15 May 2022).
- Heimerl, S.; Hagmeyer, M.; Echteler, C. Numerical flow simulation of pool-type fishways: New ways with well-known tools. Hydrobiologia 2008, 609, 189–196. [Google Scholar] [CrossRef]
- Höger, V. Experimental study on flow patterns in vertical slot fishways. In Proceedings of the Fish Passage Conference 2015, Session D1, Groningen, The Netherlands, 22–24 June 2015. [Google Scholar]
- Fuentes-Pérez, J.; Sanz-Ronda, F.; de Azagra, A.; García-Vega, A. Non-uniform hydraulic behavior of pool-weir fishways: A tool to optimize its design and performance. Ecol. Eng. 2016, 86, 5–12. [Google Scholar] [CrossRef]
- Santos, J.; Silva, A.; Katopodis, C.; Pinheiro, P.; Pinheiro, A.; Bochechas, J.; Ferreira, M. Ecohydraulics of pool-type fishways: Getting past the barriers. Ecol. Eng. 2012, 48, 38–50. [Google Scholar] [CrossRef]
- Cassan, L.; Tien, T.; Courret, D.; Laurens, P.; Dartus, D. Hydraulic resistance of emergent macro roughness at large Froude numbers: Design of nature-like fishpasses. J. Hydraul. Eng. 2014, 140, 04014043. [Google Scholar] [CrossRef] [Green Version]
- Heimerl, S.; Hagmeyer, M.; Echteler, C. Dimensioning of fish passage structures with perturbation boulders. Hydrobiologia 2008, 609, 197–204. [Google Scholar] [CrossRef]
- Chanson, H.; Leng, X. Fish Swimming in Turbulent Flows; CRC Press: London, UK, 2021. [Google Scholar]
- Hassinger, R. Der Borstenfischpass—Fischaufstieg und Bootsabfahrt in einer Rinne. Wasserwirtschaft 2002, 92, 38–42. [Google Scholar]
- Kucukali, S.; Verep, B.; Alp, A.; Turan, D.; Mutlu, T.; Kaya, C.; Yildirim, Y.; Toreyin, B.U.; Ozelçi, D. Flow structure and fish passage performance of a brush-type fish way: A field study in the Iyidere River, Turkey. Mar. Freshw. Res. 2019, 70, 1619–1632. [Google Scholar] [CrossRef]
- Piquet, J. Turbulent Flows. Models and Physics; Springer: Berlin, Germany, 2010. [Google Scholar]
- Enders, E.C.; Castro-Santos, T.; Lacey, R.W.J. The effects of horizontally and vertically oriented baffles on flow structure and ascent performance of upstream-migrating fish. J. Ecohydraul. 2017, 2, 38–52. [Google Scholar] [CrossRef] [Green Version]
- Enders, E.C.; Boisclair, D.; Roy, A.G. A model of the total swimming costs in turbulent flow for Atlantic salmon (Salmo salar). Can. J. Fish. Aquat. Sci. 2005, 62, 1079–1089. [Google Scholar] [CrossRef] [Green Version]
- Silva, A.T.; Santos, J.M.; Ferreira, M.T.; Pinheiro, A.N.; Katopodis, C. Effects of water velocity and turbulence on the behaviour of Iberian barbell (Luciobarbus bocagei, Steindachner 1864) in an experimental pool-type fishway. River Res. Appl. 2011, 27, 360–373. [Google Scholar] [CrossRef]
- Gao, Z.; Anderson, H.I.; Dai, H.; Jiang, F.; Zhao, L. A new Eulerian–Lagrangian agent method to model fish paths in a vertical slot fishway. Ecol. Eng. 2016, 88, 217–225. [Google Scholar] [CrossRef] [Green Version]
- Schweizer, H. Implementation of the Swiss regulatory context from an operator perspective. In Proceedings of the IEA Hydro/EU Hydropower and Fish Workshop, Brussels, Belgium, 29–31 May 2017; IEA Hydropower: Paris, France, 2017. Available online: https://www.ieahydro.org/media/b5129d1f/3%20-%20Schweizer%20Hasliaare.pdf (accessed on 7 May 2019).
- Yagci, O. Hydraulic aspects of pool–weir fishways as ecologically friendly water structure. Ecol. Eng. 2010, 36, 36–46. [Google Scholar] [CrossRef]
- Kucukali, S. An experimental investigation of flow resistance and turbulent flow in brush fish pass. PI Civ. Eng.-Water Manag. 2019, 172, 241–256. [Google Scholar] [CrossRef]
- Kucukali, S.; Hassinger, R. Hydraulic model test results of baffle–brush fish pass. PI Civ. Eng.-Water Manag. 2015, 168, 189–194. [Google Scholar] [CrossRef]
- Wu, S.; Rajaratnam, N.; Katopodis, C. Structure of flow in vertical slot fishways. J. Hydraul. Eng. ASCE 1999, 125, 351–360. [Google Scholar] [CrossRef]
- Kucukali, S.; Cokgor, S. Boulder-flow interaction associated with self-aeration process. J. Hydraul. Res. 2008, 46, 415–419. [Google Scholar] [CrossRef]
- Nikora, V.; Cameron, S.; Albayrak, I.; Miler, O.; Nikora, N.; Siniscalchi, F.; Stewart, M.; O’Hare, M. Flow–biota interactions in aquatic systems: Scales, mechanisms, and challenges. In Environmental Fluid Mechanics: Memorial Volume in Honour of Professor Gerhard H. Jirka; IAHR Monographs, Rodi, W., Uhlmann, M., Eds.; CRC Press/Balkema: Oxford, UK, 2012; Chapter 11. [Google Scholar]
- Mosch, M. Functional check of the brushfish pass at the Okerwehr Rüningen. EIFAC working party. In Proceedings of the 2nd Meeting on Fish Passage Best Practices, Salzburg, Austria, 8–10 October 2007. [Google Scholar]
Figure 1.
Illustration of diagonal-type brush fish-pass arrangement adopted from DWA [6]. b = pool width, bG = alley width at bristle passes, bGb = free channel width at bristle passes, LG = length of the alley at bristle passes, and LLB = pool length.
Figure 1.
Illustration of diagonal-type brush fish-pass arrangement adopted from DWA [6]. b = pool width, bG = alley width at bristle passes, bGb = free channel width at bristle passes, LG = length of the alley at bristle passes, and LLB = pool length.

Figure 2.
The location of Incirli HPP in İyidere river basin and in Turkey. Adopted from Kucukali et al. [16].
Figure 2.
The location of Incirli HPP in İyidere river basin and in Turkey. Adopted from Kucukali et al. [16].

Figure 3.
S flow in diagonal brush fish pass at Incirli Small Hydropower Plant. Bristle clear height is 0.37 m. Young modulus of elasticity of bristles is E = 973 MPa.
Figure 3.
S flow in diagonal brush fish pass at Incirli Small Hydropower Plant. Bristle clear height is 0.37 m. Young modulus of elasticity of bristles is E = 973 MPa.

Figure 4.
Plan view of the diagonal brush fishway and the ADV velocity measurement points.

Figure 5.
Incirli Reservoir water surface elevation time series for May 2016. Temporal resolution is 15 min.
Figure 5.
Incirli Reservoir water surface elevation time series for May 2016. Temporal resolution is 15 min.

Figure 6.
Discharge rating curve of the Incirli brush fish pass.

Figure 7.
Average energy dissipation per unit mass versus Reynolds number [2].
Figure 7.
Average energy dissipation per unit mass versus Reynolds number [2].

Figure 8.
Friction factor versus relative submergence of bristles. The prototype data are compared with the brush-fish-pass physical model data from Kucukali [24].
Figure 8.
Friction factor versus relative submergence of bristles. The prototype data are compared with the brush-fish-pass physical model data from Kucukali [24].

Figure 9.
Velocity vectors in the vicinity of brush blocks, d/h = 0.92 for Q = 0.187 m3/s: (a) z/d = 0.60 and (b) z/d = 0.15.
Figure 9.
Velocity vectors in the vicinity of brush blocks, d/h = 0.92 for Q = 0.187 m3/s: (a) z/d = 0.60 and (b) z/d = 0.15.

Figure 10.
Distribution of turbulence intensities in three directions around brush blocks for d/h = 0.92 at z/d = 0.60 for Q = 0.187 m3/s: (a) TIx, (b) TIy, and (c) TIz.
Figure 10.
Distribution of turbulence intensities in three directions around brush blocks for d/h = 0.92 at z/d = 0.60 for Q = 0.187 m3/s: (a) TIx, (b) TIy, and (c) TIz.

Figure 11.
Distribution of the Reynolds shear stresses in the horizontal plane in the representative basin at z/d = 0.60 for Q = 0.187 m3/s: (a) τxy and (b) τxz.
Figure 11.
Distribution of the Reynolds shear stresses in the horizontal plane in the representative basin at z/d = 0.60 for Q = 0.187 m3/s: (a) τxy and (b) τxz.

Figure 12.
Distribution of TKE in vertical section E for (a) Q = 0.187 m3/s and d/h = 0.92, and (b) Q = 0.264 m3/s and d/h = 1.08.
Figure 12.
Distribution of TKE in vertical section E for (a) Q = 0.187 m3/s and d/h = 0.92, and (b) Q = 0.264 m3/s and d/h = 1.08.

Figure 13.
Spatial distribution of temporal average velocity vectors (Vyz) in vertical section E. (a) Q = 0.187 m3/s and d/h = 0.92, (b) Q = 0.264 m3/s and d/h = 1.08.
Figure 13.
Spatial distribution of temporal average velocity vectors (Vyz) in vertical section E. (a) Q = 0.187 m3/s and d/h = 0.92, (b) Q = 0.264 m3/s and d/h = 1.08.

Figure 14.
Video frames, with a time frame of 0.01 s, inside the brush fish passage showing the upstream migration of Alburnoides fasciatus individuals. (a) t0 = 7:71 s, no fish is seen in the flow field; (b) t1 = 7:72 s, first individual pass; (c) t2 = 7:73 s, following of other individuals; (d) t4 = 7:74 s fish schooling.

Figure 15.
Velocity field in the diagonal-brush fish pass in the physical model. Discharge = 0.4 m3/s, channel width = 2 m, and bed slope = 4%. Adapted from Rahn [3].
Figure 15.
Velocity field in the diagonal-brush fish pass in the physical model. Discharge = 0.4 m3/s, channel width = 2 m, and bed slope = 4%. Adapted from Rahn [3].

Disclaimer/Publisher’s Note: The statements, opinions and data contained in all publications are solely those of the individual author(s) and contributor(s) and not of MDPI and/or the editor(s). MDPI and/or the editor(s) disclaim responsibility for any injury to people or property resulting from any ideas, methods, instructions or products referred to in the content. |
© 2022 by the authors. Licensee MDPI, Basel, Switzerland. This article is an open access article distributed under the terms and conditions of the Creative Commons Attribution (CC BY) license (https://creativecommons.org/licenses/by/4.0/).
Share and Cite
MDPI and ACS Style
Kucukali, S.; Verep, B.; Albayrak, I. Hydrodynamic Characteristics of Diagonal Brush Fish Pass: Prototype Measurements. Water 2023, 15, 88. https://doi.org/10.3390/w15010088
AMA Style
Kucukali S, Verep B, Albayrak I. Hydrodynamic Characteristics of Diagonal Brush Fish Pass: Prototype Measurements. Water. 2023; 15(1):88. https://doi.org/10.3390/w15010088
Chicago/Turabian StyleKucukali, Serhat, Bulent Verep, and Ismail Albayrak. 2023. "Hydrodynamic Characteristics of Diagonal Brush Fish Pass: Prototype Measurements" Water 15, no. 1: 88. https://doi.org/10.3390/w15010088
Note that from the first issue of 2016, this journal uses article numbers instead of page numbers. See further details here.