Article

Evaluation by Means of Electrochemical Impedance Spectroscopy of the Transport of Phosphate Ions through a Heterogeneous Anion-Exchange Membrane at Different pH and Electrolyte Concentration

by
Eduardo Henrique Rotta
1,2,
Manuel César Martí-Calatayud
2,
Valentín Pérez-Herranz
2 and
Andréa Moura Bernardes
1,*
1
Laboratório de Corrosão, Proteção e Reciclagem de Materiais, Programa de Pós-Graduação em Engenharia de Minas, Metalúrgica e de Materiais, Universidade Federal do Rio Grande do Sul, Av. Bento Gonçalves, 9500, Porto Alegre 91509-900, Rio Grande do Sul, Brazil
2
Ingeniería Electroquímica y Corrosión, Instituto Universitario de Seguridad Industrial, Radiofísica y Medioambiental, Universitat Politècnica de València, Camí de Vera s/n, 46022 Valencia, Spain
*
Author to whom correspondence should be addressed.
Water 2023, 15(1), 9; https://doi.org/10.3390/w15010009
Submission received: 31 October 2022 / Revised: 16 December 2022 / Accepted: 18 December 2022 / Published: 21 December 2022
(This article belongs to the Special Issue Innovative Membrane Processes for Drinking and Wastewater Treatment)

Abstract

:
Electrodialysis is an innovative technique to reclaim phosphates from municipal wastewater. However, chemical reactions accompany the transport of these ions through ion-exchange membranes. The present study investigates the dependence of these phenomena on the initial pH and concentration of the phosphate-containing solution using a heterogeneous anion-exchange membrane. Linear sweep voltammetry, electrochemical impedance spectroscopy, and chronopotentiometry experiments were conducted for different phosphate-containing systems. For the most diluted solution, two limiting current densities (ilim) have been observed for pH 5 and 7.2, while only one ilim for pH 10, and correlated with the appearance of Gerischer arcs in EIS spectra. For pH 7.2, sub-arcs of Gerischer impedance were separated by a loop, indicating the involvement of the membrane functional groups. Increasing the phosphate concentration changed the system’s characteristics, reporting a single ilim. In the EIS spectra, the absence of Gerischer elements determined the attenuation of chemical reactions, followed by the development of a diffusion boundary layer, as indicated by the finite-length Warburg arcs. Chronopotentiometry clarified the mass transport mechanism responsible for distorting the diffusion boundary layer thickness at lower concentrations. The obtained results are expected to contribute to the phosphates recovery using electrodialysis in the most varied conditions of pH and concentration available in the environment.

1. Introduction

Phosphorus (P) is a vital and irreplaceable nutrient for modern agriculture [1,2]. Higher quantities of fertilizers must be obtained to meet the increasing demand for food, leading to crescent phosphate rock mining [3]. Regarding its availability, the European Commission has considered phosphate rock and phosphorus as critical raw materials since 2014 and 2017, respectively, warning about their imminent scarcity [4]. In contrast, low concentrations of phosphate (<10 mg L−1) [5], which can be frequently measured in industrial, agricultural, and municipal wastewater, are enough to unleash a severe water degradation process called eutrophication. In this context, wastewater streams emerge as alternative sources of phosphate, with their recovery being mandatory within a context of sustainable development to guarantee food safety and water quality [5,6].
Conventional wastewater treatment processes are primarily designed to remove phosphates as waste sludge [7]. However, sludge management is complex and onerous since phosphates can be released into the environment [8]. In addition to not contributing to the phosphate scarcity problem, conventional treatment techniques are often insufficient to meet the legal standards of nutrient discharge, even when the phosphate concentration in the wastewater is low [9]. In this regard, electrodialysis emerges as an innovative technology to treat wastewater and recover phosphates. In electrodialysis, the phosphate ions present in a solution are selectively transported through ion-exchange membranes by applying an electric field [10,11]. The phosphorus can be removed from wastewater and recovered in concentrated solutions, as already demonstrated in previous studies [12,13,14]. However, since phosphates form weak electrolytes, some peculiarities in the transport of these ions have been reported, such as protonation–deprotonation reactions, shown in Equations (1)–(3). The progress of such reactions can be accelerated by the Donnan exclusion effect prevailing in the membrane matrix [12,15].
H 3 PO 4 H 2 PO 4 + H + ;   pK a 1 = 2.16 .
H 2 PO 4 HPO 4 2 + H + ;   pK a 2 = 7.21 .
HPO 4 2 PO 4 3 + H + ;   pK a 3 = 12.34 .
Understanding the influence of these reactions on phosphate ion transport through anion-exchange membranes is of considerable interest for the successful implementation of phosphate recovery by electrodialysis. In this context, linear sweep voltammetry, chronopotentiometry, and electrochemical impedance spectroscopy (EIS) are valuable and complementary techniques to study these phenomena [16]. Linear sweep voltammetry is helpful in obtaining the system’s polarization curve and determining the system’s limiting current density. Through chronopotentiometry and electrochemical impedance spectroscopy, it is possible to evaluate the current-voltage and the impedance response of a system, respectively. Thus, it is attainable to define the primary transport mechanism and the presence of chemical reactions [16].
Important information has already been reported in the literature [17,18,19,20] in studies conducted with homogeneous anion-exchange membranes in contact with a 0.02 M monosodium phosphate solution (pH ≈ 5) [15]. The authors described the reported polarization curve with two limiting states, which may be a characteristic behavior in ampholyte solutions. According to them, the first limiting state may be linked to the concentration decrease of the leading current carriers (H2PO4) at the membrane/diluted solution interface, similar to the response observed with strong electrolytes [17]. Further increments in current above the limiting value are possible due to the presence of H+ ions in the depleted solution, generated through deprotonation reactions of single charged species into HPO42− ions (Equation (2)). In turn, when the main ionic species inside the membrane is HPO42− and a successive deprotonation reaction (to PO43−) is not achievable due to the low values of internal pH and potential drop recorded (Equation (3)), a second limiting state takes place [19]. From the analysis of EIS spectra at overlimiting current density conditions, the authors identified a high-frequency arc, a low-frequency Warburg arc, and a Gerischer arc, which may be formed by the combination of two sub-arcs according to the occurring chemical reactions [15].
Scaling up a phosphate recovery process employing homogenous membranes can be onerous, with heterogeneous membranes being widely employed commercially [21]. Furthermore, it must be considered that wastewater streams may present a variable composition in pH and phosphates concentration, which can result in transport singularities in each condition. Considering the lack of information in this regard, the objective of this study is to evaluate the influence of pH and concentration in the transport of phosphate ions across a heterogeneous membrane at under- and overlimiting current density conditions. To this end, the system’s current voltage and impedance responses were analyzed for three different pH values (between pKa1 and pKa3) and concentrations. Dependences on the initial pH and concentration value were detected in the polarization curves. The number of limiting current densities depended on the main phosphate species available, with the double-charged species acting as a strong electrolyte. In the EIS spectra, Gerischer arcs stated the occurrence of chemical reactions in the membrane/solution system. The appearance of two sub-arcs of Gerischer impedance divided by a loop was explained for the first time for a phosphate-containing solution. Moreover, differences in the pattern of the Warburg impedances at low frequencies were linked to chronopotentiometry results. Based on this, it was possible to determine the dominant mass transport mechanism at overlimiting current density conditions responsible for the disruption of the boundary layer thickness. It is expected that these results can help to elucidate the transport peculiarities that may occur. Therefore, it may contribute to electrodialysis systems’ application to recover phosphates from municipal wastewater.

2. Materials and Methods

2.1. Membranes, Reagents, and Solutions

A commercial anion-exchange membrane (IONSEP-HC-A, supplied by Hidrodex®, Cotia, São Paulo, Brazil) was used throughout this study. The heterogeneous structure of the membrane is composed of quaternary amine groups (-NR3+) attached to a polyethylene polymeric matrix, which is reinforced at both sides with nylon meshes to improve the mechanical strength of the membrane [22]. An auxiliary cation-exchange membrane (IONSEP-HC-C, also supplied by Hidrodex®, Cotia, São Paulo) was used to prevent interferences from the cathode reactions in measuring the voltage drop across the anion-exchange membrane. This membrane has a similar mechanical structure to the IONSEP-HC-A membrane, with sulfonic acid groups fixed in its polymer backbone. Both membranes present an ion exchange capacity ≥ 2.0 mol kg−1, an ionic permselectivity ≥ 92%, a thickness of approximately 0.42 mm, and a water content lower than 40%. Before their usage, both ion-exchange membranes were equilibrated in the feeding solution for at least 24 h.
The working solutions were prepared based on the composition of a phosphate-concentrated solution resulting from the treatment of a municipal wastewater by electrodialysis [23], with a final phosphate concentration of 0.001 M. The solutions were prepared in deionized and distilled water by dissolving analytical-grade phosphate-containing salts (NaH2PO4·H2O, Na2HPO4, and Na3PO4). The measurements were conducted at pH values of approximately 5, 7.2, and 10, represented by the vertical lines in the speciation diagram shown in Figure 1. Using different pH values made it possible to investigate the influence of pH variation of the bulk solution and the impact of each phosphate species on ionic transport. At pH ≈ 5, around 99.2% of the phosphate ions are available in the single-charged species (H2PO4), while at pH ≈ 10, approximately 99.4% of phosphate species are double-charged (HPO42−). At pH ≈ pKa2 ≈ 7.2, both H2PO4 and HPO42− are equally proportioned in the solution. Additionally, experiments with 0.01 M and 0.1 M phosphate concentrations were conducted at the neutral pH value (pH 7.2). Information regarding the conductivity of the solutions employed is disclosed in Table 1.

2.2. Electrochemical Measurements

The experimental procedure applied was similar to the one employed by Martí-Calatayud et al. [16]. All the measurements were carried out using a cylindrical cell with three compartments. Each compartment was filled with around 130 mL of the feeding solution and separated by the anion- and cation-exchange membranes, with 3.14 cm2 and 12.57 cm2 of effective area, respectively. The reduced effective area of the anion-exchange membrane leads to reduced ionic flux values, ensuring that the working solution does not present significant variations in its composition. On the other side, a higher effective area in the cation-exchange membrane may suppress the influence that possible chemical reactions in this membrane exert on the system, in addition to isolating the cathode reactions.
The potential value of the anion-exchange membrane was monitored. It was done by two Ag/AgCl reference electrodes immersed in Luggin capillaries and placed at each side of the studied membrane. Two graphite electrodes arranged at the edges of the cell were used as anode and cathode. The measurements were conducted at room temperature with a Metrohm Autolab PGSTAT302N potentiostat/galvanostat using the Nova 1.11.2 software (Metrohm Autolab, Utrecht, The Netherlands).
Linear sweep voltammetry measurements were carried out at a scan rate of 2 mV s−1, starting from 0 V and reaching at least 2 V. The relationship between the current density value (i) and the membrane potential (Um) was obtained, and the distinct regions of a polarization curve were identified [24]. EIS experiments were then conducted at potential values representative of each region of the polarization curve. First, the average pre-established bias potential value was applied for the time needed to reach a steady state (usually less than 600 s). Then, a sinusoidal potential perturbation with an amplitude of 20 mV was summed to the average signal. The impedance was measured at approximately 50 values of frequencies distributed in a range between 10 kHz to 2.5 mHz. At least two integration cycles were performed for each frequency value, with a total experimental time of about 2.5 h. The results were graphically represented in Nyquist and Bode plots.
Additionally, chronopotentiometry curves were recorded at overlimiting current density conditions. While monitoring the potential value of the membrane, the current density value was imposed for 300 s, with a subsequent relaxation period of 100 s before applying another value of current density. Each chronopotentiometry curve was displayed relating Um (V) versus the experimental time (s).
All experiments were conducted at least in duplicate. The results reported in the subsequent section represent the studied systems with accuracy and are reliable with the repetitions performed.

3. Results

3.1. Polarization Curves Results

The polarization curves are essential in the analysis of the current–voltage response of an electrolyte-membrane system. Their different regions delimitate significant mass transfer and electrochemistry-related events. A conventional polarization curve obtained with a strong electrolyte can be divided into three well-defined regions [24,25]: (i) at low currents exists a linear relationship between i and Um, showcasing a quasi-ohmic behavior; (ii) then a limiting state is reached, where a notorious increase in the Um values (with the formation of a plateau) attest the escalation of concentration polarization; and (iii) at higher bias, a new increment in the supply of current carriers towards the membrane/solution interface is facilitated by overlimiting mass transfer mechanisms, such as the dissociation of water and electroconvection. For ampholytes, such as phosphate and organic acids, two limiting states in the polarization curve may be reported [12,16,26], and consequently, two limiting current density values can be measured.
The polarization curves for the studied membrane in contact with the different solutions evaluated in this work are shown in Figure 2 and Figure 3. In Figure 2, corresponding to a phosphate concentration of 0.001 M, it can be noted that two limiting states were recorded for pH 5 and 7.2, with an ilim,1 value of approximately 0.09 mA cm−2 and 0.18 mA cm−2, respectively. In contrast, the ilim,2 value rounded 0.22 mA cm−2 for both pH conditions. For pH 10, a different type of polarization curve was registered, similar to that obtained for strong electrolytes, with a single limiting current density of approximately 0.23 mA cm−2. In addition to pH, increasing the phosphate concentration also changed the limiting states reported in the polarization curves, as shown in Figure 3. For the solution with 0.01 M of phosphates (pH 7.2), two limiting current density values were also recorded (ilim,1 of about 0.94 mA cm−2 and ilim,2 of 1.85 mA cm−2). For the solution with 0.1 M of HxPO43−x ions, only one value of ilim (around 16.84 mA cm−2) was obtained.
The different behavior observed for each system may be associated with ion composition variations in the membrane and near the membrane/solution interface as the membrane voltage increases along the polarization curves [15]. The first limiting state (corresponding to the ilim,1 value) is similar to the one reported with strong electrolytes. It is generally linked to the concentration decrease of the leading current carriers at the membrane/diluted solution interface [17]. For pH 5 and 10, it can be referred to the depletion of H2PO4 and HPO42− ions, respectively, considering their major predominance in the solution. For pH 7.2, even though the single and double-charged phosphate species are available in similar proportions, it can be suggested that the H2PO4 ions are preferably transported across the anion-exchange membrane. These ions present a higher diffusion coefficient (0.959 × 10⁻⁵ cm2 s−1) than the HPO42− ions (0.759 × 10⁻⁵ cm2 s−1) [27], approximating the format of the polarization curve with the one obtained for pH 5.
After the ilim,1, a limiting state is reported by the scarcity of charge carriers near the diluted diffusion boundary layer, represented by a plateau in the Um values. A relatively short plateau was recorded for pH 5 and 7.2 (at both 0.001 and 0.010 M), with a new increment in the current density values until reaching a second limiting state (ilim,2). The increase in current density between ilim,1 and ilim,2 is associated with deprotonation reactions of phosphate species (Equations (1)–(3)) [15]. These reactions can be caused by the alkalization of the internal membrane solution due to the Donnan exclusion of co-ions (H+) from the membrane matrix at high levels of polarization [12]. In this region of currents, the phosphate ions are partially deprotonated when passing through the diffusion boundary layer and membrane section, releasing H+ ions toward the anode. Protons act as additional current carriers in the depleted solution near the membrane. This may lead to a supplementary attraction of phosphate ions to that region in a phenomenon known as the exaltation effect [28,29].
The pattern of the polarization curve between the two plateaus depended on the phosphate species availability. For pH 5, with the single charged species (H2PO4) representing almost the totality of initial current carriers, a more prolonged second quasi-ohmic region was reported, with a higher slope than the same region of the polarization curve for pH 7.2. This behavior can be related to the quantity of H2PO4 ions available in the membrane and solution interfaces. When the membrane contains more H2PO4 ions (conditions at pH 5), more H+ ions can be released to the depleted solution compared to the system at pH 7.2. In addition, it can be noted that the slope of the second quasi-ohmic region for pH 5 is similar to that reported for pH 7.2 between zero and the ilim,1 value. The change of slope observed for pH 5 below ilim,1 and between ilim,1 and ilim,2 coincides with the evolution of the primary charge carrier from H2PO4 to the doubly charged species, HPO42−. The latter presents significantly higher ion conductivity [30]—the molar conductivity of H2PO4 ion is 36 S cm2 mol−1, while that of HPO42− is 114 S cm2 mol−1 [27]. The H+ ions generated by deprotonation reactions and made available to the diffusion boundary layer also reduce the system resistance, reflected in higher slopes.
The second limiting state noted at pH 5 and 7.2 occurs when all H2PO4 ions in the membrane have been converted, and the membrane fixed charges become saturated in HPO42− ions. At this stage, this species is the main one inside the membrane. According to Rybalkina et al. [19] and Pismenskaya et al. [15], a subsequent transformation reaction to PO43− (Equation (3)) presents a relatively low kinetic rate. It is not achievable until a specific high value of potential and internal pH are met. Consequently, the likelihood of the membrane system releasing more H+ ions has reached a limit. Due to this, a prolongation of the second plateau after the ilim,2 was noted, and new considerable increments of current density were only obtained after reaching a potential value higher than 0.80 V for 0.001 M and 1.75 V to 0.010 M. At this range of high voltage values, overlimiting mass transfer mechanisms are responsible for the new current density increase above ilim,2 [15]. It will be confirmed in the following sections.
In line with the above-explained phenomenon, the low rate of deprotonation of HPO42− may approximate this phosphate species to a strong electrolyte. This fact would also agree with the occurrence of only one limiting state in the polarization curve obtained for pH 10, since HPO42− ions are the leading current carriers. A new increase in the current density was only accepted at values of potential ≥ 0.80 V, similar to the other pH conditions. For the case of the solution at neutral pH and 0.100 M HxPO43−x, the high ionic concentration at the membrane/solution interface may weaken the Donnan exclusion effect [31]. Consequently, it decreases the rate of the deprotonation reaction of the H2PO4 fraction in the system.

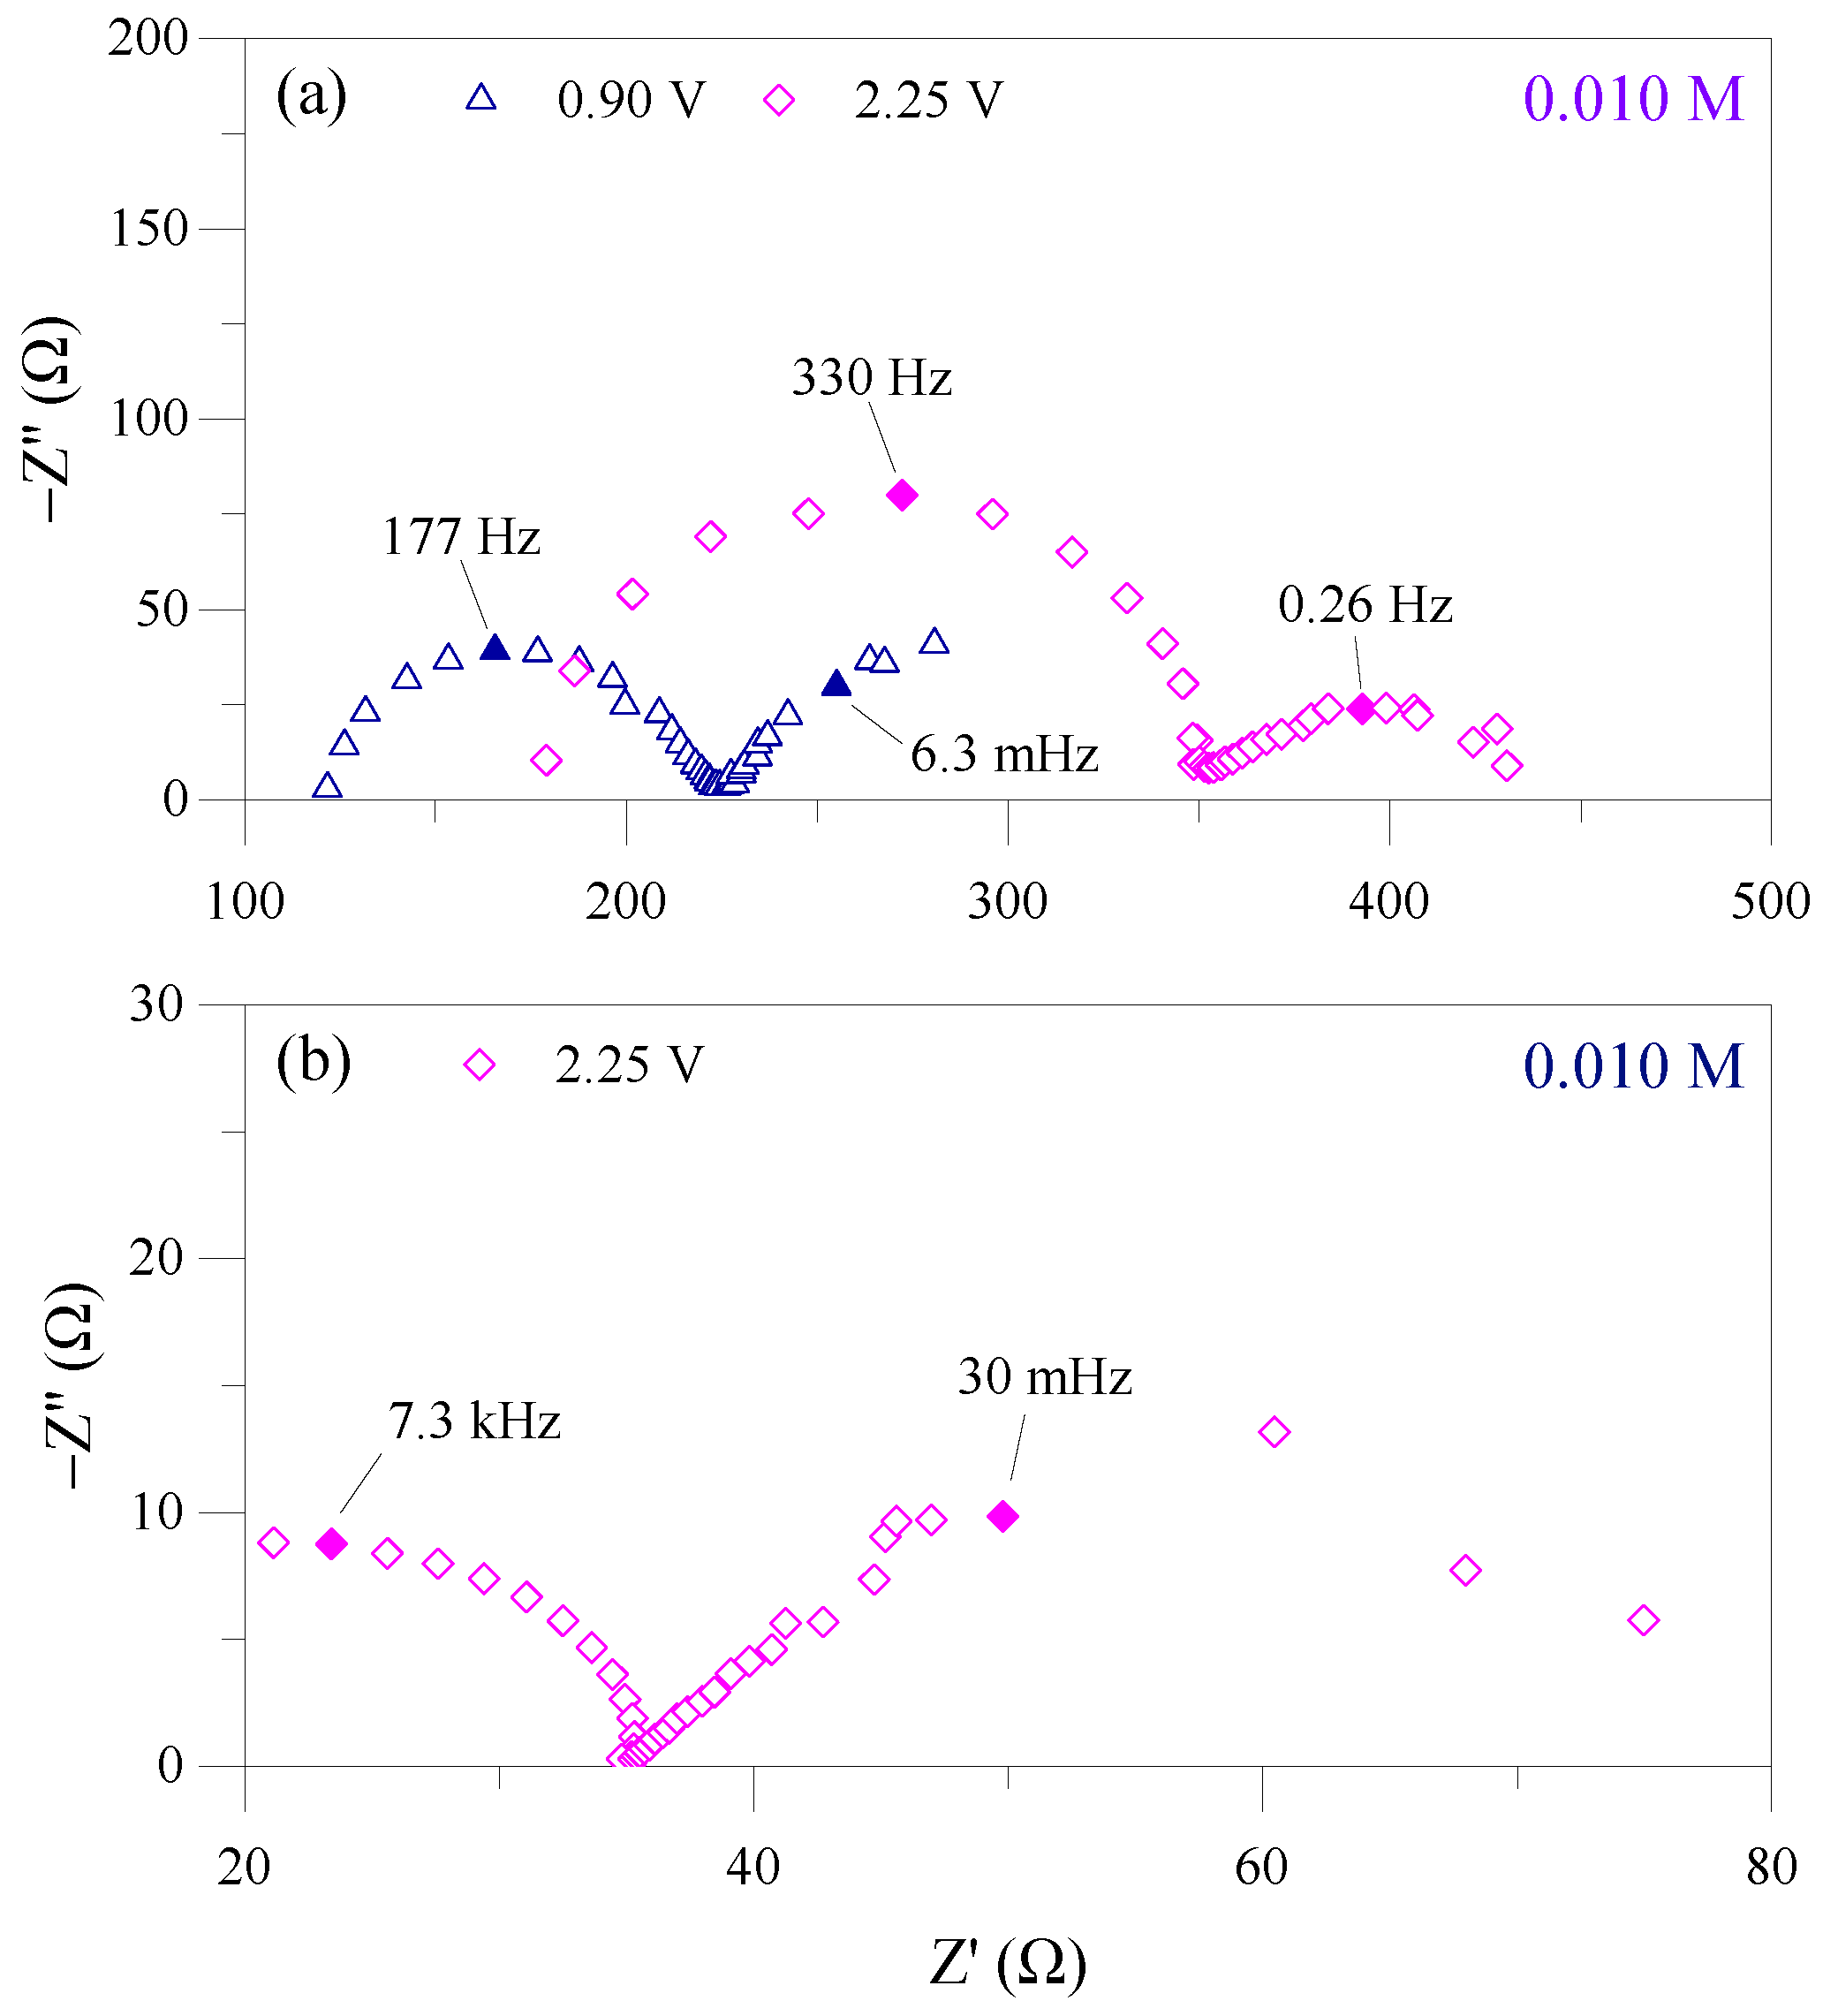
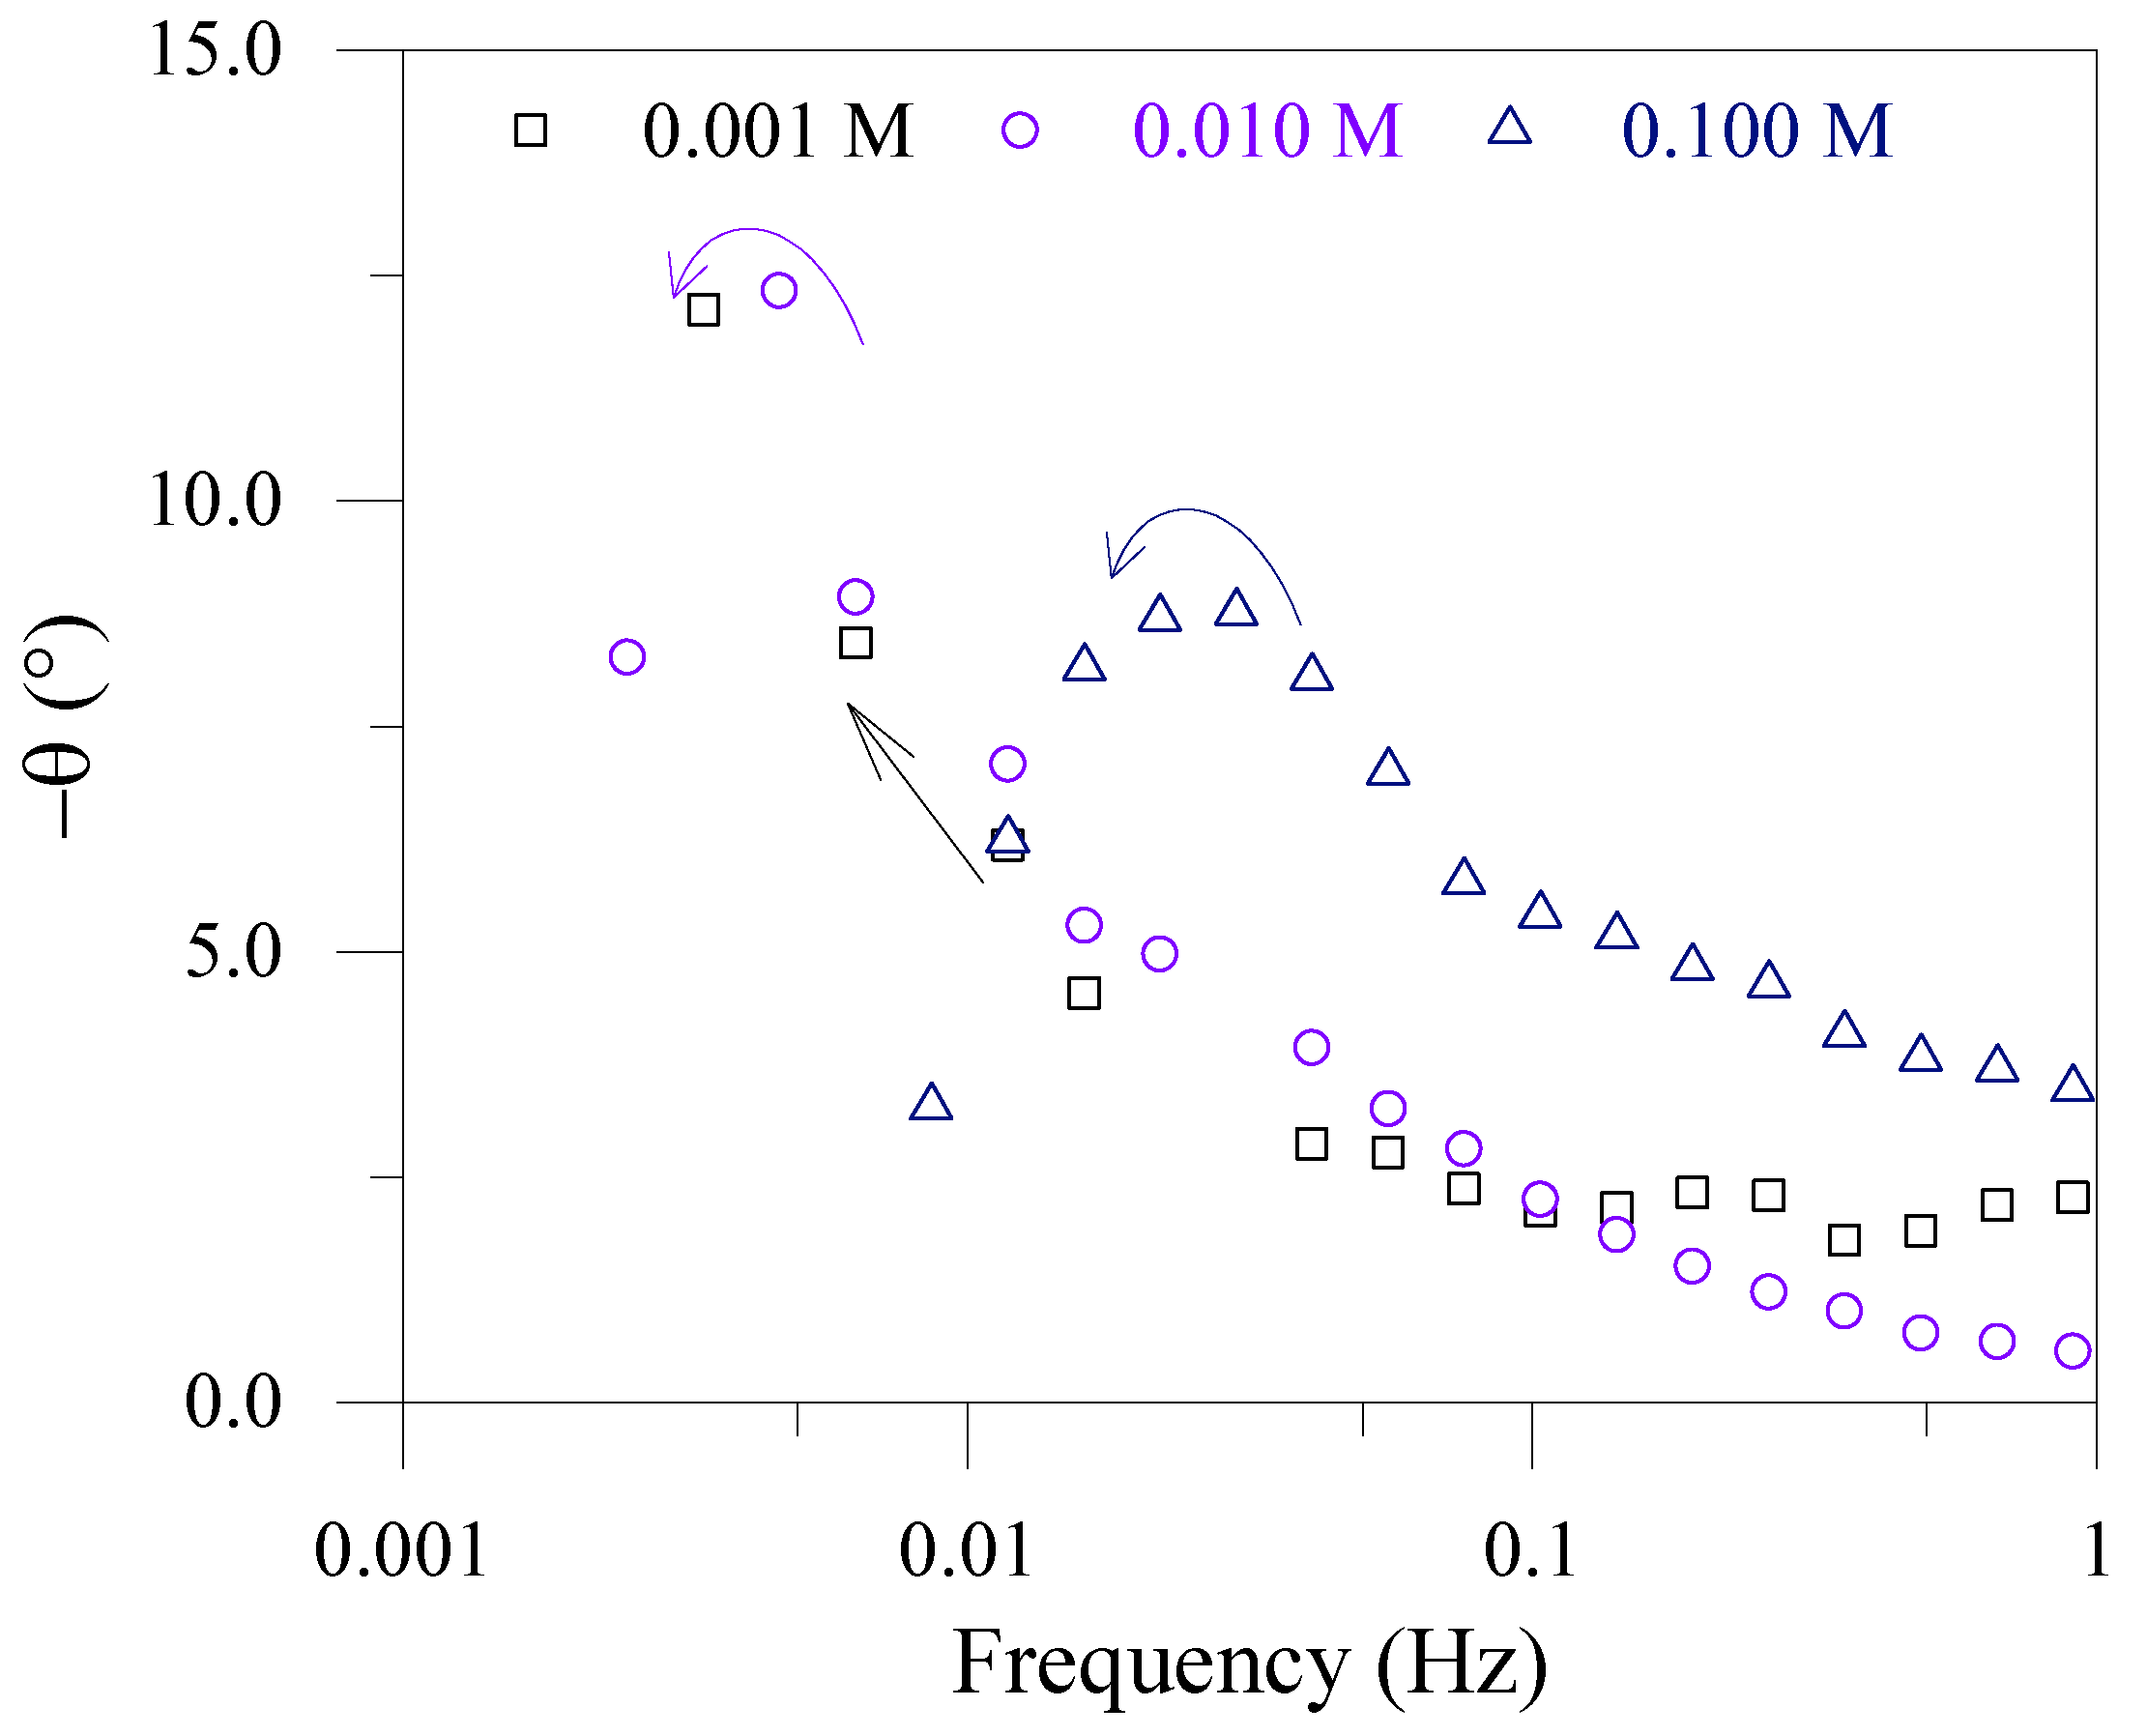
3.2. Electrochemical Impedance Spectroscopy Response

The interpretation of EIS spectra is crucial to elucidate the involved alterations at the membrane/solution region. Additionally, it may be helpful to confirm the hypothesis raised to explain the different regions obtained in the polarization curves. An ion-exchange membrane system commonly presents at least two arcs in a Nyquist plot type [32,33,34]. The first arc occurs at high-frequency values (105–103 Hz), and is associated with the geometric capacitance and ohmic resistances of the membrane and its adjoining regions, the bulk solution, and the Luggin capillaries [35]. The diameter of this semi-circle corresponds to the ohmic resistance of the evaluated membrane system. The second one is a Warburg-type arc with a finite length associated with the transport of ions by diffusional mechanisms [36,37]. It is characterized by an initial 45° slope in the Nyquist plots, which usually tend towards a semi-circle in the lower frequency region. The length of the diffusion boundary layer (LDBL) can be estimated from the characteristic frequency of the Warburg arc ( f W ) using Equation (4), given the fact that the diffusion coefficient of the salt (D) is known [38,39].
L D B L = 2.53 × D 2 × π × f W
A third arc of Gerischer impedance can also be seen at intermediate frequency values (103–101 Hz). It usually occurs when chemical reactions add additional ions to the membrane/solution interface [40]. As already mentioned in the Introduction section, in specific systems, this arc can be divided into two sub-arcs: the one reported at higher frequencies associated with the dissociation of water, and the other at lower frequencies, linked to slower homogeneous reactions taking place in the electrolyte [15]. Some researchers also used the Gerischer characteristic frequency (fG) to calculate the effective rate of these reactions [41].
As mentioned in Section 3.1, the polarization curves presented distinct regions depending on the deprotonation reactions of phosphate species taking place in each system. Water dissociation reactions were also detected, especially at current density conditions above the ilim,2 value. Considering these phenomena are intrinsically related to the electric field imposed on the system, impedance spectra were obtained for all solution conditions for at least one representative potential value of each polarization curve region. The scale of the real part (Z′) and the imaginary part (−Z″) of the impedance axis was adjusted to allow better visualization of each Nyquist plot.
The impedance spectra obtained in the i ≤ ilim,1 region for the 0.001 M HxPO43−x solution at pH 5, 7.2, and 10 are shown in Figure 4. For pH 5 and 7.2, respectively, in Figure 4a,b, the geometric arc was not registered at high frequencies (>1 kHz) in the Nyquist plots. In addition, for these pH conditions, the x-axis intersection occurred at quite large values of Z′ for the range of applied electric fields. This fact reveals that the initial ohmic resistance of the experimental system (Luggin capillaries, membrane/solution interface, and the bulk solution itself) is very high [35,37], which is linked to the diluted character of the solution and to a low availability of ions in the diffusion boundary layer. With the increase of the pH value to 10, the conductivity of the solution increased. This behavior is associated with the larger HPO42− availability in the solution and the significative presence of OH ions (approximately 0.1 mM), which reduces ohmic resistance contributions. Under these pH conditions, the high-frequency geometric arc was visible in the spectrum (Figure 4c).
At underlimiting conditions (i < ilim,1 region), the Warburg-type impedance in the low-frequency domain showed a distribution corresponding to a semi-infinite diffusion for all pH conditions [42]. For porous electrodes, this is related to the inability of charge carriers to completely penetrate the material layer, making it difficult to obtain a fully developed system response over the entire probed surface at low-frequency signals [43]. However, for ion-exchange membranes, it was reported in numerical simulations conducted by Femmer et al. [38] that the Warburg-type impedance presented a closing semi-circle behavior for all thickness variations of a membrane surface modification. A Warburg arc with finite length was also obtained by Pismenskaya et al. [15] and Martí-Calatayud et al. [16], who evaluated the transport of weak electrolytes at concentrations higher than 0.02 M across homogeneous and heterogenous anion-exchange membranes, respectively. In the context of the obtained experimental results with a more diluted solution, it can be suggested that the concentration gradients are still under development across the diffusion boundary layers, with their length not yet completely defined.
When an electric field equivalent to the ilim,1 was imposed, the ohmic resistance of the membrane system increased. This increase was an expected response for all pH conditions and is associated with concentration polarization occurring near the membrane surface at ilim,1. In other words, a decrease of the ion concentration to values close to 0 next to the depleting membrane surface. For pH 10, the overall distribution of the data was quite similar to the obtained at underlimiting conditions. The more pronounced Warburg-type impedances are linked to an intensification of the concentration gradients [37]. At pH 5 (Figure 4a), Gerischer semi-circles begin to be noted at intermediate frequencies, precisely 1.23 Hz, for an applied potential value of 0.15 V, indicating the presence of chemical reactions near the membrane surface [40].
For the pH 7.2 solution, two different sub-arcs can be seen at mid-frequencies for the potential value of 0.30 V, as presented in Figure 4b. The first sub-arc has a characteristic frequency value of approximately 612 Hz, and is frequently associated with water dissociation reactions with the participation of the membrane fixed charges and water molecules in the membrane/solution interface [41]. Moreover, the same Gerischer element is presented for solutions containing strong electrolytes or ampholytes with low deprotonation rates. It is important to note that the obtained value of characteristic frequency (around 612 Hz) is close to that reported by Pismenskaya et al. [15] for a 0.02 M KHT solution at overlimiting conditions. However, it is significantly lower than the obtained by the authors for the 0.02 M KH2PO4 solution (between 1200–2200 Hz). The distinct nature of the ion-exchange membranes can explain this difference. In the case of the heterogeneous membrane used in the current study, the presence of non-conductive areas may deviate the current lines, facilitating the formation of vortices which may decrease the rate of water dissociation reactions [44].
In turn, the Gerischer sub-arc reported at lower frequencies in Figure 4b, around 0.5 Hz, is generally linked to protolysis reactions of phosphate species in the membrane [16]. These reactions may present a lower rate than water splitting and are thus reported at lower frequencies. Moreover, the dissociation reactions of phosphate species occur together with a diffusive process, where phosphates pass through the membrane, losing a proton due to the Donnan exclusion principle, bringing this process closer to the Warburg’s domain at low frequencies.
Additionally, a loop between the two sub-arcs at intermediate frequencies was observed for pH 7.2 (still in Figure 4b). Similar behavior was reported by Rybalkina et al. [45] at a current density value 60% higher than the limiting one for an ammonium-containing solution. However, no detailed information was given. The presence of elements at intermediate frequencies of Nyquist plots has been reported in corrosion [46], solar cells [47,48], and Lithium-ion batteries [49] studies, and they are frequently associated with instabilities on the material surface. Therefore, the loop observed in Figure 4b can be related to the formation of additional charge carriers in the diffusion boundary layer by chemical reactions, probably involving a partial transformation of the functional groups of the anion-exchange membrane (-NR3+) [50].
The EIS spectra for potential values above the ilim,1 value are presented in Figure 5. Since two limiting states were observed for pH 5 and pH 7.2 solutions, bias potentials comprehending the region between ilim,1 and ilim,2 were applied. For pH 5 (Figure 5a), a Gerischer semi-circle with a characteristic frequency of around 10.9 Hz is noted at 0.40 V. This value is almost one order of magnitude higher than the one previously reported for 0.15 V (ilim,1). This pattern indicates an acceleration of the chemical reactions (mainly the deprotonation of phosphate species) taking place in the diffusion boundary layer with the increase of the bias potential [41]. The H+ ions generated by these reactions, acting as new current carriers, may distort the thickness of the diffusion boundary layer, as indicated by the dispersed distribution of the Warburg-type impedances. For pH 7.2, two Gerischer sub-arcs were again observed at approximately 612 Hz and 37.6 Hz as characteristic frequencies, without a loop in-between. Diffusive contributions are still significant even with the generation of new charge carriers. The distortion of the concentration profiles in the diffusion boundary layer can be seen by the propagation of the semi-infinite Warburg-type impedances.
When the imposed electric field was increased to potentials corresponding to the second plateau region, in general, large impedances were noted. At potential values comprehending the ilim,2 value, for both pH 5 (0.55 V, Figure 5a) and pH 7.2 (0.50 V, Figure 5b), the Gerischer semi-circles merge into an arc with a characteristic frequency of about 37.5 Hz. For the pH 10 solution, with an imposed electric field right above the ilim,1 (0.40 V, Figure 5c), the development of Gerischer impedances, not observed for this pH at lower potentials, can be seen here. The generation of H+ and OH ions, for pH 10, may be associated with the catalytic activity towards water splitting of tertiary amine groups present in the membrane [44]. The shape of the Warburg-type impedances was similar to the one observed at lower potential values, but with a larger size due to the intensified polarization.
At potential values above the ilim,2 (1.5 V in Figure 5b,c), the magnitude of the Gerischer arc was considerably expanded. In fact, the Gerischer arc encompasses other semi-circles and turns out to be the primary system resistance. According to Martí-Calatayud et al. [16], the diffusive limitations can be overcome by the new current carriers generated in homogeneous chemical reactions [16]. This phenomenon may help to understand the reduced percent extraction of phosphate ions at intense electric fields seen in a previous study [12]. An exception is made for the result obtained at 1.50 V for pH 5, where it can be noted a downsizing of the major semi-circle in comparison with 0.55 V. This can be associated with an increase in the conductivity value of the membrane, also reported by Sarapulova et al. [30] for homogeneous membranes in contact with ampholyte compounds at concentration values lower than 0.05 M. A similar effect is the increase in the slope noted after ilim,1 in the polarization curve. As already mentioned, at i > ilim,2 the internal solution of the membrane may be filled with doubly charged species (HPO42−), which have a higher conductivity. Furthermore, the overall resistance of the system including membrane, solution and diffusion boundary layer can be affected by the overlimiting transport mechanism observed from certain threshold values of potential [20].
The impedance spectra were also affected by the variation in phosphate concentration, as can be seen in Figure 6 and Figure 7. At potential values corresponding to the i < ilim,1, it can be noted in Figure 6a,b that the increase in the phosphate concentration implies a decrease of the initial ohmic resistance compared to the most diluted solution. Increasing the phosphate concentration also affected the low-frequency arcs, with their pattern leaning towards a finite-length Warburg arc [42]. Upon reaching the first plateau region, applying potential values of 0.30 V and 0.95 V (Figure 6a,b, respectively), the diameter of this Warburg semi-circle presented a significant increase, emphasizing the impacts of concentration polarization effects on diffusive contributions to the overall system response [37].
In the range between ilim,1 and ilim,2, a remarkable Gerischer arc can be noted in Figure 6a. The chemical reactions associated with such components in the EIS spectra can generate significant additional current carriers, which can soften the diffusion boundary layer resistance. With the step-up of the bias potential to i ≥ ilim,2 regions, an increase in the dimensions of the Gerischer arc can be observed for the 0.01 M HxPO43−x solution Figure 7a, together with an increase of its characteristic frequency. However, unlike the observed for the most diluted solution, diffusive contributions marked as finite-length Warburg arcs were still present even at such intense electric fields. For the most concentrated solution (Figure 7b), the distribution of the impedance values at overlimiting conditions (i > ilim,1) was comparable to that obtained at lower bias potentials. In this case, the resistance of the system increased with the potential applied, but the thickness of the diffusion boundary layer at 2.25 V was maintained at the same order of magnitude reported for 0.95 V. This can be inferred from the characteristic frequency of the Warburg-type impedances, giving the relation presented in Equation (4) [39].
A precise observation of the differences in the distribution of the impedances at low frequencies for the three concentration conditions at pH 7.2 can be seen in Figure 8. The Bode plot of the phase angle ( θ ) was obtained at bias potentials comprehending the last plateau region of each solution condition (0.50 V for 0.001 M, 0.90 V for 0.01 M and 0.95 V for 0.1 M HxPO43−x). For the 0.001 M solution, where a semi-infinite Warburg-type impedance was reported, a linear increase of the phase angle values can be observed, with θ showing a continuous raise at low frequencies [42]. When the phosphate concentration is increased, a maximum in the phase angle values is noted at approximately 12° for 0.010 M and 9° for 0.1 M, with the θ tending again to 0 at the lowest frequencies. These features suggest that an increase in the phosphate concentration may attenuate the effects of additional charge carriers provided by overlimiting mass transport mechanisms, such as phosphate species deprotonation, water splitting, and electroconvection. So, a consolidation of the concentration gradients and, consequently, a better definition of the diffusion boundary layer thickness can be confirmed at increasing electrolyte concentrations.

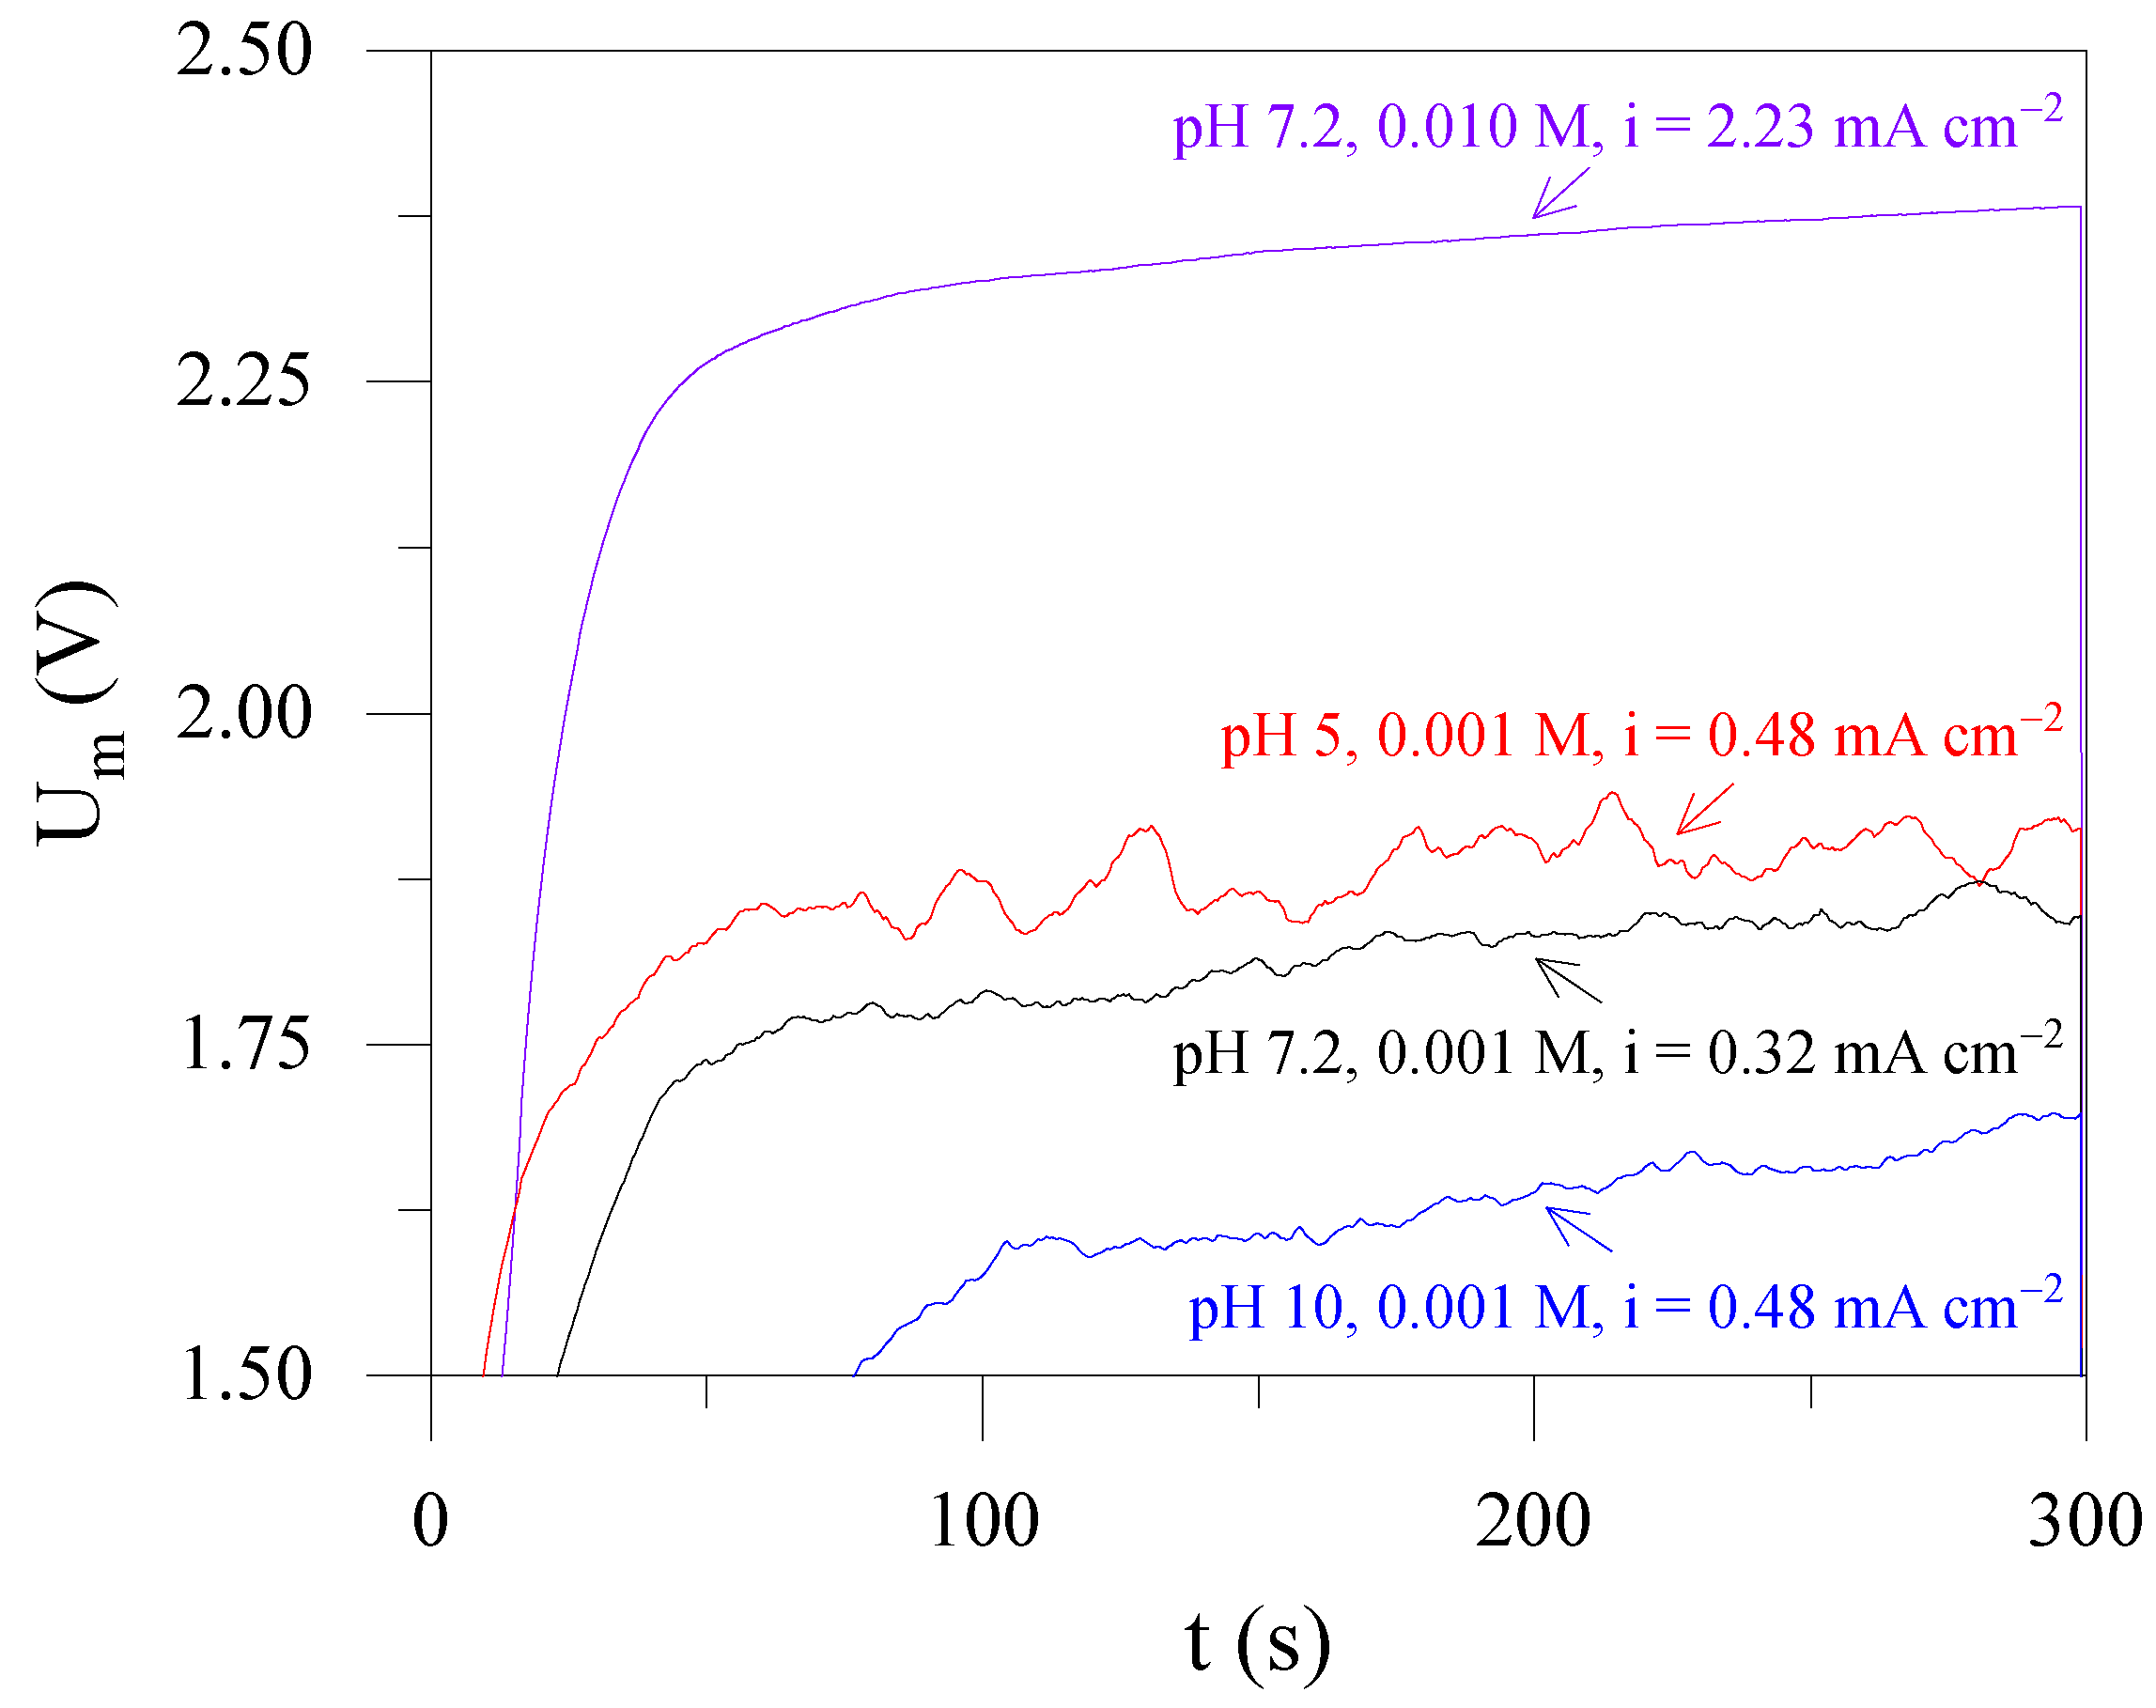
3.3. Chronopotentiometric Curves

The phenomena responsible for registering overlimiting currents in each system can be further investigated using chronopotentiometry. Based on the analysis of the Um response from the inflection point of a chronopotentiometry curve at intense electric fields, the dominant overlimiting mass transport mechanism can be estimated. Commonly, a peak in the Um values followed by a smooth decrease until reaching a steady state is associated with the presence of water splitting reactions [51] and gravitational convection [25]. When oscillations are observed in the curve, it can be assumed that the chaotic supply of additional current carriers to the diffusion boundary layer, as a consequence of electrically induced vortices near the membrane surface, is caused by the activation of electroconvection [52]. Nikonenko et al. [25] and Barros et al. [53] state that the non-conductive regions of a heterogeneous membrane (such as the IONSEP-HC-A) deviate the current lines, in a phenomenon known as the funnel effect, facilitating the formation of electrically induced vortices near the membrane surface. For homogeneous membranes, this effect is not observed.
In this regard, Figure 9 presents a section of the chronopotentiograms obtained for 0.001 M and 0.010 M HxPO43−x solutions at current density values higher than the ilim,2. For the most diluted solution, intense undulations in the Um values can be seen in the curves for all pH conditions, especially at pH 5, indicating the occurrence of electroconvection [54,55]. This result is in accordance with the literature, where it is reported that electroconvection is generally the dominant overlimiting mass transport mechanism in diluted solutions, usually lower than 0.02 M [25,53]. However, the chronopotentiometry curve for the 0.010 M HxPO43−x solution presented a smooth evolution, indicating the attenuation of the instabilities induced by the electrical vortices near the membrane surface. This occurrence confirms the development of the diffusion boundary layer with a well-defined thickness.
This agrees with the Bode plots of Figure 8. When the Um and impedance values are compared, it can be noted that the pattern of the chronopotentiometry curves and EIS spectra changed with the same variation of experimental conditions. Even though Gerischer semi-circles at intermediate frequencies of the EIS spectra indicate the occurrence of H+ ions generating reactions, it can be assumed that electroconvection is a determinant to disrupt the concentration profiles in the diffusion boundary layer. In this view, the additional charge carriers provided by the electrically induced vortices facilitate the distortion of the polarized region near the membrane surface. This phenomenon is observed in the form of an infinite-length diffusion boundary represented by the continuous phase angles increase at EIS spectra [56].

4. Conclusions

With the variable composition of municipal wastewater, it is necessary to study the effect of parameters like pH and concentration. The obtained results significantly contribute to further developing systems to recover phosphates using electrodialysis. It was observed that the transport of phosphate ions across a heterogeneous anion-exchange membrane reported singularities according to the solution pH and concentration. For a 0.001 M phosphate solution, a second quasi-ohmic region after the first limiting current density was registered in the polarization curves at pH 5 and 7.2. In contrast, at pH 10, only one limiting current density was observed. This behavior can be related to the protolysis of specific phosphate species in the membrane and its interfaces, enhanced by the Donnan exclusion effect. The detection of Gerischer impedance arcs in the EIS spectra for imposed electric fields comprehending the first plateau region confirms that statement. Two Gerischer semi-circles, with a loop between them, were noted in the first limiting state for pH 7.2 solution. This suggests that water splitting reactions may act as an additional source of H+ and OH ions in the diffusion boundary layer with the involvement of a partial transformation of membrane functional groups. For most pH conditions, the diameter of the Gerischer arcs increased with the electric field applied, becoming the major resistance in the EIS spectra. An increase in the phosphate concentration resulted in changes in the pattern of the polarization curves and Nyquist plots. For the most concentrated solution (0.1 M phosphate), a single quasi-ohmic region was reported in the polarization curves, with the absence of semi-circles at intermediate frequencies of the EIS spectra. At higher phosphate concentrations, finite-length Warburg semi-circles suggested the complete development of the diffusion boundary layers, confirmed by the distribution of the phase angle values at Bode plots. The distinct pattern of the low-frequency impedances showed by the solution conditions can be linked to the attenuation of chemical reactions in the diffusion boundary layer with increasing phosphate concentration. Another possibility is the disruption of the diffusion boundary layer thickness by the additional charge carriers provided by electrically induced vortices, as evidenced by chronopotentiometry curves. Further studies regarding the phosphate transport behavior across ion-exchange membranes may be conducted with the presence of co-ions and counter-ions (such as sulfate and sodium), complementing the information obtained in this research.

Author Contributions

E.H.R.: Conceptualization, methodology, validation, investigation, data curation, writing—original draft, visualization. M.C.M.-C.: Methodology, validation, writing—original draft, writing—review and editing, visualization. V.P.-H.: Formal analysis, writing—review and editing. A.M.B.: Conceptualization, resources, writing—review and editing, supervision, project administration, funding acquisition. All authors have read and agreed to the published version of the manuscript.

Funding

This research was funded by the Brazilian research funding agencies Coordenação de Aperfeiçoamento de Pessoal de Nível Superior—CAPES (88882.345780/2010-01), Conselho Nacional de Desenvolvimento Científico e Tecnológico—CNPq (203277/2019-8 and CNPq/BRICS-STI-2-442229/2017-8), Fundação de Amparo à Pesquisa do Estado do Rio Grande do Sul FAPERGS (21/2551-0002145-4) and Financiadora de Estudos e Projetos -FINEP. International financial support from the Ibero-American Program on Science and Technology for Development (CYTED), RFBR (No. 18-58-80031), DST (DST/IMRCD/BRICS/PC2/From waste to resources/2018 (G)), NSFC (51861145313) and NRF (No: 116020) are also received.

Data Availability Statement

Not applicable.

Conflicts of Interest

The authors declare no conflict of interest.

References

  1. Larriba, O.; Rovira-Cal, E.; Juznic-Zonta, Z.; Guisasola, A.; Baeza, J.A. Evaluation of the Integration of P Recovery, Polyhydroxyalkanoate Production and Short Cut Nitrogen Removal in a Mainstream Wastewater Treatment Process. Water Res. 2020, 172, 115474. [Google Scholar] [CrossRef] [PubMed]
  2. Shaddel, S.; Grini, T.; Ucar, S.; Azrague, K.; Andreassen, J.-P.; Østerhus, S.W. Struvite Crystallization by Using Raw Seawater: Improving Economics and Environmental Footprint While Maintaining Phosphorus Recovery and Product Quality. Water Res. 2020, 173, 115572. [Google Scholar] [CrossRef] [PubMed]
  3. Mayer, B.K.; Baker, L.A.; Boyer, T.H.; Drechsel, P.; Gifford, M.; Hanjra, M.A.; Parameswaran, P.; Stoltzfus, J.; Westerhoff, P.; Rittmann, B.E. Total Value of Phosphorus Recovery. Environ. Sci. Technol. 2016, 50, 6606–6620. [Google Scholar] [CrossRef] [PubMed]
  4. European Commission. Study on the EU’s List of Critical Raw Materials (2020): Final Report; Publications Office: Brussels, Belgium, 2020. [Google Scholar]
  5. Zhang, J.; Tang, L.; Tang, W.; Zhong, Y.; Luo, K.; Duan, M.; Xing, W.; Liang, J. Removal and Recovery of Phosphorus from Low-Strength Wastewaters by Flow-Electrode Capacitive Deionization. Sep. Purif. Technol. 2020, 237, 116322. [Google Scholar] [CrossRef]
  6. Robles, Á.; Aguado, D.; Barat, R.; Borrás, L.; Bouzas, A.; Giménez, J.B.; Martí, N.; Ribes, J.; Ruano, M.V.; Serralta, J.; et al. New Frontiers from Removal to Recycling of Nitrogen and Phosphorus from Wastewater in the Circular Economy. Bioresour. Technol. 2020, 300, 122673. [Google Scholar] [CrossRef]
  7. Yuan, Z.; Pratt, S.; Batstone, D.J. Phosphorus Recovery from Wastewater through Microbial Processes. Curr. Opin. Biotechnol. 2012, 23, 878–883. [Google Scholar] [CrossRef]
  8. Geng, Y.-K.; Wang, Y.; Pan, X.-R.; Sheng, G.-P. Electricity Generation and in Situ Phosphate Recovery from Enhanced Biological Phosphorus Removal Sludge by Electrodialysis Membrane Bioreactor. Bioresour. Technol. 2018, 247, 471–476. [Google Scholar] [CrossRef] [PubMed]
  9. Mohammadi, R.; Tang, W.; Sillanpää, M. A Systematic Review and Statistical Analysis of Nutrient Recovery from Municipal Wastewater by Electrodialysis. Desalination 2021, 498, 114626. [Google Scholar] [CrossRef]
  10. Ye, Y.; Ngo, H.H.; Guo, W.; Chang, S.W.; Nguyen, D.D.; Zhang, X.; Zhang, J.; Liang, S. Nutrient Recovery from Wastewater: From Technology to Economy. Bioresour. Technol. Rep. 2020, 11, 100425. [Google Scholar] [CrossRef]
  11. Bernardes, A.M.; Rodrigues, M.A.S.; Ferreira, J.Z. Electrodialysis and Water Reuse. Eds.; Springer Berlin Heidelberg: Berlin/Heidelberg, Germany, 2014; ISBN 978-3-642-40248-7. [Google Scholar]
  12. Rotta, E.H.; Bitencourt, C.S.; Marder, L.; Bernardes, A.M. Phosphorus Recovery from Low Phosphate-Containing Solution by Electrodialysis. J. Membr. Sci. 2019, 573, 293–300. [Google Scholar] [CrossRef]
  13. Liu, R.; Wang, Y.; Wu, G.; Luo, J.; Wang, S. Development of a Selective Electrodialysis for Nutrient Recovery and Desalination during Secondary Effluent Treatment. Chem. Eng. J. 2017, 322, 224–233. [Google Scholar] [CrossRef]
  14. Zhang, Y.; Desmidt, E.; Van Looveren, A.; Pinoy, L.; Meesschaert, B.; Van der Bruggen, B. Phosphate Separation and Recovery from Wastewater by Novel Electrodialysis. Environ. Sci. Technol. 2013, 47, 5888–5895. [Google Scholar] [CrossRef] [PubMed]
  15. Pismenskaya, N.D.; Rybalkina, O.A.; Kozmai, A.E.; Tsygurina, K.A.; Melnikova, E.D.; Nikonenko, V.V. Generation of H+ and OH Ions in Anion-Exchange Membrane/Ampholyte-Containing Solution Systems: A Study Using Electrochemical Impedance Spectroscopy. J. Membr. Sci. 2020, 601, 117920. [Google Scholar] [CrossRef]
  16. Martí-Calatayud, M.C.; Evdochenko, E.; Bär, J.; García-Gabaldón, M.; Wessling, M.; Pérez-Herranz, V. Tracking Homogeneous Reactions during Electrodialysis of Organic Acids via EIS. J. Membr. Sci. 2020, 595, 117592. [Google Scholar] [CrossRef]
  17. Belashova, E.D.; Pismenskaya, N.D.; Nikonenko, V.V.; Sistat, P.; Pourcelly, G. Current-Voltage Characteristic of Anion-Exchange Membrane in Monosodium Phosphate Solution. Modelling and Experiment. J. Membr. Sci. 2017, 542, 177–185. [Google Scholar] [CrossRef]
  18. Belashova, E.D.; Kharchenko, O.A.; Sarapulova, V.V.; Nikonenko, V.V.; Pismenskaya, N.D. Effect of Protolysis Reactions on the Shape of Chronopotentiograms of a Homogeneous Anion-Exchange Membrane in NaH2PO4 Solution. Pet. Chem. 2017, 57, 1207–1218. [Google Scholar] [CrossRef]
  19. Rybalkina, O.; Tsygurina, K.; Melnikova, E.; Mareev, S.; Moroz, I.; Nikonenko, V.; Pismenskaya, N. Partial Fluxes of Phosphoric Acid Anions through Anion-Exchange Membranes in the Course of NaH2PO4 Solution Electrodialysis. Int. J. Mol. Sci. 2019, 20, 3593. [Google Scholar] [CrossRef] [Green Version]
  20. Rybalkina, O.A.; Solonchenko, K.V.; Nikonenko, V.V.; Pismenskaya, N.D. Investigation of Causes of Low Current Efficiency in Electrodialysis of Phosphate-Containing Solutions. Membr. Membr. Technol. 2021, 3, 220–230. [Google Scholar] [CrossRef]
  21. Lee, S.; Meng, W.; Wang, Y.; Wang, D.; Zhang, M.; Wang, G.; Cheng, J.; Zhou, Y.; Qu, W. Comparison of the Property of Homogeneous and Heterogeneous Ion Exchange Membranes during Electrodialysis Process. Ain Shams Eng. J. 2021, 12, 159–166. [Google Scholar] [CrossRef]
  22. Rotta, E.H.; Marder, L.; Pérez-Herranz, V.; Bernardes, A.M. Characterization of an Anion-Exchange Membrane Subjected to Phosphate and Sulfate Separation by Electrodialysis at Overlimiting Current Density Condition. J. Membr. Sci. 2021, 635, 119510. [Google Scholar] [CrossRef]
  23. Rotta, E.H.; Marder, L.; Bernardes, A.M. Sulphate and Phosphate Separation under Overlimiting Electrodialysis Conditions. In Proceedings of the Book of Abstracts Euromembrane 2018, Valencia, Spain, 9–13 July 2018; pp. 191–192. [Google Scholar]
  24. Scarazzato, T.; Buzzi, D.C.; Bernardes, A.M.; Tenório, J.A.S.; Espinosa, D.C.R. Current-Voltage Curves for Treating Effluent Containing HEDP: Determination of the Limiting Current. Braz. J. Chem. Eng. 2015, 32, 831–836. [Google Scholar] [CrossRef]
  25. Nikonenko, V.V.; Kovalenko, A.V.; Urtenov, M.K.; Pismenskaya, N.D.; Han, J.; Sistat, P.; Pourcelly, G. Desalination at Overlimiting Currents: State-of-the-Art and Perspectives. Desalination 2014, 342, 85–106. [Google Scholar] [CrossRef]
  26. Pismenskaya, N.; Nikonenko, V.; Volodina, E.; Pourcelly, G. Electrotransport of Weak-Acid Anions through Anion-Exchange Membranes. Desalination 2002, 147, 345–350. [Google Scholar] [CrossRef]
  27. Lide, D.R. CRC Handbook of Chemistry and Physics, Internet Version 2005; CRC Press: Boca Raton, FL, USA, 2005; Available online: http://www.hbcpnetbase.com (accessed on 5 October 2022).
  28. Zabolotsky, V.I.; Nikonenko, V.V.; Pismenskaya, N.D.; Laktionov, E.V.; Urtenov, M.K.; Strathmann, H.; Wessling, M.; Koops, G.H. Coupled Transport Phenomena in Overlimiting Current Electrodialysis. Sep. Purif. Technol. 1998, 14, 255–267. [Google Scholar] [CrossRef]
  29. Melnikova, E.D.; Pismenskaya, N.D.; Bazinet, L.; Mikhaylin, S.; Nikonenko, V.V. Effect of Ampholyte Nature on Current-Voltage Characteristic of Anion-Exchange Membrane. Electrochim. Acta 2018, 285, 185–191. [Google Scholar] [CrossRef]
  30. Sarapulova, V.; Nevakshenova, E.; Pismenskaya, N.; Dammak, L.; Nikonenko, V. Unusual Concentration Dependence of Ion-Exchange Membrane Conductivity in Ampholyte-Containing Solutions: Effect of Ampholyte Nature. J. Membr. Sci. 2015, 479, 28–38. [Google Scholar] [CrossRef]
  31. Jin, D.; Xi, R.; Xu, S.; Wang, P.; Wu, X. Numerical Simulation of Salinity Gradient Power Generation Using Reverse Electrodialysis. Desalination 2021, 512, 115132. [Google Scholar] [CrossRef]
  32. Zhao, Z.; Shi, S.; Cao, H.; Li, Y. Electrochemical Impedance Spectroscopy and Surface Properties Characterization of Anion Exchange Membrane Fouled by Sodium Dodecyl Sulfate. J. Membr. Sci. 2017, 530, 220–231. [Google Scholar] [CrossRef] [Green Version]
  33. Kozmai, A.; Sarapulova, V.; Sharafan, M.; Melkonian, K.; Rusinova, T.; Kozmai, Y.; Pismenskaya, N.; Dammak, L.; Nikonenko, V. Electrochemical Impedance Spectroscopy of Anion-Exchange Membrane AMX-Sb Fouled by Red Wine Components. Membranes 2021, 11, 2. [Google Scholar] [CrossRef]
  34. Moya, A.A.; Moleón, J.A. Study of the Electrical Properties of Bi-Layer Ion-Exchange Membrane Systems. J. Electroanal. Chem. 2010, 647, 53–59. [Google Scholar] [CrossRef]
  35. Sistat, P.; Kozmai, A.; Pismenskaya, N.; Larchet, C.; Pourcelly, G.; Nikonenko, V. Low-Frequency Impedance of an Ion-Exchange Membrane System. Electrochim. Acta 2008, 53, 6380–6390. [Google Scholar] [CrossRef]
  36. Moya, A.A. Influence of Dc Electric Current on the Electrochemical Impedance of Ion-Exchange Membrane Systems. Electrochim. Acta 2011, 56, 3015–3022. [Google Scholar] [CrossRef]
  37. Park, J.-S.; Choi, J.-H.; Woo, J.-J.; Moon, S.-H. An Electrical Impedance Spectroscopic (EIS) Study on Transport Characteristics of Ion-Exchange Membrane Systems. J. Colloid Interface Sci. 2006, 300, 655–662. [Google Scholar] [CrossRef] [PubMed]
  38. Femmer, R.; Martí-Calatayud, M.C.; Wessling, M. Mechanistic Modeling of the Dielectric Impedance of Layered Membrane Architectures. J. Membr. Sci. 2016, 520, 29–36. [Google Scholar] [CrossRef]
  39. Nikonenko, V.V.; Kozmai, A.E. Electrical Equivalent Circuit of an Ion-Exchange Membrane System. Electrochim. Acta 2011, 56, 1262–1269. [Google Scholar] [CrossRef]
  40. Pärnamäe, R.; Mareev, S.; Nikonenko, V.; Melnikov, S.; Sheldeshov, N.; Zabolotskii, V.; Hamelers, H.V.M.; Tedesco, M. Bipolar Membranes: A Review on Principles, Latest Developments, and Applications. J. Membr. Sci. 2021, 617, 118538. [Google Scholar] [CrossRef]
  41. Kniaginicheva, E.; Pismenskaya, N.; Melnikov, S.; Belashova, E.; Sistat, P.; Cretin, M.; Nikonenko, V. Water Splitting at an Anion-Exchange Membrane as Studied by Impedance Spectroscopy. J. Membr. Sci. 2015, 496, 78–83. [Google Scholar] [CrossRef]
  42. Nguyen, T.Q.; Breitkopf, C. Determination of Diffusion Coefficients Using Impedance Spectroscopy Data. J. Electrochem. Soc. 2018, 165, E826. [Google Scholar] [CrossRef]
  43. Qu, D. Application of a.c. Impedance Technique to the Study of the Proton Diffusion Process in the Porous MnO2 Electrode. Electrochim. Acta 2003, 48, 1675–1684. [Google Scholar] [CrossRef]
  44. Pismenskaya, N.D.; Pokhidnia, E.V.; Pourcelly, G.; Nikonenko, V.V. Can the Electrochemical Performance of Heterogeneous Ion-Exchange Membranes Be Better than That of Homogeneous Membranes? J. Membr. Sci. 2018, 566, 54–68. [Google Scholar] [CrossRef]
  45. Rybalkina, O.A.; Tsygurina, K.A.; Melnikova, E.D.; Pourcelly, G.; Nikonenko, V.V.; Pismenskaya, N.D. Catalytic Effect of Ammonia-Containing Species on Water Splitting during Electrodialysis with Ion-Exchange Membranes. Electrochim. Acta 2019, 299, 946–962. [Google Scholar] [CrossRef]
  46. Bessone, J.B.; Salinas, D.R.; Mayer, C.E.; Ebert, M.; Lorenz, W.J. An EIS Study of Aluminium Barrier-Type Oxide Films Formed in Different Media. Electrochim. Acta 1992, 37, 2283–2290. [Google Scholar] [CrossRef]
  47. Guerrero, A.; Garcia-Belmonte, G.; Mora-Sero, I.; Bisquert, J.; Kang, Y.S.; Jacobsson, T.J.; Correa-Baena, J.-P.; Hagfeldt, A. Properties of Contact and Bulk Impedances in Hybrid Lead Halide Perovskite Solar Cells Including Inductive Loop Elements. J. Phys. Chem. C 2016, 120, 8023–8032. [Google Scholar] [CrossRef] [Green Version]
  48. Ghahremanirad, E.; Bou, A.; Olyaee, S.; Bisquert, J. Inductive Loop in the Impedance Response of Perovskite Solar Cells Explained by Surface Polarization Model. J. Phys. Chem. Lett. 2017, 8, 1402–1406. [Google Scholar] [CrossRef] [PubMed]
  49. Radvanyi, E.; Van Havenbergh, K.; Porcher, W.; Jouanneau, S.; Bridel, J.-S.; Put, S.; Franger, S. Study and Modeling of the Solid Electrolyte Interphase Behavior on Nano-Silicon Anodes by Electrochemical Impedance Spectroscopy. Electrochim. Acta 2014, 137, 751–757. [Google Scholar] [CrossRef]
  50. Choi, J.-H.; Moon, S.-H. Structural Change of Ion-Exchange Membrane Surfaces under High Electric Fields and Its Effects on Membrane Properties. J. Colloid Interface Sci. 2003, 265, 93–100. [Google Scholar] [CrossRef]
  51. Gally, C.; García-Gabaldón, M.; Ortega, E.M.; Bernardes, A.M.; Pérez-Herranz, V. Chronopotentiometric Study of the Transport of Phosphoric Acid Anions through an Anion-Exchange Membrane under Different PH Values. Sep. Purif. Technol. 2020, 238, 116421. [Google Scholar] [CrossRef]
  52. Stockmeier, F.; Schatz, M.; Habermann, M.; Linkhorst, J.; Mani, A.; Wessling, M. Direct 3D Observation and Unraveling of Electroconvection Phenomena during Concentration Polarization at Ion-Exchange Membranes. J. Membr. Sci. 2021, 640, 119846. [Google Scholar] [CrossRef]
  53. Barros, K.S.; Martí-Calatayud, M.C.; Scarazzato, T.; Bernardes, A.M.; Espinosa, D.C.R.; Pérez-Herranz, V. Investigation of Ion-Exchange Membranes by Means of Chronopotentiometry: A Comprehensive Review on This Highly Informative and Multipurpose Technique. Adv. Colloid Interface Sci. 2021, 293, 102439. [Google Scholar] [CrossRef]
  54. Nikonenko, V.V.; Mareev, S.A.; Pis’menskaya, N.D.; Uzdenova, A.M.; Kovalenko, A.V.; Urtenov, M.K.; Pourcelly, G. Effect of Electroconvection and Its Use in Intensifying the Mass Transfer in Electrodialysis (Review). Russ. J. Electrochem. 2017, 53, 1122–1144. [Google Scholar] [CrossRef]
  55. Akberova, E.M.; Vasil’eva, V.I. Effect of the Resin Content in Cation-Exchange Membranes on Development of Electroconvection. Electrochem. Commun. 2020, 111, 106659. [Google Scholar] [CrossRef]
  56. Mareev, S.A.; Butylskii, D.Y.; Pismenskaya, N.D.; Nikonenko, V.V. Chronopotentiometry of Ion-Exchange Membranes in the Overlimiting Current Range. Transition Time for a Finite-Length Diffusion Layer: Modeling and Experiment. J. Membr. Sci. 2016, 500, 171–179. [Google Scholar] [CrossRef]
Figure 1. Speciation diagram of phosphate species in solution as a function of pH. The dotted lines represent the studied pH values (5, 7.2 and 10).
Water 15 00009 g001
Figure 2. Polarization curves for the IONSEP-HC-A membrane in contact with a solution with 0.001 M of HxPO43−x at pH 5 (red line), 7.2 (black line), and 10 (blue line). Dotted lines represent the delimitation of polarization curve regions.
Water 15 00009 g002
Figure 3. Polarization curves for the IONSEP-HC-A membrane in contact with a solution with 0.010 M and 0.100 M of HxPO43−x at pH 7.2. Dotted lines represent the delimitation of polarization curve regions.
Water 15 00009 g003
Figure 4. Electrochemical impedance spectroscopy spectra for the 0.001 M HxPO43−x solution at (a) pH 5, (b) pH 7, and (c) pH 10. The impedances were obtained at bias potentials comprehending i < ilim,1 (red) and i = ilim,1 (green) region of the polarization curve. Solid points refer to characteristic frequencies.
Water 15 00009 g004
Figure 5. Electrochemical impedance spectroscopy spectra for the 0.001 M HxPO43−x solution at (a) pH 5, (b) pH 7 and (c) pH 10. The impedances were obtained at bias potentials corresponding to the ilim,1 < i < ilim,2 (orange, when applicable), i = ilim,2 (blue) and i > ilim,2 (pink) region of the polarization curve. Solid points refer to characteristic frequencies.
Water 15 00009 g005
Figure 6. Electrochemical impedance spectroscopy spectra for the (a) 0.01 M and (b) 0.1 M HxPO43−x solution at pH 7.2. The impedances were obtained at bias potentials comprehending the i < ilim,1 (red), i = ilim,1 (green), and ilim,1 < i < ilim,2 (orange, when applicable) region of the polarization curve. Solid points refer to characteristic frequencies.
Water 15 00009 g006
Figure 7. Electrochemical impedance spectroscopy spectra obtained at bias potentials corresponding the i = ilim,2 (blue) and i > ilim,2 (pink) for the (a) 0.01 M and (b) 0.1 M HxPO43−x solution at pH 7.2. For the 0.1 M solution, only ilim,1 was reported. Solid points refer to characteristic frequencies.
Water 15 00009 g007
Figure 8. Bode plot of the phase angle versus the frequency for the three HxPO43−x concentration conditions at pH 7.2. The bias potential applied comprehends the last plateau region of each experimental condition.
Water 15 00009 g008
Figure 9. Overlimiting current density condition section of chronopotentiometric curves for different experimental conditions.
Water 15 00009 g009
Table 1. Initial conductivity values of the working solutions (in mS cm−1).
Solution0.001 M0.01 M0.1 M
pH 50.11 ± 0.01--
pH 7.20.17 ± 0.011.41 ± 0.028.86 ± 0.02
pH 100.37 ± 0.02--
Disclaimer/Publisher’s Note: The statements, opinions and data contained in all publications are solely those of the individual author(s) and contributor(s) and not of MDPI and/or the editor(s). MDPI and/or the editor(s) disclaim responsibility for any injury to people or property resulting from any ideas, methods, instructions or products referred to in the content.

