
An Integrated Approach for the Recovery of Sn from Used Water Adsorbents

Department of Chemical Engineering, Aristotle University of Thessaloniki, 54124 Thessaloniki, Greece
*
Author to whom correspondence should be addressed.
Water 2023, 15(1), 97; https://doi.org/10.3390/w15010097
Submission received: 23 November 2022
/
Revised: 21 December 2022
/
Accepted: 23 December 2022
/
Published: 28 December 2022
(This article belongs to the Special Issue Application of Sustainable Chemical and Biological Methods for Pollutants Removal from Water)
Abstract
:This research examined a scenario for the recovery of a high-capacity Cr(VI) adsorbent, consisting of Sn6O4(OH)4, after reaching its operational lifetime. To accomplish this target, a sequence of processes involving the spent adsorbent’s decomposition, the separation of Sn/Cr ions, and Sn6O4(OH)4 reconstruction was investigated. Characterization of the saturated adsorbent indicated its extended oxidation to SnO2 during its use according to the occurring Cr(VI) to Cr(III) reduction mechanism, which is responsible for the loading of 19 mg Cr/g. To decompose saturated adsorbent, the optimized process involved the dissolution by HCl using a solid concentration of 10 g/L, a solid to acid mass proportion of 1:20, an increase of the temperature at 75 °C. Such conditions brought a dissolution rate of more than 95% and 92.5%, respectively, of the total Sn and Cr in the spent adsorbent. Then, separation of Cr was succeeded by the addition of hydrazine, which acts as a reducing agent for the transformation of Sn(IV) to Sn(II); the precipitation of Cr(III) at pH 3, and the reconstruction of Sn6O4(OH)4 in a second step after increasing pH to 7. The recovered adsorbent stabilized a higher percentage of Sn(II) than the initial material, which explains the improvement of the removal efficiency by 50% in the Cr(VI) adsorption capacity.
1. Introduction
The dramatic decrease in raw materials availability and the extremely large quantities of wastes are considered the price paid to support the industrial revolution and improvement in the standard of living during the last decades. Based on the linear model of economy, people collect natural resources, prepare products, and dispose of used products back to nature. However, the increase of public awareness in environmental protection, the world economic crisis, and the need of communities to remain self-sufficient initiated policies for the establishment of a regenerative system in which wastes, emissions, and energy leakage are eliminated. Circular economy is an alternative concept where resources are kept in use as long as possible by adopting actions of recovery, regeneration, remanufacturing, and recycling [1,2,3]. Under this frame, very recently, authorities began to declare new priorities in critical raw materials recycling [4]. For instance, the European Commission promotes a new legislative proposal for wastes that will cover the full economic cycle of end-of-life products rather than just their waste reduction [5,6].
Metals represent a major class of raw materials characterized as critical according to their value, availability, mining difficulties, limited access to resources, and political and market incidents. For this reason, metals reuse was one of the earliest actions taken towards recycling [7]. Nevertheless, recycling rates remain at low levels. For example, tin (Sn), a metal that combines high commercial price and consumption quantities, has a recycling rate of just 20% [8]. Considering that the total production covering current demand is around 3 × 10⁵ tn/year, and the recoverable quantity available in the form of wastes is 7.62 × 10⁷ tn, one can understand the importance of designing new methods that restore Sn in the economy cycle [9]. The main applications of Sn are found in metal technology for the preparation of solder, tin plating, metal alloys, and optoelectronics, while its compounds (salts, oxides) can be used as catalysts, stabilizers, and additives in several products [10,11]. Moreover, very recently, an Sn oxyhydroxide, Sn6O4(OH)4, was successfully introduced in drinking water treatment technology as the first adsorbent optimized for hexavalent chromium (Cr(VI)) removal [12]. The Sn6O4(OH)4 acts as an electron donor that captures chromium on its surface in the Cr(III) form after the reduction of Cr(VI) [13]. The considerable efficiency of this material to reduce Cr(VI) below the upcoming regulation limit of 25 μg/L [14], together with the high worldwide concern about the risks of Cr(VI) pollution, indicates that the use of similar products is going to expand in the near future [15].
Unfortunately, although drinking water adsorbents comprise a facile and relatively cheap solution to protect human health from toxic pollutants, currently, they are only used as consumables having a specific lifetime of effective operation. At the end, the spent material is a solid waste loaded with high quantities of toxic elements pending disposal in some manner. The environmentally safe disposal in a landfill and the regeneration of the adsorbent are the commonly applied approaches [16,17] depending on the type of the adsorbed pollutant, the leaching possibility, and the cost of the spent adsorbent. Both ways include the risk of secondary pollution either by long-term pollutant dissolution in the landfill or the production of secondary liquid wastes that increase the overall effort and cost during regeneration [18,19,20]. In the case of Sn-based adsorbents, the treatment options are defined by the non-negligible market price of Sn [21] and the difficulty to regenerate the adsorbent after the extended surface oxidation and severe composition modifications that take place [13]. For these reasons, Sn recovery, following a method of reconstructing the adsorbent to bring it back in its initial state, can stand as a viable alternative with direct benefits in environmental protection, consumables’ cost reduction, and improvement of Cr(VI) removal technology. Furthermore, the adoption of this strategy enables the exploitation of Sn wastes and end-of-life products from other sources or applications.
This study addresses a comprehensive effort to establish a closed loop in the use of Sn resources towards water treatment purposes. It involves a sequence of chemical processes that (i) receive and decompose the spent Cr-adsorbent or other types of stannous wastes, (ii) separate Sn from loaded pollutants, (iii) rebuild fully operative Sn6O4(OH)4, and (iv) inertize Cr or other toxic species in the form of stable solids with technological value.
2. Materials and Methods
2.1. Selective Separation of Sn from Spent Material and Reconstruction of Adsorbent
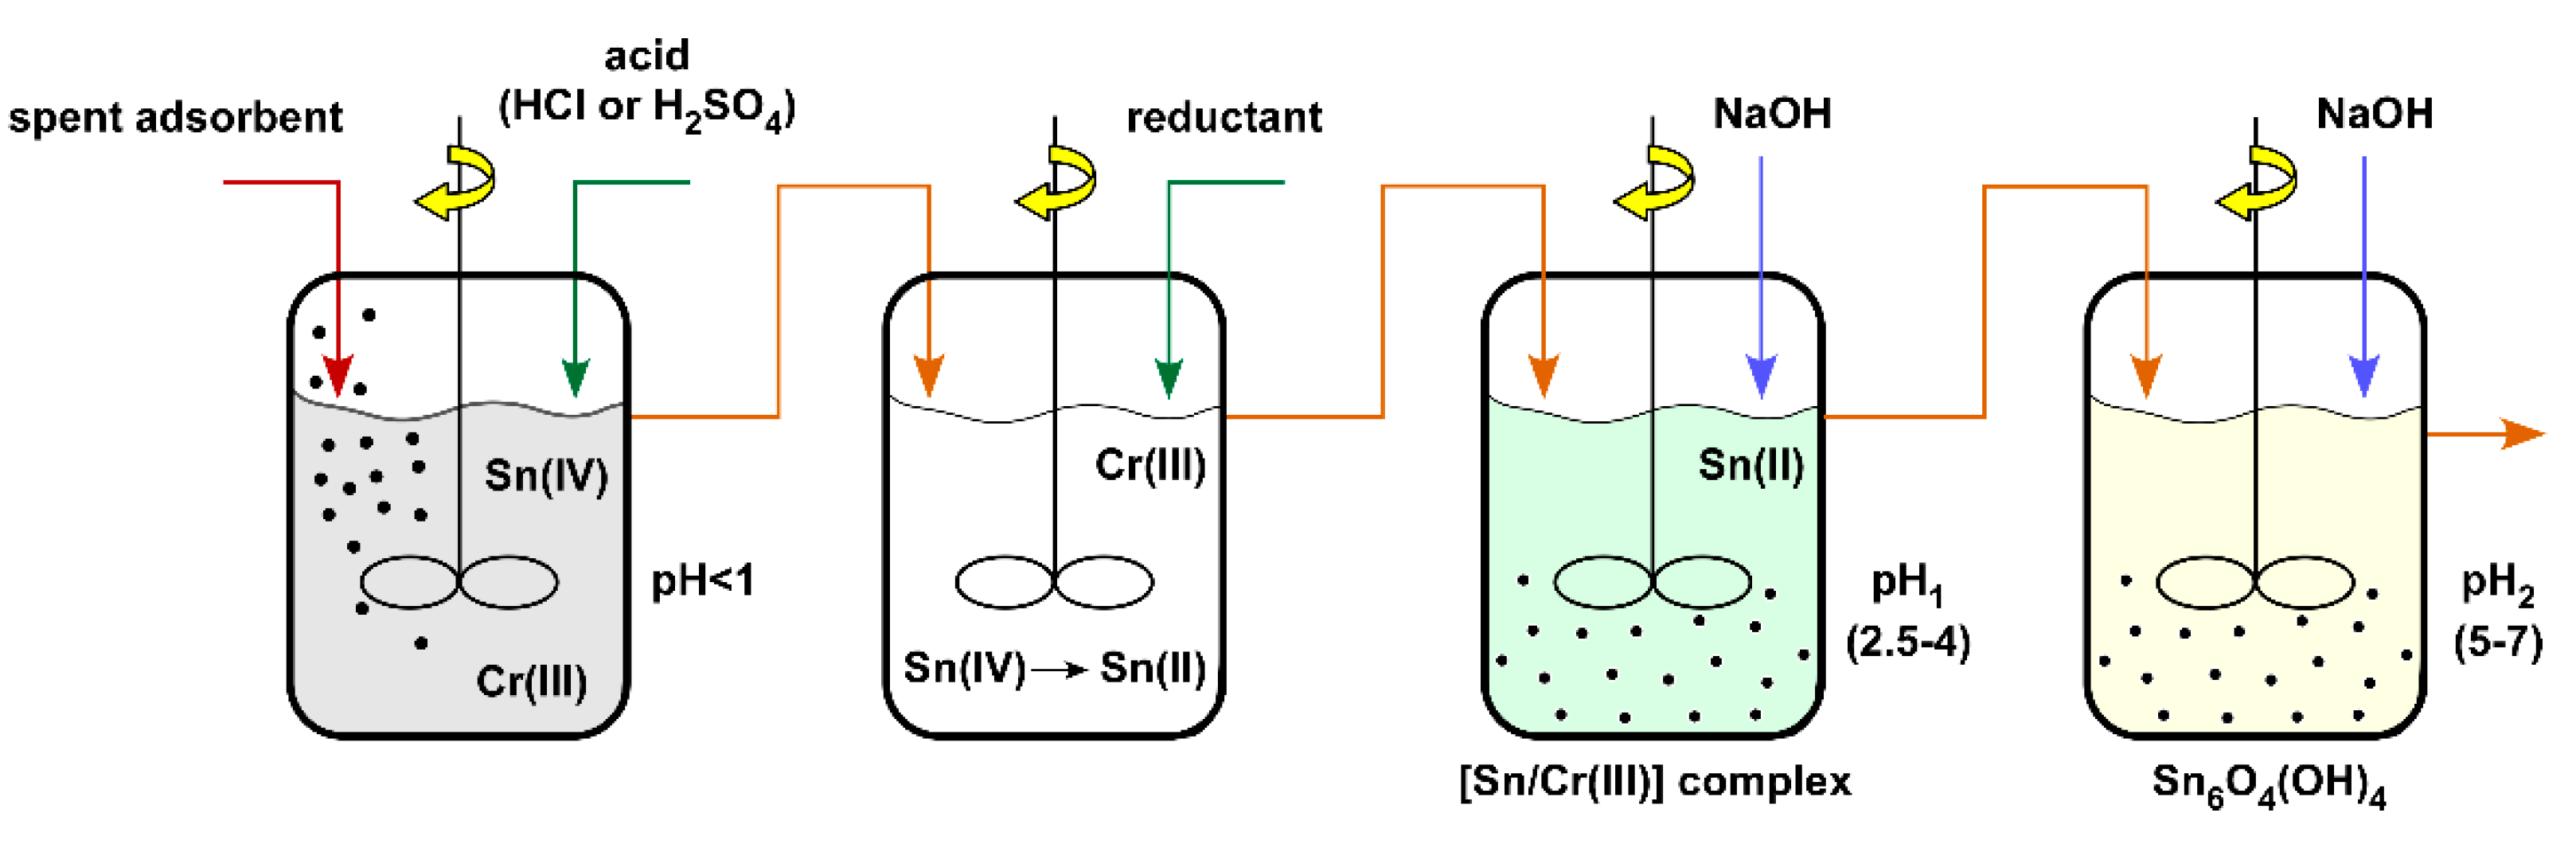
This component examined the conditions to achieve complete decomposition of spent Sn-based adsorbent into the constituting ions (Sn(II) or Sn(IV) and Cr(III)) and the process that selectively separates tin forms from the potentially toxic Cr(III). The spent adsorbent was obtained after saturating granular Sn6O4(OH)4 with chromium in a short-term column experiment feeding Cr(VI)-containing water [12]. After reaching its operational lifetime, the residual solid was collected, washed, and dried under mild conditions before its use as the input of the aforementioned recovery procedure. For the first objective, the adsorbent was dissolved in a highly acidic environment in a stirring tank. The optimization of the procedure was performed by examining the impact of parameters such as the dissolution pH, the type of acid (HCl, H2SO4), the solid-to-acid proportion, the spent adsorbent concentration, and the dissolution temperature. The separation between dissolved Sn and Cr was studied using the outflowing solution in a second reaction system. In this stage, the difference between the solubility constants of Sn(IΙ) (Ksp Sn(OH)2 = 7 × 10⁻²⁷), Sn(IV) (Ksp Sn(OH)4 = 1 × 10−56), and Cr(III) (Ksp Cr(OH)3 = 7 × 10⁻³¹) was exploited to design a sequence of precipitation steps. Initially, the reduction of Sn(IV) to Sn(II) was studied, while subsequently, the gradual increase of the pH in the mixture allowed the separation of Cr(III) in a first precipitation step and the recovery of solid Sn6O4(OH)4 in a second. Reduction and stepwise precipitation were investigated in an integrative way to determine the optimum conditions for maximum separation ratio. The entire procedure is graphically illustrated in Figure 1.
2.1.1. Dissolution
For the dissolution experiments, a certain quantity of spent adsorbent (20–400 mg) was dispersed in 20 mL of aqueous solution of HCl (37%, 1.19 g/mL) or H2SO4 (96%, 1.84 g/mL) in a beaker and stirred for a sufficient period of time (30 min). The assisting role of temperature increase during the dissolution was also investigated for the range 25–75 °C.
2.1.2. Tin Reduction and Adsorbent Reconstruction
Τhe dissolution of the spent adsorbent was followed by the reduction of Sn(IV) to Sn(II). The reductants evaluated for this purpose were NaHSO3, Na2S2O4, Na2S2O5, and N2H4∙2HCl. In particular, the reductant was added in a stoichiometric ratio (for complete reduction of Sn(IV)) to the spent adsorbent solution as obtained from the dissolution process, and a 30 min stirring was applied. Subsequently, a gradual increase in solution pH by the addition of NaOH allowed the separation of Cr(III) in a first precipitation step and the recovery of solid Sn6O4(OH)4 in a second. Specifically, when the pH value reached the examined value for the first stage (pH1) (2.5, 3, 3.5, and 4), the mixture was filtered, and the solid was dried. The filtrate was then transferred to another beaker, where the addition of the NaOH solution continued until the pH value increased to be examined for the second stage (pH2) (5, 6, and 7). The mixture was then filtered, and the obtained solid was dried. Before the drying of the solids, both in the first and in the second stage, washings were carried out to remove water-soluble salts. The addition of extra quantity of reducing agent (25% and 50%) was also evaluated. The solids obtained from the two precipitation stages were mass measured, and the Cr and Sn content were determined by total dissolution and flame atomic absorption measurement.
2.2. Characterisation of Materials
Since the initial structure and composition of the adsorbent were subjected to significant modifications, as a result of the continuous oxidation, dehydroxylation, and chromium incorporation, a detailed characterization step provided information towards the design of the following processes. For this purpose, a combination of analytical and structural characterization techniques was applied to the spent adsorbent. Respectively, since the product of reconstruction procedure was meant for another cycle of drinking water treatment, recovered material characterization was also performed. In particular, total tin and chromium content was determined by atomic absorption spectroscopy (Perkin-Elmer AAnalyst 800) after acid dissolution, while the Sn(II) percentage was quantified by titration with KMnO4 0.05 N. The structural characteristics were identified by X-ray diffraction (XRD), thermogravimetric analysis (TG-DTA), Fourier-transformed infrared (FT-IR), and scanning electron microscopy (SEM). XRD was performed using a water-cooled Rigaku Ultima+ diffractometer with CuKa radiation, a step size of 0.05°, and a step time of 3 s, operating at 40 kV and 30 mA. TG-DTA were collected by a Perkin-Elmer STA 6000 instrument in the temperature range 30–900 °C and at a heating rate of 20 °C/min and nitrogen flow. Fourier-transformed infrared FT-IR spectra of the materials were recorded using a Perkin-Elmer Spectrum 100 spectrophotometer. For the measurement, the powdered samples were homogeneously mixed with KBr and pelletized. The obtained spectra were the result of 10 co-added scans with a resolution of 4 cm−1. SEM micrographs were obtained from a Quanta 200 ESEM FEG FEI microscope.
2.3. Validation of Efficiency
This section provided a feedback for the developed adsorbent after the recovery cycle concerning its ability to capture Cr(VI) and to maintain a similar capacity to the adsorbent prepared from chemical reagents. The produced solid suspension was thickened in an Imhoff tank, followed by washing, centrifuging, drying, grounding, and sieving of the product in order to achieve either a fine powder (<63 μm) or granules (250–500 μm). Obtained fine powder of the material was tested in a series of batch adsorption experiments at 20 °C and equilibrium pH 6–8. A certain amount of adsorbent (10–35 mg) was dispersed in 200 mL of Cr(VI)-containing distilled or test water (2500–7500 μg Cr(VI)/L) in a conical flask and shaken for a sufficient period of time (24 h). Target pH values were adjusted by the addition of drops of either NaOH or HNO3 during the first 2 h. The solid was separated after the experiment by filtering through a 0.2 μm membrane filter, and the filtrate was analyzed for residual chromium concentration. The test Cr(VI) solutions were prepared in natural-like water (according to the National Sanitation Foundation, NSF standard) to investigate the collective effect of commonly co-existing and possibly interfering ions and compare the removal capacity with the corresponding one obtained by using distilled water. For the preparation of 10 L of NSF water, 2.520 g NaHCO3, 1.470 g CaCl2 2H2O, 1.283 g MgSO4·7H2O, 0.706 g NaSiO3 5H2O, 0.1214 g NaNO3, 0.0221 g NaF, and 0.0018 g NaH2PO4·H2O were dissolved in distilled water. Initial and residual Cr(VI) concentrations were determined by the diphenyl-carbazide spectrophotometric method. The evaluation of produced material as Cr(VI) adsorbent was focused on its ability to decrease residual Cr(VI) concentration below 25 μg/L, the recently adopted maximum contaminant level for chromium pursuant to EU Directive 2020/2184 on the quality of water intended for human consumption [14].
Each experiment was performed in three replicates, and the average variation of measured values was approximately within 5%; thus, the respective error bars are not presented in the figures.
3. Results and Discussion
3.1. Characterization of Spent Adsorbent
Chemical characterization of spent adsorbent is presented in Table 1. To evaluate the effect of chromium uptake on adsorbent’s properties, the results are compared to those for the corresponding original material.
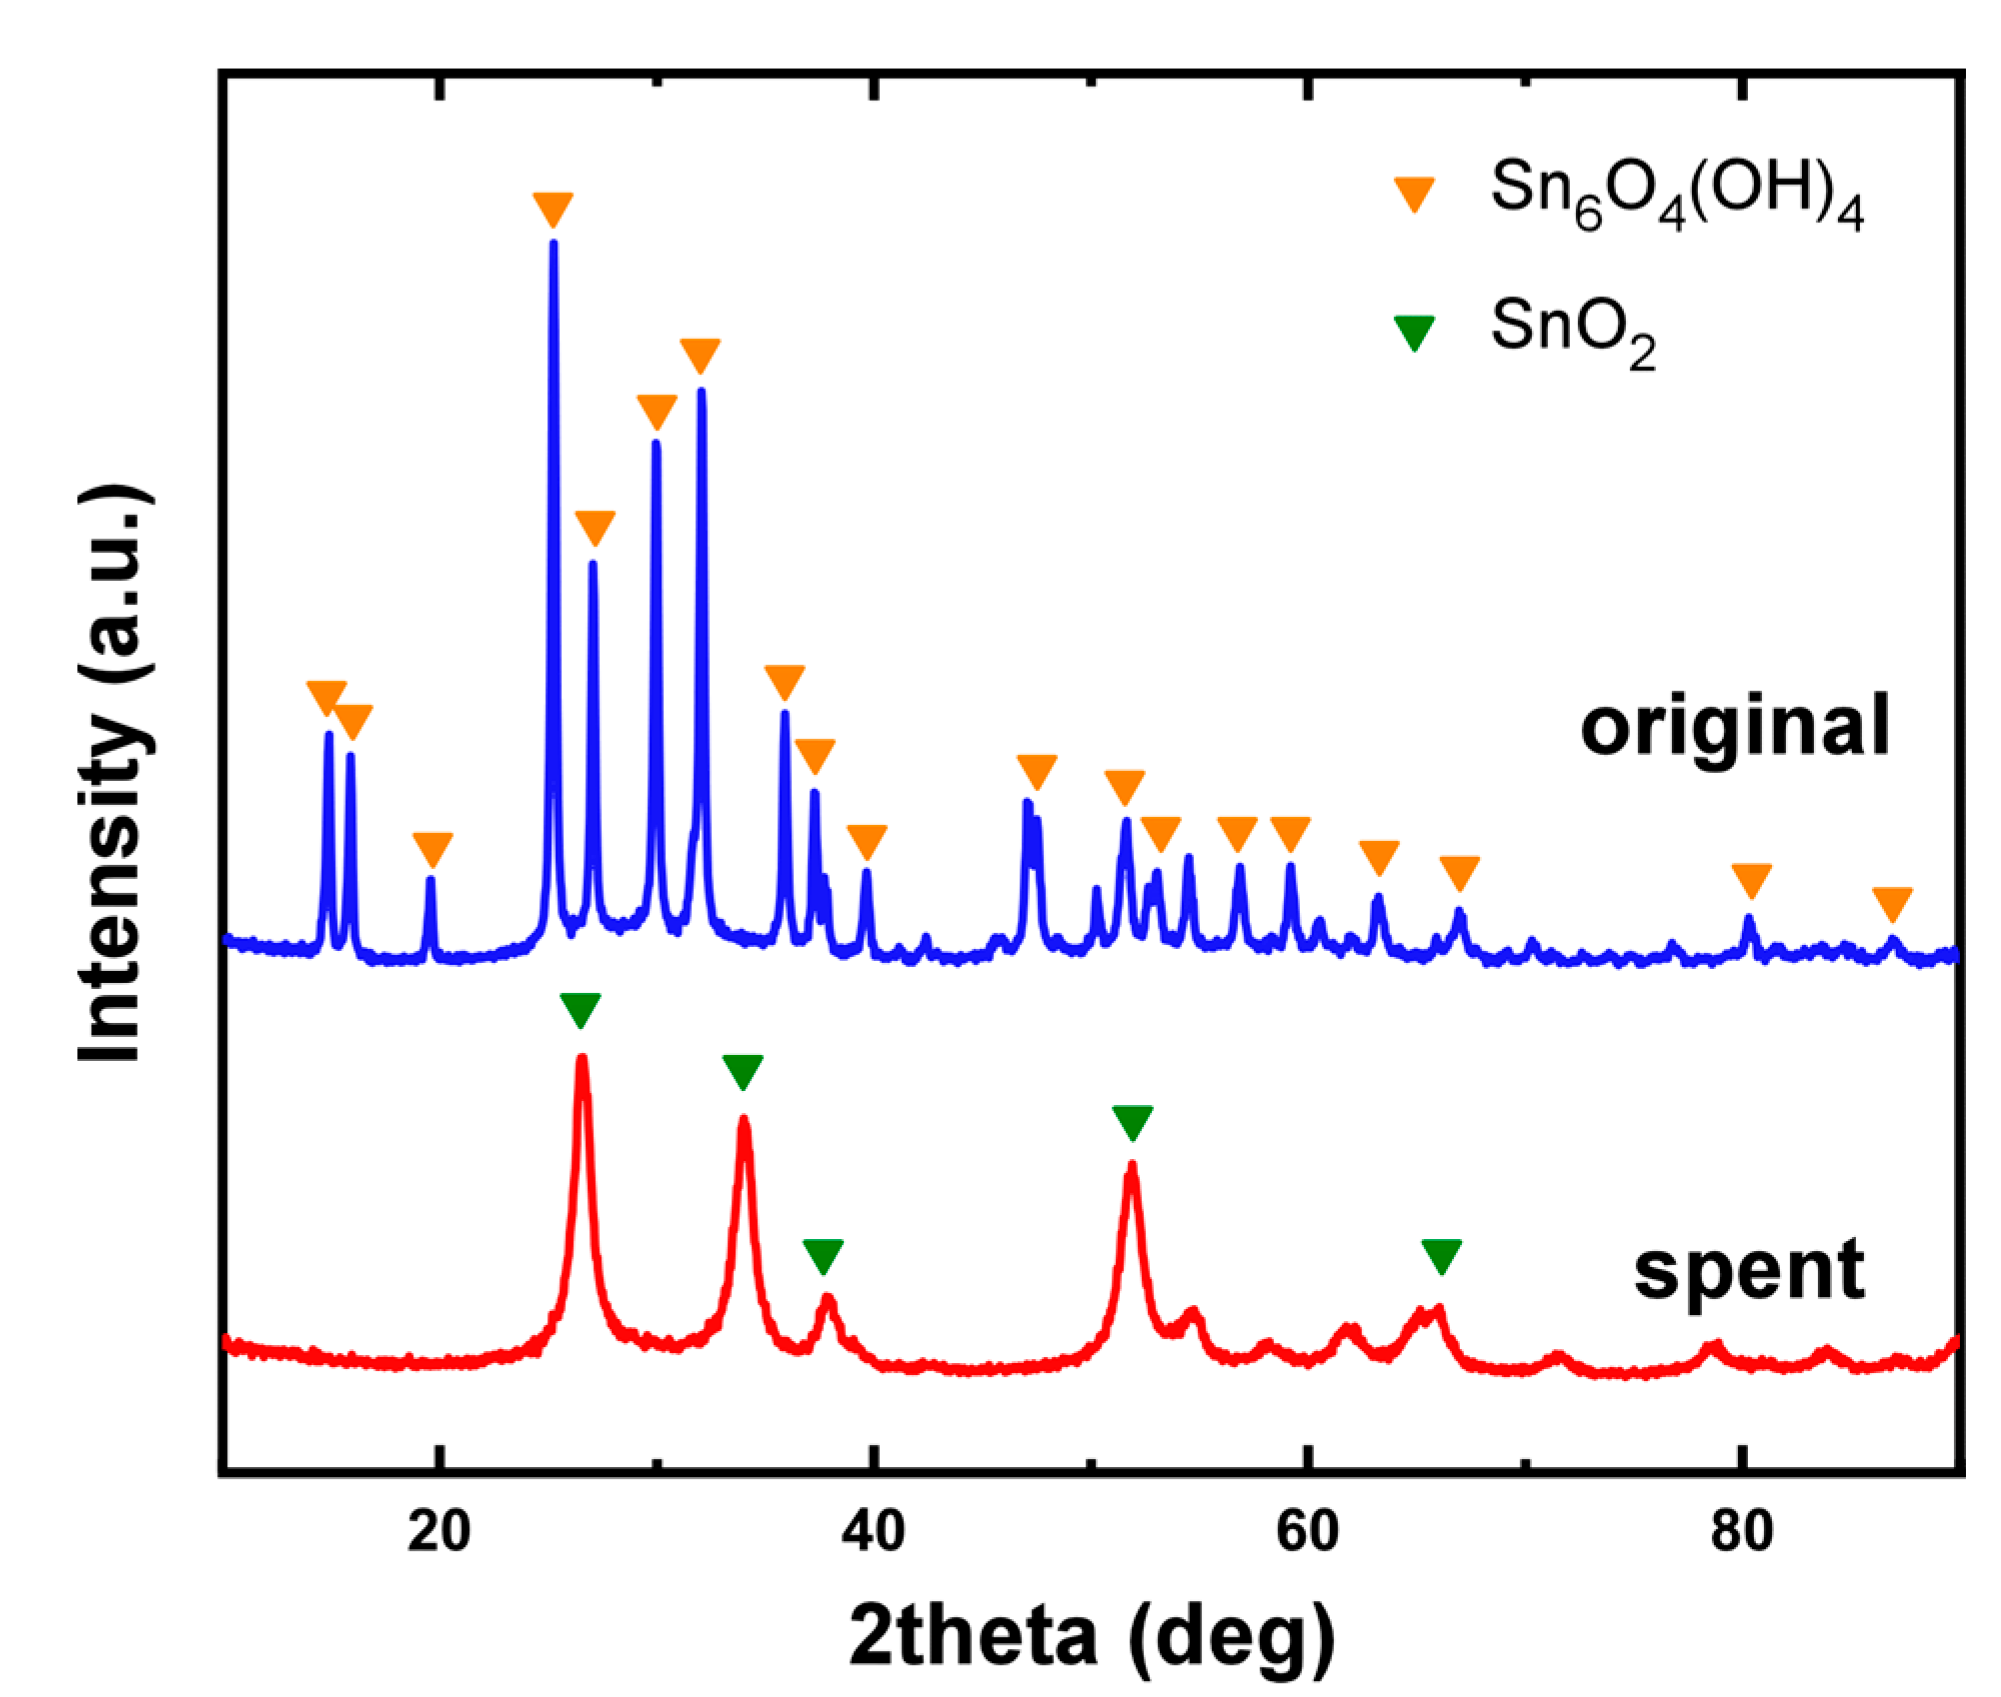
As can be observed from the values of Table 1, the percentage of Sn(II) in the adsorbent after its saturation decreased by 95%, indicating Sn(II) oxidation to Sn(IV) with simultaneous reduction of Cr(VI) to Cr(III). The amount of Cr retained in the material was calculated to 19 mg/g as also determined by the breakthrough curves for Cr(VI) adsorption on granular Sn6O4(OH)4 in rapid small-scale column tests [12]. The oxidation of Sn(II) was also verified by the comparison of the XRD diagrams of the adsorbent prior to (original) and after its use (spent) for Cr(VI) removal from drinking water (Figure 2). XRD analysis indicated the occurrence of a single phase for the original adsorbent, a bivalent tin oxy-hydroxide with the chemical structure of hydro-romarchite (Sn6O4(OH)4), while at the spent adsorbent, SnO2 is formed. This is attributed to the conversion of Sn(II) to Sn(IV) and the oxide formation.
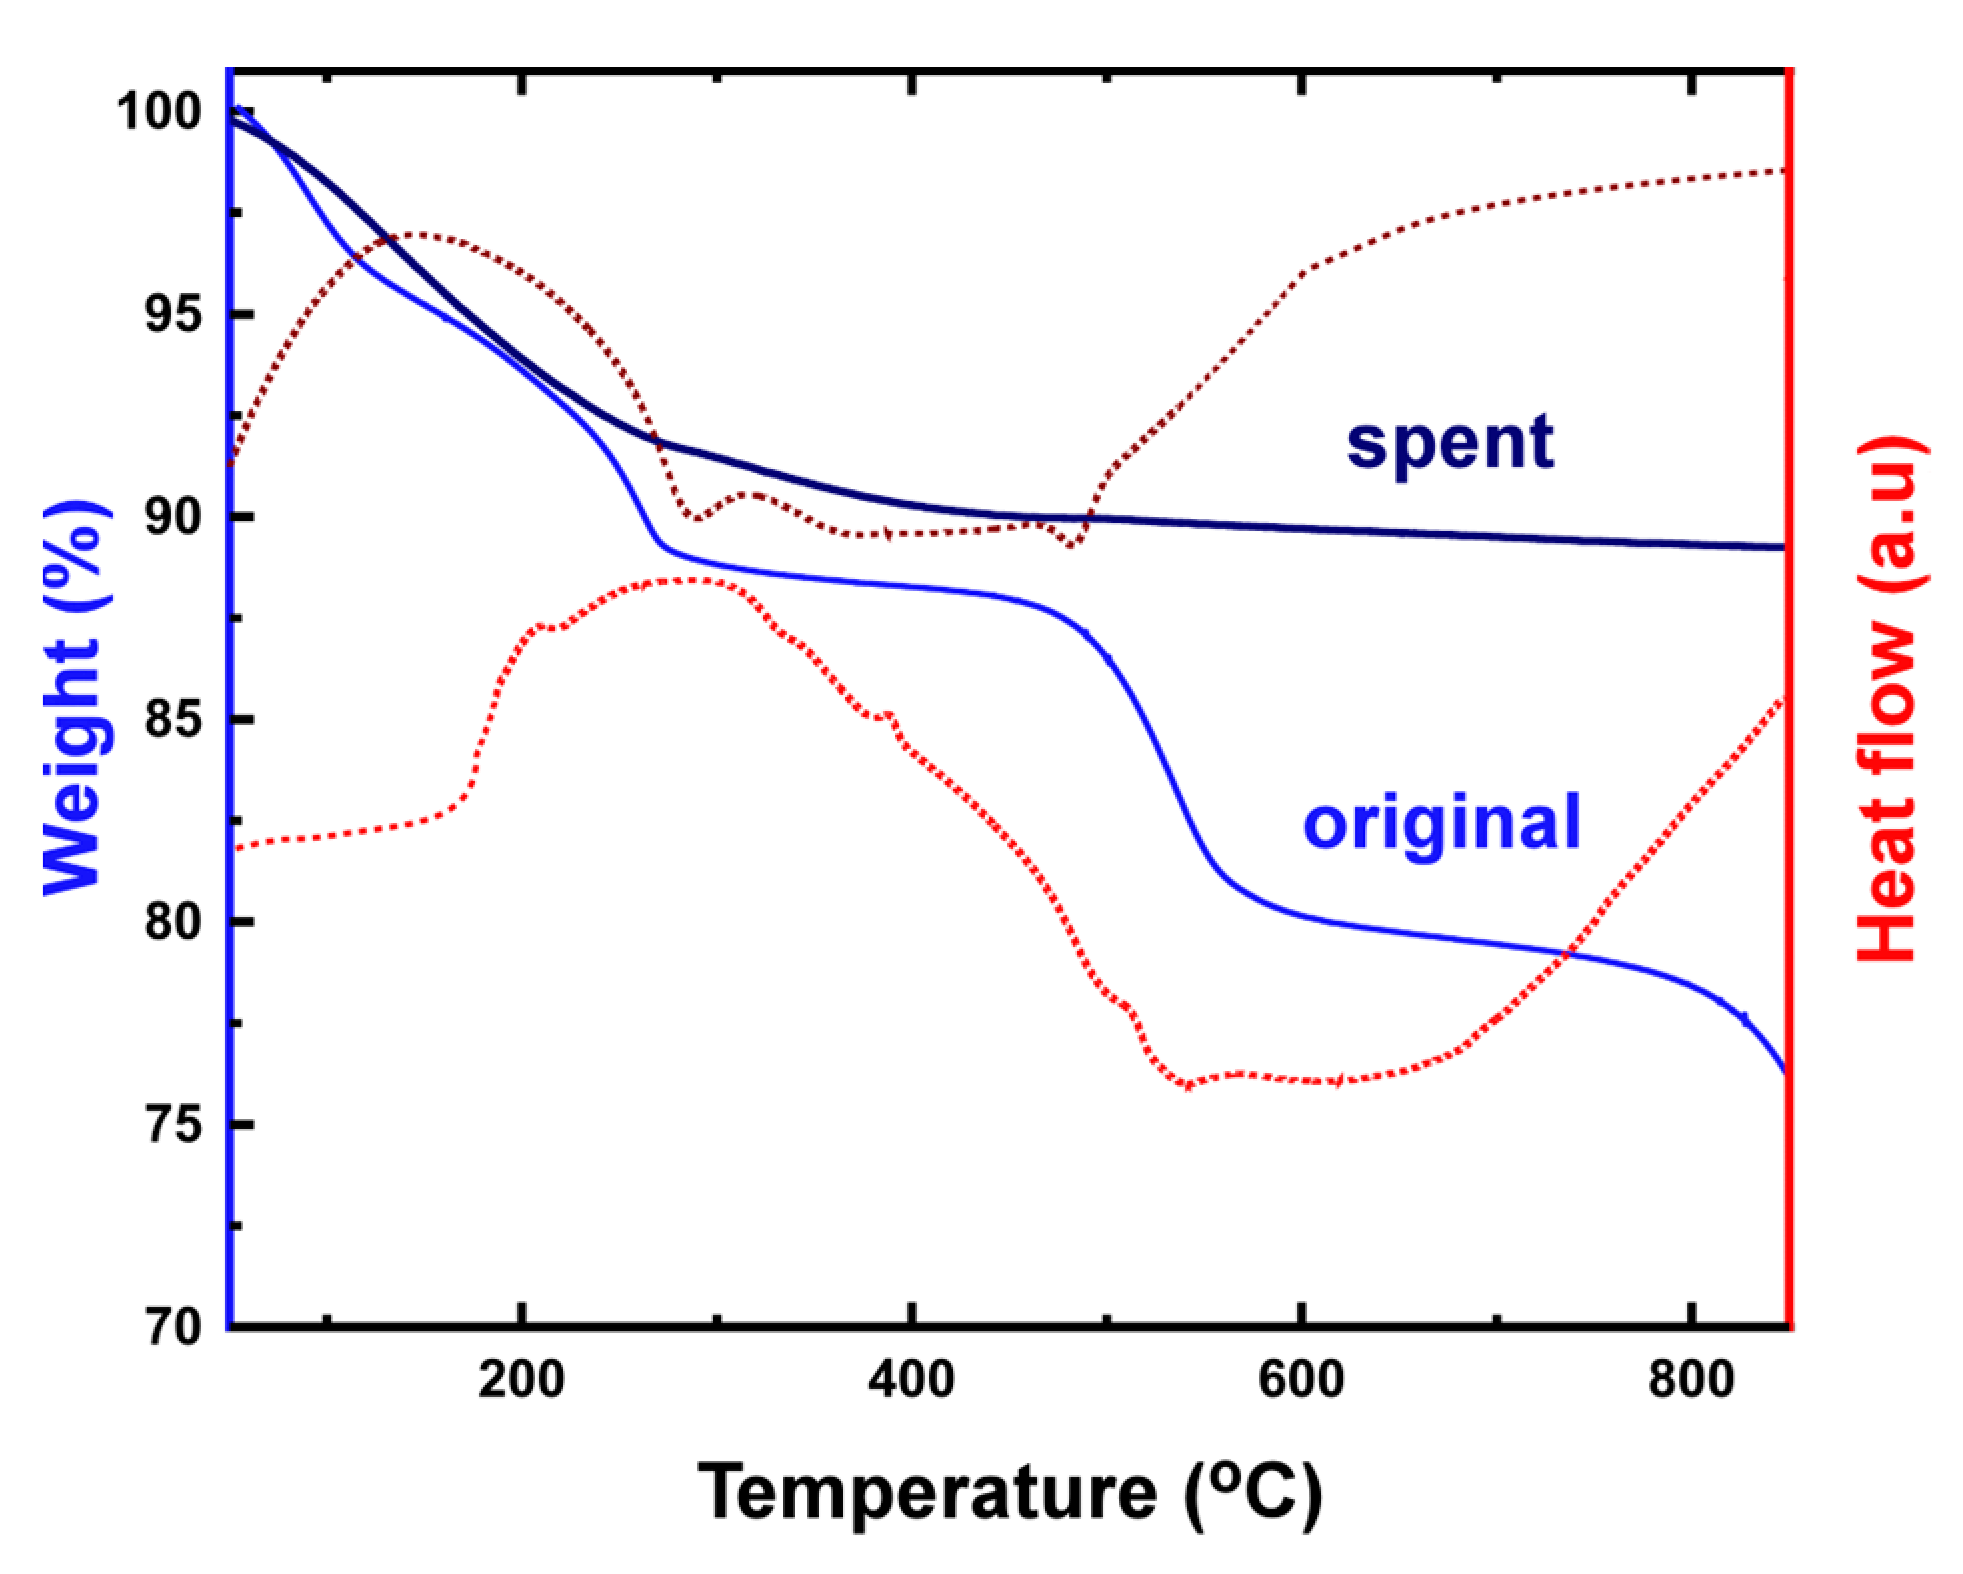
Figure 3 show the corresponding TG-DTA diagrams of the adsorbent before and after its saturation. The TGA curve of original adsorbent indicates that the degradation of Sn6O4(OH)4 with heating is a three-step process. In the first step, up to 100 °C, a weight loss of 2.5% is observed due to the removal of naturally adsorbed water in the material, while a further increase in temperature (100–250 °C) results in the removal of crystalline water. The subsequent significant decrease in the sample’ weight (20%) is due to the dehydration of Sn6O4(OH)4 to the formation of SnO [22].
The first two steps of the sample’s conversion with temperature, corresponding to the removal of naturally adsorbed and crystalline water, can similarly be identified in the TG-DTA diagram of the saturated adsorbent. The weight loss after 250 °C is attributed to dehydration of tin hydroxide [23].
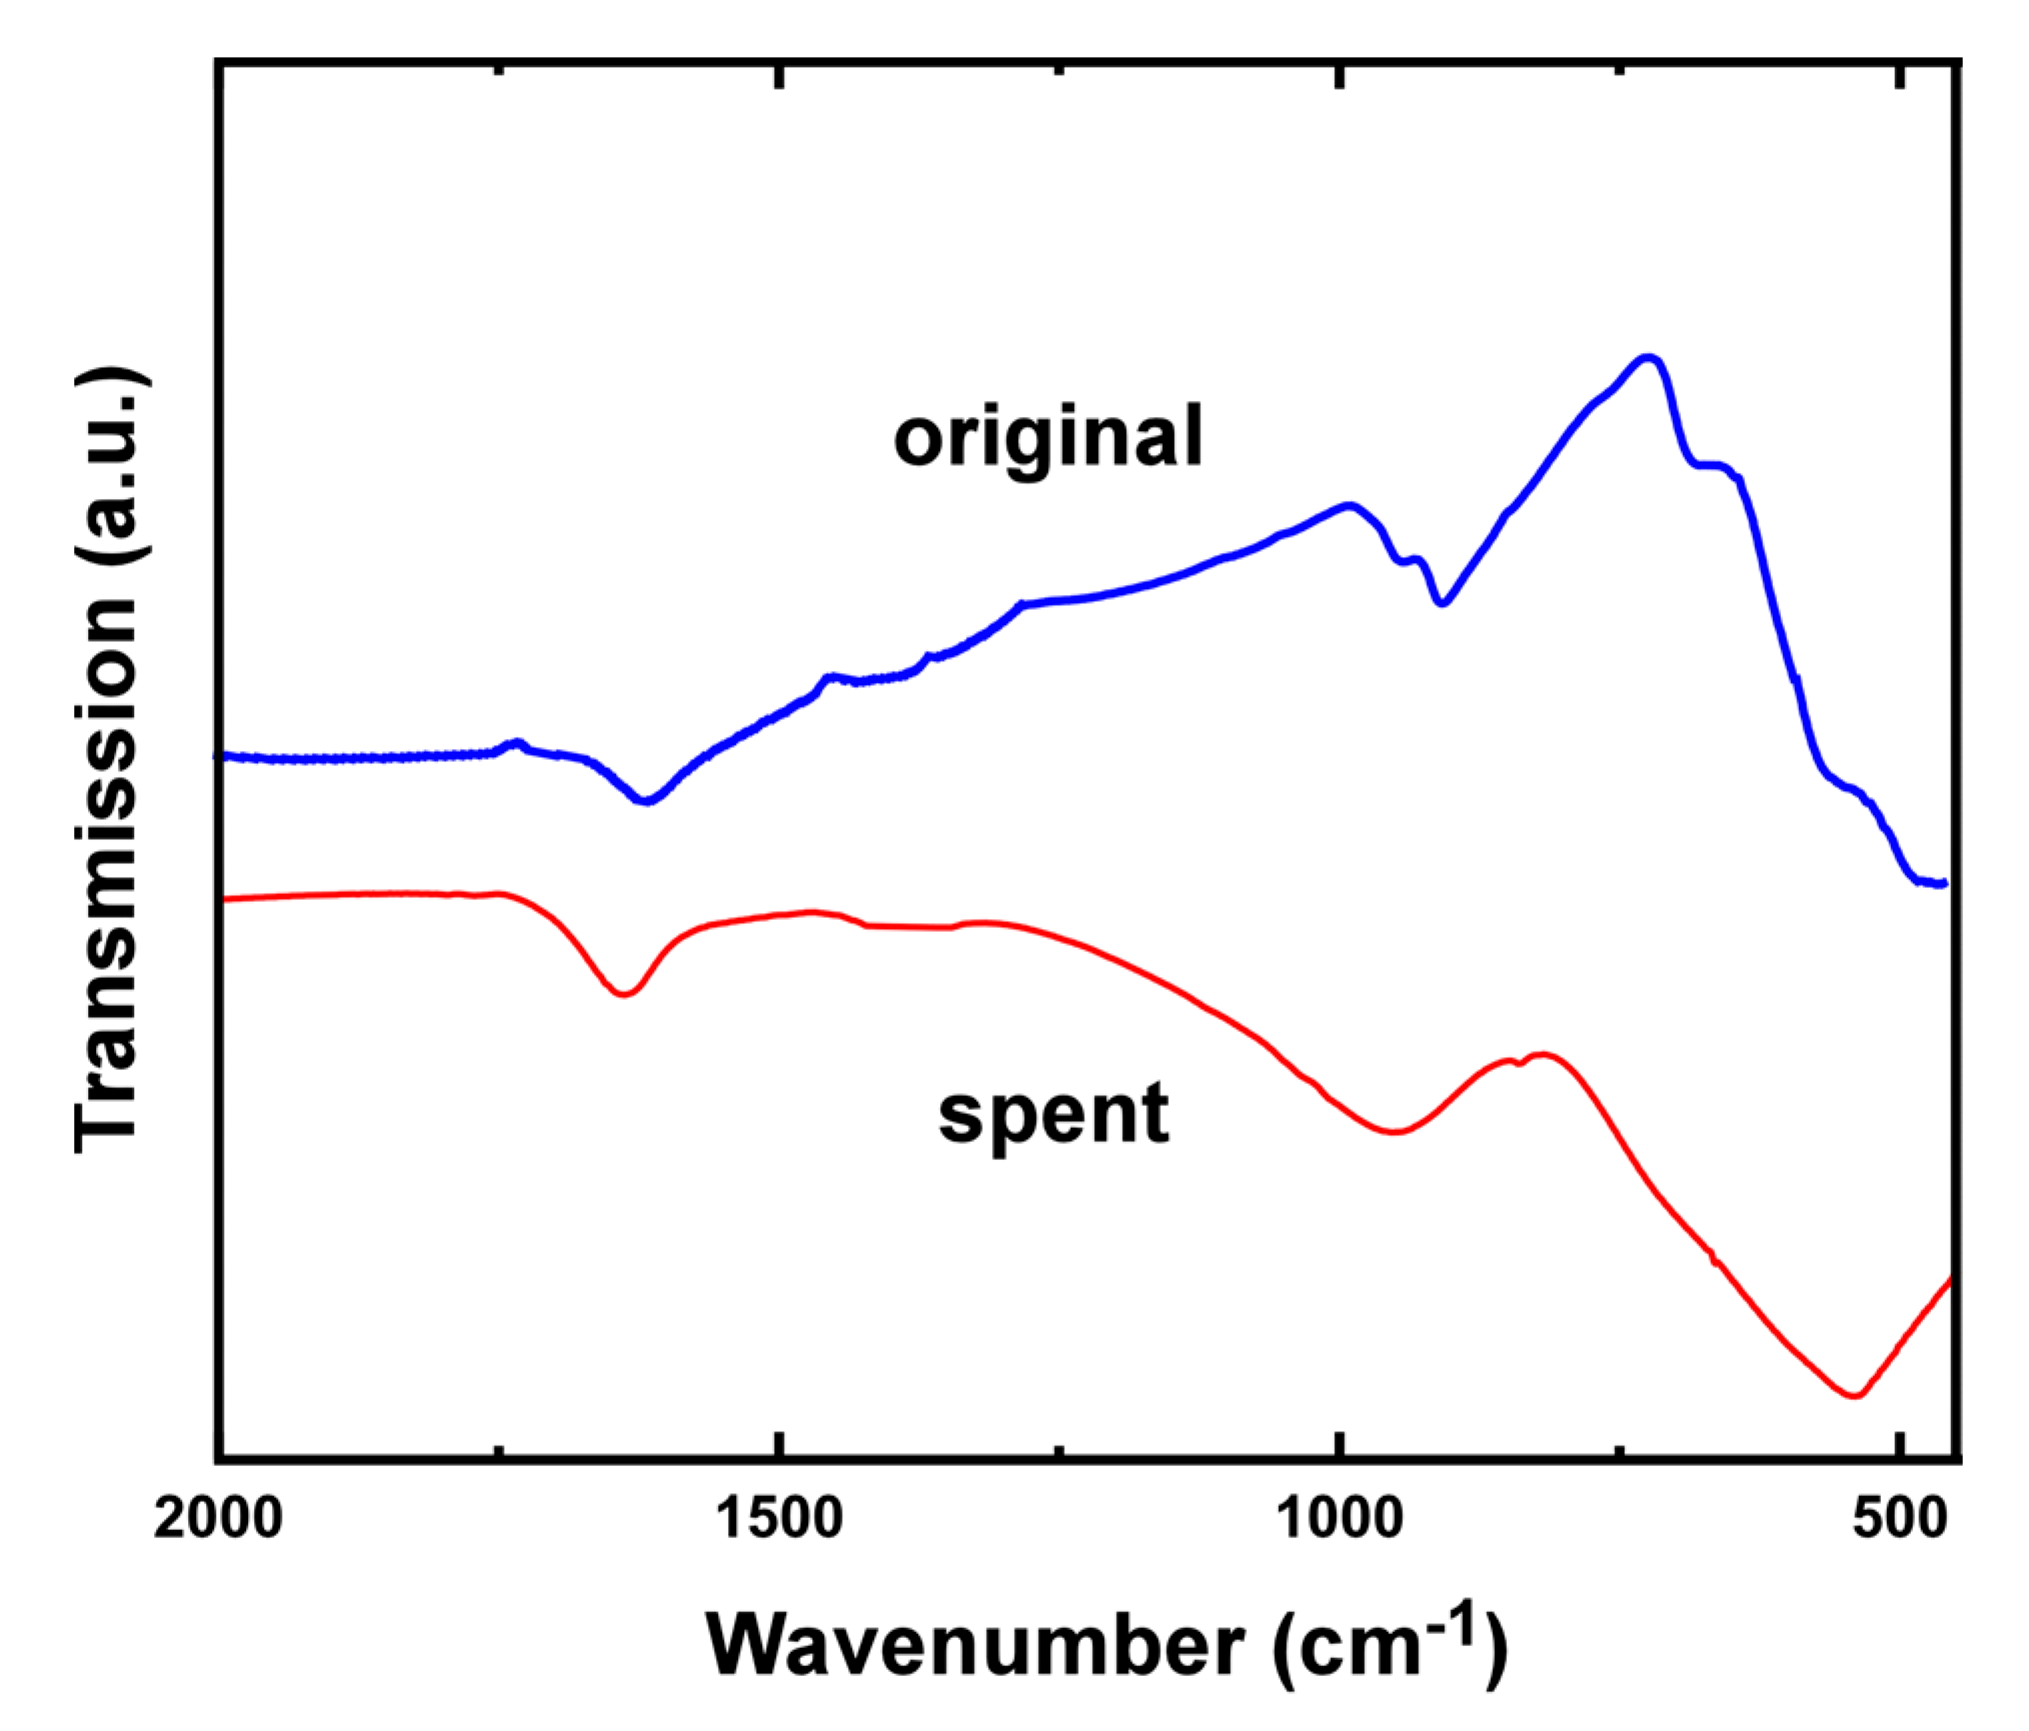
FT-IR transmission patterns of the adsorbent prior to and after its use for Cr(VI) removal are presented in Figure 4. Absorption peaks at 3395 and 1635 cm−1 are originated from the vibration of hydroxyl [24]. In the spectrum of the saturated material, the bands at approximately 950 cm−1 and 550 cm−1 can be attributed to the vibration of the Sn-O and O-Sn-O stretching and bending modes of SnO2, respectively [25].
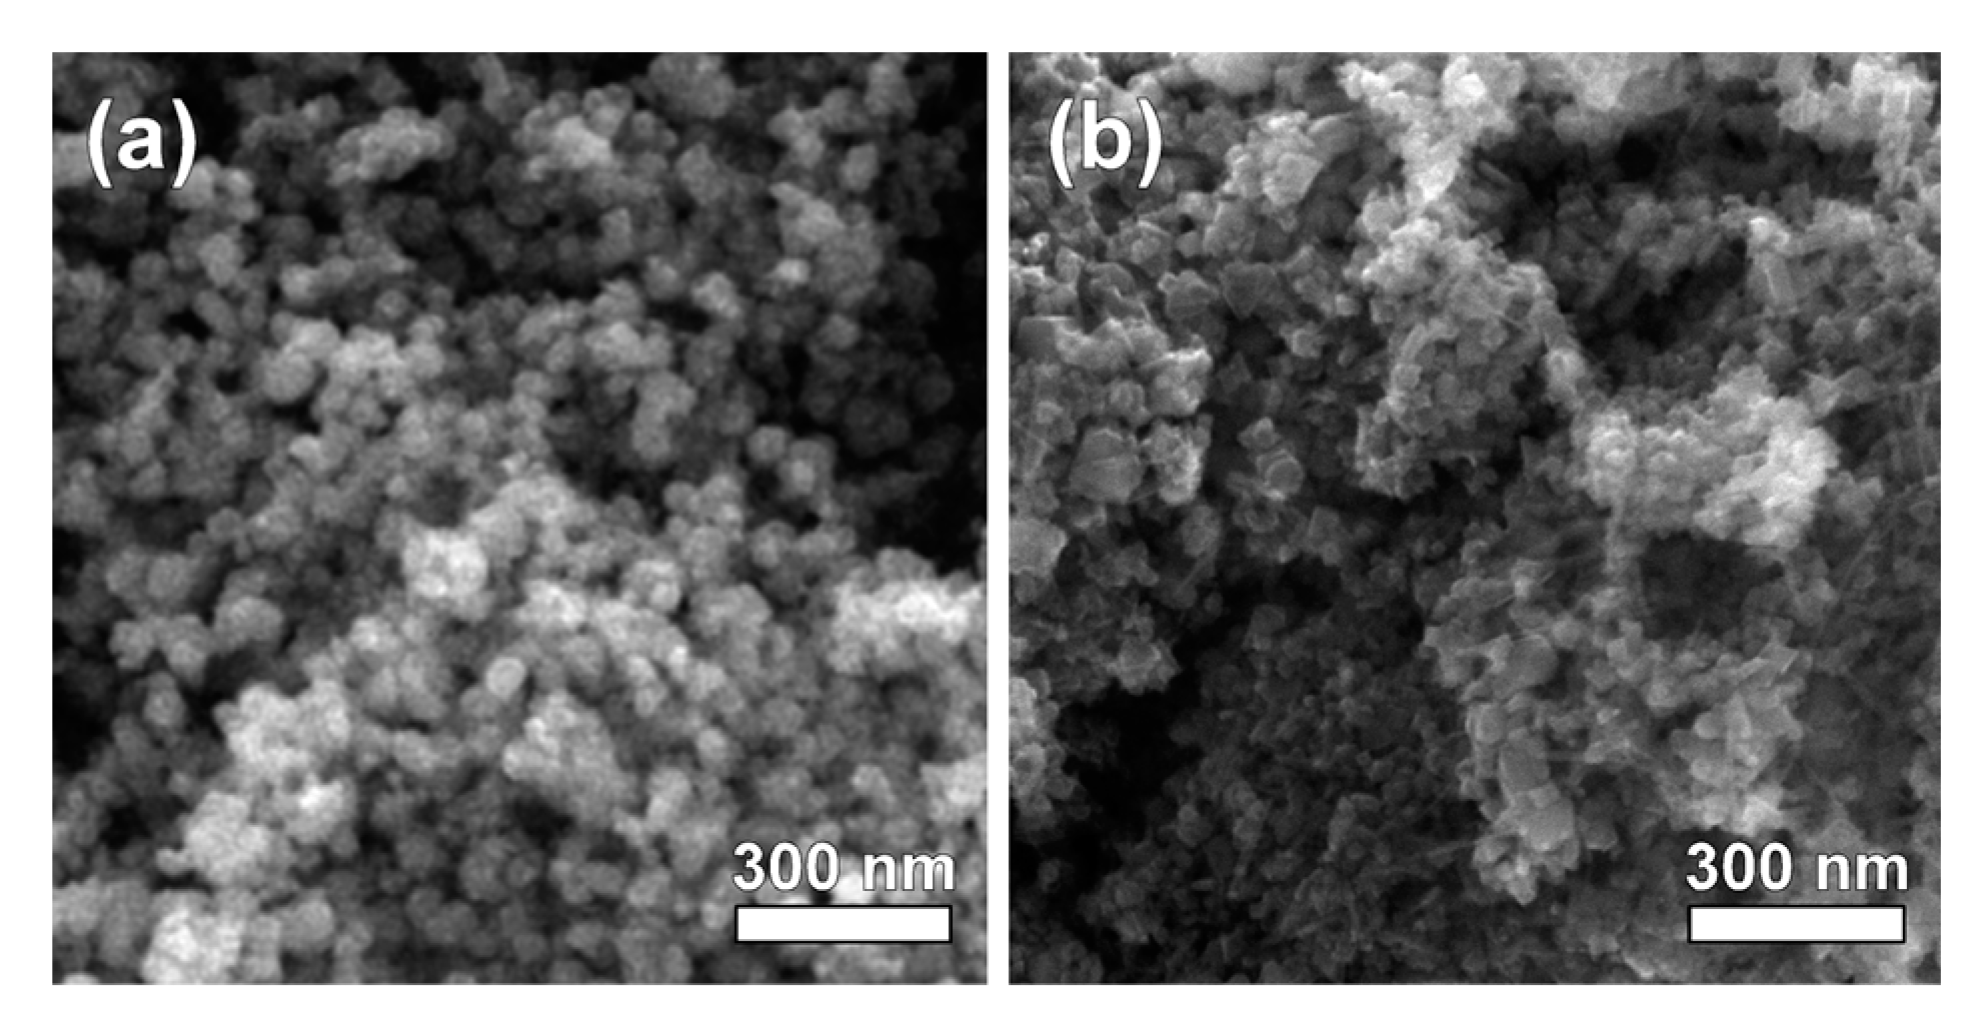
The respective SEM images in Figure 5 provide further information regarding the morphology and size of the material. The original adsorbent, with the hydro-romarchite structure, consists of discernible spherical nanoparticles with a mean diameter of around 30 nm (Figure 5a). The long-term operation of the adsorbent in water treatment affects its morphology, as the image of Figure 5b illustrates. In particular, the initially formed nanoparticles tend to aggregate and form larger structural units, thus gradually decreasing the specific surface area of the material and possibly its effectiveness.
3.2. Selective Separation of Sn from Spent Material and Reconstruction of Adsorbent
3.2.1. Dissolution of Spent Adsorbent
Influence of pH
The effect of pH value on the dissolution of the spent adsorbent was studied for hydrochloric (HCl) and sulfate (H2SO4) acid application. The experimental results are provided at Table 2 and Table 3. The use of HCl for spent adsorbent dissolution led to insignificant dissolution rates of Sn and Cr at least down to the examined pH value of 0.5. The application of H2SO4 provided slightly better results with dissolved Sn and Cr but not exceeding 8% (weight of dissolved Sn for weight of spent material) and 0.7 mg/g (mg of dissolved Cr per g of spent material), respectively, even for a pH value of 0.5 (Table 2). Applying lower concentrations of adsorbent in the dissolution mixture improved the dissolution of Sn and Cr due to the increase of acid-to-solid ratio (Table 3). However, even for the lowest adsorbent’s concentration, the dissolution rate was not sufficient, with dissolved Sn and Cr reaching 9.6% and 1.7 mg/g, respectively (Table 3). Given that the concentrations of Sn and Cr in the spent adsorbent are 70% and 19 mg/g, respectively, it becomes evident that a pH value below 0.5 is required for dissolution optimization.
Influence of Acid Type
The effect of acid type on the dissolution of the spent adsorbent was studied for HCl and H2SO4 at a solid-to-acid ratio (mads/macid, calculated mass ratio of adsorbent to acid) of 1:20 and adsorbent concentration of 10 g/L. The results of the experiments are listed in Table 4. It is observed that, when equal amounts of acids are used, HCl dissolves much greater quantities of Sn and Cr than H2SO4. In particular, about 30% more Sn is dissolved from the spent adsorbent to the mixture, while for Cr, the dissolution is even higher, with the dissolved concentration determined in the liquid mixture for dissolution with HCl being more than 10 times greater than the one determined in the case of H2SO4 use. Thereafter, HCl was concluded as the optimum acid to be applied for the dissolution of the spent adsorbent (Equation (1)):
SnO2 + 4HCl → SnCl4 + 2H2O
Influence of Solid-to-Acid Mass Proportion
From the results of the experiments on the effect of pH on the dissolution of the spent adsorbent (Table 2 and Table 3), it is concluded that much lower pH values are required to optimize the process; that is, the amount of acid used should be significantly increased. To determine the appropriate solid-to-acid ratio for the dissolution of Sn and Cr, a series of experiments was carried out with the addition of different amounts of acid up to the application of a concentrated acid solution. The results of these experiments are presented in Table 5. As anticipated, an increase in the amount of acid used enhanced the dissolution, with the application of concentrated acid leading to dissolution of 46.9% of Sn and 18.6 mg/g of Cr. However, the use of concentrated acid is not recommended, mainly for safety reasons, given that HCl is volatile. Therefore, the optimum solid-to-acid mass proportion was obtained in combination with the dissolution temperature.
Influence of Spent Adsorbent Concentration and Temperature
The effect of spent adsorbent concentration on its solubility was studied for 10 and 20 g/L at three different temperatures (25, 50, and 75 °C). The results of the experiments are available in Table 6. As observed during the study of pH influence on dissolution rate (Table 3), increasing the concentration of the spent adsorbent has a negative effect on its dissolution; i.e., it leads to lower concentrations of dissolved Sn and Cr. That was also the case in all dissolution temperatures examined (Table 6). However, the use of very low concentrations of spent adsorbent results in increased process time and cost. For this reason, 10 g/L was selected as the appropriate solid concentration for the dissolution of spent adsorbent.
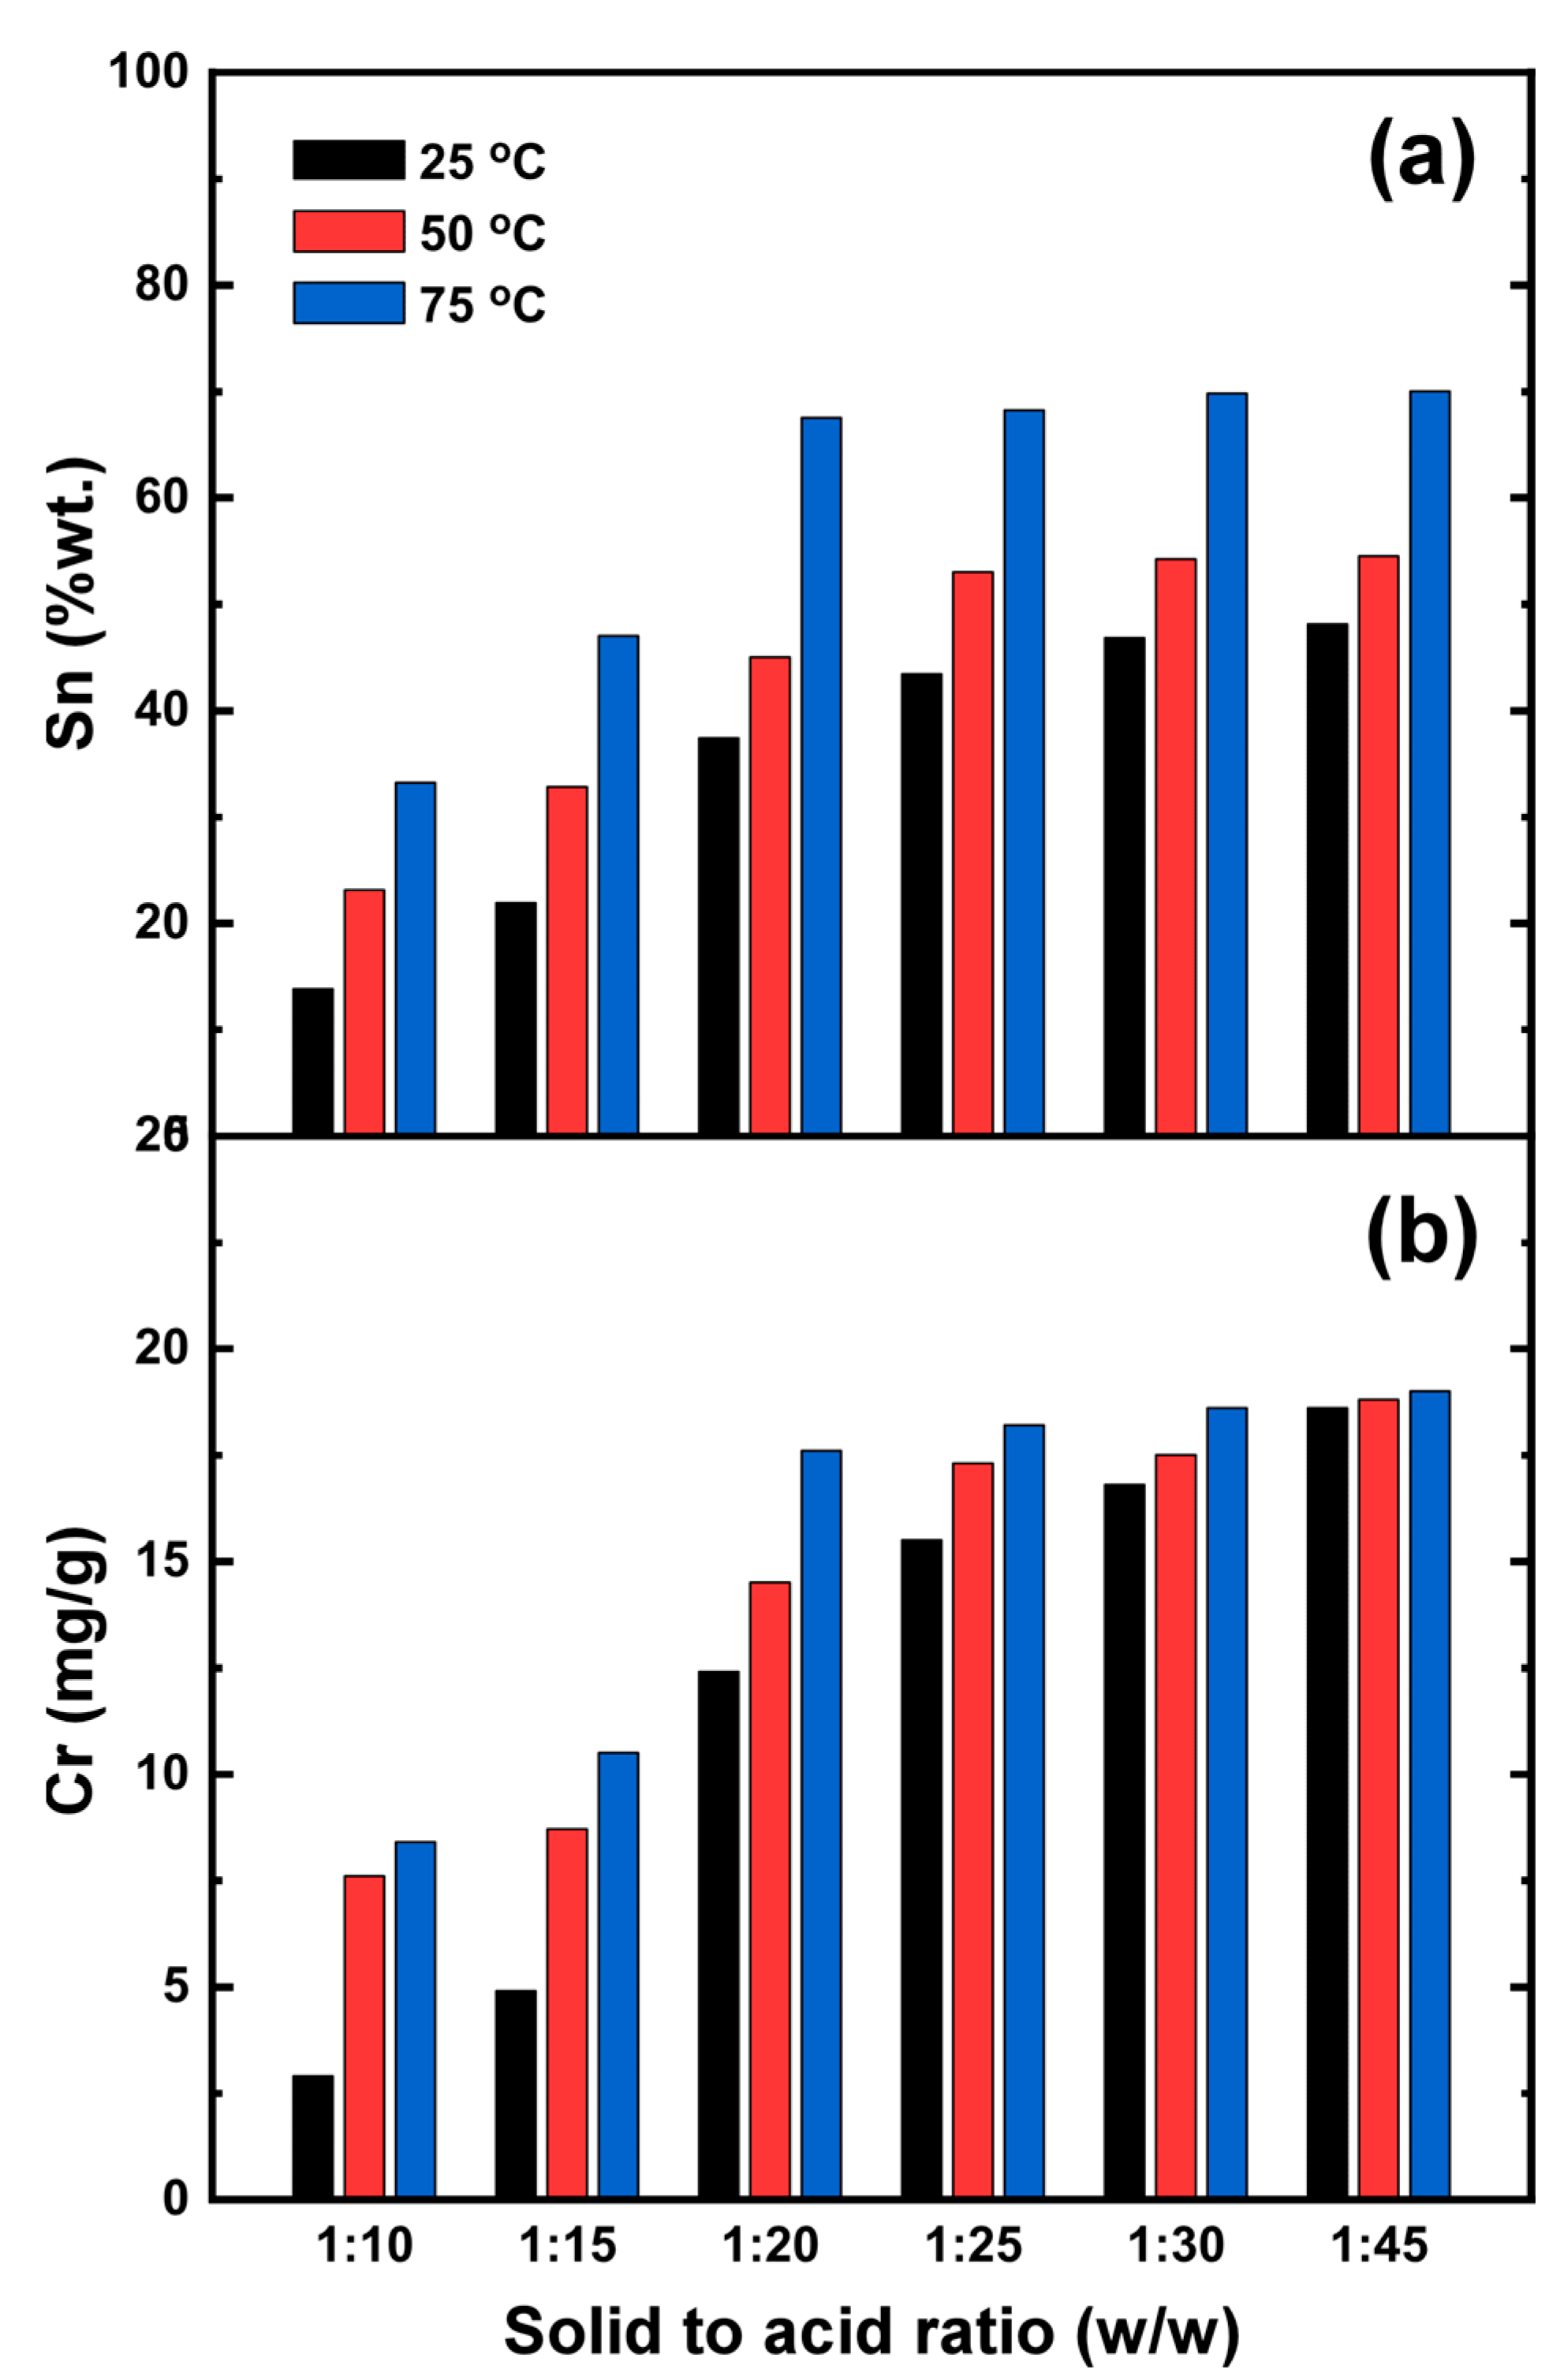
Regarding temperature effect, experimental results verified the enhancement of Sn (Figure 6a) and Cr (Figure 6b) dissolution by increasing temperature and decreasing solid-to-acid mass proportion. At a temperature of 75 °C and for solid-to-acid mass ratios lower than 1:20, dissolved Sn and Cr concentrations did not change significantly, indicating that a 1:20 ratio is adequate for satisfactory dissolution. Dissolution of adsorbent in temperatures higher than 75 °C was not investigated for safety reasons since HCl is volatile. Considering the environmental and economic impact, temperature and solid-to-acid ratio conditions regarded as optimum for dissolution were 75 °C and 1:20 w/w spent adsorbent to acid.
3.2.2. Reduction of Sn(IV) to Sn(II) and Adsorbent Recovery
Influence of Reducing Agent
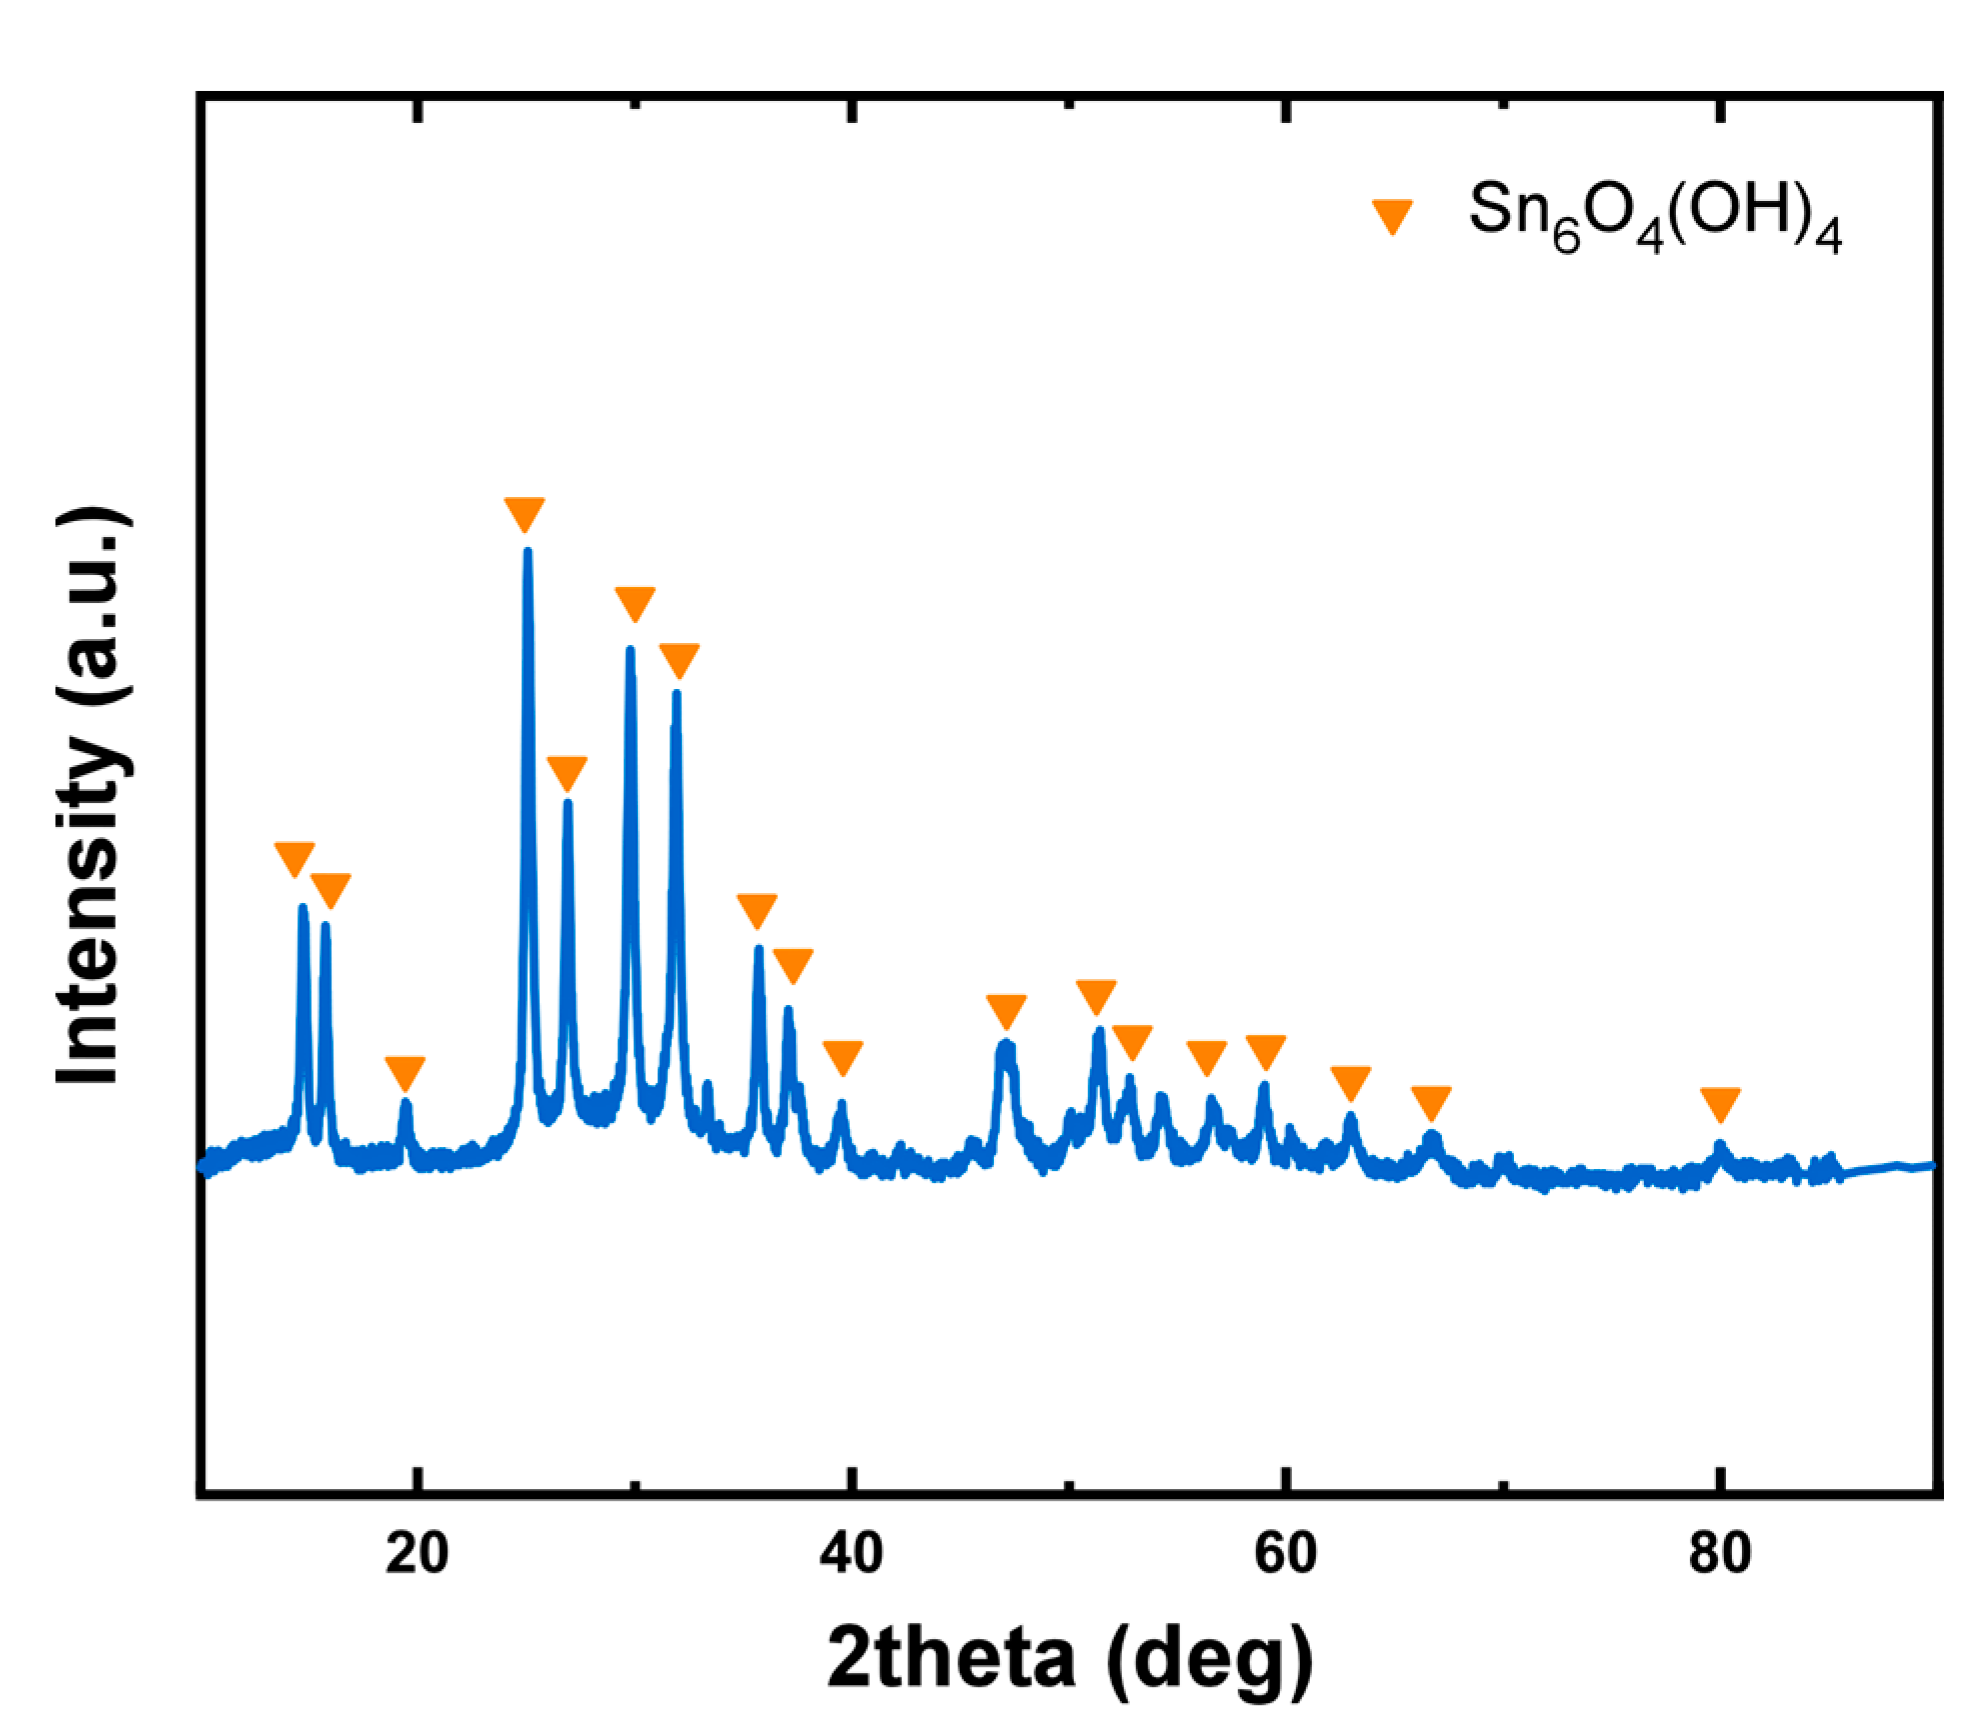
The compounds examined for the reduction of Sn(IV) were NaHSO3, Na2S2O4, Na2S2O5, and Ν2H4∙2HCl. The experimental results are provided in Table 7. The application of NaHSO3, Na2S2O4, and Na2S2O5 resulted in the precipitation of a solid in the first stage of the process, with Cr content 9.9, 11.1, and 15.9 mg/g, respectively, and Sn percentage of 49.6%, 62.6%, and 74.6%, respectively. However, further increase in pH value did not lead to any further precipitation in a following stage even for pH values greater than 7. In other words, the use of these reductants did not result in Cr separation and material recovery. The decrease in the percentage of tin in the solid obtained in the first precipitation phase indicates the adsorption of sulfates in the structure of the solid. On the other hand, when hydrazine (N2H4∙2HCl) was used, two precipitation phases were identified at pH 3 and 7, respectively, while the values of Cr and Sn concentrations, determined in corresponding produced solids, suggested the successful separation of Cr. In particular, the concentration of Cr in the material obtained after the second precipitation step was calculated at only 3 mg/g, while the respective XRD diagram (Figure 7) indicates that the material consists mainly of one phase identical with the original adsorbent, i.e., Sn6O4(OH)4. The reduction (Equation (2)) and following precipitation (Equation (3)) reactions can be described as follows:
N2H4 +Sn4+ → N2 + Sn2+ + 2H2
6Sn2+ + 8OH− → Sn6O4(OH)4 + 4H+
The effect of reducing agent concentration on adsorbent recovery was studied for hydrazine with the addition of 25% and 50% more than that required by the stoichiometric ratio. As suggested by experimental results (Table 8), increasing the amount of the reducing agent leads to an increase in the amount of recovered material (second precipitation stage) and Sn percentage in it. However, an increase is also observed in the concentration of Cr, which indicates that the addition of additional reducing agent does not enhance the separation.
Influence of pH in the First Precipitation Step
The effect of pH in the first precipitation stage was studied in the range of 2.5 to 4 for addition of hydrazine as reducing agent in stoichiometric ratio and in the second precipitation stage at pH 7. Sn and Cr concentrations in solids produced at the two precipitation steps of the reconstruction process are presented in Figure 8 and Table S1 (Supplementary Materials).
As can be noted from the comparison of the two diagrams of Figure 8, the pH value of the first precipitation step mainly affects the properties of the solid obtained in the second stage, specifically the concentration of Cr, which can reach very low values of up to 1.2 mg/g for pH 4. However, as the pH value increases, the amount of material obtained in the second step (Table S1), that is, the amount of material recovered, decreases. For this reason, the value 3 is chosen as the optimal pH value of the first precipitation stage.
Influence of pH in the Second Precipitation Step
The effect of the pH value of the second precipitation stage was studied in the range of 5 to 7 for addition of hydrazine as reducing agent in stoichiometric ratio and for first precipitation step at pH 3. The experimental results are listed in Table 9. As can be observed, the increase of pH value in the second stage does not significantly change the amount and composition of the obtained solid. Nevertheless, to obtain maximum quantity of recovered material, a pH value of 7 was selected for the second precipitation stage.
As mentioned above, to determine the optimum conditions leading to the maximization of the separation efficiency, reduction and stepwise precipitation were studied as a group. From the experimental study on the effect process parameters, it was observed that the conditions that lead to its optimization are the application of hydrazine as a reducing agent and the adjustment of pH to the values 3 and 7 for the first and the second precipitation stages, respectively. However, as indicated from the amounts of solids obtained in the two precipitation stages, although the recovery of the material in the second stage is successful (as evidenced by the characterization results presented in the following section), the amount recovered is not satisfactory. This is also confirmed by the characteristics of the solid obtained in the first stage, i.e., its significantly larger amount, but also the presence of tin in a high concentration (67.1% for the conditions chosen as optimal). The high concentration of tin in the first precipitation stage may be the result of co-precipitation of chromium with tin, possibly in the form of a complex.
3.3. Characterisation of Recovered Adsorbent
Chemical characterization of the recovered adsorbent is presented in Table 10. To evaluate the potential of adsorbent’s recovery, the results are compared to those for the original Sn6O4(OH)4.
As observed from the values of Table 10, the percentage of Sn(II) in the recovered material was determined 66%, i.e., 7% higher than in the original adsorbent. Since the significant effectiveness of Sn6O4(OH)4 in Cr(VI) remediation is mainly due to its increased reducing capacity, it can be assumed that the increase of Sn(II) percentage in the recovered material will result in an increase of its Cr(VI) removal efficiency. The percentage of total tin in the recovered material was calculated 70.4%, while the amount of Cr that remained in its structure was estimated around 3 mg/g.
3.4. Validation of Efficiency
The evaluation of the recovered material as potential Cr(VI) adsorbent was mainly focused on its ability to decrease Cr(VI) concentrations below 25 μg/L. Namely, its adsorption capacity corresponding to a residual Cr(VI) concentration of 25 μg/L, mentioned hereafter as Q25, was used as a criterion for its efficiency and comparison to the corresponding original adsorbent.
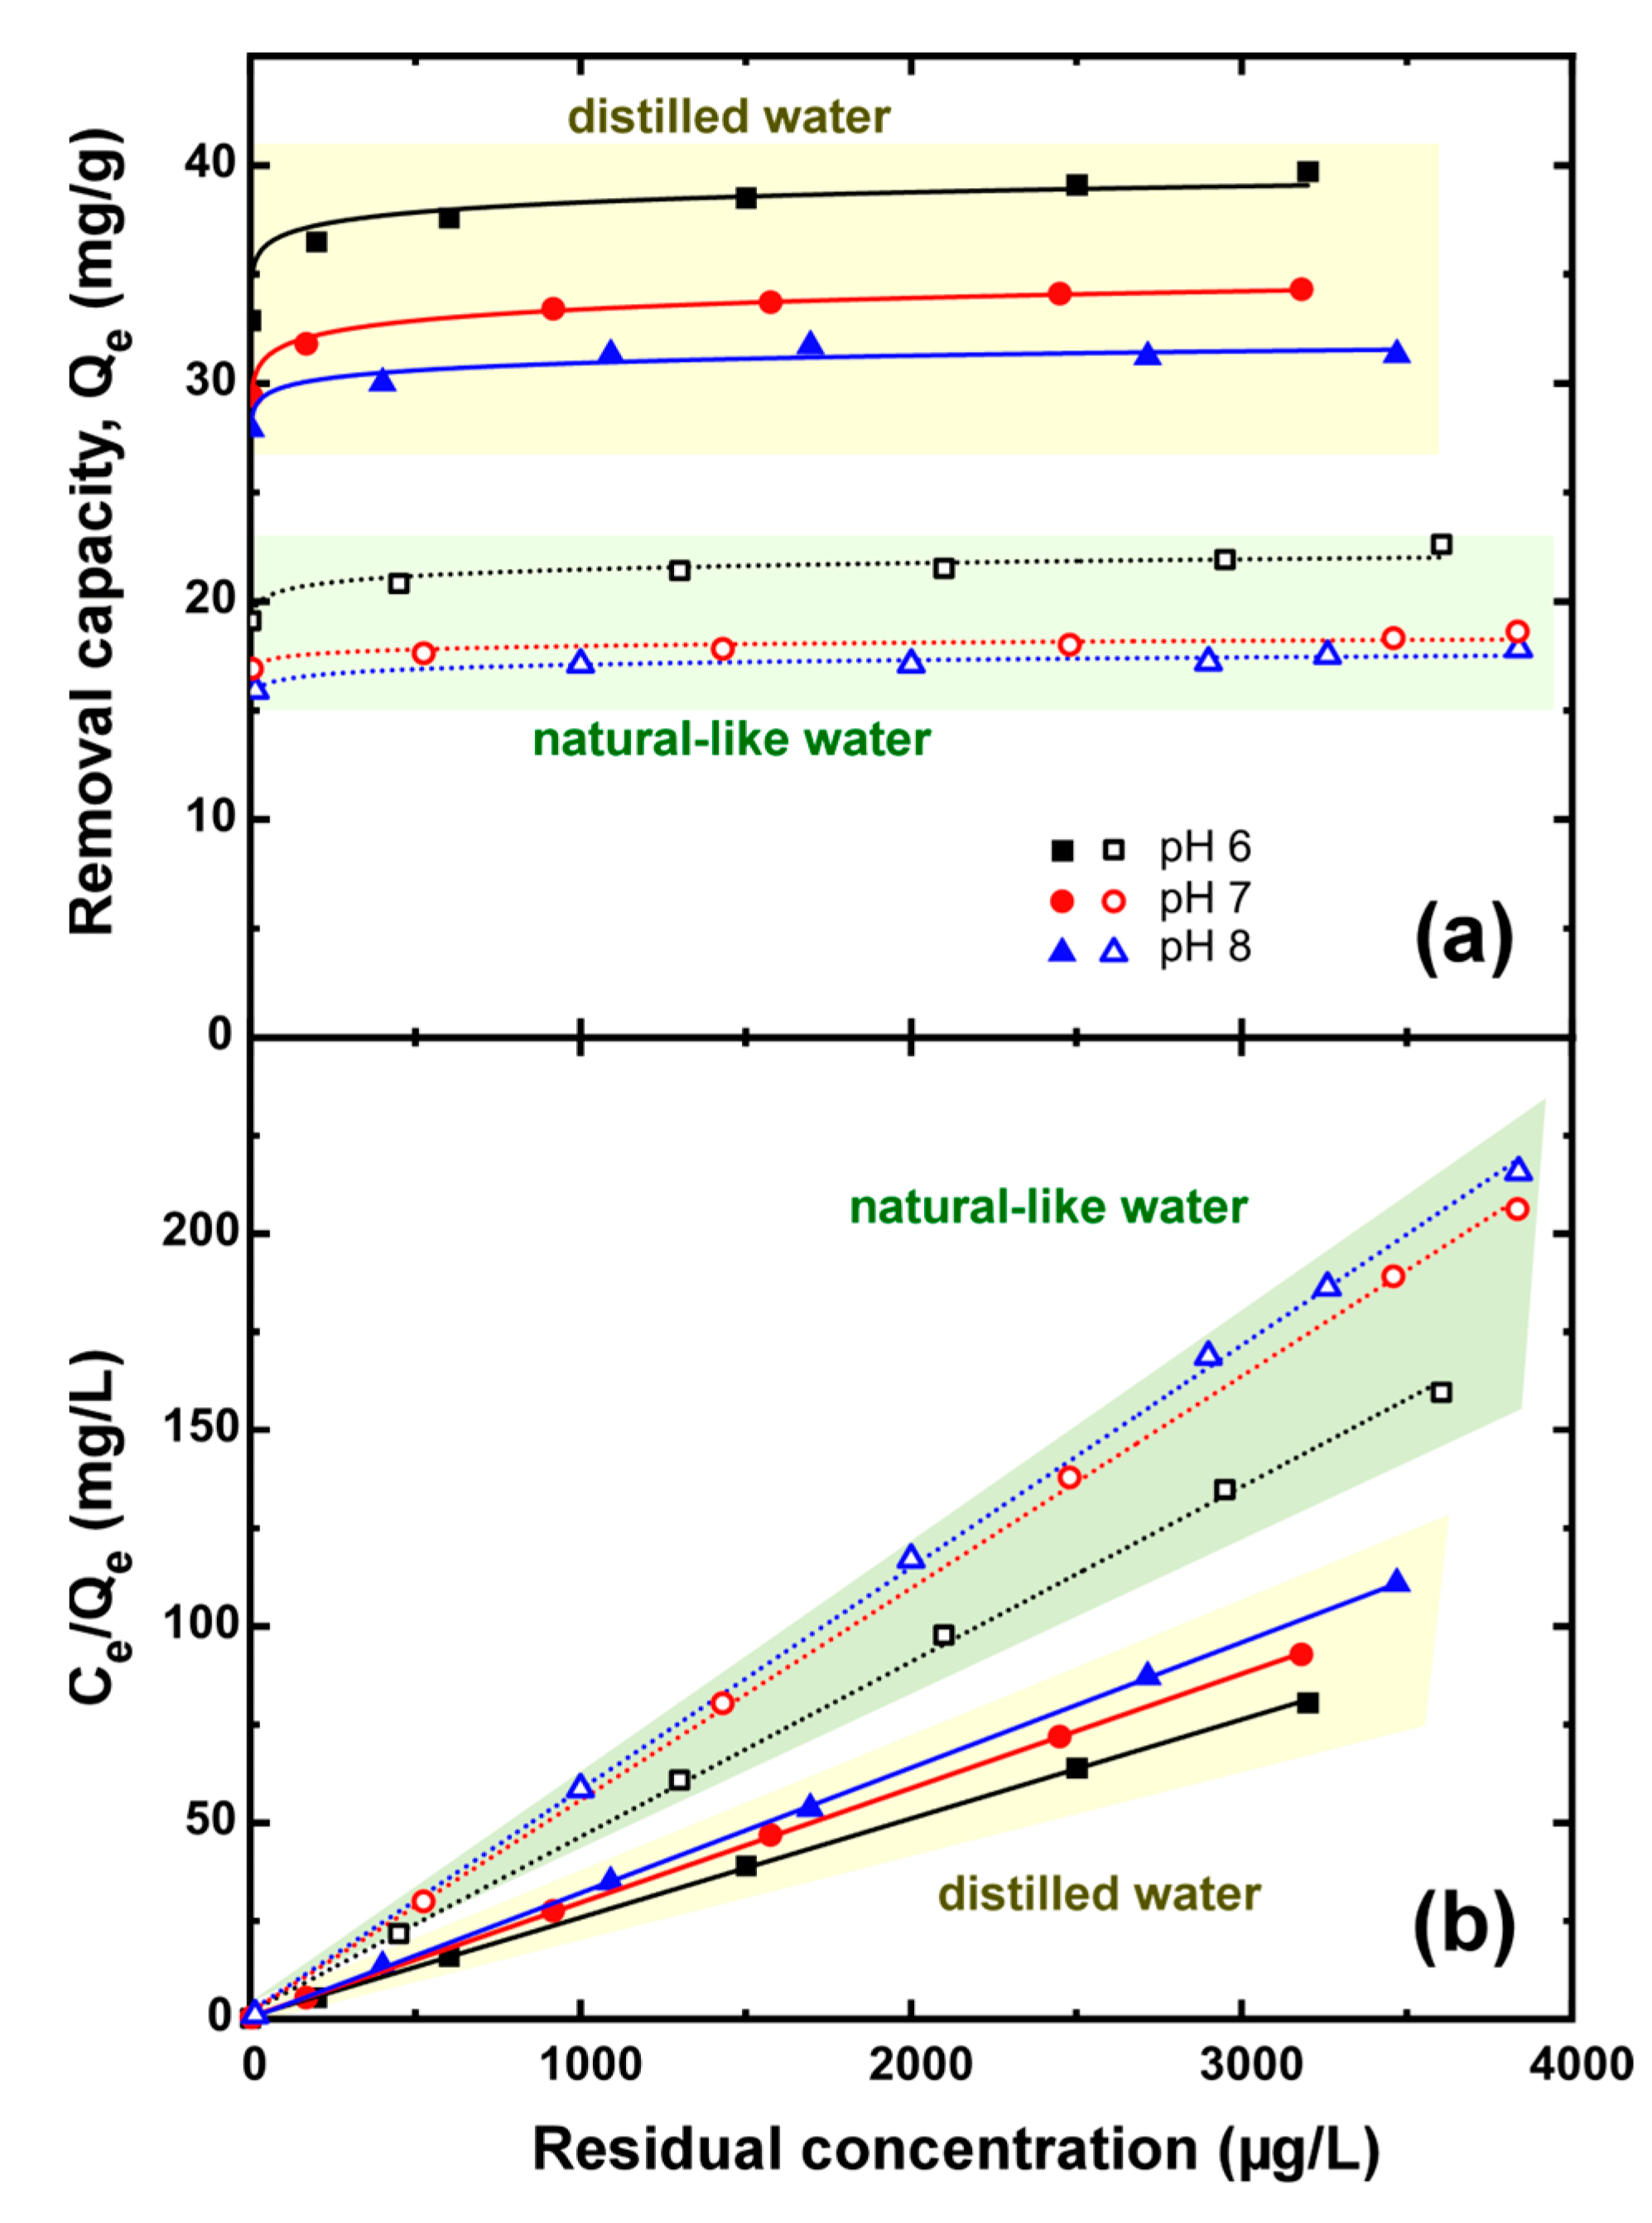
Figure 9 depicts the adsorption isotherms of the recovered material for the removal of Cr(VI) from distilled and natural-like water at 20 °C and equilibrium pH 6–8 adjusted to Freundlich and Langmuir models, respectively.
The high capacity values obtained even when the residual Cr(VI) concentration values were found close to zero are indicative of the in situ quantitative reduction of Cr(VI) to Cr(III) species, which are subsequently adsorbed on the Sn(II) oxy-hydroxide surface. The obtained data were better fitted by a Langmuir-type equation [26]. The corresponding fitting parameters for Freundlich and Langmuir models are presented in Tables S2 and S3, respectively.
Experimental results showed that the ability of recovered Sn6O4(OH)4 to remove Cr(VI) from its solutions in distilled water increases with decreasing pH (Figure 9a), as has also been observed for the corresponding original Sn6O4(OH)4 [12]. However, this phenomenon becomes less pronounced in the case of experiments in natural-like water, where the performance of the material at pH 7 and 8 is approximately the same, with the adsorption capacity of the material at a residual Cr(VI) concentration of 25 μg/L reaching the values of Q25 = 17.1 mg/g and Q25 = 16 mg/g, respectively. This is in contrast with most materials tested in the literature for Cr(VI) removal, which present a significant loss of their effectiveness as the solution pH value increases towards weakly alkaline environments [27]. Taking into consideration that a typical natural Cr(VI)-polluted water presents a pH value greater than 7.5 [28], recovered material application in a full-scale system will not require pH adjustment, thereby avoiding the addition of chemical reagents that is expected to increase operating costs and, most importantly, change water quality.
It is also important to note that the process is significantly affected by the presence of other co-existing interfering constituents of natural-like water. Adsorbent’s removal capacity at 25 μg for distilled water experiments at pH 7 is 30.7 mg/g, while the corresponding value for NSF water experiments falls to 17.1 mg/g (Table S2).
Comparison of Cr(VI) adsorption isotherms obtained from the recovered material with those of the original adsorbent [12] indicates a significant improvement in Cr(VI) removal efficiency, with Q25 value increasing from 19.9 mg/g to 30.7 mg/g for Cr(VI) treatment in distilled water and pH 7. This increase is consistent with the increased percentage of Sn(II) in the recovered material compared to the original (Table 10), and it can be attributed to the addition of the reducing agent during the reconstruction process. Furthermore, the shape of the sorption isotherms indicates that the contribution of the reducing capacity of the material to its overall performance is critical, as the “sorption” capacity does not change substantially with increasing residual concentration.
4. Conclusions
This study aimed to establish a non-conventional way of approaching adsorption processes for water purification by designing an infinite operation cycle for the adsorbent according to the principles of circular economy and green chemistry. For this purpose, the recovery of a material consisting of Sn6O4(OH)4, used for the removal of Cr(VI) from drinking water, was investigated. The examined approach included multiple steps of material acid dissolution, ions reduction, and precipitation, which were separately optimized and then unified to produce the reconstructed adsorbent. The material obtained from this recovery process was evaluated for Cr(VI) remediation, presenting significantly high removal capacity even compared to the original adsorbent.
However, the adoption of recovery processes to advance circular economy and promote green chemistry is an emerging scientific concept yet to be fully discovered. Alternative approaches may include the reuse of the saturated adsorbent through a process of dissolution, reduction, and precipitation in one step, without chromium separation or separation of chromium in its hexavalent form, which is much more soluble. The latter could be achieved by oxidation of chromium in an alkaline environment using an oxidizing agent, such as O3 or H2O2, and subsequent dissolution, reduction, and recovery of the material.
In any case, before implementing any process on a large scale, its environmental and economic footprint should be evaluated.
Supplementary Materials
The following supporting information can be downloaded at: https://www.mdpi.com/article/10.3390/w15010097/s1, Table S1. Sn and Cr concentration in solids produced at reconstruction process in relation to 1st precipitation step pH (reductant: Ν2H4∙2HCl, pH2: 7); Table S2. Parameters of Freundlich fitting on Cr(VI) adsorption isotherms in distilled and natural-like water at 20 °C and equilibrium pH 6–8 for the recovered adsorbent; Table S3. Parameters of Langmuir fitting on Cr(VI) adsorption isotherms in distilled and natural-like water at 20 °C and equilibrium pH 6–8 for the recovered adsorbent.
Author Contributions
Conceptualization, M.M., K.S. and E.K.; data curation, E.K.; formal analysis, E.K.; funding acquisition and investigation, E.D. and E.K.; methodology, M.M. and E.K.; project administration, E.K.; resources, M.M.; supervision, M.M.; validation, E.D. and E.K.; visualization, E.K.; writing—original draft, K.S. and E.K.; writing—review and editing, E.K. and M.M. All authors have read and agreed to the published version of the manuscript.
Funding
This research is co-financed by Greece and the European Union (European Social Fund- ESF) through the Operational Programme “Human Resources Development, Education and Lifelong Learning” in the context of the project “Reinforcement of Postdoctoral Researchers—2nd Cycle” (MIS-5033021), implemented by the State Scholarships Foundation (IKΥ).
Conflicts of Interest
The authors declare no conflict of interest.
References
- Stahel, W.R. The circular economy. Nature 2016, 531, 435–438. [Google Scholar] [CrossRef] [PubMed] [Green Version]
- Zink, T.; Geyer, R. Circular Economy Rebound. J. Ind. Ecol. 2017, 21, 593–602. [Google Scholar] [CrossRef]
- Kalaitzidou, K.; Mitrakas, M.; Raptopoulou, C.; Tolkou, A.; Palasantza, P.A.; Zouboulis, A. Pilot-Scale Phosphate Recovery from Secondary Wastewater Effluents. Environ. Process 2016, 3, 5–22. [Google Scholar] [CrossRef]
- Geng, Y.; Fu, J.; Sarkis, J.; Xue, B. Towards a national circular economy indicator system in China: An evaluation and critical analysis. J. Clean. Prod. 2012, 23, 216–224. [Google Scholar] [CrossRef]
- Richards, G.; Lénia, M.; Mein, K.; Marques, L.; Mein, K. Summary for policymakers. In Climate Change 2013—The Physical Science Basis: Contribution of Working Group I to the Fifth Assessment Report of the Intergovernmental Panel on Climate Change (Climate Change 2013—The Physical Science Basis); Stocker, T.F., Qin, D., Plattner, G.-K., Tignor, M., Allen, S.K., Boschung, J., Nauels, A., Xia, Y., Bex, V., Midgley, P.M., Eds.; Cambridge University Press/UNEP: Cambridge, UK, 2015. [Google Scholar] [CrossRef]
- Closing the Loop—An EU Action Plan for the Circular Economy. Communication from the Commission to the European Parliament, the Council, the European Economic and Social Committee and the Committee of the Regions. European Commission Brussels, 2.12.2015. COM(2015) 614 Final. Available online: https://eur-lex.europa.eu/legal-content/EN/TXT/?uri=CELEX%3A52015DC0614 (accessed on 14 December 2022).
- Brown, M.T.; Buranakarn, V. Energy indices and ratios for sustainable material cycles and recycle options. Resour. Conserv. Recycl. 2003, 38, 1–22. [Google Scholar] [CrossRef]
- US Geological Survey. U.S. Volume of Tin Recycled from Scrap between 2010 and 2021 (in 1000 Metric Tons). Statista. Statista Inc., 2022. Available online: https://www.statista.com/statistics/209387/recycled-volume-of-tin-in-the-us/ (accessed on 14 December 2022).
- European Academies’ Science Advisory Council. Indicators for a Circular Economy; EASAC Policy Report 30; German National Academy of Sciences: Halle (Saale), Germany, 2008; Available online: https://easac.eu/fileadmin/PDF_s/reports_statements/Circular_Economy/EASAC_Indicators_web_complete.pdf (accessed on 14 December 2022).
- Britton, S.C. Tin and Tin Alloys. In Corrosion, 3rd ed.; Butterworth-Heinemann: Oxford, UK, 2013; pp. 4:157–4:167. [Google Scholar]
- Davies, A.G.; Gielen, M.; Pannell, K.H.; Tiekink, E.R.T. Tin Chemistry: Fundamentals, Frontiers, and Applications, 1st ed.; Wiley: Hoboken, NJ, USA, 2008; Available online: https://onlinelibrary.wiley.com/doi/book/10.1002/9780470758090 (accessed on 14 December 2022).
- Kaprara, E.; Tziarou, N.; Kalaitzidou, K.; Simeonidis, K.; Balcells, L.; Pannunzio, E.V.; Zouboulis, A.; Mitrakas, M. The use of Sn(II) oxy-hydroxides for the effective removal of Cr(VI) from water: Optimization of synthesis parameters. Sci. Total Environ. 2017, 605–606, 190–198. [Google Scholar] [CrossRef]
- Pinakidou, F.; Kaprara, E.; Katsikini, M.; Paloura, E.C.; Simeonidis, K.; Mitrakas, M. Sn(II) oxy-hydroxides as potential adsorbents for Cr(VI)-uptake from drinking water: An X-ray absorption study. Sci. Total Environ. 2016, 551–552, 246–253. [Google Scholar] [CrossRef]
- Directive (EU) 2020/2184 of the European Parliament and of the Council of 16 December 2020 on the quality of water intended for human consumption (recast) (Text with EEA relevance). Off. J. Eur. Union 2020, 63, L 435.
- Mitrakas, M.; Kaprara, E.; Symeonidis, K. A Method for the Synthesis of a Bivalent Tin Oxyhydroxide for the Removal of Hexavalent Chromium from Drinking Water. WO 2017109521 A1, 29 June 2017. Applicant: Aristotle University of Thessaloniki. Available online: https://patentimages.storage.googleapis.com/48/0c/2b/3abc1a96705245/WO2017109521A1.pdf (accessed on 14 December 2022).
- Tresintsi, S.; Simeonidis, K.; Estradé, S.; Martinez-Boubeta, C.; Vourlias, G.; Pinakidou, F.; Katsikini, M.; Paloura, E.C.; Stavropoulos, G.; Mitrakas, M. Tetravalent manganese feroxyhyte: A novel nanoadsorbent equally selective for As(III) and As(V) removal from drinking water. Environ. Sci. Technol. 2013, 47, 9699–9705. [Google Scholar] [CrossRef]
- Simeonidis, K.; Martinez-Boubeta, C.; Rivera-Gil, P.; Ashraf, S.; Samaras, T.; Angelakeris, M.; Tresintsi, S.; Mitrakas, M.; Parak, W.J.; Monty, C.; et al. Regeneration of arsenic spent adsorbents by Fe/MgO nanoparticles. J. Chem. Technol. Biotechnol. 2017, 92, 1876–1883. [Google Scholar] [CrossRef]
- Ben Salem, Z.; Capelli, N.; Grisey, E.; Baurand, P.E.; Ayadi, H.; Aleya, L. First evidence of fish genotoxicity induced by heavy metals from landfill leachates: The advantage of using the RAPD-PCR technique. Ecotoxicol. Environ. Saf. 2014, 101, 90–96. [Google Scholar] [CrossRef] [PubMed]
- Saiz, J.; Bringas, E.; Ortiz, I. New functionalized magnetic materials for As5+ removal: Adsorbent regeneration and reuse. Ind. Eng. Chem. Res. 2014, 53, 18928–18934. [Google Scholar] [CrossRef]
- Tresintsi, S.; Simeonidis, K.; Katsikini, M.; Paloura, E.C.; Bantsis, G.; Mitrakas, M. A novel approach for arsenic adsorbents regeneration using MgO. J. Hazard. Mater. 2014, 265, 217–225. [Google Scholar] [CrossRef] [PubMed] [Green Version]
- Thoburn, J.T. The tin industry since the collapse of the International Tin Agreement. Resour. Policy 1994, 20, 125–133. [Google Scholar] [CrossRef]
- Okamura, K.; Nasr, B.; Brand, R.; Hahn, H. Solution-processed oxide semiconductor SnO p-channel thin-film transistors. J. Mater. Chem. 2012, 22, 4607–4610. [Google Scholar] [CrossRef]
- Nemeth, J.; Dekany, I.; Suvegh, K.; Marek, T.; Klencsar, Z.; Vertes, A.; Fendler, J. Preparation and structural properties of tin oxide-montmorillonite nanocomposites. Langmuir 2003, 19, 3762–3769. [Google Scholar] [CrossRef]
- Shi, L.; Lin, H. Facile fabrication and optical property of hollow SnO2 spheres and their application in water treatment. Langmuir 2010, 26, 18718–18722. [Google Scholar] [CrossRef]
- Elci, A.; Demirtas, O.; Ozturk, I.M.; Bek, A.; Esenturk, E.N. Synthesis of tin oxide-coated gold nanostars and evaluation of their surface-enhanced Raman scattering activities. J. Mater. Sci. 2018, 53, 16345–16356. [Google Scholar] [CrossRef]
- Langmuir, I. The constitution and fundamental properties of solids and liquids. J. Am. Chem. Soc. 1916, 38, 2221–2295. [Google Scholar] [CrossRef] [Green Version]
- Barrera-Díaz, C.E.; Lugo-lugo, V.; Bilyeu, B. A review of chemical, electrochemical and biological methods for aqueous Cr(VI) reduction. J. Hazard. Mater. 2012, 223–224, 1–12. [Google Scholar] [CrossRef]
- Kaprara, E.; Kazakis, N.; Simeonidis, K.; Coles, S.; Zouboulis, A.I.; Samaras, P.; Mitrakas, M. Occurrence of Cr(VI) in drinking water of Greece and relation to the geological background. J. Hazard. Mater. 2015, 281, 2–11. [Google Scholar] [CrossRef]
Figure 1.
Experimental setup for the reconstruction of adsorbent Sn6O4(OH)4.

Figure 2.
XRD diagrams of spent and corresponding original adsorbent.

Figure 3.
TG-DTA curves of spent and corresponding original adsorbent.

Figure 4.
FT-IR spectra of spent and corresponding original adsorbent.

Figure 5.
SEM images of original (a) and spent (b) adsorbent.

Figure 6.
Influence of solid-to-acid mass proportion on Sn (a) and Cr (b) dissolution at different temperatures (Cads: 10 g/L, acid: HCl, t = 30 min).
Figure 6.
Influence of solid-to-acid mass proportion on Sn (a) and Cr (b) dissolution at different temperatures (Cads: 10 g/L, acid: HCl, t = 30 min).

Figure 7.
XRD diagram of recovered adsorbent.

Figure 8.
Influence of pH in the 1st precipitation step (pH1) to the Sn and Cr content in solids produced at reconstruction process.
Figure 8.
Influence of pH in the 1st precipitation step (pH1) to the Sn and Cr content in solids produced at reconstruction process.

Figure 9.
Cr(VI) uptake isotherms of recovered adsorbent from distilled and natural-like water at 20 °C and equilibrium pH 6, 7, and 8, with corresponding fitting by Freundlich (a) and Langmuir (linearized) (b) equations.
Figure 9.
Cr(VI) uptake isotherms of recovered adsorbent from distilled and natural-like water at 20 °C and equilibrium pH 6, 7, and 8, with corresponding fitting by Freundlich (a) and Langmuir (linearized) (b) equations.


Table 1.
Chemical analysis of original and spent adsorbent.
| Adsorbent | Sn(II) wt.% | Sn wt.% | Cr (mg/g) |
|---|---|---|---|
| Original | 59 | 70 | ND |
| Spent | 3 | 70 | 19 |
Table 2.
Dissolved Sn and Cr in relation to dissolution pH for different acids (Cads: 10 g/L, Τ: 25 °C, t = 30 min).
Table 2.
Dissolved Sn and Cr in relation to dissolution pH for different acids (Cads: 10 g/L, Τ: 25 °C, t = 30 min).
| pH | HCl | H2SO4 | ||
|---|---|---|---|---|
| Sn (%) 1 | Cr (mg/g) 2 | Sn (%) 1 | Cr (mg/g) 2 | |
| 4 | ND | ND | ND | ND |
| 3 | ND | ND | ND | ND |
| 2 | 0.03% | 0.05 | ND | ND |
| 1.5 | 0.04% | 0.05 | ND | 0.14 |
| 1 | 0.06% | 0.08 | 0.14% | 0.3 |
| 0.5 | 0.67% | 0.15 | 7.63% | 0.7 |
1 weight of dissolved Sn for weight of spent material; 2 mg of dissolved Cr per g of spent material.
Table 3.
Dissolved Sn and Cr in relation to dissolution pH for different adsorbent concentrations (acid: HCl, Τ: 25 °C, t = 30 min).
Table 3.
Dissolved Sn and Cr in relation to dissolution pH for different adsorbent concentrations (acid: HCl, Τ: 25 °C, t = 30 min).
| pH | Cads: 1 g/L | Cads: 10 g/L | ||
|---|---|---|---|---|
| Sn (%) 1 | Cr (mg/g) 2 | Sn (%) 1 | Cr (mg/g) 2 | |
| 4 | ND | ND | ND | ND |
| 3 | ND | ND | ND | ND |
| 2 | ND | ND | 0.03% | 0.05 |
| 1.5 | 3.3% | 0.5 | 0.04% | 0.05 |
| 1 | 3.1% | 0.6 | 0.06% | 0.08 |
| 0.5 | 9.6% | 1.7 | 0.67% | 0.15 |
1 weight of dissolved Sn for weight of spent material; 2 mg of dissolved Cr per g of spent material.
Table 4.
Dissolved Sn and Cr in relation to the type of acid used for dissolution (Cads: 10 g/L, mads/macid: 1:20, Τ: 25 °C, t = 30 min).
Table 4.
Dissolved Sn and Cr in relation to the type of acid used for dissolution (Cads: 10 g/L, mads/macid: 1:20, Τ: 25 °C, t = 30 min).
| Acid | Sn (%) 1 | Cr (mg/g) 2 |
|---|---|---|
| HCl | 37.4 | 8.5 |
| H2SO4 | 8.5 | 1.1 |
1 weight of dissolved Sn for weight of spent material; 2 mg of dissolved Cr per g of spent material.
Table 5.
Dissolved Sn and Cr in relation to solid-to-acid proportion used for dissolution (Cads: 10 g/L, acid: HCl, Τ: 25 °C, t = 30 min).
Table 5.
Dissolved Sn and Cr in relation to solid-to-acid proportion used for dissolution (Cads: 10 g/L, acid: HCl, Τ: 25 °C, t = 30 min).
| mads/macid 1 | Sn (%) 2 | Cr (mg/g) 3 |
|---|---|---|
| 1:10 | 13.8% | 2.9 |
| 1:15 | 21.9% | 4.9 |
| 1:20 | 37.4% | 12.4 |
| 1:25 | 43.4% | 15.5 |
| 1:30 | 46.8% | 16.8 |
| 1:45 (concentrated) | 48.1% | 18.6 |
1 calculated mass ratio of adsorbent to acid; 2 weight of dissolved Sn for weight of spent material; 3 mg of dissolved Cr per g of spent material.
Table 6.
Dissolved Sn and Cr in relation to spent adsorbent’s concentration for different temperatures (acid: HCl, Τ: 25 °C, t = 30 min).
Table 6.
Dissolved Sn and Cr in relation to spent adsorbent’s concentration for different temperatures (acid: HCl, Τ: 25 °C, t = 30 min).
| Cads (g/L) | T (°C) | Sn (%) 1 | Cr (mg/g) 2 |
|---|---|---|---|
| 10 | 25 | 48.1% | 18.6 |
| 10 | 50 | 54.5% | 18.8 |
| 10 | 75 | 70.0% | 19.0 |
| 20 | 25 | 41.5% | 14.4 |
| 20 | 50 | 45.2% | 15.3 |
| 20 | 75 | 53.9% | 16.4 |
1 weight of dissolved Sn for weight of spent material; 2 mg of dissolved Cr per g of spent material.
Table 7.
Sn and Cr concentration in solutions and solids produced at reconstruction process in relation to reductants used for Sn(IV) reduction (pH1: 3, pH2: 7).
Table 7.
Sn and Cr concentration in solutions and solids produced at reconstruction process in relation to reductants used for Sn(IV) reduction (pH1: 3, pH2: 7).
| Reductant | CRed (g/L) | 1st Precipitation Step | 2nd Precipitation Step | ||||||
|---|---|---|---|---|---|---|---|---|---|
| Solid | Solution | Solid | Solution | ||||||
| Sn (%) | Cr (mg/g) | Sn (g/L) | Cr (g/L) | Sn (%) | Cr (mg/g) | Sn (g/L) | Cr (g/L) | ||
| NaHSO3 | 6.1 | 49.6% | 9.9 | 3.85 | 0.127 | ND | ND | 3.85 | 0.127 |
| Na2S2O4 | 3.4 | 62.6% | 11.1 | 2.96 | 0.118 | ND | ND | 2.96 | 0.118 |
| Na2S2O5 | 5.6 | 74.6% | 15.9 | 2.15 | 0.087 | ND | ND | 2.15 | 0.087 |
| Ν2H4∙2HCl | 6.2 | 67.1% | 20.2 | 2.37 | 0.051 | 70.4% | 3 | 1.45 | 0.047 |
CRed, reductant’s concentration in original solution.
Table 8.
Sn and Cr concentration in solids produced at reconstruction process in relation to reducing agent concentration (reductant: Ν2H4∙2HCl, pH1: 3, pH2: 7).
Table 8.
Sn and Cr concentration in solids produced at reconstruction process in relation to reducing agent concentration (reductant: Ν2H4∙2HCl, pH1: 3, pH2: 7).
| mreductant Added 1 | 1st Precipitation Step | 2nd Precipitation Step | ||||
|---|---|---|---|---|---|---|
| Sn (wt.%) | Cr (mg/g) | m (mg) | Sn (wt.%) | Cr (mg/g) | m (mg) | |
| 100% | 67.1% | 20.2 | 138 | 70.4% | 3 | 26 |
| 125% | 66.3% | 21.2 | 122 | 71.4% | 5.1 | 37 |
| 150% | 64.9% | 21.6 | 123 | 76.2% | 4.8 | 38 |
1 % of stoichiometric ratio.
Table 9.
Sn and Cr concentration in solids produced at reconstruction process in relation to the second precipitation step pH (reductant: Ν2H4∙2HCl, pH1: 3).
Table 9.
Sn and Cr concentration in solids produced at reconstruction process in relation to the second precipitation step pH (reductant: Ν2H4∙2HCl, pH1: 3).
| 1st Precipitation Step | 2nd Precipitation Step | |||||
|---|---|---|---|---|---|---|
| Sn (wt.%) | Cr (mg/g) | m (mg) | pH2 | Sn (wt.%) | Cr (mg/g) | m (mg) |
| 66.8% | 19.9 | 138 | 5 | 71.6% | 2.8 | 21 |
| 67.0% | 20.2 | 137 | 6 | 71.1% | 2.9 | 25 |
| 67.1% | 20.2 | 138 | 7 | 70.4% | 3 | 26 |
Table 10.
Chemical analysis of original and recovered adsorbent.
| Adsorbent | Sn(II) wt.% | Sn wt.% | Cr (mg/g) |
|---|---|---|---|
| Original | 59 | 70 | ND |
| Recovered | 66.0 | 70.4 | 3.0 |
Disclaimer/Publisher’s Note: The statements, opinions and data contained in all publications are solely those of the individual author(s) and contributor(s) and not of MDPI and/or the editor(s). MDPI and/or the editor(s) disclaim responsibility for any injury to people or property resulting from any ideas, methods, instructions or products referred to in the content. |
© 2022 by the authors. Licensee MDPI, Basel, Switzerland. This article is an open access article distributed under the terms and conditions of the Creative Commons Attribution (CC BY) license (https://creativecommons.org/licenses/by/4.0/).
Share and Cite
MDPI and ACS Style
Kaprara, E.; Daskalopoulou, E.; Simeonidis, K.; Mitrakas, M. An Integrated Approach for the Recovery of Sn from Used Water Adsorbents. Water 2023, 15, 97. https://doi.org/10.3390/w15010097
AMA Style
Kaprara E, Daskalopoulou E, Simeonidis K, Mitrakas M. An Integrated Approach for the Recovery of Sn from Used Water Adsorbents. Water. 2023; 15(1):97. https://doi.org/10.3390/w15010097
Chicago/Turabian StyleKaprara, Efthimia, Evangelia Daskalopoulou, Konstantinos Simeonidis, and Manassis Mitrakas. 2023. "An Integrated Approach for the Recovery of Sn from Used Water Adsorbents" Water 15, no. 1: 97. https://doi.org/10.3390/w15010097
Note that from the first issue of 2016, this journal uses article numbers instead of page numbers. See further details here.