
Temporal and Spatial Variation Analysis of Lake Area Based on the ESTARFM Model: A Case Study of Qilu Lake in Yunnan Province, China

1
School of Geography and Ecotourism, Southwest Forestry University, Kunming 650224, China
2
Southwest Research Center for Eco-Civilization, National Forestry and Grassland Administration, Kunming 650224, China
3
Human Resource Department, Southwest Forestry University, Kunming 650224, China
4
School of Biodiversity Conservation and Utilization, Southwest Forestry University, Kunming 650224, China
*
Author to whom correspondence should be addressed.
Water 2023, 15(10), 1800; https://doi.org/10.3390/w15101800
Submission received: 31 March 2023
/
Revised: 2 May 2023
/
Accepted: 6 May 2023
/
Published: 9 May 2023
(This article belongs to the Special Issue Adaptive Water Resources Management in an Era of Changing Climatic, Environmental and Social Conditions)
Abstract
:Qilu Lake is one of the nine plateau lakes in Yunnan Province, China. In recent years, under the influence of extreme climate and human activities, the area of Qilu Lake has shrunk significantly, the water level has dropped, and the problem of water shortage has become increasingly serious. Based on the Landsat and MODIS image data from 2000 to 2020, this study applied the ESTARFM spatiotemporal fusion model to unify the data images used in the study to February, used three kinds of water body indexes, selected the water body index most suitable for the study area to extract relevant information, and analyzed the spatiotemporal change characteristics of Qilu Lake area in the last 20 years. The results showed that: (1) Based on the ESTARFM model, the Landsat and MODIS data on 18 January 2020, the Landsat and MODIS data on 9 May 2020, and the MODIS data on the date to be predicted (February 13) were fused to obtain the Landsat image data of the predicted date, which met the accuracy requirements; (2) Taking 2005 as an example, the NDWI, MNDWI, and AWEIsh indexes were used to extract the water body with the precisions of 99.0%, 99.6% and 98.6%, respectively, and then the MNDWI water body index was selected to extract the lake area; (3) In the past 20 years, the overall area of Qilu Lake has shown a downward trend, with the area reduced by 0.7132 km2. From 2000 to 2010, the lake area was relatively stable, fluctuating up and down around 36 km2. From 2010 to 2015, the lake area decreased sharply, with a change rate of −40%. After 2015, the lake area gradually increased; (4) The spatial change of Qilu Lake area mainly occurred in the southwest and west, which decreased by 0.44 km2 and 0.49 km2, respectively, and there were small fluctuations in other directions. In the past two decades, the shape index of Qilu Lake has shown a downward trend as a whole; the contour of the lake tends to be simplified, the contour is complex and stable from 2000 to 2010, and the shape index decreases from 2.17 to 1.74 from 2010 to 2020; (5) The change in the Qilu Lake area is positively correlated with the change in the water level. Polynomial models with different times were selected as the model for retrieving water level elevation from the Qilu Lake water surface area, with a highest correlation coefficient of 0.9259. The temporal and spatial changes of the Qilu Lake area in the last 20 years are the result of the joint action of natural factors and socio-economic factors. According to the analysis, the annual average temperature, annual precipitation, annual average sunshine hours, and population density are the main driving forces leading to the change. In the future, the government and relevant researchers should strengthen real-time monitoring and regular research, formulate and optimize emergency plans to deal with changes in the ecological environment of lakes, and promote the sustainable development of the ecological environment and social economy of the basin.
1. Introduction
Lakes are an important part of the hydrosphere, as they represent the hub of interactions between the biosphere, atmosphere, and lithosphere in regard to matter cycling and energy transfer, and the contraction or expansion of lakes reflects the changes in the global climate and environment [1]. The fifth assessment report by the IPCC (Intergovernmental Panel on Climate Change) pointed out that, as land surface water reservoirs, lakes serve as important indicators of regional responses to global climate change. Therefore, a timely and accurate monitoring of changes in lake water resources has a significant importance for understanding changes in climate and environmental conditions [2,3,4].
As an important part of the Yunnan Guizhou Plateau, Yunnan Province is located in the southwest border of China and has many plateau lakes, including nine major plateau lakes with an area of more than 30 km2. The drainage area of these nine plateau lakes is about 8000 km2, accounting for 2% of the provincial area, and the lake capacity is nearly 30 billion m3 [5]. Plateau lakes not only play an important role in maintaining the quality of Yunnan’s aquatic habitats but also play an indispensable role in promoting social and economic development, especially in ecotourism. However, with the intensification of climate change and human activities, the shrinkage of plateau lakes and the deterioration of aquatic environment have attracted extensive attention from all sectors of society [6,7]. Qilu Lake is one of the nine plateau lakes with the fastest decline rate, the greatest reduction in size, and the most serious extent of eutrophication in recent years. Qilu Lake basin, which gathers more than 90% of the population of Tonghai County, is the most densely populated and economically developed area in the county. In the past two decades, the continuous drought in Yunnan Province, coupled with the continuous development of the social economy in the basin, has greatly reduced the area of Qilu Lake. As a result, the water level has gradually declined, and the shortage of water resources has become increasingly serious. The basin is suffering from ecological pressure and risks caused by the expansion of economic scale and land use [8,9].
The traditional surface monitoring of lakes takes a long time, consumes much energy, and requires high monitoring accuracy. It is difficult to achieve effective and efficient monitoring of a lake water area. With the development and application of remote sensing (RS) and geographic information technology (GIS, GPS), some effective technical means can be used to monitor the dynamic changes of lake waters in large space areas. For example, satellite remote sensing images of resources and meteorology, etc., create conditions for accurately investigating the hydrological characteristics of lakes and reservoirs, etc., with their characteristics of periodicity, macrocosm, and efficiency, and have broad application prospects. Compared with traditional ground monitoring, when the dynamic changes of water areas are monitored, the use of long time series, multi-temporal, multi-band remote sensing image data can quickly obtain macro water surface radiation information, which has incomparable advantages. In recent years, a series of achievements have been made in monitoring, extraction methods, and water quality index inversion, etc. [10,11,12,13,14,15,16]. At present, the main remote sensing data used are multi-spectral data such as Sentinel, AHVRR, SPOT, Landsat, ASTER, and resource satellites [17,18,19]. Landsat images are most widely used because of their high spatial resolution (30 m), free access policy, and data records up to more than 30 years [20,21].
As Yunnan has a distinct climate of dry and wet seasons, about 90% of the precipitation within a year is concentrated in the rainy season (May–October), while the total precipitation in the dry season (November to April of the next year) only accounts for 10% of the year. Therefore, when using remote sensing images to monitor Qilu Lake, the dry season months with a relatively stable lake area and water level were selected. Most of the previous studies selected remote sensing data from several months in the dry season, but there are errors in different months due to cloud cover [9,22,23]. Therefore, if the used image data are acquired in the same month, the above errors can be avoided. The ESTARFM spatiotemporal data fusion model can provide a good solution to this problem, because it can combine different satellite images with high spatial and temporal resolution [9,24]. Therefore, based on the spatiotemporal fusion model, we simulated and acquired the Landsat data that could not be obtained in 2020, so as to unify the image data time of this experiment to February and ensure the accuracy of data analysis.
Common water extraction methods include the single band method, the spectral relationship method, the water index method, the object-oriented method, the decision tree method, the SVM method, the BP neural network based method, and the depth learning based method, etc. The water index method is widely used because of its high accuracy and low implementation cost. In 1996, Mcfeeters used specific bands of TM images to carry out normalized difference calculation and constructed the normalized difference water index NDWI [25]. In 2005, Xu improved the wavelength combination on the basis of the NDWI index and built an improved normalized difference water body index MNDWI [26]. In 2009, Ma et al. compared the mixed water body index CIWI with common water body information extraction methods [27]. In 2014, Feyisa et al. selected different water bodies in different regions for repeated tests and proposed an automatic water body extraction index (AWEI) that can be more accurately extracted. According to the shadow condition in the study area, it distinguished the AWEIsh (shadowed) index and AWEInsh (unshaded index) [28]. In order to find the most suitable method for water body extraction in the study area, we compared the extraction effects of three water body indexes—NDWI, MNDWI and AWEIsh—and selected the best water body index with which to extract the Qilu Lake area. In addition, as another important hydrological feature of a lake, the change in water levels is closely related to the spatial change of the lake area [29]. Therefore, the comprehensive consideration of the relationship between lake area and water level can provide an in-depth understanding of the change mechanism between lake area and other hydrological features of the lake. In this regard, we used a linear model, an exponential model, a logarithmic model and a polynomial model [30] of different times to build the relationship between the Qilu Lake area and water levels between 2000 and 2020, and selected the one with the highest accuracy among the four models for subsequent analysis. Compared with previous studies, our innovations were: (1) using the spatiotemporal fusion model to unify the basic data extracted from water bodies to the same month; (2) the early high-resolution images of EO-1 were used to verify the extraction accuracy; (3) the relationship between lake area and water level was established, and the internal change mechanism of hydrological elements of Qilu Lake was explored so as to avoid a single discussion of lake area change.
In this study, our objectives were: (1) based on the spatiotemporal fusion model, the MODIS and Landsat data fusion was used to obtain the missing image data in February 2020; (2) the image data from February 2000, 2005, 2010, 2015, and 2020 were used to extract the water body and the most suitable water index was selected through accuracy verification to extract the area of Qilu Lake, and the temporal and spatial variation characteristics of the area of Qilu Lake were analyzed; (3) to explore the area water level change relationship of Qilu Lake over the last 20 years.
2. Materials and Methods
2.1. Study Area
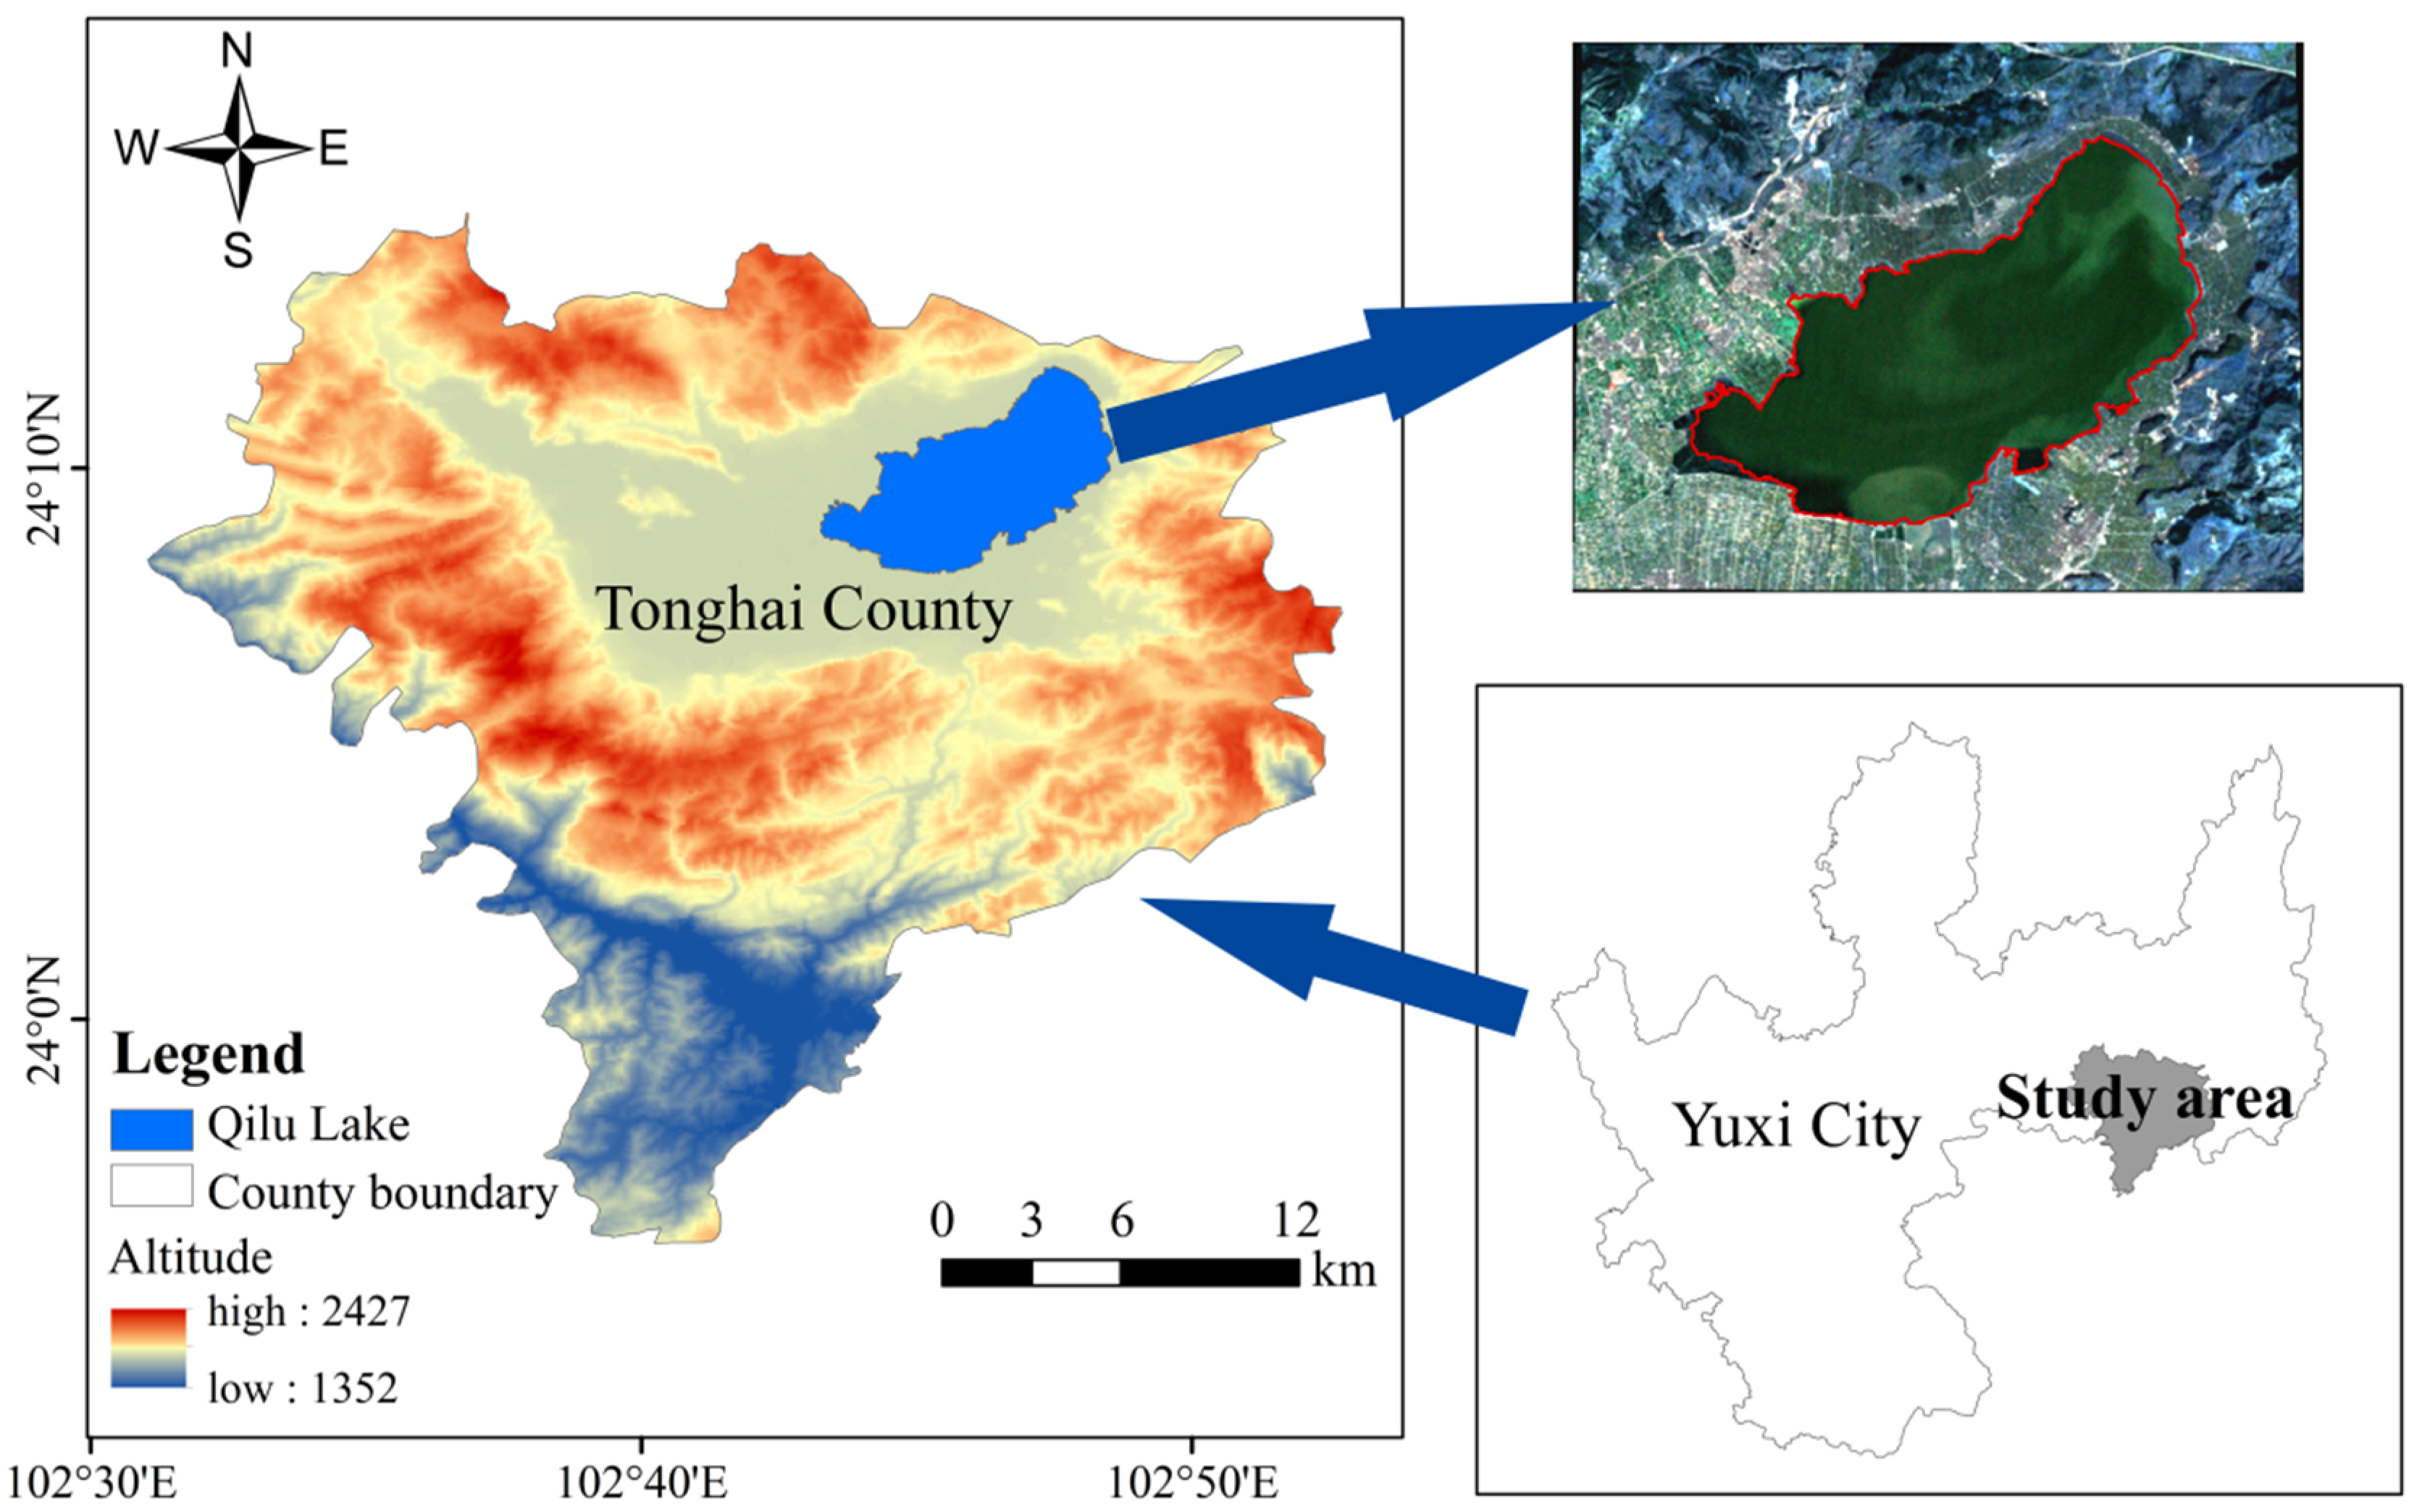
Qilu Lake (102°33′48″~102°52′36″ E, 24°4′36″~24°14′2″ N) is located in Tonghai County, Yuxi City, Yunnan Province, China, with an altitude of about 1796.62 m. It is one of the nine plateau lakes in Yunnan Province (Figure 1), serves as an important water resource in Tonghai County, and has many functions such as industrial and agricultural production water, regulation and storage, flood prevention, tourism, shipping, aquaculture, and climate regulation, etc. [23,31]. Qilu Lake is a closed fault sink lake of catchment runoff type, belonging to the Xijiang River system of the Pearl River basin. The long axis of the lake is east–west. The ancient Qilu Lake occupies the whole Tonghai Basin, and the lake surface elevation reaches 2000 m above sea level. However, after a long history of evolution, its water level drops and the lake surface gradually shrinks. Qilu Lake basin belongs to the humid plateau monsoon climate zone in the middle subtropical zone. The average annual rainfall in the county is 898 mm, of which the rainy season is from May to October, mainly supplied by precipitation. The drainage basin is mainly composed of mountains and dam areas. The dam area is the main production area of grain and cash crops in the county, and is also the main residential area of Tonghai County. It is one of the most densely populated drainage basins among the nine lakes in Yunnan [32,33,34,35,36].
2.2. Data Source and Preprocessing
2.2.1. Data
The Landsat remote sensing image data used in the study were downloaded from the geospatial data cloud (http://www.gscloud.cn/, accessed on 2 May 2022) and the MODIS data were downloaded from USGS (http://glovis.usgs.gov/, accessed on 7 May 2022). See Table 1 for details. In order to reduce the error caused by seasonal difference, the imaging time of image data in each year used in the study was February. Specifically, except for 2020, the other four images were Landsat data from February of that year and, due to the lack of applicable Landsat data in February 2020, we used Landsat and MODIS data from 18 January 2020, Landsat and MODIS data from May 9, and MODIS data from 13 February 2020. They were fused using the ESTARFM model to obtain the Landsat data as of February 13 of that year, thus filling the data gap for 2020.
The water level data were the daily measured data of five years in the study period, which were from the Yunnan Hydrology and Water Resources Yuxi Branch. The meteorological data came from Tonghai Meteorological Station, nearest to Qilu Lake, including monthly temperature, precipitation, evaporation, and sunshine hours. Social and economic data, such as population and GDP, were collected from the Tonghai County National Economic and Social Development Statistics Bulletin, the Yunnan Provincial Statistics Yearbook, and the China County Statistics Yearbook.
2.2.2. Preprocessing of Remote Sensing Data
The ENVI software was used to preprocess the remote sensing image. The Landsat data preprocessing process was as follows: first, radiometric calibration was carried out, then the FLAASH module was used for atmospheric correction and, finally, the image was appropriately trimmed after geometric correction so that the study area was clearly visible for subsequent operations. The preprocessing of MODIS data was as follows: firstly, MRT was used to re-project the data to the UTM-WGS84 coordinate system and convert it to GeoTIFF format. At the same time, the nearest neighbor method was used to resample to 30 m spatial resolution. Finally, after accurate registration with Landsat data, the same area was trimmed as the input data of ESTARFM model [24].
2.3. Methods
2.3.1. ESTARFM Spatiotemporal Data Fusion Algorithm
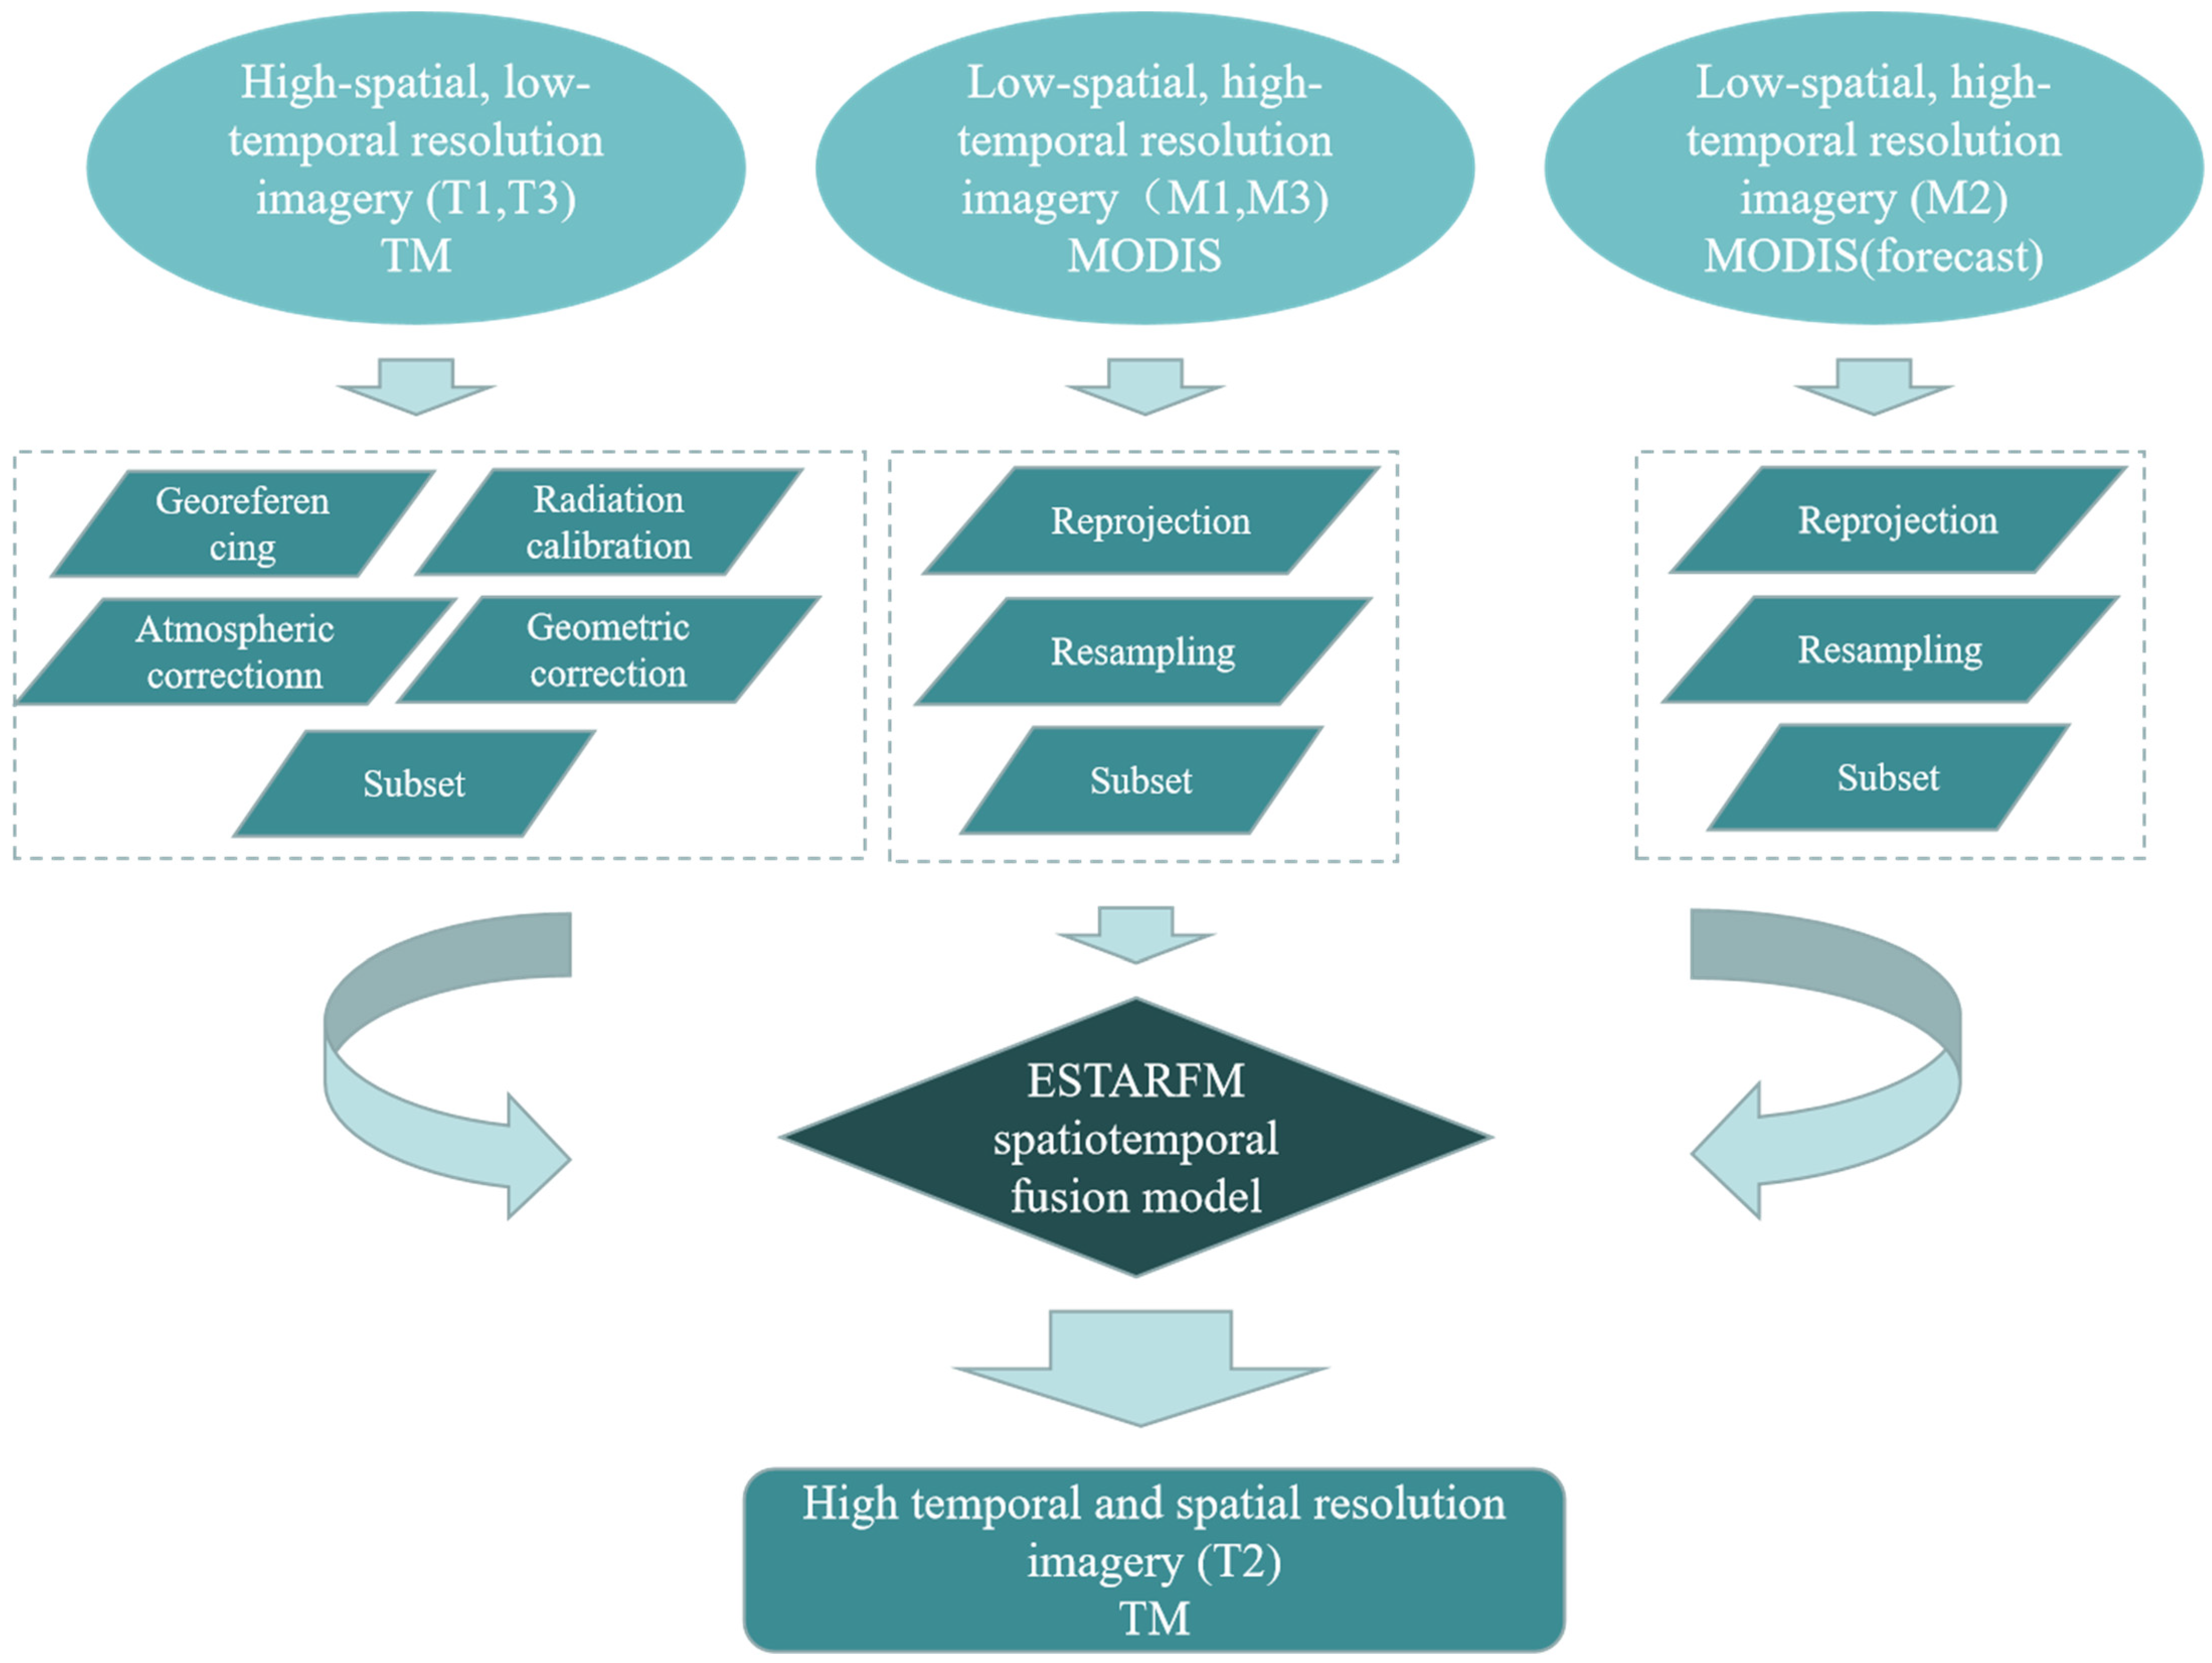
The STARFM model is based on window technology, which comprehensively considers the spatial distance, spectral difference, and time difference between the target cell and the neighboring cell, which greatly improves the fusion accuracy, but the model still has many limitations [24]. The ESTARFM spatiotemporal fusion model is an improvement of the STARFM model. The principle is to consider the similarity of pixel space and spectrum in the same area at the same time. According to at least two pairs of high and low resolution images before and after the prediction date and a low resolution image on the prediction date, the weight and conversion coefficients between corresponding pixels were used to simulate the high spatiotemporal resolution data of the prediction date [37]. ESTARFM adjusted the weighting method. By introducing a conversion coefficient, it improved the prediction accuracy of regions with complex surface conditions and large differences in spatial properties. At the same time, not only the temporal and spatial differences between pixels but also the spectral differences are fully considered in the fusion process. It is one of the most widely used spatiotemporal fusion models with high fusion accuracy [38,39,40]. This study used Landsat 8 OLI_TIRS data and MYD09GA product data in two periods (18 January 2020 and 9 May 2020), as well as MYD09GA product data in the period to be predicted (13 February 2020), and simulated the Landsat data with a spatial resolution of 30 m in the period to be predicted [41,42]. The simulation process principle is shown in Figure 2.
The model first used the weight function for convolution to obtain the central pixel value, as shown in Formula (1):
In the formula, L represents the Landsat image, M represents the MODIS image, w represents the size of the calculation window, t0 and tp represent the two moments of image acquisition, B represents the image band, N represents the number of similar pixels of the central prediction pixel, Wi is the weight of the ith similar pixel, Vi is the conversion coefficient of the ith similar pixel, and (xi, yi) is the location of the ith similar pixel [24].
The reflectivity of the Landsat image at tp time was predicted according to the Landsat and MODIS images of phase 1 (time m: 18/1/2020) and the MODIS images of phase 2 (time tp: 13/2/2020), recorded as Lm (xw/2, yw/2, tp, B). Then, the Landsat and MODIS of time phase 3 (n time: 9/5/2020) and the MODIS of time phase 2 (tp time) were used to predict the reflectivity of the Landsat image at tp time, which was recorded as Ln(xw/2, yw/2, tp, B). The more accurate reflectivity of the Landsat image at tp time was obtained through the weighted combination of the two time phase prediction results, as shown in Formula (2):
where L(xw/2, yw/2, tp, B) is the fusion result of the center pixel at tp time and Tm and Tn are the weight coefficients of the prediction result images at two times [40,43].
2.3.2. Extracting Lake Area by Water Body Index Method
The water body index method takes the strong reflection band and the weak reflection band as the numerator and denominator, respectively, constructs the model through band ratio operation, and extracts the water body information with a certain threshold value. This method highlights the characteristics of the water body and is easy to use. It is the most commonly used method for extracting water body information at present. NDWI, MNDWI, and AWEIsh are the most commonly used water indexes. The calculation formula is as follows [10,11]:
where Green, Blue, NIR, MIR, SWIR1, and SWIR2 bands are the reflectivity of bands 2, 1, 4, 5, and 7, respectively, in TM/ETM+images, while in OLI_, the TIRS image shows the reflectivity of bands 3, 2, 5, 6, and 7.
These three water index methods have different advantages and disadvantages in terms of the effect of water extraction in different regions. The NDWI index method can inhibit the interference of vegetation and soil information to a certain extent and better identify the differences between water bodies and other features, but the extraction results may contain a little land or mis-mention some ice and snow information. The MNDWI index method can effectively distinguish building and soil information; the water extraction effect, especially, is better in urban areas but there is a risk of mis-mentioning ice and snow information. The AWEIsh index method can effectively distinguish dark surface cells, such as water cells and terrain shadows, and can be applied to unshadowed areas, but it is greatly disturbed by ice and snow. Therefore, through the comparison of actual effects, we selected and adopted one of the water index methods with the best extraction effect for the water body of Qilu Lake [24,44,45,46].
2.3.3. A Model for Retrieving Water Level from Lake Area
In this study, the area data of Qilu Lake in 2000, 2005, 2010, 2015, and 2020 and the measured water level elevation data of corresponding dates obtained through calculation were used as the data for the inversion model. The linear model, exponential model, logarithmic model, and polynomial models of different degrees were used to establish multiple regression models and the correlation coefficient R2 was used to measure the degree of correlation of model fitting. The larger the correlation coefficient, the better the model fitting performance [30].
3. Results
3.1. ESTARFM Spatio-Temporal Fusion Results and Evaluation
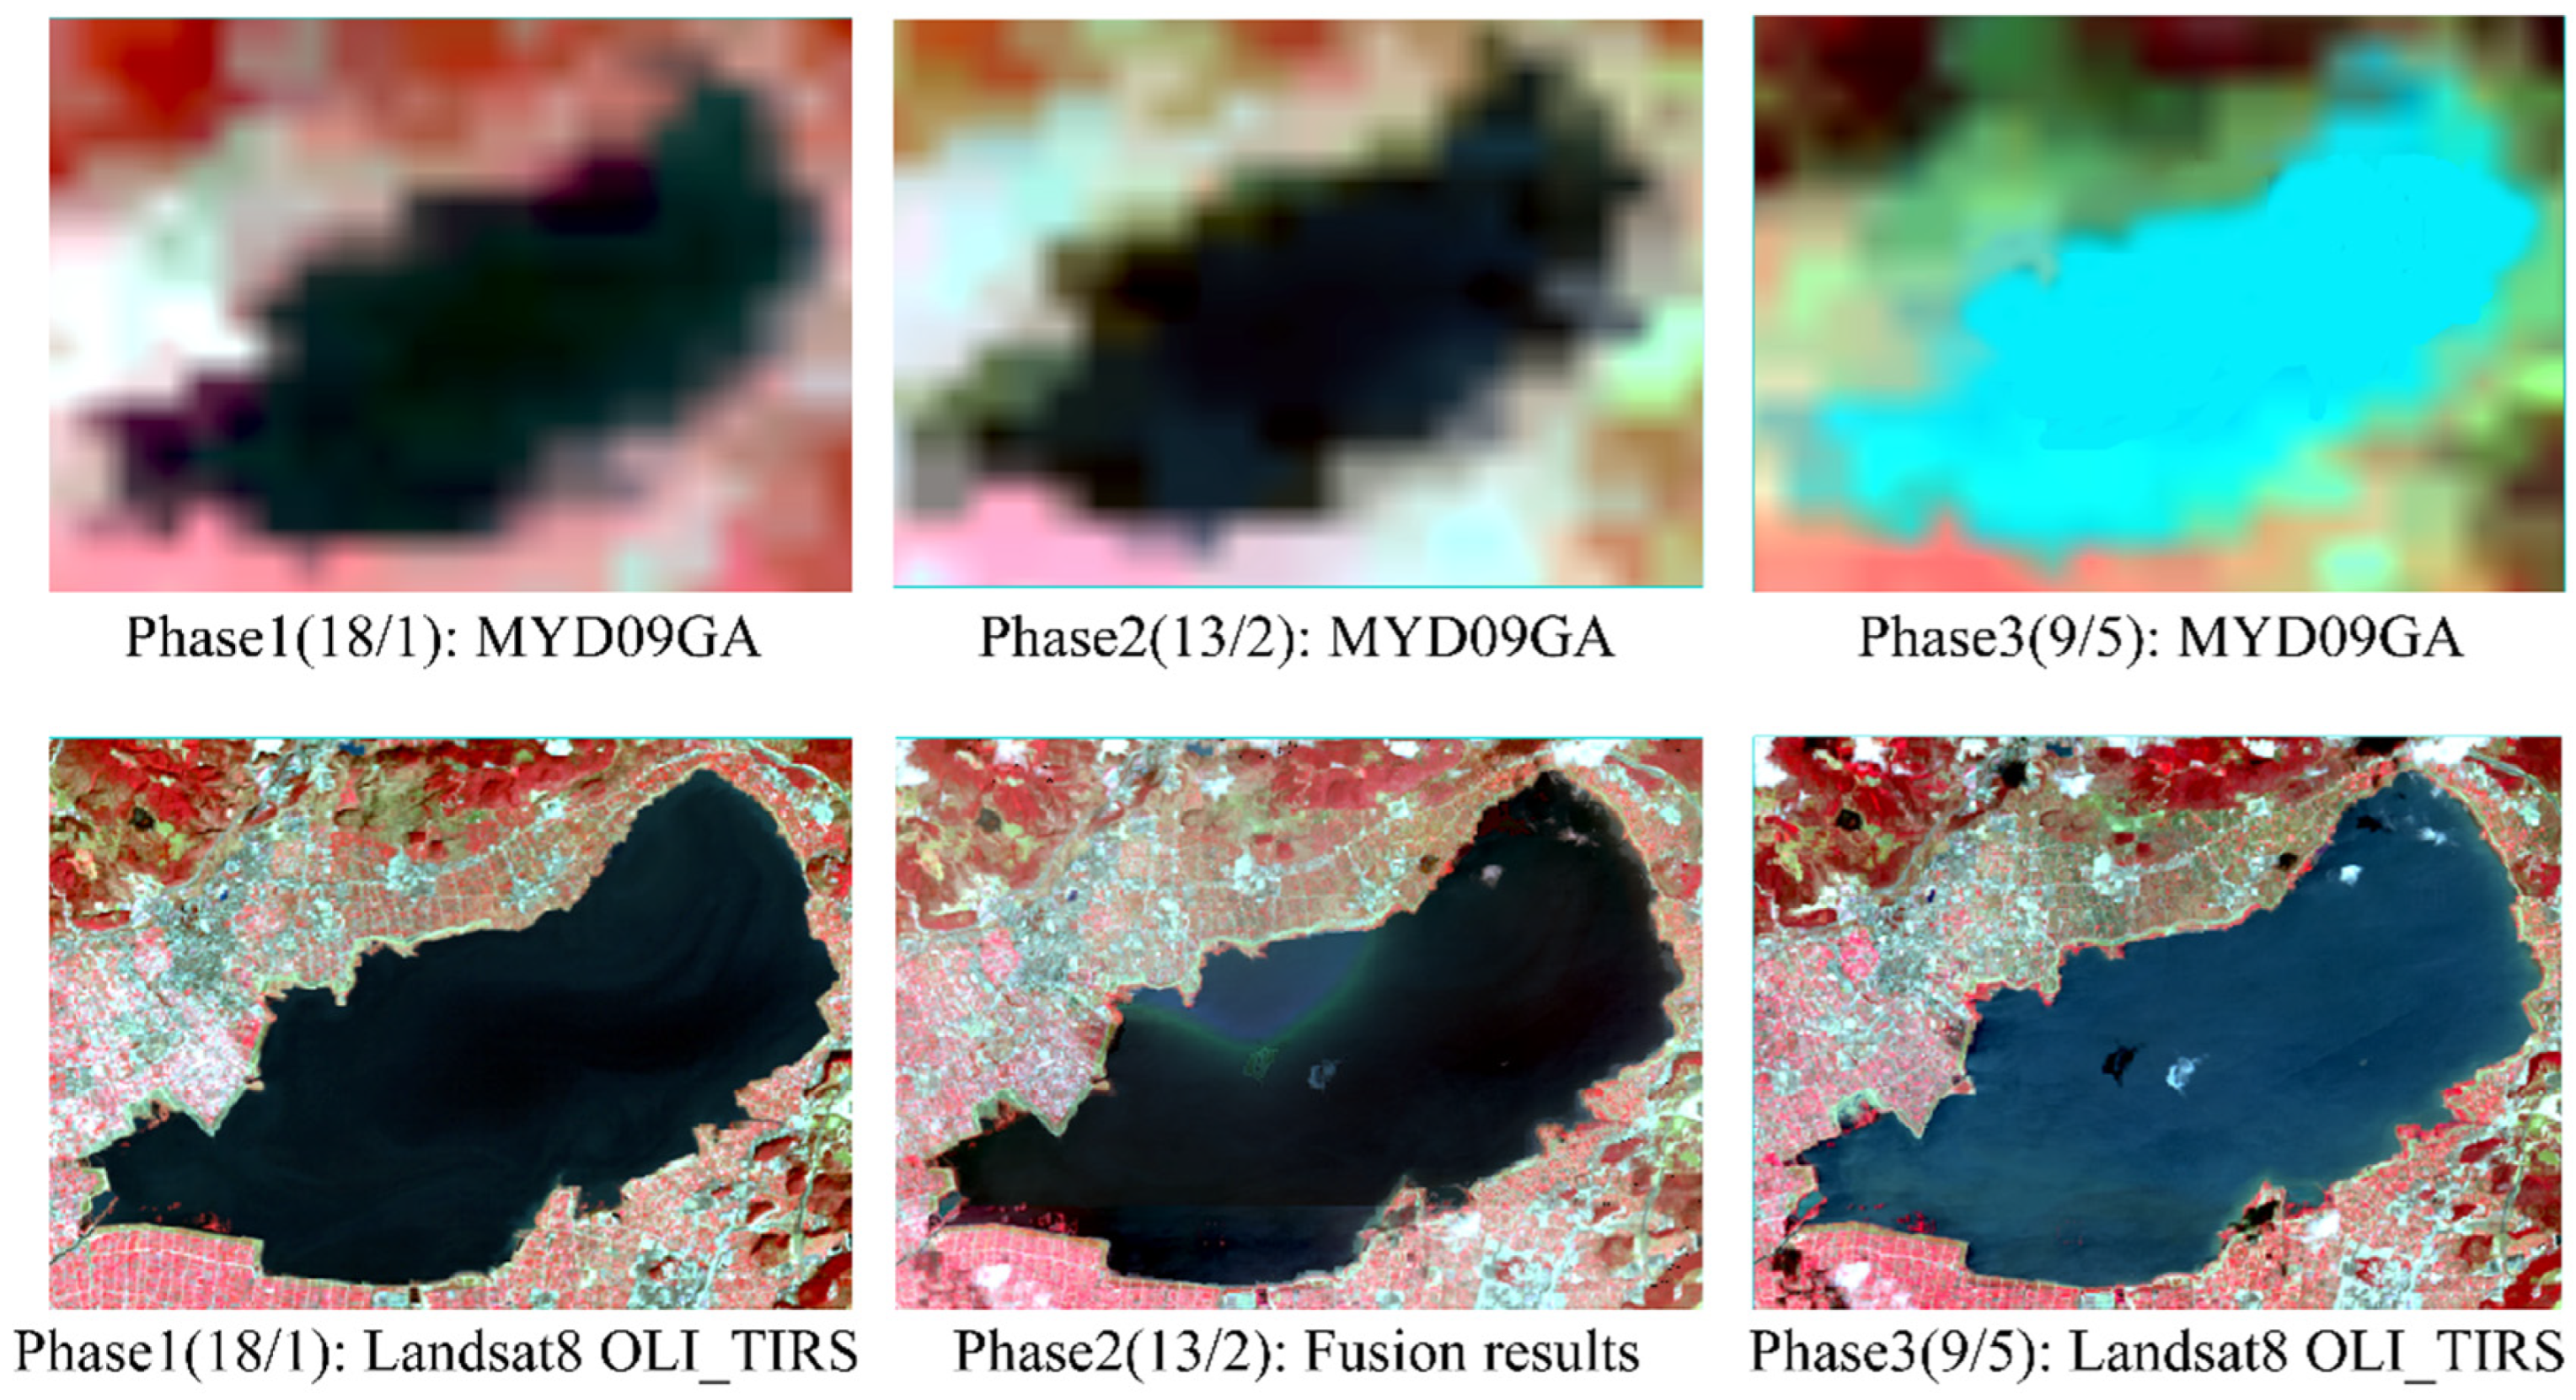
The two groups of Landsat and MYD09GA data for 18 January and 9 May 2020, as well as the MYD09GA data for the prediction period of 13 February 2020, were used as the initial data of the ESTARFM model to obtain the Landsat data on February 13 after fusion. In Figure 3, phases 1, 2, and 3 show the comparison of MODIS and Landsat images in the Qilu Lake area on January 18, February 13, and May 9, respectively, and the upper and lower phases represent MODIS and Landsat image data, respectively. We found from “Phase2 (13/2): Fusion results” that the Landsat images obtained after fusion on February 13 (prediction date) are very similar to the real Landsat data from other periods (January 18 and May 9), and the fusion effect is in line with expectations. The spatial resolution was successfully improved from 500 m to 30 m and the spectral information was well preserved. Since the cloud amount of Landsat remote sensing images in 2020 is generally high, and there are few images with qualified definition, it is impossible to obtain other predicted images on the same day of February 13, so the Landsat image on January 18 of the same year was selected as the test data for the precision verification of fusion results. The specific step was to randomly generate 10,000 verification points with uniform distribution in the fusion area and the average correlation coefficient of the two images was 0.7525 after calculation, which shows that the fusion result based on the ESTARFM model is reliable.
3.2. Precision Validation of the Water Extraction Method
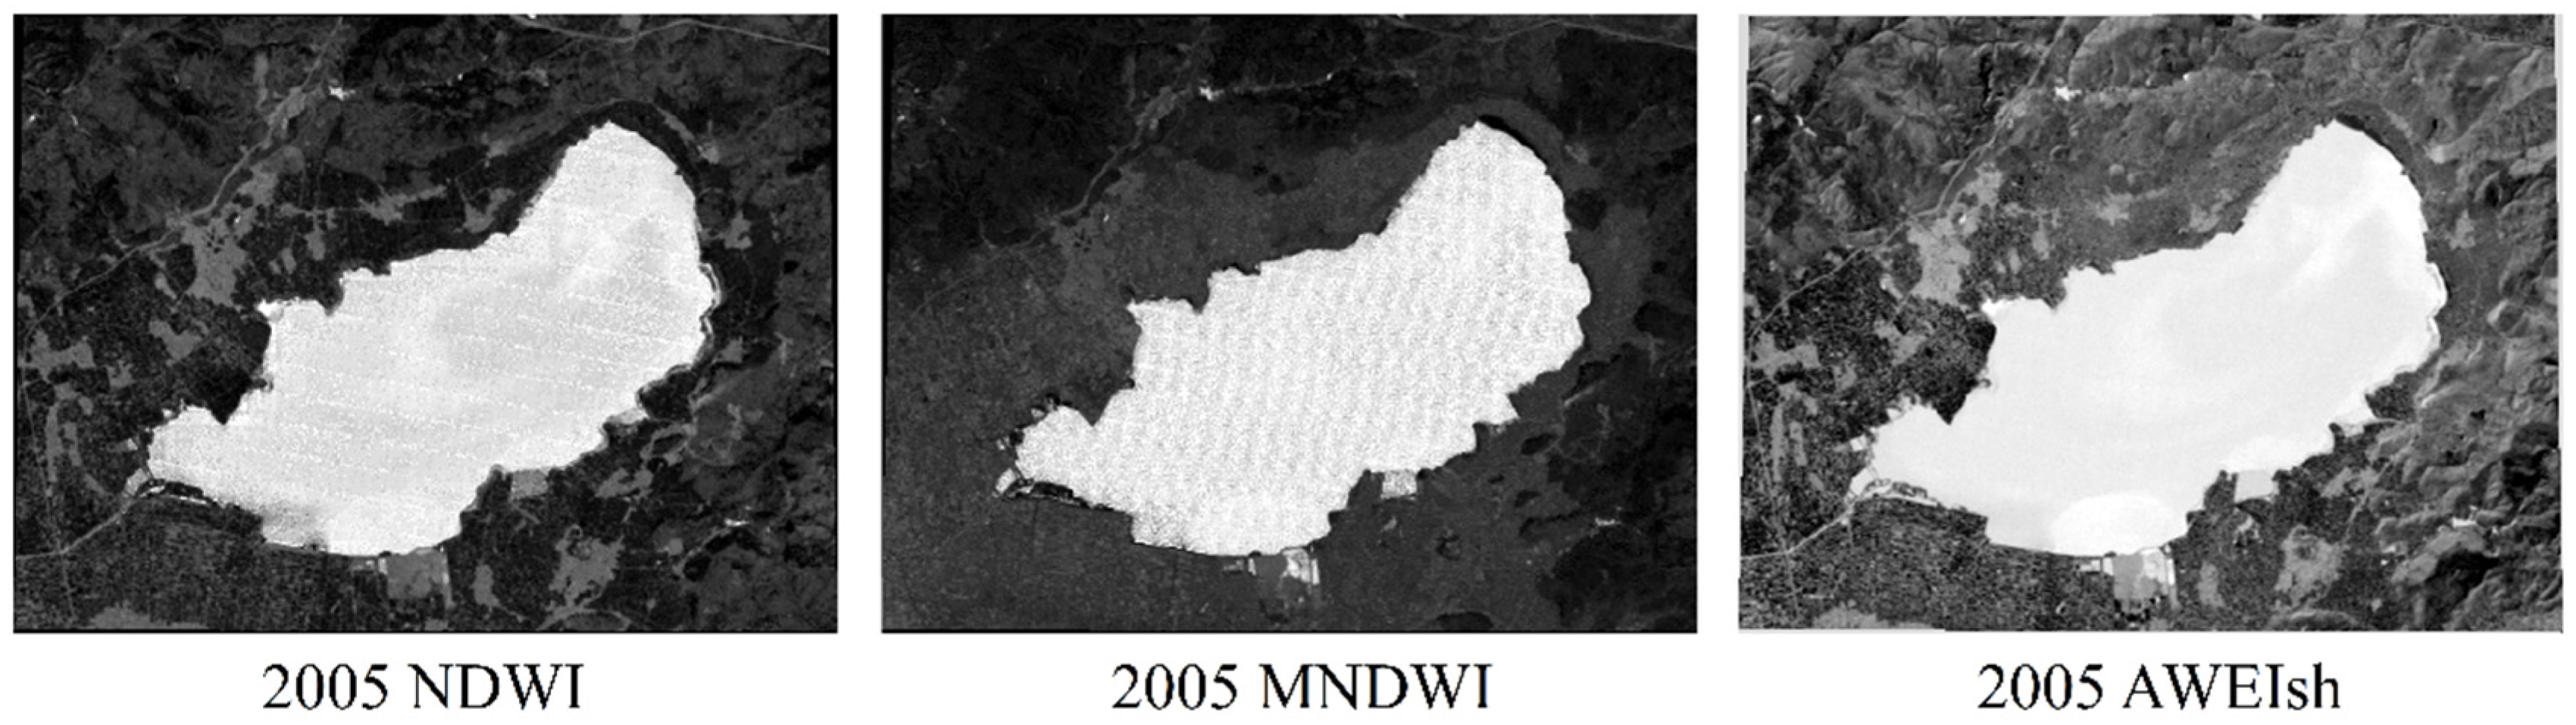
Since the cloud amount of Landsat TM image data in 2005 was 0, the data quality was the highest, and remote sensing images involved in water extraction were mainly obtained from TM sensors. Therefore, we selected 2005 data as an example with which to verify the extraction accuracy of three water body index methods (NDWI, MNDWI, AWEIsh). The extraction results are shown in Figure 4. Through visual inspection, it was found that the NDWI index was relatively fuzzy in the identification of the boundary part of Qilu Lake, and there were many burrs in the water boundary, and the extraction results of the AWEIsh index included the dried up part of the original lake area and the fish ponds around the lake. After comparative analysis, it was found that MNDWI index was more effective in extracting the water area of Qilu Lake. This result is the same as the research findings of Xiaojun Wu et al. [23]. For more accurate accuracy verification, we used the EO-1 Advanced Land Imager (ALI) image from 3 March 2005 as the verification data, which had a spatial resolution of 10 m and a 5-day difference between the imaging time and the Landsat data based on water extraction (25 February 2005), resulting in minimal error. The specific operation was as follows: 500 water sample points were randomly generated in the extraction results and superimposed on the pretreated EO-1 ALI image, the accuracy verification was carried out by visual interpretation, and the lake extraction accuracy of these three water body indices in 2005 was 98.0%, 99.2% and 98.4%, respectively, which once again verifies the results of visual judgment. Therefore, the MNDWI water index extraction method was adopted in the subsequent lake area statistics.
3.3. Spatio-Temporal Change of the Lake Area
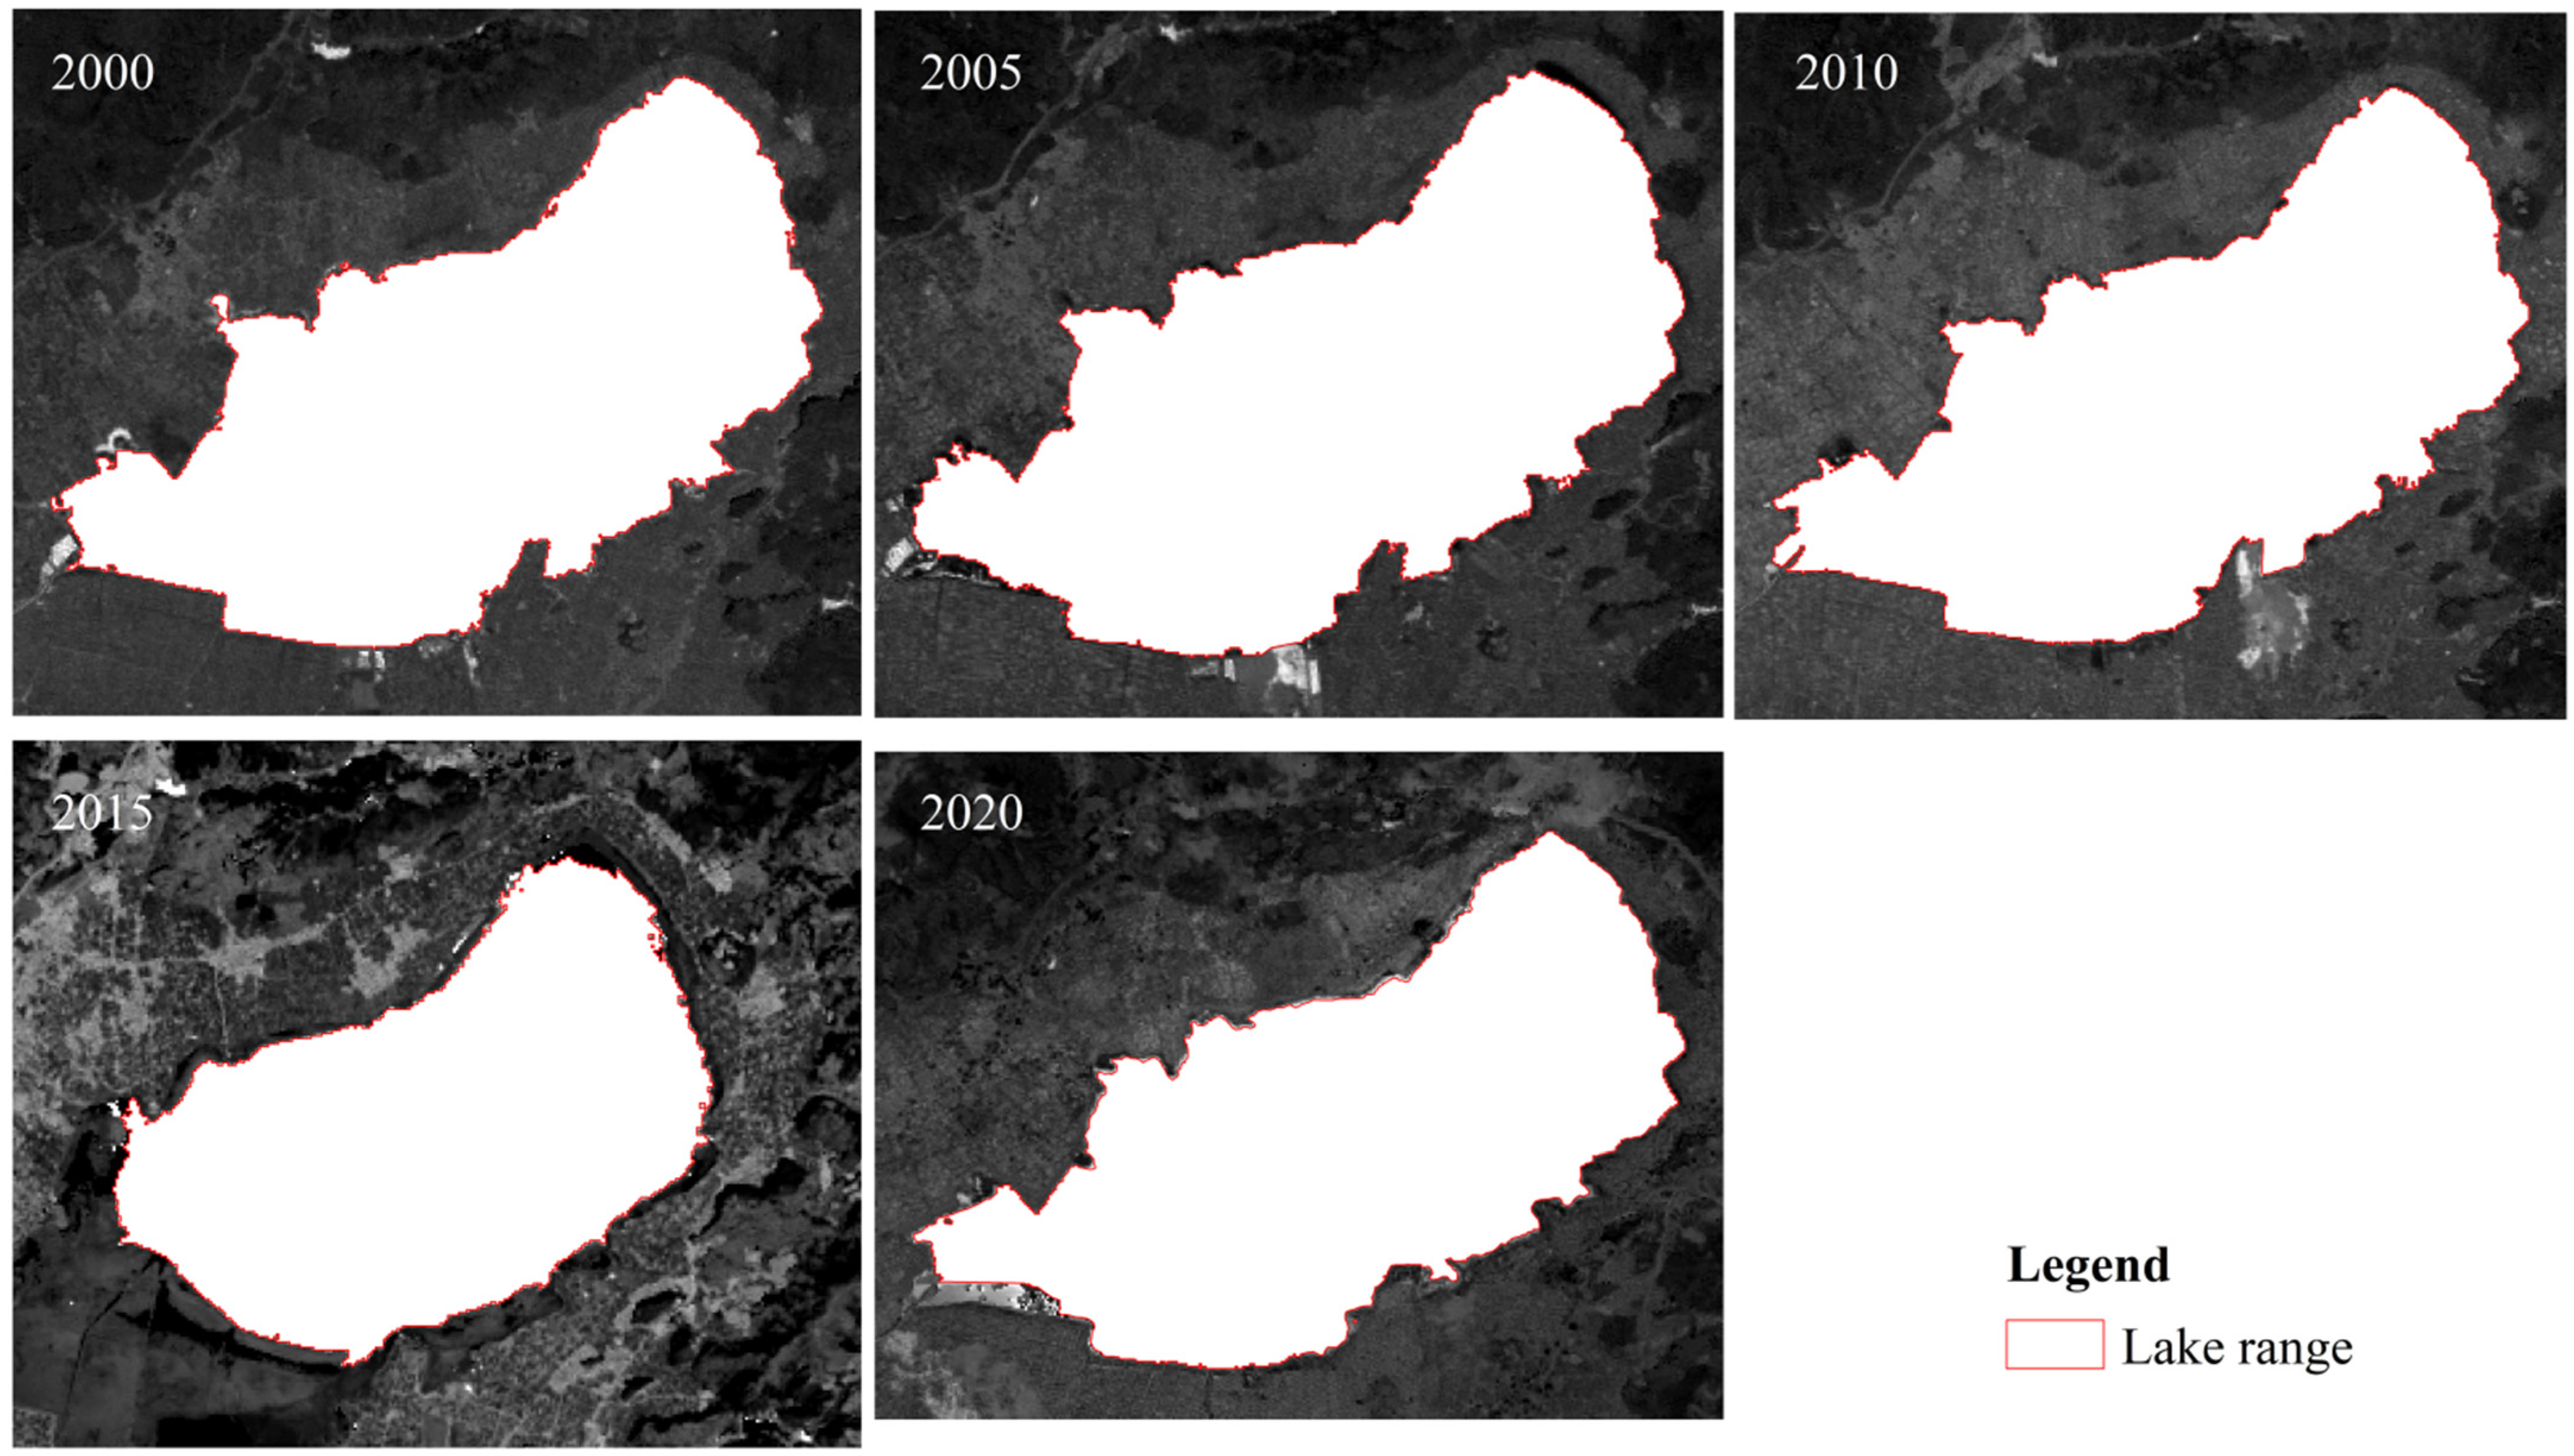
The MNDWI water index method was used to extract the water body of the five-stage Landsat image, and the optimal segmentation threshold for lake extraction was determined by combining the Otsu algorithm and the debris was combined or rejected. The Otsu [47] method is an adaptive threshold method that helps eliminate errors caused by erroneous splitting between water and non-water areas caused by artificial thresholds. The extraction results are shown in Figure 5 and the lake area was counted for each year (Table 2). The extraction results are shown in Figure 5.
3.3.1. Area Size Changes
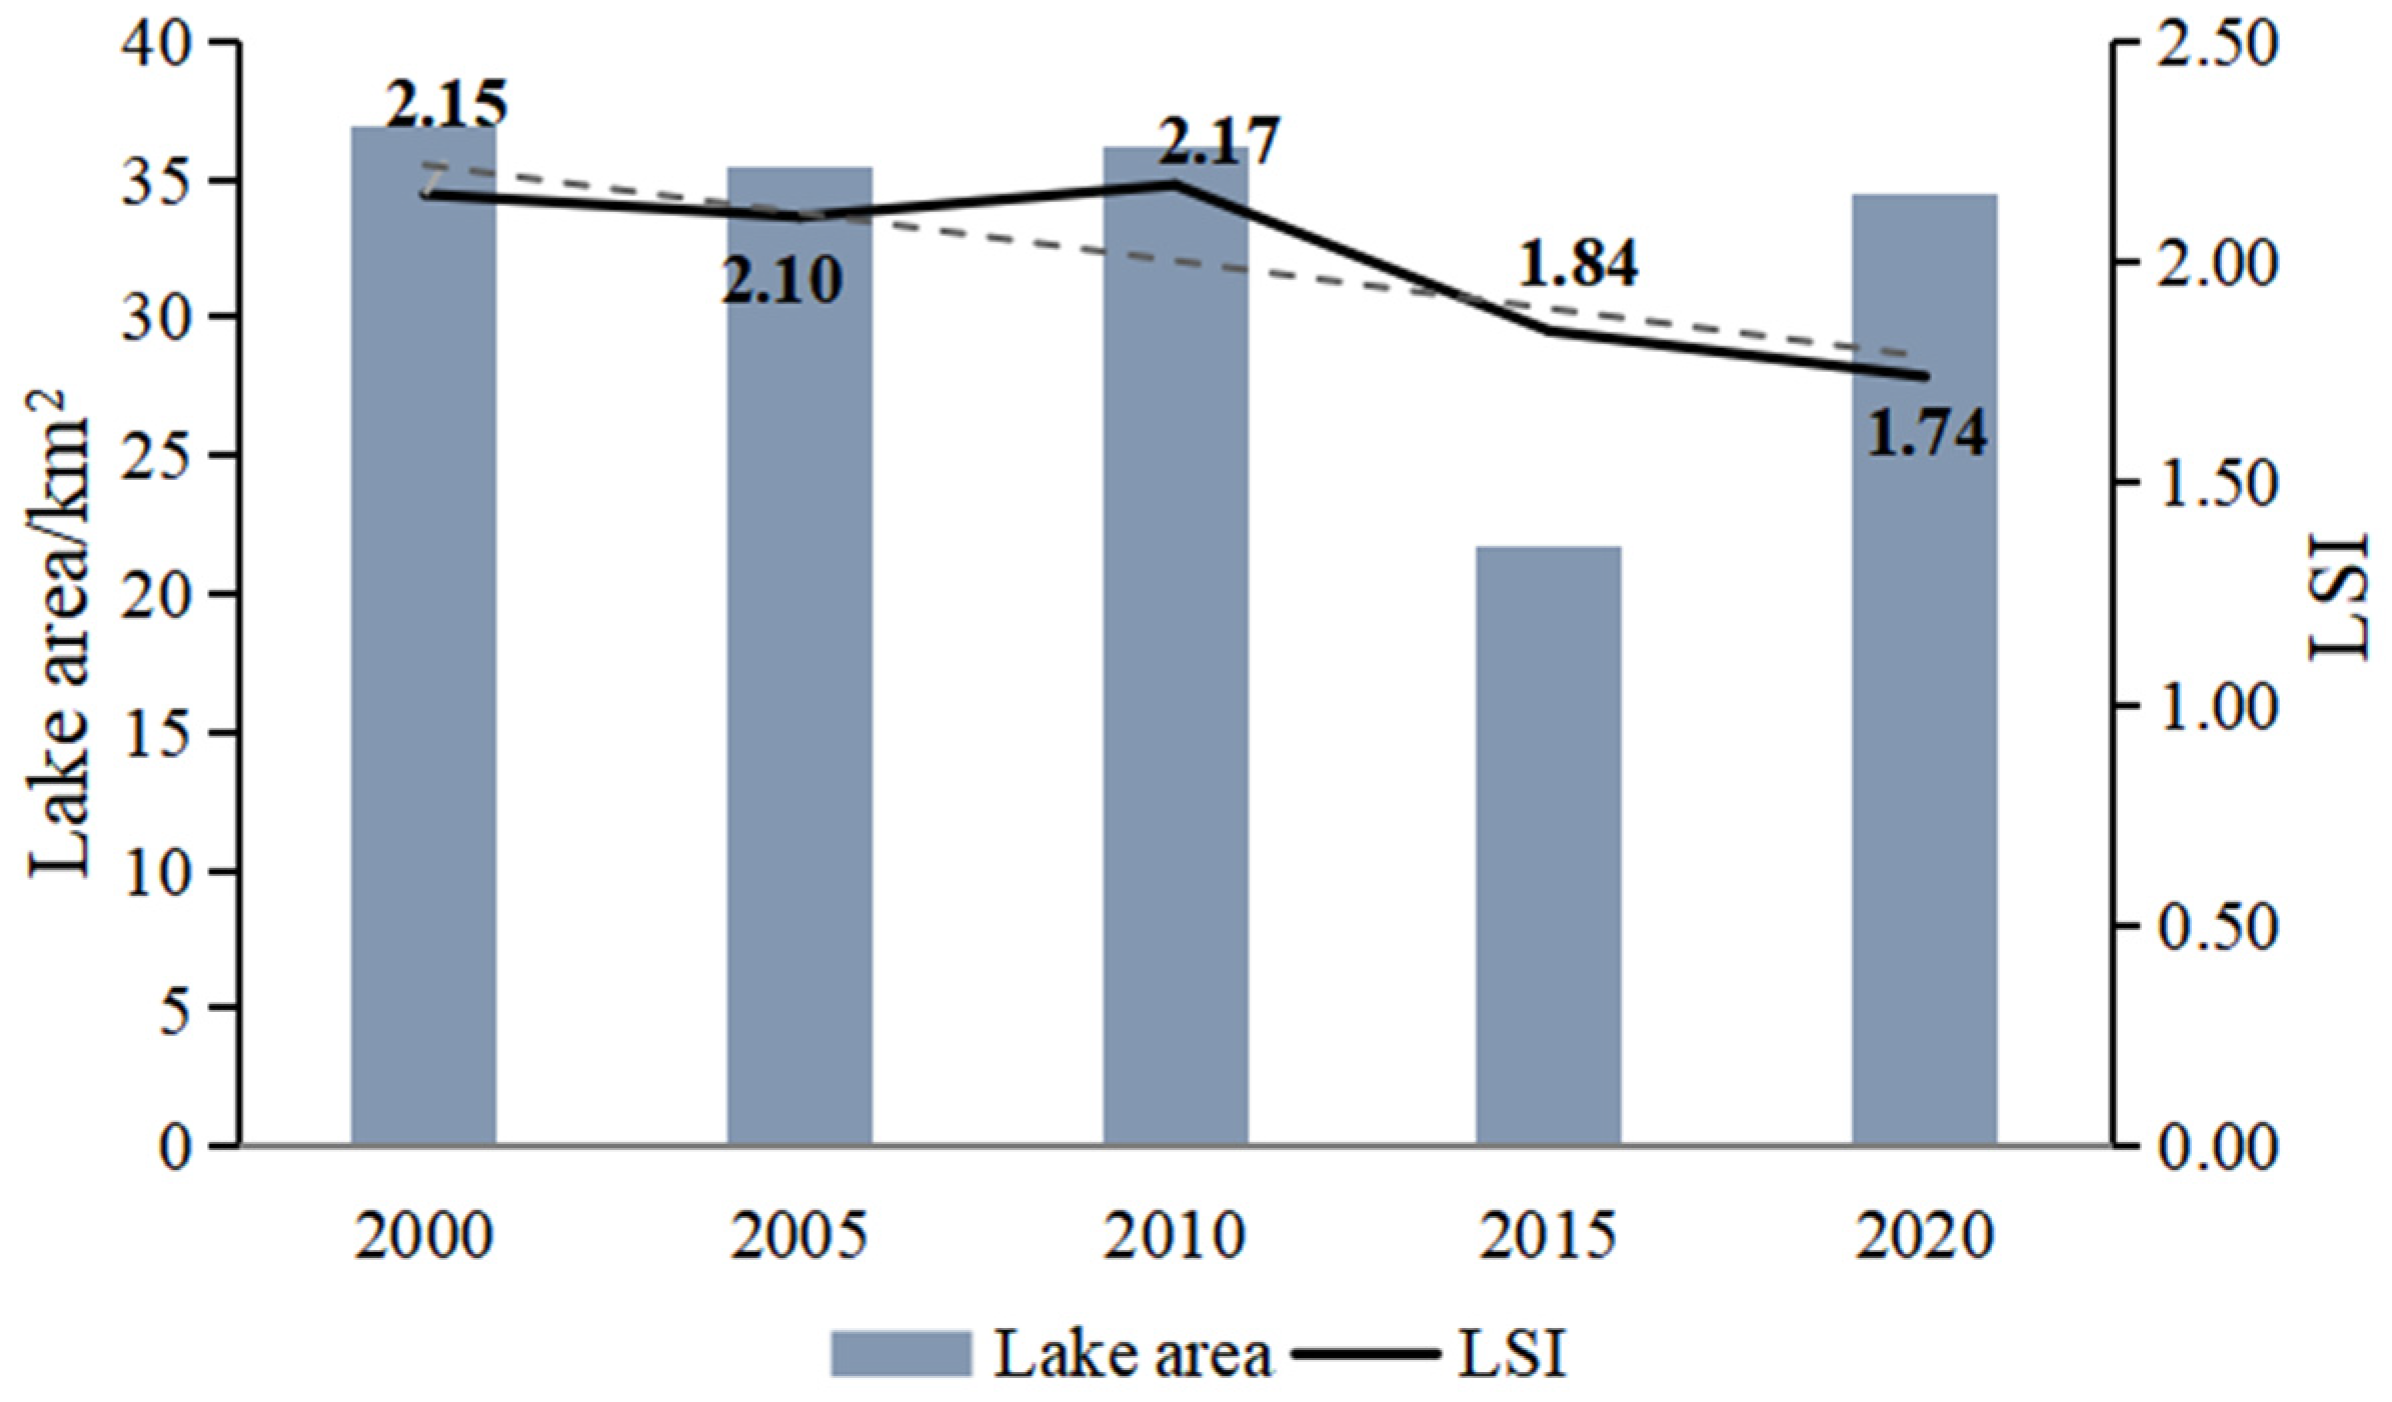
From 2000 to 2020, the area of Qilu Lake showed a downward trend of fluctuation, with an overall reduction of 0.71 km2, which can be divided into three stages: (1) from 2000 to 2010, the area of the lake was relatively stable, fluctuating around 36 km2; (2) from 2010 to 2015 or so, the lakes have been reduced in a large scale, with a change rate of −40%; (3) after about 2015, the lake gradually expanded and the area rebounded (Table 2).
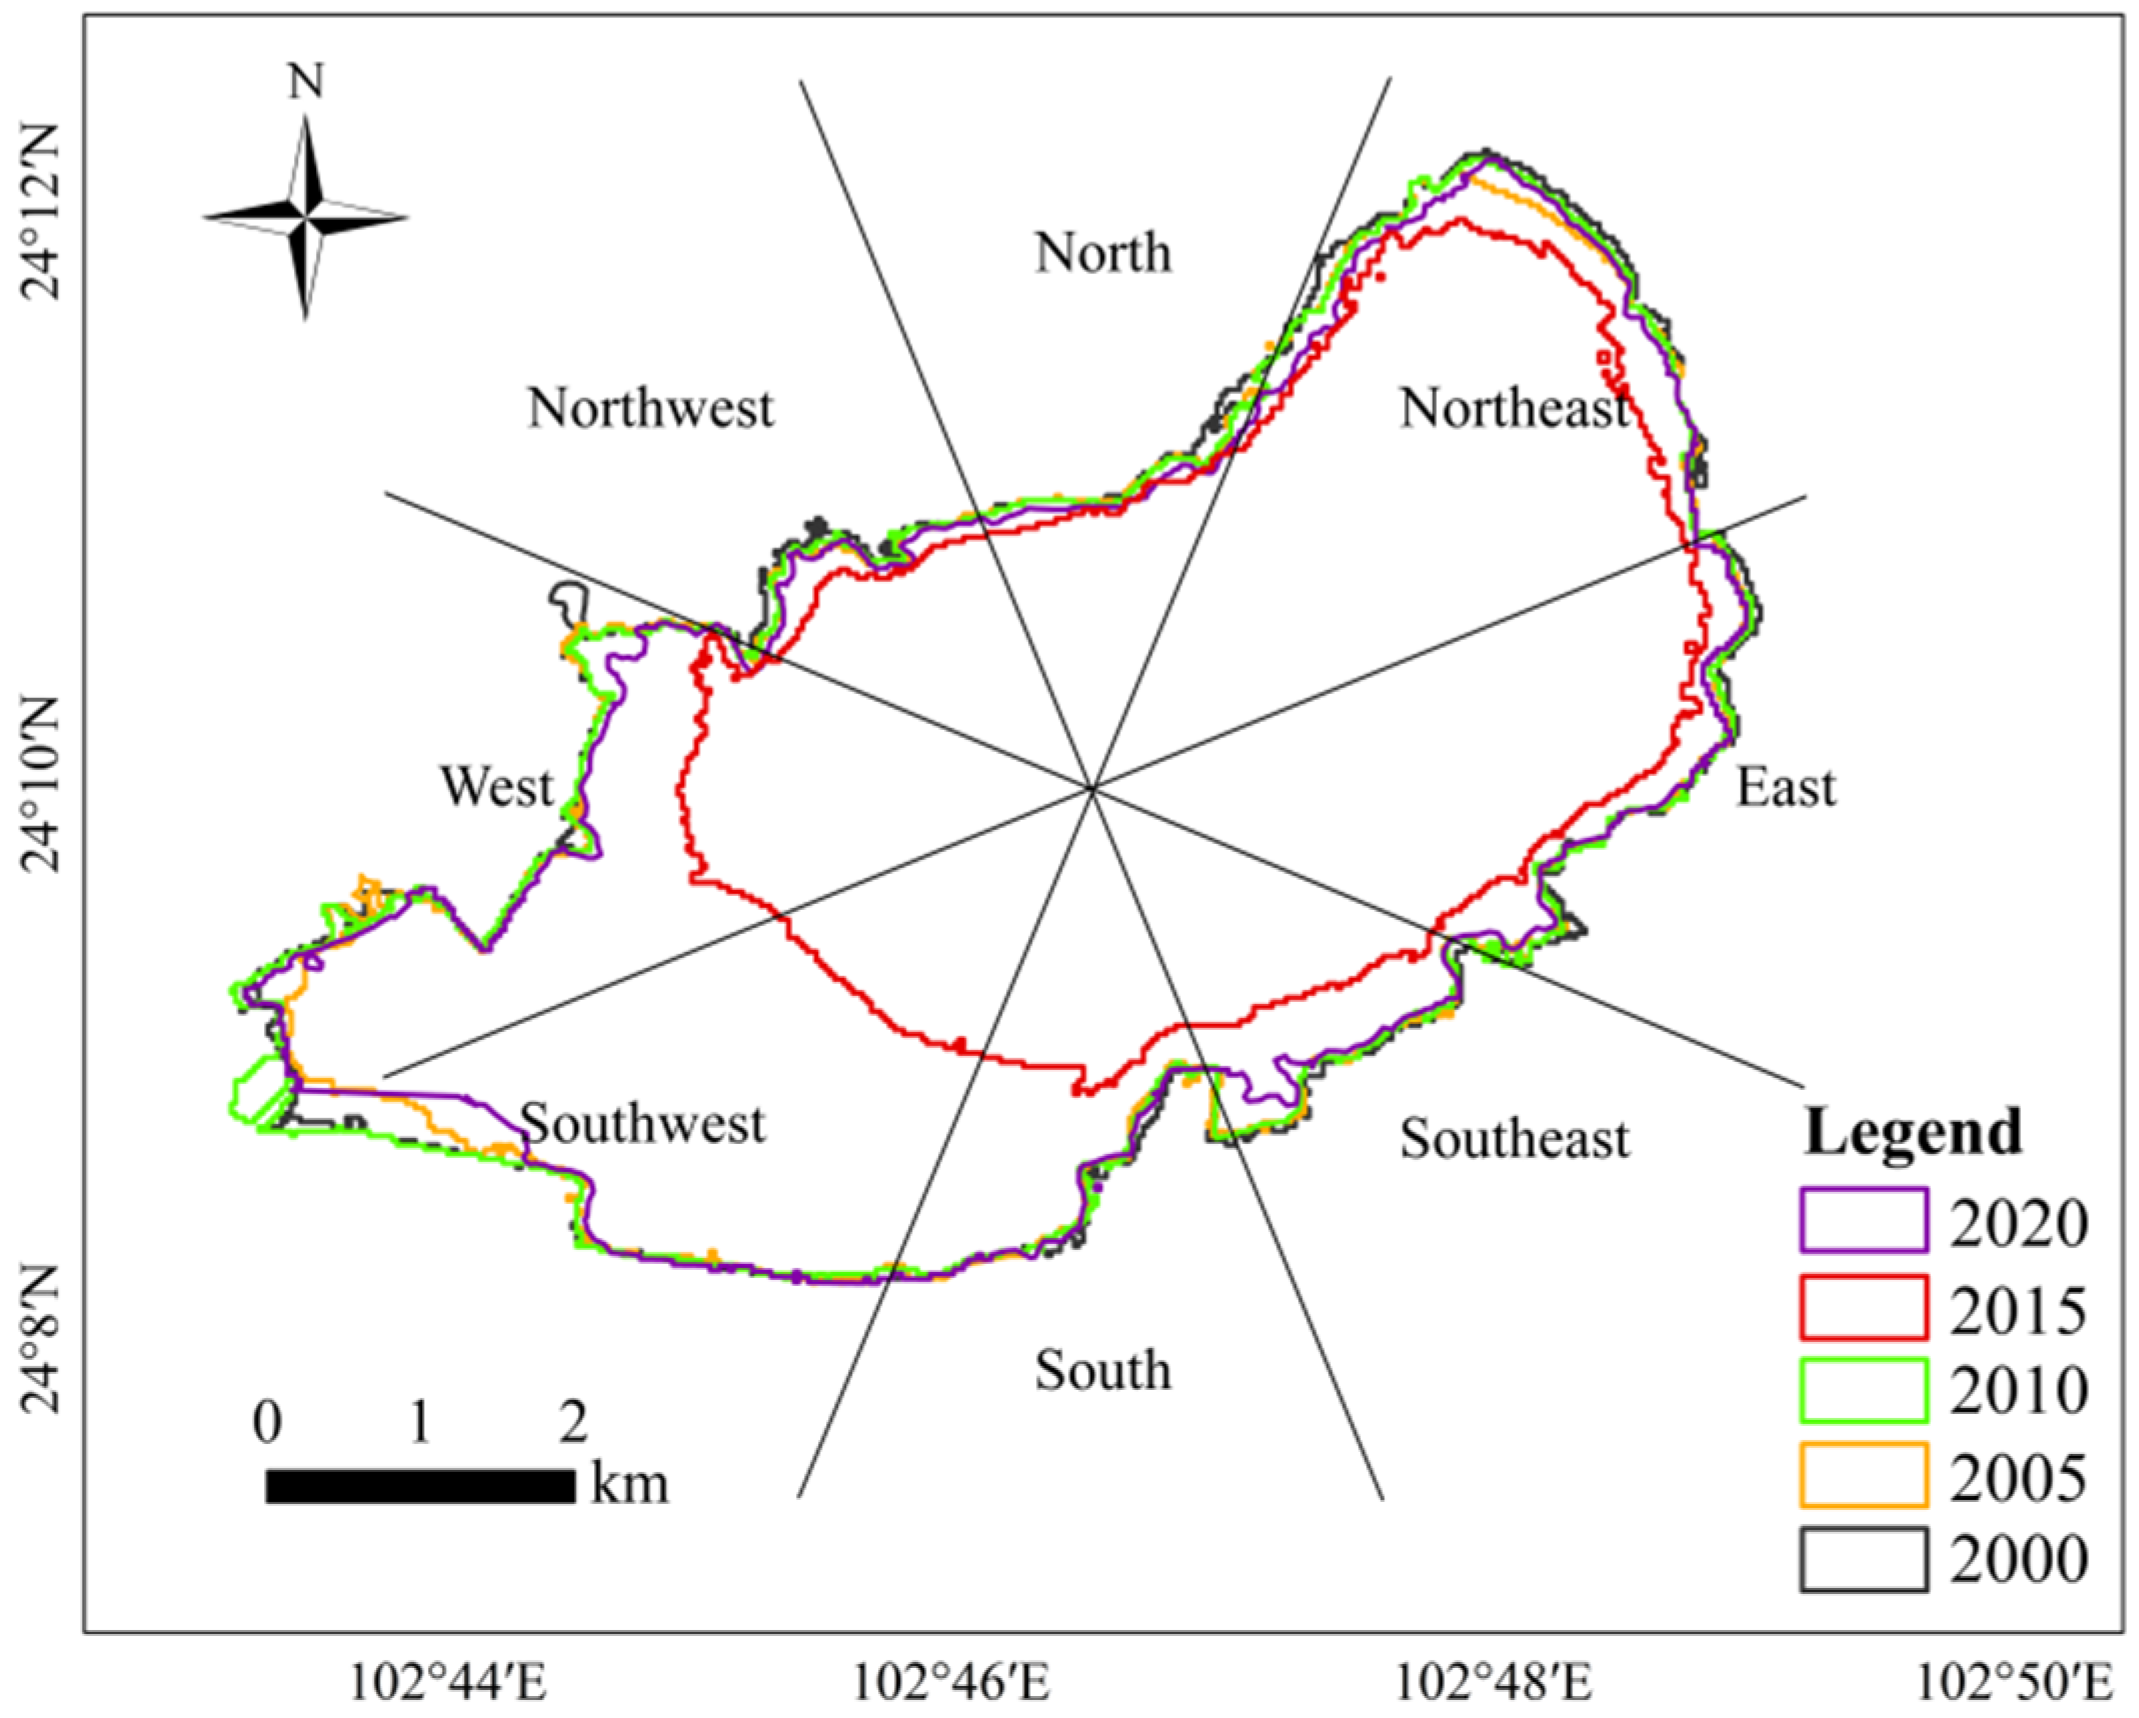
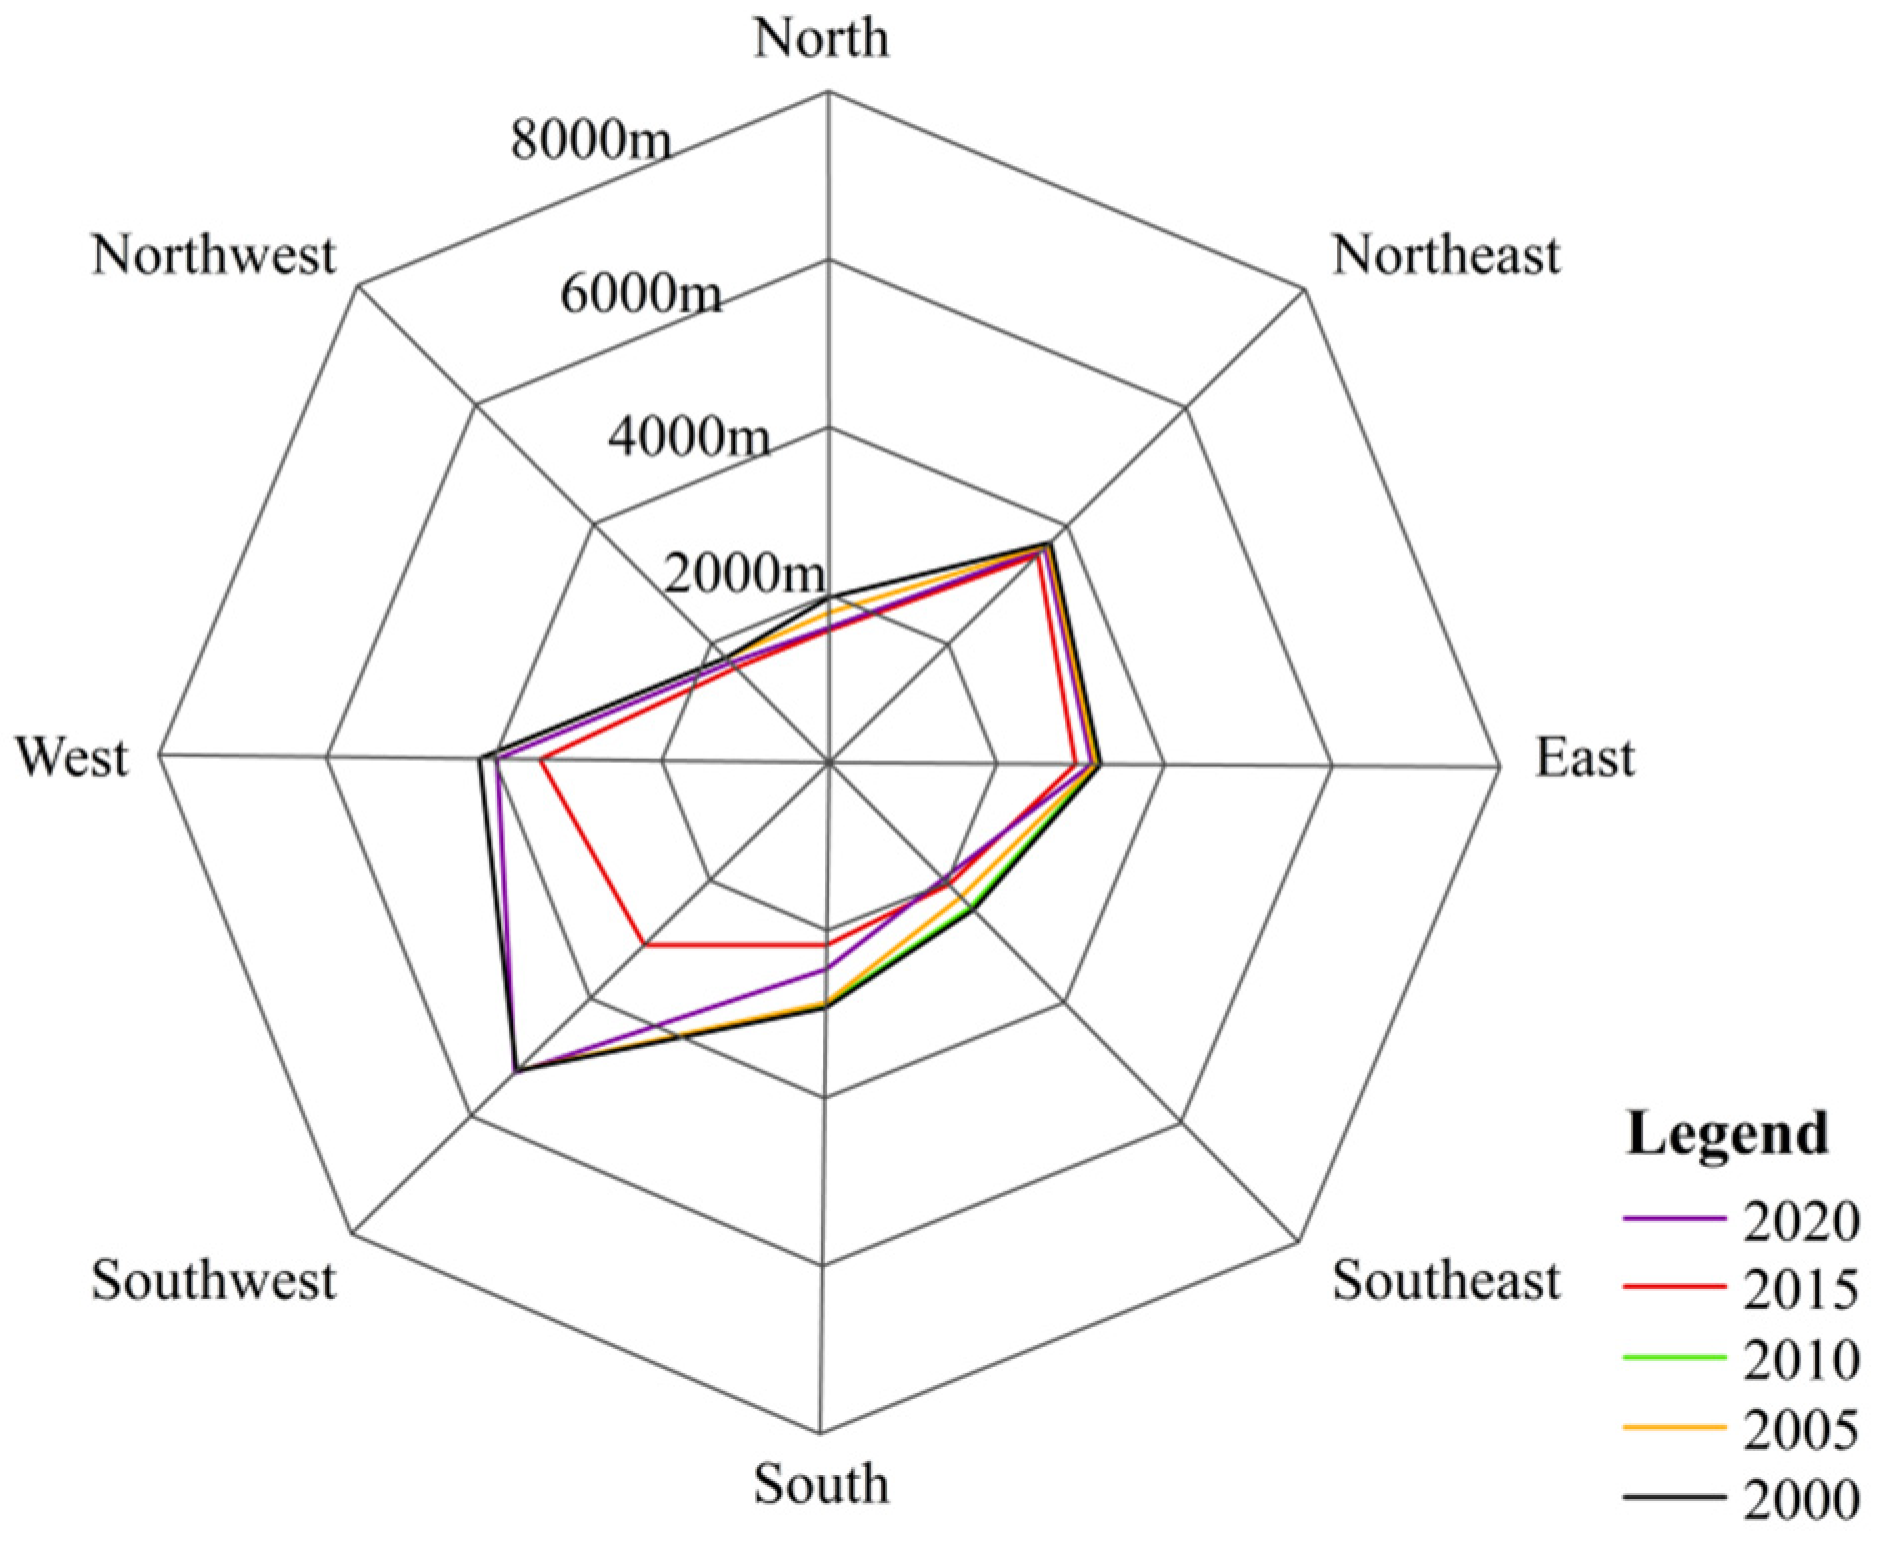
We used the quadrant orientation analysis method in geometry for reference to analyze the spatial change trend of the lake area from eight directions: east, northeast, north, northwest, west, southwest, south, and southeast (Figure 6 and Figure 7, Table 3). On the whole, from 2000 to 2020, the spatial changes of Qilu Lake in all directions showed the characteristics of reduction, especially in the southwest and west, with the area reduced by 0.44 and 0.49 km2, respectively. The second largest reductions were in the north and south. In these two directions, the area of Qilu Lake has shrunk by 0.29 and 0.22 km2. However, the area in other directions decreased slightly, and the northwest direction only decreased by 0.09 km2. Compared with other years, the lake profile in 2015 decreased by 200 m in this direction. From the stage of lake spatial change, except for 2015, the lake contours in other years are roughly consistent with a small change range. From 2000 to 2010, the area of lakes changed steadily. In the early stage, it was mainly reduced, while in the later stage, it was mainly expanded. From 2010 to 2015, Qilu Lake contracted sharply, with a shrinking area of 7.36 km2 in the southwest, accounting for 1/4 of the total area, and a shrinking area of 3.2 km2 in the west. From 2015 to 2020, Qilu Lake will gradually expand, and its area will return to the state close to that before 2015. Its expansion direction is consistent with the reduction direction of the previous stage, mainly reflected in the southwest and west directions. The lake area will increase by 6.82 km2 and 2.8 km2, respectively.
3.3.2. Lake Contour Changes
In order to visualize the characteristics of lake contour changes, we used the landscape shape index (LSI) to measure the shape changes of the contour of Qilu Lake from 2000 to 2020. The landscape shape index indicates the ratio of the circumference of a plaque to the circumference of an equal area and is an important indicator for quantifying the complexity of the landscape shape; the larger the value, the more complex the landscape shape and vice versa—the smoother and simpler the shape, when its value is 1, the landscape is round [22,48]. The results show (Figure 8) that the shape index of Qilu Lake has generally shown a downward trend in the past two decades and its changes mainly include two stages: the shape index in the previous stage (2000–2010) is not less than 2.10, which roughly maintains a stable level, first falling and then rising, and the lake contour at this stage maintains the original complexity and is less disturbed by the outside world. In the later stage (2010–2020), the shape index gradually decreased from 2.17 to 1.74, for which the index fell the most from 2010 to 2015, and the lake contour tended to be flat, which was due to the increasingly severe human disturbances such as road damming, water release, and construction of scenic spots around Qilu Lake at this stage, coupled with the uneven distribution of rainwater in the river basin, resulting in low regularity of lake contour changes [22]. There is a certain degree of positive correlation between lake contour and area size change.
3.3.3. The Geometric Center of the Lake Changes
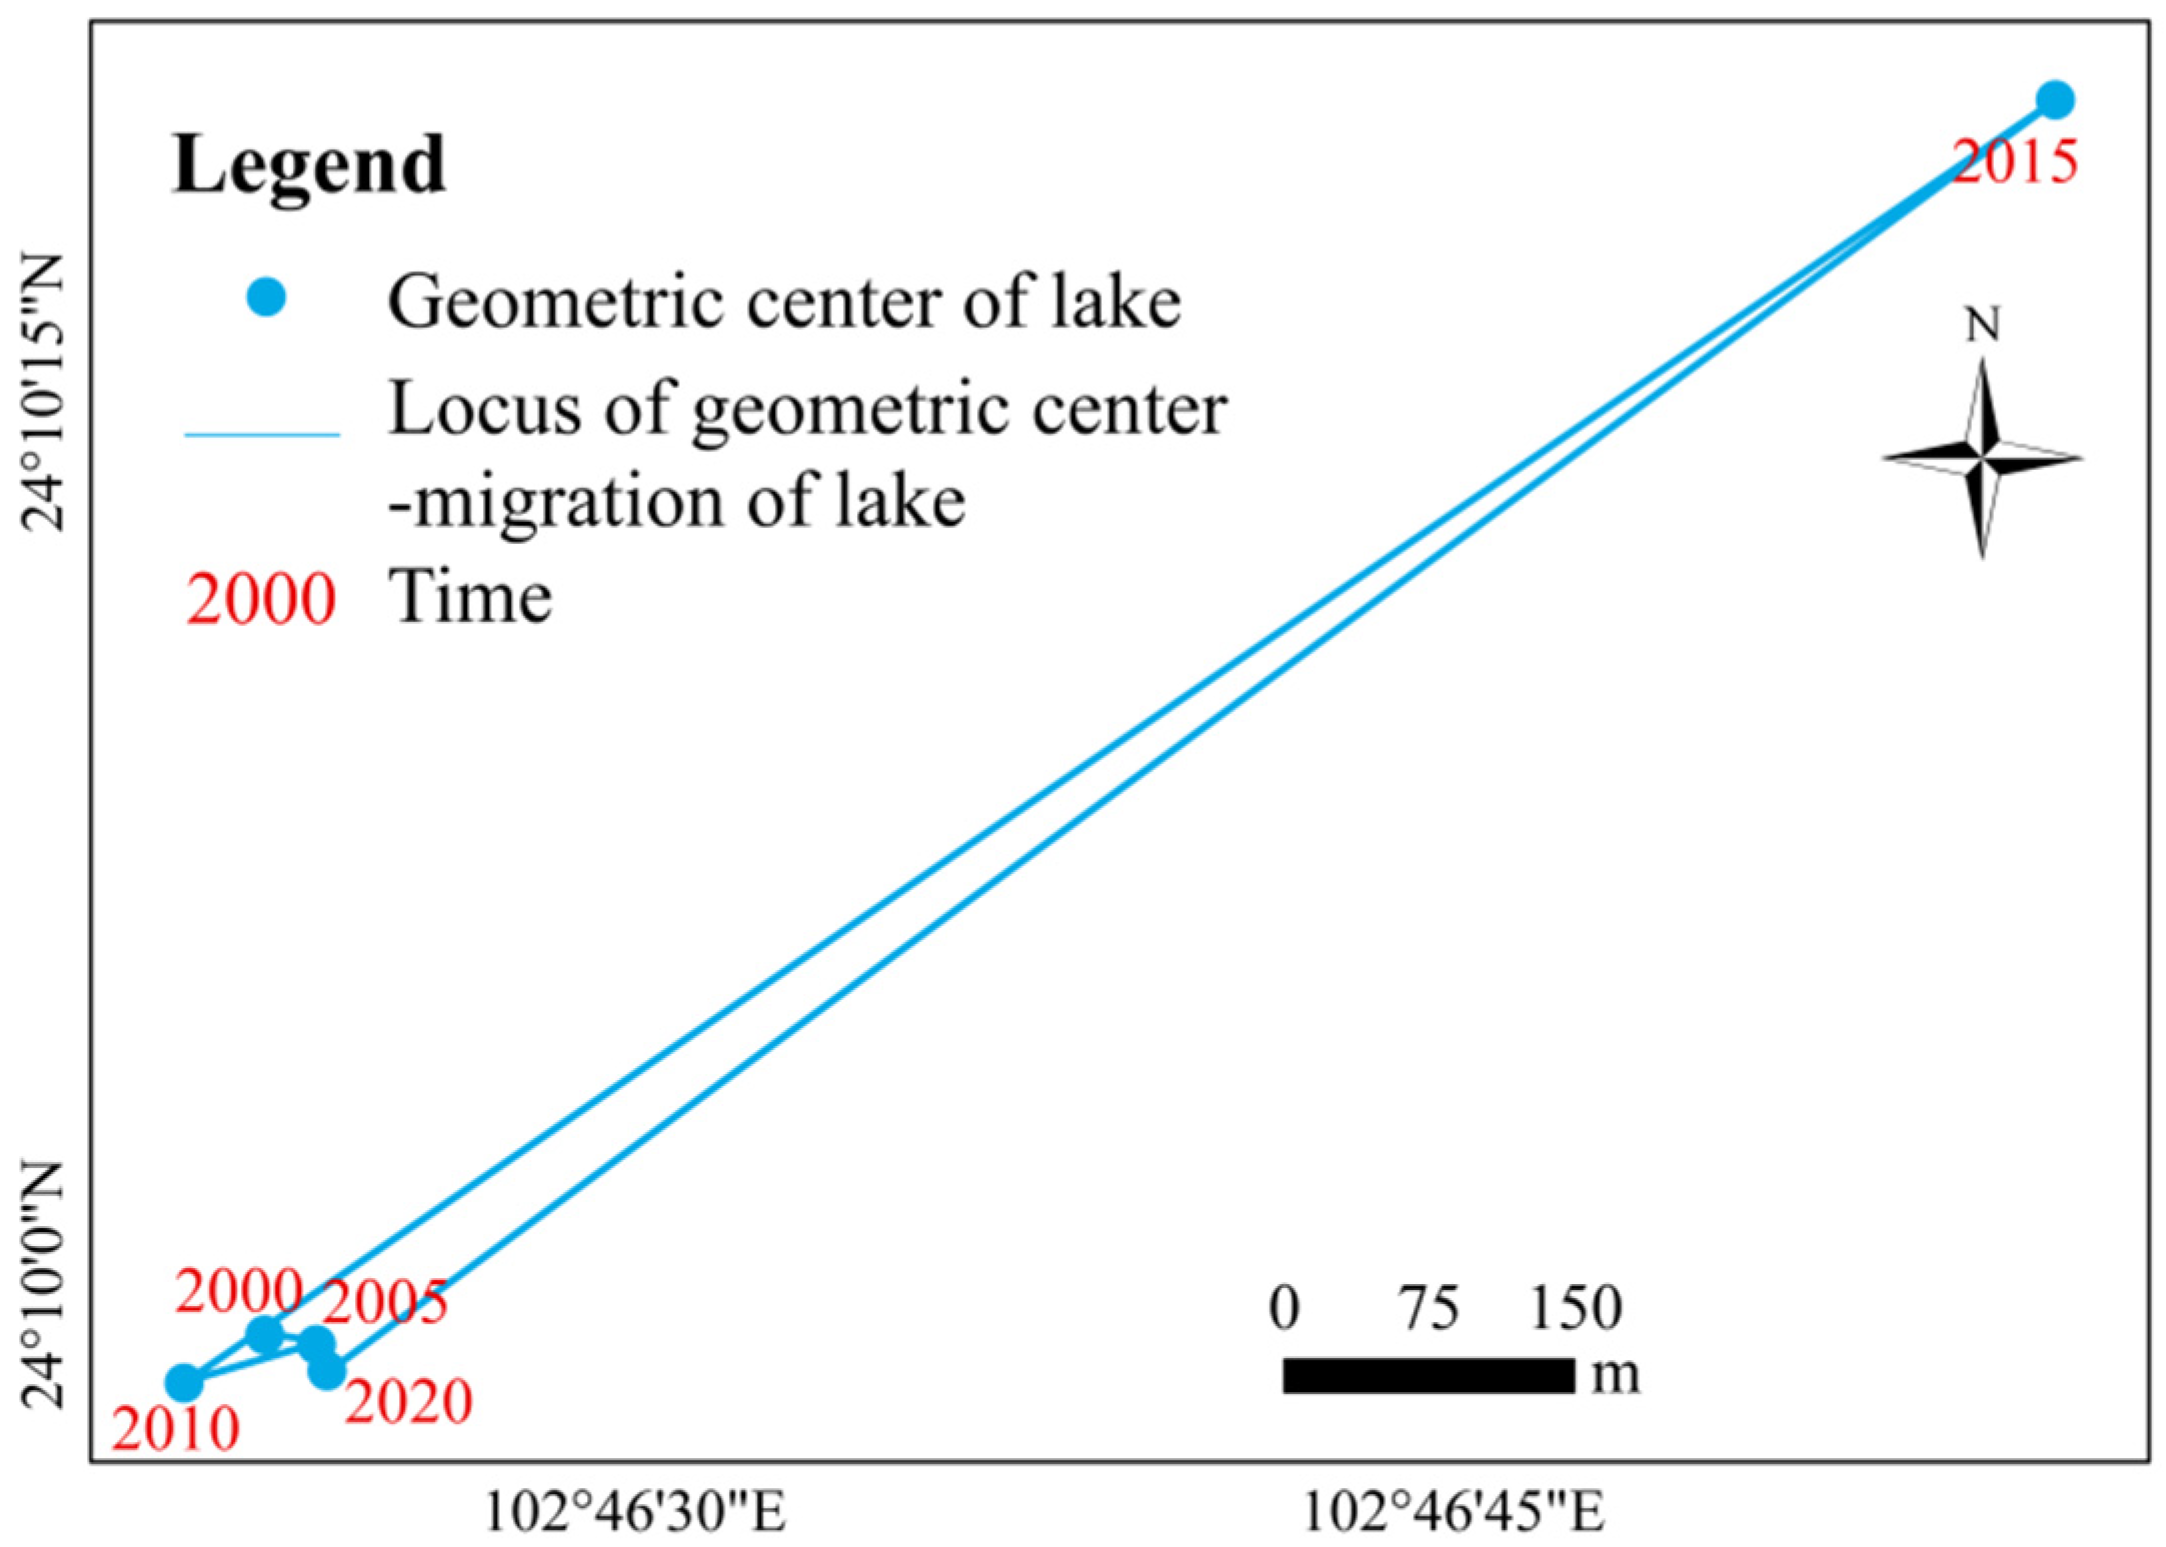
Spatial variations in lake area inevitably lead to the migration of the geometric center of the lake (Figure 9). Using the Calculate Geometry function of GIS to obtain the geometric center coordinate position of the lake, we found that the geometric center of Qilu Lake did not change significantly from 2000 to 2010, but its position shifted significantly to the northeast in 2015, with a migration distance of 1173 m, and the geometric center returned to the vicinity of the center in 2005 in 2020. On the whole, the change in the geometric center position of Qilu Lake from 2000 to 2020 mainly occurred in the southwest–northeast direction.
3.4. The Relationship between Lake Area and Water Level
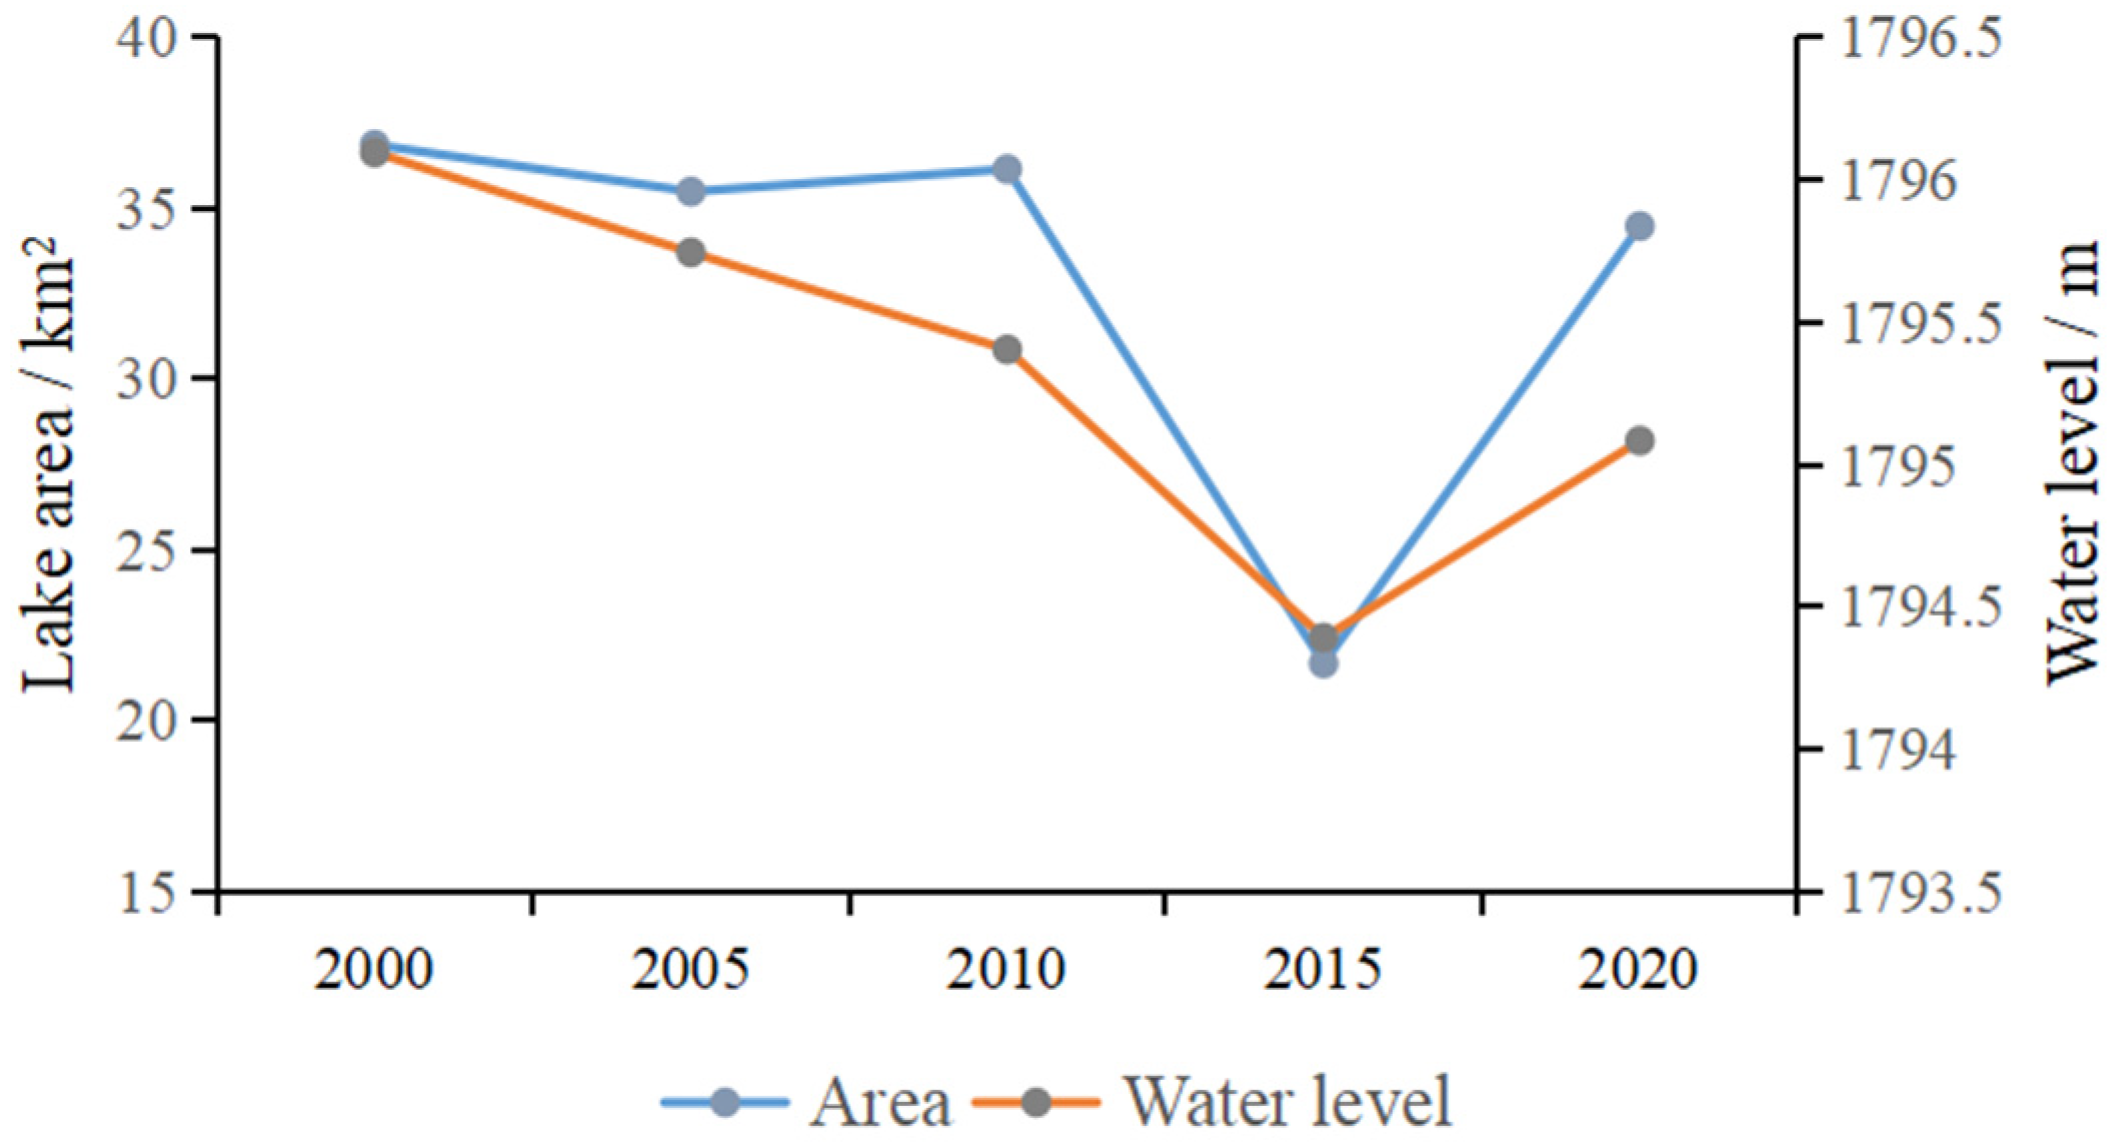
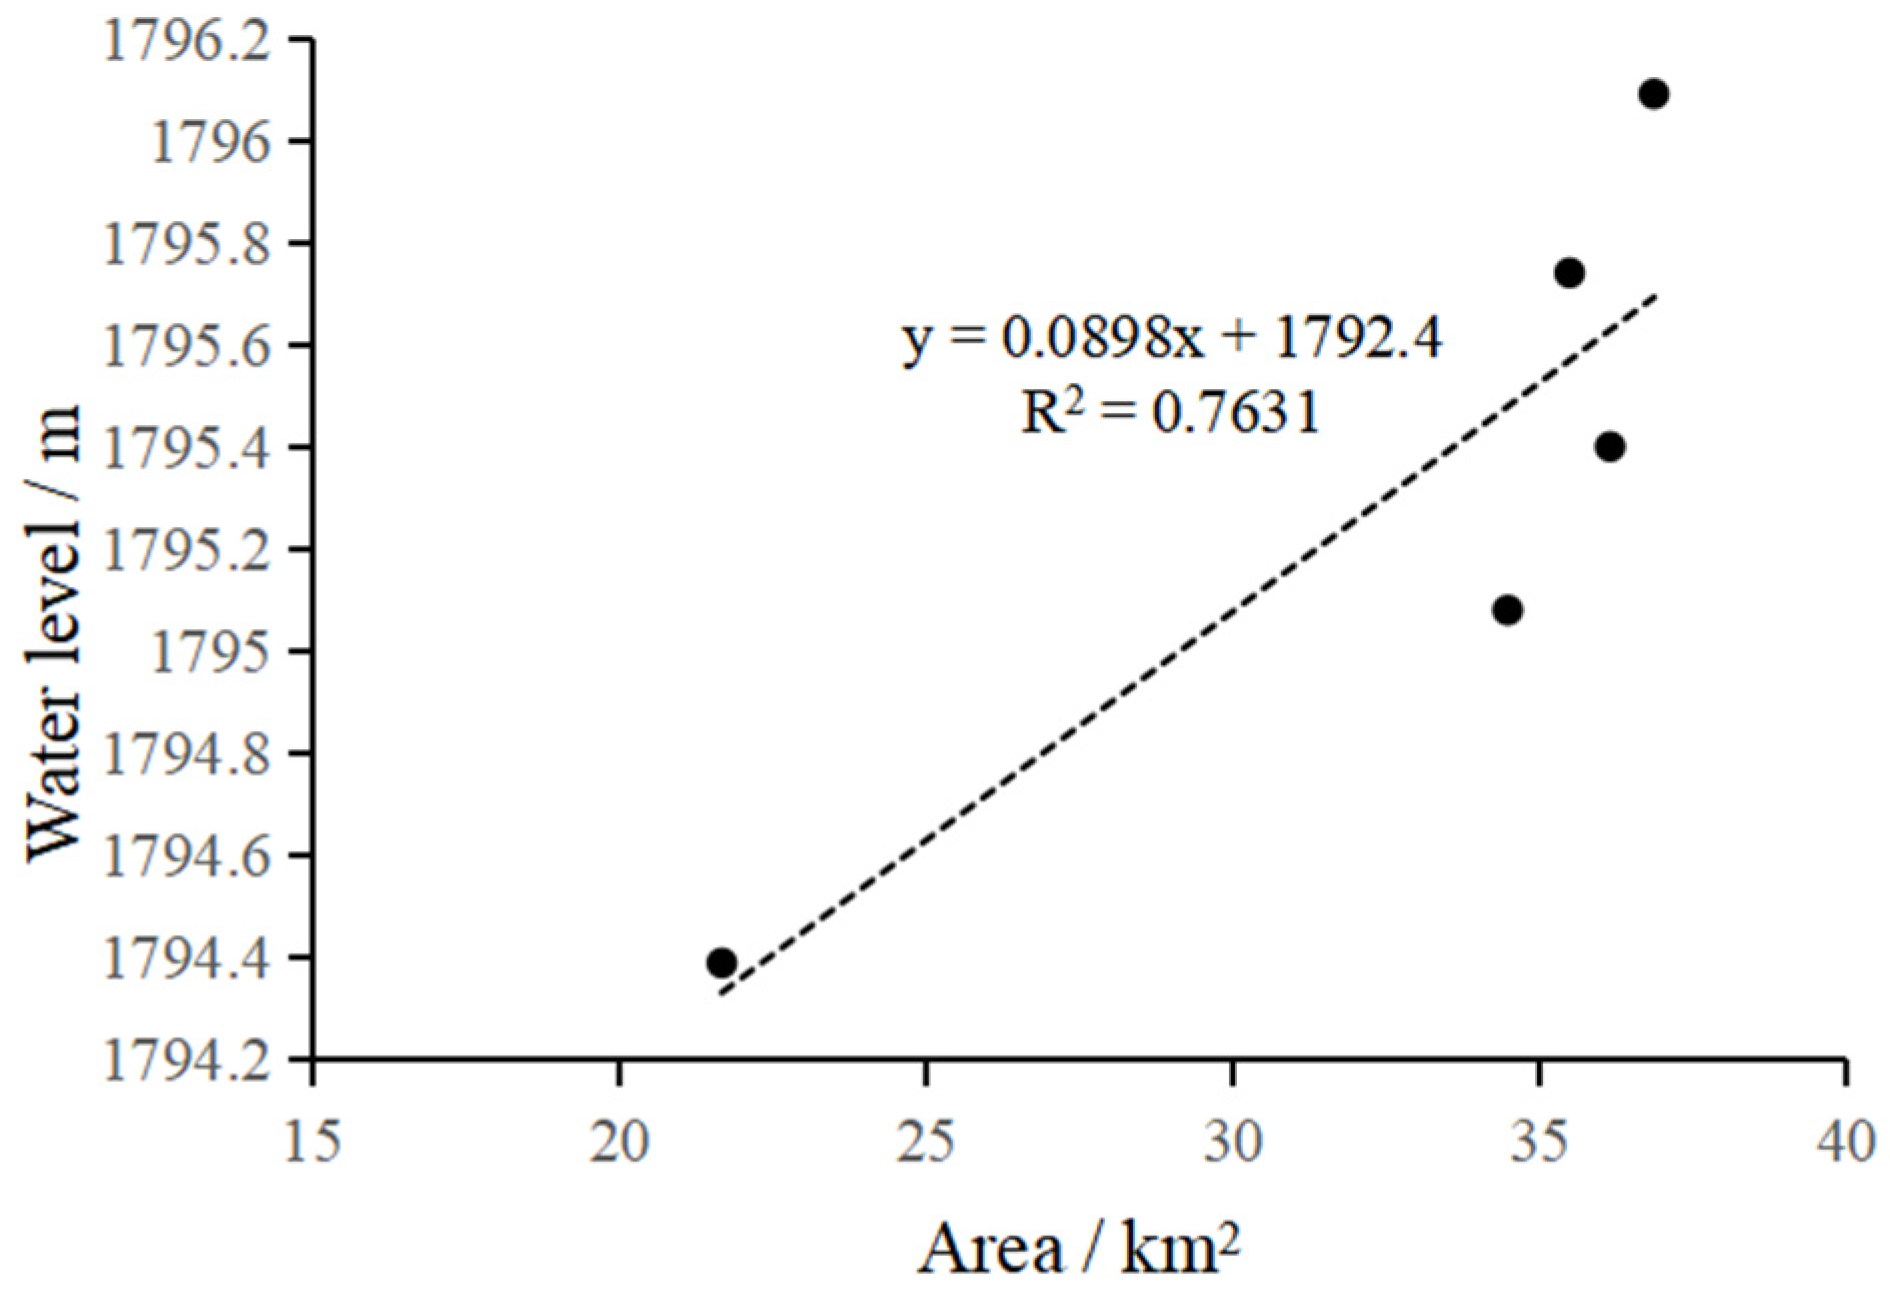
In order to maintain data consistency and reduce errors, we selected the water level data in February of each year corresponding to the remote sensing data used for area extraction to analyze the water level change and its relationship with area change (Figure 10 and Figure 11). From 2000 to 2020, the water level of Qilu Lake showed a decreasing trend and its change was roughly divided into two stages: from 2000 to 2015, the water level of the lake gradually decreased, with the largest drop from 2010 to 2015 reaching 1.01 m. According to the linear regression analysis (Figure 11), we found that the water level change of Qilu Lake was positively related to the area change. Except for small fluctuations, the characteristics of the change trend were generally consistent.
The area of Qilu Lake in 2000, 2005, 2010, and 2015 and the corresponding water level data were taken as the data for the inversion model. The linear model, exponential model, logarithmic model, and polynomial model of different times were selected to establish multiple area water level regression models, and the correlation degree of model fitting was measured by the correlation coefficient R2. The larger the correlation coefficient, the better the model fitting performance [30]. The R2 of the linear model, exponential model, logarithmic model, and polynomial model with different degrees were 0.8995, 0.9039, 0.8815, and 0.9259, respectively. Finally, the polynomial models of different degrees with the highest correlation coefficient were selected as the models for retrieving the lake water level elevation from the water surface area of Qilu Lake. The results are as follows:
where H is the water level elevation of Qilu Lake and S is the water surface area of Qilu Lake in the corresponding year.
The water level elevation of Qilu Lake in 2020 predicted by the inversion model was 1795.10 m, with an error of only 0.01 m from the measured value of the hydrological station at the corresponding time, and the prediction accuracy was close to 100%. Therefore, the inversion model established in this study can accurately predict the corresponding water level elevation data using the lake area data, so as to establish the digital model relationship between area and water level.
3.5. Drivers of Lake Area Change
With the intensification of global warming, different regions of the world are experiencing more extreme weather events and drought has become one of the major threats. Between 2009 and 2014, continuous drought occurred in Southwest China in general, and in Yunnan specifically, resulting in a serious shortage of water resources in most lakes in Yunnan. The water volume of lakes could not meet the normal requirement for evaporation and human demands and the water level of several plateau lakes dropped to the lowest level in nearly 30 years. Although the meteorological data show that the precipitation increased between 2014 and 2015, the Qilu Lake surface remains shrinking, which indicates that the factors causing the reduction in lake area and water level include both natural factors and socio-economic factors. Due to the occurrence of severe drought, Qilu Lake dried up over a large area. Villagers around the basin reclaimed the land from the dried part of the lake and thus accelerated the reduction of Qilu Lake [9]. In addition, the Qilu Lake basin is densely populated, the urbanization process is accelerating, the area of human interference is expanding, and the whole lake is surrounded by artificial dikes and reclamation, resulting in the complete destruction of the natural land water transition zone by hardened facilities and reclaimed farmland, reducing the area and volume of the lake basin. The construction of large-scale projects, especially the Pan Asian Railway Tunnel Project, has damaged the balance of groundwater resources in the southwest of the sea; it also aggravated the drought crisis of Qilu Lake [9,23].
After 2015, the dry weather in the Qilu Lake basin has eased and the sharp reduction of its area has also been highly valued by the government. At present, Tonghai County implements the “lake revolution” and makes every effort to harness Qilu Lake to save water and reduce emissions at the source, to replace the water supply in the basin, to complete the Dalongtan water diversion project, and to replenish Qilu Lake. Until 2020, the Qilu Lake area gradually expanded and was recovered to its original state.
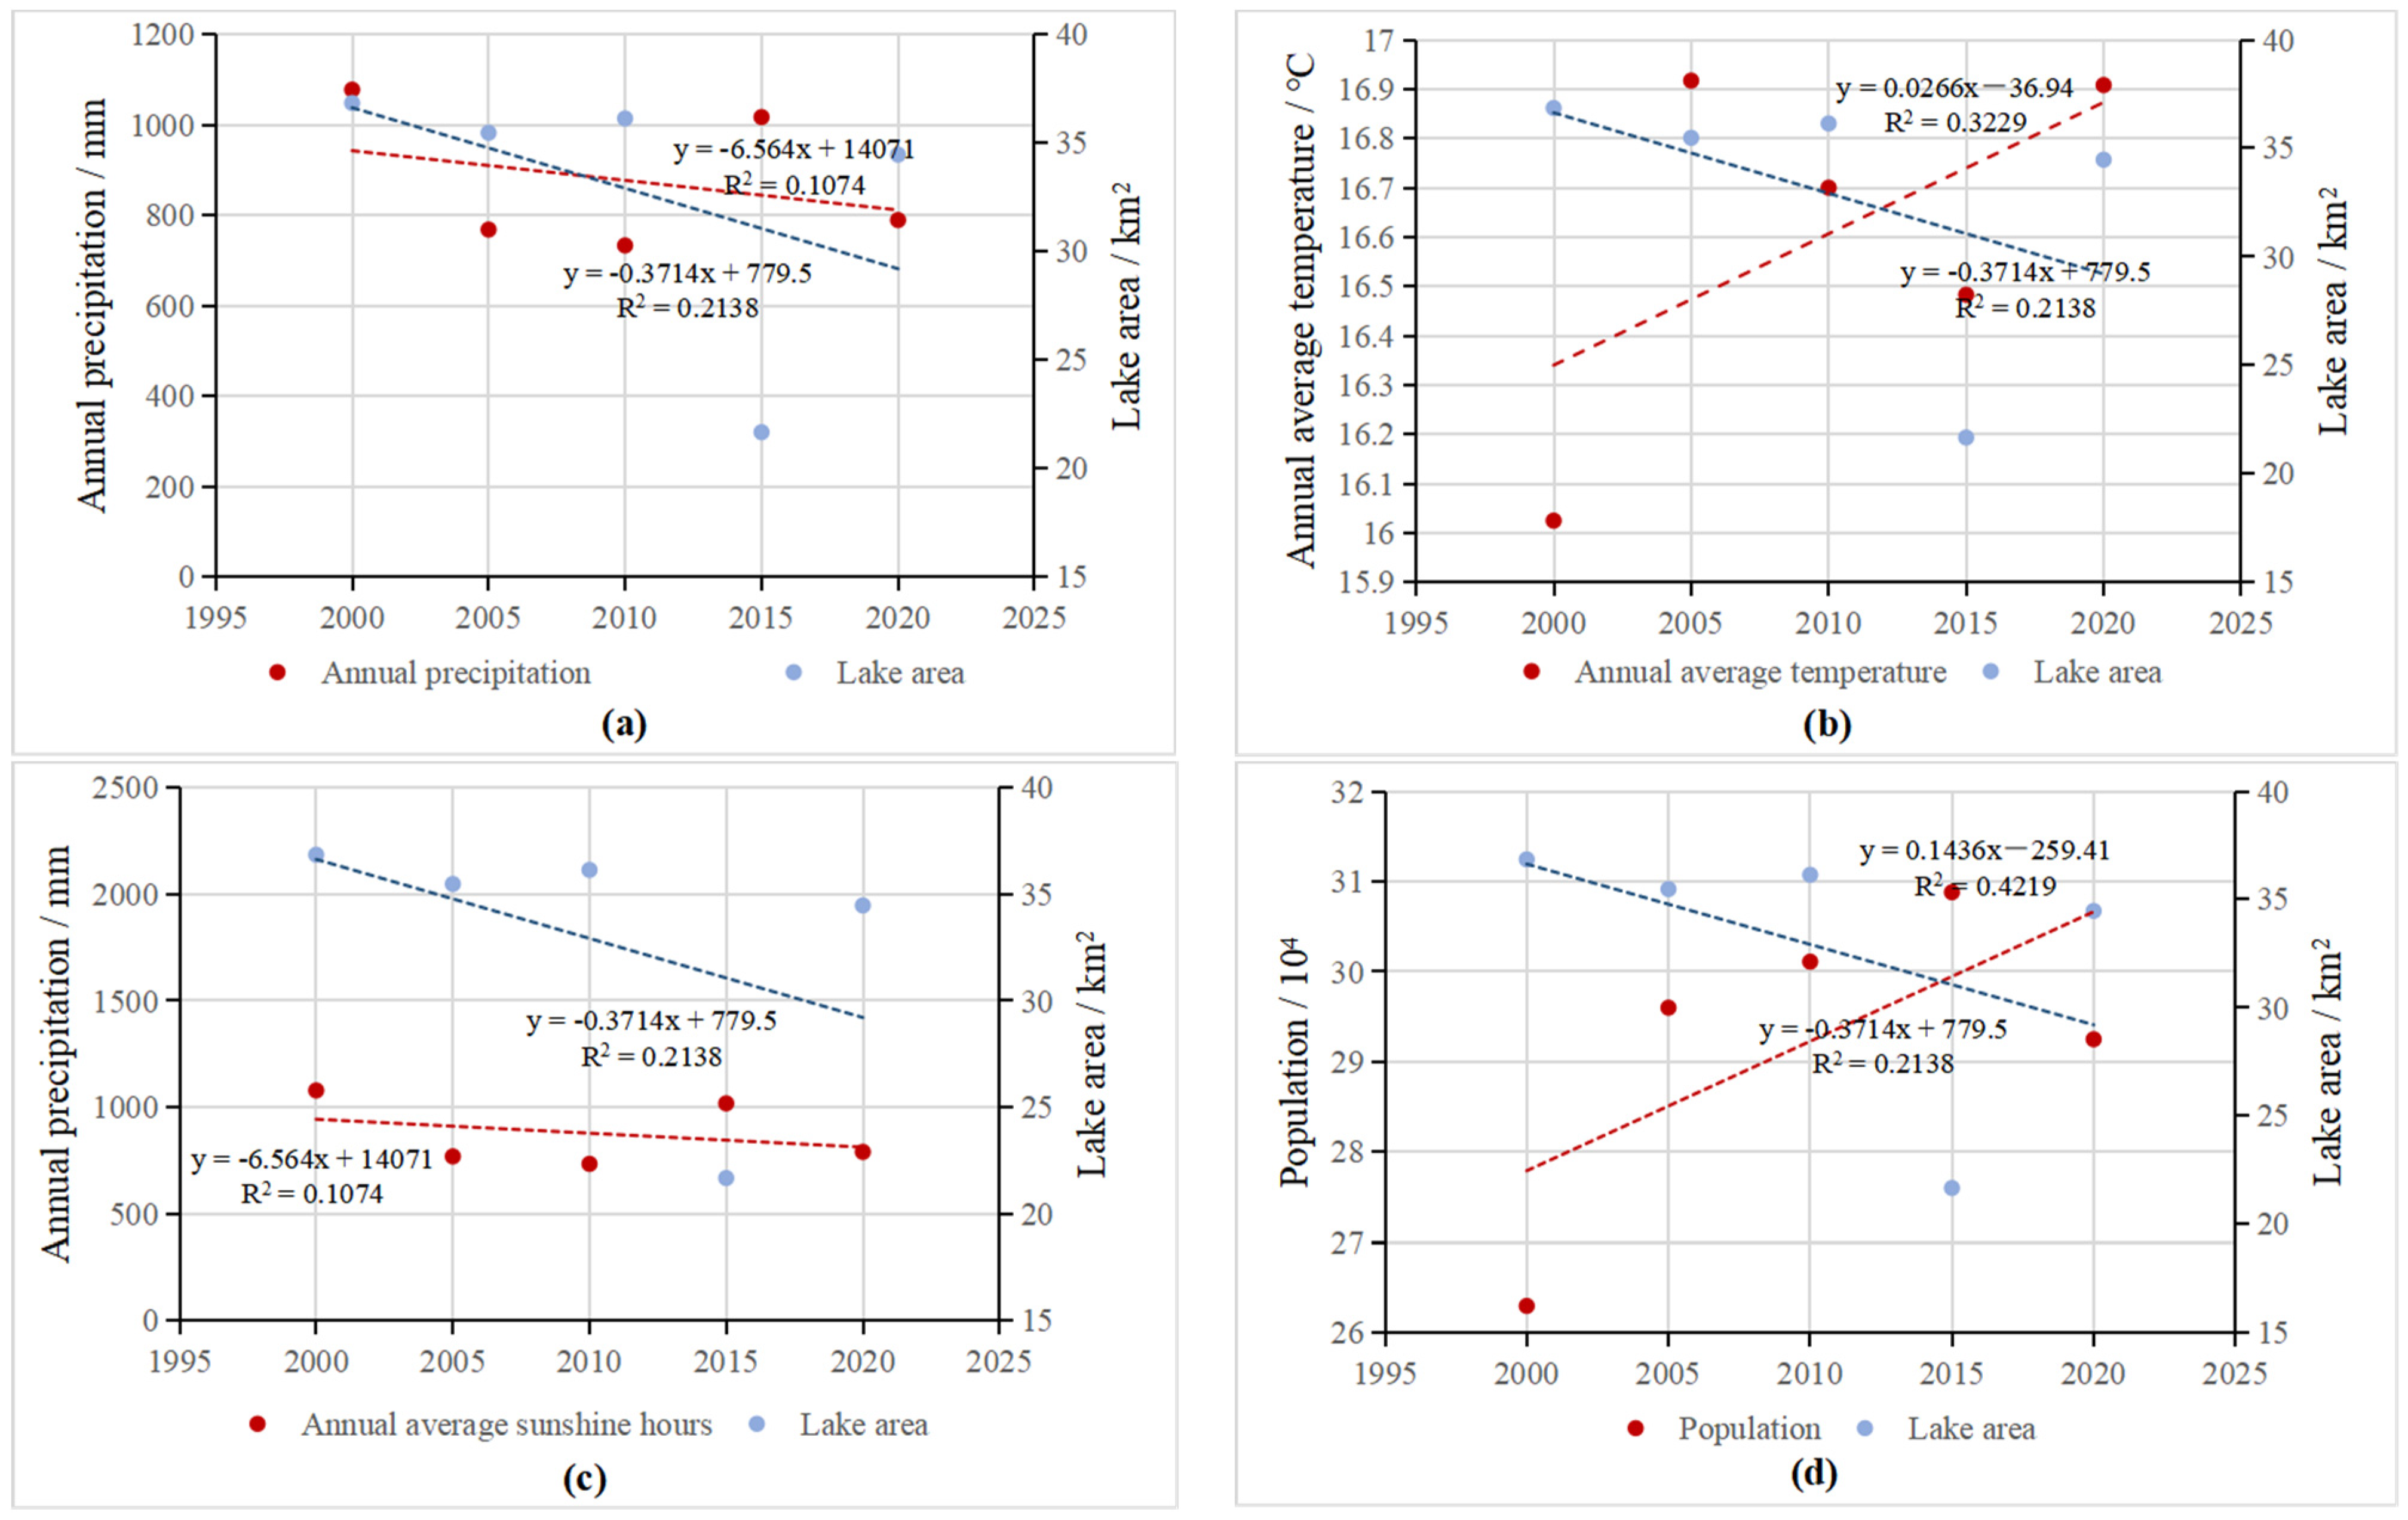
In order to better quantify the driving factors of the changes in Qilu Lake area in the last 20 years, we selected four natural factors, namely annual average temperature, annual precipitation, annual average sunshine hours, and annual average evaporation, and five socio-economic factors, namely population, GDP, gross industrial output value, gross agricultural output value, and crop planting area for analysis. Through the analysis of grey correlation degree [49], it was found that, on the whole, the influence of natural factors on the changes in Qilu Lake area is greater than that of social and economic factors (Table 4). The order of correlation degree of natural factors is: annual average temperature > annual average sunshine hours > annual precipitation > annual evaporation. The order of correlation degree of social and economic factors is: population > crop planting area > total industrial output value > GDP > total agricultural output value. In general, the annual average temperature, annual precipitation, annual average sunshine hours, and population have the greatest impact on the change in the Qilu Lake area. According to the linear analysis results (Figure 12), it can be seen that the annual average temperature (b), annual average sunshine hours (c) and population density (d) are negatively correlated with the lake area, and the population density and annual average temperature are more significant. Annual precipitation was slightly positively correlated with the lake area (a).
The stepwise regression analysis method [50,51] was used to screen out the main driving factors affecting the water level changes in Qilu Lake, including the gross industrial output value (p = 0.001) and the planting area of crops (p = 0.004). Based on this, a multiple regression model between these two driving factors and the water level of the lake was established. The mathematical expression of this model is:
where W is the lake water level elevation and X1 and X2 represent the two driving factors of gross industrial output value and crop planting area, respectively. Through the above analysis, it can be seen that the area of Qilu Lake is mainly affected by natural factors such as annual average temperature and annual average sunshine hours, and the main driving force of water level change is socio-economic factors. This can help explain the difference in the development trend of lake area and water level between 2005 and 2010. At this stage, the total industrial output value and agricultural planting area of Tonghai County doubled and the lake water level dropped significantly. During this period, the annual average temperature and other natural factors did not change significantly, and the lake area did not change significantly due to the impact of the experimental extraction time scale.
4. Discussion
So far, the research period for the monitoring of the area of Qilu Lake has mainly focused on before 2015, and time series studies after that are relatively lacking. In this paper, it was found that Qilu Lake suffered severe shrinkage from 2010 to 2015 through water extraction, which is consistent with the relevant research results. However, due to the selection of image data and the different methods of water extraction, there are different degrees of discrepancy between the data results obtained by each study [22,23,52]. Our extraction results are most consistent with the research results of Tao Wang [22] et al.; the difference in lake area data in 2000, 2005, 2010, and 2015 is less than 0.1%, and the common point is that the water extraction method we adopted is MNDWI. It can be seen that the selection of water extraction methods has a key impact on the data accuracy of the extracted results, and the accuracy verification of the lake extraction results has become a necessary link to ensure the credibility and scientificity of the research results. In previous studies, when selecting the water index extracted from lakes, only visual comparison or direct continuation of the results of predecessors were used, which made the selection of water extraction methods unscientific. Therefore, in order to overcome this problem, this paper used hyperspectral data images (EO-1 Advanced Land Imager) from the same time period to verify the accuracy of water extraction results. Launched by NASA on 21 November 2000, EO-1 was one of the first available high-resolution satellite images due to its spatial resolution of 10 m, and its sensor ALI is considered NASA’s alternative data for Landsat TM and Landsat ETM+.
Sentinel series data have become emerging hot data in recent years due to their high resolution, wide global coverage, large amount of available data, fixed revisit cycle, and free policy [53]. However, due to their late emission time, the high-quality image imaging time available is only after 2017, so they are not suitable for long-time monitoring research. On the other hand, affected by the availability of image data and corresponding hydrological and socio-economic data of the river basin, this paper selected five representative and equal time intervals in the past 20 years to carry out long-time monitoring research on the area of Qilu Lake, but this inevitably has the problems of incomplete years and insufficient data. Therefore, in the next step of our research, we will use the Sentinel series of image data to fill the gap in the year caused by the lack of Landsat data, and conduct a short-term specific study of lake changes in the past five years.
This study used the method of time–space fusion and the image data used were all taken from February in the dry season, so the calculation error was controlled from the data source level, making up for the lack of uniformity in the months of data extraction for the Qilu Lake water body [9,23,29]. Yunnan Province, where Qilu Lake basin is located, has typical dry and wet seasons in its climate. However, due to the limitation of data and workload, and considering the representativeness of the research year, this study did not carry out specific calculations and analysis for each year and its dry and wet seasons in the research period. In the next step, the GEE (Google Earth Engine) remote sensing big data platform can be used to help process a large number of remote sensing images with a long time series. In fact, the emergence of this platform provides technical support for researchers to carry out long-term monitoring of resource and environmental elements at the global or regional scales, such as large-scale mangrove distribution, land cover mapping, impervious surface extraction, lake water monitoring, etc. [52,54,55,56,57]. In addition, optical remote sensing data are generally vulnerable to cloud and rain weather. For example, in this study, the optical remote sensing image of a certain year had a high cloud amount affected by weather, and there were few images that met the use conditions. Microwave remote sensing data can supplement the data to a certain extent, but there are still differences in imaging and spatial and temporal resolution between microwave remote sensing data and optical data, so we need to conduct further data collection, analysis, and other processing and joint application research [29]. In recent years, the overall situation of Qilu Lake has not been stable and it is particularly vulnerable to meteorological factors and human activities. Although, with the efforts of the government and all sectors of society, the area of Qilu Lake has been restored and the quality of its ecological environment has been improved to some extent, the lake may change significantly in the future due to extreme weather. Therefore, relevant departments and researchers need to constantly strengthen the management of the lake’s shoreline, perform real-time monitoring, regular research, set and update emergency plans, and carry out governance work reasonably. At the same time, it is also necessary to pay real-time attention to the changes in lake water quality, to protect lake water resources according to law, and to ensure the ecological health of lake water so as to effectively prevent the shrinkage of lake size and ultimately achieve the sustainable development of water resources [58,59].
Author Contributions
Data processing and analysis, Z.W., X.L. and T.Z.; Article writing, Z.W., S.H. and W.L.; Data collection and collation, Z.W., X.L., S.H. and T.Z.; funding acquisition, Z.W. and W.L. All authors have read and agreed to the published version of the manuscript.
Funding
This research was funded by the Yunnan Provincial Department of Education Scientific Research Fund, grant Number 2022Y563, 2023J0722, and the National Natural Science Foundation of China, grant number 31760175 and 31460158.
Acknowledgments
The author thanks the Yuxi Branch of Yunnan Hydrological and Water Resources Bureau for providing data. The authors thank the editors and anonymous reviewers for their invaluable Comments and suggestions.
Conflicts of Interest
The authors declare no conflict of interest.
References
- Yamazaki, D.; Trigg, M.A.; Ikeshima, D. Development of a global ~90 m water body map using multi-temporal Landsat images. Remote Sens. Environ. 2015, 171, 337–351. [Google Scholar] [CrossRef]
- Laba, Z.M.; Deji, Y.Z.; La, B.; Chen, T.; Ci, Z.; Qiu, Y.B.; Pubu, C.R. Remote sensing analysis on the area variations of Tangra Yutso in Tibetan Plateau over the past 40 years. Lake Sci. 2017, 29, 480–489. [Google Scholar]
- Christopher, S. Ask the experts: The IPCC fifth assessment report. Carbon Manag. 2014, 5, 17–25. [Google Scholar]
- Fan, G.; Bing, H.; Zheng, L.; Song, S.; Yi, Z. Analysis of the changes and driving force of the water area in the Ulungur Lake over the past 40 years. J. Water Supply Res. Technol.-Aqua 2020, 69, 500–511. [Google Scholar]
- Li, H.; Zhong, D.; Fan, S.; Zhang, S.; Wang, J. Remote sensing monitoring of the nine plateau lakes’ s surface area in Yunnan in recent thirty years. Resour. Environ. Yangtze Basin 2016, 25, 32–37. [Google Scholar]
- Guo, Y.; Zheng, Y.; Wang, Y.; Liu, Y.; Liang, Q. Evolution of Jianhu Lake and its eco-environmental effects in the northwestern Yunnan Province. Environ. Eng. 2017, 35, 45–50. [Google Scholar]
- Chen, P.; Pan, X. Ecological risk analysis of regional landscape in inland river watershed of arid area: A case study of Sangong River Basin in Fukang. Chin. J. Ecol. 2003, 22, 116–120. [Google Scholar]
- Dong, Q. Studies on Land Use Changes and Ecological Security Assessment of Qilu Lake Basin in Yunnan Plateau; Beijing Forestry University: Beijing, China, 2009. [Google Scholar]
- Wu, P.; Shen, H.; Cai, N.; Zeng, C.; Wu, W.; Wang, B.; Wang, Y. Spatiotemporal analysis of water area annual variations using a Landsat time series: A case study of nine plateau lakes in Yunnan province, China. Int. J. Remote Sens. 2016, 37, 5826–5842. [Google Scholar] [CrossRef]
- Hu, Z.; Wang, Y.; Chi, T.; Liu, S.; Bi, J. Monitoring lake areas based on mixed pixel decomposition combined with double-edge extraction. Remote Sens. Inf. 2007, 3, 34–38. [Google Scholar]
- Yin, L.; Zhang, M.; Dong, J. Area variation and controlling factors of Lake Hongjiannao, Mu Us desert, China based on remote sensing techniques. Geol. Bull. China 2008, 27, 1151–1156. [Google Scholar]
- Liu, B.; Wei, X.; Feng, S.; Mei, D.; Li, C.; Liu, Y.; Zhang, J. Dynamics of Qinghai Lake area based on environmental mitigation satellite data. Pratacultural Sci. 2013, 30, 95–96. [Google Scholar]
- Zhu, C.; Li, J.; Zhang, X.; Luo, J. Bosten water resource dynamic detection and feature analysis in recent 40 years by remote sensing. J. Nat. Resour. 2015, 30, 106–114. [Google Scholar]
- Zhao, N.; Ma, C.; Yang, Y. Water quality variation of Lake Hongjiannao and its driving force analysis from 1973 to 2013. J. Lake Sci. 2016, 28, 982–993. [Google Scholar]
- Du, Y.; Liu, B.; He, W.; Duan, S.; Hou, F.; Wang, Z. Dynamic change and cause analysis of Salt Lake area in Hoh Xil on Qinghai-Tibet Plateau during 1976-2017. J. Glaciol. Geocryol. 2018, 40, 47–54. [Google Scholar]
- Wu, J. Analysis On the Changing and Reason of the Salt Lake Surface Water Area in the Qaidam Basin Since Recent 20 Years; Qinghai Institute of Salt Lakes, Chinese Academy of Sciences: 2014. Available online: https://xueshu.baidu.com/usercenter/paper/show?paperid=0de2c2dcdab2c6cc1062bf260dfcc23d&site=xueshu_se (accessed on 30 March 2023).
- Huang, H.; Zhao, P.; Chen, Z.; Guo, W. Research on the method of extracting water body information from ASTER remote sensing image. Remote Sens. Technol. Appl. 2008, 23, 525–528+485. [Google Scholar]
- Zhang, B.; Jia, R.; Zhang, Q.; Cheng, G. The water body area changes of Dalainur lake based satellite images of remote sensing. Res. Soil Water Conserv. 2011, 18, 196–199. [Google Scholar]
- Hu, W.; Meng, L.; Zhang, D.; Fan, Z.; Cheng, J. Methods of water extraction from ZY-1 02C satellite imagery. Remote Sens. Nat. Resour. 2014, 26, 43–47. [Google Scholar]
- Hanse, M.C.; Egorov, A.; Potapov, P.V.; Stehman, S.V.; Bents, T. Monitoring conterminous United States (CONUS) land cover change with Web-Enabled Landsat Data (WELD). Remote Sens. Environ. 2014, 140, 466–484. [Google Scholar] [CrossRef]
- Lv, G.; Li, Y.; Bai, J.; Bai, J. A tentative discussion on the geographical condition monitoring method based of long time series Landsat data. Remote Sens. Nat. Resour. 2015, 27, 126–132. [Google Scholar]
- Wang, T.; Wu, C.; Liu, J.; Lu, X. Dynamic evolution and landscape ecological risks assessment of Qilu Lake in Yunnan Plateau. J. Zhejiang AF Univ. 2020, 37, 9–17. [Google Scholar]
- Wu, X.; Wu, P.; Liu, Z.; Zeng, C.; Wang, J. A spatio-temporal analysis of water body area annual changes in Qilu Lake based on time series Lansat data. Remote Sens. Inf. 2016, 31, 89–94. [Google Scholar]
- Hao, G.; Wu, B.; Zhang, L.; Fu, D.; Li, Y. Temporal and spatial variation analysis of the area of Siling Co lake in Tibet based on ESTARFM (1976-2014). J. Geo-Inf. Sci. 2016, 18, 833–846. [Google Scholar]
- McFeeters, S.K. The use of the Normalized Difference Water Index (NDWI) in the delineation of open water features. Int. J. Remote Sens. 1996, 17, 1425–1432. [Google Scholar] [CrossRef]
- Xu, H. A study on information extraction of water body with the modified normalized difference water index (MNDWI). Natl. Remote Sens. Bull. 2005, 9, 589–595. [Google Scholar]
- Ma, Y.; Lin, H.; Sun, H.; Mo, D. Research on water information extraction based on CIWI model. Soil Water Conserv. China 2009, 5, 41–43. [Google Scholar]
- Feyisa, G.L.; Meilby, H.; Fensholt, R.; Proud, S.R. Automated Water Extraction Index: A new technique for surface water mapping using Landsat imagery. Remote Sens. Environ. 2014, 140, 23–25. [Google Scholar] [CrossRef]
- Wang, W.; Huang, D.; Liu, J.; Liu, H.; Wang, H. Patterns and causes of changes in water level and volume in Tangra Yumco from 1988 to 2018 based on Landsat images and Sentinel-3A synthetic aperture radar. J. Lake Sci. 2020, 32, 1552–1563. [Google Scholar]
- Chen, J.; Chen, S.; Ma, F.; Chen, J. Analysis of water balance of Hulun Lake based on digital remote sensing images. Water Resour. Prot. 2020, 36, 73–79. [Google Scholar]
- Sun, J.; Zhang, Q.; Xu, M.; Chen, S. Environmental impact and prediction of Gushing water of Tonghai tunnel engineering, Yunnan province, China. Res. Soil Water Conserv. 2011, 18, 69–73. [Google Scholar]
- Zhou, Y.; Zhang, H.; Chang, F.; Duan, L.; Li, H.; Wen, X.; Bi, R.; Wu, H.; Zhu, M. Seasonal variations of water quality parameters in Lake Qilu. Adv. Geosci. 2017, 7, 487–499. [Google Scholar] [CrossRef]
- Kang, X.; Wang, Y.; Zhang, H. An analysis of bad environmental effects of clogging of the discharging underground river of the Qilu Lake. Hydrogeol. Eng. Geol. 2008, 35, 121–124. [Google Scholar]
- Dong, Y.; Zhang, J.; Chen, Y.; Yu, Y.; Zhao, L. Succession of nine plateau lakes and regulation of ecological safety in Yunnan Province. Ecol. Econ. 2014, 1, 42–54. [Google Scholar]
- Dong, Y.; Liu, Y.; Li, Y.; Zhang, R. Analysis on factors of ecological vulnerability of Qilu Lake in Yunnan Province. Environ. Sci. Surv. 2011, 30, 24–29. [Google Scholar]
- Yang, H.; Yang, S.; Liu, Y.; Liu, X. Seasonal Succession of Plankton Community and Driving Factors in Hypereutrophic Qilu Lake (Yunnan-Guizhou Plateau). Res. Environ. Sci. 2020, 33, 876–884. [Google Scholar]
- Chen, Q.; An, Y.; Xi, S. Applicability analysis of Spatio-temporal fusion model of multi-source remote sensing data in Karst Plateau. Sci. Technol. Eng. 2020, 20, 6538–6546. [Google Scholar]
- Wu, M.; Niu, Z.; Wang, C. Assessing the accuracy of spatial and temporal image fusion model of complex area in South China. J. Geo-Inf. Sci. 2014, 16, 776–783. [Google Scholar]
- Zhu, X.; Chen, J.; Gao, F.; Chen, X.; Masek, J. An enhanced spatial and temporal adaptive reflectance fusion model for complex heterogeneous regions. Remote Sens. Environ. 2010, 114, 2610–2623. [Google Scholar] [CrossRef]
- Qi, G.; Ma, X.; He, S.; Wu, P. Long-term spatiotemporal variation analysis and probability prediction of algal blooms in Lake Chaohu (2009–2018) based on multi-source remote sensing data. J. Lake Sci. 2021, 33, 414–427. [Google Scholar]
- Wei, Y.; Zhu, L.; Cao, X.; Wang, W.; Gong, J. A downscaling study of evapotranspiration in Nanjing based on the ESTARFM model. Acta Ecol. Sin. 2022, 42, 1–11. [Google Scholar]
- Bai, L.; Cai, J.; Liu, Y.; Chen, H.; Zhang, B. Spatial downscaling of evapotranspiration in large irrigation area based on data fusion. Trans. Chin. Soc. Agric. Mach. 2017, 48, 215–223. [Google Scholar]
- Bai, L.; Cai, J.; Liu, Y.; Chen, H.; Zhang, B.; Huang, L. Responses of field evapotranspiration to the changes of cropping pattern and groundwater depth in large irrigation district of Yellow River basin. Agric. Water Manag. 2017, 188, 1–11. [Google Scholar] [CrossRef]
- Wang, L.; Xie, H.; Wen, G.; Yang, Y. A study on water information extraction method of cyanobacteria lake based on Landsat8. Remote Sens. Nat. Resour. 2020, 32, 130–136. [Google Scholar]
- Cheng, X.; Hong, Y.; Chen, J.; Ye, B. A study of the long-term remote sensing dynamic monitoring of inland based on ESTARFM. Remote Sens. Land Resour. 2020, 32, 183–190. [Google Scholar]
- Fan, H. Lake Dynamic Monitoring and Regional Climate Response Analysis in the Source Region of Three Rivers Based on Time Series; China University of Geosciences: Beijing, China, 2021. [Google Scholar]
- Otsu, N. A Threshold Selection Method from Gray-Level Histograms. IEEE Trans. Syst. Man Cybern. 1979, 9, 62–66. [Google Scholar] [CrossRef]
- Li, F. Study on Landscape Pattern Change and Driving Force of Longwan Lake Wetland in Eastern Jilin; Changchun Normal University: Changchun, China, 2022. [Google Scholar]
- Li, Y. Grey Correlation Analysis of Industrial Structure and Economic Growth in Gansu Province. Enterp. Econ. 2011, 30, 20–23. [Google Scholar]
- Gao, J.; Wu, F.; He, G.; Yang, W. Phytoplankton community characteristics and environmental driving factors of urban lakes in cold regions. Environ. Sci. Technol. 2021, 44, 1–10. [Google Scholar]
- Cheng, J.; Xu, L.; Wang, Q.; Yan, B.; Wan, R. Temporal and spatial variations of water level and its driving forces in Lake Dongting over the last three decades. J. Lake Sci. 2017, 29, 974–983. [Google Scholar]
- Lu, L.; Hong, L. Study on surface water area variations of nine plateau lakes in Yunnan Province. Yangtze River 2021, 52, 128–134. [Google Scholar]
- Wang, D.; Wang, S.; Huang, C. Comparison of Sentinel-2 imagery with Landsat8 imagery for surface water extraction using four common water indexes. Remote Sens. Land Resour. 2019, 31, 157–165. [Google Scholar]
- Chen, B.; Xiao, X.; Li, X.; Pan, L.; Doughty, R.; Ma, J.; Dong, J.; Qin, Y.; Zhao, B.; Wu, Z.; et al. A mangrove forest map of China in2015: Analysis of time series Landsat 7/8 and Sentinel-1A imageryin Google Earth Engine cloud computing platform. ISPRS J. Photogramm. Remote Sens. 2017, 131, 104–120. [Google Scholar] [CrossRef]
- Huang, H.; Chen, Y.; Clinton, N.; Koh, L. Mapping major land cover dynamics in Beijing using all Landsat images in Google Earth Engine. Remote Sens. Environ. 2017, 202, 166–176. [Google Scholar] [CrossRef]
- Lee, J.; Wich, S.; Widayati, A.; Koh, L. Detecting industrial oil palm plantations on Landsat images with Google Earth Engine. Remote Sens. Appl. Soc. Environ. 2016, 4, 219–224. [Google Scholar] [CrossRef]
- Feng, F.; Mao, D.; Wang, Z.; Pu, H.; Du, J. Spatial and temperal characteristics of water bodies occupied by global urban land expansion from 1986 to 2015 based on GEE and remote sensing big data. Sci. Geogr. Sinica. 2022, 42, 143–151. [Google Scholar]
- Pang, X.; Liu, H.; Liu, X.; Yu, X.; Kou, X. Analysis of lake area and water level dynamic and its drving forces of Daihai Lake in recent 30 years. J. Inn. Mong. Univ. (Nat. Sci. Ed.) 2021, 52, 311–321. [Google Scholar]
- Ma, C.; Yan, X. Spatio-temporal Change Analysis and Map Visualization of Qilu Lake Morphology. J. Geomat. 2022, 47, 86–90. [Google Scholar]
Figure 1.
Location and image map of study area.

Figure 2.
Schematic diagram of the space-time fusion process.

Figure 3.
Input image and fusion effect of ESTARFM model.

Figure 4.
Comparison of extraction results of different water indexes.

Figure 5.
Extraction results of Qilu Lake from 2000 to 2020.

Figure 6.
Spatial change of Qilu Lake based on quadrant orientation analysis.

Figure 7.
Rose diagram of Qilu Lake outline change.

Figure 8.
Changes in shape index and area of Qilu Lake.

Figure 9.
Migration track of geometric center of Qilu Lake.

Figure 10.
Time series changes of Qilu Lake area and water level.

Figure 11.
Relationship between Qilu Lake area and water level.

Figure 12.
Relationship between Qilu Lake area and other factors.


Table 1.
Remote sensing images used in this study.
| Year | Imaging Date | Satellite Sensors | Spatial Resolution | Cloudiness |
|---|---|---|---|---|
| 2000 | 12/2 | Landsat 4–5 TM | 30 m | 0.02 |
| 2005 | 25/2 | Landsat 4–5 TM | 30 m | 0 |
| 2010 | 7/2 | Landsat 4–5 TM | 30 m | 0.02 |
| 2015 | 21/2 | Landsat 8 OLI_TIRS | 30 m | 0.04 |
| 2020 | 18/1 | Landsat 8–9 OLI_TIRS | 30 m | 0.03 |
| 9/5 | Landsat 8–9 OLI_TIRS | 30 m | 5.9 | |
| 13/2 | MYD09GA | 500 m |
Table 2.
Area change in Qilu Lake.
| Year | Lake Area/km2 | Rate of Change/% |
|---|---|---|
| 2000 | 36.85 | / |
| 2005 | 35.48 | −3.73% |
| 2010 | 36.14 | 1.86% |
| 2015 | 21.67 | −40.04% |
| 2020 | 34.47 | 59.07% |
Table 3.
Area change of Qilu Lake in different directions during different periods.
| Direction | 2000–2005 | 2005–2010 | 2010–2015 | 2015–2020 | 2000–2020 |
|---|---|---|---|---|---|
| North | −0.02 | −0.02 | −0.42 | 0.17 | −0.29 |
| Northeast | −0.20 | 0.12 | −0.86 | 0.77 | −0.17 |
| East | −0.06 | 0.03 | −0.57 | 0.49 | −0.11 |
| Southeast | −0.03 | 0.01 | −0.61 | 0.52 | −0.11 |
| South | −0.05 | 0 | −1.28 | 1.11 | −0.22 |
| Southwest | −0.19 | 0.29 | −7.36 | 6.82 | −0.44 |
| West | −0.18 | 0.09 | −3.20 | 2.80 | −0.49 |
| Northwest | 0 | −0.01 | −0.20 | 0.12 | −0.09 |
Table 4.
Grey correlation between lake area and driving forces in Qilu Lake.
| Natural Factors | Grey Correlation Degree | Socio economic Factors | Grey Correlation Degree |
|---|---|---|---|
| Annual average temperature | 0.9729 | population | 0.9593 |
| Annual precipitation | 0.9578 | GDP | 0.6817 |
| Annual average sunshine hours | 0.9710 | Total industrial output value | 0.7206 |
| Annual average evaporation | 0.9416 | Total agricultural output value | 0.6297 |
| Crop sown area | 0.8660 |
Disclaimer/Publisher’s Note: The statements, opinions and data contained in all publications are solely those of the individual author(s) and contributor(s) and not of MDPI and/or the editor(s). MDPI and/or the editor(s) disclaim responsibility for any injury to people or property resulting from any ideas, methods, instructions or products referred to in the content. |
© 2023 by the authors. Licensee MDPI, Basel, Switzerland. This article is an open access article distributed under the terms and conditions of the Creative Commons Attribution (CC BY) license (https://creativecommons.org/licenses/by/4.0/).
Share and Cite
MDPI and ACS Style
Wang, Z.; Liu, X.; Li, W.; He, S.; Zheng, T. Temporal and Spatial Variation Analysis of Lake Area Based on the ESTARFM Model: A Case Study of Qilu Lake in Yunnan Province, China. Water 2023, 15, 1800. https://doi.org/10.3390/w15101800
AMA Style
Wang Z, Liu X, Li W, He S, Zheng T. Temporal and Spatial Variation Analysis of Lake Area Based on the ESTARFM Model: A Case Study of Qilu Lake in Yunnan Province, China. Water. 2023; 15(10):1800. https://doi.org/10.3390/w15101800
Chicago/Turabian StyleWang, Ziyuan, Xingyue Liu, Wei Li, Shuqiang He, and Tingdan Zheng. 2023. "Temporal and Spatial Variation Analysis of Lake Area Based on the ESTARFM Model: A Case Study of Qilu Lake in Yunnan Province, China" Water 15, no. 10: 1800. https://doi.org/10.3390/w15101800
Note that from the first issue of 2016, this journal uses article numbers instead of page numbers. See further details here.