Article

Simulating the Flood Limits of Urban Rivers Embedded in the Populated City of Santa Clara, Cuba

by
Rolando Ariel Martínez Socas
1,
Michael Alvarez González
2,
Yoandy Rodríguez Marín
1,
Carlos Lázaro Castillo-García
1,
Jorge Jiménez
3,
Luciana das Dores de Jesus da Silva
4 and
Lisdelys González-Rodríguez
5,6,*
1
Facultad de Construcciones, Universidad Central “Marta Abreu” de Las Villas, Carretera a Camajuaní Km 9 ½, Santa Clara 50100, Cuba
2
Empresa de Investigaciones y Proyectos Hidráulicos de Villa Clara, Ave. Libertadores 201 e/Jesús Menéndez y Danielito, Santa Clara 42206028, Cuba
3
Facultad de Ingeniería, Universidad de Concepción, Concepción 4030000, Chile
4
Facultad de Ciencias Ambientales, Universidad de Concepción, Concepción 4030000, Chile
5
Facultad de Ingeniería y Negocios, Universidad de Las Americas, Sede Concepción, Concepción 4030000, Chile
6
Núcleo de Investigación en Data Science (NIDS), Facultad de Ingeniería y Negocios, Universidad de Las Americas, Santiago 7500000, Chile
*
Author to whom correspondence should be addressed.
Water 2023, 15(10), 1805; https://doi.org/10.3390/w15101805
Submission received: 7 April 2023 / Revised: 28 April 2023 / Accepted: 3 May 2023 / Published: 9 May 2023
(This article belongs to the Section Hydraulics and Hydrodynamics)

Abstract

:
Floods are a natural phenomenon that cause damage to structures and property as well as negatively affect human life. Assessing the extent, speed, power, and depth of flooding has always been a challenge for water resource planners. This research developed a hydraulic simulation model for the Cubanicay and Bélico urban rivers embedded in the city of Santa Clara, Cuba. The methodology was based on a one-dimensional model of the Hydrological Engineering River Analysis System (HEC-RAS) and GIS-based methods. The HEC-RAS model (Beta) and three modeling flood tests for scenarios of 1% (100 years), 2% (50 years), and 10% (10 years) of probability for hydrometeorological events were analyzed. Bank lines, flow path lines, and cross-section cut lines were extracted from Digital Elevation Models. Manning’s roughness coefficients were considered for the channel morphology and soil typology. The flood Beta model results were accurate with a difference of ±0.10 m considering the water footprint found in the field. The results showed that the areas near the control section 2 + 87 presented a high risk of flooding. The flood limit map for urban areas could be an important tool for researchers, planners, and local governments for risk assessment and to develop evacuation plans and flood mitigation strategies in order to reduce human and economic losses during a flood.

1. Introduction

Flooding is one of the major natural disasters worldwide and has led to large amounts of property damage and human life losses [1,2,3]. In developing countries, the impact of flooding can be particularly severe due to factors such as limited infrastructure, poor land use planning, and lack of resources for emergency response and recovery. In many cases, flooding is exacerbated by environmental degradation and climate change [4], which can increase the frequency and intensity of extreme weather events such as heavy rainfall and storms. The Intergovernmental Panel on Climate Change (IPCC) Fifth Assessment Report indicated that extreme rainfall events are expected to increase in the future [5]. Extreme events have been reported in recent years [6,7]. Therefore, it is important to develop effective flood boundary awareness and management strategies in developing countries, including early warning systems, floodplain management, and disaster awareness and response planning.
The Caribbean region is prone to natural disasters including tropical depressions, storms, and hurricanes [8], which significantly increase the occurrence of flood events. In Cuba, historical records of flood events are incomplete. However, extreme flooding events from hurricane Gustav (2008), Ike (2008), Matthew (2009), and Irma (2017) were widely reported [8,9,10,11]. Hurricane Gustav and Ike caused large damage to agricultural land, including Cuba’s main citrus-producing area, Jagüey Grande, in the west central part of the country causing flooding and uprooted trees [10]. In addition, floods were reported in the provinces of Granma, Holguín, and Santiago de Cuba, with an estimated damage of more than 2.5 billion dollars, and more than 1.3 million people were evacuated. More recently, in 2017, Cuba was hit by Hurricane Irma [9] affecting 90% of its population. During this event, nearly 95,000 hectares of cropland and 500 poultry farms were destroyed. In 2020, a strong local storm generated significant damage in Central Cuba, where flooding occurred as a result of the severe climatic events on May 25th and 26th [11]. The recorded rainfall was 148, 166, and 243 mm for Santi Spiritus, Villa Clara, and Cienfuegos, respectively, whereas rainfall–runoff had an adverse effect on the water quality causing health-related problems within the population [11]. Therefore, it is necessary to identify areas susceptible to flooding to prevent future impacts on the human population from extreme hydrometeorological events.
Currently, the Instituto Nacional de Recursos Hidráulicos (INRH, https://www.hidro.gob.cu, accessed on 25 January 2022) is responsible for directing, executing, and controlling policies regarding the activities of hydraulic resources in Cuba, which includes demanding compliance with adequate measures to prevent and mitigate the effects of extreme hydrometeorological events [12]. Populated areas located in flat areas or without effective storm drainage systems are highly susceptible to flooding during extreme rainfall events [13]. The authors of [14] suggested that factors such as climate change and inadequate infrastructure increase the losses associated with these disasters. Similarly, another study [15] reported that populated areas located in the flat coastal zone of Puri, India are highly vulnerable to hydrometeorological events such as cyclones, floods, and storm surges.
In developing countries, floodplain definition and flood hazard assessment typically involve the identification of areas that are at high risk of flooding, and the assessment of the potential impacts of flooding on people, infrastructure, and the environment [4,16]. Several approaches to the identification of areas that are at high risk of flooding include geographic information systems (GIS) [17], participatory mapping techniques [18], or integrating hydraulic models with GIS [16,19].
In recent years, several hydraulic models integrated with geographic information systems (GIS) have been reported [20]. The performance of these models depends on several factors, including the choice of the hydraulic model, one-dimensional (1D) and two-dimensional (2D) simulations, a correct representation of the river channel and floodplain geometry, model assumptions/parameters, and initial boundary conditions, such as Flood Extent and Water Surface elevation (WS) along the river [21]. In this context, hydraulic simulation is crucial for flood warning systems. However, input data for simulation generally include uncertainties that can vary significantly in time and space for the most vulnerable flood areas [22]. Despite these issues, hydraulic simulation is a powerful tool for understanding water flow behavior and predicting emerging problems in channel systems [23]. Modeling urban basins is important for several water resource applications such as average river velocity, water quality, stream–aquifer interactions, overtopping frequency, and flood control operations [24]. Models can be complemented with aerial photographs, satellite images, and evaluations in the place where the mark of the previous flood is observed [25]. These combinations of tools may contribute to improving risk assessment and urban planning to avoid great economic and human losses under extreme rainfall events. Among the tools for the numerical modeling of hydrological and hydraulic processes, the computer platform River Analysis System (HEC-RAS), developed by the U.S. Army Corps of Engineers Hydrologic Engineering Center, has been recognized as a useful tool for flood modeling [19,25,26,27,28,29]. The HEC-RAS model is available for 1D and 2D simulations and channel geometry must be taken into account for cross sections along the channel, along with water velocity, flow rate, and Froude number, among others, which may be constant or variable over time [19]. The authors of [19] addressed the issues of uncertainties of the combined hydraulic variables and the effect in flood inundation mapping when using the HEC-RAS model and GIS integration. The authors of [27] made a comparison between the Alpha and Beta models using 1D or 2D simulations, obtaining excellent results. Similarly, ref. [21] applied 1D models to estimate flood levels for a mountain river, while [30] applied several models to analyze urban flood maps in Seoul, Korea.
It is important to integrate different climate models since climate change may increase the frequency of flood-causing events, and cause droughts and different climatic phenomena that have a great impact on water resources. The authors of [31] improved the accuracy of flood risk maps based on three flood models, with 3% (33-year), 1% (100-year), and 0.1% (1000-year) recurrence intervals. According to [32], the 1% scenario was for extremely heavy rainfall events that occur every 100 years, 2% is for events that occur every 50 years, and 10% is for a 10-year event, which collapses any type of engineered design.
In Cuba, sections of the Quibú river were modeled to rehabilitate retaining walls affected by erosion [33]. However, no documented simulations for urban river behavior are available for other cities and only analytical estimations based on frequent flooding areas and partial rectifications of sections of the riverbed are available. Hydrodynamic models may provide fair flow and water level simulations for urban rivers with limited morphological data by recalculating and establishing flood zones through GIS-integrated hydraulic models. Therefore, it would be possible to identify human settlements and structures of socioeconomic interest that could be affected by floods associated with hydrometeorological events in the urban basin of Santa Clara, Cuba.
The purpose of this study was to analyze a hydraulic simulation, adjusted with the presence of bridges, crossing structures, and frontage lines in the riverbed. In addition, the study generated a flood map for different probabilities of hydrometeorological events for the vulnerable areas within the city of Santa Clara, Cuba. An urban flood hazard map could be a useful resource for researchers, city planners, emergency response teams, and local governments to elaborate on flood mitigation strategies, including preventive evacuation plans and limitations for home development projects.

2. Material and Method
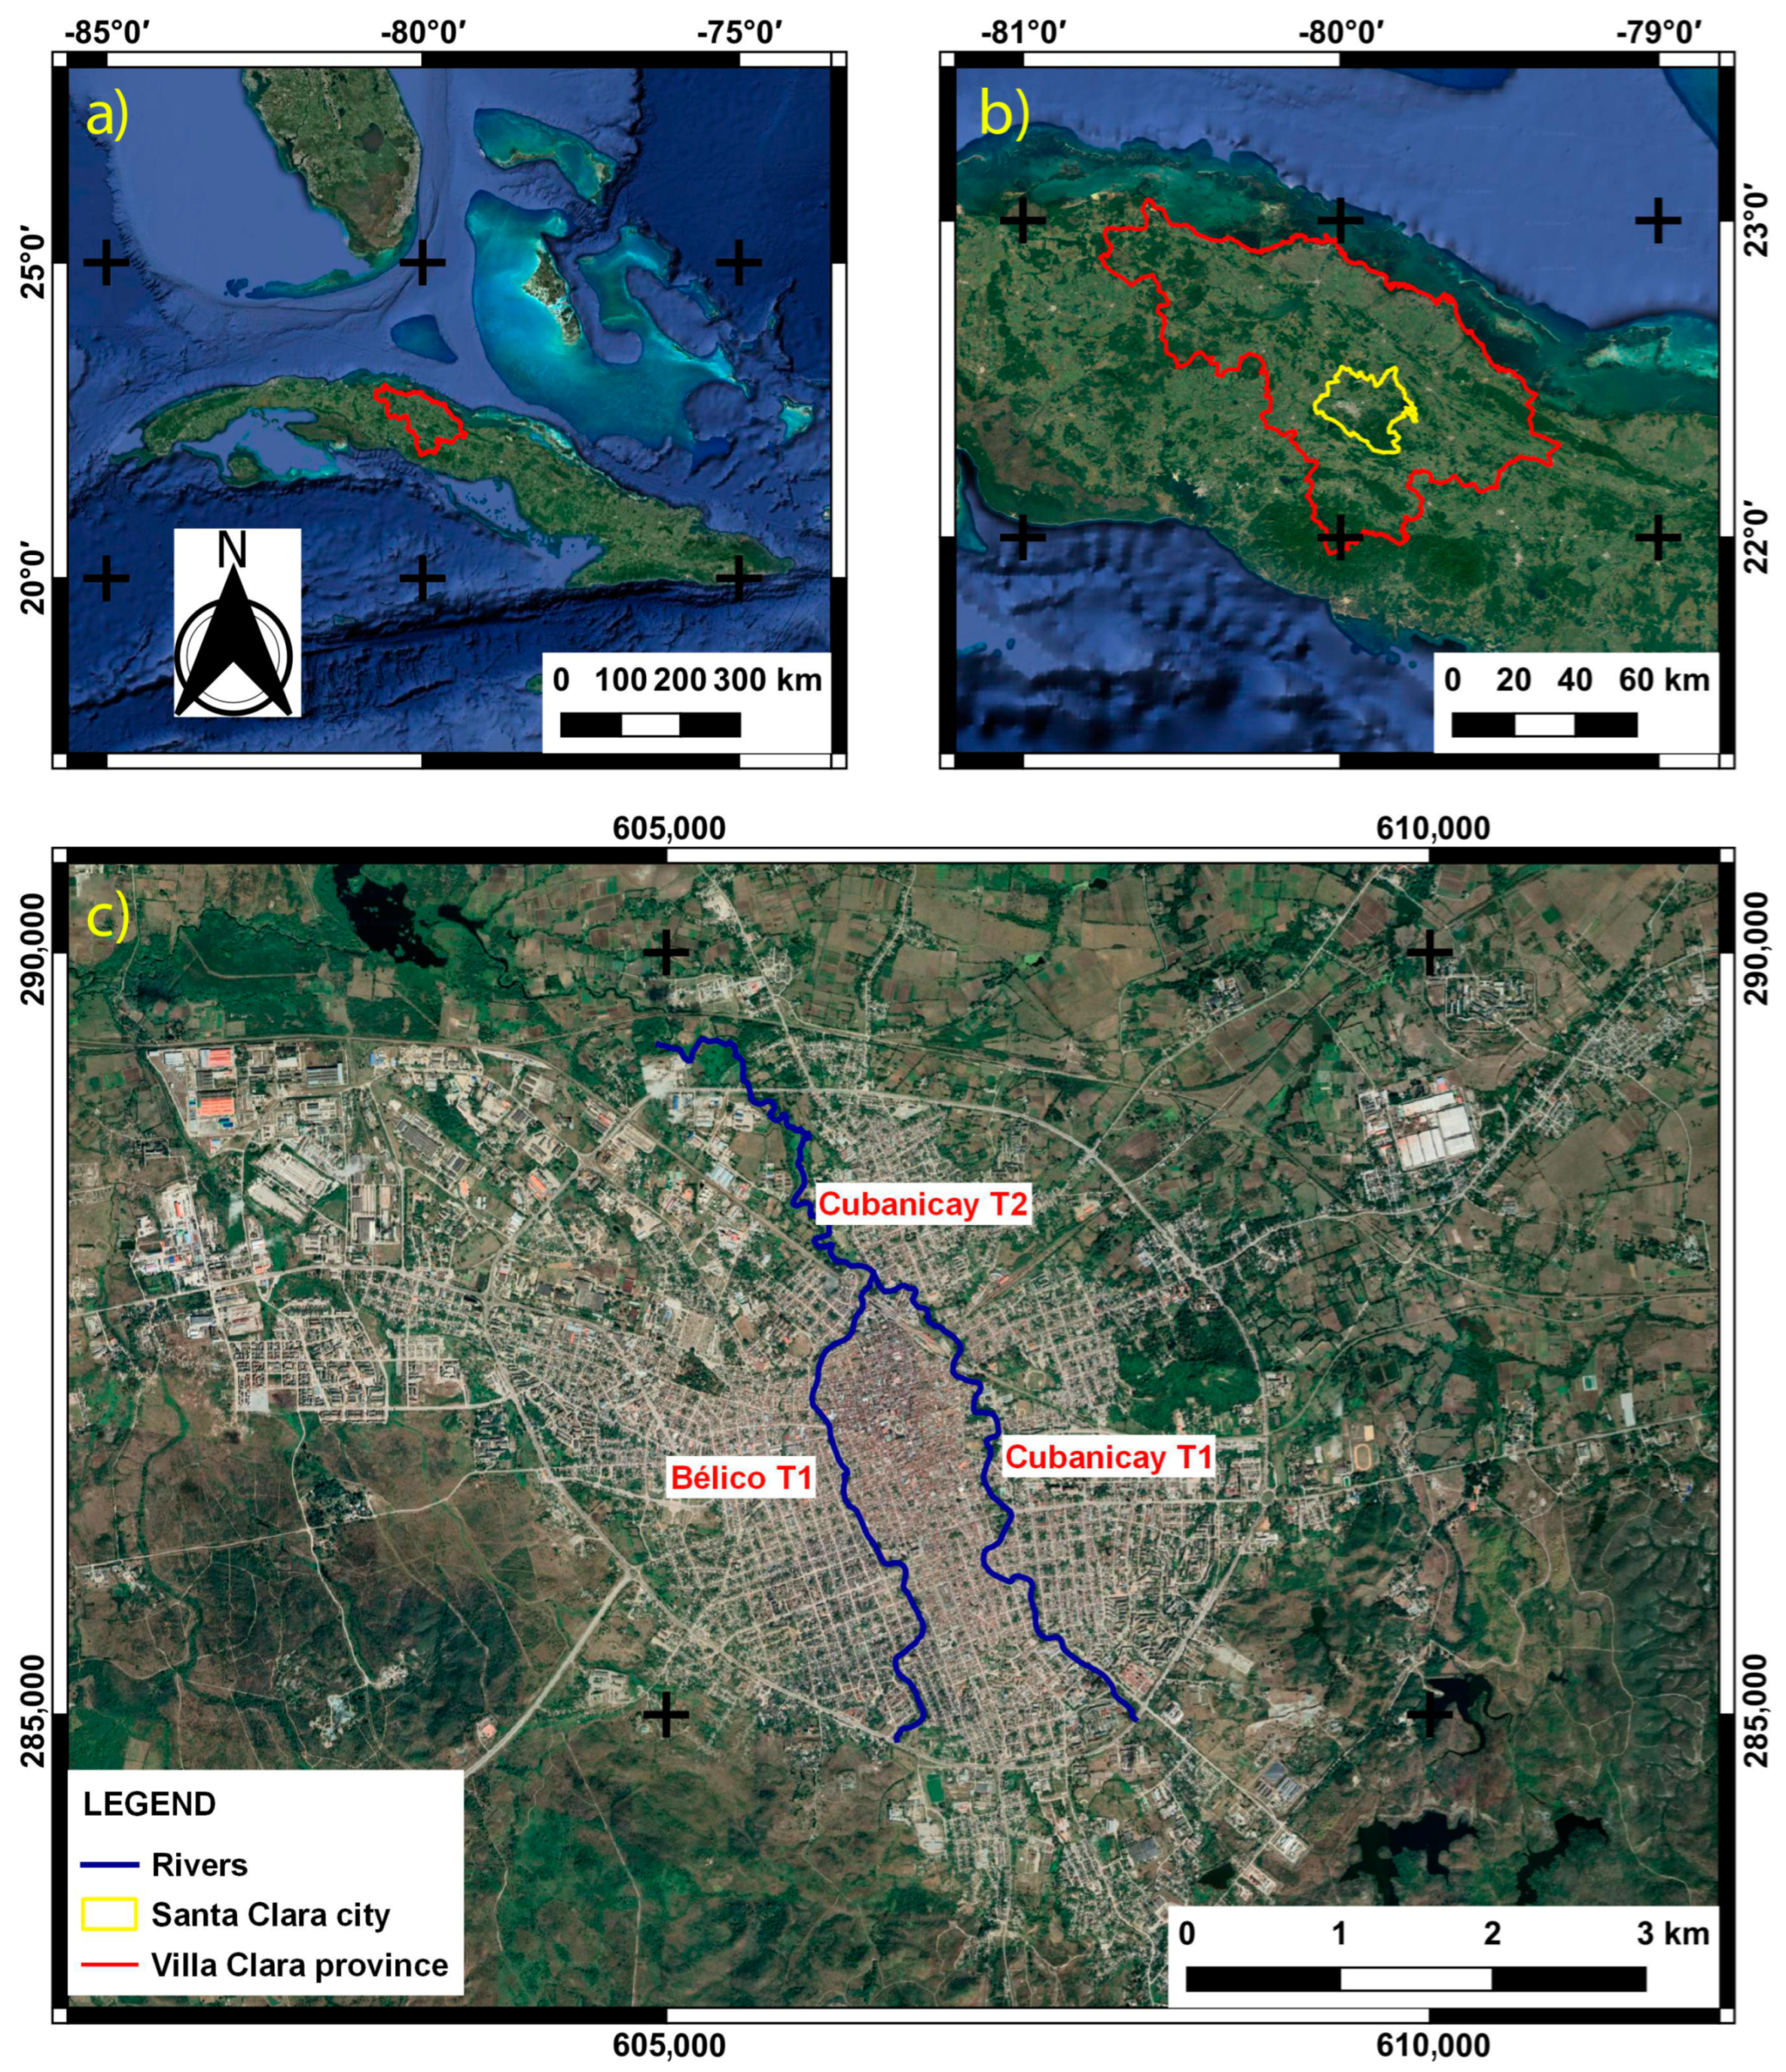
2.1. Study Area

The Island of Cuba is located in the western West Indies, between the Caribbean Sea and the Gulf of Mexico, south of Florida and The Bahamas, north of Jamaica and the Cayman Islands (Figure 1a). Villa Clara is one of the 15 provinces of Cuba (Figure 1b); with a population of 790,191 inhabitants, it is the fifth most populated area in Cuba. The province has a tropical climate, moderated by trade winds; it has a dry season between November and April, and a rainy season between May and October, with the prevalence of tropical storms and hurricanes. The province of Villa Clara includes Santa Clara as its main city (Figure 1b,c). The geographic location of Santa Clara is found between a latitude of 22.24° N, longitude of 79.57° W, and altitude of 100 m.a.s.l. (Figure 1c), with a population of 200,000 inhabitants and a high level of urbanization, especially in the historic center and between the Bélico and Cubanicay rivers [13]. These rivers are embedded in a flat basin (see Figure 1c) that belong to the Sagua la Grande river basin, which originates near the southern ring road and crosses the urban center of Santa Clara from south to north. The storm drainage system of the city is vulnerable and may collapse even without extreme events such as tropical storms or hurricanes. A normal rainfall event during summer may cause flooding in vulnerable areas from the excessive accumulation of water due to the inability of the natural and artificial network system to evacuate runoff [13]. Poor urban planning has led to a significant reduction in the main tributaries and riverbed along with housing and business development in flooding areas. Therefore, the Bélico and Cubanicay rivers were selected for analysis, focusing on the section from the Central Railway Bridge to the North Highway Bridge (Figure 1c). The selection of the vulnerable areas was based on records of recurrent flooding events [11].

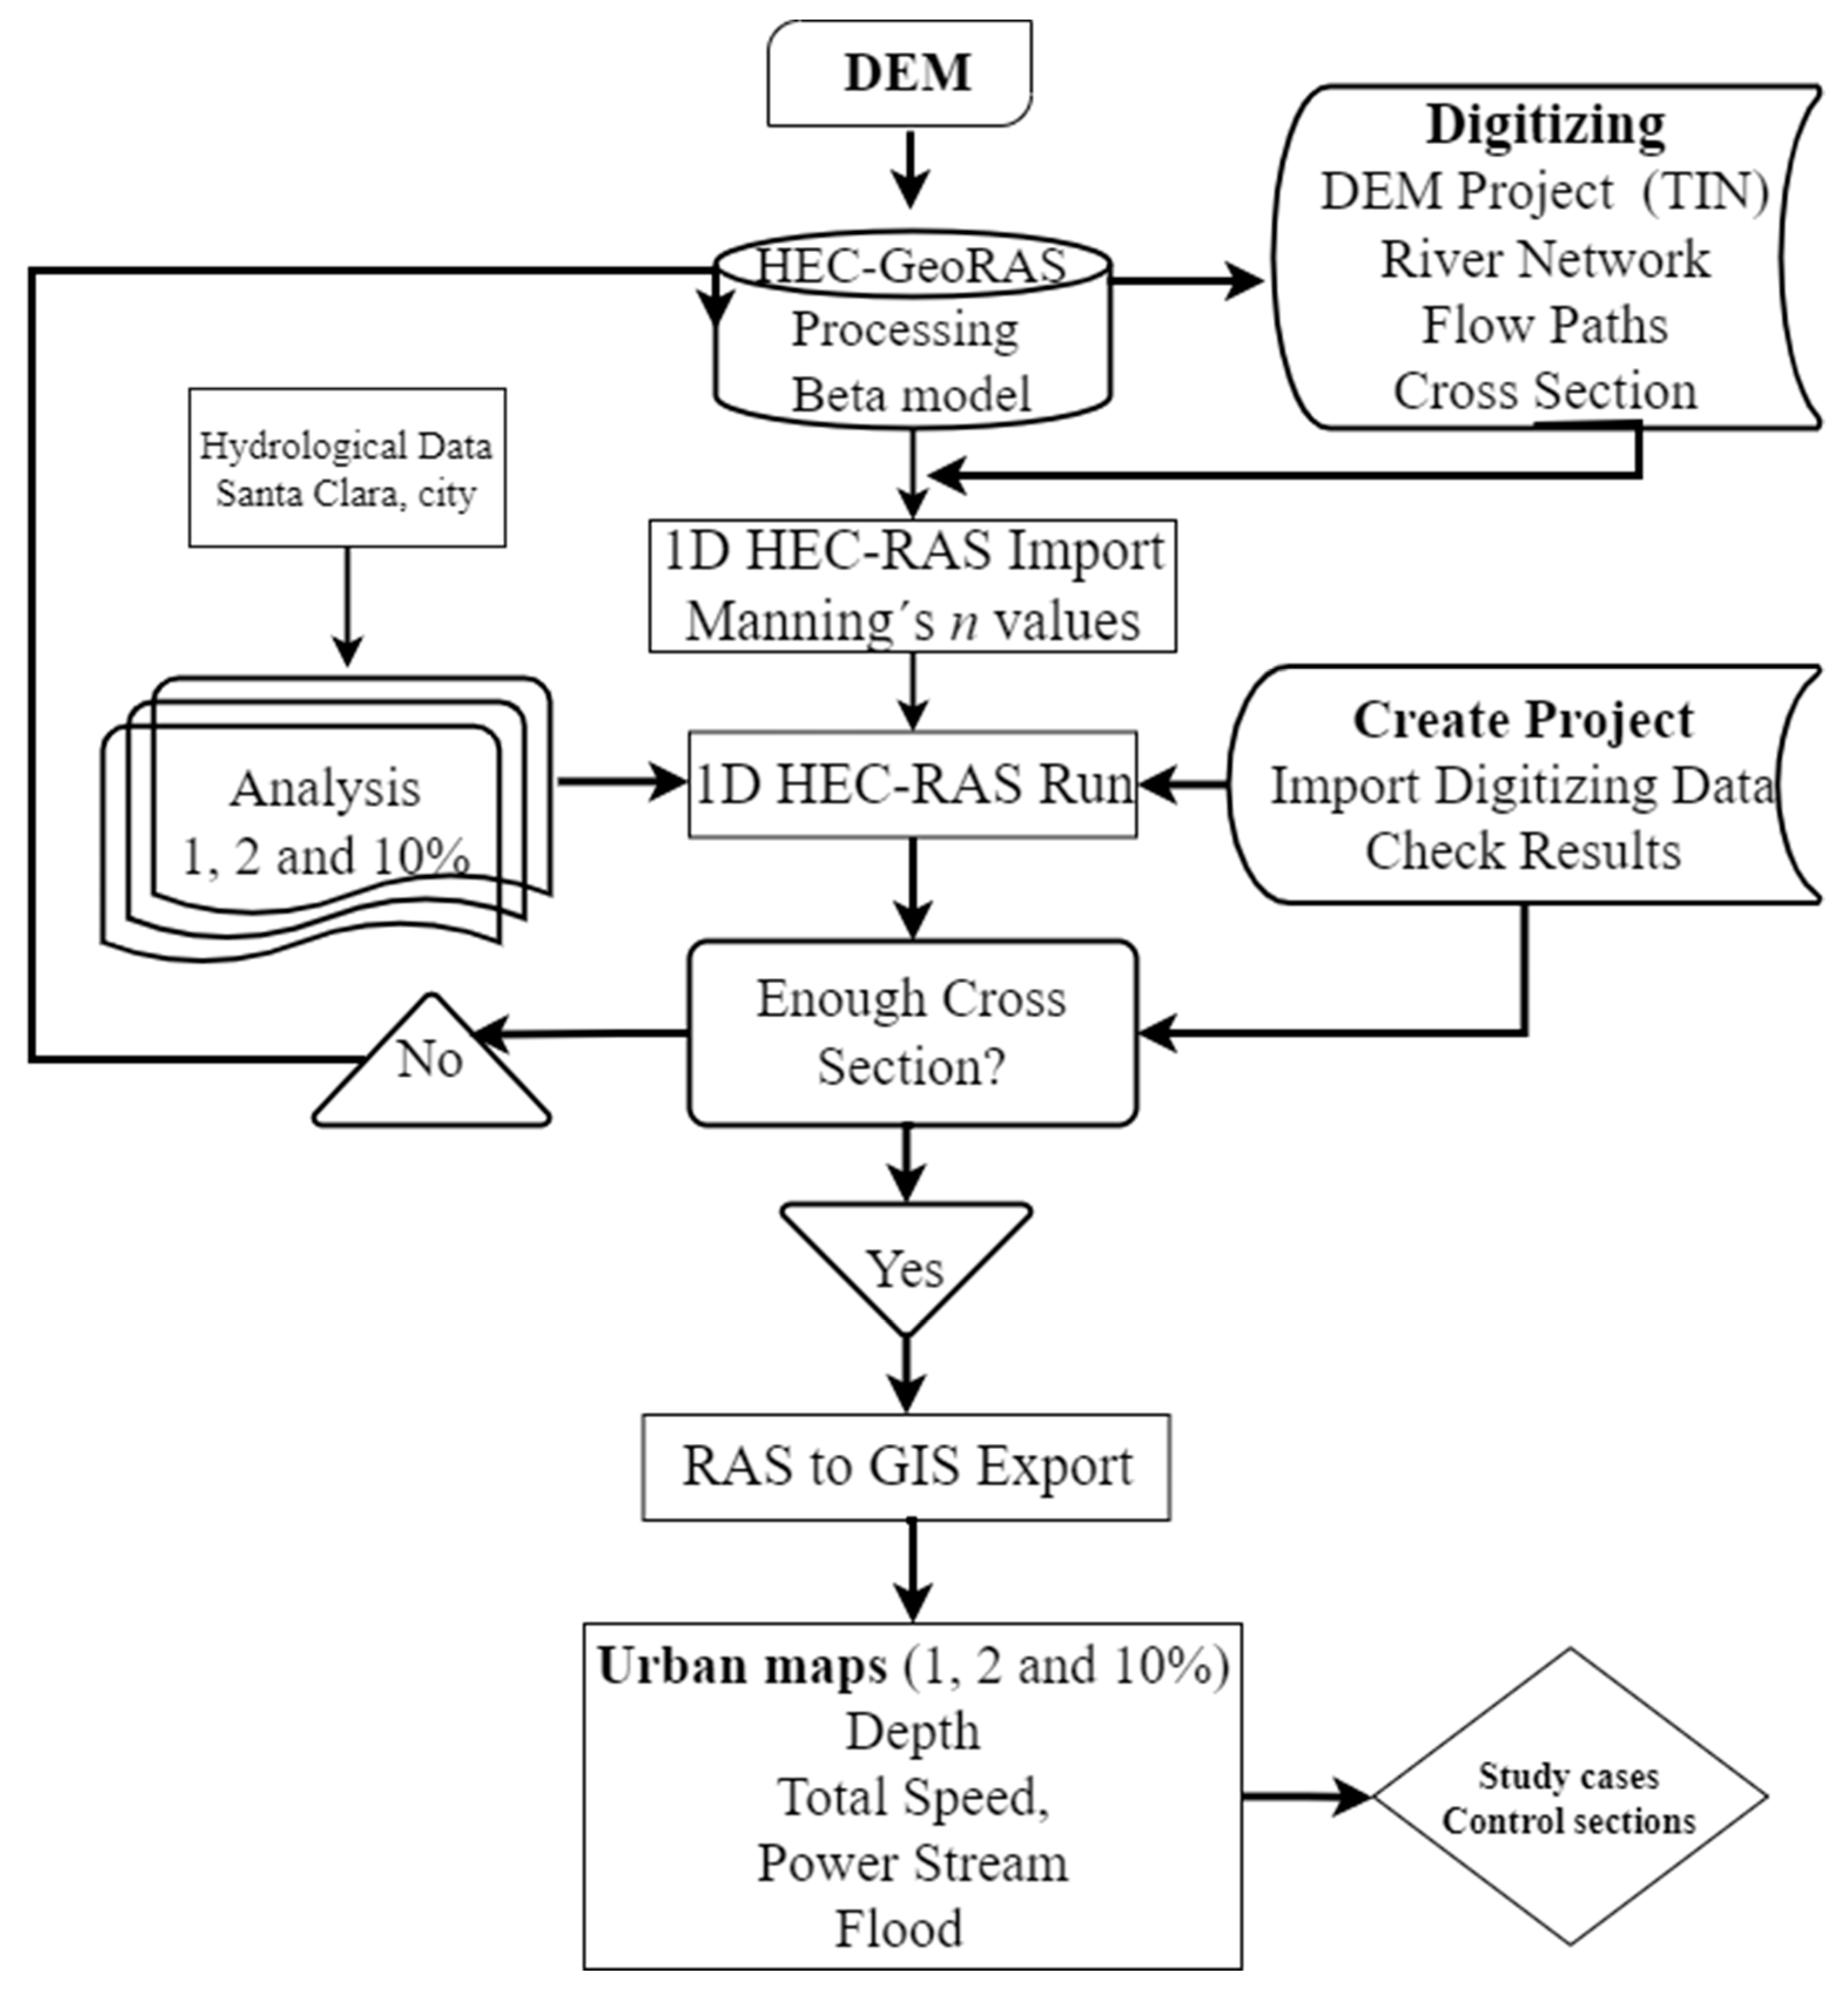
2.2. Methodological Framework

Figure 2 shows the flow chart (steps) involving the simulation of the Bélico and Cubanicay river systems. The Digital Elevation Model (DEM) was essential for providing land elevation data when estimating flood volumes in the study area, which was used as input to generate a watershed and drainage network in RAS Mapper [34]. The DEM was based on the criteria contained by the Triangular Irregular Network (TIN) following [35] and AutoCAD Civil 3D 2019 was used. The channel, bank stations, flow paths, and cross-section cut lines were prepared in QGIS v3.22 for HEC-GeoRAS. The one-dimensional (1D) model (Beta model) and three flood test models for scenarios of 1% (100 years), 2% (50 years), and 10% (10 years) of probability for hydrometeorological events were analyzed [32]. Hydrological data for Santa Clara city reported in [36,37] were used. After running the HEC-RAS model, the results were exported to the geographic information system (GIS) in the format of the RAS GIS Export file. Several maps (depth, total speed, stream power, and flood) under three different scenarios were generated and three control sections were selected for analysis:16 + 38.46 (located in Cubanicay river, T2), 2 + 87 (located in Cubanicay river, T1), and 27 + 14 (located in Bélico river, T1).

2.3. HEC-RAS One-Dimensional (1D) Model

The Beta model was implemented, which included anthropogenic effects on the river channel. The model considered 1D flows along the center line of the river channel, based on a finite difference solution of the full Saint-Venant equations [22]. The 1D model represents the terrain as a sequence of cross sections and simulates flow to estimate the average velocity and water depth at each cross section. The selected hydrological model is reported in [38]; more detail and local hydrological data for Santa Clara city were reported in [36,37]. The Beta model included two important aspects for the simulation: (i) the existing frontage lines due to nearby construction along the channel, which caused flow choking; and (ii) the presence of structures such as bridges across the channel. These structures may generate scouring effects and sediment accumulation at the bottom of the channel, affecting the flow regime and the stability of bridges. Therefore, the location of the bridges along the channel was included in the map to assess their influence on water flow. The results obtained were compared with the water footprint created by the river.
Spatially varying roughness maps were based on Manning’s roughness coefficient (n) [39]. Equation (1) was used to determine n, including an initial value obtained through field surveys and empirical formulas [40]. Where nb is a base value of n for a straight, uniform, smooth channel in natural materials; n1 is a correction factor for the effect of surface irregularities; n2 corrects for variations in the shape and size of the channel cross section; n3 corrects for obstructions; n4 corrects for vegetation and flow conditions; and m is a correction factor for meandering.
n = n b + n 1 + n 2 + n 3 + n 4 m
Four assumptions were considered when determining n: (1) the mean velocity of each subsection of the cross section was the same, (2) the total force resisting the flow was equal to the sum of the forces resisting the flows in the subdivided areas, (3) the total discharge of the flow was equal to the sum of the discharges of the subdivided areas, and (4) the energy slope was the same for each of the subsections and the degree of meandering (m). The n value was obtained for channels and floodplains following [41] and geometry cross sections were used to define the channel and floodplain. A map with the river sections located every 20 m was developed according to Samuel’s equation (Equation (2)) for the calculation of spatial intervals ΔX [26]. This parameter influences the accuracy, convergence, robustness, and stability of numerical models [16]. For urban conditions, a section every 100 m or less is often required [42].
Δ X   1.5 × D S o
where, D is the total depth of the average bank of the main channel (feet), So is a bottom slope (dimensionless).
To determine the water level and geographically represent the flood zones on typical river sections, the HEC-RAS v5.0 model was used [26,42]. The geometric data required for model development were constructed using the HEC-RAS extension for ESRI’s ArcGIS v 10.8. HEC-GeoRAS allows the user to create HEC-RAS geometry data within a GIS environment by using a DEM and user-defined polylines describing the stream topology. The parameters of a longitudinal profile of the river slope associated with each calculated probability were Water Surface elevation (WS) and Energy Grade lines (EG). To obtain the model input hydrographs as boundary conditions, the non-stationary flow for a 10 h hydrograph reported in [43] and the TR 55 model of the U.S. Soil Conservation Service were used. The hydraulic parameters were (i) stream power (SP) (N/m*s), (ii) areas of greater depth (m) which is the difference in height between the WS and the bottom of the river and (iii) total speed to define the areas prone to scour, dragging, and sediment accumulation.

3. Results and Discussion

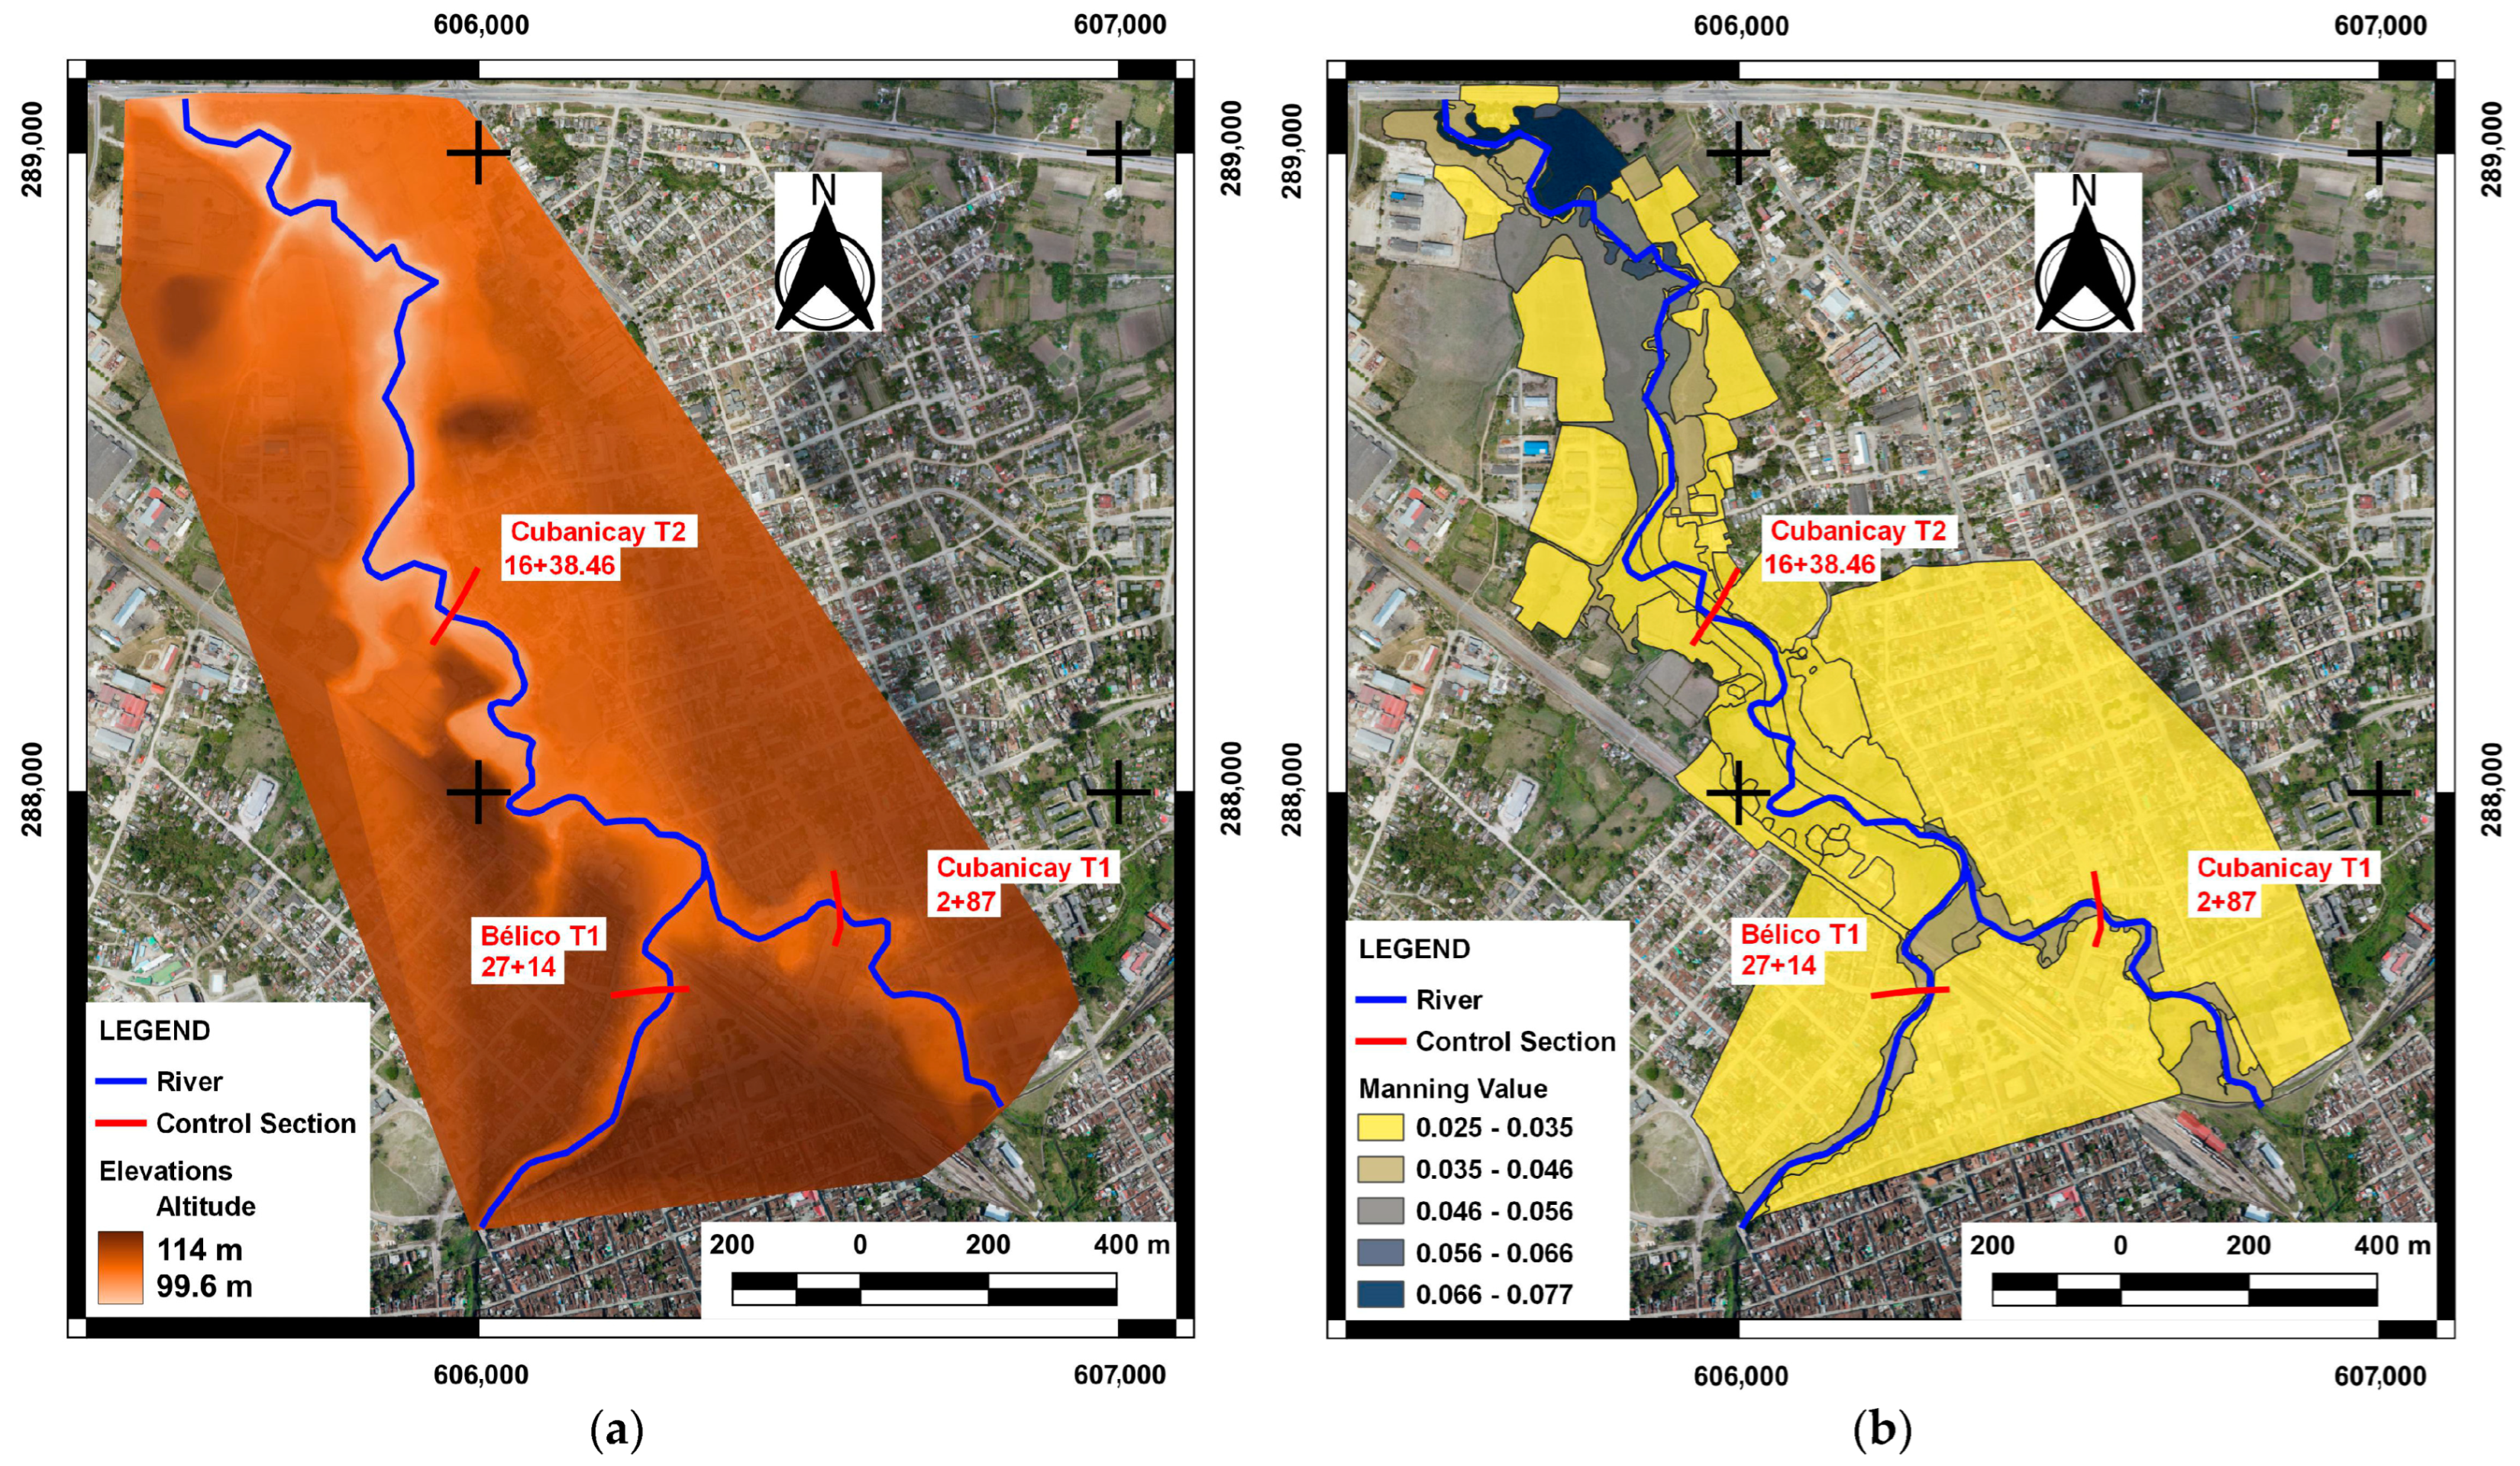
3.1. Digital Elevation Model and Manning’s Coefficient

Figure 3 shows the DEM for the Bélico and Cubanicay rivers within the urban area of Santa Clara. This model provides the geometry of the river, the profile data, and the direction of the spatial variability of the flow in the main channel. The highest elevation was toward the south of the river with an altitude of 114 m. For hydraulic modeling in the HEC-RAS platform, input data were required for defining the geometry of the channel through which the river flows and other elements such as Manning’s coefficients (n) [39]. Figure 3b shows Manning’s roughness coefficients, which were between n = 0.025 m−1/3 s and n = 0.066 m−1/3 s. These values are affected by the presence of forest, litter, man-made structures, and debris that caused a restriction to the river flow in the channel which directly affects the velocities and water flow.

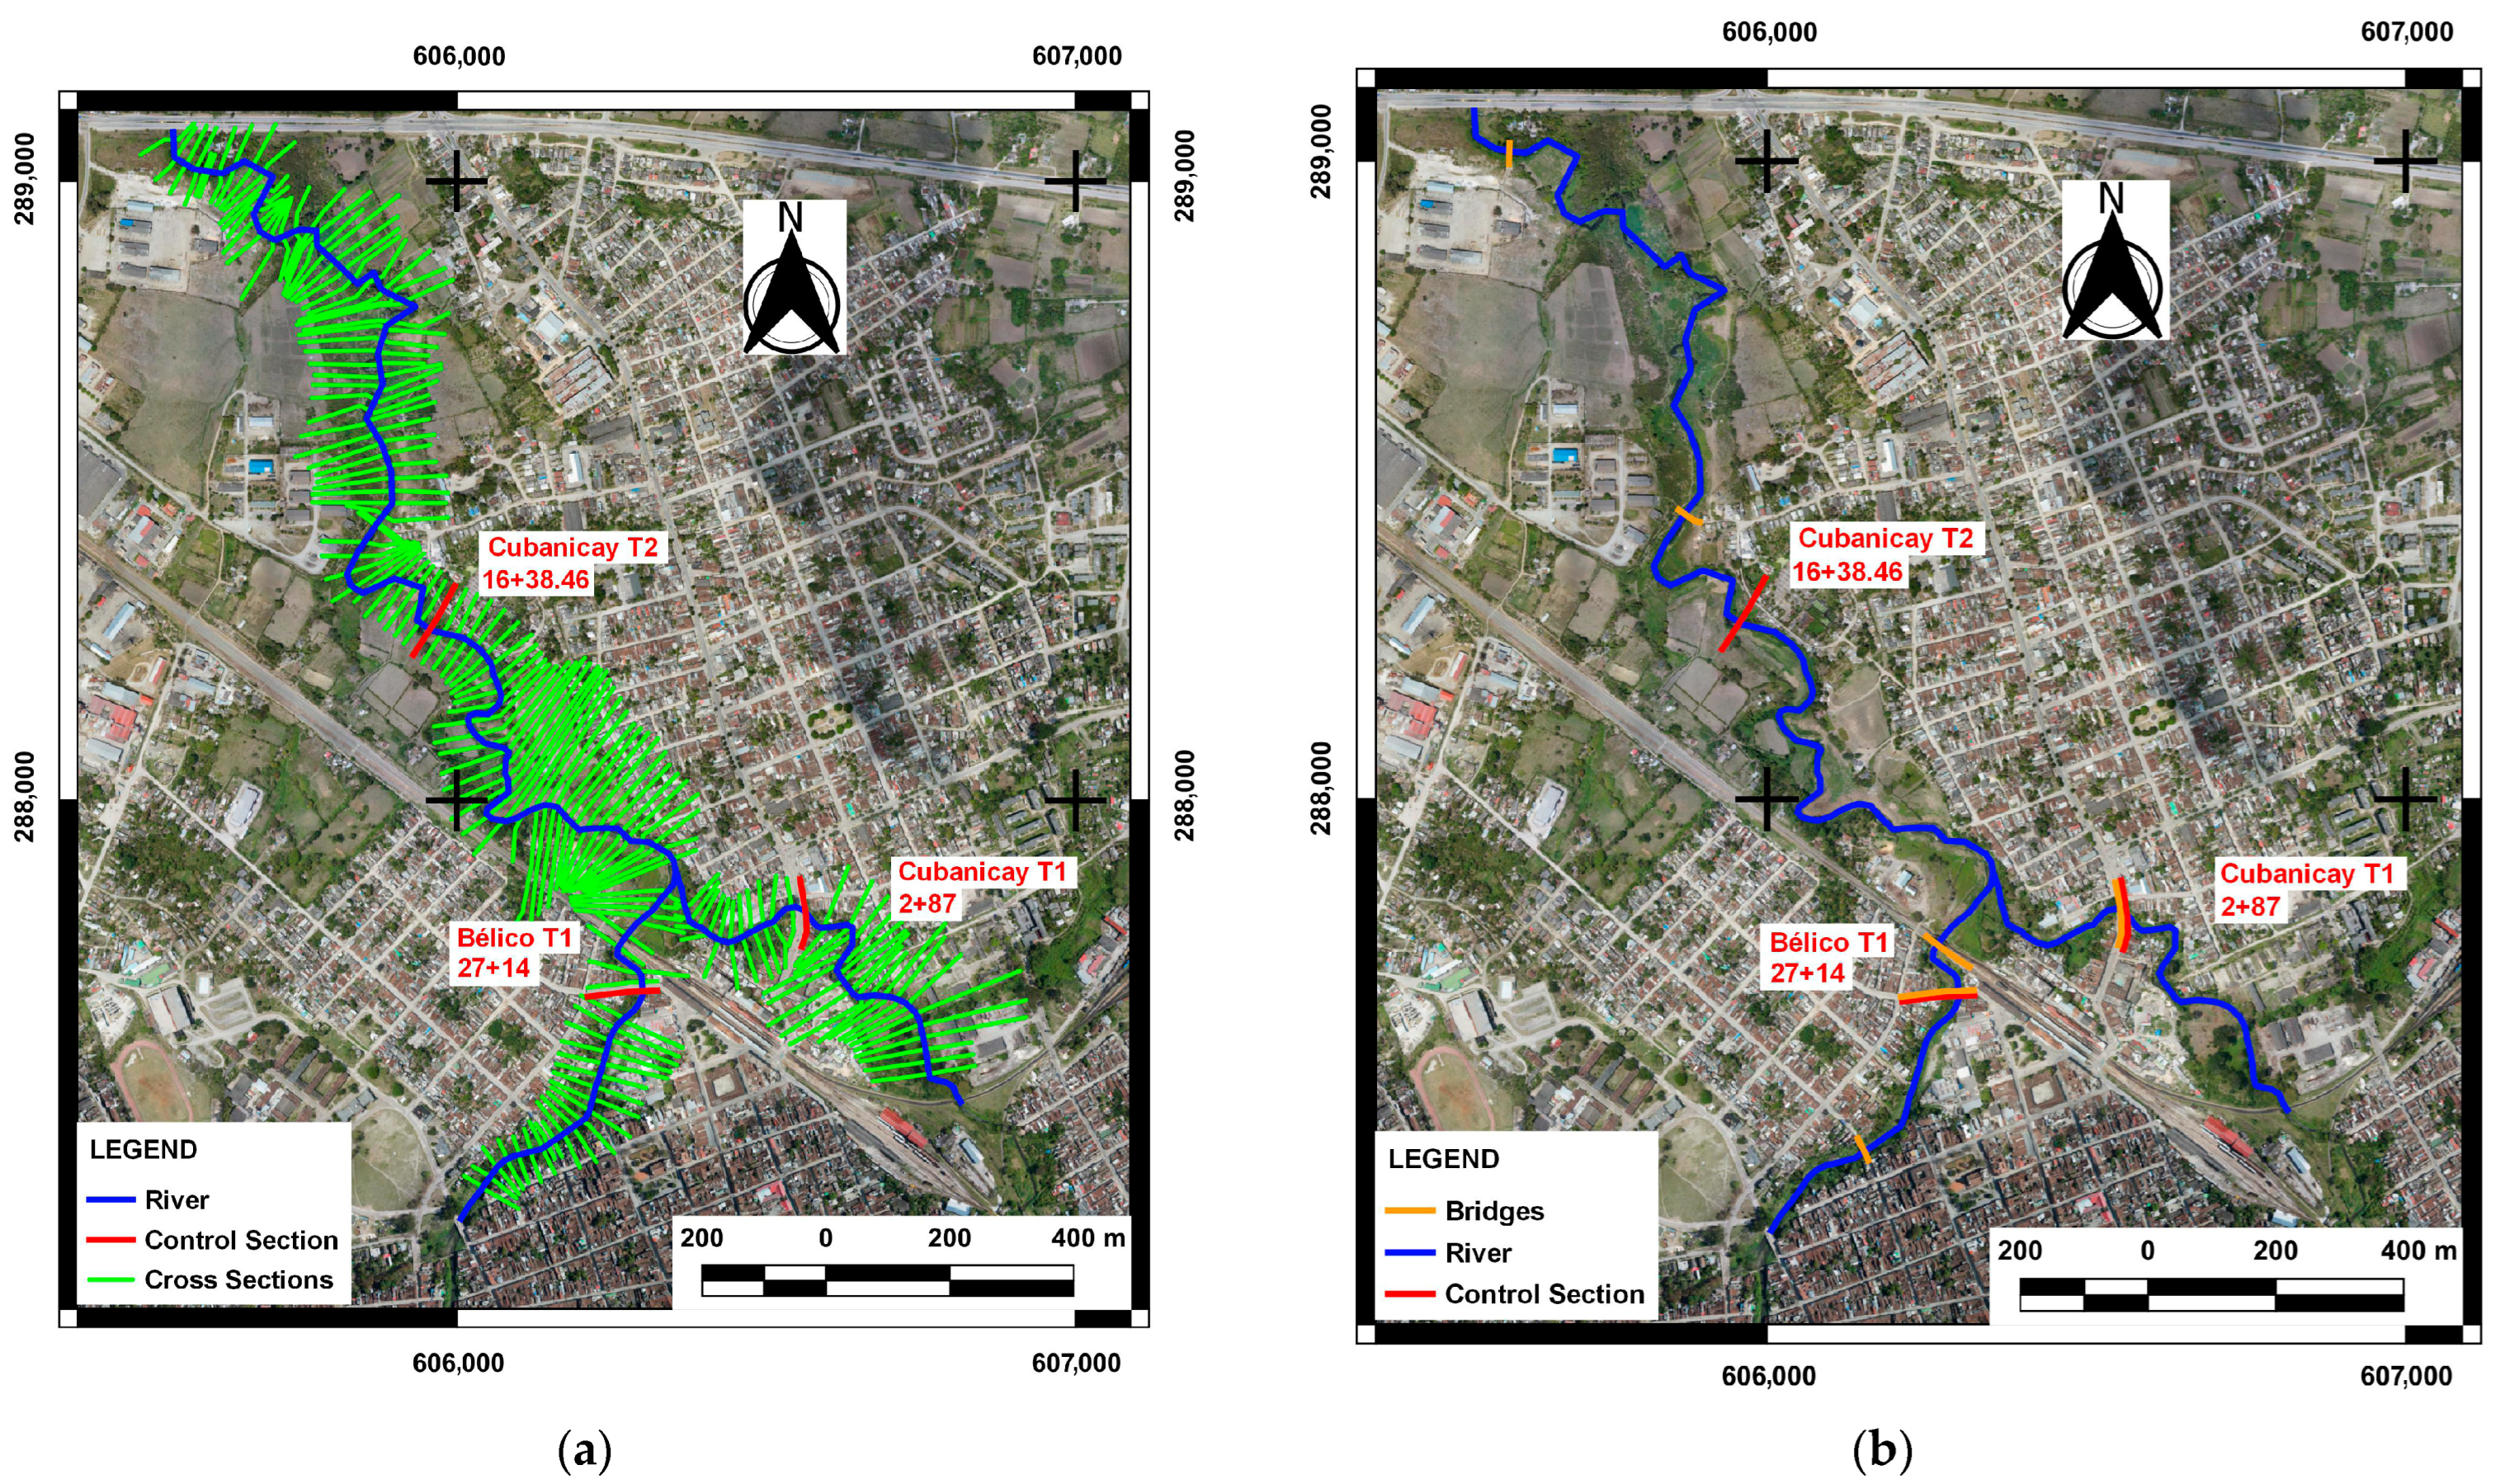
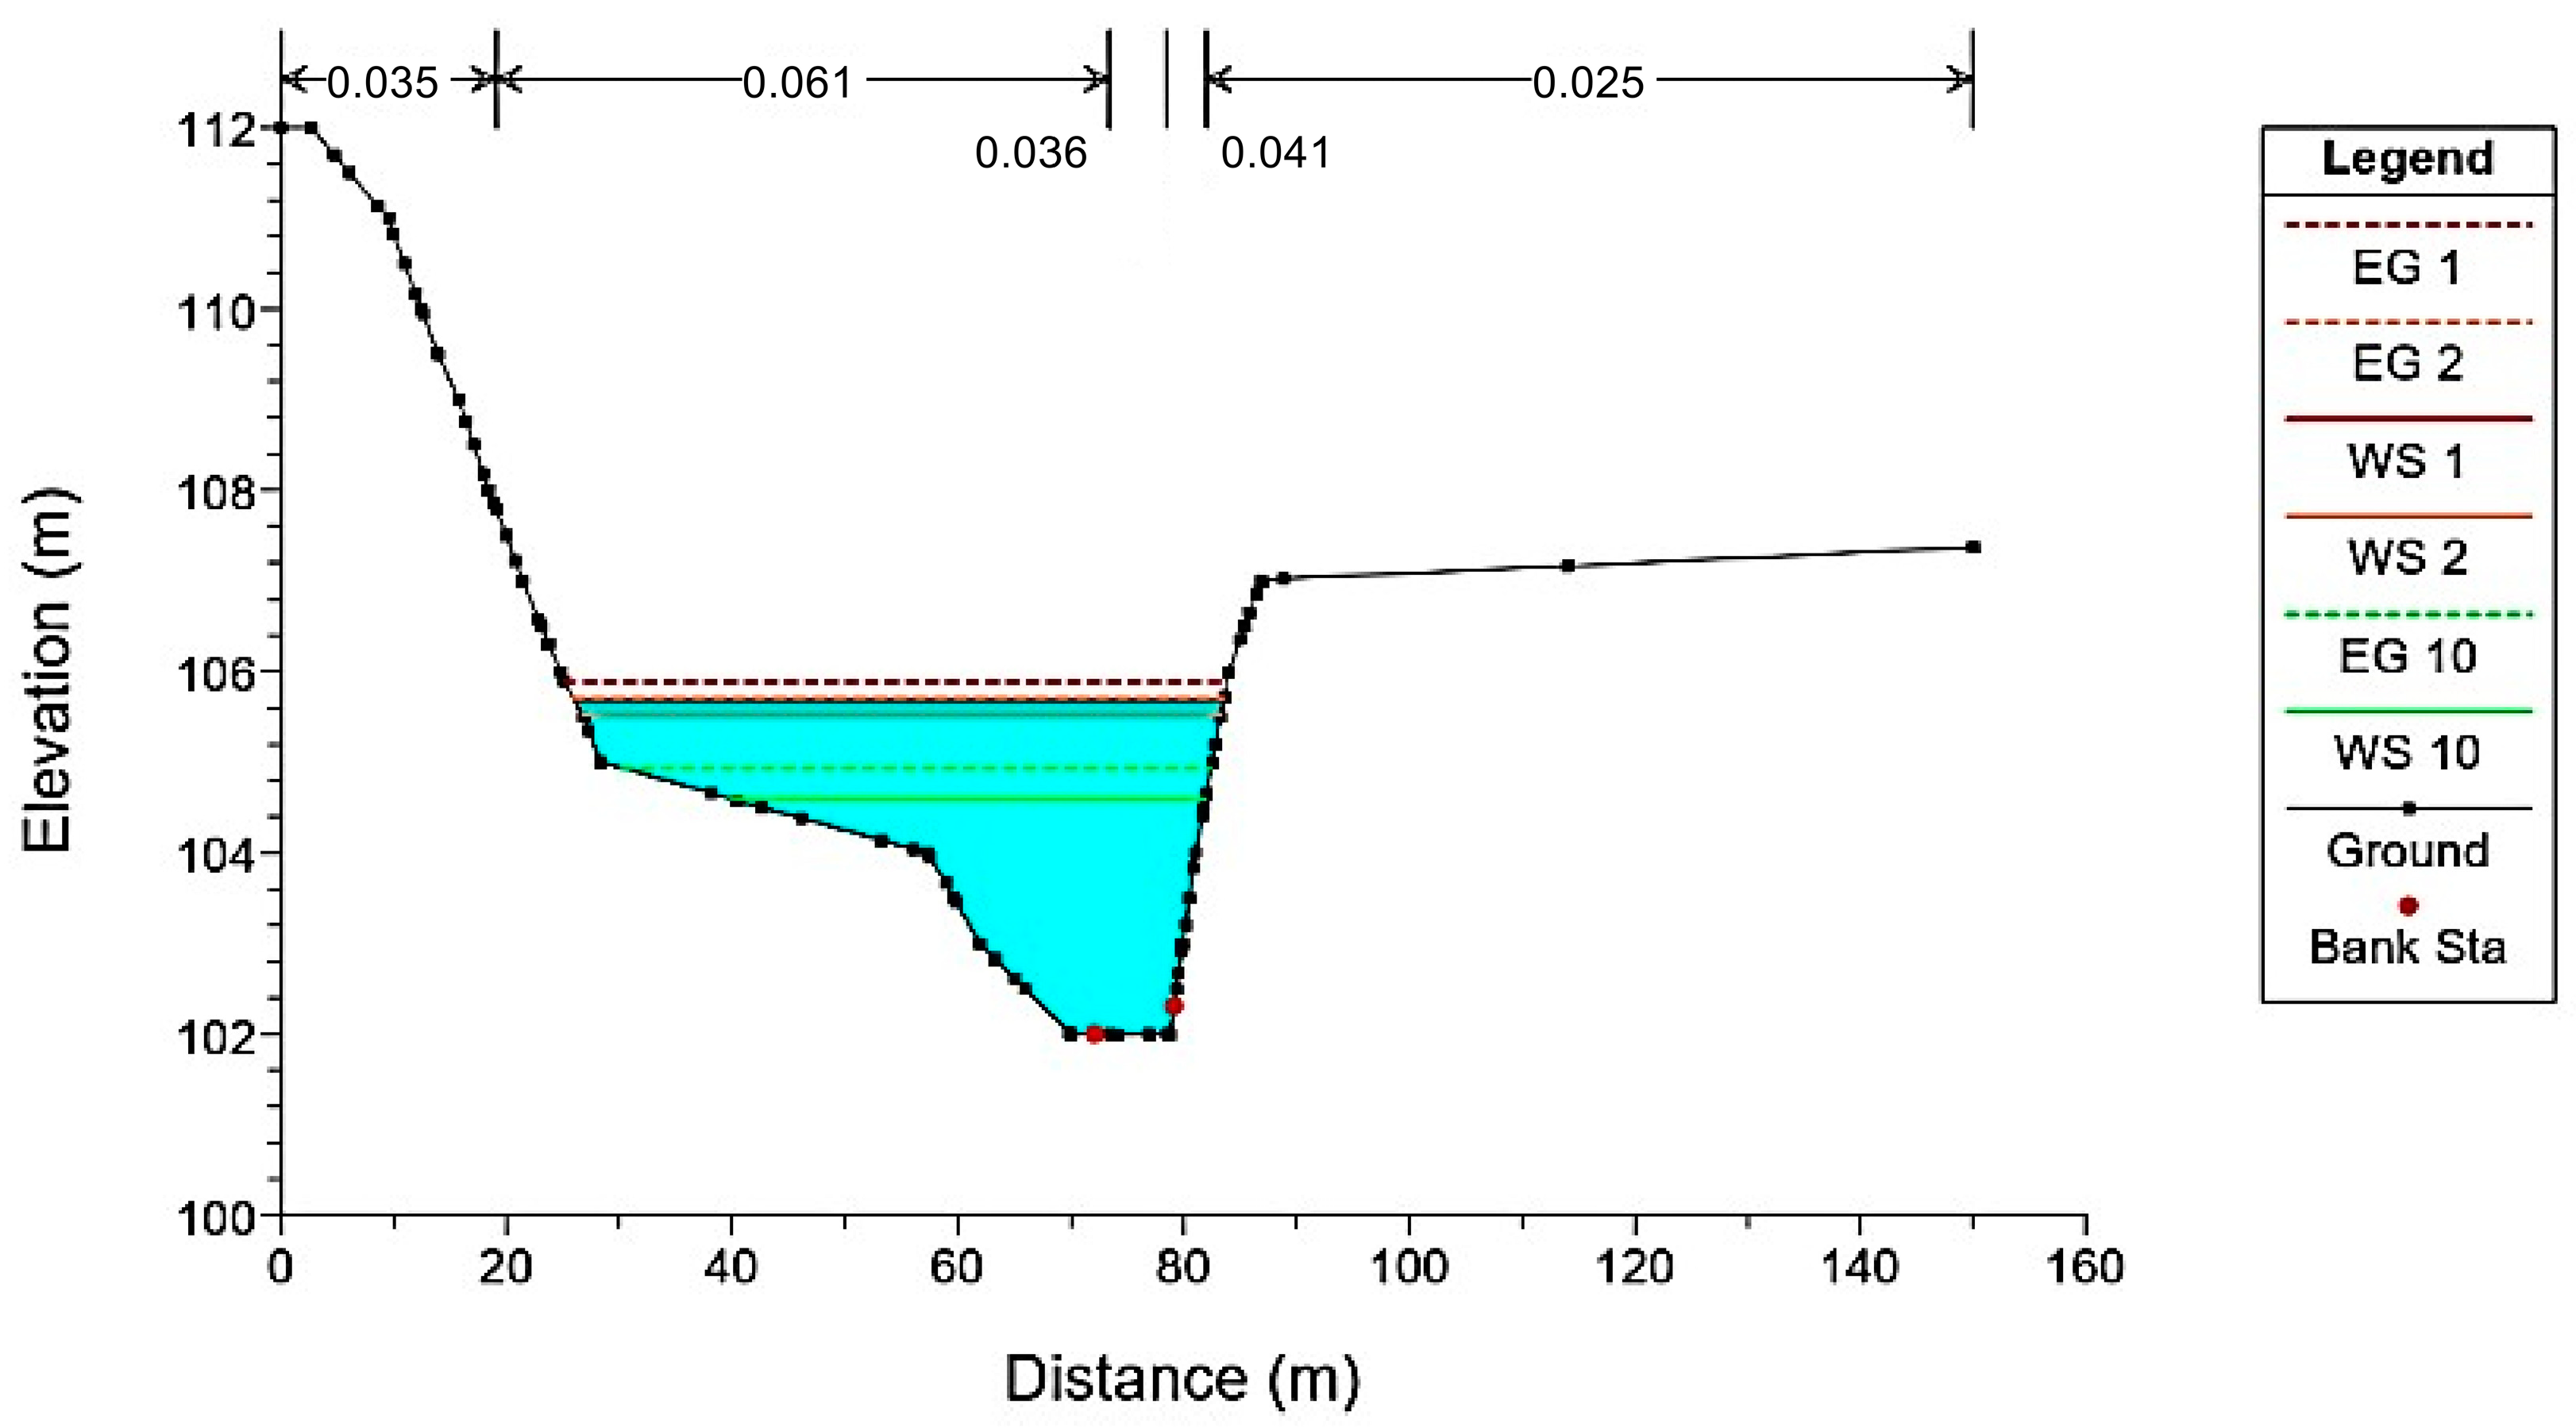
3.2. Channel Cross Section

After determining the Manning coefficients, a map was created for all river sections (spaced at intervals of 20 m) using Samuel’s equation for model stabilization. To account for the sinuosity of the river, 1D cross sections were spaced at 59 m (ΔX) between each section, as shown in Figure 4a. The location of the bridges (marked by orange lines) in the river sections is shown in Figure 4b. A total of six bridges have been built along the Cubanicay and Bélico rivers. Of these six bridges, four are located south, while two are located in the northwest area of the city. Two of them close to the control sections 2 + 87 and 27 + 14.

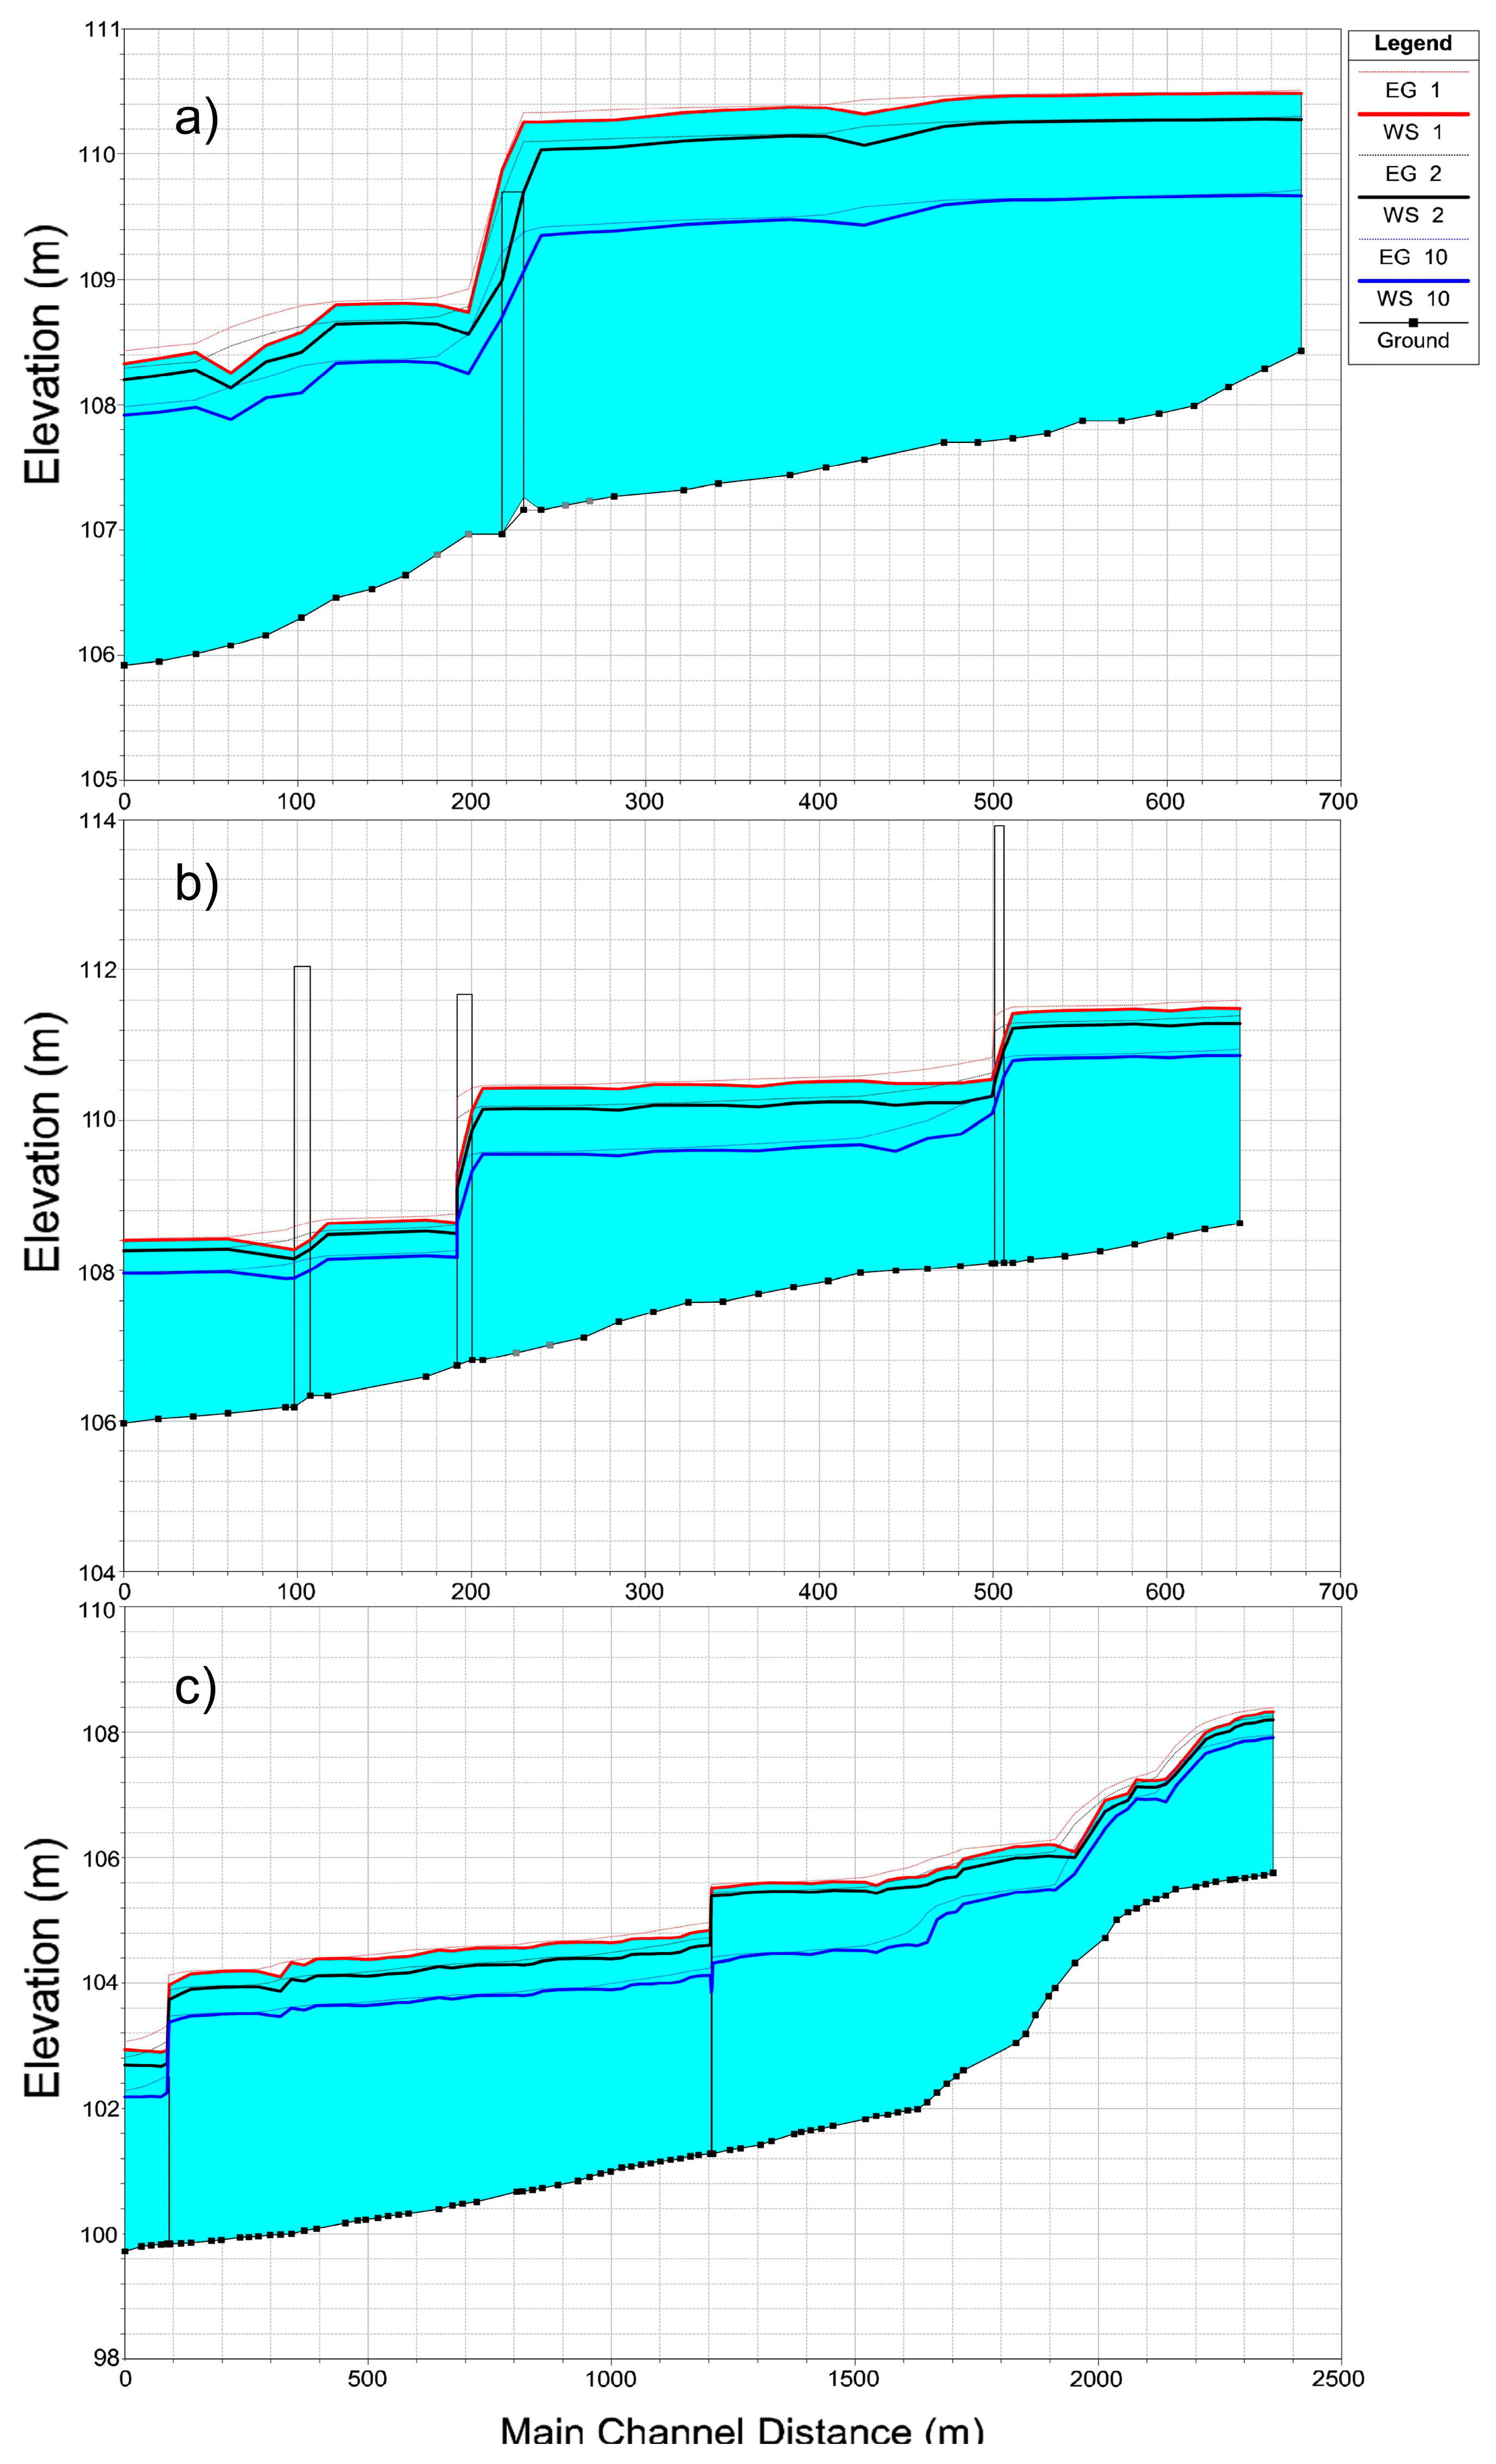
3.3. Simulation Beta Model

Figure 5 shows the calculated WS and EG using the Beta model, while Table 1 included the most relevant hydraulic results. The control section 16 + 38.46 was selected to compare the model results with the water footprints observed in the field, and longitudinal profiles were also included for analysis. Water upwelling levels from its natural state to the recurrence values for 1% (WS 1), 2% (WS 2), and 10% (WS 10) were obtained along with the EG associated with each calculated probability of occurrence.
Overall, simulated depth and energy values were higher for all probabilities of occurrence. The results at the control section 16 + 38.46 for probabilities of occurrence of 1 and 2% showed values of depth and energy between 2.88–3.71 m and 105.56–105.90 m, respectively. The Beta model predicted a maximum elevation of 105.90 m with only a difference of ±0.10 m with the water footprint observed on 25 May 2020 after a hydrometeorological event [11], which documented a footprint value of 106.00 m. Likewise, at point 2 + 87 (Cubanicay river, T1), a water depth of 3.74 m was obtained. This is consistent with reports and evidence of flooding in the area, given that the Sagua road bridge was completely underwater during the estimated 1% flooding event. This was verified with field visits since most of the bridges across the rivers do not exceed 3 m. Depths greater than this limit imply that the structure would remain completely submerged. Therefore, in the case of a high-intensity hydrometeorological event, this area should be identified as critical because of its high risk of flooding.
Figure 6a shows the WS from the stationary modeling of the Sagua road bridge (station 2 + 87). It can be observed that for a design probability of 1%, the bridge is subject to stress and the possibility of flooding is high in this river section. Figure 6b shows the passage of the Cubanicay tributary through the Sagua road bridge, where the presence of sediment and debris in the riverbed is evident, affecting the normal flow. In addition, the hydraulic section is confined due to the existing facade lines in the vicinity. Thus, the structures located on the riverbank cause a considerable reduction in the cross sections. This confining effect on the channel causes a backwater effect upstream of the bridge. Man-made structures located on the riverbank within the urban area may be at risk due to flooding. In addition, the structural integrity of bridges and the safety of the roads are also affected during these flooding events.
Figure 7 shows the longitudinal profiles of the Cubanicay river in sections T1 and T2 (Figure 7a,c) and Bélico in T1 (Figure 7b). From the stationary model, it was confirmed that in most of the upstream sections of bridges, there is a variation in the energy line, creating a backwater effect before its passage through the structure. This phenomenon may occur due to sediment deposits and the abrupt variation in the geometry of the sections upstream and downstream of the bridges, which is expressed by the presence of the frontage lines as a sign of an imminent channel reduction. Therefore, the Beta model results resemble the behavior of the river flow influenced by man-made structures since they are consistent with the facade line observed in the surrounding area of the bridge. It is important to note that, for rivers in urban environments with banks defined mainly by buildings, the use of a simulation 1D model becomes very useful when fluid directions are recommended. On the other hand, 2D models require more computational resources [26] and are mainly justified when the velocity vector component is significant across the floodplains.

3.3.1. Water Footprint

Simulation results from the Beta model were compared to photographic records after a heavy rainfall event for validation purposes. Figure 8a shows the water footprint left on houses located upstream of the Sagua road bridge, where the perimeter fence exceeded 3 m at a location 50 m upstream of the section station 2 + 87. Figure 8b shows scouring and structure damage near the riverbed from the flooding event. Interviews with local residents indicated that most flooding occurred near the Sagua road bridge where the river level reached most of the construction and building facades.

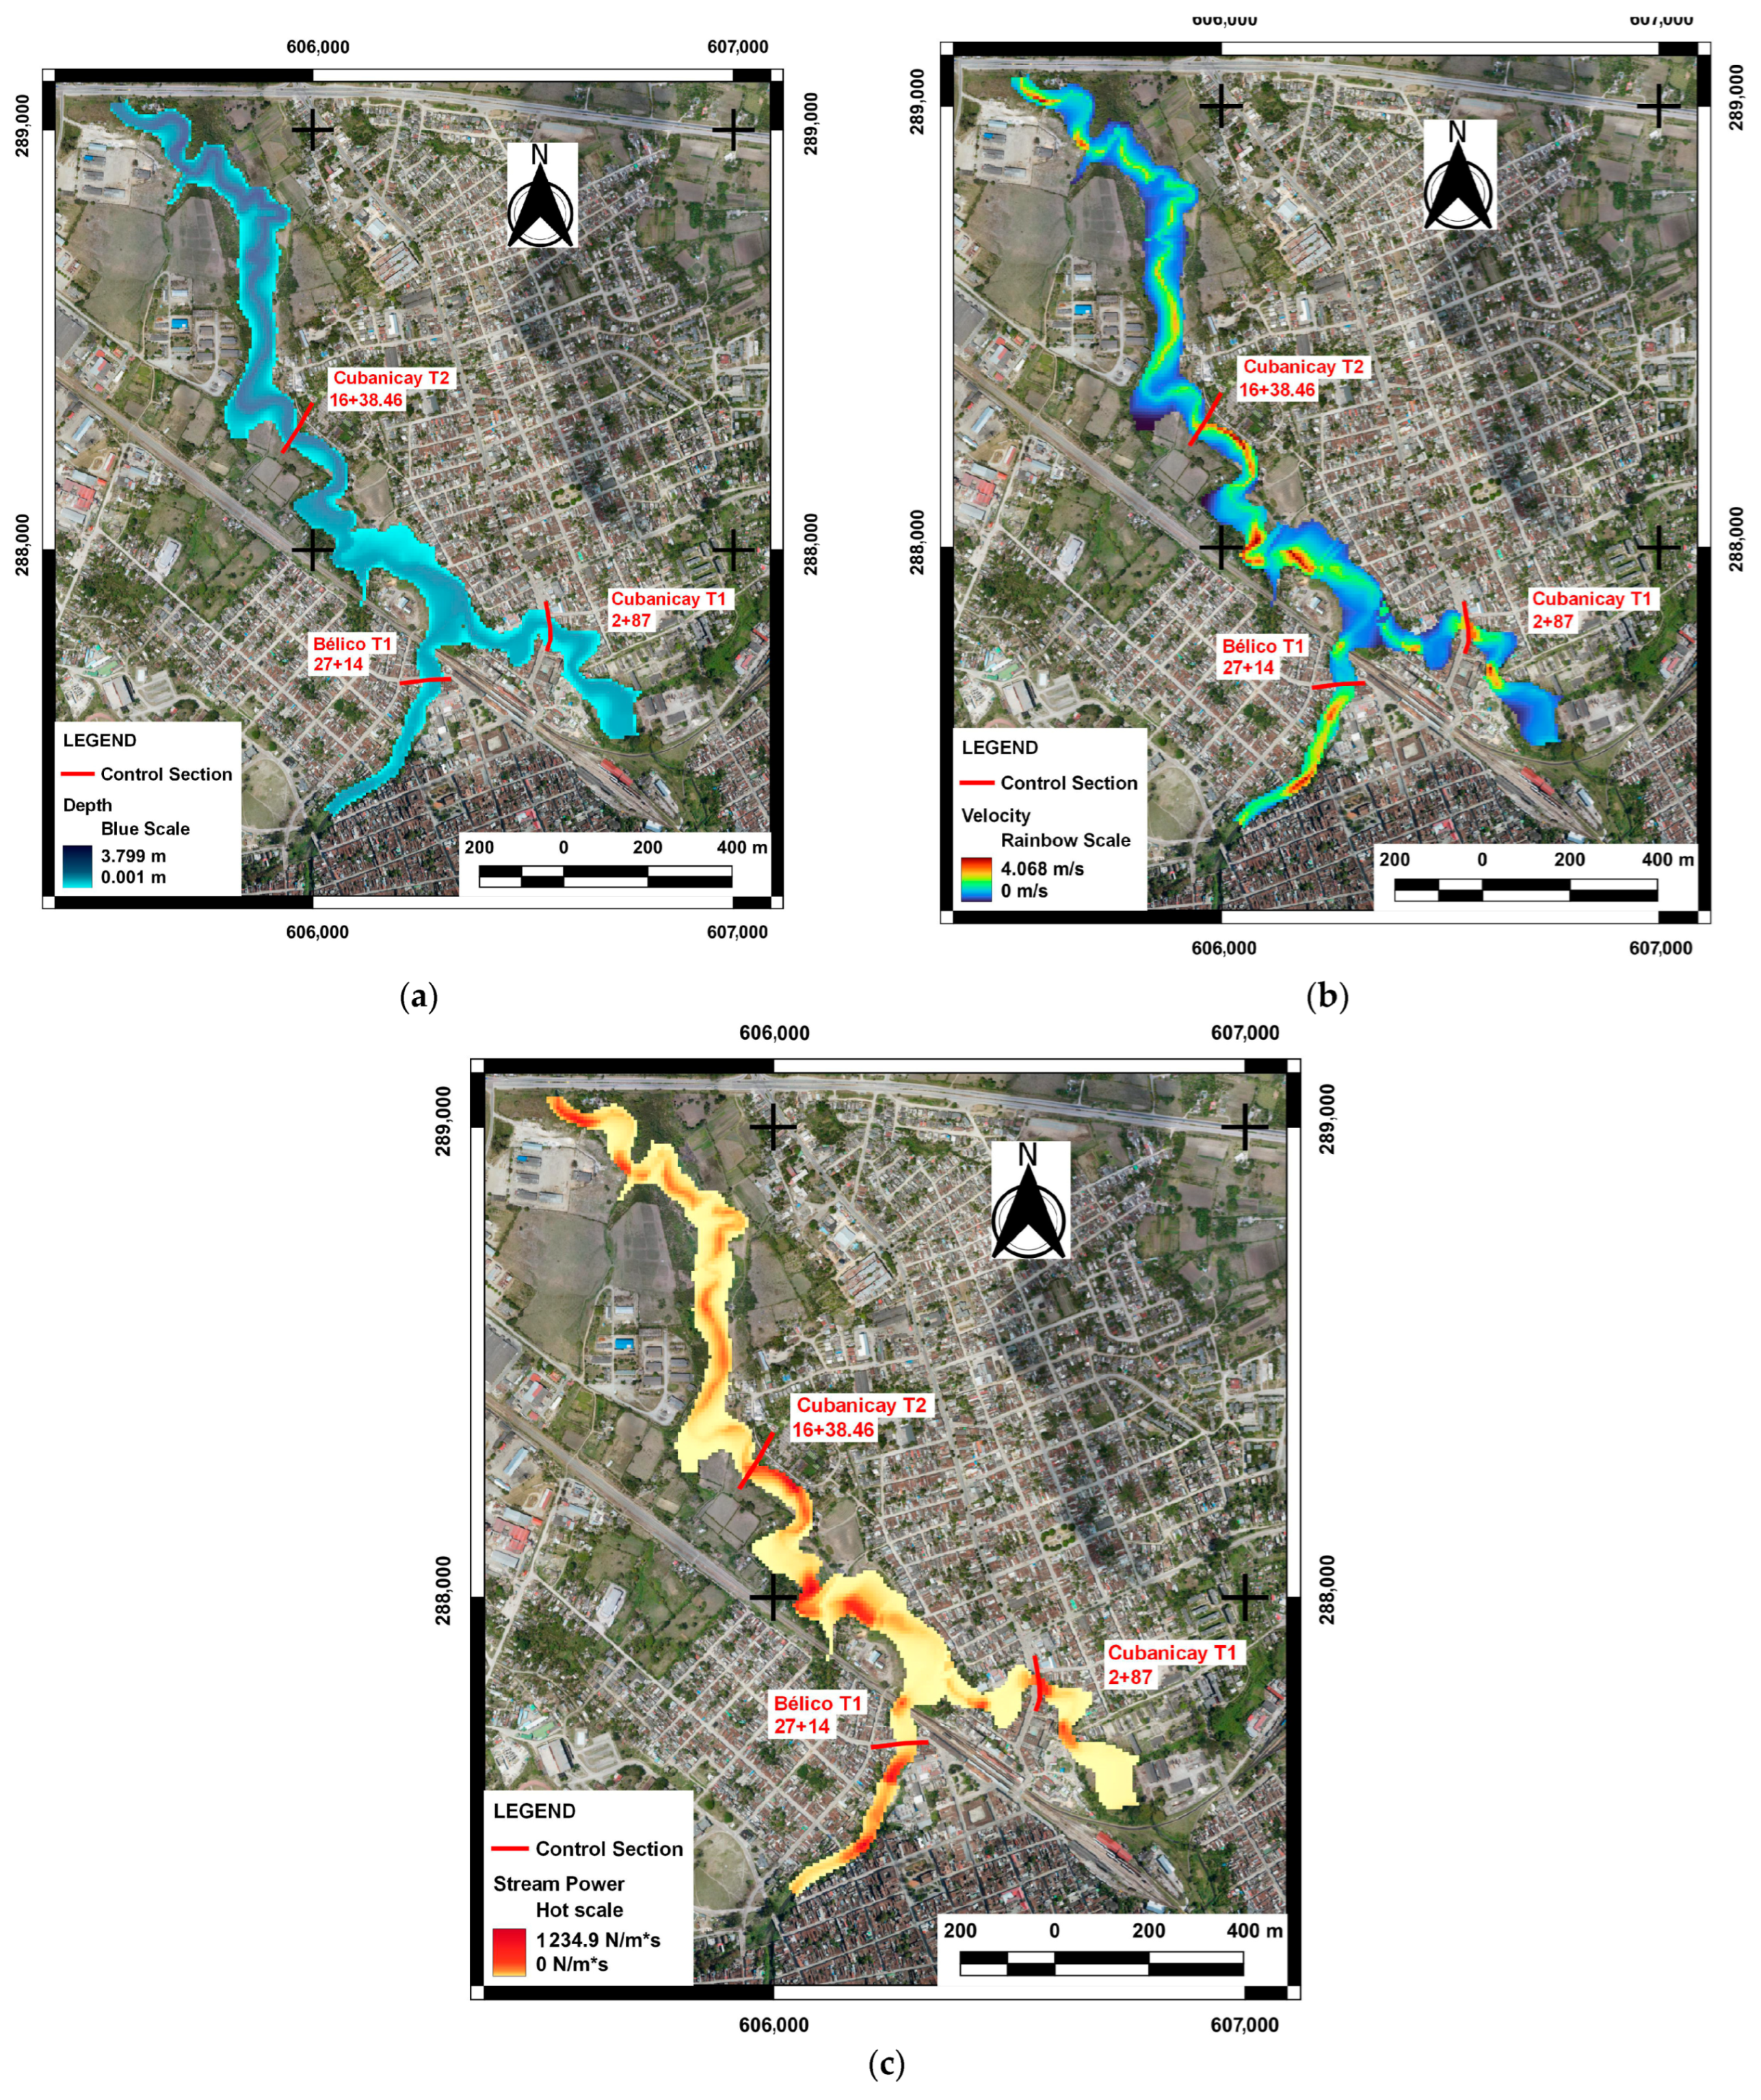
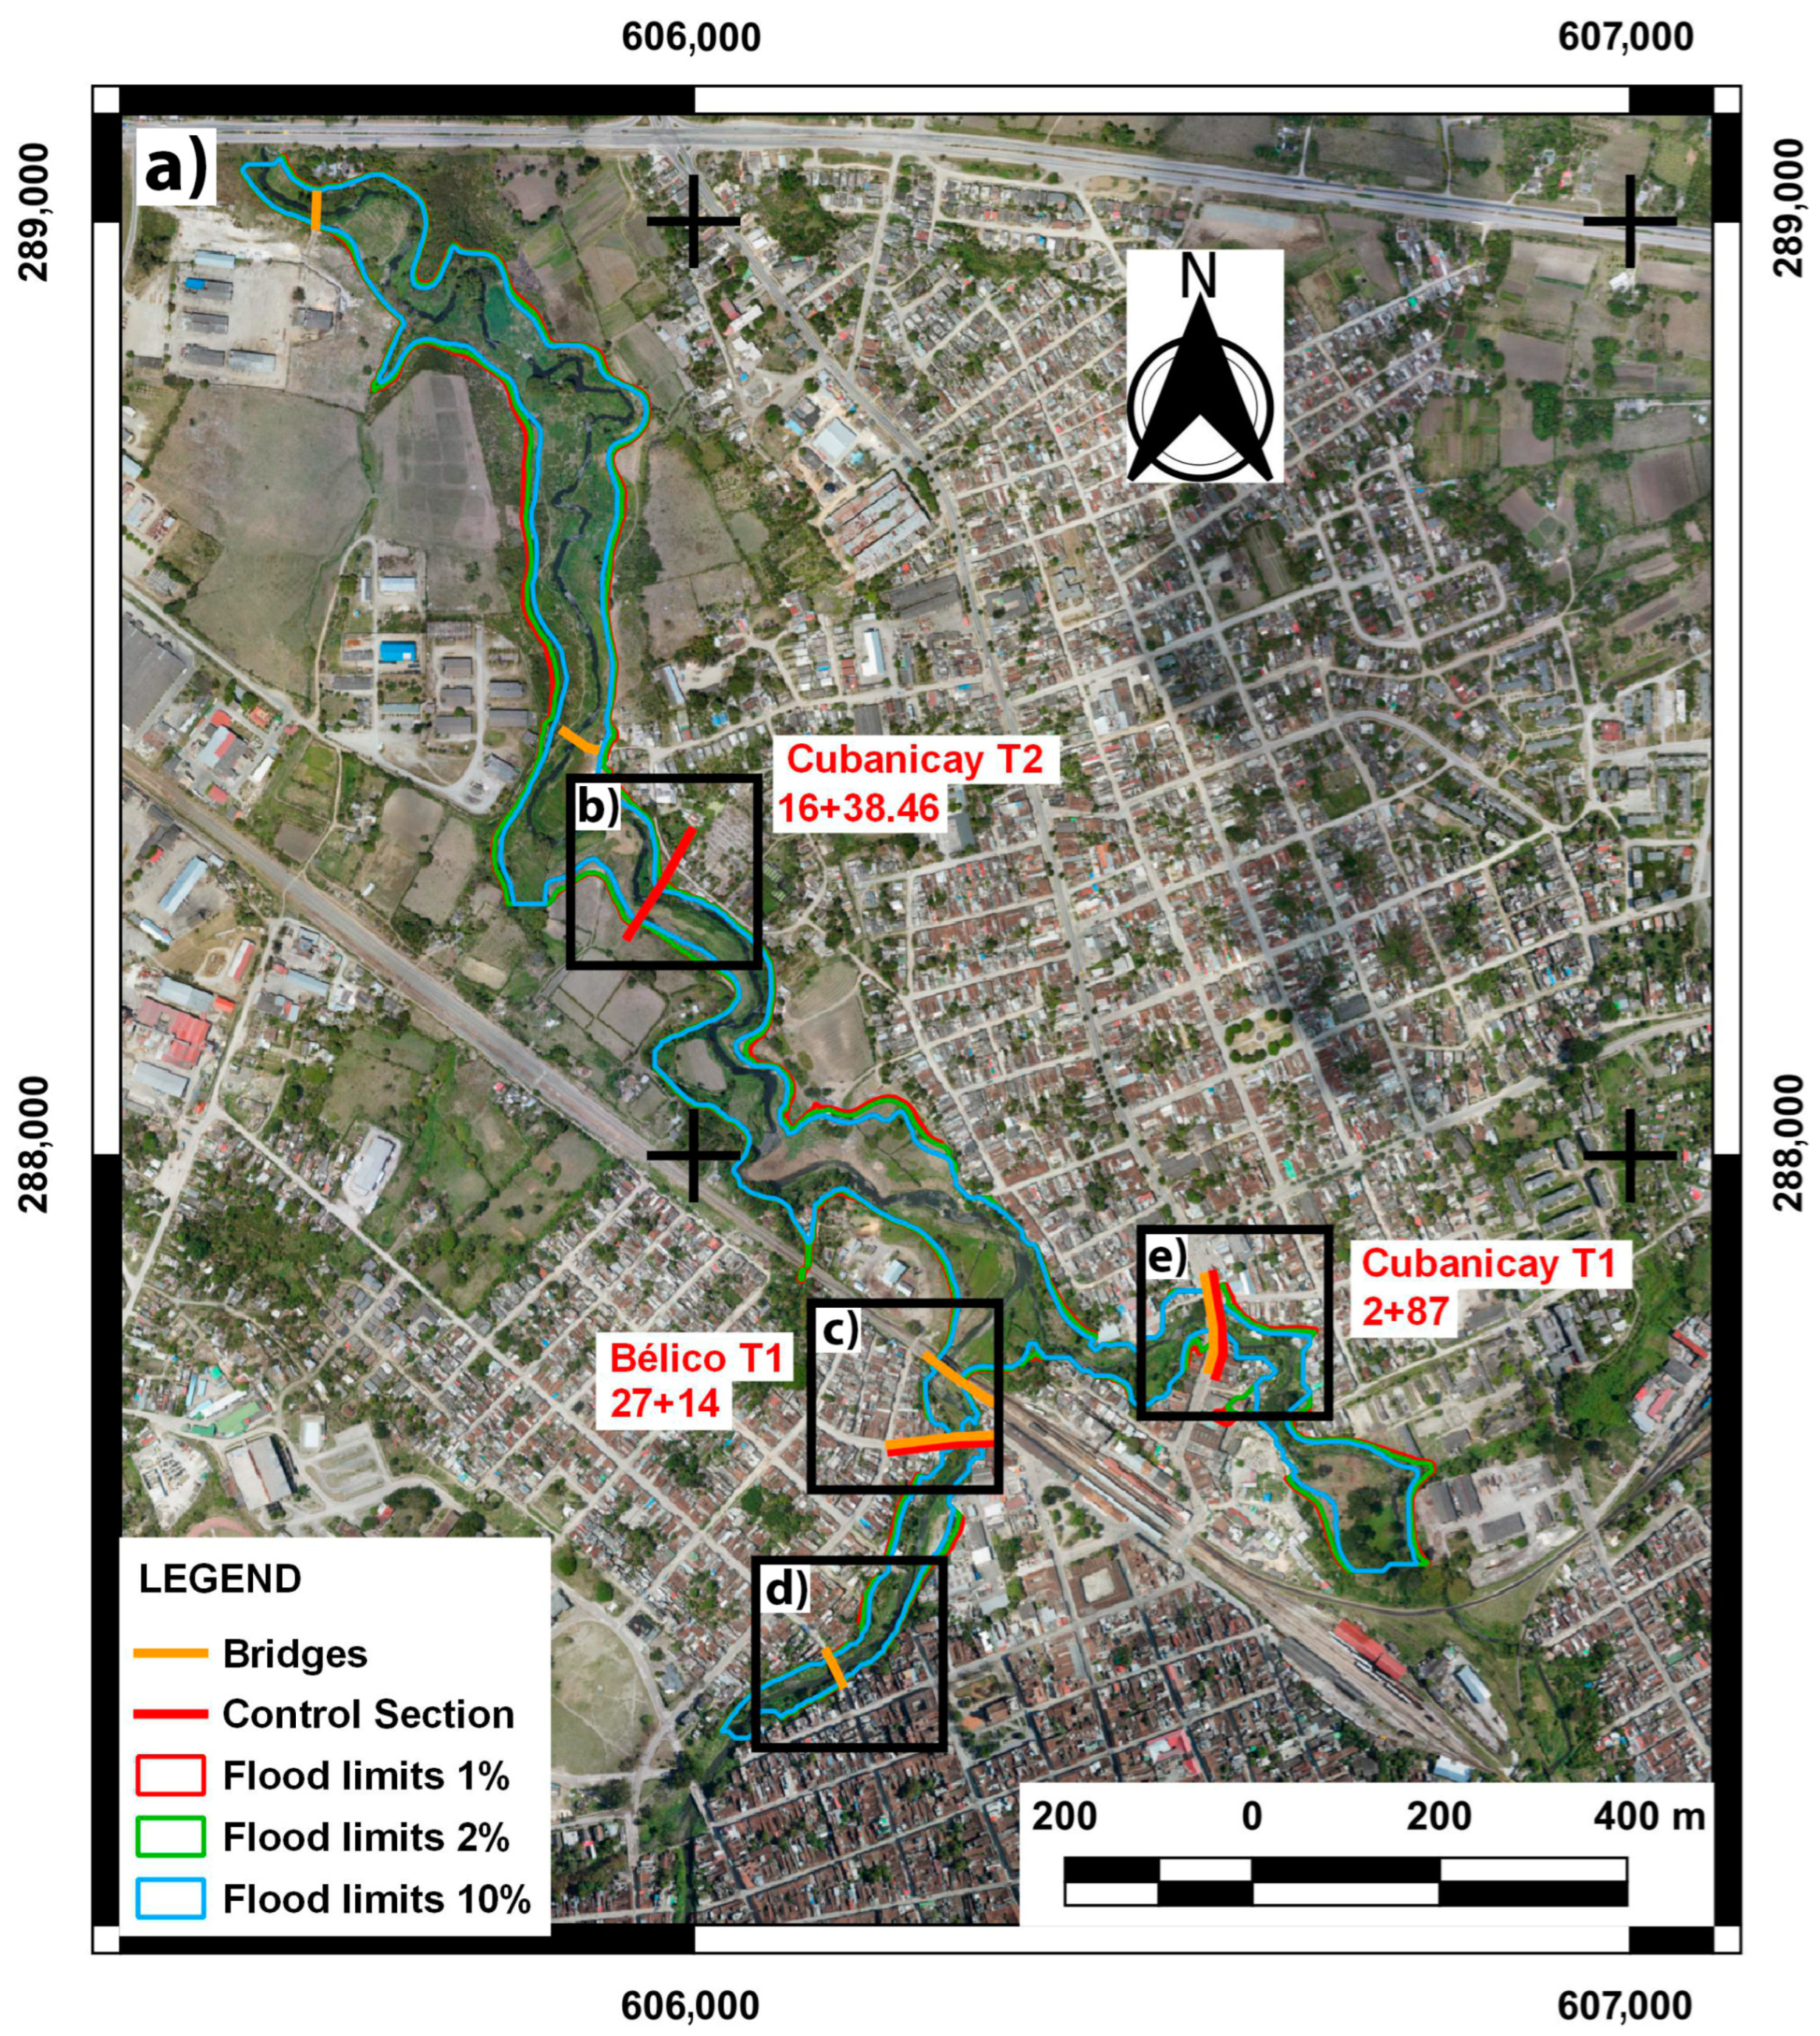
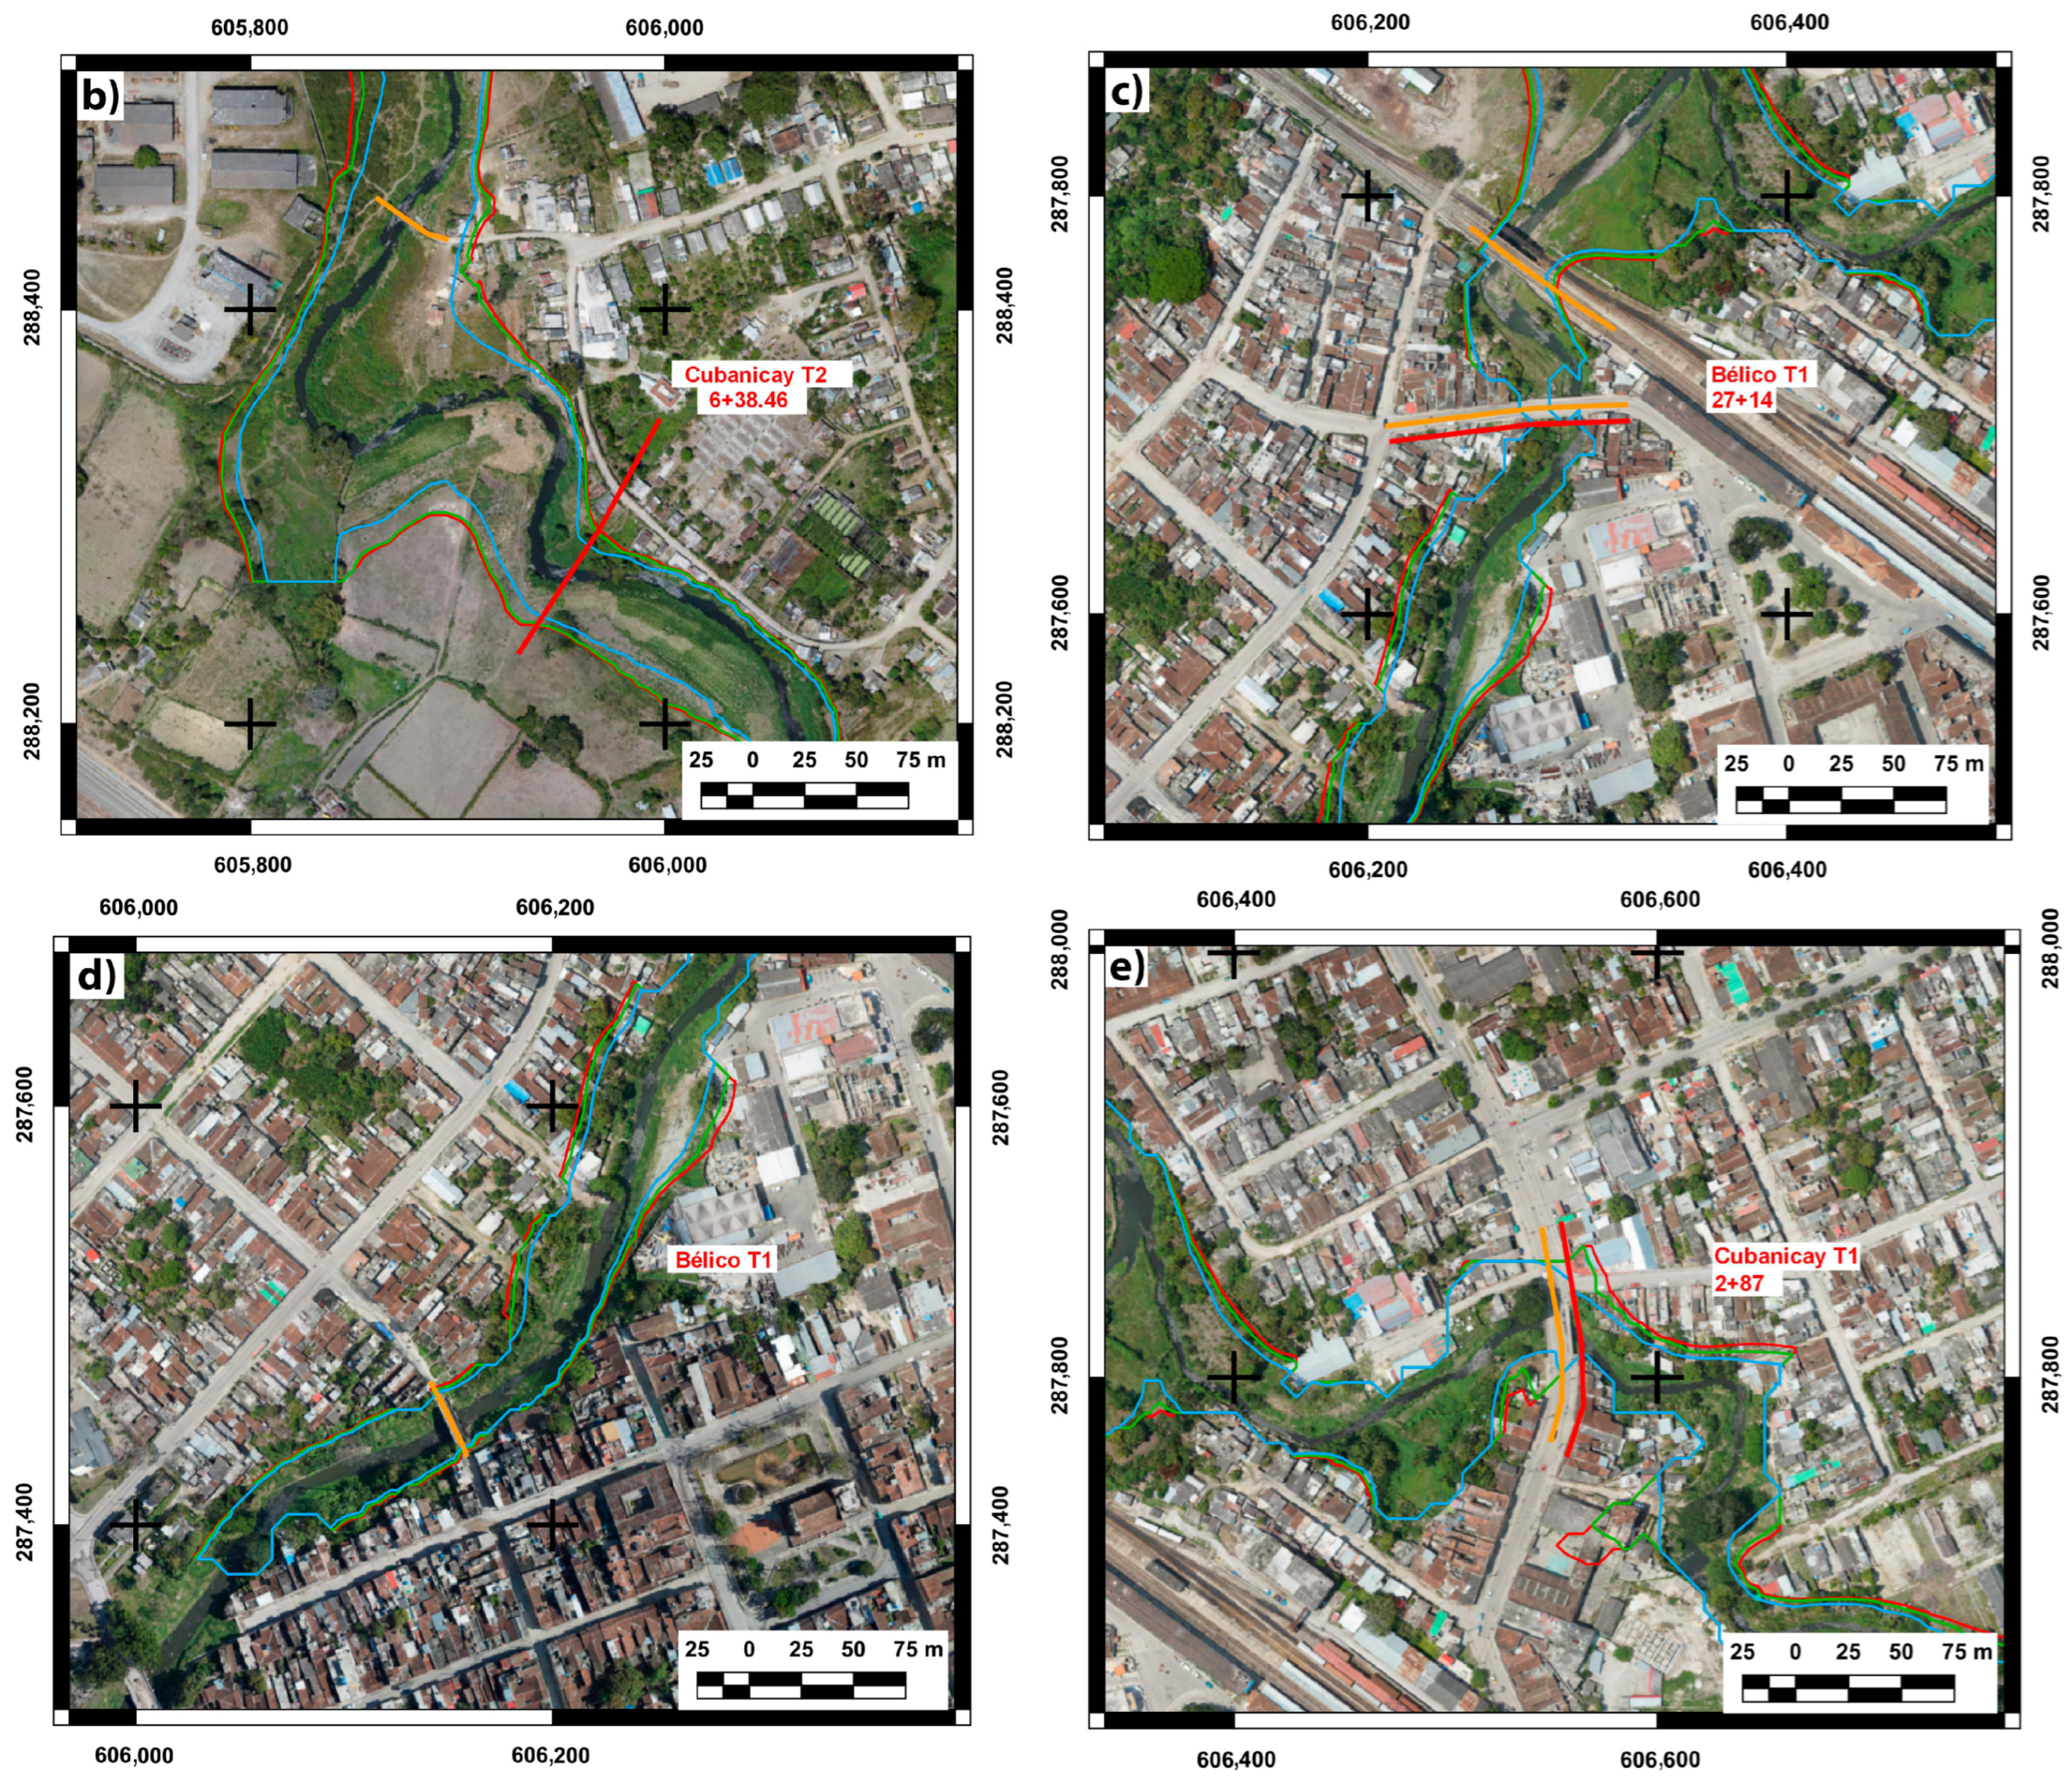
3.3.2. Urban Flood Maps

Figure 9a,b show depth and water total speed distribution for the most critical scenario, which was a 1% probability of occurrence (i.e., the highest values obtained during the simulation). In addition, it shows the reconstructed flooding area for the event that occurred on 25 May 2020 [11], which will be discussed later. Figure 9a shows simulation results for flow depth and the extent of the floodplain for the Cubanicay river, with depths up to 3.80 m in its deepest parts (dark blue). Figure 9b shows the areas for greater erosive potential (red color). In addition, the effect of flow acceleration due to the backwater effect upstream of each construction site can be observed. In several sections of the river, velocities of up to 4.1 m/s were predicted, particularly in narrow areas of the channel. A previous study [33] for the Quibú river located in Habana, Cuba reported velocity values between 0.5 and 2.0 m/s. According to [44], the water velocity must be between 2.16 and 2.20 m/s to prevent damage. Therefore, these areas highlighted in red (Figure 9c) should be monitored given potential changes in the channel due to erosion. Remarkably, in the control section 16 + 38.46, despite the predictions of high-flow velocities that could cause high shear stresses on sandy and rocky surfaces, the pedestrian bridge was not affected. Minimum velocity values were found in low-slope areas, including the junction of both rivers. These areas were identified as prone to the accumulation of sediments and debris due to the lack of maintenance of the riverbed. Stream power results represent the rate of dissipation of energy against the riverbed and banks. Figure 9c shows a maximum stream power of 1234.9 N/m*s. The red areas represent locations where the riverbed has greater force (i.e., in these areas, there is no sediment accumulation). Conversely, the yellow areas suggest the presence and accumulation of sediments, which influence the channel flow. The Beta model with bridges shows high velocities, but for short spans. Then, the resistance and dissipation of energy due to viscosity and depth variation in water flow significantly reduce the erosion potential.
Figure 10a–e show flood maps developed for the different probabilities of occurrence, and by enlarging some areas of interest. A closer analysis was performed on control section 16 + 38.46 (located in T2 in Cubanicay river) and 27 + 14 (located in Bélico river, T1) downstream of the point where it joins the Bélico river and 2 + 87 (located in T1 in Cubanicay river) where the overflows appear to be significant. Under the influence of a maximum flow of 154.54 m3/s, a wetted surface width of 205.20 m was reached at its widest section, corresponding to the confluence of the two rivers. However, in this area, overflows do not seem to be significant and the river remains in its main channel and few houses are exposed to overflows. Even further upstream, towards the northwest section of the river after station 16 + 38.46, there is a wetland (Figure 10b) that does not seem to be affected by overflows. This is unlike the T1 sections of the Bélico and Cubanicay rivers, which are negatively impacted under the three scenarios of occurrence of hydrometeorological events. In addition, the structure of the Sagua road bridge, 2 + 87 (Figure 6 and Figure 10e), had already been identified as critical. This result was confirmed by site visits and by testimonies of the inhabitants of this urban area, which considered the area vulnerable to flooding in case of heavy rain. Therefore, the previously reported results reliably describe the flood limits in the study area.
Natural disasters such as flash floods can have a devastating impact on communities and the environment. Therefore, it is essential to develop accurate and reliable models to predict and mitigate flood risks [4]. The elaboration of this hydraulic model was part of research carried out by the authors of [38], oriented to improve the model, which did not predict good values of velocity and maximum flow due to the initial assumptions adopted by them; this was also reported in [28]. The results from the improved model were compared with the May 25th and 26th, 2019 flood event through direct observation of the flooded areas and water footprint. The model captured a flooded area of 20.79 ha, recognizing the low existence of flooded plains and the predicting capabilities of the one-dimensional model reported in [28] and [20].
Several significant factors [20,28,45] that may contribute to flash floods were predicted by the model, including channel changes due to the influence of urbanization with bridges and the facade lines, the slope in some channel sections, and the flood hydrographs caused by rains for a different probability of occurrence. These results may be contrary to previous studies [28] stating that the elevation and slope are the main factors in a flooding event. It was found that the presence of structures such as bridges and high accumulation degrees of sediment and litter in the riverbed are the main cause.
Flood hazard boundary maps may have a significant impact on a global, regional, and local scale, including decreasing flood risks and consequences, supporting sustainable development, and enhancing disaster resilience. These maps are a valuable tool for identifying areas that are at risk of flooding, enabling decision makers to develop effective flood management strategies. By comprehending the extent and severity of a potential flooding event, decision makers may prioritize solutions for improving drainage systems, constructing flood protection structures, and regulating land use and new developments in flood-prone areas [4,33]. Additionally, these maps can promote sustainable development by distinguishing between suitable and unsuitable areas for urban development, which can reduce losses and expenses due to flooding events. Furthermore, flood limit maps can boost disaster resilience by offering critical information that can be utilized in emergency planning and response. By comprehending the potential consequences of flooding on infrastructure and other areas, decision makers can make informed decisions about emergency response efforts such as evacuations, rescue operations, and relief efforts.

3.3.3. Final Remarks and Future Recommendations

Despite the benefits of the approach presented in this study, there are some limitations and challenges that should be addressed. The main limitations were the lack of observed data during flood events to validate the hydraulic Beta model in other control sections. Future work should focus on monitoring flood events to improve the prediction capabilities of the model throughout the basin, as well as incorporating analyses of the effect of sediment transport and flooding time for flood hazard assessment. In addition, it is recommended to develop two-dimensional (2D) models to assess potential risks not only for flooding but also for wall erosion and the structural stability of the bridges that are submerged.
The involvement of local communities is strongly recommended for developing flood mitigation strategies, as their past experience with flood events may help to provide insights about the flooding dynamic during complex hydrometeorological events. Therefore, there is a constant need to educate and empower local communities to prepare them for future flood events. The results presented in this study are expressed in maps and reports elaborated on in such a manner that can be more accessible to the non-scientific community.

4. Conclusions

The Beta simulation model was used to obtain the flood limits of two urban rivers in Santa Clara, Cuba under different probabilities of occurrence of hydrometeorological events to identify vulnerable areas affected by flooding. The Beta simulation model showed a difference of ±0.10m concerning the water footprint found in the field, providing a more realistic representation of the probability and severity of different flood scenarios. The urban areas located in T1 of Bélico and Cubanicay rivers, mainly near the monitoring stations (27 + 14 and 2 + 87) should be considered as flood-prone areas (flood hazard areas) during a strong hydrometeorological event.
Modeling may play a crucial role in reducing flood damages by providing insights into the behavior of water flow and how the river interacts with man-made structures. By simulating different flood scenarios and predicting their potential impacts, the results can be used by researchers, city planners, and local governments for risk assessment and zoning regulations to prevent further urban developments in flood-prone areas. In addition, the results can provide insights for building new structures such as bridges and culverts to ensure safety and prevent the exacerbation of flooding in nearby areas. This flood limits map developed for this urban area can be an important tool for developing evacuation plans and flood mitigation strategies to reduce human and economic losses during a flood event.

Author Contributions

Conceptualization: R.A.M.S., L.G.-R. and M.A.G.; methodology: M.A.G., L.G.-R., C.L.C.-G. and R.A.M.S.; software: C.L.C.-G., M.A.G. and L.G.-R.; formal analysis: J.J.; investigation: L.G.-R., L.d.D.d.J.d.S. and Y.R.M. resources: C.L.C.-G. and M.A.G.; data curation: L.G.-R.; writing—original draft preparation: M.A.G. and L.G.-R.; writing—review and editing: L.G.-R., Y.R.M. and J.J.; visualization: L.G.-R. and L.d.D.d.J.d.S. supervision: L.G.-R. and M.A.G.; project administration: R.A.M.S. and M.A.G. All authors have read and agreed to the published version of the manuscript.

Funding

This research was funded by Empresa de Investigaciones y Proyectos Hidráulicos, Villa Clara, Cuba and Universidad de Las Americas, Chile and the APC was funded by Program to Support Publication in Open Access Journals 2023 of Universidad de Las Américas, Chile.

Data Availability Statement

Derived data supporting the findings of this study are available from the L.G.-R. on request.

Acknowledgments

The authors acknowledge the Universidad de Las Americas, Chile for funding acquisition, L.G.-R. gratefully acknowledges the NIDS.

Conflicts of Interest

The authors declare no competing interest.

References

  1. Yao, L.; Wei, W.; Yu, Y.; Xiao, J.; Chen, L. Rainfall-runoff risk characteristics of urban function zones in Beijing using the SCS-CN model. J. Geogr. Sci. 2018, 28, 656–668. [Google Scholar] [CrossRef]
  2. Cui, P.; Peng, J.; Shi, P.; Tang, H.; Ouyang, C.; Zou, Q.; Liu, L.; Li, C.; Lei, Y. Scientific challenges of research on natural hazards and disaster risk. Geogr. Sustain. 2021, 2, 216–223. [Google Scholar] [CrossRef]
  3. Lechowska, E. What determines flood risk perception? A review of factors of flood risk perception and relations between its basic elements. Nat. Hazards 2018, 94, 1341–1366. [Google Scholar] [CrossRef]
  4. Membele, G.M.; Naidu, M.; Mutanga, O. Examining flood vulnerability mapping approaches in developing countries: A scoping review. Int. J. Disaster Risk Reduct. 2022, 69, 102766. [Google Scholar] [CrossRef]
  5. IPCC. Climate Change 2013: The Physical Science Basis: Working Group I Contribution to the Fifth Assessment Report of the Intergovernmental Panel on Climate Change; IPCC: United Kingdom; New York, NY, USA, 2013. [Google Scholar]
  6. Quesada-Román, A.; Fallas-López, B.; Hernández-Espinoza, K.; Stoffel, M.; Ballesteros-Cánovas, J.A. Relationships between earthquakes, hurricanes, and landslides in Costa Rica. Landslides 2019, 16, 1539–1550. [Google Scholar] [CrossRef]
  7. Ramos-Scharrón, C.E.; Arima, E.Y.; Hughes, K.S. An assessment of the spatial distribution of shallow landslides induced by Hurricane María in Puerto Rico. Phys. Geogr. 2022, 43, 163–191. [Google Scholar] [CrossRef]
  8. de Beurs, K.M.; McThompson, N.S.; Owsley, B.C.; Henebry, G.M. Hurricane damage detection on four major Caribbean islands. Remote Sens. Environ. 2019, 229, 1–13. [Google Scholar] [CrossRef]
  9. Zakrison, T.L.; Valdés, D.M.; Shultz, J.M. The Medical, Public Health, and Emergency Response to the Impact of 2017 Hurricane Irma in Cuba. Disaster Med. Public Health Prep. 2020, 14, 10–17. [Google Scholar] [CrossRef]
  10. Messina, W.A.; Royce, F.S.; Spreen, T.H. Cuban Agriculture and the Impacts of Tropical Storm Fay and Hurricanes Gustav and Ike 1. 2008. Available online: https://ufdcimages.uflib.ufl.edu/ir/00/00/09/45/00001/fe75500.pdf (accessed on 6 April 2023).
  11. IFRCRCS. DREF Final Report Cuba: Floods. 2021. Available online: https://reliefweb.int/report/cuba/cuba-floods-dref-final-report-mdrcu006 (accessed on 6 April 2023).
  12. Iturralde-Vinent, M.A. Peligro De Inundaciones Por Intensas Lluvias En Cuba: Comportamientos. An. Acad. Cienc. Cuba 2018, 11, 16–28. [Google Scholar]
  13. Castillo García, C.L.; Pérez, T.D.; Gil, L.Á.; Gonzáles, M.Á. Estrategias para el diseño de sistemas de drenaje urbano en la ciudad de Santa Clara. Ing. Hidráulica Ambient. 2022, XLIII, 44–57. [Google Scholar]
  14. Putri, I.H.S.; Buchori, I.; Handayani, W. Hydrometeorological Disaster Assessment: Study of Risk and Loss Assessment of Disaster Events in Central Java. Sustain. Clim. Chang. 2022, 15, 446–460. [Google Scholar] [CrossRef]
  15. Sen, S.; Nayak, N.C.; Mohanty, W.K.; Keshri, C.K. Vulnerability and risk perceptions of hydrometeorological disasters: A study of a coastal district of Odisha, India. GeoJournal 2023, 88, 711–731. [Google Scholar] [CrossRef]
  16. Nkwunonwo, U.C.; Whitworth, M.; Baily, B. A review of the current status of flood modelling for urban flood risk management in the developing countries. Sci. Afr. 2020, 7, e00269. [Google Scholar] [CrossRef]
  17. Ikirri, M.; Faik, F.; Echogdali, F.Z.; Antunes, I.M.H.R.; Abioui, M.; Abdelrahman, K.; Fnais, M.S.; Wanaim, A.; Id-Belqas, M.; Boutaleb, S.; et al. Flood Hazard Index Application in Arid Catchments: Case of the Taguenit Wadi Watershed, Lakhssas, Morocco. Land 2022, 11, 1178. [Google Scholar] [CrossRef]
  18. Müller, A.; Reiter, J.; Weiland, U. Assessment of urban vulnerability towards floods using an indicator-based approach-a case study for Santiago de Chile. Nat. Hazards Earth Syst. Sci. 2011, 11, 2107–2123. [Google Scholar] [CrossRef]
  19. Mokhtar, E.S.; Pradhan, B.; Ghazali, A.H.; Shafri, H.Z.M. Assessing flood inundation mapping through estimated discharge using GIS and HEC-RAS model. Arab. J. Geosci. 2018, 11, 2107–2123. [Google Scholar] [CrossRef]
  20. Popescu, C.; Bărbulescu, A. Floods Simulation on the Vedea River (Romania) Using Hydraulic Modeling and GIS Software: A Case Study. Water 2023, 15, 483. [Google Scholar] [CrossRef]
  21. Pinos, J.; Timbe, L.; Timbe, E. Evaluation of 1D hydraulic models for the simulation of mountain fluvial floods: A case study of the santa bárbara river in Ecuador. Water Pract. Technol. 2019, 14, 341–354. [Google Scholar] [CrossRef]
  22. Ghimire, E.; Sharma, S.; Lamichhane, N. Evaluation of one-dimensional and two-dimensional HEC-RAS models to predict flood travel time and inundation area for flood warning system. ISH J. Hydraul. Eng. 2022, 28, 110–126. [Google Scholar] [CrossRef]
  23. Imanudin, M.S.; Priatna, S.J.; Armanto, M.E.; Prayitno, M.B. Integrated Duflow-Drainmod model for planning of water management operation in tidal lowland reclamation areas. IOP Conf. Ser. Earth Environ. Sci. 2021, 871, 12035. [Google Scholar] [CrossRef]
  24. Samanta, R.K.; Bhunia, G.S.; Shit, P.K.; Pourghasemi, H.R. Flood susceptibility mapping using geospatial frequency ratio technique: A case study of Subarnarekha River Basin, India. Model. Earth Syst. Environ. 2018, 4, 395–408. [Google Scholar] [CrossRef]
  25. Ibacache, V.; Vergara, V.M. Análisis Comparativo De Áreas De Inundación Mediante Diferentes Modelos Digitales De Terreno; Universidad del Bio Bio: Concepción, Chile, 2016. [Google Scholar]
  26. Gary, W. Brunner HEC-RAS River Analysis System Hydraulic Reference Manual. Hydrol. Eng. Cent. 2016, 547. [Google Scholar]
  27. Tikul, N.; Shinawanno, S.; Yamyuean, P. PTAD: A web-based climate service for building design adaptation. Clim. Serv. 2022, 25, 100279. [Google Scholar] [CrossRef]
  28. Syarifudin, A.; Satyanaga, A.; Destania, H.R. Application of the HEC-RAS Program in the Simulation of the Streamflow Hydrograph for Air Lakitan Watershed. Water 2022, 14, 4094. [Google Scholar] [CrossRef]
  29. Dhungel, S.; Barber, M.E.; Mahler, R.L. Comparison of one-and two-dimensional flood modeling in urban environments. Int. J. Sustain. Dev. Plan. 2019, 14, 356–366. [Google Scholar] [CrossRef]
  30. Kim, J.; Cho, H. Scenario-based urban flood forecast with flood inundation map. Trop. Cyclone Res. Rev. 2019, 8, 27–34. [Google Scholar] [CrossRef]
  31. Stoleriu, C.C.; Urzica, A.; Mihu-Pintilie, A. Improving flood risk map accuracy using high-density LiDAR data and the HEC-RAS. J. Flood Risk Manag. 2019, 13, e12572. [Google Scholar]
  32. Her, Y.G.; Lusher, W.R.; Migliaccio, K.W. How Likely Is a 100-Year Rainfall Event During the Next Ten Years? Agric. Biol. Eng. Trop. REC 2018, 2018, 1–4. [Google Scholar] [CrossRef]
  33. Stucchi, L.; Bignami, D.F.; Bocchiola, D.; Del Curto, D.; Garzulino, A.; Rosso, R. Assessment of climate-driven flood risk and adaptation supporting the conservation management plan of a heritage site. the national art schools of Cuba. Climate 2021, 9, 23. [Google Scholar] [CrossRef]
  34. Alvarez González, M. Croquis Tecnológico para la Creación de Modelos Digitales de Elevación del terreno. 2014. [Google Scholar]
  35. Chen, L.; Xu, J. Optimal delaunay triangulations. J. Comput. Math. 2004, 22, 299–308. [Google Scholar]
  36. Castillo García, C.L.; Abreu Franco, D.E.; Álvarez González, M. Evaluación de distintas fórmulas empíricas para el cálculo del tiempo de concentración en la cuenca urbana del río Bélico y Cubanicay, ciudad de Santa Clara. Enfoque UTE 2021, 12, 51–64. [Google Scholar] [CrossRef]
  37. Castillo-García, C. Curvas de Intensidad-Duración-Frecuencia para la ciudad de Santa Clara, Cuba Intensity-Duration-Frequency Curves for Santa Clara. Tecnolgías Cienc. Agua 2022. [Google Scholar] [CrossRef]
  38. Castillo García, C.L.; Carvajal González, V.M. Modelación hidrológica de la cuenca urbana del río Bélico en la ciudad de Santa Clara, Cuba. Enfoque UTE 2023, 77–93. [Google Scholar] [CrossRef]
  39. Kastridis, A.; Stathis, D. Evaluation of Hydrological and Hydraulic Models Applied in Typical Mediterranean Ungauged Watersheds Using Post-Flash-Flood Measurements. Hydrology 2020, 7, 12. [Google Scholar] [CrossRef]
  40. Chow, V.; Maidment, D.; Mays, L. Hidrología Aplicada; McGraw-Hill Science/Engineering/Math: Bogotá, Colombia, 1994; ISBN 958-600-171-7. [Google Scholar]
  41. USGS. Guide for Selecting Manning’s Roughness Coefficients for Natural Channels and Flood Plains; USGS Water Supply Paper 2339; USGS: Dallas, TX, USA, 1989; Volume 2339.
  42. Dyhouse, G.; Hatchett, J.; Benn, J. Floodplain Modeling Using HEC-RAS; (U.S.), H.E.C.; Haestad Press: Waterbury, CT, USA, 2003; ISBN 0971414106. [Google Scholar]
  43. Castillo-García, C. Parametric models of rainfall temporal distribution at the Yabú meteorological station in Villa Clara province, Cuba. Tecnolgías Cienc. Agua 2022. [Google Scholar] [CrossRef]
  44. Singh, V.P.; Eng, D. Handbook of Applied Hydrology.; McGraw-Hill Education: New York, NY, USA, 2017; ISBN 9780071835091. [Google Scholar]
  45. Ibrahim, H.; Elsebaie, A.Q.K.; Alnahit, A.O. Mapping and Assessment of Flood Risk in the Wadi Al-Lith Basin, Saudi Arabia Ibrahim. Water 2023, 15, 902. [Google Scholar]
Figure 1. (a) Location of the island of Cuba with delimitation of Villa Clara region represented in red, (b) location of Villa Clara with the yellow delimitation of Santa Clara city, (c) representation of the Bélico and Cubanicay river basins within the urban area of the city of Santa Clara. Highlighted red letters represent the different segments of the rivers under study.
Water 15 01805 g001
Figure 2. Flow diagram of the methodology used in this study.
Water 15 01805 g002
Figure 3. (a) Digital Elevation Model and (b) distribution of Manning’s roughness coefficients for the Bélico and Cubanicay rivers in the urban area of Santa Clara.
Water 15 01805 g003
Figure 4. (a) Map of 1D cross sections and (b) location of bridges and control section along the entire length of the Bélico and Cubanicay rivers.
Water 15 01805 g004
Figure 5. Sections at control section 16 + 38.46 using the Beta model for 1%, 2%, and 10% probability of occurrence.
Water 15 01805 g005
Figure 6. (a) Stationary modeling of the Sagua road bridge for 1%, 2%, and 10% probability of occurrence and (b) actual picture of Sagua road bridge.
Water 15 01805 g006
Figure 7. Longitudinal profiles of the river sections in (a,c) T1 and T2 in the Cubanicay, and (b) T1 in the Bélico river for 1%, 2%, and 10% probability of occurrence.
Water 15 01805 g007
Figure 8. (a) Water footprint observed in the field after the occurrence of a severe hydrometeorological storm, 25–26 May 2020 [11], and (b) photograph of the damage to structures near the Cubanicay riverbed.
Water 15 01805 g008
Figure 9. (a) Depth map, (b) channel velocity, and (c) stream power of the Bélico and Cubanicay rivers using the Beta model for a probability of 1%.
Water 15 01805 g009
Figure 10. Representation of flood limits for design probabilities: (a) all study area, (b) T2 Cubanicay river downstream before control section 16 + 38.46, (c) second and third tributary bridge on the left, control section 27 + 14 (d) first tributary bridge on the left, and (e) affected houses near the Sagua road bridge, control section 2 + 87.
Water 15 01805 g010aWater 15 01805 g010b
Table 1. Simulation results from the Beta model at different control sections.
Beta
RiverSectionControl SectionScenarioTotal FlowDepthTotal SpeedEnergy
%(m3/s)(m)(m/s)(m)
BélicoT127 + 14185.693.091.20110.50
T127 + 14274.322.811.17110.22
T127 + 141052.602.201.16109.61
CubanicayT12 + 87184.233.741.65110.33
T12 + 87271.981.272.16111.10
T12 + 871049.981.802.36109.38
T216 + 38.46 1170.043.711.51105.90
T216 + 38.46 2146.483.551.42105.72
T216 + 38.46 10101.962.621.88104.94
Disclaimer/Publisher’s Note: The statements, opinions and data contained in all publications are solely those of the individual author(s) and contributor(s) and not of MDPI and/or the editor(s). MDPI and/or the editor(s) disclaim responsibility for any injury to people or property resulting from any ideas, methods, instructions or products referred to in the content.

