

Effect of Tide Level Change on Typhoon Waves in the Taiwan Strait and Its Adjacent Waters

College of Civil Engineering, Fuzhou University, Fuzhou 380108, China
*
Author to whom correspondence should be addressed.
Water 2023, 15(10), 1807; https://doi.org/10.3390/w15101807
Submission received: 2 April 2023
/
Revised: 27 April 2023
/
Accepted: 6 May 2023
/
Published: 9 May 2023
(This article belongs to the Topic Hydro-Meteorological Hazards: Forecasting, Assessment and Risk Management)
Abstract
:In recent years, most research on typhoons in the Taiwan Strait and its adjacent waters has focused on simulating typhoon waves under the influence of wind fields. In order to study the influence of tidal level changes on typhoon waves, a numerical model was established in the Taiwan Strait based on the third-generation ocean wave model SWAN. The simulation results of the tide level during the corresponding typhoon landing time were incorporated into the model to optimize its performance. Subsequently, the wave height of the typhoon landing at the lowest tide level was compared with that at the highest tide level. This comparison serves as a reference and warning for ocean engineering, highlighting the hazards of the typhoon landing at high tide. The simulation results were verified and analyzed using the measured data of significant wave heights and wind speeds when typhoons Mekkhala (2006) and Maria (0607) approached. The results show that after optimization, the relative error of the significant wave peak is reduced. Furthermore, there has been a decrease in the maximum wind speed, bringing it closer to the measured value. These improvements signify enhanced model accuracy. The tide level has a great influence on the typhoon wave, and the tide level height at the time of the typhoon landing is positively correlated with the significant wave height of the waves generated by the typhoon. When the typhoon’s landing time coincides with the high tide level, the resulting waves are significantly higher, reaching up to 0.71 m. This has a substantial impact on the safety of marine structures, particularly breakwaters.
1. Introduction
The Taiwan Strait is a sea area that is frequently affected by typhoons. When a typhoon hits, the resulting waves can cause significant damage to offshore structures in coastal areas. Therefore, studying typhoon waves in the Taiwan Strait is crucial for early warning and forecasting of such waves. This has important practical significance for disaster prevention and mitigation. Additionally, this provides useful references for coastal engineering design.
In typhoon wave simulation, researchers have used various models and analyzed different parameters. For example, Ying et al. [1] used the SWAN model to construct a numerical wave model in the East China Sea. Their study focused on analyzing various factors that influence wave behavior, including friction parameterization, wave breaking, wind energy input, whitecap dissipation, and wave–wave nonlinear interaction. Kim and Lee [2] developed a typhoon wave forecasting system that used two different models (SWAN and WAVEWATCH III) to provide accurate parameters. Zhou et al. [3] found that the size of typhoon waves is not only influenced by the intensity of the typhoon but also by the sea area. Meanwhile, Chen and Li [4] used the SWAN model to simulate and analyze the passage of typhoons through different sides of the Taiwan Strait. Their study aimed to explore the alterations in wind speed, wave field, and energy spectrum that occur under different typhoon paths.
Several scholars have attempted to optimize mathematical models for typhoons. Liu et al. [5] established a Taiwan coastal tide–wave coupling model to simulate storm surges during typhoons. Their study revealed that wind stress intensity and atmospheric pressure play a key role in affecting coastal water levels and controlling swell height. Wu et al. [6] established an air–sea coupling model in the South China Sea based on the WRF mesoscale atmospheric model and the ROMS regional ocean model. Their simulation results showed high accuracy in predicting storm surge under the influence of Typhoon Kide. Wang et al. [7] obtained the drag coefficient of Pingtan Island from nine typhoon processes and used weather research and forecast models to simulate the typhoon wave field, exploring the influence of the drag coefficient. Pei et al. [8] improved the Kepert analytical model by introducing a turbulent diffusion coefficient model that varies along the height and a drag coefficient model affected by velocity. Their study focused on the quantitative analysis of different models, aiming to simulate the wind field characteristics of typhoons. Yang et al. [9] coupled land cover and terrain into a parametric typhoon wind field model in the mesoscale meteorological model WRF. Yin et al. [10] also used the WRF model and the Delft3D flow model to simulate typhoons. Their findings revealed that the type of land cover can affect the simulation results of wind fields caused by typhoons. This leads to changes in the simulation results of storm surges. Dong et al. [11] used a multi-scale wind field numerical simulation method. They observed that after typhoons make landfall, they are influenced by complex coastal terrain, resulting in a high-frequency intensity of turbulence and an increase in wind speed. Yang et al. [12] analyzed the measurement data of two stations in the coastal waters of northeastern Zhoushan Island. Their findings showed that underwater topography plays a major role in wave direction change, and typhoons with different paths have obvious effects on the spectral patterns of the two stations.
In recent years, most research on typhoons in the Taiwan Strait and its adjacent waters has focused on typhoon wave simulation under the influence of the wind field. However, the tide level is a non-negligible factor that also affects the characteristics of the wave. For instance, when a typhoon hits during high tide, it generates higher waves. Therefore, many scholars have studied the combination of tide and typhoon forecasts. By establishing a fully coupled circulation wave model, Hsiao et al. [13] found that the influence of wave–tidal interaction on the total water level is relatively small. Additionally, they observed that there is a significant difference between tide–surge interaction with and without wave effect. It is concluded that considering the wave setting when predicting the storm surge produced by the typhoon can avoid miscalculation of the storm surge. Ding et al. [14] established a two-dimensional tidal-level mathematical model along the coast of Zhejiang based on the MIKE21 hydrodynamic calculation module. Taking Typhoon Fit (1323) as an example, the process of storm surge caused by strong wind and the process of typhoon water increase were simulated. Duan et al. [15] developed an improved analysis method for sea level change based on a stochastic dynamic prediction model. Their approach took into account the periodicity, trend, and randomness of tide levels in a long time series. By considering these factors comprehensively, their method provided more accurate predictions compared to previous single-analysis methods. Liu et al. [16] compared the actual storm surge with the simulated results and pointed out that the actual storm surge was significantly stronger than the simulated results. They also noted that the typhoon intensity and model wind field calculation results from the Central Meteorological Observatory were significantly weaker than the actual conditions. Zheng and Chen [17] used the Regional Ocean Modeling System (ROMS) with a spatial resolution of 2 km to understand the cooling response associated with multiple typhoons in the Northeastern Sea of Taiwan. The results show that, after integrating the tidal forcing, the cold wake after the typhoon channel simulated by the model is basically enhanced. Zhang et al. [18] used the FVCOM model to conduct a numerical study on the storm surge behavior caused by typhoon “Mangosteen” in the Pearl River Estuary and its surrounding areas. The results show that the impact of landfall timing is dominated by tide–tide interactions. Taking typhoon “Chanhong“ as an example, Li et al. [19] used a validated numerical model to study the characteristics and dynamics of storm surges. The model results show that during the typhoon process, the total water level of Haizhu Island is dominated by tides, and the storm surge is closely related to the wind field. Surface currents are primarily influenced by wind, followed by tides. Based on the numerical simulation method, Tang et al. [20] constructed a detailed hydrodynamic model of the Shantou Sea area in Guangdong, China, and verified the accuracy of the model by using the measured tide height and tidal current. According to the simulation results, the tidal elevation and tidal current in the study area are analyzed. Chen et al. [21] use the semi-implicit Euler–Lagrangian finite element model coupled with wind wave model II (selfe-wm-II) based on unstructured grids to simulate the fully coupled simulation system of tidal and wave interactions. The results show that wind waves should not be ignored when simulating typhoon-induced storm surges, especially in areas with steep submarine slopes. Additionally, storm surge simulations require accurate tidal and meteorological forces. Chen et al. [22] developed a numerical model of storm surge and applied it to the coast of Taiwan and adjacent waters. This two-dimensional model has a fine horizontal resolution and considers the interaction of storm surges and astronomical tides, which is suitable for describing the complex physical properties of storm surges along the coast of Taiwan. The results show reasonable agreement between model simulations and observed data. Tu et al. [23] carried out a numerical simulation of global ocean tide waves based on the semi-implicit trans-scale ocean model of unstructured grids. The measured data are consistent with the simulation results, but there is room for improvement in accuracy. Wu et al. [24] proposed a modularized tide level prediction model consisting of astronomical tidal data affected by astronomical tidal forces and non-astronomical tidal data affected by various environmental factors. They emphasized the significant impact of meteorological factors on tides, indicating that these factors play a crucial role in the variability of tide levels.
The research content of this paper aims to establish a numerical model of the Taiwan Strait and its surrounding waters using the third-generation numerical model SWAN, which is coupled with the tide level at the corresponding moment. The simulation results will be compared with measured data to verify the accuracy of the typhoon wind field simulation. Additionally, this paper will analyze the optimization effect after incorporating the tide level into the model and discuss the influence of the tide level on typhoons.
2. Numerical Model Description
2.1. Wind Model
The CCMP (Cross Calibrated Multi-Platform) sea surface wind field is the global surface wind field assimilation data launched by NASA in 2009. It adopts the enhanced variational assimilation analysis method and combines the sea surface wind field data collected on many ocean passive microwave and scatterometer remote sensing platforms. The CCMP wind field, with high precision and high spatial and temporal resolution, can meet the needs of oceanic and atmospheric research [25]. In this paper, this wind field is selected as the background wind field in the driven wind field of the SWAN model [25,26]. The third-generation wave model SWAN constructs a mathematical wave model by using the dynamic spectrum balance equation based on the principle of energy conservation and the theory of linear random surface gravity waves. This model was first developed by Delft University in the Netherlands. After years of version iterations, it has become a numerical model commonly used in the world to simulate wind waves, swell waves, and mixed waves. The data used in this study are sourced from ESE (NASA Earth Science Enterprise), offering a temporal resolution of 6 h and a spatial resolution of 0.25° × 0.25°. The dataset spans from July 1927 to December 2020, covering a spatial range is 78.375° S to 78.375° N and a longitude range from 180° W to 180° E.
The wind field calculation grid adopts a rectangular distribution, and the grid points are arranged as 131 × 131. The grid spatial resolution is 6′ × 6′, and it is distributed in the area of 17.625° N~30.625° N, 115.625° E~128.625° E. In the process of setting the SWAN model, white wave dissipation, wave breaking, bottom friction, nonlinear interactions, and other physical processes are considered. Every calculation takes 6 h.
2.2. Wave Model
In the SWAN model, the random wave is represented by a two-dimensional dynamic spectral density, denoted as N(σ,θ) = E(σ,θ)/σ, where N(σ,θ) is the dynamic spectral density and E(σ,θ) is the energy spectral density. In the spherical coordinate system, the energy balance equation can be expressed as:
The first term on the left side of the equation represents the rate of change of the action density over time; the second and third terms represent the propagation of the action density over geometric space; and the fourth term represents the frequency shift due to flow and changing water depth. The fifth term represents the effect of refraction and shallowing due to flow and changing water depth. S on the right side of the equation represents the energy source-sink term, including the wind energy input term, white-hat dissipation, bottom friction, dissipation due to shallowing, three-wave interaction, and four-wave interaction.
The numerical method of the SWAN model uses a fully implicit finite difference scheme to discretize the governing equations. In the action balance equation, the headwind scheme determines the state of each scheme. The SWAN model adopts a fully implicit finite difference scheme, which allows for calculations with larger time steps compared to explicit schemes used in shallow water modeling. This implicit scheme enhances the accuracy of the calculations [1].
2.3. Tide Model
Tides are divided into two aspects: tide level and current. Tides are difficult to combine with waves due to their dynamic and directional characteristics. In comparison, the tide level can be better integrated with the wave simulation. Therefore, this paper simulates typhoon waves by adding tidal levels to the SWAN model.
The governing equations of the numerical simulation of power flow include a continuity equation and two momentum equations. The basic equations are:
where ς is the tidal level; p and q are the single-width flows in the x and y directions, respectively; h is the water depth; Ω is the Coriolis force parameter; pw is the water pressure; C is the Chezy coefficient; Pa is the standard atmospheric pressure; f is the wind friction coefficient; V, Vx, and Vy are the components of wind speed in the x and y directions, respectively; E is the eddy viscosity coefficient.
The initial conditions are ; ; .
3. Study Objects and Areas
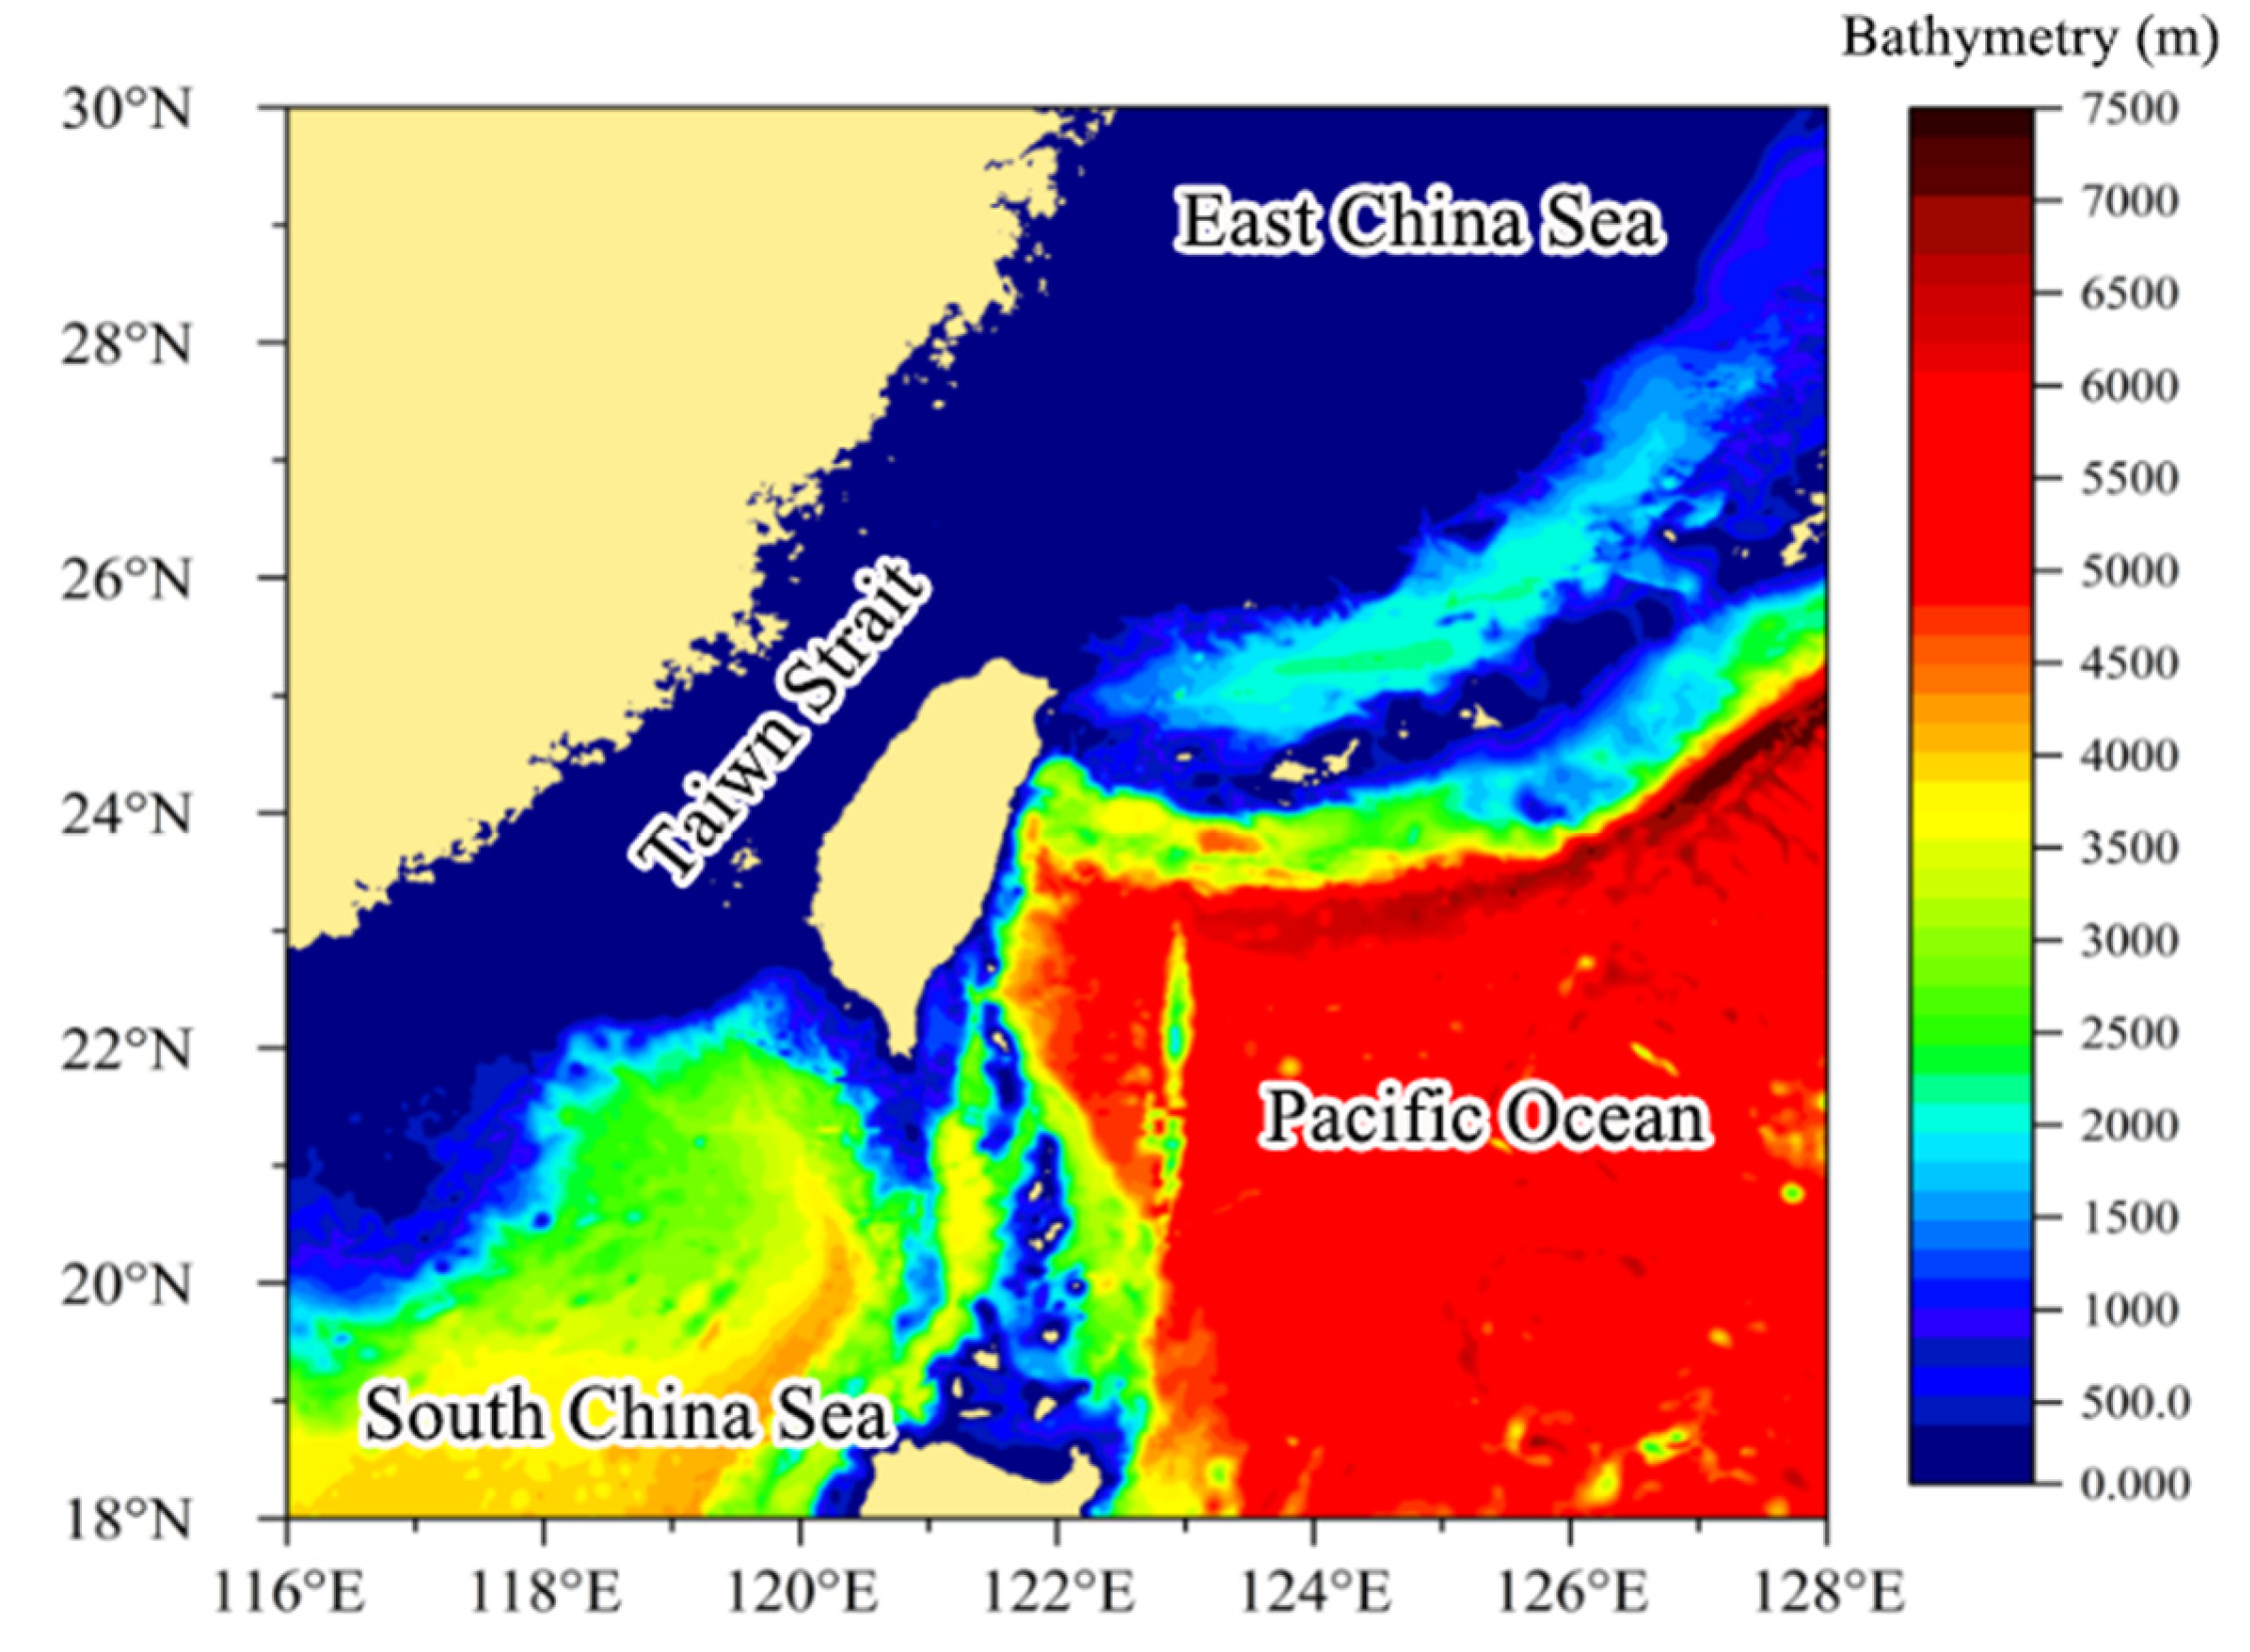
The bathymetric data used in this model are sourced from ETOPO1 of NOAA (the National Oceanic and Atmospheric Administration of the United States). The data interpolation method is used to process the topographic bathymetry data. This calculation scale ranges from 18° N to 30° N, 116° E to 128° E, and its spatial resolution is 1′ × 1′. The distribution of water depth is shown in Figure 1. It can be seen from the figure that the seabed topography gradually increases from the inner sea to the outer sea. Additionally, it shows that the seabed water depth increases with the increase in longitude and latitude. The maximum water depth in the study area is about 7500 m, and the water depth in the Taiwan Strait is below 100 m.
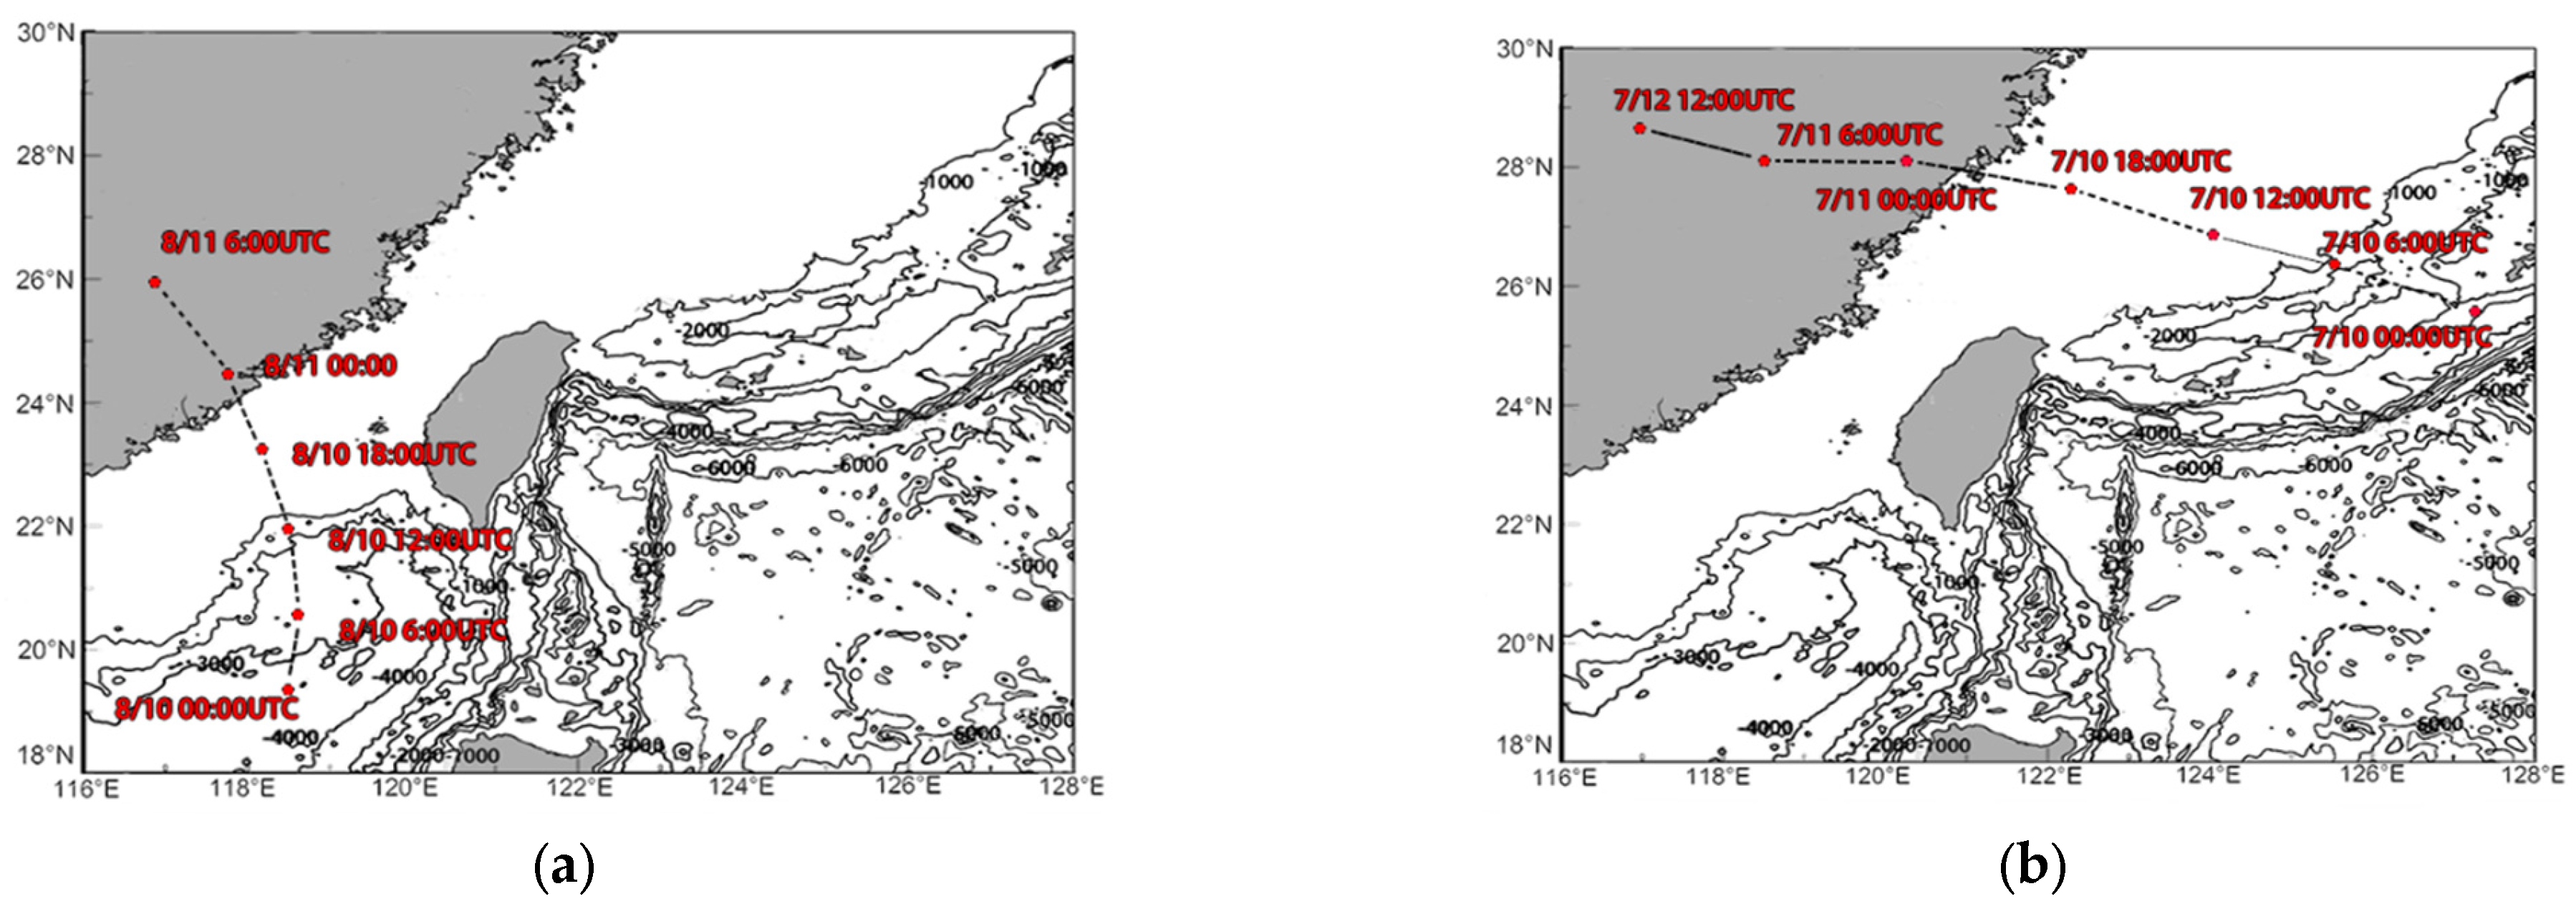
Typhoon Mekkhala (whose path is shown in Figure 2a) was named in the northeastern part of the South China Sea at T05:00 on 10 August 2020. At this time, the typhoon center was located at 118.5° E and 19.6° N. The central pressure reached 998 hPa, and the central wind speed reached 18 m/s. Subsequently, the typhoon continued its northward trajectory, gradually intensifying in strength until it reached its maximum intensity upon making landfall along the coast of Fujian Province, China. The maximum wind speed reached level 12 (33 m/s), and the central pressure reached 980 hPa. After the landfall, Typhoon Mekkhala shifted to a certain extent and moved to the north. The intensity gradually weakened and finally almost dissipated at 11:00 on 11 August 2020.
Typhoon Maria (Figure 2b) made landfall in Lianjiang County, Fujian Province, China, at 01:00 on 11 July 2018. It was at the time of the astronomical spring tide. The high tide level affected the waves generated by the typhoon. Afterward, the intensity and scale of the typhoon gradually decreased, and the direction changed to the northwest. It continued to move at a speed of 29 km/h and finally dissipated in Jiangxi Province, China. Considering that Typhoon Maria made landfall during the astronomical spring tide, this study specifically focuses on Typhoon Maria as a representative case of a typhoon affected by high tide levels. To investigate the impact of tide levels on waves, this study further examines the scenario where the typhoon’s landing time coincides with the low tide level. By translating the tide levels accordingly, the study aims to explore how the convergence of high tide and low tide at the time of typhoon landing influences wave behavior.
Figure 2 shows the movement path maps of the two typhoons. The thick solid line represents the coastline, and the thin solid line represents the water depth contour.
The calculation scale of the tide level model in this paper is 18° N~30° N and 116° E~128° E. The tide level model adopts a triangular mesh, which has 17,564 nodes and 3111 elements. The calculation time (UTC) for simulation verification is from 0:00 on 10 August 2020 to 23:00 on 12 August 2020. The model calculation takes 30 min as a time step, and the output frequency of the calculation results is 1 result per hour.
4. Model Setup and Validation
4.1. Model Setup
4.1.1. Initial and Boundary Conditions
The SWAN model has land and water boundaries. According to its nature, the land boundary is further subdivided into three types: complete absorption, partial absorption, and total reflection. The expression is as follows:
where is the reflection coefficient. The total reflection value is 1, total absorption is 0, and partial reflection ranges from 0 to 1. The “water boundary” mainly refers to the area where the incident wave is. The boundary condition expression in SWAN is as follows:
where , , , and . and , , , , where and represent the incident wave potential and the reflected wave potential, respectively. is the wave number on the open boundary.
4.1.2. Computational Time Step
In this paper, the wind field model is adopted at a scale of 18° N~30° N and 116° E~128° E, with a grid point arrangement of 145 × 145 and a spatial resolution of 5′ × 5′. Here, the mesh is used to calculate the waves generated by the wind, while another one in Section 2.1 is for the wind. Moreover, a two-dimensional time-varying spherical coordinate system model is used. Its frequency range is 0.04 to 1.00 Hz, and the direction is divided into 24 segments with a resolution of 15°. The time step of the model calculation is 15 min, delivering outcomes once per hour.
4.1.3. Tide Level Operation
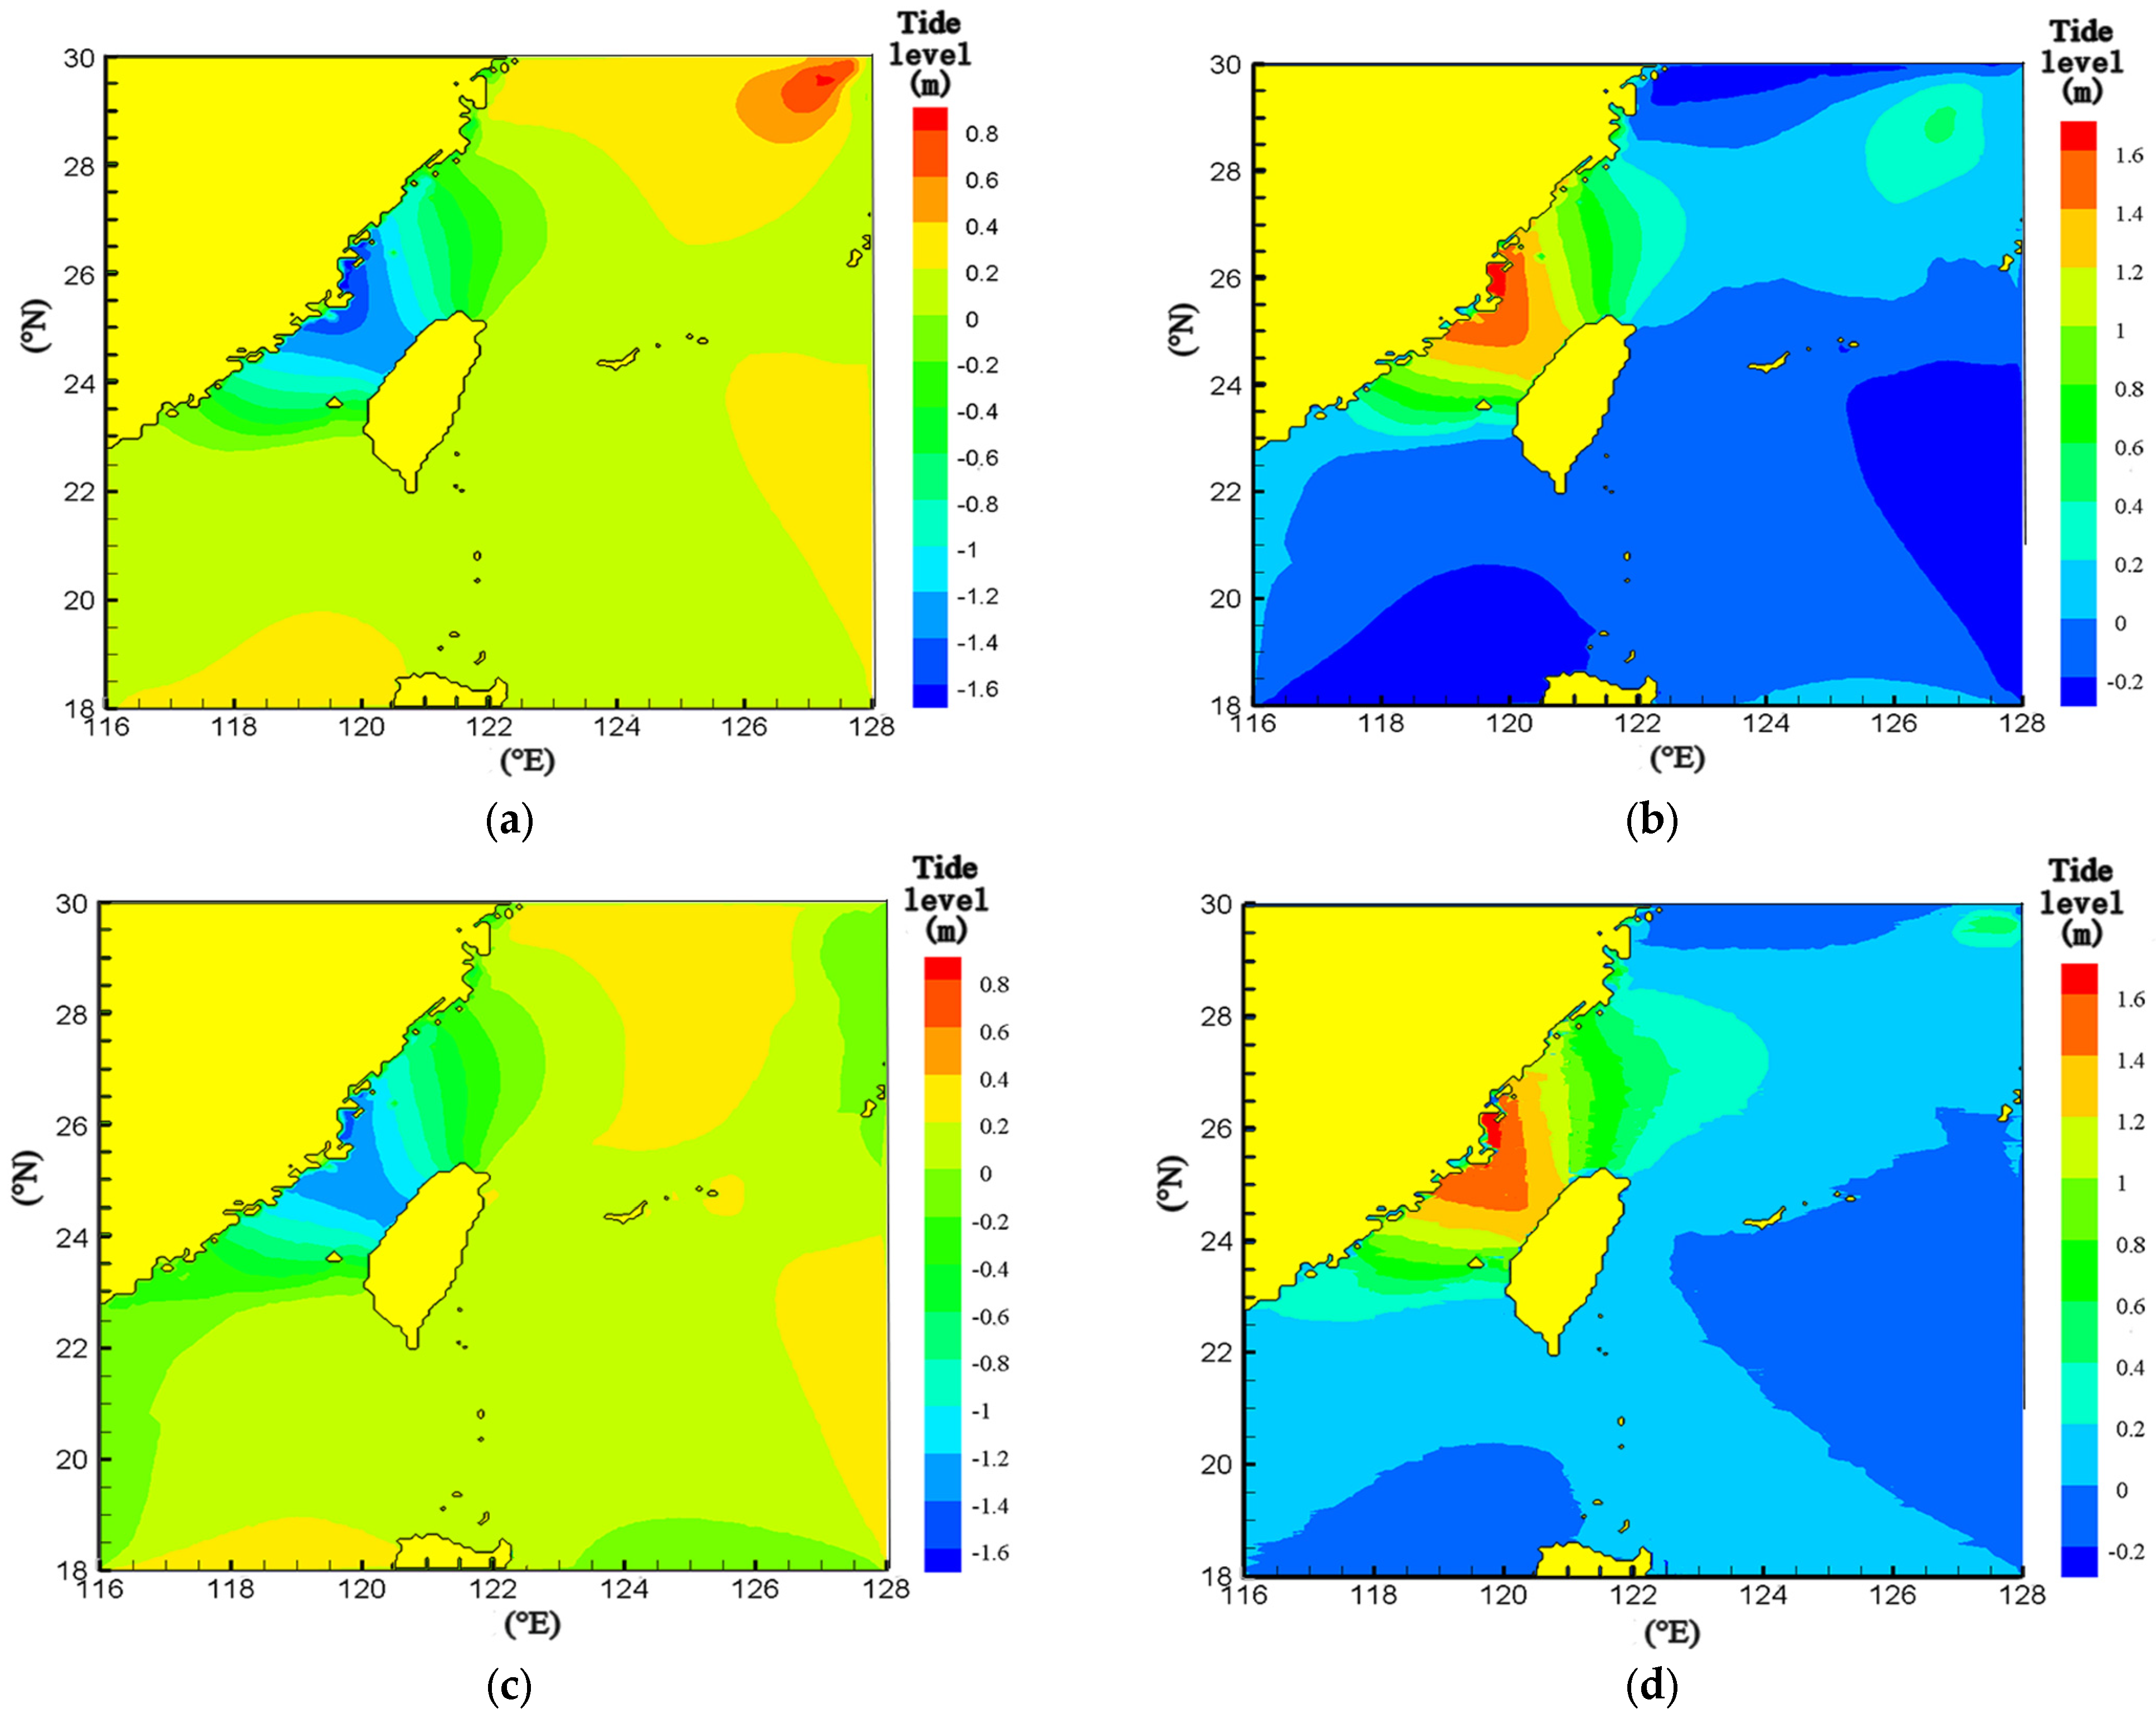
By simulating the tide level at each calculation time during the Typhoon Mekkhala process, the tide level simulation results of the calculation area within the calculation time can be obtained. Figure 3 shows the simulation results of the tide level in the calculation area spanning from 10 August 2020 to 11 August 2020. During this period, the tide level in the Taiwan Strait reached its lowest tide at 00:00 UTC on 10 August 2020. Six hours later, it reached its highest tide, followed by a cyclic pattern of reaching the highest tide every twelve hours. The simulated results are consistent with the semi-diurnal tide pattern near the Taiwan Strait.
4.2. Model Validation
4.2.1. Wind Speed Validation
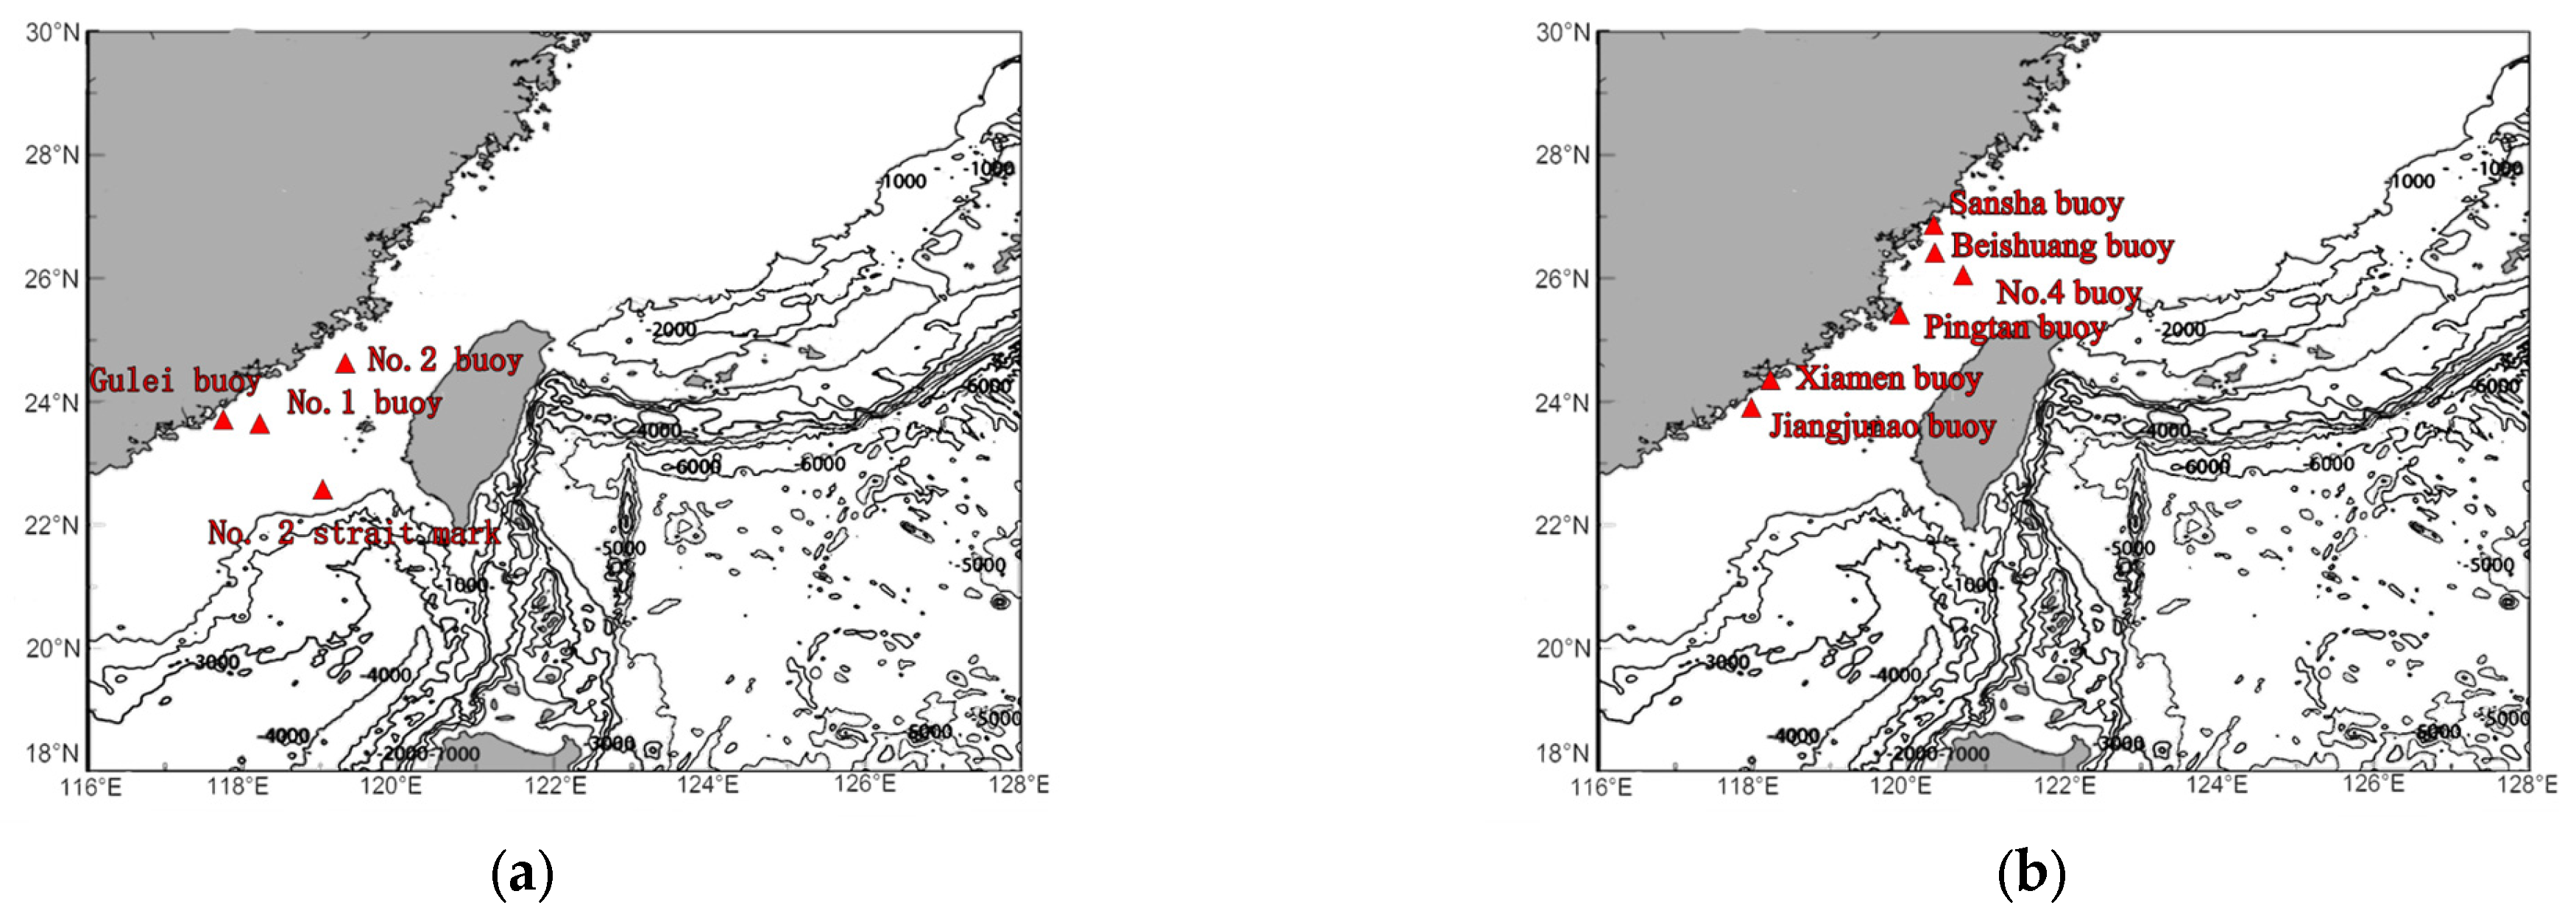
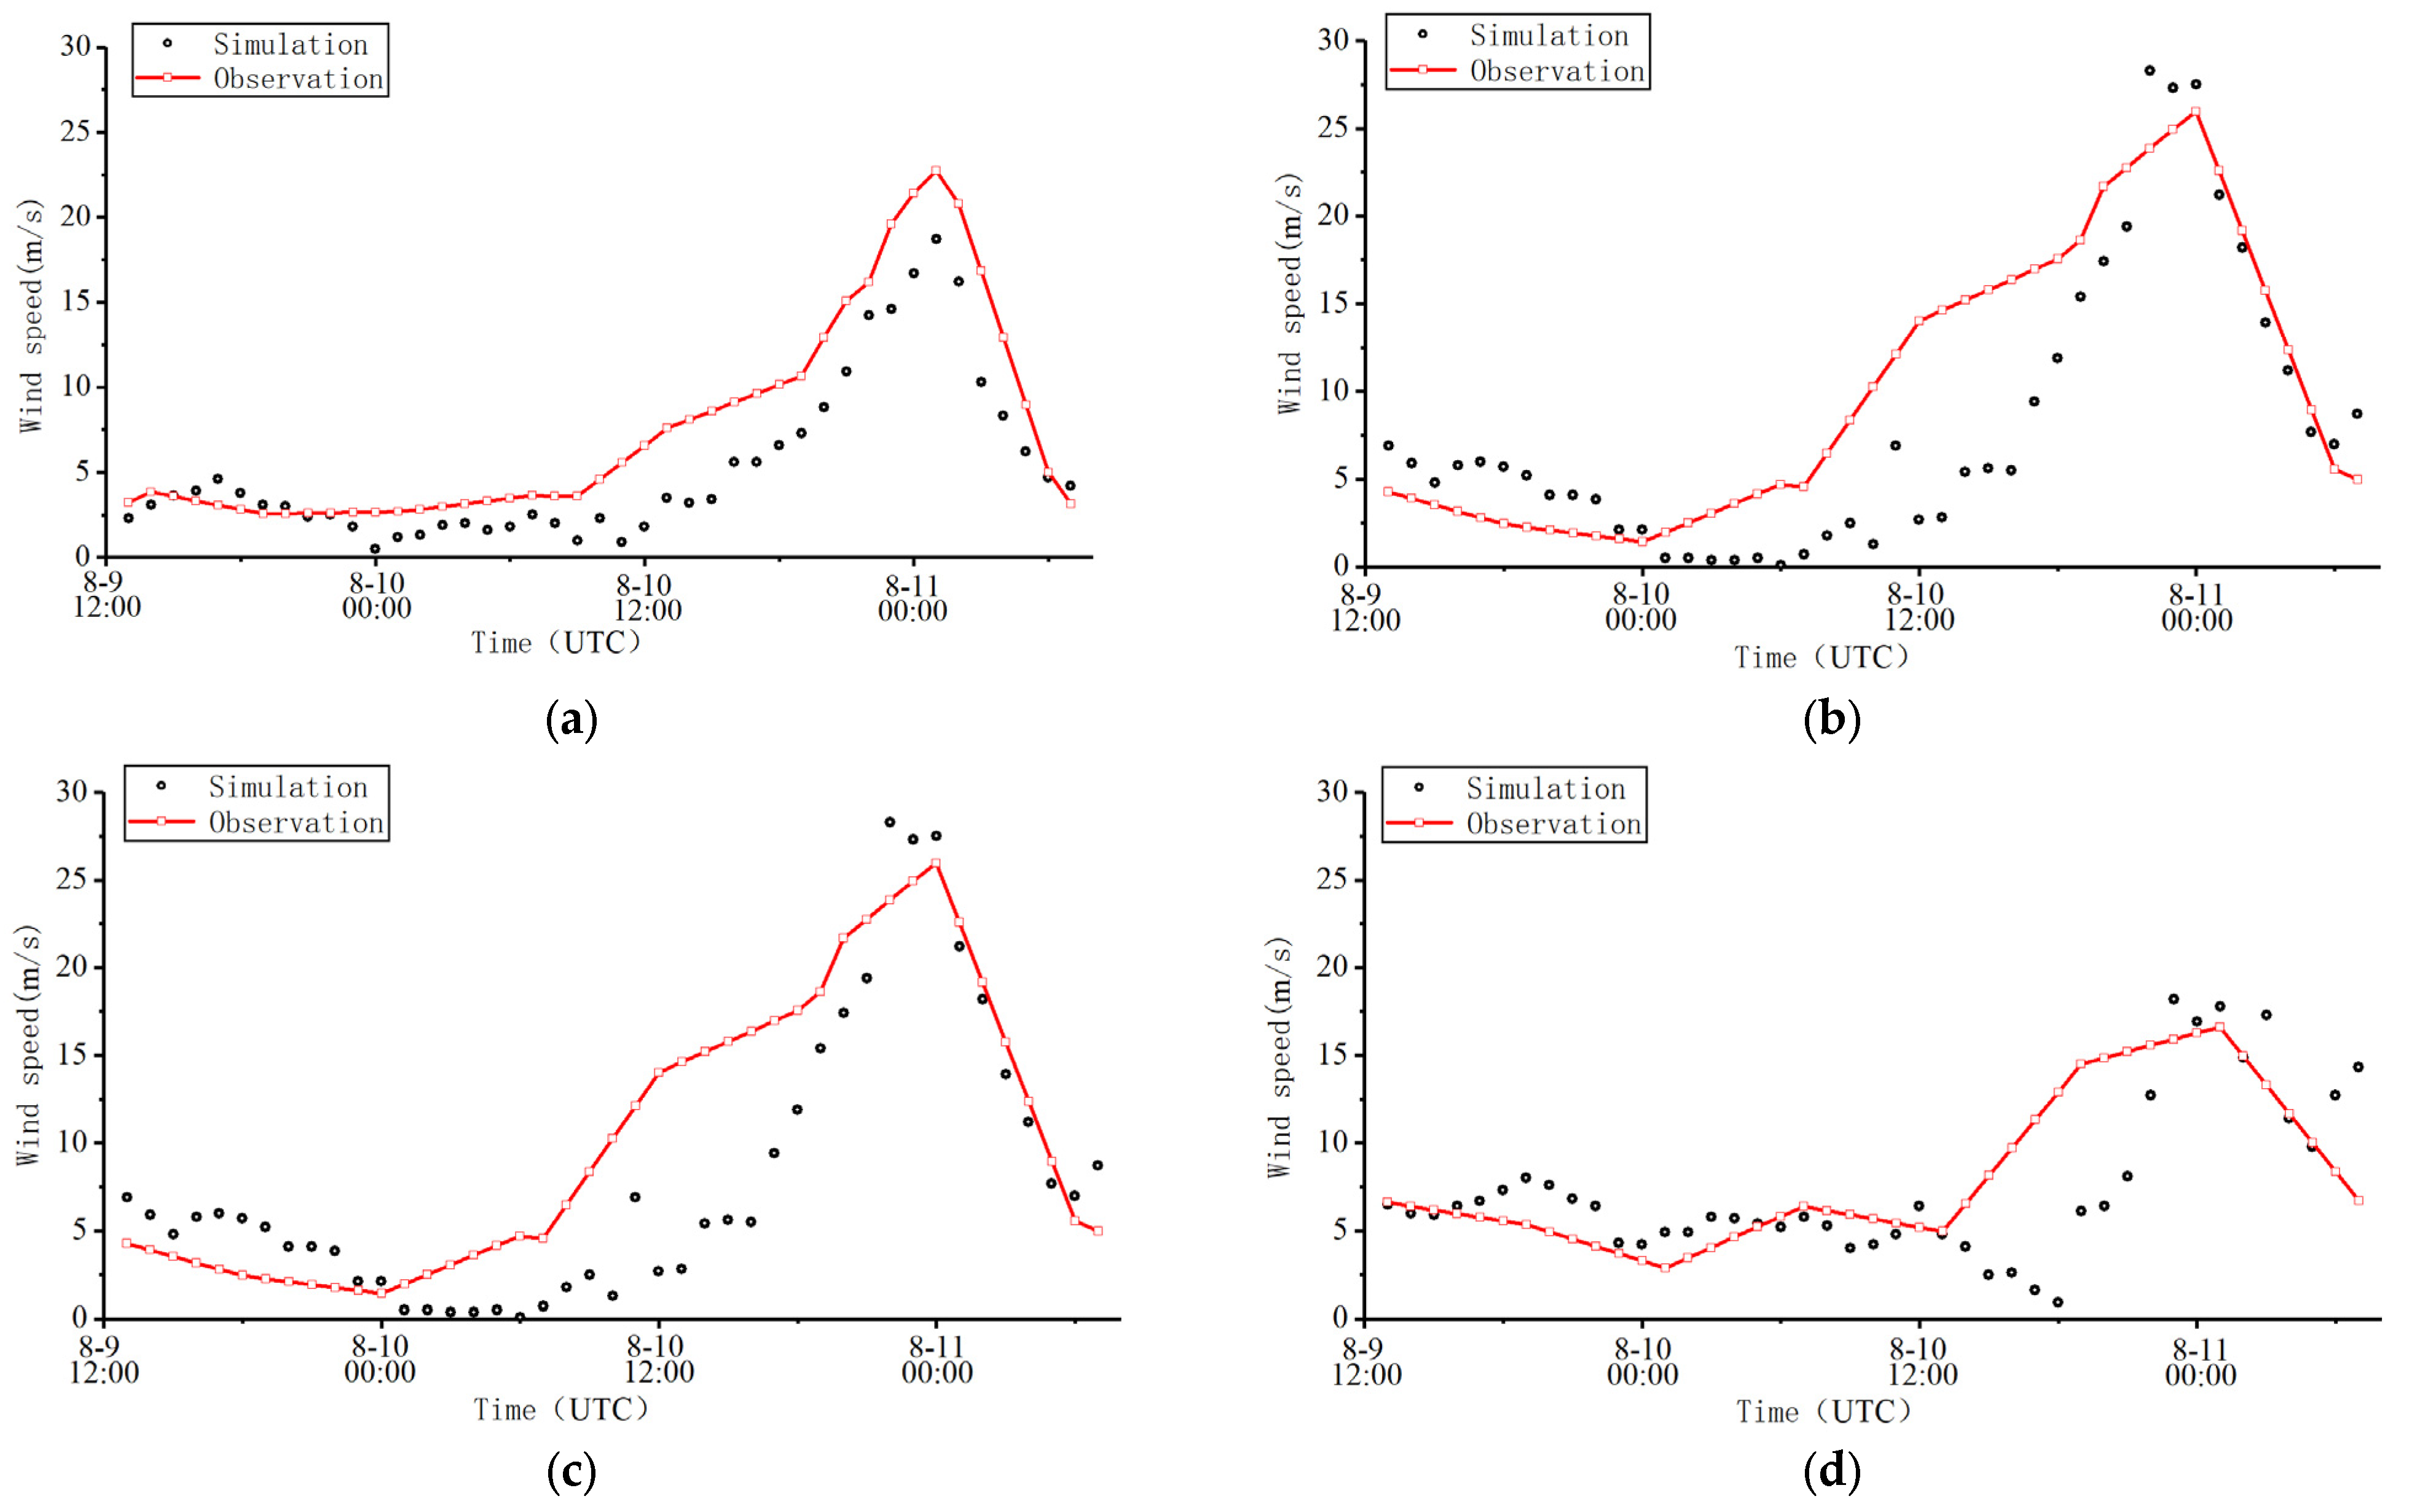
The simulated wind speeds were compared with the measured data from verification points No. 1, No. 2, Taiwan Strait, and Gulei buoys. The location of each verification point is shown in Figure 4a.
Figure 5 shows a comparison between the simulated and measured wind speeds at each verification point. The figure reveals that although there are some errors in the simulation results at each moment, the overall trend remains consistent. This consistency indicates the high accuracy of the numerical model and highlights its potential for further study and analysis of the results.
4.2.2. Tide Level Validation
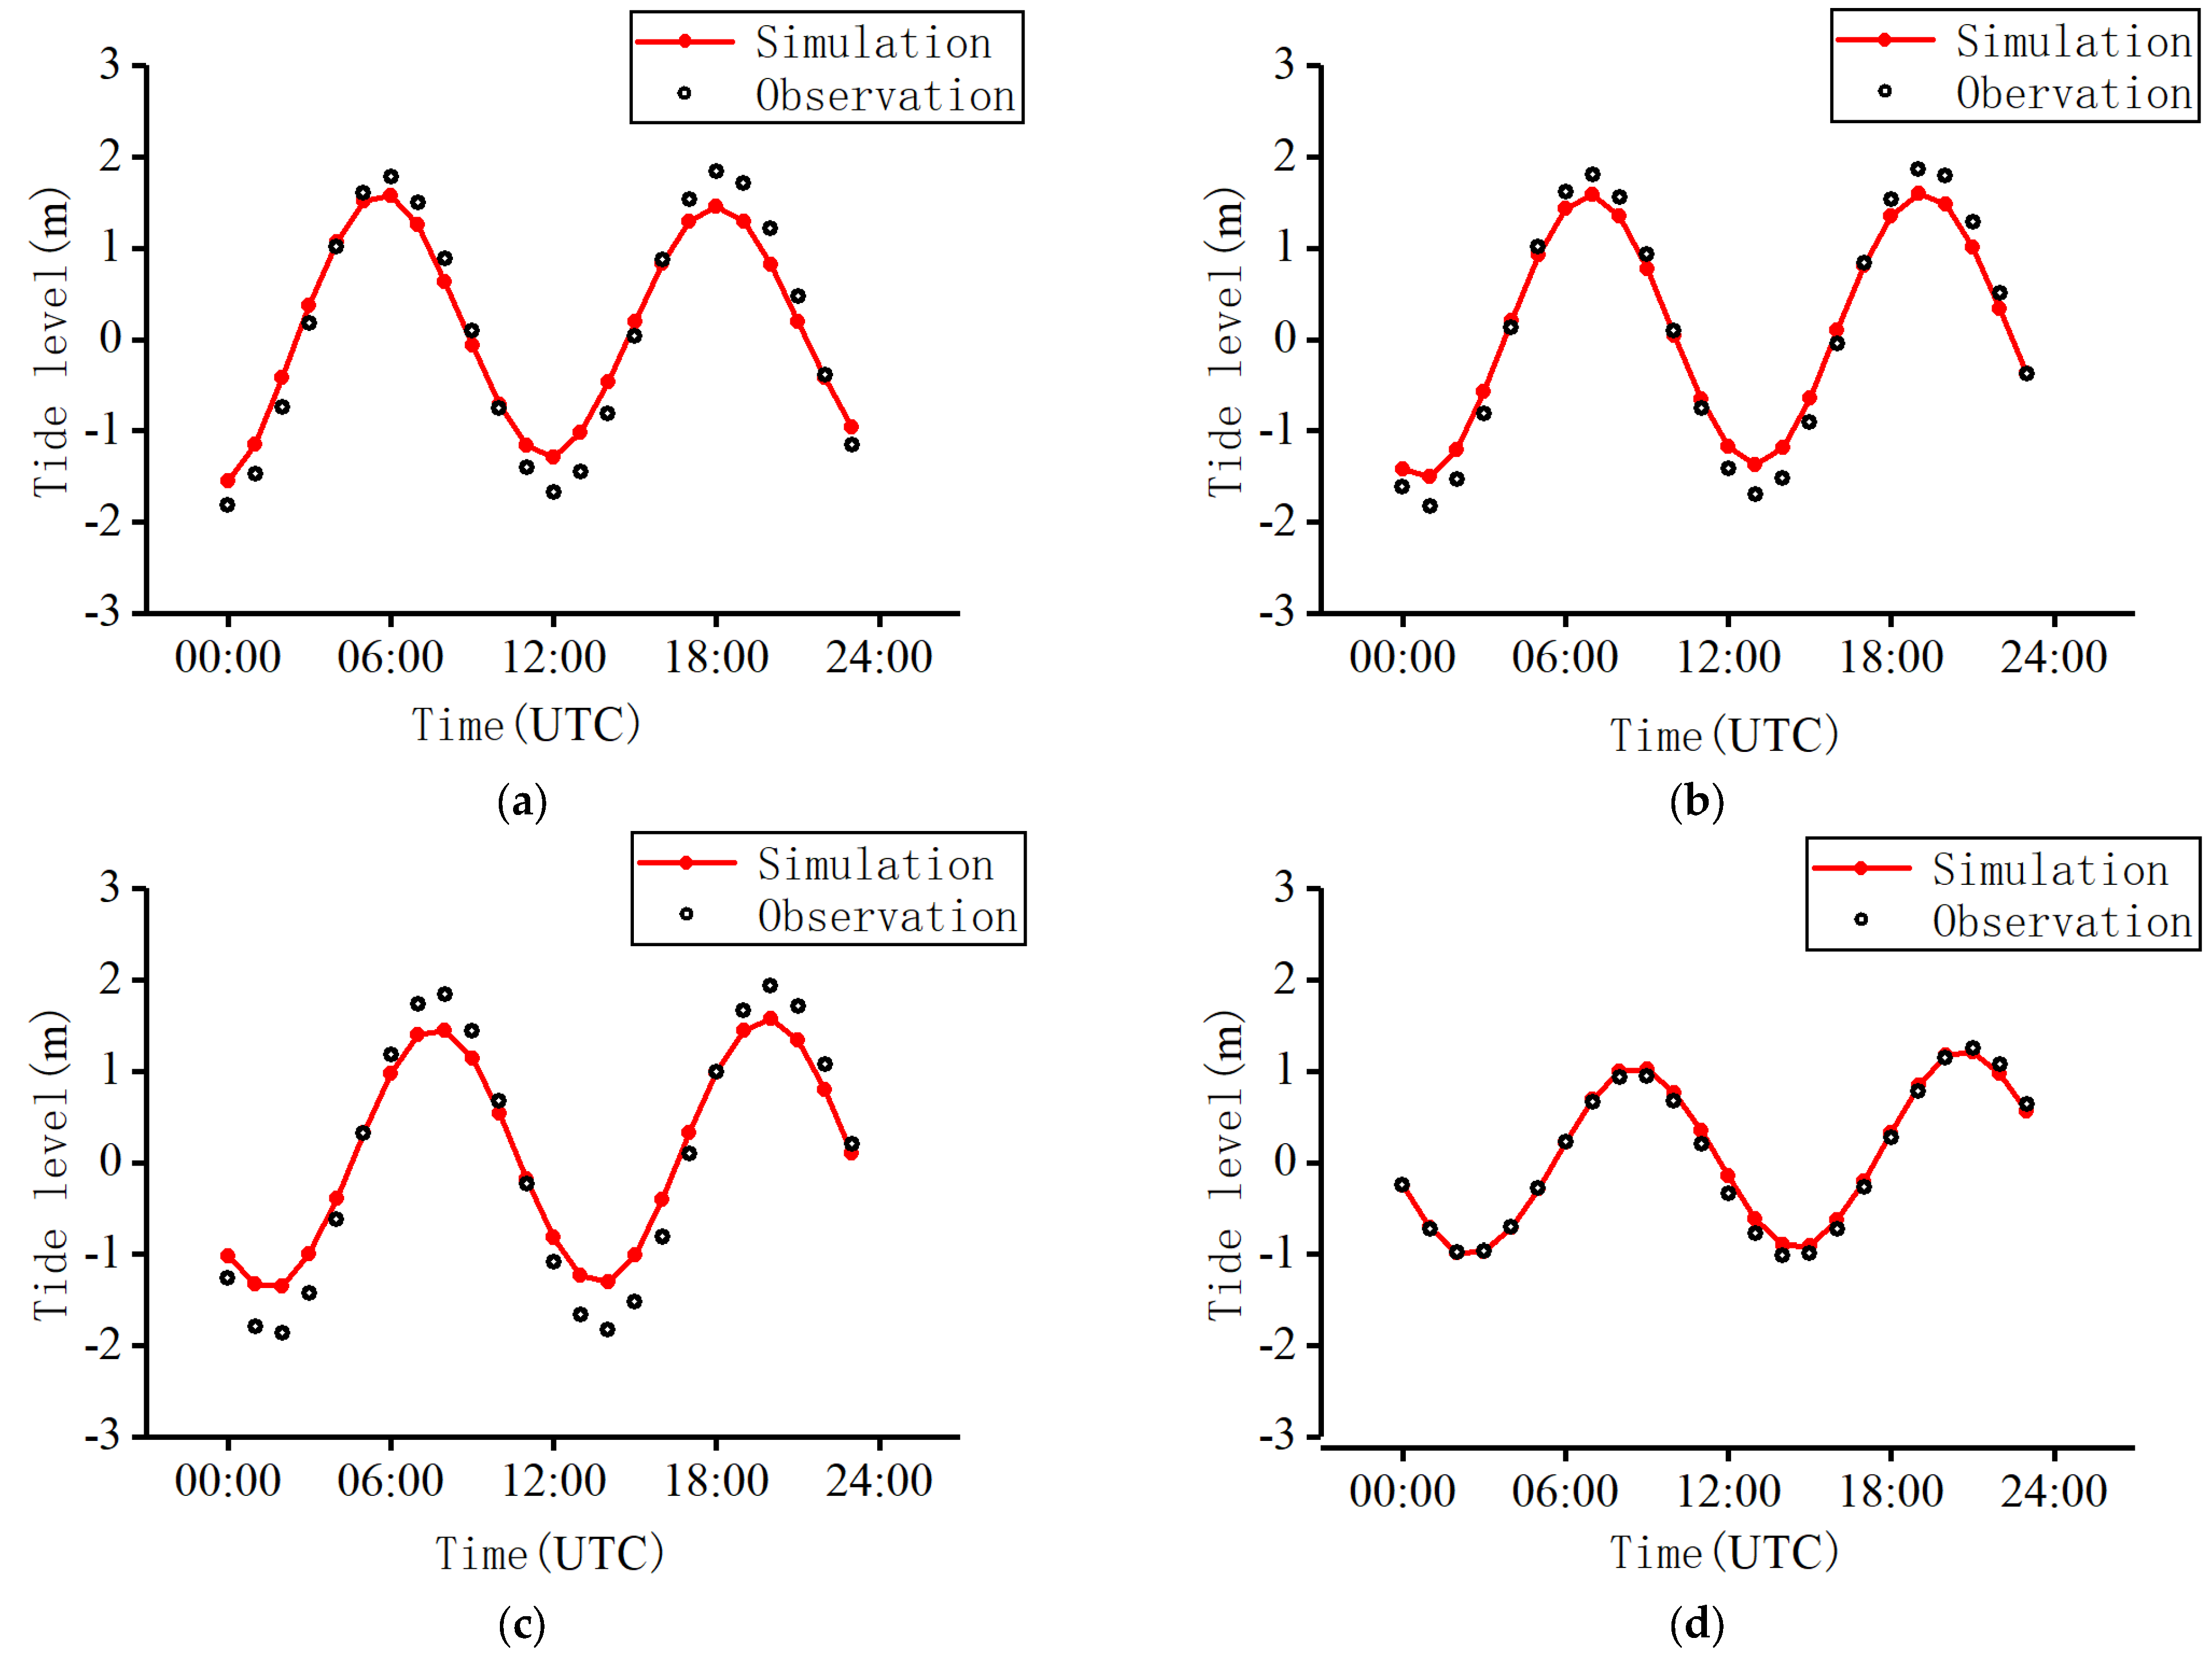
In this paper, four typical tide-level buoys were used to verify the simulation of Typhoon Mekkhala, namely the Sansha, Pingtan, Xiamen, and Jiangjunao buoys. Meanwhile, the simulation of the tide level was verified for Typhoon Maria using the Beishuang buoy and No. 4 buoy. The distribution map of each tide level station is shown in Figure 4b.
Figure 6 shows that both simulated and measured values change periodically with time, which is in line with the semidiurnal tide near the Taiwan Strait. The relative error of the highest tide level at the Sansha buoy is 6%, and the relative error of the lowest tide level is 14%. On the Pingtan tidal buoy, both errors were 16%. At the Xiamen tide level buoy, the relative error of the highest tide level is 18%, and the relative error of the lowest tide level is 27%. This is due to the topographic accuracy, which leads to a large tidal error in the study area. At the Jiangjunao buoy, the errors are 2% and 9%, respectively. The measured tide level at the highest tide level at all verification points is consistent with the simulated time phase, so it can be determined that the model can better simulate the tidal conditions.
4.2.3. Significant Wave Height Validation
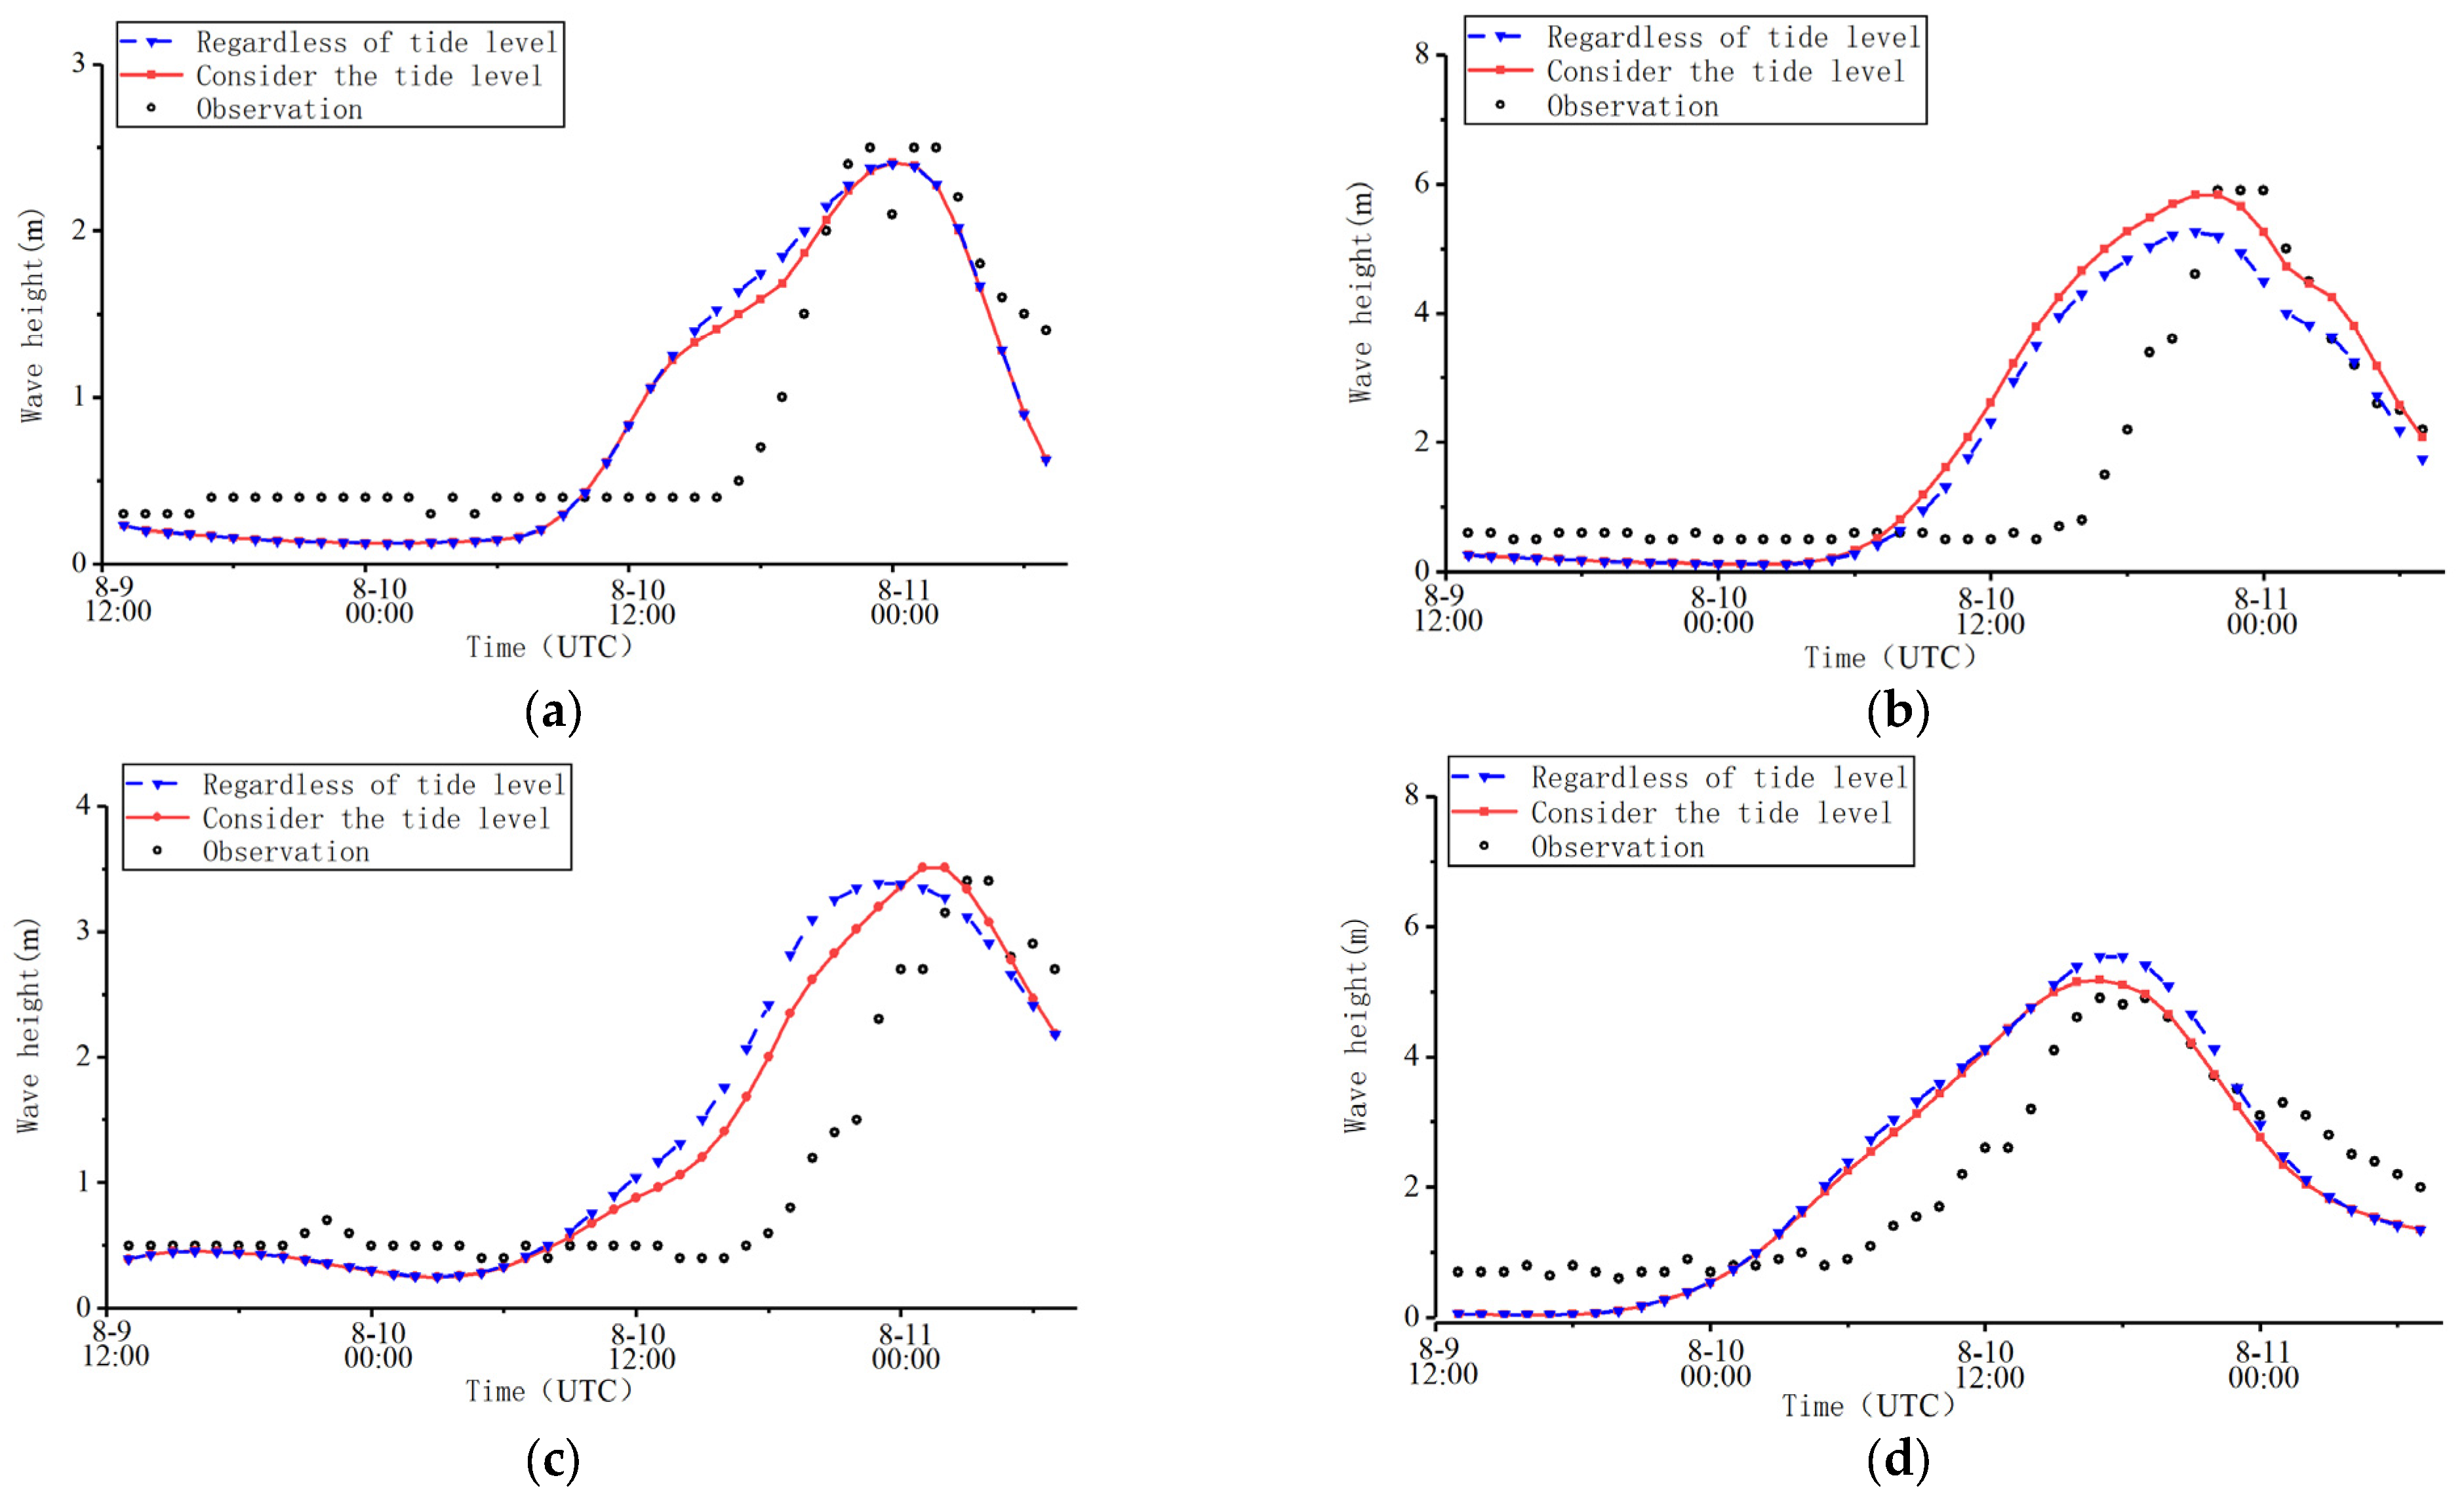
Figure 7 shows a comparison between the simulated and measured data of significant wave heights at each verification point of Typhoon Mekkhala. The absolute error at the Gulei Buoy was 0.1 m, with a relative error of 4%. For Buoy No. 1, the absolute error was 0.07 m, resulting in a relative error of 3%. At Buoy No. 2, the absolute error reached 0.1 m, with a relative error of 4%. Lastly, at No. 2 Strait, the absolute error was 0.05 m, resulting in a relative error of 2%. It is worth noting that the maximum significant wave height measured at the No. 1 marker is 5.9 m, the maximum value without considering the tide level is 5.26 m, and the maximum value after considering the tide level is 5.83 m. These findings indicate that the simulation results are more accurate after considering the influence of the tidal level. However, it is evident from the figure that the optimization effect varies among the verification points when considering the tide level. Particularly, the optimization effect appears to be minimal at the Gulei buoy. This inconsistency could be attributed to the limited influence of tide levels at this specific location, resulting in a lesser impact on the optimization outcome.
The figure indicates that the significant wave height and wind speed at each point exhibit variations corresponding to the movement of the typhoon center. These variations follow a trend of initially increasing and then decreasing, with the peak time occurring simultaneously with the maximum intensity of the typhoon at the verification point. However, there exists a discrepancy between the measured and simulated values of significant wave height, which is attributed to the rapid movement of the typhoon center. Nonetheless, after considering the influence of the tide level, the errors in significant wave height and wind speed are reduced within a certain range. This adjustment brings the simulated results closer to the actual situation, making the trend more consistent with the observed data compared to the simulation results without considering the tide level. In conclusion, considering the tide level leads to more accurate simulation results for waves, which can facilitate the investigation of the impact of a typhoon landing at different tide levels.
5. Influence of High and Low Tide Levels on Typhoon Waves
5.1. Translating Tide Level
According to the above verification results, the tidal level results obtained through this method are consistent with the actual situation, indicating that it is feasible to input tidal level results into the SWAN model.
The impact of typhoon waves on hydraulic structures is more severe during high tide than at other times. In this section, the high tide level and low tide level obtained from the tidal level conversion at the time of the typhoon’s landing are used in the typhoon simulation. Additionally, the obtained simulation results are compared to analyze the influence of high and low tide levels on typhoon waves.
Typhoon Maria is a typical example in which the landing time of the typhoon coincides with the arrival of the high tide level. The simulation under normal conditions represents the simulation of the typhoon waves when the high tide level arrives. By simulating the tide level when Typhoon Maria arrives, the tide level simulation results at each time point (24 h) in the study area can be obtained. These results are similar to the simulation results of the previous Typhoon Mekkhala and are consistent with the actual situation. Since the change in the typhoon wind field on the time axis is affected by the background wind field, it is necessary to eliminate the effect of the background wind field to explore the influence of different tidal levels on the typhoon. To facilitate the comparison of the influence of different tidal levels on the effective typhoon wave height, the method of translating the tide level instead of the typhoon process is adopted. The tide level in the calculation area is shifted back 6 h so that when Typhoon Maria makes landfall, the tide level at the landing site is at the lowest tide time to explore the effect of the tide level.
Figure 8 shows the tidal height comparison of each verification point before and after the tidal level shift of Typhoon Maria. Upon comparing the results before and after the shift, it can be observed that when the typhoon arrives at the Beishuang buoy during the highest tide level and the shifted lowest time, a notable difference of 5 m is observed between the high tide and the low tide levels. At the No. 4 buoy, the difference is 4.1 m.
Figure 9 shows the tide level simulation results of the two verification buoys, Beishuang and No. 4, during the landfall of Typhoon Maria. It can be seen from the figure that the tidal heights at both buoys follow a 12-h cycle. The simulation results of the tide level are consistent with the semidiurnal tide characteristics in the Taiwan Strait.
5.2. Effect of Tide Level on Wave Height
Figure 10 shows the comparison between the simulated and measured values of the Beishuang buoy and No. 4 buoy at the time when the typhoon landfall time coincides with the highest tide level before and after the landfall of Typhoon Maria. It can be seen from the figure that the significant wave heights of all verification points first increase and then decrease with time. Additionally, the results, with or without considering the tide level, are consistent with the trend of the measured wave heights. At high tide, the maximum significant wave height of the Beishuang buoy increases by 0.34 m and decreases by 0.37 m at low tide, which means that the typhoon has a gap of 0.71 m between high and low tide (Figure 11).
In the simulation results, the reason why the tide level of the No. 4 buoy has less influence on the wave height than the Beishuang buoy may be due to topographic factors. Beishuang buoy is closer to the land, so the water depth is smaller than that of the No. 4 buoy. The difference in water depth causes the wave height of the No. 4 buoy to be larger than that of the Beishuang buoy, so the influence of the No. 4 buoy on the wave height is less obvious than that of the Beishuang buoy.
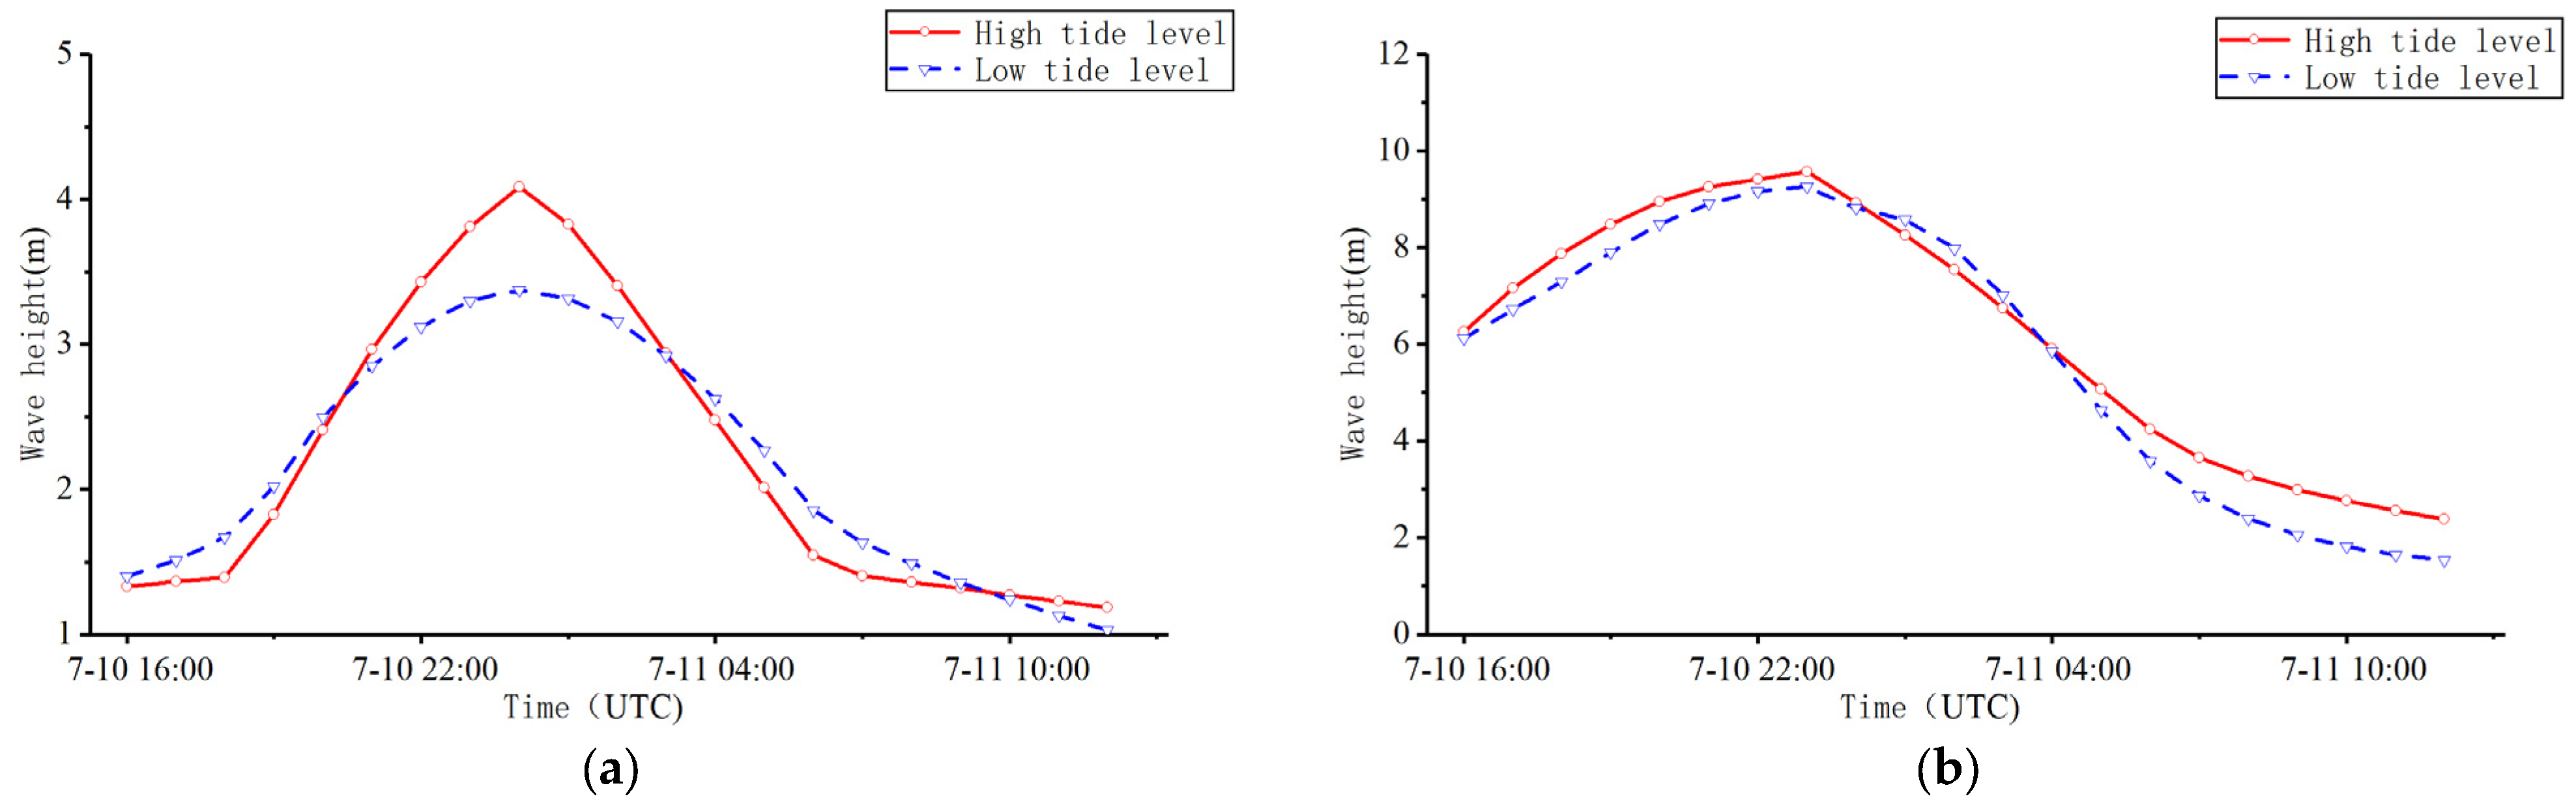
Figure 11 shows a comparison between the simulated and measured values of the Beishuang buoy and No. 4 buoy when the typhoon landing time coincides with the highest and lowest tide levels. It can be observed from the figure that the peak of the significant wave height appears at the time of typhoon landing, regardless of whether it is the lowest or highest tide level. The difference between the significant wave height values generated by the typhoon at high and low tide levels at the verification point is 0.5 m (Beishuang buoy) and 0.31 m (No. 4 buoy). In the case of a typhoon with the highest tide level, the significant wave height of the lowest tide level condition is lower than that of the high tide level at the peak. However, as the tide rises (7:00–10:00), significant wave heights continue to increase.
There is a situation where the phases of the peaks of the significant wave heights are different between the Beishuang buoy and the No. 4 buoy. When the Beishuang buoy reaches the highest tide level, the No. 4 buoy still has a phase difference of 1 h. This is because when studying the influence of different tide levels on typhoon waves, the first consideration is the relationship between the typhoon landing time and the tide level at the landing site. Therefore, the translation of the typhoon is based on its landfall time rather than the time at which the typhoon reaches its maximum significant wave height at different verification points. When the typhoon’s landfall time and the high tide level coincide, the waves generated by the typhoon are higher than in general situations. Simultaneously, the water level height resulting from the tide level itself is combined, which has a huge impact on the safety of other marine structures such as shore breakwaters.
6. Conclusions
In this study, a numerical model was developed using SWAN based on the wind field model of Typhoon Mekhala (2006). Tidal data were included in the calculation of the wave model, and the simulation results were validated by actual measurements. It was found that the inclusion of tidal factors could improve the accuracy of typhoon predictions. Typhoon Maria (0607) was used as an example to explore the effect of different tidal levels on typhoon waves. The incoming tide of Typhoon Maria was varied on the time axis to examine its impact, and the main conclusions obtained were as follows:
- (1)
- The simulation results of Typhoon Mekkhala were verified using measured data of significant wave height and wind speed at verification points during the calculation time. The results indicated that the simulated significant wave height and the measured values followed the same change process. The peak time of the wave was also consistent with the time when the typhoon had the greatest impact on the verification point. These findings suggest that the SWAN model is more accurate when coupling tide-level data compared to uncoupled tide-level data.
- (2)
- The simulation results of Typhoon Maria were optimized by adjusting the tidal level to better match the actual situation. Based on this, the tidal level during the typhoon’s approach was shifted on the time axis. When the high tide phase coincided, the simulated significant wave height at the verification point was higher compared to that without the influence of the tidal level. As a result, the wave height increased, posing a greater danger to shore buildings. Conversely, when the typhoon landed during low tide, the significant wave heights at both verification points decreased by 0.37 m and 0.07 m, respectively.
- (3)
- The significant wave height of Typhoon Maria during a high-tide landing differed significantly from that during a low-tide landing. At the Beishuang buoy, the maximum significant wave height difference was 0.71 m (20%), while at the No. 4 buoy, the difference was 0.29 m (3%). The tidal level height had a significant influence on the typhoon’s landing, and the tidal level height at the time of the typhoon’s landing was positively correlated with the significant wave height of the typhoon wave.
- (4)
- The significant wave heights of the verification buoys, Beishuang and No. 4, show significant differences under the influence of different tidal heights. This is because the water depth at the No. 4 buoy is 63 m, which is 2.5 times deeper than that of the northern double buoys (18 m). Therefore, the reference value of significant wave height before the tide level is taken into account is larger for No. 4, amplifying the influence of tide level height on the Beishuang buoy.
Author Contributions
Conceptualization, C.C. and H.X.; methodology, H.X.; software, H.X.; validation, H.X.; writing—original draft preparation, C.P.; writing—review and editing, C.P.; visualization, T.W.; supervision, M.W.; project administration, C.C.; funding acquisition, C.C. All authors have read and agreed to the published version of the manuscript.
Funding
The work was financially supported by the National Natural Science Foundation of China (Grant No. 51809047); the National Natural Science Foundation of China (Grant No. U22A20585); and the Fujian Provincial Natural Science Foundation (Grant No. 2019J05029).
Data Availability Statement
Data will be made available on request.
Conflicts of Interest
The authors declare no conflict of interest.
References
- Ying, W.M.; Zheng, Q.; Zhu, C.C. Numerical simulation of “CHAN-HOM” typhoon waves using SWAN model. Mar. Sci. 2017, 41, 108–117. [Google Scholar]
- Kim, T.R.; Lee, J.H. Comparison of High Wave Hindcasts during Typhoon Bolaven (1215) using SWAN and WAVEWATCH III Model. J. Coast. Res. 2018, 85 (Suppl. S1), 1096–1100. [Google Scholar] [CrossRef]
- Zhou, Y.Y.; Zhou, L.; Guan, H. Numerical simulation of typhoon waves in the Northwest Pacific Ocean. Mar. Forecast. 2016, 33, 23–30. [Google Scholar]
- Chen, J.Q. Study on the characteristics of typhoon waves under three typical paths in Taiwan Strait Chinese. Mar. Forecast. 2018, 35, 1–12. [Google Scholar]
- Liu, W.C.; Huang, W.C. Investigating typhoon-induced storm surge and waves in the coast of Taiwan using an integrally-coupled tide-surge-wave model. Ocean Eng. 2020, 212, 107571. [Google Scholar] [CrossRef]
- Wu, Z.; Chen, J.; Jiang, C.B.; Deng, B. Simulation of extreme waves using coupled atmosphere-wave modeling system over the South China Sea Zhiyuan. Ocean Eng. 2021, 221, 108531. [Google Scholar] [CrossRef]
- Wang, Z.F.; Gong, Y.Z.; Cui, J.N. Effect of the drag coefficient on a typhoon wave model. J. Oceanol. Limnol. 2019, 37, 1795–1804. [Google Scholar] [CrossRef]
- Pei, Z.N.; Li, S.W.; Li, W. Comparative Study among Various Parameterizations on the Modelling of Tropical Cyclone Wind Field. J. Disaster Prev. Mitig. Eng. 2021, 41, 265–275. [Google Scholar]
- Yang, J.; Chen, Y.; Xu, F. Parametric typhoon wind field simulations by considering the effects of terrain and land cover. J. Nat. Disasters 2021, 30, 47–59. [Google Scholar]
- Yin, K.; Xu, S.D.; Zhao, Q.; Huang, W.R.; Yang, K.; Guo, M.T. Effects of land cover change on atmospheric and storm surge modeling during typhoon event. Ocean Eng. 2020, 199, 106971. [Google Scholar] [CrossRef]
- Dong, H.T.; Tao, T.; Du, X.Q. Multi-scale numerical simulation of the wind field over a coastal complex terrain during a typhoon landfall. Acta Aerodyn. Sin. 2021, 39, 147–152. [Google Scholar]
- Yang, B.; Shi, W.Y.; YE, Q. Characteristics of waves in coastal waters of northeast Zhoushan Island during typhoons. Adv. Water Sci. 2017, 28, 106–115. [Google Scholar]
- Hsiao, S.C.; Chen, H.; Chen, W.B.; Chang, C.H.; Lin, L.Y. Quantifying the contribution of nonlinear interactions to storm tide simulations during a super typhoon event. Ocean Eng. 2020, 199, 106971. [Google Scholar] [CrossRef]
- Ding, J.; Wang, J.; Zhao, X. Simulation of the highest tidal level in history of typhoon 1323 “Fitow”. Mar. Forecast. 2014, 31, 30–36. [Google Scholar]
- Duan, X.F.; Xu, X.G.; Chen, M.C.; Li, X. Methodology and Case Study of Sea Level Prediction Based on Secular Tide Gauge Data. Acta Sci. Nat. Univ. Pekin. 2014, 50, 1065–1070. [Google Scholar]
- Liu, J.; Shi, G.Y.; Zhu, K.G.; Zhang, J.W. A combined tide prediction model based on harmonic analysis and AmMA-SVR. J. Shanghai Marit. Univ. 2019, 40, 93–99. [Google Scholar]
- Zheng, Z.-W.; Chen, Y.-R. Influences of Tidal Effect on Upper Ocean Responses to Typhoon Passages Surrounding Shore Region off Northeast Taiwan. J. Mar. Sci. Eng. 2022, 10, 1419. [Google Scholar] [CrossRef]
- Zhang, Z.; Guo, F.; Song, Z.; Chen, P.; Liu, F.; Zhang, D. A Numerical Study of Storm Surge Behavior in and around Lingdingyang Bay, Pearl River Estuary, China. Nat. Hazards 2022, 111, 1507–1532. [Google Scholar] [CrossRef]
- Li, L.; Li, Z.; He, Z.; Yu, Z.; Ren, Y. Investigation of Storm Tides Induced by Super Typhoon in Macro-Tidal Hangzhou Bay. Front. Mar. Sci. 2022, 9, 890285. [Google Scholar] [CrossRef]
- Tang, Y.; Wang, Y.; Zhao, E.; Yi, J.; Feng, K.; Wang, H.; Wang, W. Study on Hydrodynamic Characteristics and Environmental Response in Shantou Offshore Area. J. Mar. Sci. Eng. 2021, 9, 912. [Google Scholar] [CrossRef]
- Chen, W.-B.; Lin, L.-Y.; Jang, J.-H.; Chang, C.-H. Simulation of Typhoon-Induced Storm Tides and Wind Waves for the Northeastern Coast of Taiwan Using a Tide-Surge-Wave Coupled Model. Water 2017, 9, 549. [Google Scholar] [CrossRef]
- Chen, W.-B.; Liu, W.-C.; Hsu, M.-H. Computational Investigation of Typhoon-Induced Storm Surges along the Coast of Taiwan. Nat. Hazards 2012, 64, 1161–1185. [Google Scholar] [CrossRef]
- Tu, C.D.; Ji, Q.Y.; Zuo, J.C. Global tide simulation based on the semi-implicit cross-scale hydroscience integrated system model. Mar. Sci. 2021. [Google Scholar]
- Wu, W.H.; Li, L.B.; Yin, J.C.; Lyu, W.Y.; Zhang, W.J. A Modular Tide Level Prediction Method Based on a NARX Neural Network. IEEE Access 2021, 9, 147416–147429. [Google Scholar] [CrossRef]
- Chong, W.; Pan, J. Wind Energy Resources Assessment in Global Ocean. Zheng J. Nat. Resour. 2012, 27, 364–371. [Google Scholar]
- Zhang, P.; Chen, X.L.; Lu, J.Z. Research on wave simulation of Bohai Sea based on the CCMP remotely sensed sea winds. Mar. Sci. Bull. 2011, 30, 266–271. [Google Scholar]
Figure 1.
Bathymetric map.

Figure 2.
Track of typhoons: (a) Mekkhala and (b) Maria.

Figure 3.
Tide level simulation for Typhoon Mekkhala. (a) 2020-08-10 T00:00, (b) 2020-08-10T06:00, (c) 2020-08-10 T12:00, (d) 2020-08-10 T18:00.
Figure 3.
Tide level simulation for Typhoon Mekkhala. (a) 2020-08-10 T00:00, (b) 2020-08-10T06:00, (c) 2020-08-10 T12:00, (d) 2020-08-10 T18:00.

Figure 4.
Verification points map. (a) For wind speed validation, (b) For tide level validation.

Figure 5.
Comparison of calculated and measured wind speeds at each verification point of Typhoon Mekkhala. (a) Gulei buoy. (b) No. 1 buoy. (c) No. 2 buoy. (d) No. 2 Strait buoy.
Figure 5.
Comparison of calculated and measured wind speeds at each verification point of Typhoon Mekkhala. (a) Gulei buoy. (b) No. 1 buoy. (c) No. 2 buoy. (d) No. 2 Strait buoy.

Figure 6.
Comparison of simulated and measured tide levels at each verification point of Typhoon Mekkhala. (a) Sansha buoy. (b) Pingtan buoy. (c) Xiamen buoy. (d) Jiangjunao buoy.
Figure 6.
Comparison of simulated and measured tide levels at each verification point of Typhoon Mekkhala. (a) Sansha buoy. (b) Pingtan buoy. (c) Xiamen buoy. (d) Jiangjunao buoy.

Figure 7.
Comparison of calculated and measured wave heights at each verification point of Typhoon Mekkhala. (a) Gulei buoy. (b) No. 1 buoy. (c) No. 2 buoy. (d) No. 2 Strait buoy.
Figure 7.
Comparison of calculated and measured wave heights at each verification point of Typhoon Mekkhala. (a) Gulei buoy. (b) No. 1 buoy. (c) No. 2 buoy. (d) No. 2 Strait buoy.

Figure 8.
Comparison of tide levels before and after shifting tide levels. (a) Beishuang buoy. (b) No. 4 buoy.
Figure 8.
Comparison of tide levels before and after shifting tide levels. (a) Beishuang buoy. (b) No. 4 buoy.

Figure 9.
Tidal height at the verification points of Typhoon Maria. (a) Under the influence of high tide level. (b) Under the influence of low tide (Translational tide level).
Figure 9.
Tidal height at the verification points of Typhoon Maria. (a) Under the influence of high tide level. (b) Under the influence of low tide (Translational tide level).

Figure 10.
The significant wave height at the verification points before and after shifting the tide level. (a) Beishuang (High tide level). (b) No. 4 (High tide level). (c) Beishuang (Low tide level). (d) No. 4 (Low tide level).
Figure 10.
The significant wave height at the verification points before and after shifting the tide level. (a) Beishuang (High tide level). (b) No. 4 (High tide level). (c) Beishuang (Low tide level). (d) No. 4 (Low tide level).

Figure 11.
Comparison of significant wave heights at the verification point after shifting the tide level (low level). (a) Beishuang buoy. (b) No. 4 buoy.
Figure 11.
Comparison of significant wave heights at the verification point after shifting the tide level (low level). (a) Beishuang buoy. (b) No. 4 buoy.

Disclaimer/Publisher’s Note: The statements, opinions and data contained in all publications are solely those of the individual author(s) and contributor(s) and not of MDPI and/or the editor(s). MDPI and/or the editor(s) disclaim responsibility for any injury to people or property resulting from any ideas, methods, instructions or products referred to in the content. |
© 2023 by the authors. Licensee MDPI, Basel, Switzerland. This article is an open access article distributed under the terms and conditions of the Creative Commons Attribution (CC BY) license (https://creativecommons.org/licenses/by/4.0/).
Share and Cite
MDPI and ACS Style
Chen, C.; Peng, C.; Xiao, H.; Wei, M.; Wang, T. Effect of Tide Level Change on Typhoon Waves in the Taiwan Strait and Its Adjacent Waters. Water 2023, 15, 1807. https://doi.org/10.3390/w15101807
AMA Style
Chen C, Peng C, Xiao H, Wei M, Wang T. Effect of Tide Level Change on Typhoon Waves in the Taiwan Strait and Its Adjacent Waters. Water. 2023; 15(10):1807. https://doi.org/10.3390/w15101807
Chicago/Turabian StyleChen, Cheng, Chen Peng, Hong Xiao, Minjian Wei, and Tingyu Wang. 2023. "Effect of Tide Level Change on Typhoon Waves in the Taiwan Strait and Its Adjacent Waters" Water 15, no. 10: 1807. https://doi.org/10.3390/w15101807
Note that from the first issue of 2016, this journal uses article numbers instead of page numbers. See further details here.