
Development of Flood Early Warning Frameworks for Small Streams in Korea
by

Tae-Sung Cheong
1,
Changwon Choi
1,
Sung-Je Ye
1,
Jihye Shin
1,
Seojun Kim
2 and
Kang-Min Koo
2,* 1
National Disaster Management Institute, Ministry of Interior and Safety, Ulsan 44538, Republic of Korea
2
HydroSEM, Yongin 16976, Republic of Korea
*
Author to whom correspondence should be addressed.
Water 2023, 15(10), 1808; https://doi.org/10.3390/w15101808
Submission received: 6 April 2023
/
Revised: 27 April 2023
/
Accepted: 7 May 2023
/
Published: 9 May 2023
(This article belongs to the Special Issue Advances in Streamflow and Flood Forecasting)
Abstract
:Currently, Korea is undergoing significant local extreme rainfall, which contributes to more than 80% of flood disasters. Additionally, there is an increasing occurrence of such extreme rainfall in small stream basins, accounting for over 60% of flood disasters. Consequently, it becomes imperative to forecast runoff and water levels in advance to effectively mitigate flood disasters in small streams. The Flood Early Warning Framework (FEWF) presents one solution to reduce flood disasters by enabling the forecast of discharge and water levels during flood events. However, the application of FEWF in existing research is challenging due to the short flood travel time characteristic of small streams. This research proposes a methodology for constructing FEWF tailored to small streams using the nomograph and rating curve method. To evaluate the effectiveness of FEWF, a 6-year dataset from the Closed-circuit television-based Automatic Discharge Measurement Technique (CADMT) was utilized. The results indicate that FEWF successfully forecasts discharge and depth during flood events. By leveraging CADMT technology and real-time data, the development of precise and dependable FEWFs becomes possible. This advancement holds the potential to mitigate the consequences of extreme rainfall events and minimize flood-related casualties in small stream basins.
1. Introduction
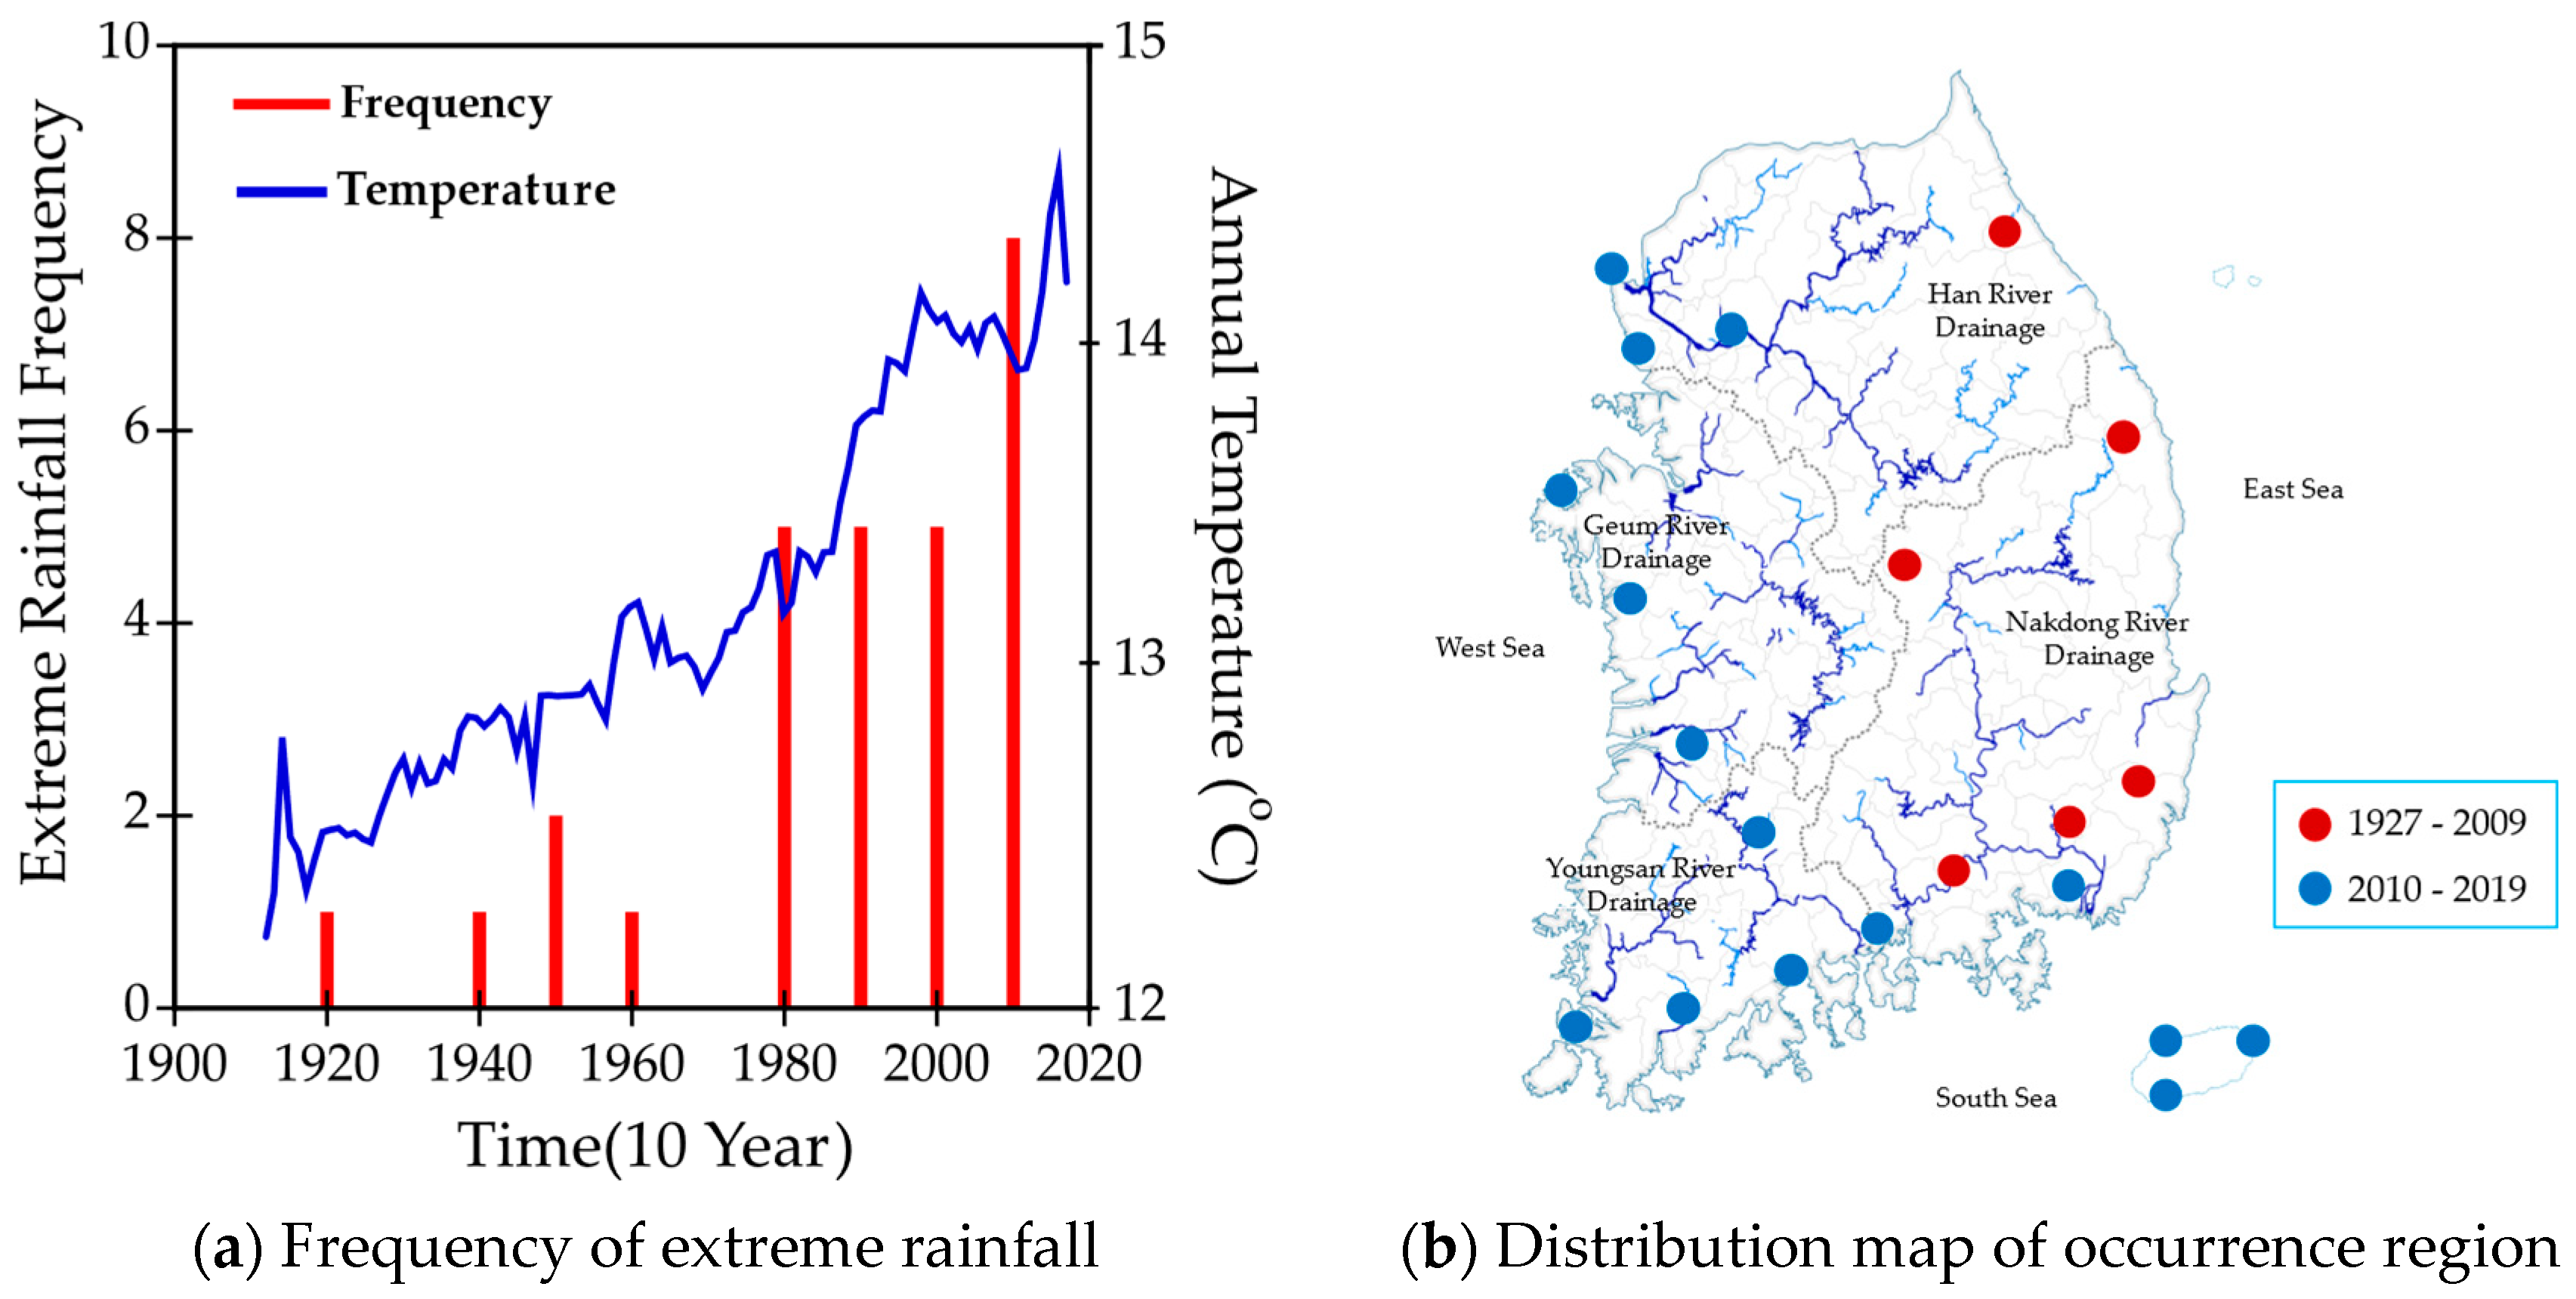
Localized extreme rainfall is one of the most severe hazards in Asia and globally, with immeasurable impacts due to increasing intensity and frequency attributed to climate change [1,2]. According to the climatological statistics of Korea's national climate data center in 2020, the frequency of heavy rainfall exceeding 100 mm per hour in South Korea has steadily increased as the average temperature has risen from 1927 to 2019, as shown by the blue line in Figure 1a. The area of occurrence is also expanding throughout Korea. Extreme rainfall that occurred once in the 1920s increased to five times in the 1980s, then to eight times in the 2010s, and continued to increase gradually, as shown in Figure 1a.
Flood disasters linked to these extreme rainfall events cause the largest socioeconomic losses in the Asian domain [3,4,5]. In Korea, more than 80% of flood disasters occur in river basins [6,7]. As extreme rainfall events occur suddenly and locally, such as in flash floods, the flood damage caused by extreme rainfall events in small streams is on the rise. Disasters in the last 10 years, from 2010 to 2019, show that about 42.3% of the total damage of $68.5 million was caused in the small stream basins [8]. Floods bring more serious impacts on small stream basins than large river basins, as small streams have fast flow characteristics within a 1-h flow duration time with a steep channel slope [6]. In particular, more than 60% of casualties have occurred in the small stream because it is located near the community and is easy to access, but it is not easy to escape when the water level suddenly rises. Therefore, the measurement system needs to be implemented urgently to reduce the risk of small streams flooding.
One of the solutions to reducing or preventing small stream flooding disasters is the Flood Early Warning Framework (FEWF), which can drastically reduce human casualties by warning people who live or recreate near small streams to leave dangerous areas before floods arrive [9]. The FEWF forecasts the arrival time and water level of the flood in advance, and the hydraulic forecasting model is required that can forecast the water level at any point in the river during the flood. The most common hydraulic model that reflects the physical characteristics of river topography and flow is the dynamic wave model, with the Saint-Vernant equation as the governing equation [10]. It is not always an appropriate method to use for forecasting purposes. In addition, to ensure the accuracy and reliability of the flood early warning system, the data analysis method is required that considers the unique characteristics of small streams, such as steep slopes and short flood travel times.
Accurate and reliable data on rainfall, water levels and discharge are essential for the development of an effective FEWF. However, many small streams lack adequate monitoring equipment, and data collection can be expensive and difficult. For this reason, it is difficult to find cases where FEWF has been applied to small streams worldwide.
In this research, SIV (Surface Image Velocimetry) was used as the technique for more accurate flow velocity measurement of small streams to overcome these problems [11,12,13,14]. The National Disaster Management Institute (NDMI) in Korea developed the Closed-circuit television-based Automatic Discharge Measurement Technology (CADMT) using SIV technology in 2016 and evaluated it through field and hydraulic experiments [6]. CADMT sets the area to be calculated between the images for each frame captured by CCTV, calculates the distance and direction of particle movement for each point, and obtains the mean value of flow velocity. The CADMT allows for real-time measurement of flow depth, velocity distribution, and discharge under extreme flow conditions without requiring direct measurement, recording, or data collection and analysis. Recent advances in ICT-based remote sensing technology, information technology, statistical analysis technology, and social media provide opportunities for flood early warning systems to gain additional capabilities [15]. These technologies provide an opportunity to overcome the technical limitations faced by flood early warning systems [16,17]. Statistical analysis technology can be used for forecasting in small watersheds as an alternative to traditional hydrologic and hydraulic models. The research of FEWF using CADMT for small streams is currently underway with the aim of reducing flood disasters in small streams, led by the NDMI in Korea [6,7,8,18,19], and this research is one of the results of that.
In particular, The Ministry of Interior and Safety (MOIS) in Korea has been installing the CADMT in small streams to collect real-time measurement data since 2016. The FEWF can be expanded to these small streams, and MOIS plans to install the CADMT in 10% of the 22,330 small streams in Korea by 2025. The selection of the 10% of small streams was based on flood risk assessments and local government demand surveys, reflecting the knowledge of local communities. The development and implementation of the CADMT is an excellent opportunity to improve flood forecasting and disaster risk reduction in small streams.
Additionally, the installation of CADMT in small streams can provide valuable data for further research and development of the FEWF, improving their effectiveness in the future. The approach of using local knowledge and flood risk assessments to prioritize the installation of CADMT in small streams also highlights the potential for community engagement and participation in flood management and risk reduction efforts. This technology and approach can provide real-time measurement and forecasting of flow discharges and depth, allowing for early warning and effective response to flood events in small streams.
To develop the FEWF, the research proposes the nomograph and rating curve for small stream flood warning. The rainfall-discharge nomograph forecasts discharge with expected rainfall data using the McGill Algorithm for Precipitation nowcasting by Lagrangian Extrapolation (MAPLE) developed by the Korea Meteorological Administration (KMA), and the rating curve forecasts flow depth for early flood warning. The FEWF can be further enhanced by incorporating remote sensing technology, such as the CADMT, which allows for real-time measurement of flow depth, velocity distribution, and discharge under extreme flow conditions without requiring direct measurement, recording, or data collection and analysis. Additionally, information technologies, such as social media, can be used to alert people in risk areas quickly and efficiently.
2. Materials and Methods
2.1. Determination of Measurement Sites
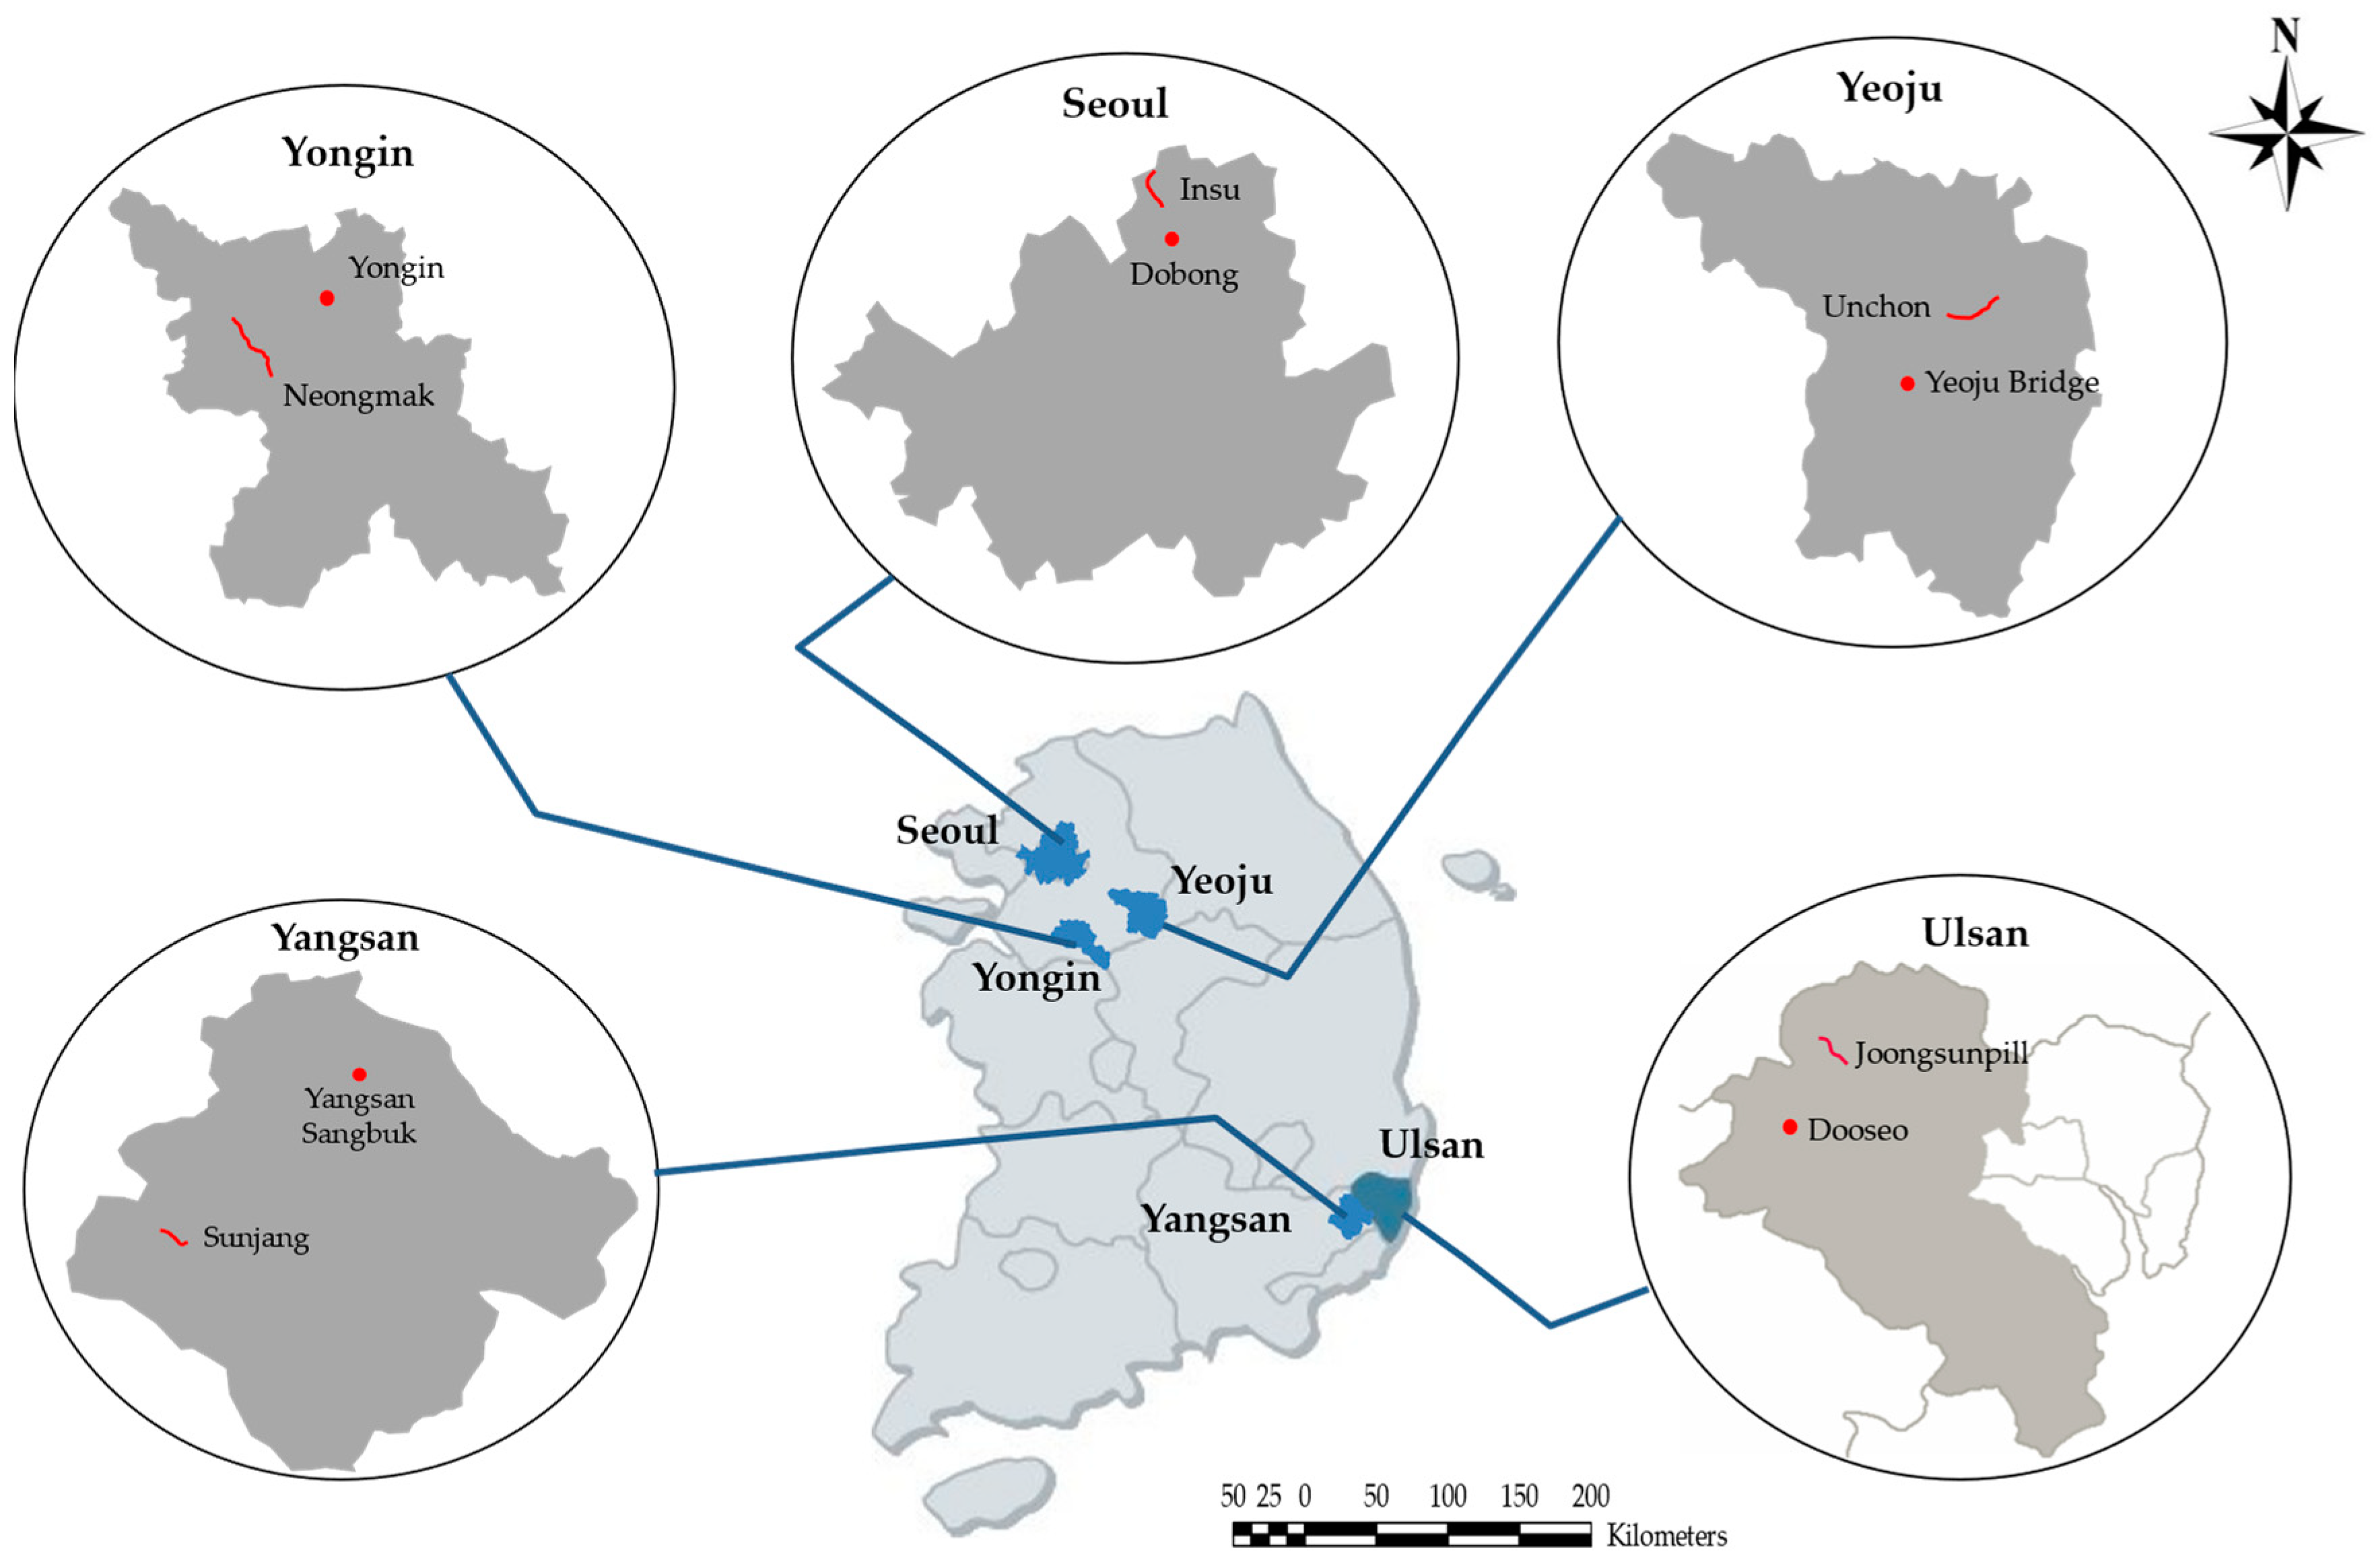
In order to develop and evaluate the FEWF, the research selected 5 small streams with CADMT installed: Jungsunpill, Sunjang, Unchon, Neungmac, and Insu streams, as test beds. For these small streams, NDMI conducted a field survey of 89 small streams in Korea to apply FEWF as the pilot plant and selected those streams that are easy to install CADMT [18]. The selection of these streams took into account various factors, such as geographic location, basin characteristics, and real-time data collected over 6-years from 2016 to 2021, which included measurements of rainfall, depth, velocity, and discharge Table 1 shows the characteristics of small stream watersheds, in which is the basin area, is the mean basin width, is the basin form coefficient (), is the mean channel slope, is the channel length, and is the channel width. The Jungsunpill and Sunjang streams are relatively steep and are located in the mountainous areas of Ulsan and Yangsan cities, respectively, in Korea. The Unchon and Neungmac streams, on the other hand, are relatively flat and are located in the urban areas of Yeoju and Yongin cities, respectively. The Insu stream, located in Seoul, Korea, has the smallest channel slope among the test beds. All small streams have a leaf-shaped watershed.
2.2. Selection of Rainfall Gauging Stations
The distance between the rainfall station and the streams and the correlation between the rainfall and the discharge were compared in order to accurately represent the rainfall and runoff characteristics of each small stream. This was done using measured discharge and rainfall data from all gauging stations, as shown in Figure 2. The total annual rainfall averages, as shown in Table 2, varied depending on local meteorological and geological conditions such as wind, rainfall direction, and mountain effects.
In order to collect both measured and estimated rainfall data per minute, the nearest rainfall gauging stations were selected using an adaptive analysis of distance and historical rainfall-runoff characteristics, except for the Insu stream located in Seoul. For this stream, the Uijeongbu gauging station was selected as its rainfall characteristics reflect the runoff processes of the Insu small stream basin well. This is due to the high mountain (Bukhan) with a height of 727 m, which is located between the Insu stream and the nearest gauging station (Dobong). The locations and reference information of the selected rainfall gauging stations are summarized in Table 2.
2.3. Measurement of Flow Velocity and Depth
Flow velocities, which are essential elements in the discharge measurement using the CADMT, were measured by using the cross-correlation method applied and verified by [20,21]. In the CADMT, the interrogation area is determined in the first image and the correlation area with a large correlation coefficient, is found in second image, and the flow velocity is calculated by dividing the moving distance between these areas by the time interval between both images. The correlation coefficient is calculated by following equation as:
in which and are the pixel size of the correlation area, and and are residual values of the correlation area and the interrogation area, respectively. The residual values are calculated by and respectively, in which and are average contrast values in the range. Finally, the surface velocity, is calculated by the following equation:
in which is the average time-velocity calculated at node of the grid in the search area, and is the total number of nodes in the grid. To measure the surface velocity distributions, the research used densely designed grids spaced 20 cm apart on cross-control cross-sections and captured images at 20 frames per second from the CCTV, which has the capacity to capture images at 30 frames per second. The surface velocity distributions were measured from each image and then averaged over time to reduce sudden fluctuations. The flow velocity measurement interval was determined to be 2 min based on the verification results of the fields and the hydraulic model experiments [6]. While using more images for averaging can significantly reduce fluctuation ranges, it may distort the measurement results and increase the measurement interval due to the increase in calculation time.
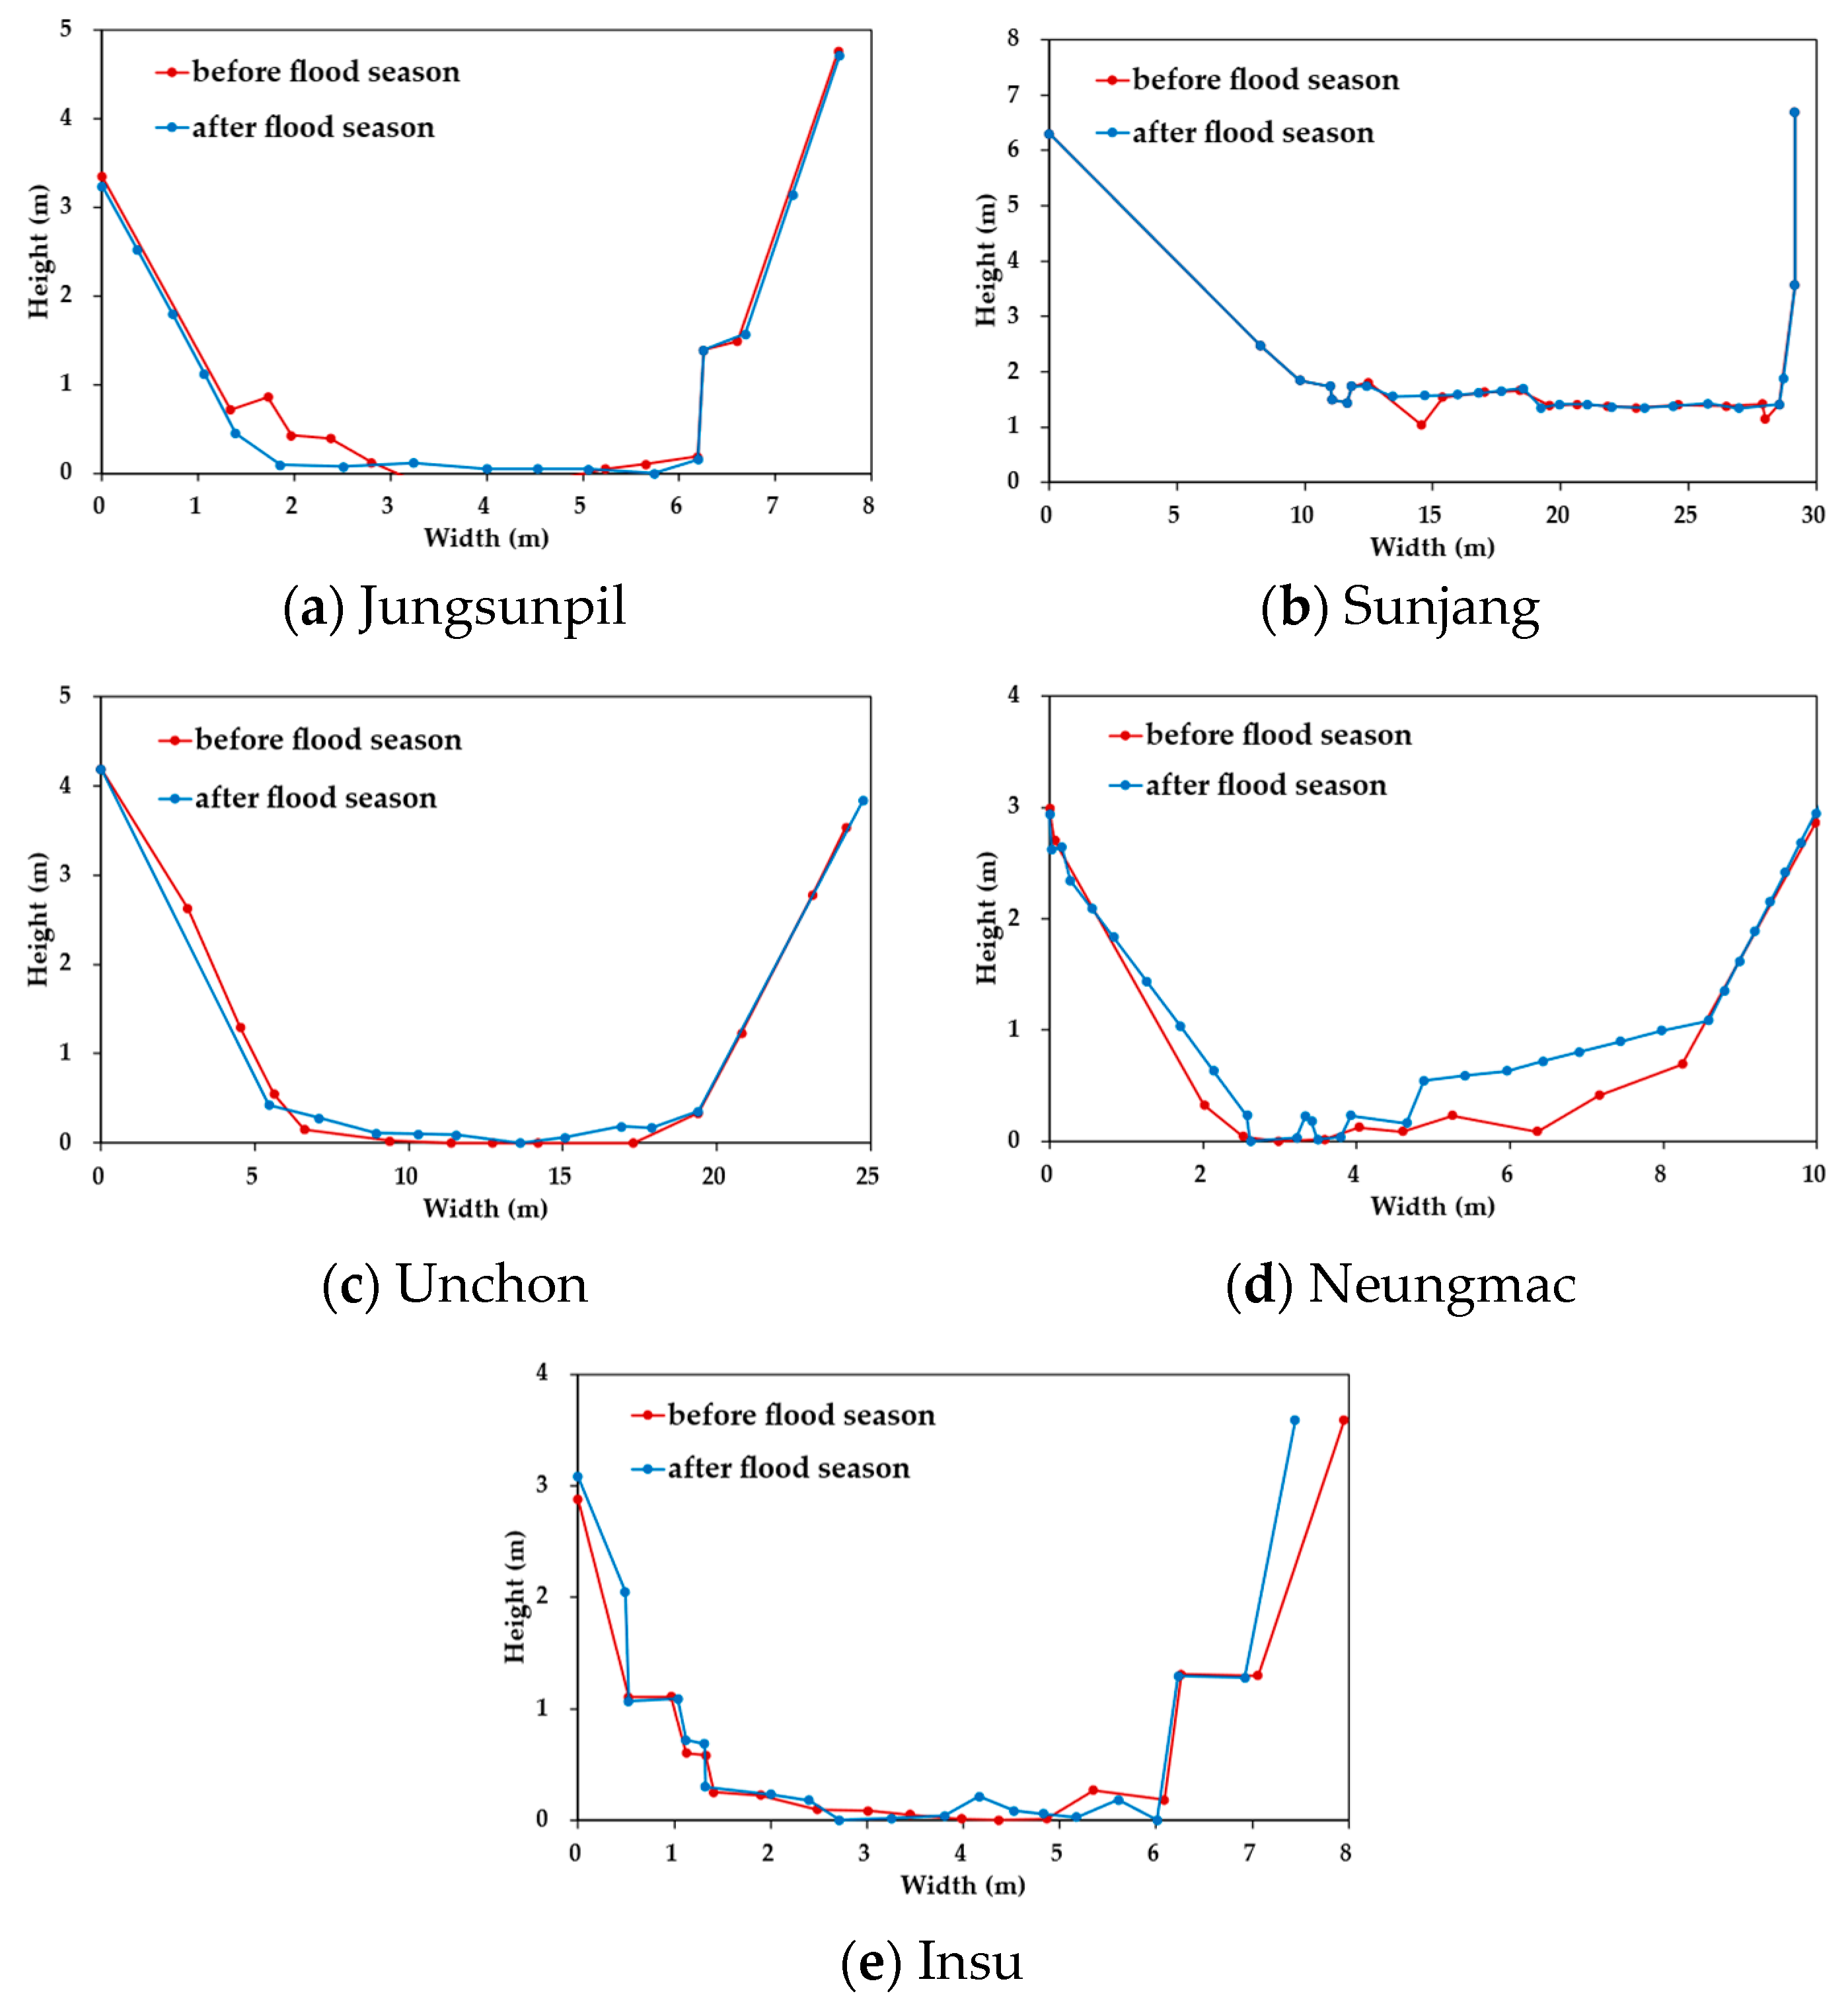
Water levels were also measured in real time using the ultrasonic type of water gauge installed in the CADMT and then converted into depth distributions on the same dense grid used for velocity measurements. To ensure accurate conversion to depth, the channel bed at the cross-section of each of the small streams was measured before and after the flood season every year. Figure 3 shows the comparison results of the cross-sectional changes before and after the flood season in the year with the greatest changes among all measured data for each of the small streams. The Jungsunpil stream had the largest cross-sectional change, measuring 47.5 cm on the cross-section in 2020, followed by the Sunjang stream with 41.3 cm on the cross-section measured in 2020, the Neungmac stream with 23.2 cm on the cross-section measured in 2018, the Unchon stream with 22.1 cm on the cross-section measured in 2018, and the Insu stream with 21.0 cm on the cross-section measured in 2020.
2.4. Discharge Measurements
For measuring discharge, the mid-section method was used in this research, which is commonly employed for calculating discharges. This method calculates the mean velocity in the sub-section using the mean velocity on the vertical. The measured discharge () and the measured area () were calculated using Equations (3) and (4), respectively,
in which is the mean velocity at vertical , is the distance from the initial point to vertical , and is the depth of flow at vertical . The subsection area extends laterally from half the distance from the preceding vertical to half the distance to the next subsection. The mean velocity was then calculated by using Equation (5):
in which is the surface velocity at vertical . If the cross-section of the small stream is rectangular or close to the rectangle, and the intervals between the verticals are equal, then the area of each subsection will be equal to the area of the sub-section (a), and the discharge calculated using surface velocity is given by Equation (7):
in which is the conversion coefficient. The conversion coefficient was estimated using Equation (8), where the ratio of the mean cross-sectional velocity and mean surface velocity was a straight line going through the origin.
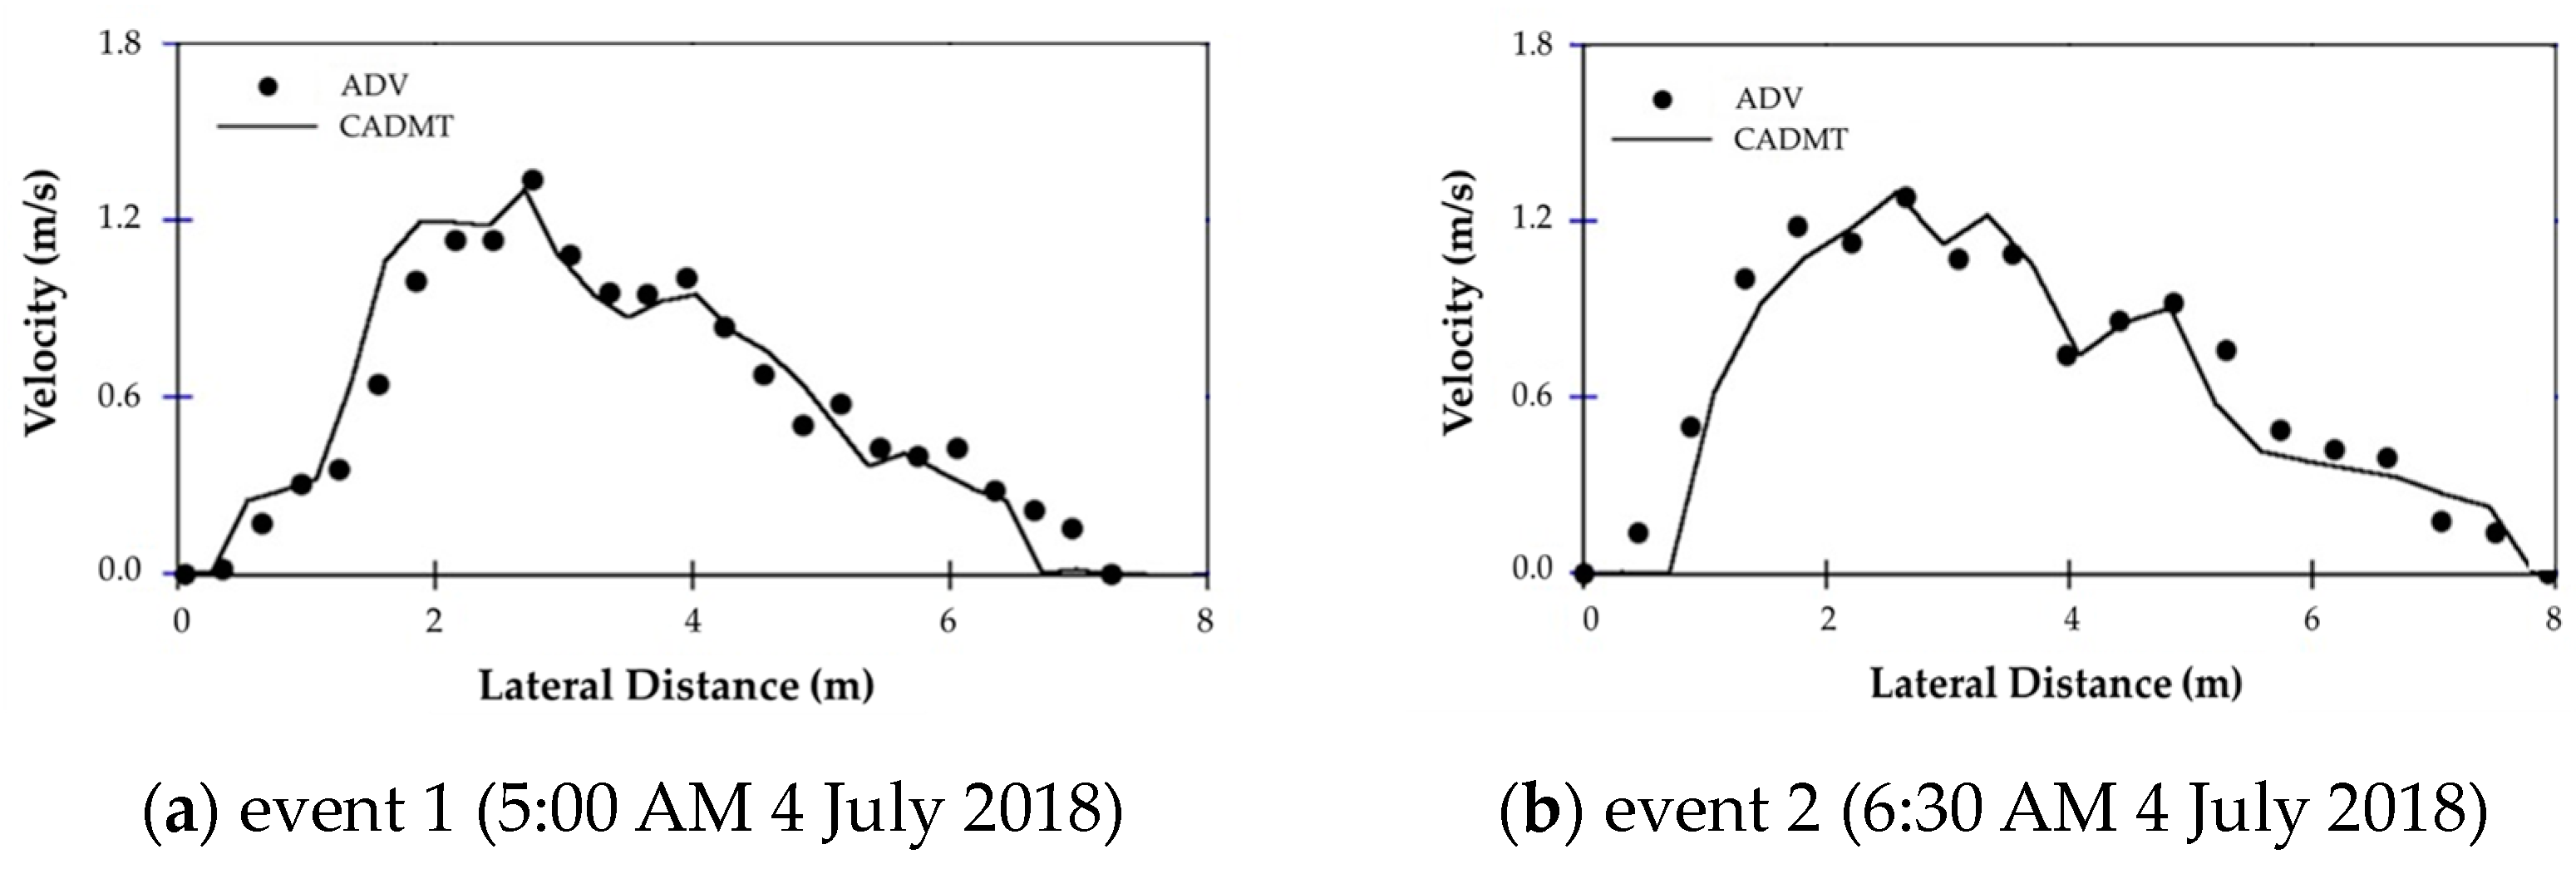
The average velocity distribution was measured by Aquatic Doppler Velocimetry (ADV), and the surface velocity was measured by CADMT in the same cross-controlled cross-section of small streams by NDMI. The ADV is the most traditional method of measuring flow velocity and is still used in many research studies to compare flow velocity measurements. However, when the flow velocity is high, it has the disadvantage of being very costly, as well as being unsafe, because it is measured using manpower. To compare average velocity distributions, the study used the USGS-recommended conversion factor of 0.85 for all streams. Figure 4 shows that the average velocity measured by the CADMT was a good representation of the ADV data.
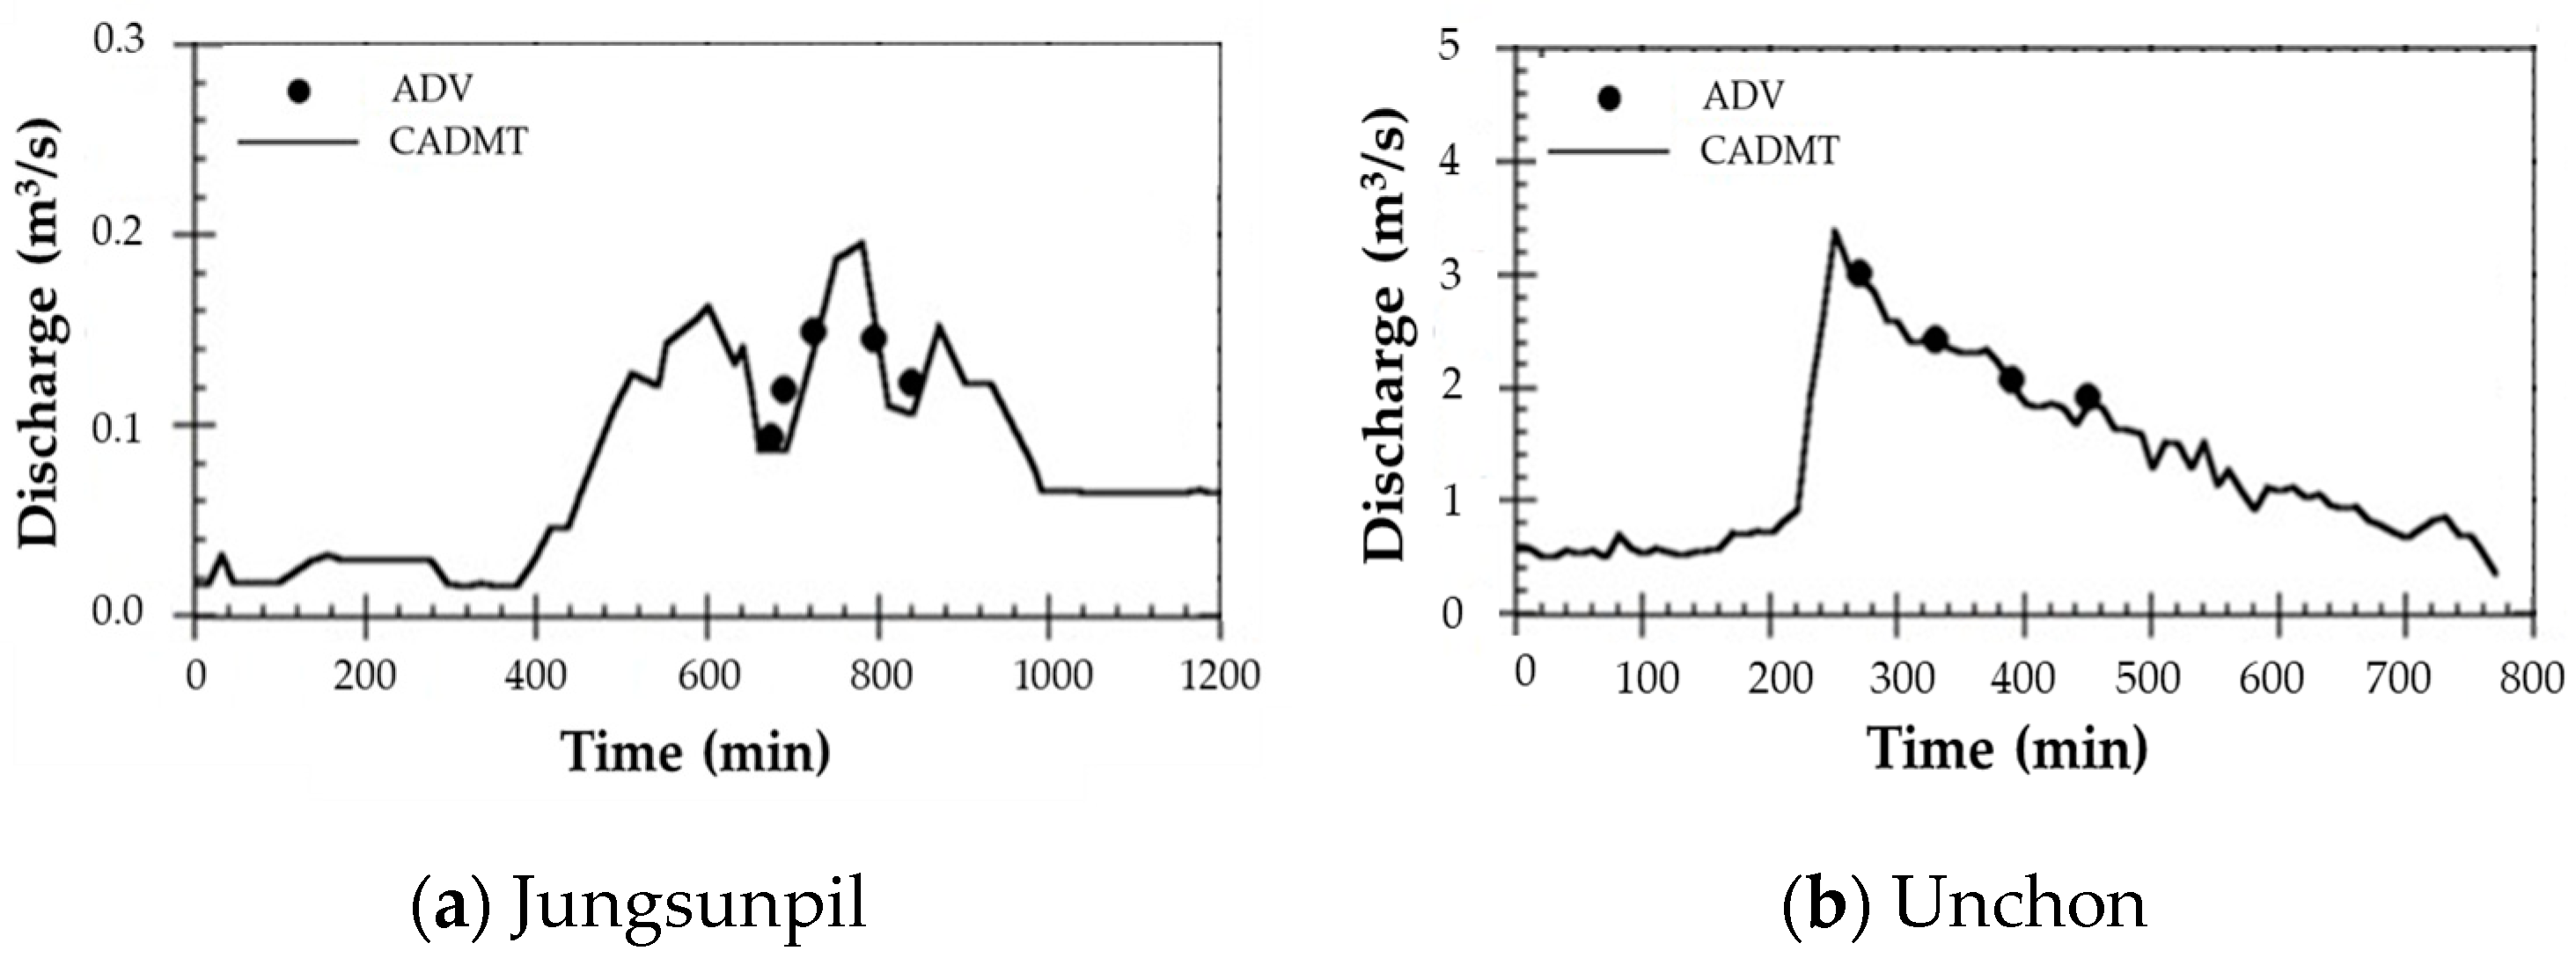
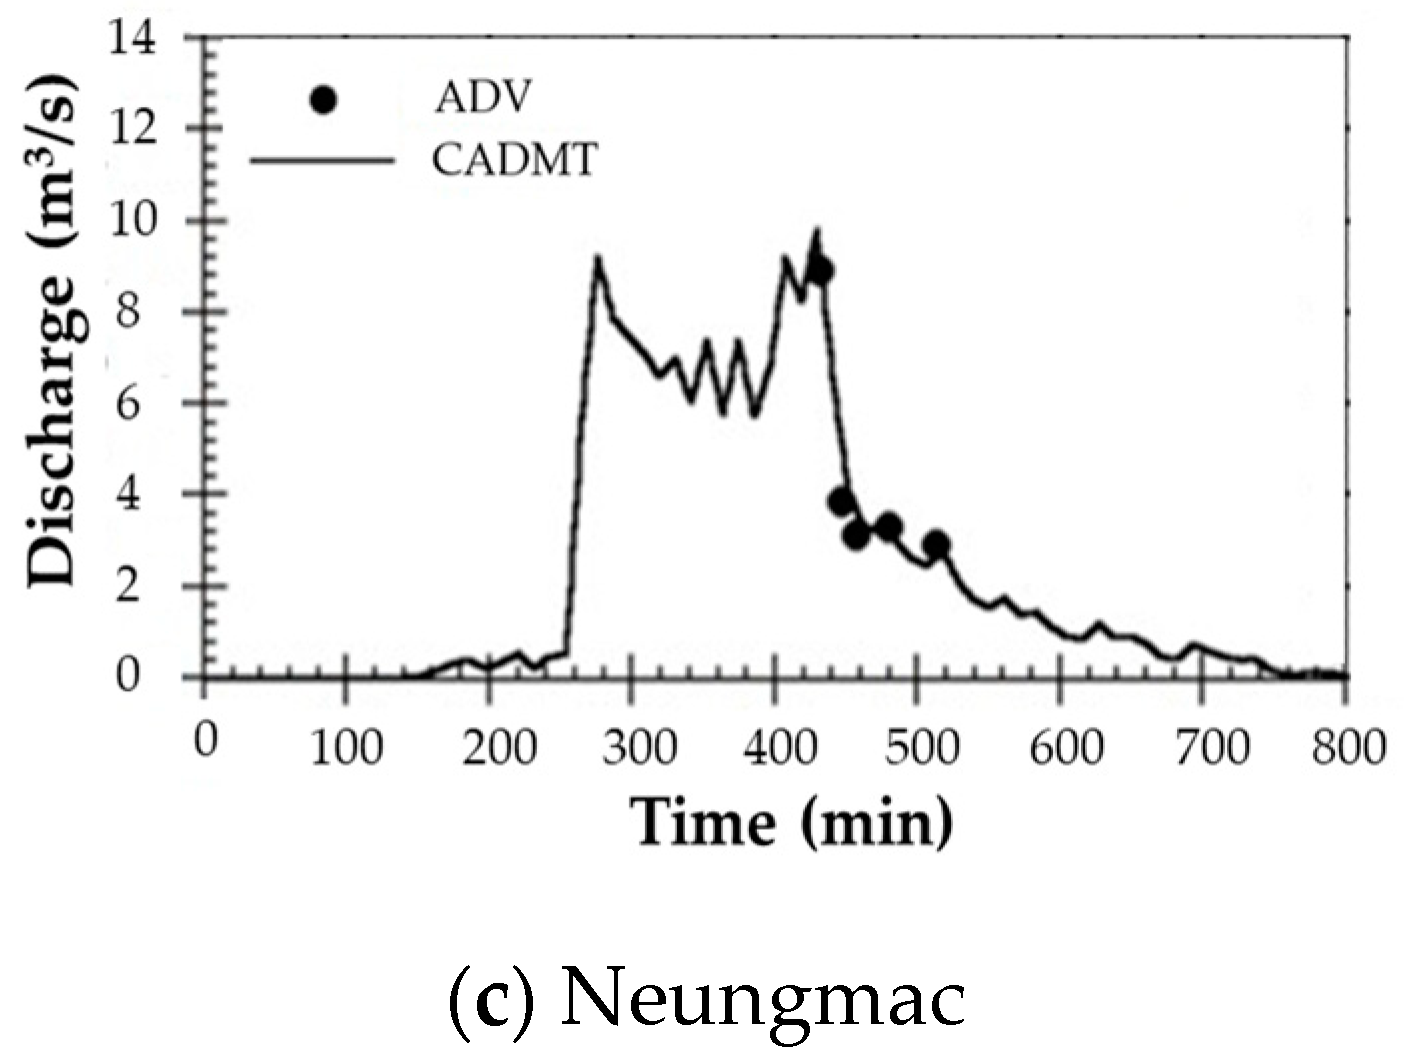
In order to quantitatively assess the difference between the CADMT and the ADV values, the Root Mean Square Errors (RMSE) were calculated in the research. The results indicate that the RMSE between the mean velocities of the CADMT and the ADV measured at 5:00 a.m. and 6:30 a.m. were 0.101 m/s and 0.159 m/s, respectively. Based on the error analysis, it can be inferred that the velocity data obtained by the CADMT has the potential to be used for developing the FEWF. In order to determine the accuracy of flow discharges measured by the CADMT, the comparison was conducted with the ADV velocities for major floods in all small streams. The results are shown in Figure 5, which presents the comparison of time discharges measured on 11 September 2017, 24 August 2017, and 6 October 2017. The comparison indicated that the discharges measured by the CADMT were well-represented by the ADV data.
The intercomparison analysis showed that the CADMT results measured at specific time intervals in the Jungsunpil, Unchon, and Neungmac small streams matched the ADV discharges very accurately with small errors ranging from 0.007 m3/s to 0.065 m3/s, depending on the time and location of the measurement, as shown in Figure 5a–c. The coefficient of determination, , was 0.90 for the Jungsunpil stream and 0.99 for the Unchon and Neungmac streams. Compared to the ADV, measuring flow discharges using the CADMT offers several advantages, including the shorter measurement time interval of at least 2 min, allowing for the measurement of peak discharges. In contrast, the ADV requires 20–30 min to measure the entire cross-section of the Jungsunpil stream, and its measurements may have large variations in time-discharge curves. Overall, the CADMT has the potential to be a useful tool for developing flood early warning systems.
3. Development of the Flood Early Warning Framework
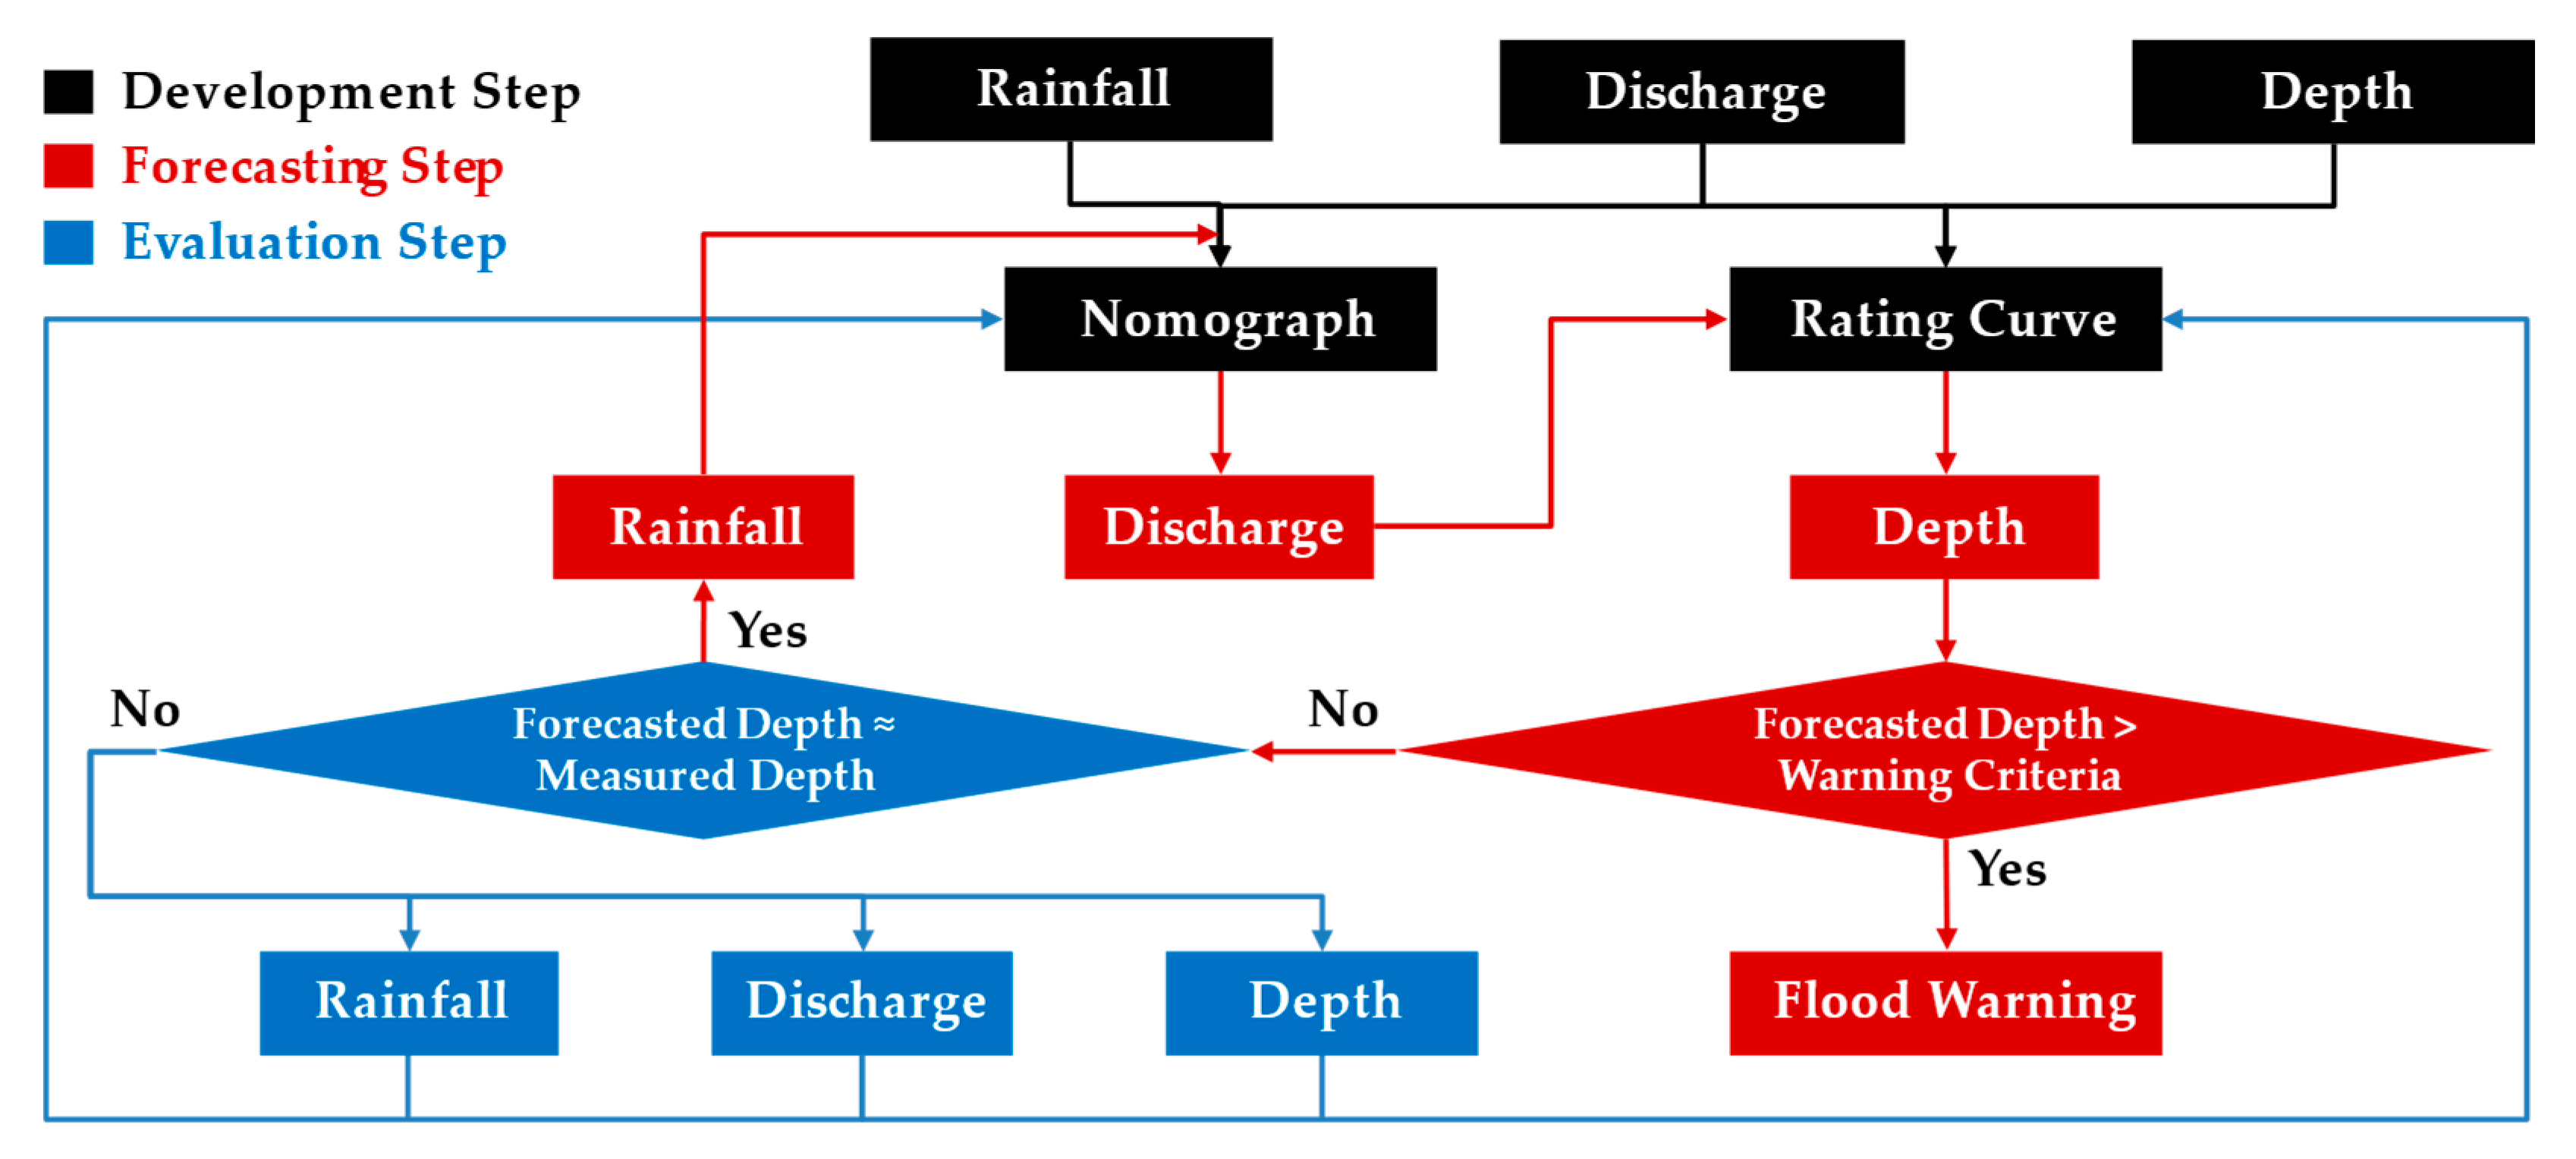
The research presents the framework for the FEWF, which consists of three major steps: development, forecasting, and evaluation, as illustrated in Figure 6. The first step, development, involves developing the rainfall-discharge nomograph and the rating curve using existing data collected in small stream basins. If measured rainfall, discharge, and depth data are available, the nomograph and rating curve is developed using this data. Otherwise, simulated data from simulation models such as the Unit Hydrograph and the Manning formula are used to develop the nomograph and rating curve.
In the second step, forecasting involves using the developed rainfall-discharge and rating curves to forecast discharge and depth, respectively. In this step, forecasted rainfall is used to forecast discharges from the rainfall-discharge nomograph. The research utilizes MAPLE for forecasting rainfall. The forecasted flood discharge is then used to forecast depth by using the developed rating curve until the forecasted depth exceeds the warning criteria. If the forecasted depth exceeds the warning criteria, the flood warning is issued to evacuate people from hazardous areas, including small streams.
If the forecasted depth does not exceed the warning criteria, it is evaluated with newly measured depth in the evaluation step to determine whether to enhance the rainfall-discharge nomograph and rating curve with newly measured values of rainfall, discharge, and depth. If the residual between the forecasted and measured values meets the convergence criteria, the forecasting is repeated to forecast the next time discharge with forecasted rainfall and depth. If it does not meet the criteria, the rainfall-discharge nomograph and rating curve can be updated with newly measured discharge, rainfall, and depth data. The research utilizes the Robust Constrained Nonlinear Equation Solver (RCNES) to improve the rainfall-discharge nomograph and rating curve by minimizing the Root Mean Square Error (RMSE) between the forecasted and measured sets of normalized data.
The RCNES is the solver that minimizes the sum of less rapidly increasing functions of the residuals rather than minimizing the sum of squared errors [22]. This has the advantage of minimizing the effect on the residuals for regression analysis. To solve for the correction vector (), the following equation is used:
in which is the unit matrix; is the Jacobian matrix of the residual function; is the residual matrix; is known, or previously estimated scale parameter; and is the non-negative parameter. The value of is chosen such that it is large enough to eliminate the singularity of the Jacobian matrix but not so large as to make moving away from the near singular region impossible. To solve for , preliminary estimates of are assumed and then computed by in which is the scalar step length. At this stage, absolute constraints may be imposed such that . The value of is calculated by , where is determined to be 0.990 as proposed by [23]. The value of is calculated by , in which if is smaller than the square root of the 0.975 quantile of residuals and if is larger than the square root of the 0.975 quantile of residuals [22]. The scale parameter is calculated by , in which the factor of 1.48 makes the scale parameter an approximately unbiased estimate of scale when the residual function is Gaussian [24].
The iterative procedure is carried out until the residual between the forecasted and measured values satisfies the convergence criteria. The identification of the solver is performed through a procedure that involves the repeated evaluation of various statistical measures for different parameters, ultimately selecting the best-identified solvers that satisfy the criteria. The identification statistics recommended by the research are the RMSE criterion and the coefficient of determination criterion, given by in which is the variance of the model residuals and is the variance of the output. If the solver explains the measured data well and is not over-parameterized, both values of approach unity, and the RMSE criterion becomes the smallest value.
3.1. Determination of the Warning Criteria
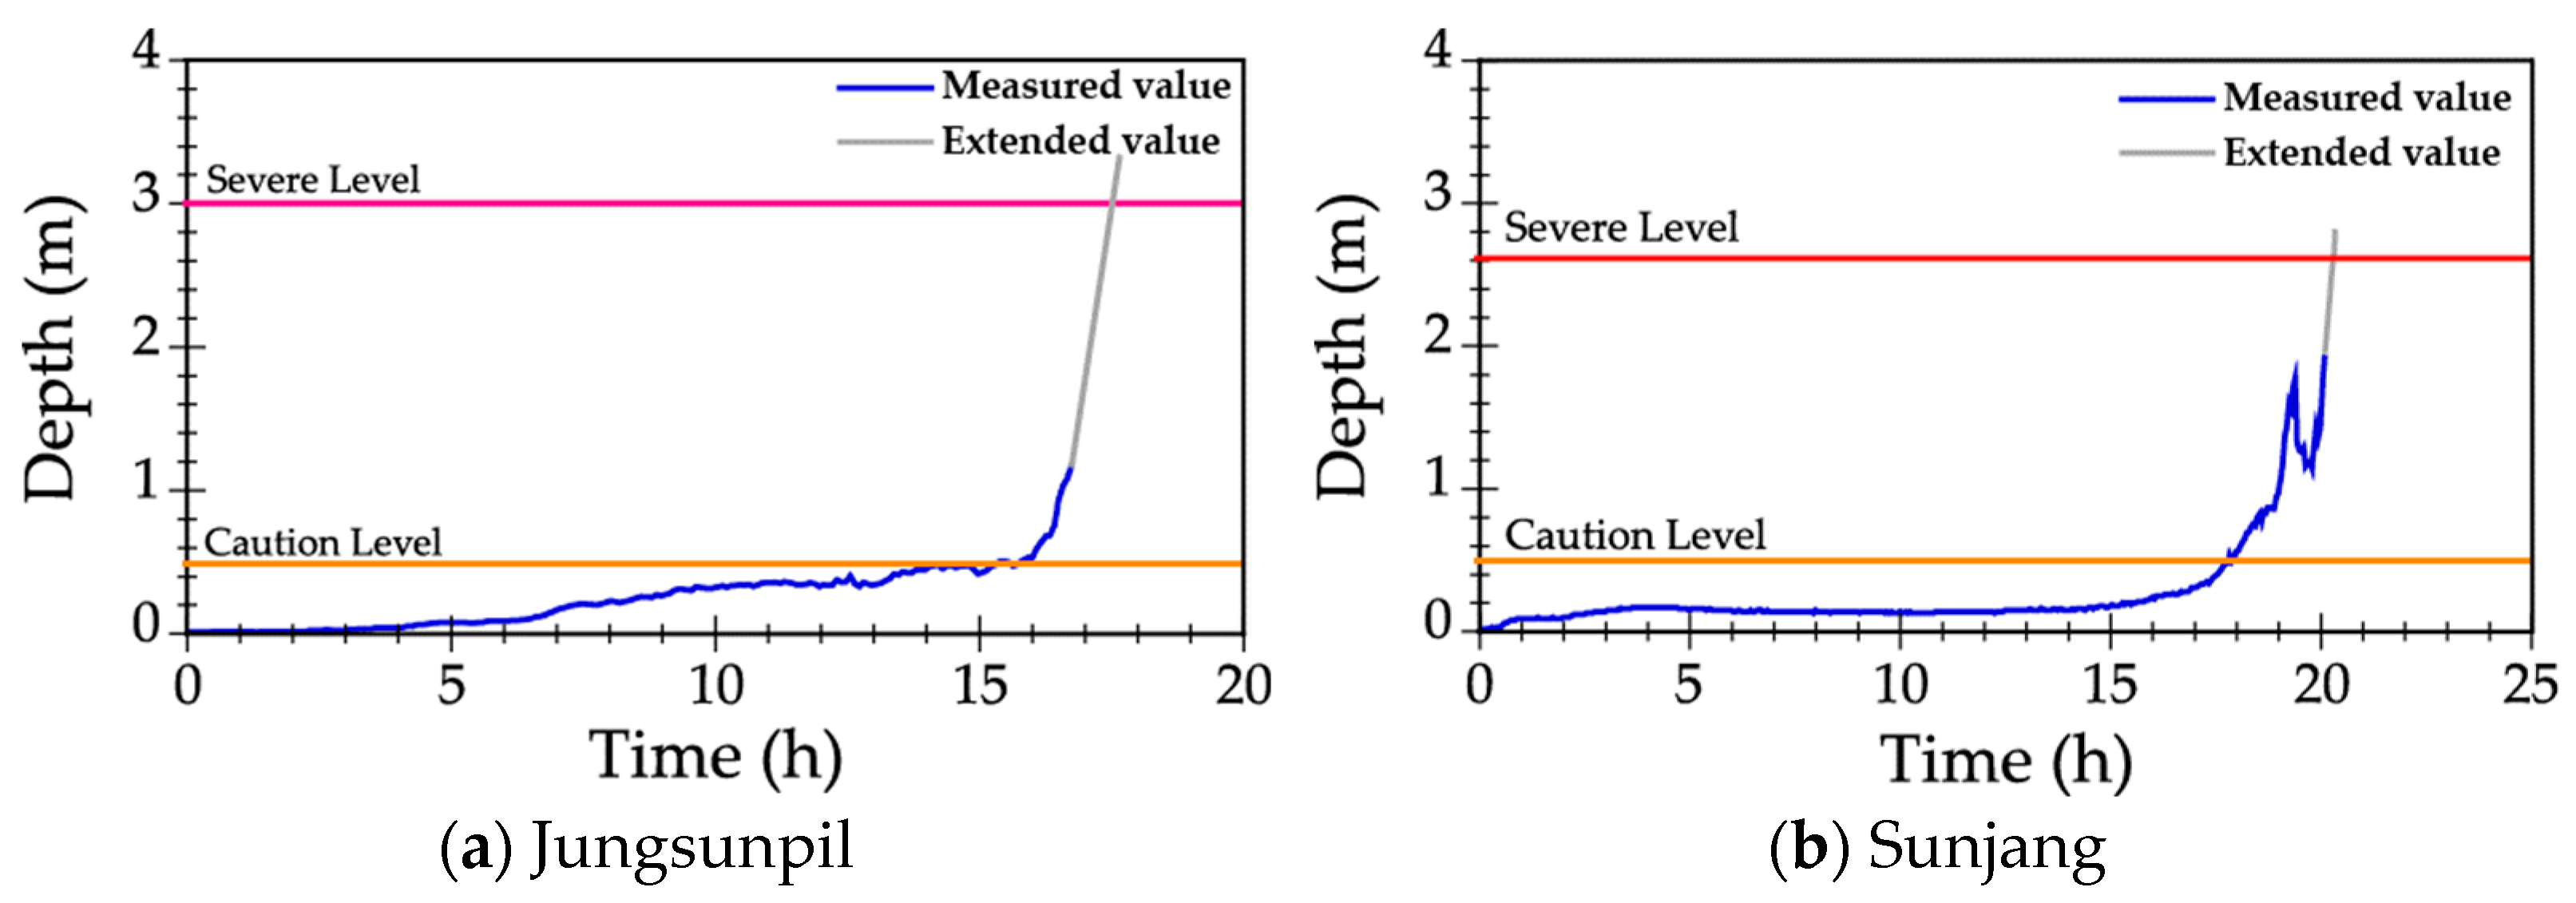
The small stream flood warning system in Korea includes two levels of warning criteria: the caution level and the severe level, as illustrated in Figure 7. The caution level warning is issued when the forecasted depth exceeds 0.5 m (knee height of an adult), as this depth is considered hazardous for people to access small streams due to the risk of being swept away by fast-flowing water. The caution level was determined based on stability conditions derived from experiments conducted by various researchers, which considered the correlation between depths, velocities, and human physical strength [25,26,27,28,29,30,31,32].
The severe level warning is issued when the forecasted depth reaches the designed flood depth in order to evacuate people from the hazard area. As shown in Figure 7, the depth increased rapidly after reaching the caution level in both small streams, and a severe level warning was issued within 2 or 3 h. The increase in depth of the Jungsunpil stream was much steeper, which can be attributed to the narrower width of the stream channel and the steeper slope of the channel compared to the Sunjang stream.
3.2. Development of the Rainfall-Discharge Nomograph
Real-time rainfall data from the rainfall gauging station listed in Table 2 and depth and discharge data collected using the CADMT in 5 small stream basins were utilized over 6-years from 2016 to 2021 to develop and evaluate the FEWF. Specifically, rainfall, depth, and discharge data collected from 2016 to 2020 were used to develop the FEWF, while data from 2021 flood events that occurred above the warning level were used to evaluate them. Table 3 summarizes the measured rainfall, depth, and discharge data from five small stream basins over 6 years.
In this research, the well-known rainfall-discharge nomograph was utilized, which forecasts discharge by employing the correlation equation between past rainfall and past discharge data [33,34,35,36]. To develop the rainfall-discharge nomograph for the measured small stream, the research utilized non-linear regression to establish an exponential function which includes optimal parameters estimated through the use of the RCNES, as follows:
in which is the discharge, is rainfall accumulated for 1 h, and and are the optimum parameters. To develop this nomograph, rainfall data measured at the rainfall gauging station listed in Table 2 and flood discharge data measured using the CADMT over 5 years (2016–2020) and summarized in Table 3 were used. The annual rainfalls measured in the small streams ranged from 1180 mm to 1588 mm, with most rainfall concentrated in the summer season from June to September. For the un-measured small streams, the rainfall-discharge nomograph was developed using measured rainfall data and simulated flood discharges obtained using hydrology and hydraulics models [37,38,39].
To forecast discharges accurately, the research incorporated Antecedent Moisture Condition (AMC) [40,41], which takes into account the initial water content and 5-day antecedent rainfall. AMC leads to three classes of soil moisture (AMC I, II, and III) shown in Table 4 by dividing a year into dormant and growing seasons. In this case, the growing season was defined as the flood season specified in the water resources design practice [19,42], from 21 June to 20 September, when flood damages were likely to occur in Korea.
In this research, the measured rainfall and discharge in 5 small stream basins were subdivided into three subsets, each corresponding to the distinct Antecedent Moisture Condition (AMC) class, to consider the different initial soil moisture conditions. The corresponding rainfall and discharge time series were sorted into the relevant AMC classes based on the corresponding AMC values. Three types of rainfall-discharge nomographs were developed using three grouped rainfall events and discharges, each corresponding to a different AMC class. A total of 166 rainfall-discharge events were collected over 6 years, from 2016 to 2021, with 84 events in the AMC I class, 59 events in the AMC II class, and 23 events in the AMC III class. The largest rainfall-discharge events data were gathered in the Neungmac stream with 49, followed by the Sunjang stream with 39, the Jungsunpil stream with 29, the Unchon stream with 27, and the Insu stream with 22.
To develop the rainfall-discharge nomograph, the parameters shown in Equation (10) were estimated using the RCNES. The determined optimal values were summarized in Table 5, which showed that the coefficients of determination ranged from 0.899 to 0.966 for AMC I, 0.756 to 0.974 for AMC II, and 0.815 to 0.933 for AMC III. Table 5 also demonstrated that the coefficients of determination ranged from 0.286 for the Insu stream to 0.523 for both Sunjang and Unchon streams for the entire data column, indicating that the whole data were utilized for developing the rainfall-discharge nomograph.
Table 6 summarizes the event numbers and ranges of the discharge and rainfall used to develop the rainfall-discharge nomographs for each small stream. The research used a total of 67, 43, 59, 55, and 60 separate rainfall-discharge data sets obtained from the total 166 rainfall events for Jungsunpil, Sunjang, Unchon, Neungmac, and Insu streams, respectively.
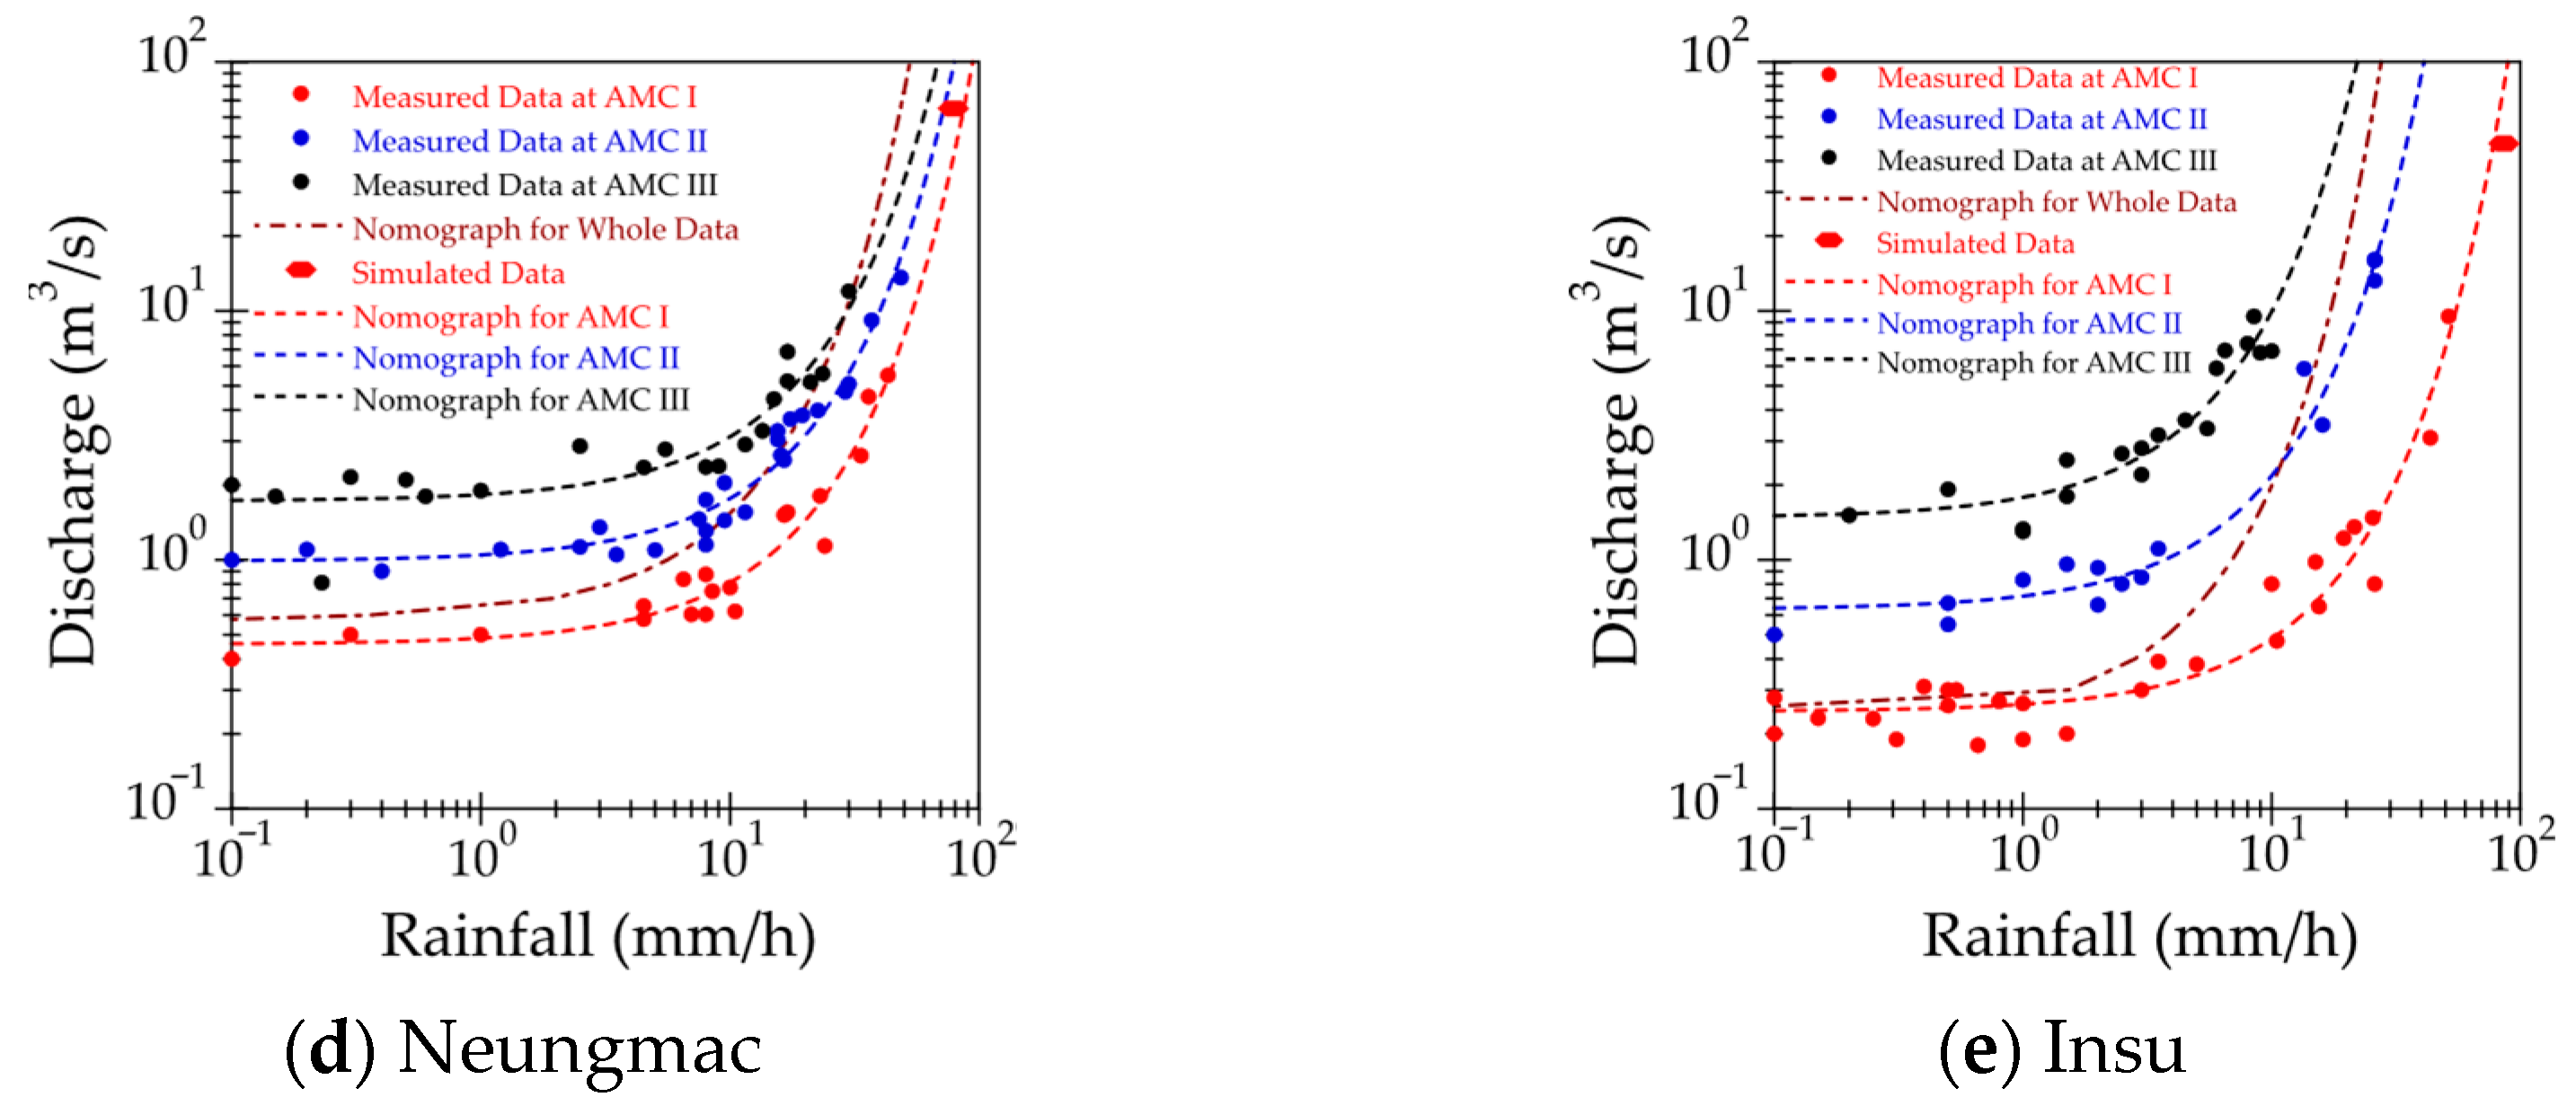
To compare the accuracy of the rainfall-discharge nomographs, scatter plots were created using the measured data from five small streams, as shown in Figure 8. In addition, design flood discharge data was simulated using the Clark Unit Hydrograph model and measured rainfall data. This simulated data was also plotted to evaluate the effectiveness of the developed rainfall-discharge nomograph in unmeasured small streams. The results of the simulated design flood discharge that caused flooding in each small stream basin were as follows: 66.1 m3/s for the Jungsunpil stream, 274 m3/s for the Sunjang stream, 117 m3/s for the Unchon stream, 78.7 m3/s for the Neungmac stream, and 85.9 m3/s for the Insu stream, respectively. Comparison of the forecasted discharge values using the nomographs with both the CADMT and simulated flood discharge values showed that the nomographs accurately matched the measured and simulated data. These results suggest that the rainfall-discharge nomograph can effectively forecast discharge in both measured and unmeasured small streams.
3.3. Development of the Rating Curve
A rating curve using the Manning equation was developed in this research, which is commonly used to establish the relationship between depth and discharge at the cross-section [43]. The Manning equation reflects the relationship among the average river velocity, riverbed roughness coefficient, and channel geometry, such as channel slope, cross-section, and sinuosity, which are collected from rivers and streams [44,45,46]. To account for variations in flow velocities in the compound cross-section, the section is generally divided into selected subsections, and the area values of the cross-section, wetted perimeter, and hydraulic radius of each subsection are measured. The equation for calculating the gauging section depends on the assumption that the hydraulic gradient of each subsection is the same [45] as follows:
in which is the area of the th subsection, is the hydraulic radius of the th subsection, and is the coefficient of the roughness of the th cross-section. The rating curve is then plotted to represent the relationship between depth and discharge at the gauging section. The Manning equation has the advantage of being applicable even to unmeasured streams without measured hydraulic data.
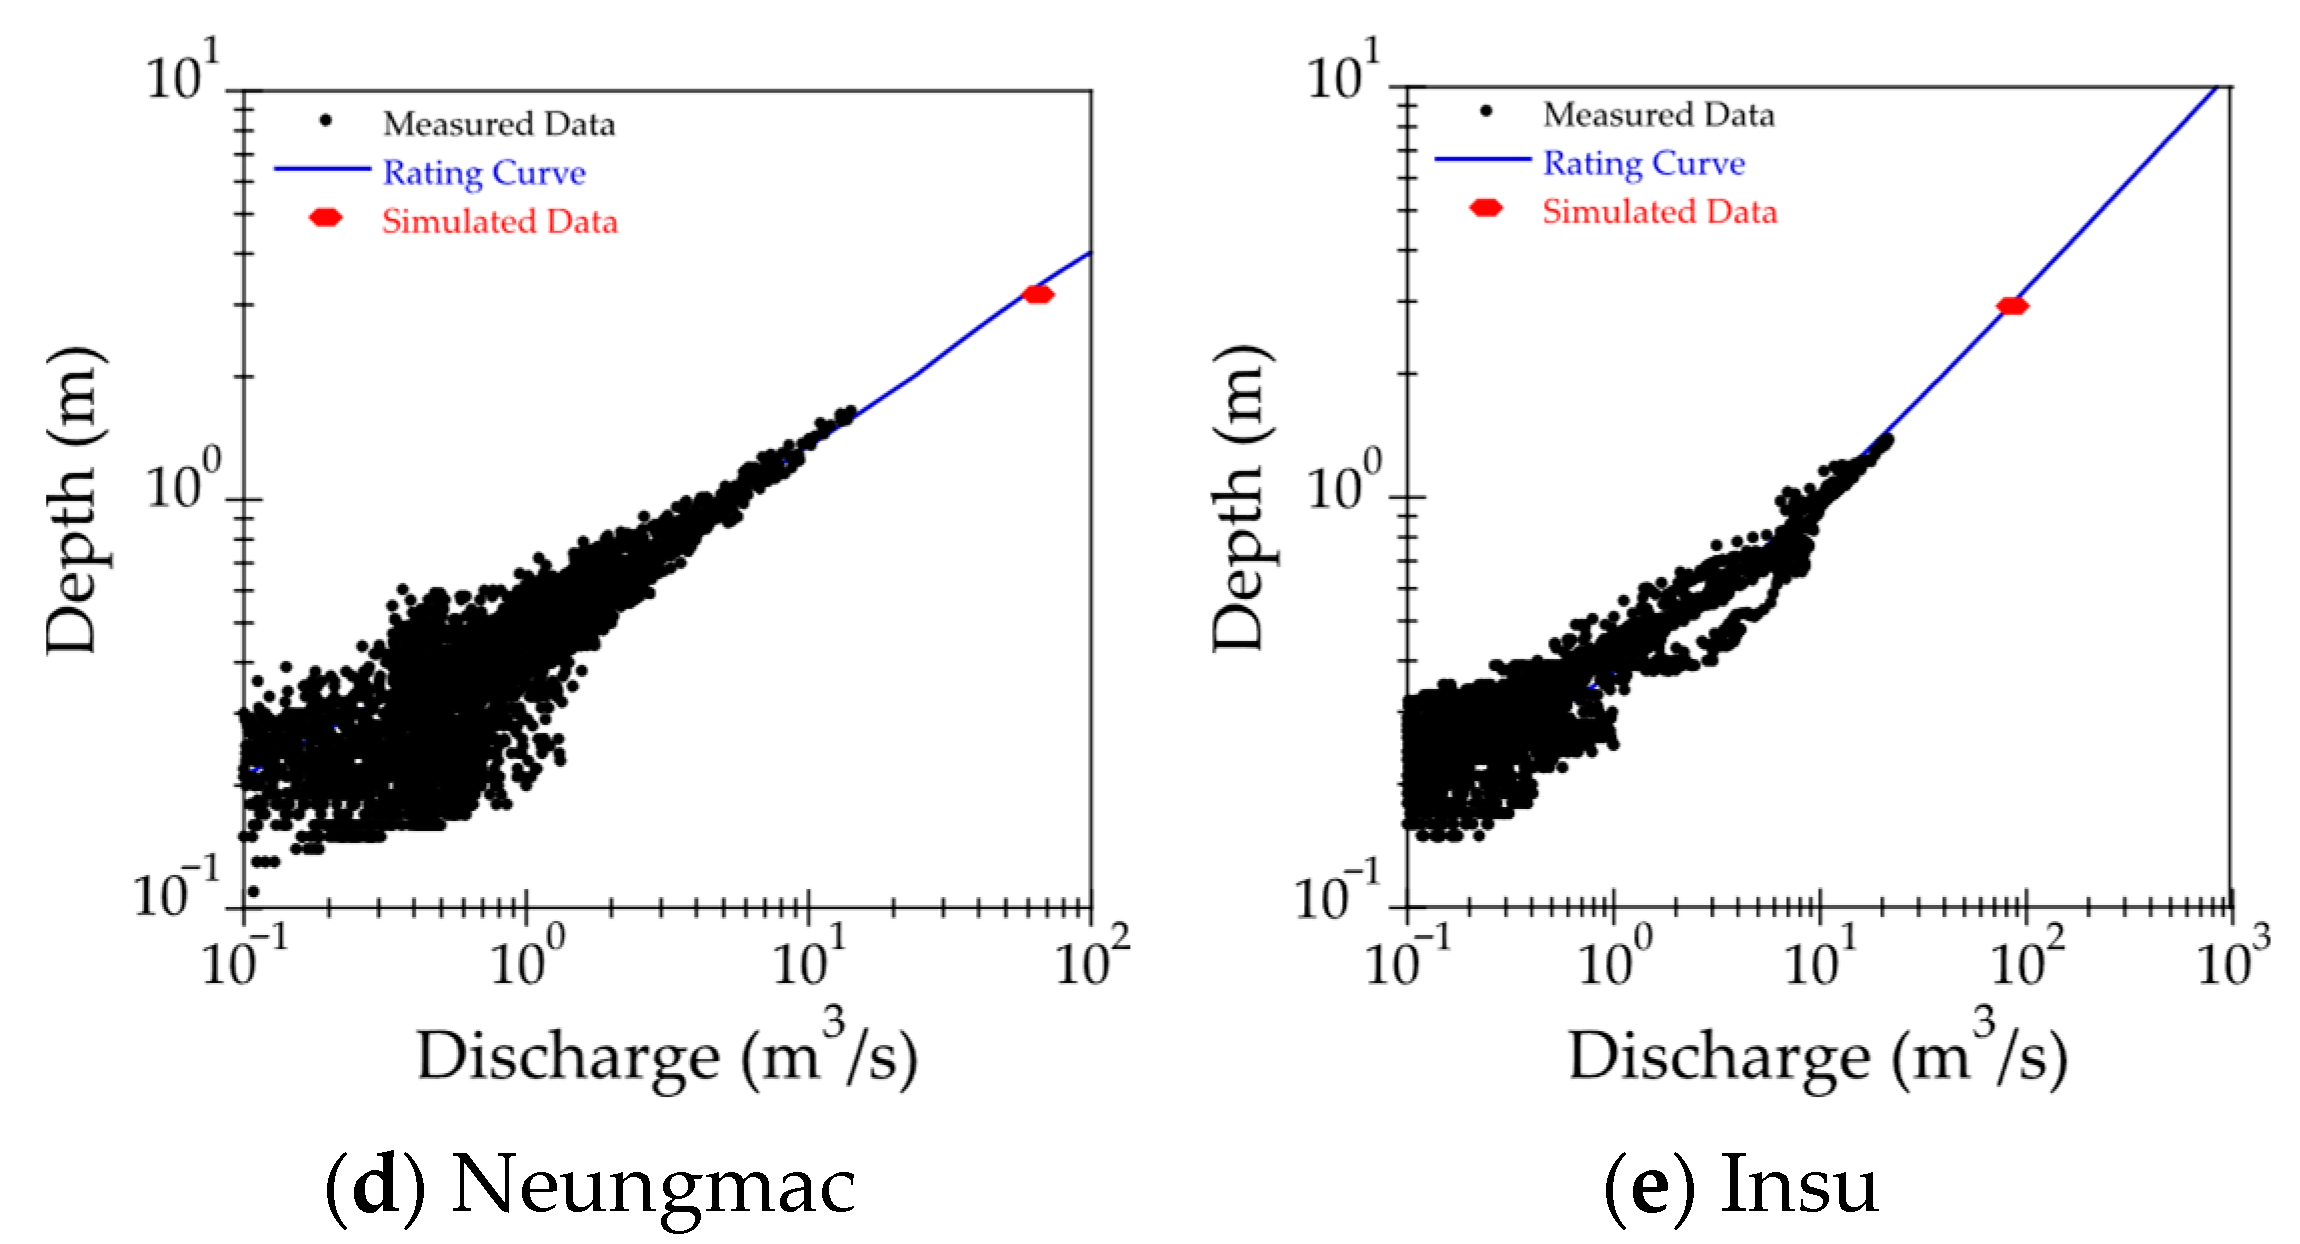
The developed rating curve was plotted to compare with the measured scatter data in Figure 9. The study used measured data collected from 5 small streams listed in Table 3 to compare rating curves developed using the Manning equation. Additionally, the design flood depth was calculated using Equation (11) with the simulated design flood discharge as an input value for the Manning equation and plotted in Figure 9. The results of the calculated design flood depths were 3.18 m for Jungsunpil stream, 2.55 m for Sunjang stream, 2.86 m for Unchon stream, 2.93 m for Neungmac stream, and 3.03 m for Insu stream, respectively.
Figure 9 shows that the rating curve developed using the Manning equation accurately represents the measured and simulated data from five small streams. Therefore, this rating curve can be effectively used to forecast depth with discharge in both measured and unmeasured small streams. The comparison results demonstrated that the depth forecasted by the rating curves closely matched the CADMT values. The coefficient of determination values for the Jungsunpil stream, the Sunjang stream, the Unchon stream, the Neungmac stream, and the Insu stream were 0.88, 0.83, 0.83, 0.92, and 0.95, respectively. Among the rating curves analyzed, the coefficient of determination for the Insu stream was the highest.
To quantitatively evaluate the differences between the measured and forecasted values, the researchers used the discrepancy ratio, as defined by [47], in which is the forecasted values of depth and is the measured values of depth. A discrepancy ratio of zero indicates that the forecasted values were identical to the measured values. A positive discrepancy ratio indicates that the forecasted values overestimate the measured values, while a negative ratio indicates that the forecasted values underestimate them. Additionally, the research utilized accuracy, defined as the proportion for which the discrepancy ratio fell between −0.2 and 0.2, to the total amount of data.
The Neungmac, Sunjang, Unchon, Insu, and Jungsunpil small streams were evaluated using rating curves to estimate their measured values, as shown in Figure 10. The rating curve for Jungsunpil overestimated the measured values, while the rating curves for Neungmac, Sunjang, Unchon, and Insu underestimated the measured values. The distribution of discrepancy ratio for Jungsunpil showed that the majority of the values were distributed between −0.1 and 0.3. The discrepancy ratio distribution for Unchon had a bell-shaped curve, indicating that the majority of the values were distributed in the range between −0.2 and 0.2. The accuracy of the rating curves for Jungsunpil, Sunjang, Unchon, Neungmac, and Insu was found to be 90.3%, 84.3%, 93.0%, 76.2%, and 85.4%, respectively. Among the rating curves examined, the curve developed for the Unchon small stream showed the highest accuracy, while the curve for the Sunjang small stream showed the lowest accuracy.
4. Results of the Evaluation and Discussion
4.1. Evaluation of the FEWF
To evaluate the FEWF, the time-discharge and time-depth distributions forecasted by the rainfall-discharge nomographs and rating curves were compared, respectively, with measured discharge and depth data in 2021 for 5 small streams that were not used in the development of the nomographs and rating curves.
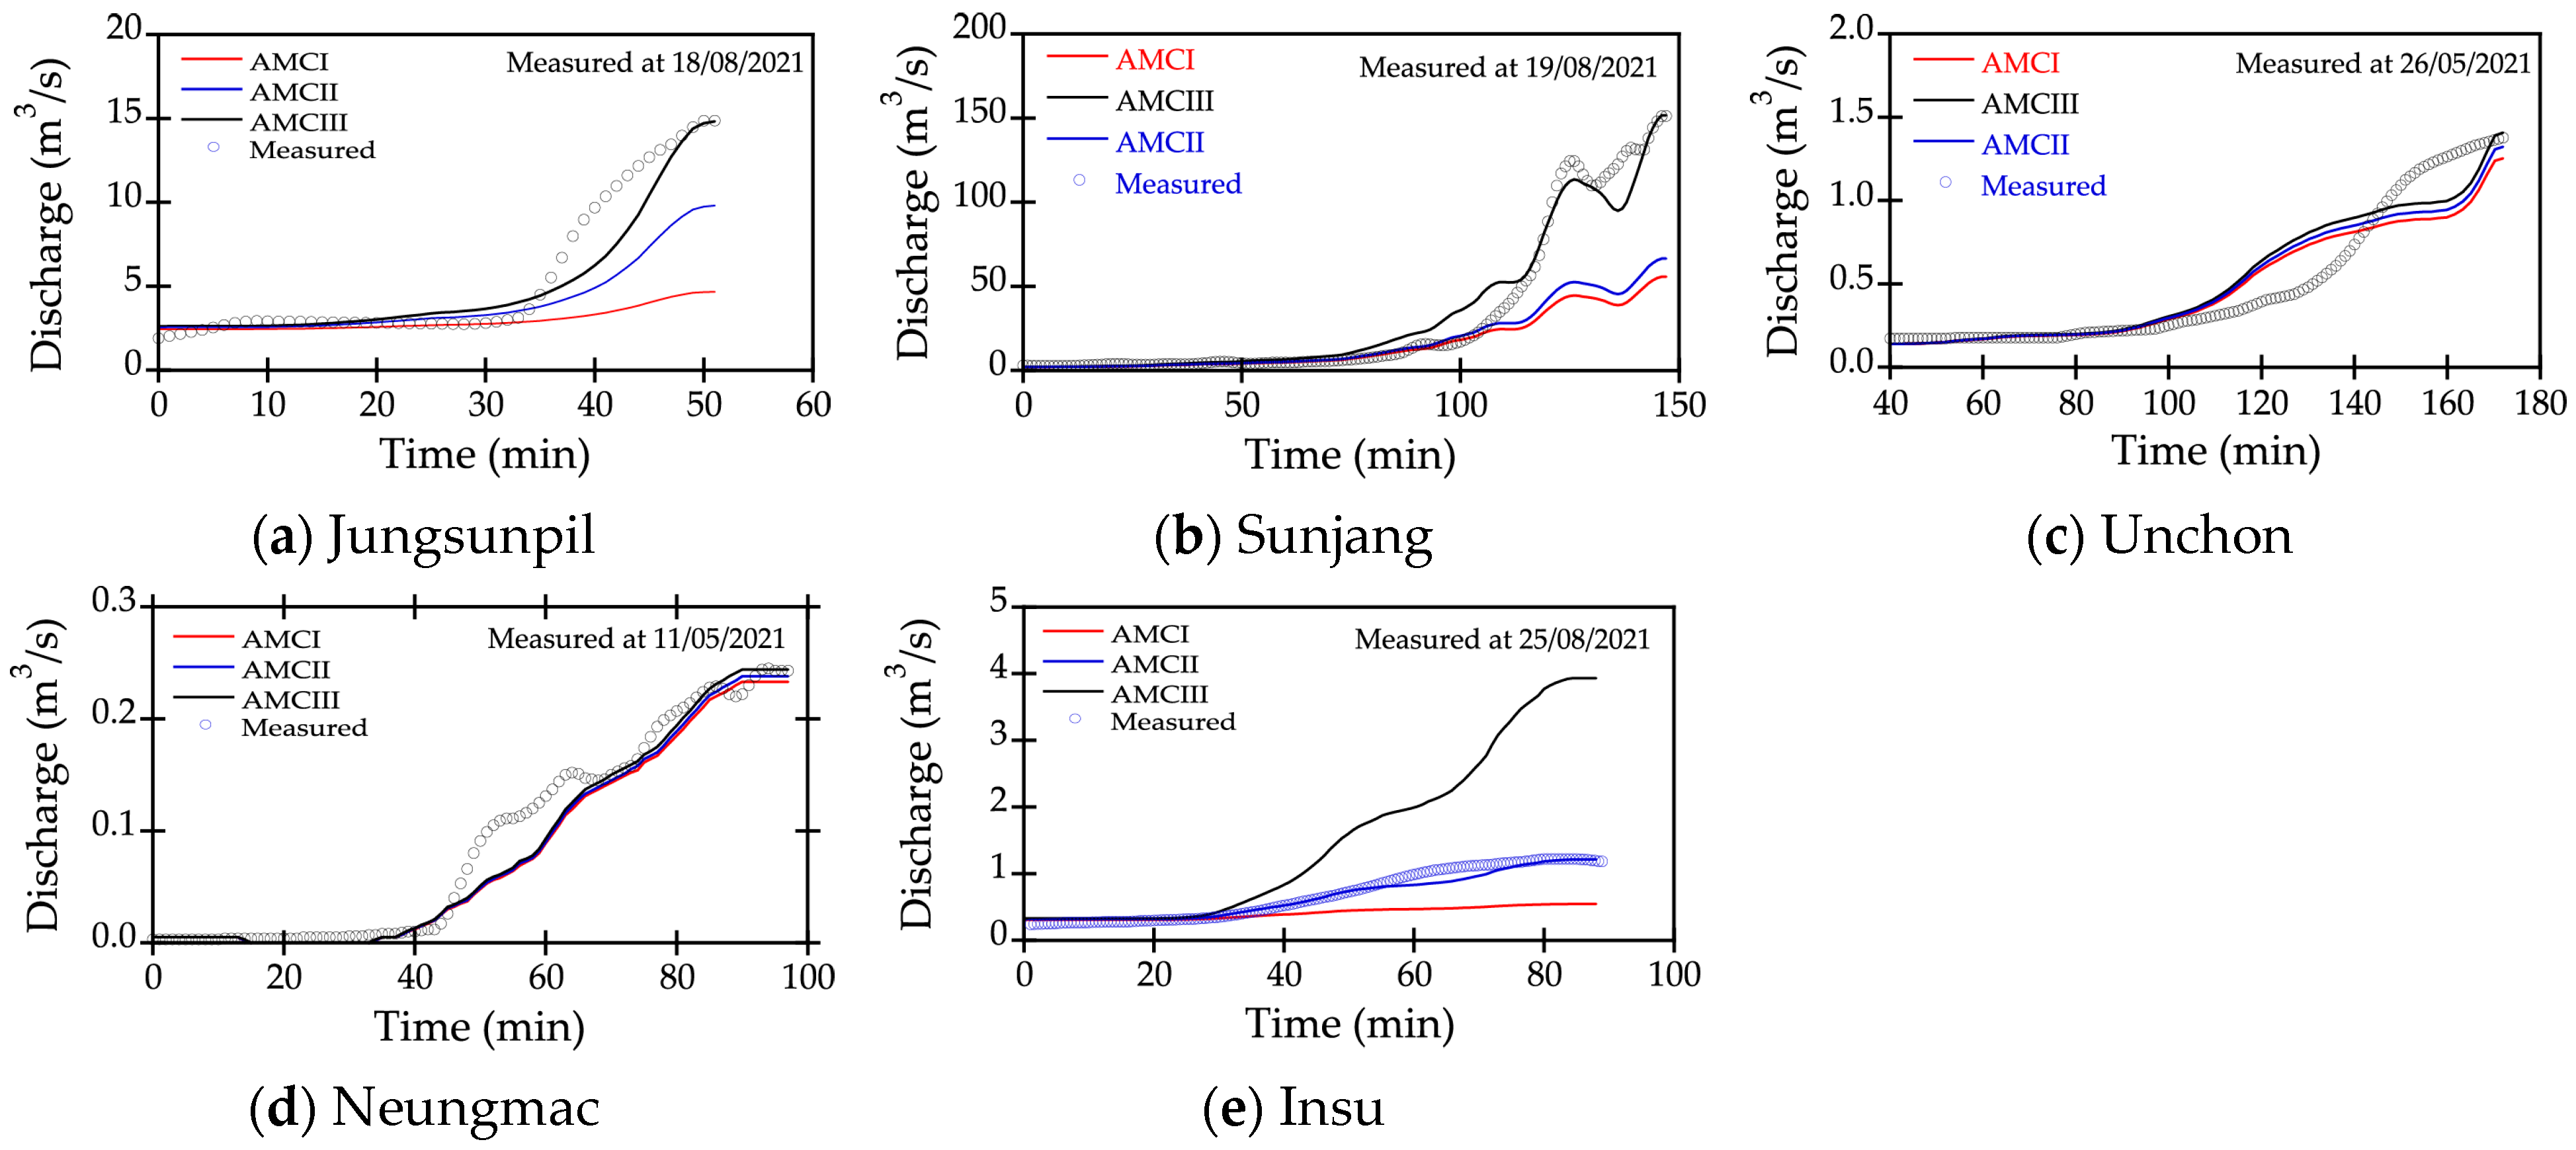
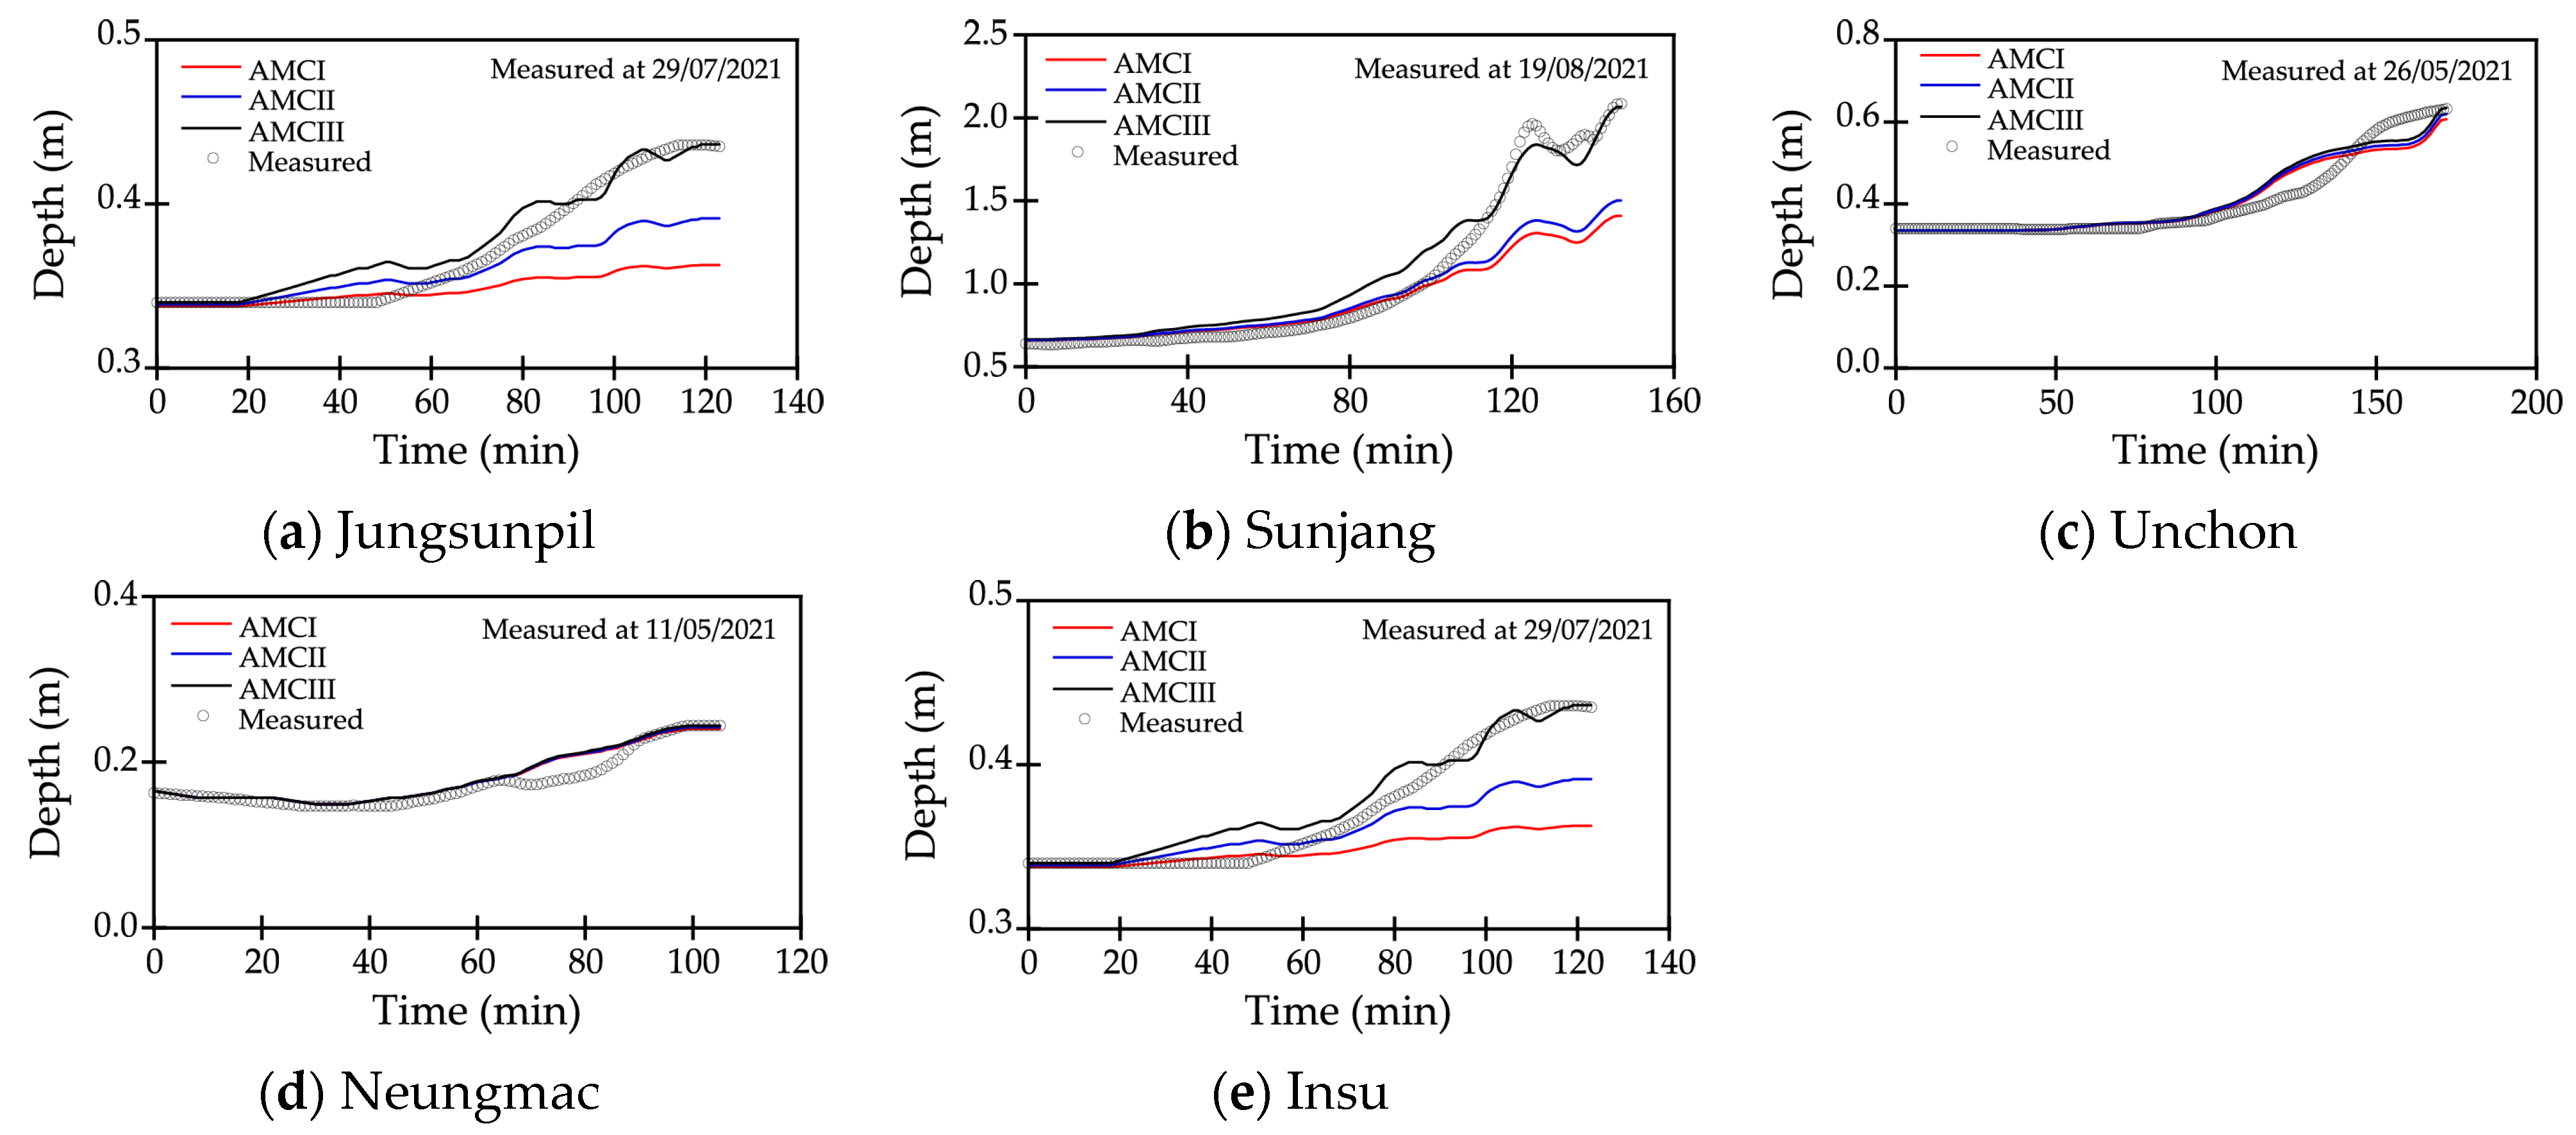
Figure 11 and Figure 12 showed part of the validation of flood events for each AMC class of the forecasted time-discharge and depth distributions compared to the measured data. Most of the rainfall events used for the evaluations occurred during the flood season from 21 June to 20 September. However, in the case of the Neungmac and Unchon streams, rainfall events occurred in February for the AMC I class and in May for the AMC III class. The rising curve to the peak of the time-discharge and depth distributions was considered for verification because the rising parts, especially the peaks, are relevant for issuing flood early warnings.
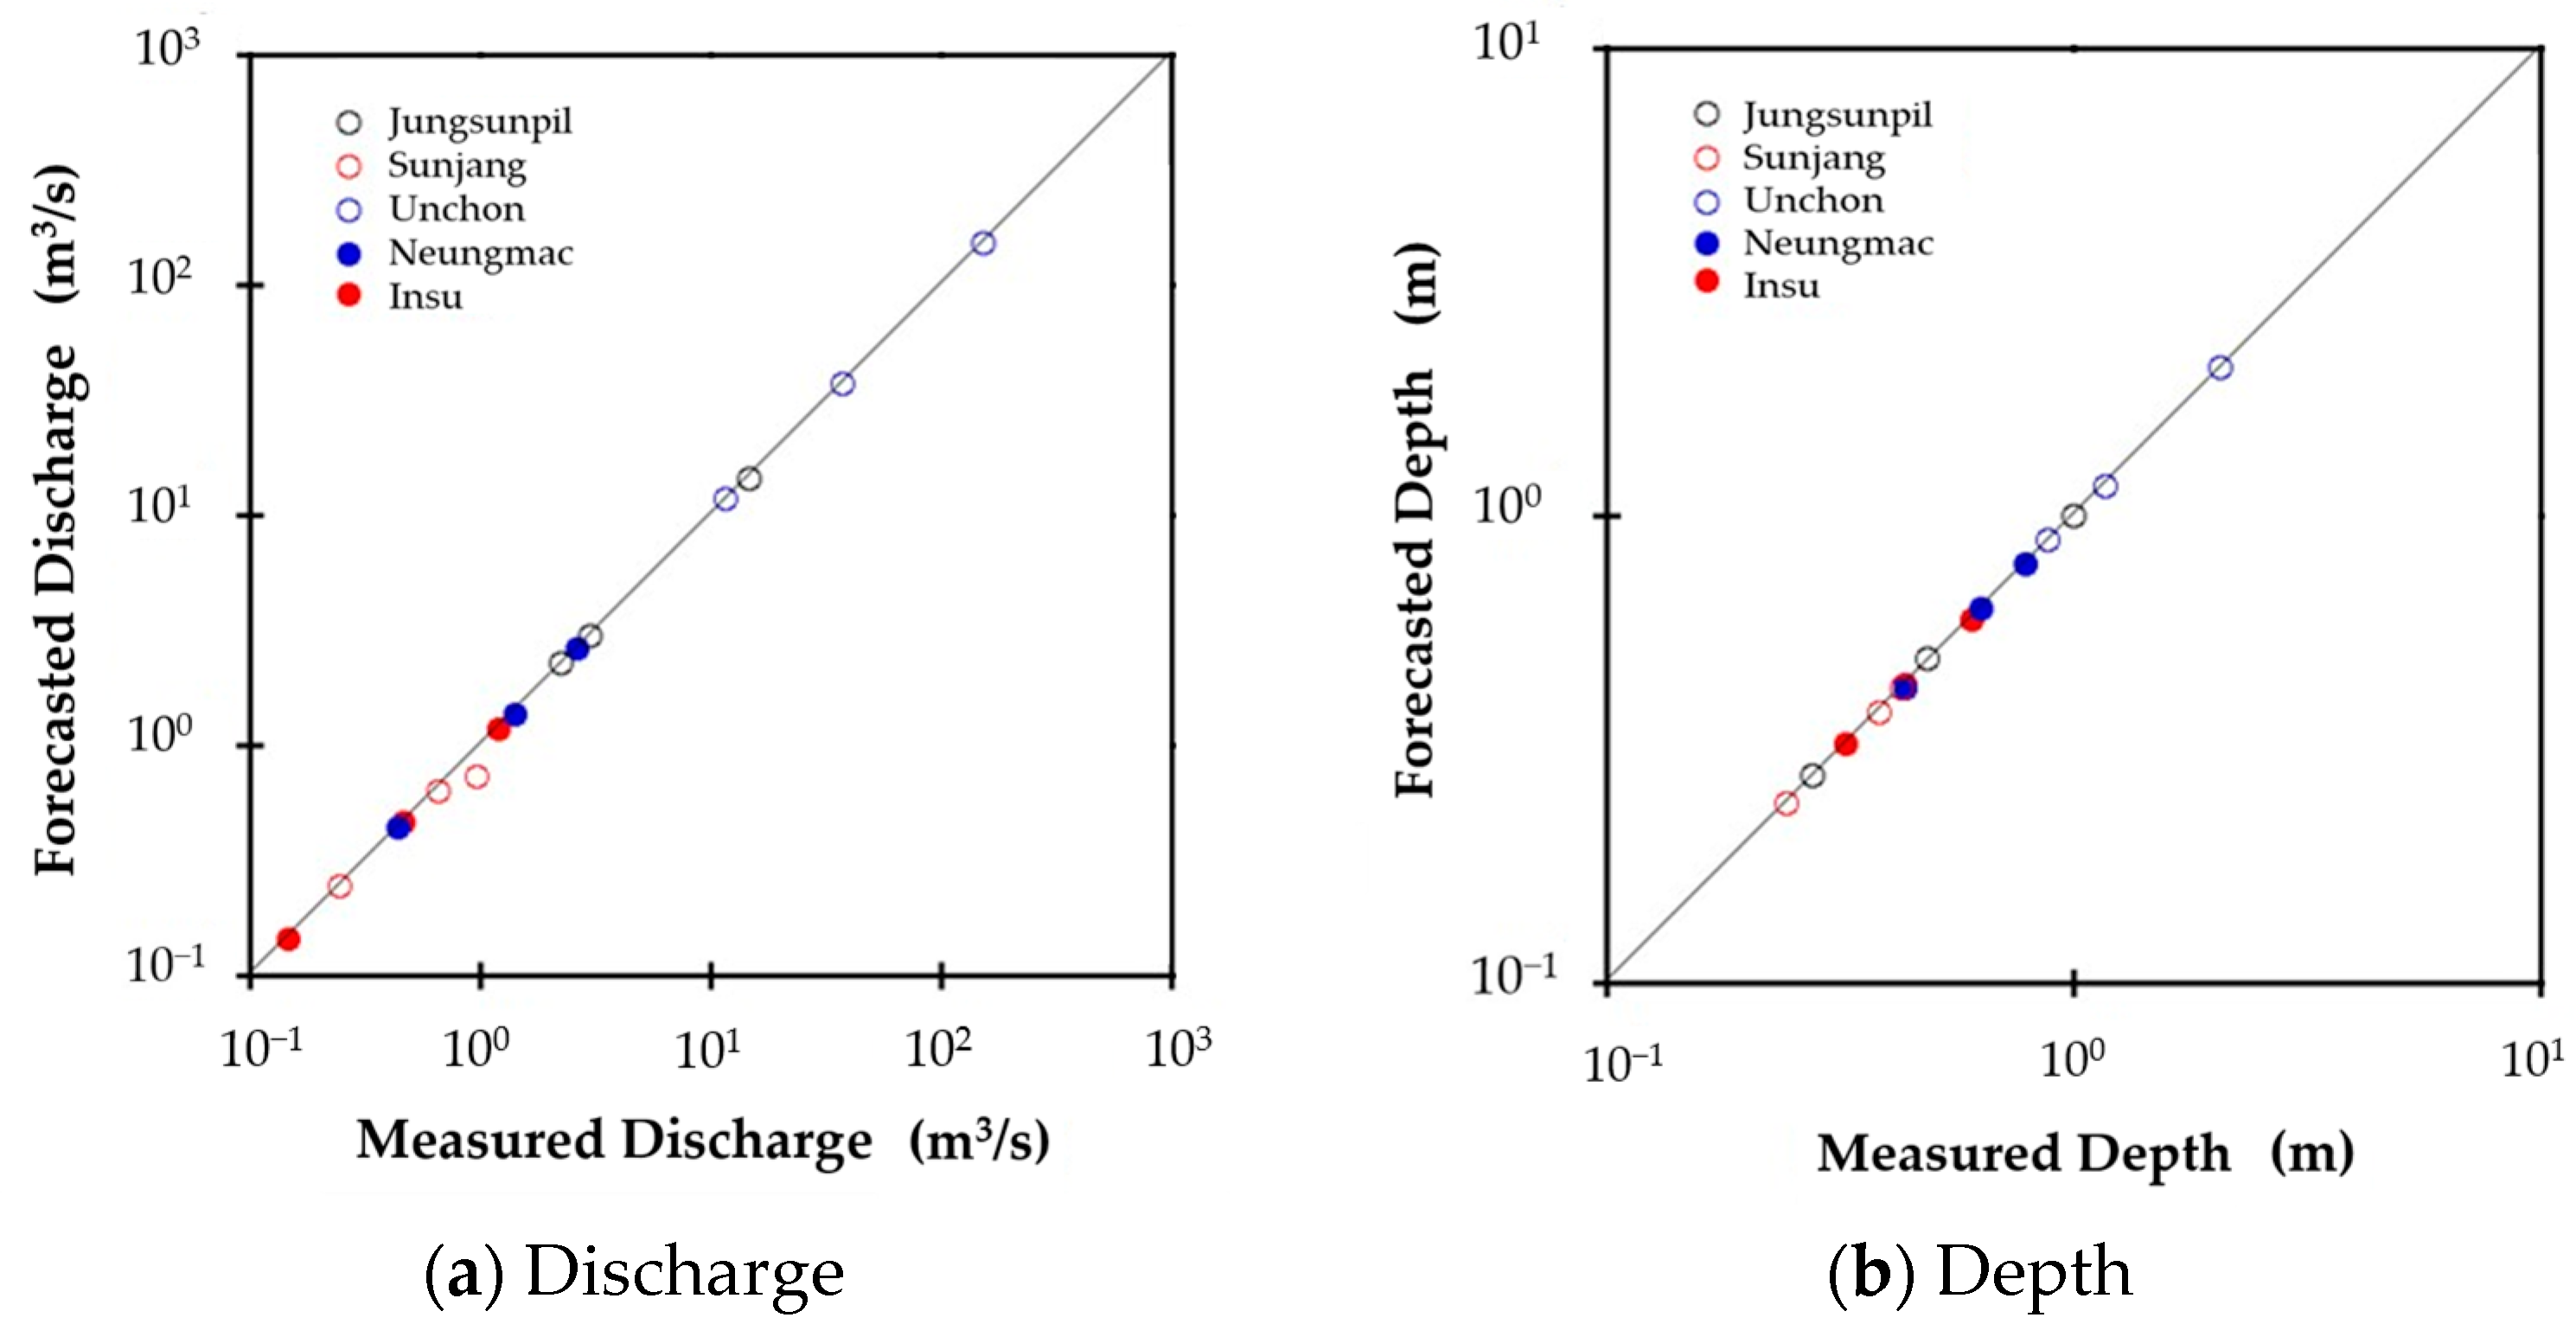
A quantitative evaluation of the forecasted peak discharge and depth values from the FEWF was conducted by comparing them to the measured data, as shown in Figure 13. The results showed that the peak discharge and depth forecasted using the proposed rainfall-discharge nomograph and rating curve accurately represented the observed values for 5 small streams. However, the forecasted depth values matched the measured values better than the forecasted discharge values. The high accuracy of the depth forecasting increased the reliability of the FEWF because early flood warning is issued based on forecasting depth values.
The coefficient of determination, was utilized to further evaluate the results, as shown in Table 7. The forecasted discharge results revealed that the Jungsunpill, Neungmac, and Unchon streams had the highest in the AMC I, AMC II, and AMC III classes, respectively. On the other hand, the depth forecasting results showed that the Jungsunpil and Unchon streams had the highest in the AMC I class, the Neungmac small stream had the highest in the AMC II class, and the Sunjang and Insu small streams had the highest in the AMC III class, respectively. The inter-comparison results indicated that the depth results forecasted by the rating curves more accurately matched the discharge results forecasted by the rainfall-discharge nomograph.
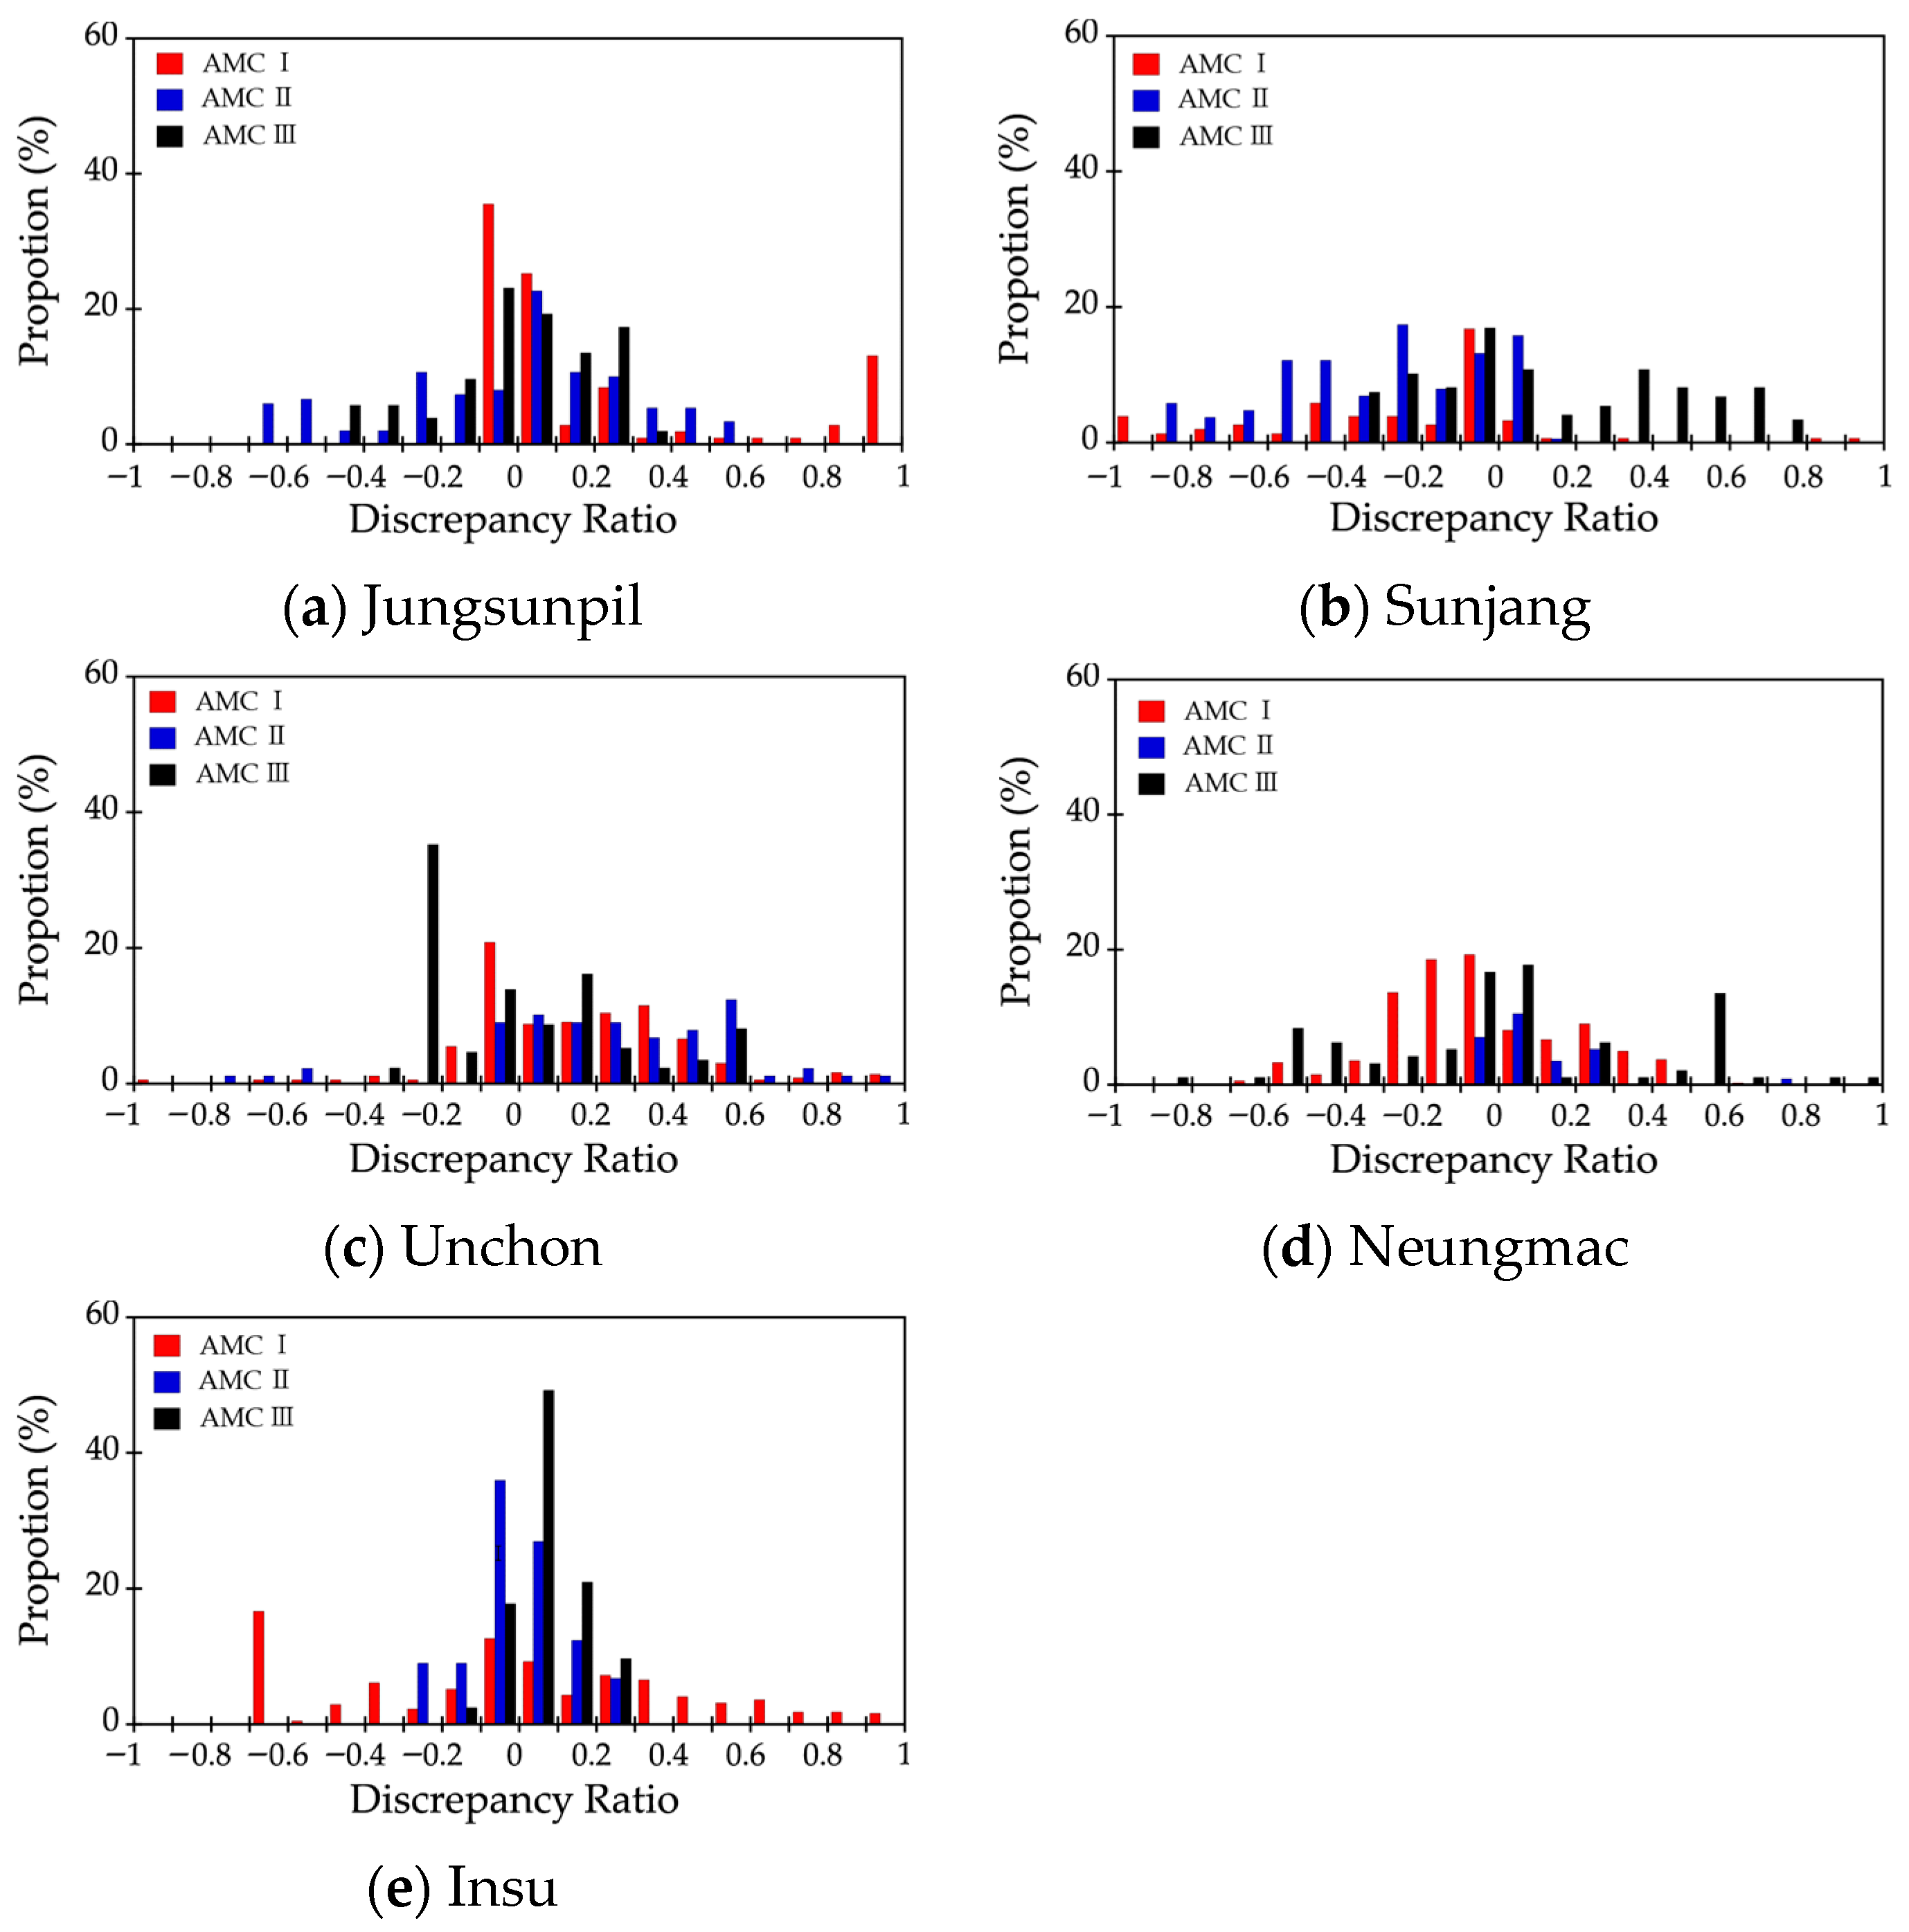
To quantitatively evaluate the difference between measured and forecasted discharge and depth values, we used the discrepancy ratio. Figure 14 shows the discrepancy ratio histograms of discharges forecasted by using the rainfall-discharge nomograph for each small stream. For the AMC I class, the rainfall-discharge nomograph of the Jungsunpil, Neungmac, Sunjang, and Unchon streams underestimated the measured values, while it overestimated the measured values of the Insu stream. For the AMC II class, the rainfall-discharge nomograph of the Jungsunpil, Neungmac, and Unchon streams overestimated the measured values, while it underestimated the measured values of the Sunjang and Insu streams. For the AMC III class, the rainfall-discharge nomograph of the Neungmac, Sunjang, and Insu streams overestimated the measured values, while it underestimated the measured values of the Jungsunpil and Unchon streams.
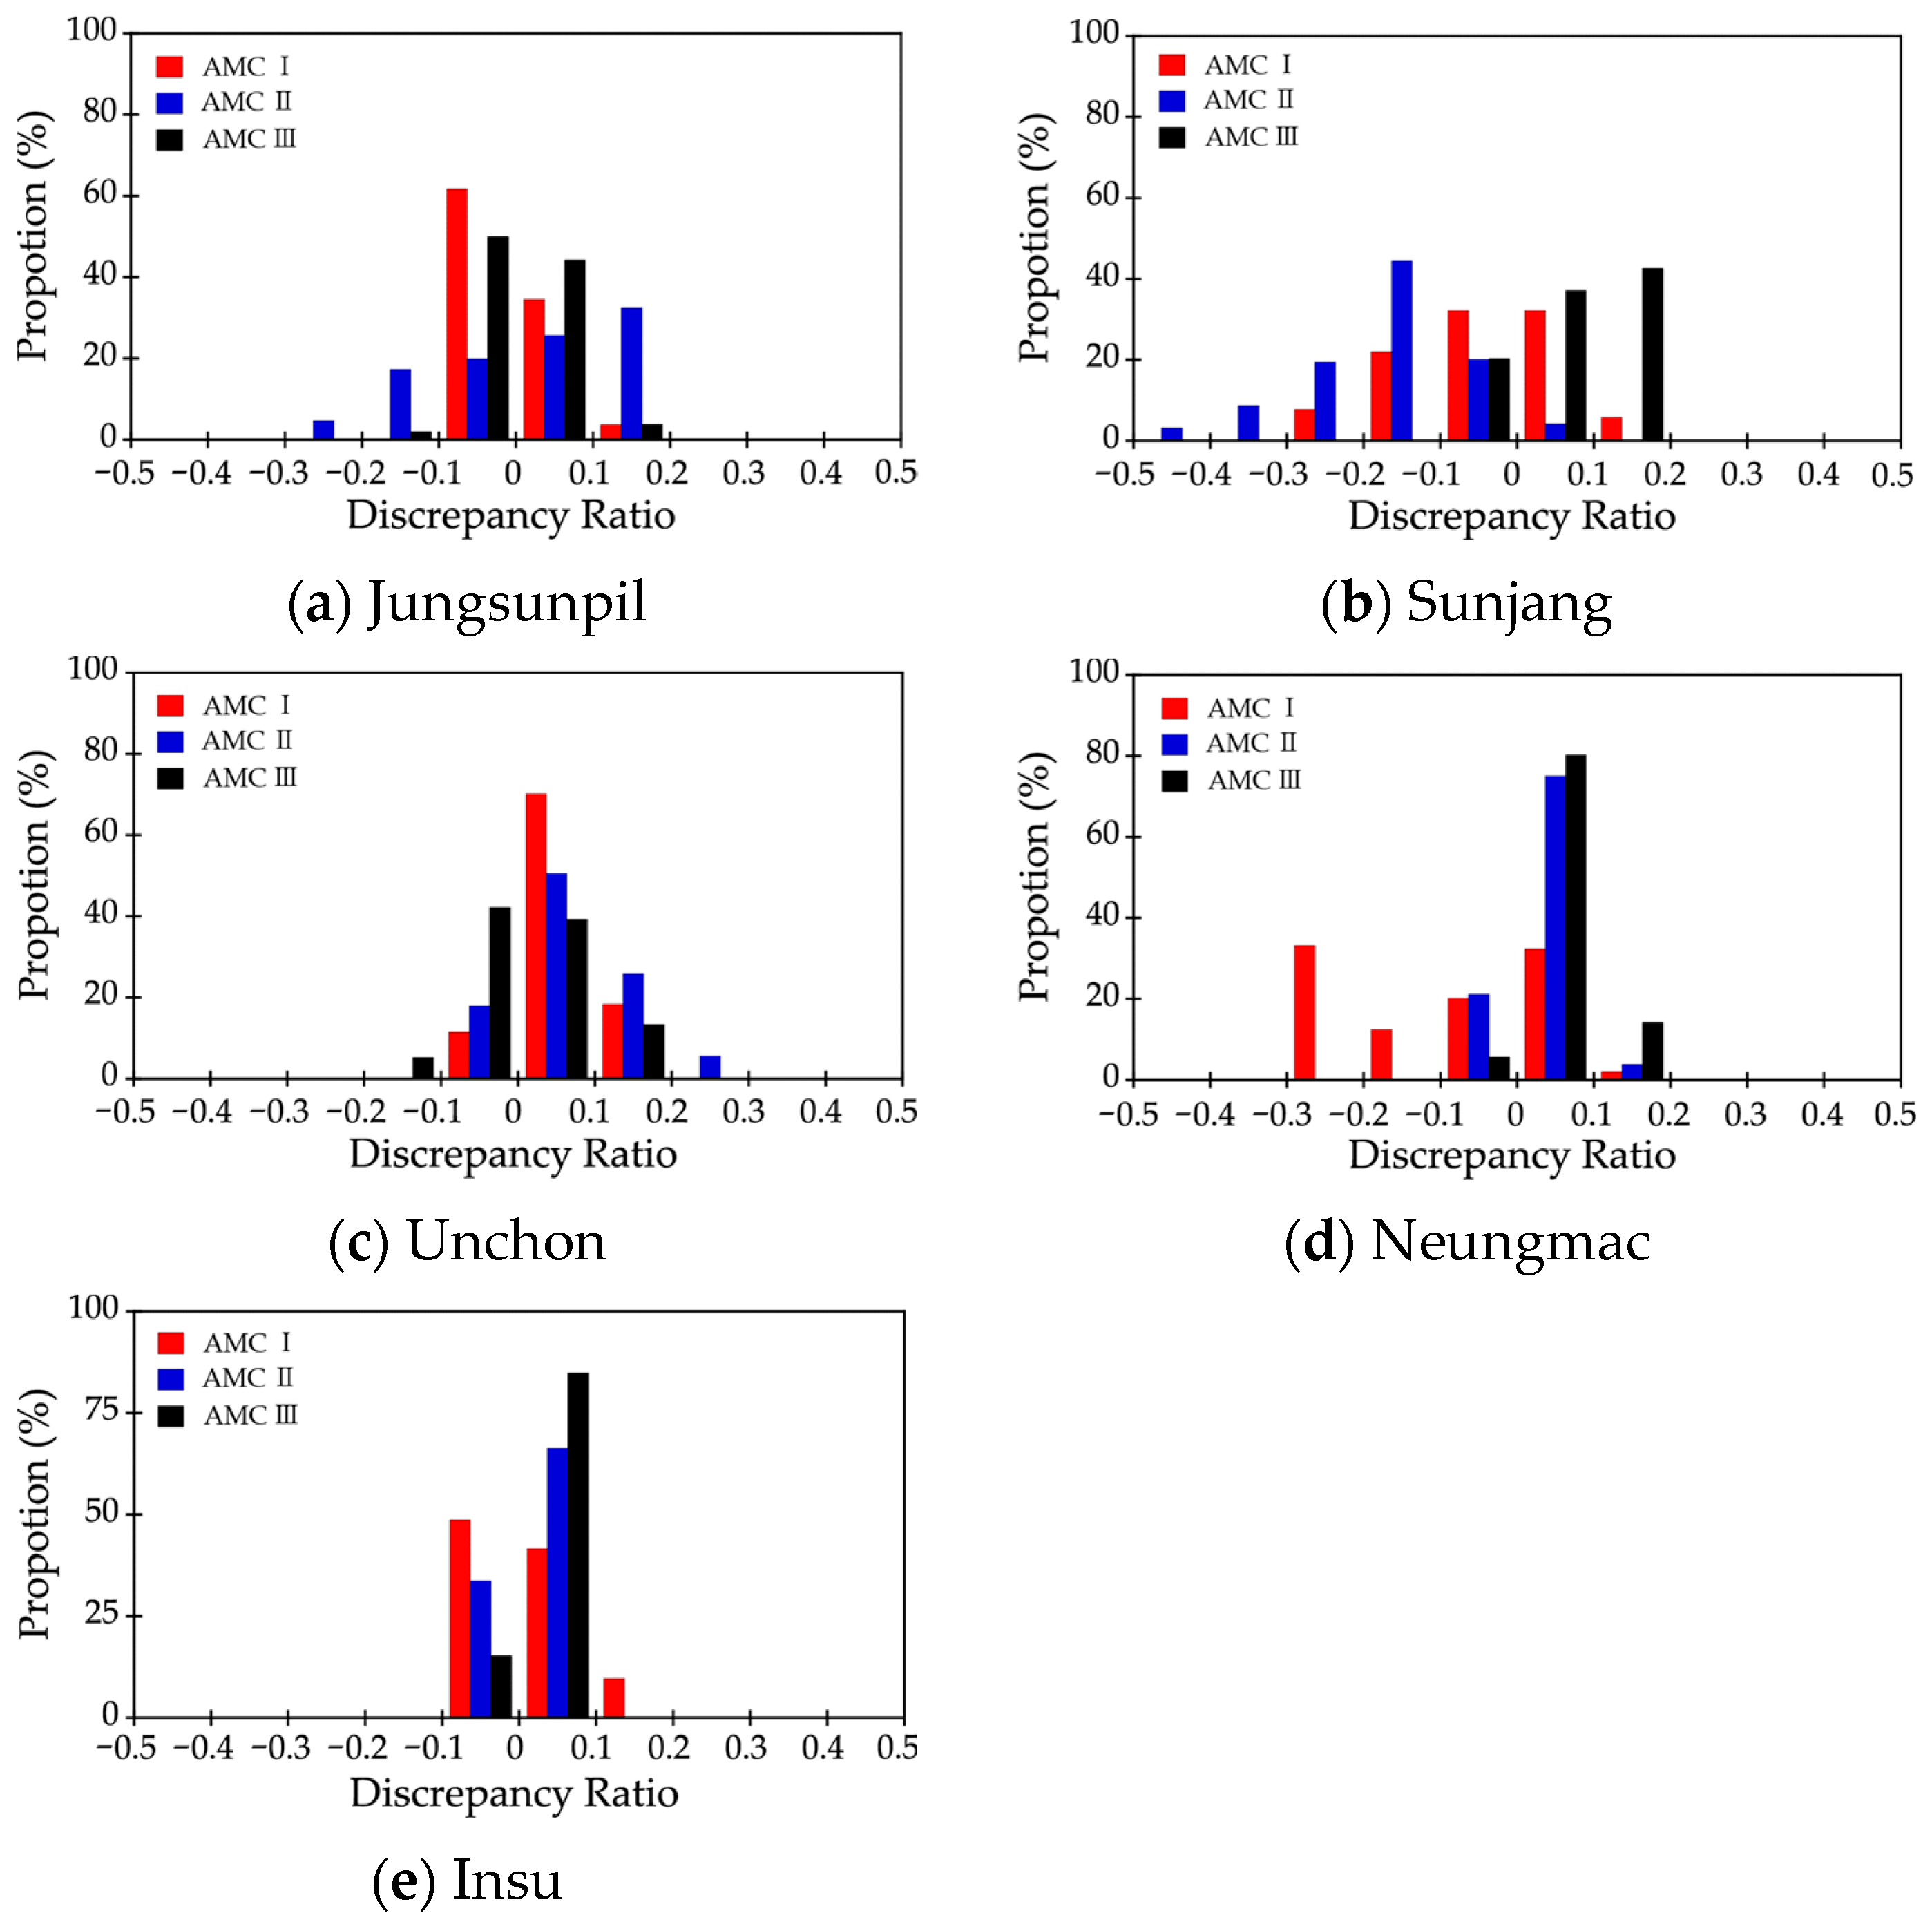
Figure 15 shows the discrepancy ratio histograms of depth forecasts generated by the rating curves for each of the five small streams. In the case of the AMC I class, the rating curves of the Jungsunpil, Neungmac, Sunjang, and Insu streams underestimated the measured values, while that of the Unchon stream overestimated them. Conversely, for the AMC II class, the rainfall-discharge nomograph of the Jungsunpil, Neungmac, Unchon, and Insu streams overestimated the measured values, while that of the Sunjang stream underestimated them. Finally, for the AMC III class, the rainfall-discharge nomographs of the Neungmac, Sunjang, and Insu streams overestimated the measured values, while those of the Jungsunpil and Unchon streams underestimated them.
The accuracy of the rainfall-discharge nomographs and rating curves for each small stream, based on the forecasted discharge and depth, is shown in Table 8. For the AMC I class, the accuracy of the rainfall-discharge nomographs was 93.9%, 28.1%, 93.3%, 44.7%, and 33.56% for the Jungsunpil, Sunjang, Unchon, Neungmac, and Insu streams, respectively. The accuracy of the rating curves for the same streams was 100%, 94.4%, 100%, 100%, and 100%, respectively. For the AMC II and AMC III classes, both methods had 100% accuracy for all streams. Notably, the rating curves developed for the Sunjang stream had the lowest accuracy. These results indicate that the rating curves were more accurate in forecasting depth compared to the rainfall-discharge nomograph in forecasting discharge.
4.2. Discussion
The three issues that need to be discussed in this research are summarized as follows. First, the development of FEWF used measured and forecasted data from rainfall events that did not exceed the design flood depth. However, the accuracy of the forecast may deteriorate if rainfall intensity increases in the future due to climate change. Therefore, it is important to obtain long-term, high-quality measured data for more accurate forecasting. In addition, incorporating design flood simulation results can improve the accuracy of the FEWF by compensating for deficiencies in the measured data. Second, the peak discharges of many flood events below the caution or warning level were used to create the nomograph applied to the FEWF, and it is necessary to analyze the sensitivity. However, care must be taken because using only the discharge above the caution or warning level for real-time flood forecasting may result in an overestimation of small-stream flood events. Finally, FEWF can also be used to develop forecasts for small, unmeasured streams. It is possible to estimate the parameters of the regression analysis using various methods by analyzing the physical characteristics of unmeasured small streams. It may be possible to develop a more accurate FEWF for small streams through additional research that considers the above issues.
5. Conclusions and Future Works
Small streams are often exposed to flood risks, resulting in casualties and property damage to network services and public facilities. Responding to these risks is challenging due to the deficient flood arrival time and insufficient management capacity of local governments. More than 60% of casualties have occurred in small streams, making it crucial to establish an appropriate FEWF suitable for small streams to minimize flood-related damages.
In this research, the FEWF was developed as an early warning system for forecasting discharge and depth before reaching flood in both measured and unmeasured small streams. The FEWF uses the rainfall-discharge nomograph to forecast discharge with the forecasted rainfall as input values. These forecasted flood discharges are then used to forecast depths by using the rating curve to issue flood warnings. The flood warning is issued when the depth reaches the warning criteria. If the forecasted depth does not exceed the warning criteria, it is evaluated with a new measured depth in the evaluation step to ensure that the residual meets the convergence criteria. If the forecasted depth does not meet the convergence criteria, the RCNES can be used to update the rainfall-discharge nomograph and the rating curve with newly measured discharge, rainfall, and depth data.
To develop the rainfall-discharge nomographs and rating curves, optimization techniques and the Manning equation with measured data were used to collect data for 5 years, from 2016 to 2020, in 5 small streams as test beds. The intercomparison results showed that both developed nomographs and rating curves represented the measured values well. The forecasted values were evaluated using the developed nomographs and rating curves with discharge and depth values measured in 2021 in 5 small streams. The evaluation results showed that the rainfall-discharge nomographs and rating curves proposed herein forecasted the rising curve to the peak of the time-discharge and depth distributions quite well, respectively.
The research used the determinant coefficient, the discrepancy ratio, and accuracy to evaluate the difference between measured and forecasted discharge and depth values more quantitatively. Overall, the forecasted depth values matched the measured values better than the forecasted discharge values. It was found that the high accuracy of the depth forecasting increased the reliability of the FEWF because the flood early warning would be issued with forecasted depth values. The Jungsunpil stream had the highest accuracy for the AMC I class, and the Unchon stream had the highest accuracy for the AMC II and III classes, respectively. The accuracy of the rating curves for the Jungsunpil, Unchon, Neungmac, and Insu streams was 100.0% for the AMC I class, and for the AMC II and III classes, the accuracy was 100.0% in the 5 small streams.
The methods and procedures used to develop and evaluate the rainfall-discharge nomograph and rating curve are suitable for forecasting discharges and depths with forecasted rainfall data for small stream flood warning. Moreover, these methods could potentially help develop treatment methods or technology to solve problems related to the establishment of the flood early warning system. Nonetheless, continuous application and evaluation research is necessary to increase the forecasting accuracy of the FEWF using measured data collected from various characterized small streams. Both the measured data method and the estimated data method have unique benefits and drawbacks when developing the flood early warning framework for small streams. The measured data method is more precise as it uses real-time data and considers the current state of the stream. However, implementing this method requires a specific level of monitoring infrastructure, which may not be feasible in certain small stream basins. And FEWF needs to reflect rainfall data on a real-time basis to forecast flood volume before the short flood travel time. Therefore, we plan to conduct FEWF construction research in the future by linking real-time measurement data for more small streams.
Author Contributions
Conceptualization, T.-S.C. and S.K.; Methodology, T.-S.C., C.C., S.-J.Y., S.K. and K.-M.K.; Software, T.-S.C. and K.-M.K.; Validation, T.-S.C.; Formal Analysis, C.C. and J.S.; Investigation, S.-J.Y. and S.K.; Resources, T.-S.C. and S.K.; Data curation, T.-S.C., C.C., S.-J.Y. and S.K.; Writing—original draft, T.-S.C. and K.-M.K.; Writing—review & editing, T.-S.C., C.C., S.-J.Y., J.S., S.K. and K.-M.K.; Visualization, T.-S.C.; Supervision, T.-S.C. and S.K.; Project administration, T.-S.C. and S.K.; Funding acquisition, T.-S.C. and S.K. All authors have read and agreed to the published version of the manuscript.
Funding
Deep thanks and gratitude to the Research Project (NDMI-PR-2022-07-04), the National Disaster Management Institute, Ulsan, Korea, for funding the research article.
Data Availability Statement
Datasets that are restricted and not publicly available.
Acknowledgments
We are thankful to the National Disaster Management Institute of Korea for providing the necessary data used in this study.
Conflicts of Interest
The authors declare that there are no known competing financial interests or personal relationships that could have appeared to influence the work reported in this article.
References
- Pörtner, H.-O.; Roberts, D.C.; Adams, H.; Adler, C.; Aldunce, P.; Ali, E.; Begum, R.A.; Betts, R.; Kerr, R.B.; Biesbroek, R. Climate Change 2022: Impacts, Adaptation and Vulnerability; IPCC: Geneva, Switzerland, 2022. [Google Scholar]
- World Meteorological Organization. WMO Statement on the State of the Global Climate in 2019; World Meteorological Organization: Geneva, Switzerland, 2020. [Google Scholar]
- Rajeevan, M.; Bhate, J.; Jaswal, A.K. Analysis of variability and trends of extreme rainfall events over India using 104 years of gridded daily rainfall data. Geophys. Res. Lett. 2008, 35, L18707. [Google Scholar] [CrossRef]
- Goswami, B.N.; Venugopal, V.; Sengupta, D.; Madhusoodanan, M.; Xavier, P.K. Increasing trend of extreme rain events over India in a warming environment. Science 2006, 314, 1442–1445. [Google Scholar] [CrossRef] [PubMed]
- Vellore, R.K.; Krishnan, R.; Pendharkar, J.; Choudhury, A.D.; Sabin, T. On the anomalous precipitation enhancement over the Himalayan foothills during monsoon breaks. Clim. Dyn. 2014, 43, 2009–2031. [Google Scholar] [CrossRef]
- Cheong, T.S.; Joo, J.; Choi, H.; Kim, S. Development and evaluation of automatic discharges measurement technology for small stream monitoring. J. Korean Soc. Hazard Mitig. 2018, 18, 347–355. [Google Scholar] [CrossRef]
- Cheong, T.S.; Ko, T.; Choi, H.; Kim, S. Development of large scale particle image velocimetry prototype for the small stream discharge monitoring. J. Disaster Manag. 2017, 2, 19–28. [Google Scholar]
- Cheong, T.S.; Joo, J.S.; Byun, H. Advancement of Automatic Discharge Measurement Technology to Enhance Disaster-Safety Codes for Small Stream; NDMI-PR(ER)-2019-06-01; The National Disaster Management Institute: Ulsan, Republic of Korea, 2019. (In Korean) [Google Scholar]
- Lee, J.; Lee, Y.; Kim, E.; Ha, J.; Jang, D. A study on the dynamical characteristics associated with heavy rainfall case of July 14, 2009. In Proceedings of the Autumn Meeting of Korea Meteor, Jeju, Korea, 21–22 October 2010; pp. 244–245. [Google Scholar]
- Cunge, J. Practical Aspects of Computational River Hydraulics; Pitman Publishing Ltd.: London, UK, 1980; Volume 420. [Google Scholar]
- Muste, M.; Hauet, A.; Fujita, I.; Legout, C.; Ho, H.-C. Capabilities of large-scale particle image velocimetry to characterize shallow free-surface flows. Adv. Water Resour. 2014, 70, 160–171. [Google Scholar] [CrossRef]
- Bechle, A.J.; Wu, C.H. An entropy-based surface velocity method for estuarine discharge measurement. Water Resour. Res. 2014, 50, 6106–6128. [Google Scholar] [CrossRef]
- Fujita, I.; Muste, M.; Kruger, A. Large-scale particle image velocimetry for flow analysis in hydraulic engineering applications. J. Hydraul. Res. 1998, 36, 397–414. [Google Scholar] [CrossRef]
- Yang, D.; Shi, X.; Marsh, P. Variability and extreme of Mackenzie River daily discharge during 1973–2011. Quat. Int. 2015, 380, 159–168. [Google Scholar] [CrossRef]
- Perera, D.; Seidou, O.; Agnihotri, J.; Mehmood, H.; Rasmy, M. Flood Impact Mitigation and Resilience Enhancement; Challenges and Technical Advances in Flood Early Warning; Intech Open: London, UK, 2020. [Google Scholar]
- Kumar, N.; Kharkwal, N.; Kohli, R.; Choudhary, S. Ethical aspects and future of artificial intelligence. In Proceedings of the 2016 International Conference on Innovation and Challenges in Cyber Security (ICICCS-INBUSH), Greater Noida, India, 3–5 February 2016; pp. 111–114. [Google Scholar]
- Kaplan, A.; Haenlein, M. Siri, Siri, in my hand: Who’s the fairest in the land? On the interpretations, illustrations, and implications of artificial intelligence. Bus. Horiz. 2019, 62, 15–25. [Google Scholar] [CrossRef]
- Joo, J.; Byeon, H.H.; Kim, S.; Cheong, T.S. Selection of Small Stream Basins and Characteristics Analysis of Closed-circuit Television-based Automated Discharge Measurement Technology. J. Korean Soc. Hazard Mitig. 2020, 20, 259–268. [Google Scholar] [CrossRef]
- Institute, N.D.M. Establishment of the CCTV Based Automatic Discharge Measurement Technology Application System for Enhancing the Disaster Safety Codes of the Small Streams; The National Disaster Management Institute: Ulsan, Republic of Korea, 2020. [Google Scholar]
- Raffel, M.; Willert, C.E.; Kompenhans, J. Particle Image Velocimetry: A Practical Guide; Springer: Berlin/Heidelberg, Germany, 2018. [Google Scholar]
- Kim, S.; Yu, K.; Yoon, B. Error analysis of image velocimetry according to the variation of the interrogation area. J. Korea Water Resour. Assoc. 2013, 46, 821–831. [Google Scholar] [CrossRef]
- Huber, P.J.; Ronchetti, E.M. Robust Statistics; Wiley: Hoboken, NJ, USA, 2011. [Google Scholar]
- Gui, Q.; Zhang, J. Robust biased estimation and its applications in geodetic adjustments. J. Geod. 1998, 72, 430–435. [Google Scholar] [CrossRef]
- Holland, P.W.; Welsch, R.E. Robust regression using iteratively reweighted least-squares. Commun. Stat.-Theory Methods 1977, 6, 813–827. [Google Scholar] [CrossRef]
- Abt, S.; Wittier, R.; Taylor, A.; Love, D. Human stability in a high flood hazard zone. JAWRA J. Am. Water Resour. Assoc. 1989, 25, 881–890. [Google Scholar] [CrossRef]
- Jonkman, S.; Penning-Rowsell, E. Human instability in flood flows. JAWRA J. Am. Water Resour. Assoc. 2008, 44, 1208–1218. [Google Scholar] [CrossRef]
- Jonkman, S.N. Global perspectives on loss of human life caused by floods. Nat. Hazards 2005, 34, 151–175. [Google Scholar] [CrossRef]
- Jonkman, S.N.; Vrijling, J.K. Loss of life due to floods. J. Flood Risk Manag. 2008, 1, 43–56. [Google Scholar] [CrossRef]
- Karvonen, R.; Hepojoki, A.; Huhta, H.; Louhio, A. The use of physical models in dam-break analysis. In RESCDAM Final Report; Helsinki University of Technology: Helsinki, Finland, 2000. [Google Scholar]
- Shand, D.; Smith, G.; Blacka, M. Appropriate criteria for the safety and stability of people in stormwater design. In Proceedings of the National Conference of the Stormwater Industry Association, Sydney, Australia, 8–12 November 2010; pp. 9–12. [Google Scholar]
- Xia, J.; Falconer, R.A.; Wang, Y.; Xiao, X. New criterion for the stability of a human body in floodwaters. J. Hydraul. Res. 2014, 52, 93–104. [Google Scholar] [CrossRef]
- Yee, M. Human Stability in Floodways; University of New South Wales: Sydney, Australia, 2003. [Google Scholar]
- Bae, D.-H.; Shim, J.B.; Yoon, S.-S. Development and assessment of flow nomograph for the real-time flood forecasting in Cheonggye stream. J. Korea Water Resour. Assoc. 2012, 45, 1107–1119. [Google Scholar] [CrossRef]
- Jang, C.H.; Kim, H.J. Development of flood runoff characteristics nomograph for small catchment using R-programming. In Proceedings of the Korea Water Resources Association Conference, Goseong, Republic of Korea, 28–29 May 2015; p. 590. [Google Scholar]
- Neely, B.L. Flood Frequency and Storm Runoff of Urban Areas of Memphis and Shelby County, Tennessee; US Geological Survey: Reston, VA, USA, 1984. [Google Scholar]
- Safety, M.O.I.A. The Integration Model of Flood Forecasting for Medium and Small Streams; Ministry of Public Safety and Security: Seoul, Republic of Korea, 2016. [Google Scholar]
- Chow, V.T.; Maidment, D.R.; Larry, W. Applied Hydrology; McGraw-Hill Education: New York, NY, USA, 1988; Volume 149. [Google Scholar]
- Straub, T.D.; Melching, C.S.; Kocher, K.E. Equations for Estimating Clark Unit-Hydrograph Parameters for Small Rural Watersheds in Illinois; US Department of the Interior, US Geological Survey: Reston, VA, USA, 2000. [Google Scholar]
- Clark, C.O. Storage and the unit hydrograph. Trans. Am. Soc. Civ. Eng. 1945, 110, 1419–1446. [Google Scholar] [CrossRef]
- Gray, D.M. Handbook on the Principles of Hydrology; Water Information Center, Incorporated: New York, NY, USA, 1970. [Google Scholar]
- Ponce, V.M.; Hawkins, R.H. Runoff curve number: Has it reached maturity? J. Hydrol. Eng. 1996, 1, 11–19. [Google Scholar] [CrossRef]
- Jeong, J.; Yoon, H. Water Resources Design Practice; Goomibook: Seoul, Republic of Korea, 2020. [Google Scholar]
- Lamb, R.; Zaidman, M.; Archer, D.; Marsh, T.; Lees, M. River Gauging Station Data Quality Classification (GSDQ); R&D Technical Report W6-058/TR; Environment Agency: Bristol, UK, 2003. [Google Scholar]
- Chow, V.T. Open Channel Hydraulics; McGraw-Hill Education: New York, NY, USA, 1959. [Google Scholar]
- Li, Z.; Zhang, H.; Singh, V.P.; Yu, R.; Zhang, S. A simple early warning system for flash floods in an ungauged catchment and application in the Loess Plateau, China. Water 2019, 11, 426. [Google Scholar] [CrossRef]
- Song, S.; Schmalz, B.; Zhang, J.; Li, G.; Fohrer, N. Application of modified Manning formula in the determination of vertical profile velocity in natural rivers. Hydrol. Res. 2016, 48, 133–146. [Google Scholar] [CrossRef]
- White, W.; Mill, H.; Crabbe, A. Sediment Transport: An Appraisal of Available Methods; Hydraulics Research Station Wallingford: Oxford, UK, 1972. [Google Scholar]
Figure 1.
The frequency of extreme rainfall and the distribution map of occurrence regions in Korea from 1927 to 2019 (Korea national climate data center, 2020).
Figure 1.
The frequency of extreme rainfall and the distribution map of occurrence regions in Korea from 1927 to 2019 (Korea national climate data center, 2020).

Figure 2.
Location map of the small streams and the rainfall gauging stations, in which —: the small streams and ●: the rainfall gauging stations.
Figure 2.
Location map of the small streams and the rainfall gauging stations, in which —: the small streams and ●: the rainfall gauging stations.

Figure 3.
The comparison results in the largest cross-sectional change among the measured data in each of the small streams.
Figure 3.
The comparison results in the largest cross-sectional change among the measured data in each of the small streams.

Figure 4.
Comparisons of the velocities measured in Jungsunpil stream, Korea.

Figure 5.
Comparisons of the time discharges measured (a) on 11 September 2017, (b) on 24 August 2017, and (c) on 6 October 2017.
Figure 5.
Comparisons of the time discharges measured (a) on 11 September 2017, (b) on 24 August 2017, and (c) on 6 October 2017.


Figure 6.
The concept diagram of the FEWF for warning of the depth, the discharge, and the velocity.
Figure 6.
The concept diagram of the FEWF for warning of the depth, the discharge, and the velocity.

Figure 7.
The warning criteria examples of the FEWF, where the time-distributed depth of Jungsunpil and Sunjang small streams were measured on 28 September 2019 and 29 August 2020, respectively.
Figure 7.
The warning criteria examples of the FEWF, where the time-distributed depth of Jungsunpil and Sunjang small streams were measured on 28 September 2019 and 29 August 2020, respectively.

Figure 8.
Comparison of rainfall-discharge nomographs forecasted by using the RCNES with measured data collected from five small streams.
Figure 8.
Comparison of rainfall-discharge nomographs forecasted by using the RCNES with measured data collected from five small streams.


Figure 9.
Comparison of rating curves estimated by using the Manning equation with measured data collected from 5 small streams.
Figure 9.
Comparison of rating curves estimated by using the Manning equation with measured data collected from 5 small streams.


Figure 10.
The histogram of discrepancy ratios of each small stream.

Figure 11.
The event verifications as rainfall-discharge nomographs for forecasting time discharge distributions.
Figure 11.
The event verifications as rainfall-discharge nomographs for forecasting time discharge distributions.

Figure 12.
The event verifications as depth for forecasting time depth distributions.

Figure 13.
Comparison of peak discharge and depth forecasted by rainfall-discharge nomographs and rating curves with measured data in 5 small streams.
Figure 13.
Comparison of peak discharge and depth forecasted by rainfall-discharge nomographs and rating curves with measured data in 5 small streams.

Figure 14.
Comparison of discrepancy ratio to evaluate the difference between measured and forecasted values of the rainfall-discharge nomographs for five small streams.
Figure 14.
Comparison of discrepancy ratio to evaluate the difference between measured and forecasted values of the rainfall-discharge nomographs for five small streams.

Figure 15.
Comparison of discrepancy ratio to evaluate the difference between measured and forecasted values of the rating curves for five small streams.
Figure 15.
Comparison of discrepancy ratio to evaluate the difference between measured and forecasted values of the rating curves for five small streams.


Table 1.
Comparisons of the location and characteristics of small stream basins.
| Small Streams | Latitude | Longitude | ||||||
|---|---|---|---|---|---|---|---|---|
| Jungsunpil | 35°65′17″ | 129°13′17″ | 5.09 | 1.60 | 0.50 | 0.096 | 3.18 | 14.0 |
| Sunjang | 35°24′04″ | 128°55′49″ | 13.6 | 2.17 | 0.34 | 0.093 | 2.14 | 33.5 |
| Unchon | 37°33′15″ | 127°70′96″ | 6.98 | 2.01 | 0.58 | 0.054 | 2.88 | 21.5 |
| Neungmac | 37°24′31″ | 127°16′81″ | 2.41 | 0.78 | 0.25 | 0.054 | 3.09 | 9.45 |
| Insu | 37°40′20″ | 127°00′20″ | 3.66 | 1.17 | 0.38 | 0.025 | 3.12 | 17.1 |
Table 2.
The reference information of selected rainfall gauging stations in each small stream basin.
Table 2.
The reference information of selected rainfall gauging stations in each small stream basin.
| Small Streams | Rainfall Gauging Station | Latitude | Longitude | Elevation (EL.m) | Started Observation Year | ||
|---|---|---|---|---|---|---|---|
| Jungsunpil | Dooseo | 35°62′03″ | 129°14′35″ | 4.23 | 1274 | 123 | 1991 |
| Sunjang | Yangsan | 35°30′74″ | 129°02′01″ | 9.86 | 1588 | 6.20 | 2008 |
| Unchon | Yeoju | 37°17′43″ | 127°38′53″ | 6.58 | 1180 | 51.5 | 1962 |
| Neungmac | Yongin | 37°27′01″ | 127°22′18″ | 5.83 | 1294 | 83.0 | 2005 |
| Insu | Uijungbu | 37°73′50″ | 127°07′50″ | 10.4 | 1545 | 72.0 | 2001 |
Table 3.
Measured data ranges from all 5 small stream basins over 6 years (2016–2021), including rainfall, depth, and discharge. (Data from 2016 to 2020 were used to develop the FEWF, while data from 2021 were used to evaluate them.).
Table 3.
Measured data ranges from all 5 small stream basins over 6 years (2016–2021), including rainfall, depth, and discharge. (Data from 2016 to 2020 were used to develop the FEWF, while data from 2021 were used to evaluate them.).
| Division | Small Streams | |||||||||
|---|---|---|---|---|---|---|---|---|---|---|
| Min. | Mean | Max. | Min. | Mean | Max. | Min. | Mean | Max. | ||
| Development (2016~2020) | Jungsunpil | 0.00 | 0.16 | 80.0 | 0.10 | 0.29 | 1.98 | 0.06 | 1.53 | 28.8 |
| Sunjang | 0.00 | 0.19 | 95.8 | 0.13 | 0.36 | 2.45 | 0.20 | 1.32 | 210 | |
| Unchon | 0.00 | 0.14 | 50.5 | 0.10 | 0.19 | 1.01 | 0.01 | 0.25 | 6.86 | |
| Neungmac | 0.00 | 0.17 | 55.5 | 0.12 | 0.20 | 1.65 | 0.00 | 0.23 | 14.1 | |
| Insu | 0.00 | 0.20 | 51.5 | 0.01 | 0.21 | 1.39 | 0.00 | 0.14 | 21.4 | |
| Evaluation (2021) | Jungsunpil | 0.00 | 0.15 | 61.0 | 0.15 | 0.19 | 1.29 | 0.00 | 1.43 | 26.0 |
| Sunjang | 0.00 | 0.19 | 65.8 | 0.29 | 0.44 | 2.20 | 0.00 | 1.33 | 165 | |
| Unchon | 0.00 | 0.11 | 32.0 | 0.01 | 0.28 | 0.82 | 0.00 | 0.13 | 2.69 | |
| Neungmac | 0.00 | 0.12 | 40.0 | 0.00 | 0.16 | 1.11 | 0.00 | 0.07 | 4.74 | |
| Insu | 0.00 | 0.13 | 28.5 | 0.16 | 0.25 | 0.60 | 0.00 | 0.04 | 1.20 | |
Table 4.
The definition of AMC classes according to the SCS approach.
| AMC Class | 5-Day Antecedent Rainfall (mm) | Soil Moisture (%) | |
|---|---|---|---|
| Dormant Season | Growing Season | ||
| AMC I (dry) | P5 < 12.70 | P5 < 35.56 | 10 |
| AMC II (medium) | 12.70 ≤ P5 ≤ 27.94 | 35.56 ≤ P5 ≤ 53.34 | 50 |
| AMC III (wet) | P5 > 27.94 | P5 > 53.34 | 90 |
Table 5.
The optimum values determined using the RCNES.
| AMC Class | Small Streams | |||||
|---|---|---|---|---|---|---|
| Jungsunpil | Sunjang | Unchon | Neungmac | Insu | ||
| AMC I | 0.179 | 1.788 | 0.362 | 0.458 | 0.246 | |
| 0.063 | 0.051 | 0.039 | 0.057 | 0.067 | ||
| 0.899 | 0.929 | 0.966 | 0.949 | 0.939 | ||
| AMC II | 0.394 | 4.983 | 0.713 | 0.987 | 0.632 | |
| 0.081 | 0.066 | 0.035 | 0.058 | 0.124 | ||
| 0.899 | 0.756 | 0.850 | 0.962 | 0.974 | ||
| AMC III | 0.756 | 13.84 | 1.262 | 1.723 | 1.471 | |
| 0.090 | 0.053 | 0.037 | 0.059 | 0.191 | ||
| 0.933 | 0.929 | 0.865 | 0.894 | 0.815 | ||
| Whole Data | 0.290 | 3.506 | 0.385 | 0.579 | 0.213 | |
| 0.088 | 0.068 | 0.076 | 0.098 | 0.223 | ||
| 0.412 | 0.523 | 0.407 | 0.523 | 0.286 | ||
Table 6.
The event numbers and ranges of the discharge and rainfall used to develop the rainfall-discharge nomographs.
Table 6.
The event numbers and ranges of the discharge and rainfall used to develop the rainfall-discharge nomographs.
| AMC Class | Small Streams | |||||
|---|---|---|---|---|---|---|
| Jungsunpil | Sunjang | Unchon | Neungmac | Insu | ||
| AMC I | Events | 21 | 12 | 19 | 19 | 27 |
| range | 0.16–22.9 | 1.50–164 | 0.30–2.97 | 0.40–5.52 | 0.18–3.09 | |
| range | 0.10–80.0 | 0.10–95.8 | 0.10–50.5 | 0.10–55.5 | 0.10–51.5 | |
| AMC II | Events | 23 | 10 | 19 | 26 | 15 |
| range | 0.35–28.8 | 12.85–207 | 0.60–3.14 | 1.00–13.6 | 0.50–16.0 | |
| range | 0.10–58.5 | 0.10–56.0 | 0.10–36.1 | 0.10–48.5 | 0.10–21.4 | |
| AMC III | Events | 23 | 21 | 21 | 20 | 18 |
| range | 0.60–23.5 | 4.83–210 | 1.20–6.86 | 0.81–14.1 | 1.30–9.50 | |
| range | 0.10–38.6 | 0.10–45.8 | 0.10–36.0 | 0.10–30.1 | 0.20–10.0 | |
Table 7.
The determination of coefficient results for the discharges and depths forecasted by using the rainfall-discharge nomographs and rating curves, respectively, in five small streams.
Table 7.
The determination of coefficient results for the discharges and depths forecasted by using the rainfall-discharge nomographs and rating curves, respectively, in five small streams.
| Small Streams | Discharges by the Rainfall-Discharge Nomograph | Depths by the Rating Curve | ||||
|---|---|---|---|---|---|---|
| AMC I | AMC II | AMC III | AMC I | AMC II | AMC III | |
| Jungsunpil | 0.969 | 0.856 | 0.910 | 0.954 | 0.928 | 0.822 |
| Sunjang | 0.928 | 0.932 | 0.966 | 0.974 | 0.822 | 0.978 |
| Unchon | 0.964 | 0.706 | 0.969 | 0.977 | 0.958 | 0.928 |
| Neungmac | 0.896 | 0.918 | 0.778 | 0.890 | 0.973 | 0.802 |
| Insu | 0.521 | 0.859 | 0.967 | 0.517 | 0.889 | 0.991 |
Table 8.
Accuracy of forecasted discharge and depth by using the rainfall-discharge nomographs and rating curves, respectively, in five small streams.
Table 8.
Accuracy of forecasted discharge and depth by using the rainfall-discharge nomographs and rating curves, respectively, in five small streams.
| Small Streams | Discharges by the Rainfall-Discharge Nomograph | Depths by the Rating Curve | ||||
|---|---|---|---|---|---|---|
| AMC I | AMC II | AMC III | AMC I | AMC II | AMC III | |
| Jungsunpil | 90.3 | 59.3 | 27.1 | 100 | 100 | 100 |
| Sunjang | 28.1 | 66.2 | 50.0 | 94.4 | 100 | 100 |
| Unchon | 93.3 | 63.6 | 44.8 | 100 | 100 | 100 |
| Neungmac | 44.7 | 69.2 | 54.7 | 100 | 100 | 100 |
| Insu | 33.6 | 78.6 | 21.1 | 100 | 100 | 100 |
Disclaimer/Publisher’s Note: The statements, opinions and data contained in all publications are solely those of the individual author(s) and contributor(s) and not of MDPI and/or the editor(s). MDPI and/or the editor(s) disclaim responsibility for any injury to people or property resulting from any ideas, methods, instructions or products referred to in the content. |
© 2023 by the authors. Licensee MDPI, Basel, Switzerland. This article is an open access article distributed under the terms and conditions of the Creative Commons Attribution (CC BY) license (https://creativecommons.org/licenses/by/4.0/).
Share and Cite
MDPI and ACS Style
Cheong, T.-S.; Choi, C.; Ye, S.-J.; Shin, J.; Kim, S.; Koo, K.-M. Development of Flood Early Warning Frameworks for Small Streams in Korea. Water 2023, 15, 1808. https://doi.org/10.3390/w15101808
AMA Style
Cheong T-S, Choi C, Ye S-J, Shin J, Kim S, Koo K-M. Development of Flood Early Warning Frameworks for Small Streams in Korea. Water. 2023; 15(10):1808. https://doi.org/10.3390/w15101808
Chicago/Turabian StyleCheong, Tae-Sung, Changwon Choi, Sung-Je Ye, Jihye Shin, Seojun Kim, and Kang-Min Koo. 2023. "Development of Flood Early Warning Frameworks for Small Streams in Korea" Water 15, no. 10: 1808. https://doi.org/10.3390/w15101808
Note that from the first issue of 2016, this journal uses article numbers instead of page numbers. See further details here.