
Control and Interception Characteristics of the Debris-Flow Flexible Net Barrier Based on Orthogonal Design

1
Key Laboratory of Mountain Hazards and Earth Surface Processes, Institute of Mountain Hazards and Environment, Chinese Academy of Sciences, Chengdu 610299, China
2
School of Engineering Science, University of Chinese Academy of Sciences, Beijing 101408, China
*
Author to whom correspondence should be addressed.
Water 2023, 15(10), 1809; https://doi.org/10.3390/w15101809
Submission received: 25 February 2023
/
Revised: 6 April 2023
/
Accepted: 2 May 2023
/
Published: 9 May 2023
(This article belongs to the Section Water Erosion and Sediment Transport)
Abstract
:As a debris-flow control and mitigation countermeasure, flexible net barriers can effectively mitigate debris flows. The control and interception characteristics of flexible net barrier play an important role in engineering design. Many influencing factors exist in debris-flow flexible net barrier control and interception processes. In order to explore the most important factors, a flume-based experimental study was carried out by selecting the four main factors, i.e., the flume slope, debris flow bulk density, net barrier interval and relative volume. The purpose of the study is to analyze the influencing degree of the four factors. Moreover, the debris-flow interception ratio, blocking ratio, velocity reduction ratio and bulk density attenuation ratio are taken as the evaluation index. Based on the theory of orthogonal experimental design, the experiment results were analyzed in detail by range analysis and variance analysis. The research results indicated the following: in regard to the interception ratio, blocking ratio, and velocity reduction ratio, the net barrier interval exerted the most notable impact, followed by the bulk density. In regard to the bulk density attenuation ratio, the flume slope and bulk density were the first and second most important influencing factors, respectively. The form of interception ratio with maximum value was as follows: the flume slope was 9°, the net barrier interval was 18 mm, the bulk density was 21 kN/m3 and the relative volume was 2/3. The form of blocking ratio with minimum value was as follows: the flume slope was 6°, the net barrier interval was 50 mm, the bulk density was 12 kN/m3 and the relative volume was 1/2. The form of velocity reduction ratio with maximum value was as follows: the flume slope was 12°, the net barrier interval was 18 mm, the bulk density was 17 kN/m3 and the relative volume was 1. The form of bulk density attenuation ratio with maximum value was as follows: the flume slope was 12°, the net barrier interval was 30 mm, the bulk density was 17 kN/m3 and the relative volume was 1/3.
1. Introduction
Debris flows, which are triggered by heavy rainfall, flash floods, and snowmelt, are common geological hazards exhibiting multiphase movement in mountainous areas, and they have caused considerable danger to local residents and damage to infrastructure [1,2,3]. For example, on 24 September 2008, 72 debris flows were triggered by heavy rainfall in the Wenchuan Earthquake-affected area, which devastated Beichuan City [4].
As an effective debris-flow mitigation countermeasure, check dams, including open- and closed-type dams, have been widely implemented. Due to the heavy inertial mass of the dam body, the closed-type check dam remains stable and performs well in sediment interception but easily becomes filled because it cannot preferentially filter the solid material of debris flows. However, open-type check dams compensate for the shortcomings of closed-type dams due to their unique characteristics, i.e., the trapping of coarse particles and discharge of fine sand and water [5,6,7]. As a novel debris-flow mitigation countermeasure, flexible net barriers, which may be quickly installed with helicopters and dissipate debris-flow energy through elastic and plastic deformation, have been increasingly applied in debris-flow mitigation, especially in the United States and Switzerland [8,9,10,11,12]. However, the impact behavior of debris flows on flexible net barriers is quite different from that on concrete dams because of the nonlinear geometrical characteristics and complicated deformation patterns of flexible net barriers [13,14,15] Many researchers have carried out physical experiments and numerical simulations on debris-flow flexible net barriers.
Based on laboratory research, Song et al. [16] researched the multiple-surge load model of debris–barrier interaction using a non-permeable physical model. Wendeler et al. [12] indicated that optimal flexible barrier results were obtained for a net interval and basal opening gap not larger than d90, which indicates that 90% of the particles are smaller than this diameter, but they did not consider the debris-flow scale. Huo et al. [17] summarized two sediment deposition patterns, and a smaller-mesh size flexible barrier performed highly efficiently in particle interception via the evaluation of flexible net barriers of different mesh sizes. Liu et al. [18] analyzed the failure form and proposed certain field design principles of flexible barriers; these conclusions are based on small field surveys. Ng et al. [19,20] conducted similar simulation research with a geotechnical centrifuge to measure the dynamic response of flexible barriers. Sun and Law [21] applied distinct element code PFC 3D in numerical simulations to study the debris-flow energy dissipation mechanism of flexible net barriers and proposed an analytical method. Huo et al. [22] reported that the maximum energy absorption efficiency of a flexible barrier reaches approximately 63% based on flume tests and theoretical analysis [21], while Song et al. [23] proposed that debris energy dissipation through internal and boundary shearing reached higher than 90% according to quantitative analysis. In these studies, the selection of variables is too empirical and lacks practical theoretical support.
Nevertheless, most studies of debris-flow flexible net barriers have focused on the dynamic response of the structure and numerical simulations [24,25,26]. The influencing factors of the control and interception characteristics are important parameters for the engineering design of flexible net barriers. However, the interaction process of debris flow and flexible barriers remains unclear and the control and interception characteristics of the debris-flow flexible net barrier has been less-extensively researched. Therefore, it is vital to find out the order of significance of influencing factors.
In this paper, through theoretical analysis and physical model experiment, the control and interception processes of flexible net barrier blocking debris flow under different working conditions were studied. The four main factors—the flume slope, bulk density, net barrier interval and relative volume—were selected as variable factors to conduct a flume-based experimental study based on orthogonal design. Moreover, the debris-flow interception ratio, blocking ratio, velocity reduction ratio and bulk density attenuation ratio were chosen as experimental targets to investigate the control and interception characteristics of debris-flow flexible net barriers. The research results provide useful input data and theoretical support for debris-flow mitigation.
2. Experimental Situation
2.1. Experimental Setup
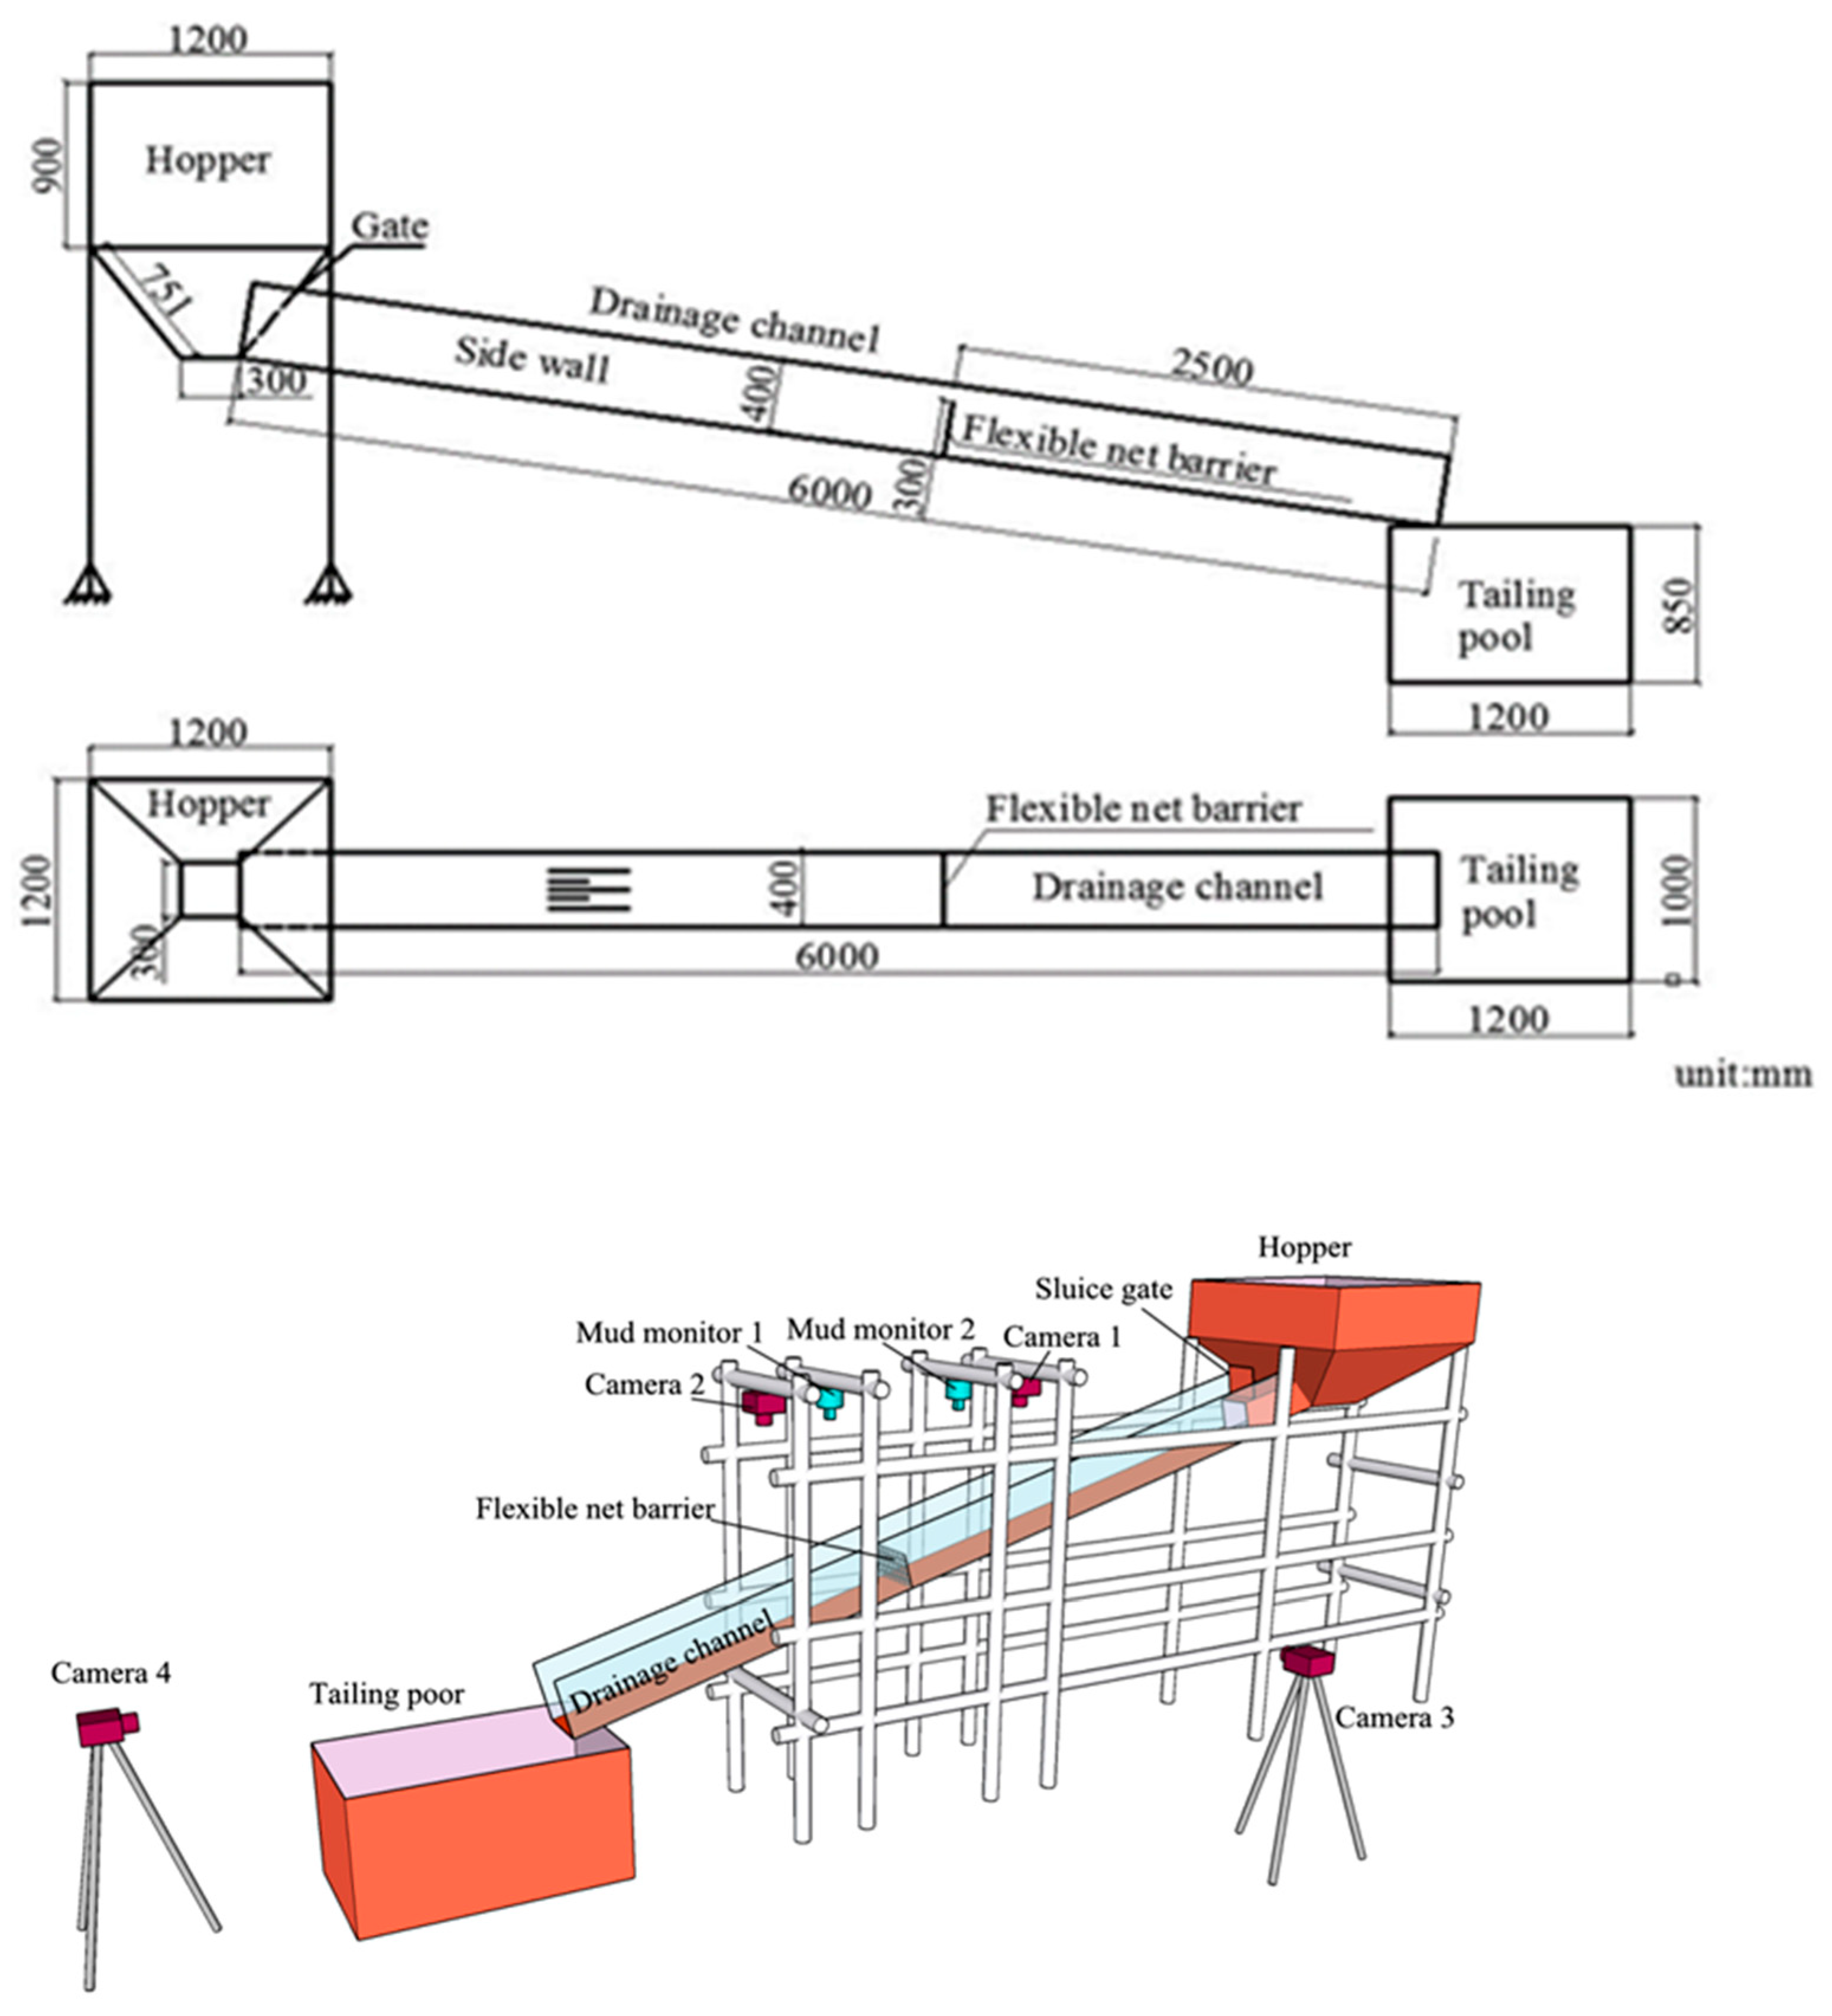
The experiment was performed at the Dongchuan Debris Flow Observation and Research Station, Chinese Academy of Sciences. The experimental facility consisted of five components: an upstream hopper, a sluice gate, a rectangular open channel, a flexible net barrier model and a tailing pool at the end of the channel (Figure 1). The hopper was used to store and mix the debris-flow material before the start of experiment. When the sluice gate was suddenly lifted, a debris-flow event could be simulated. The dimensions of the open drainage channel were 6.0 m × 0.4 m × 0.4 m (length × width × height), whose sidewall and bottom slab comprised plexiglass and steel plates, respectively. The flexible net barrier model was constructed of steel wires with a diameter of 2 mm, and the material strength class was 450 N/mm2. To effectively eliminate the influence of the fluid pressure of the hopper, the barrier model was mounted at a distance of 3.5 m from the hopper. The tailings pool measured 1.2 m × 1.0 m × 0.85 m (length × width × height) and collected material after the experiment. To capture the whole interaction process and phenomena, four video cameras (recording at 25 frames per second) were placed upstream and downstream of the barrier and at the front and on the side of the flume.
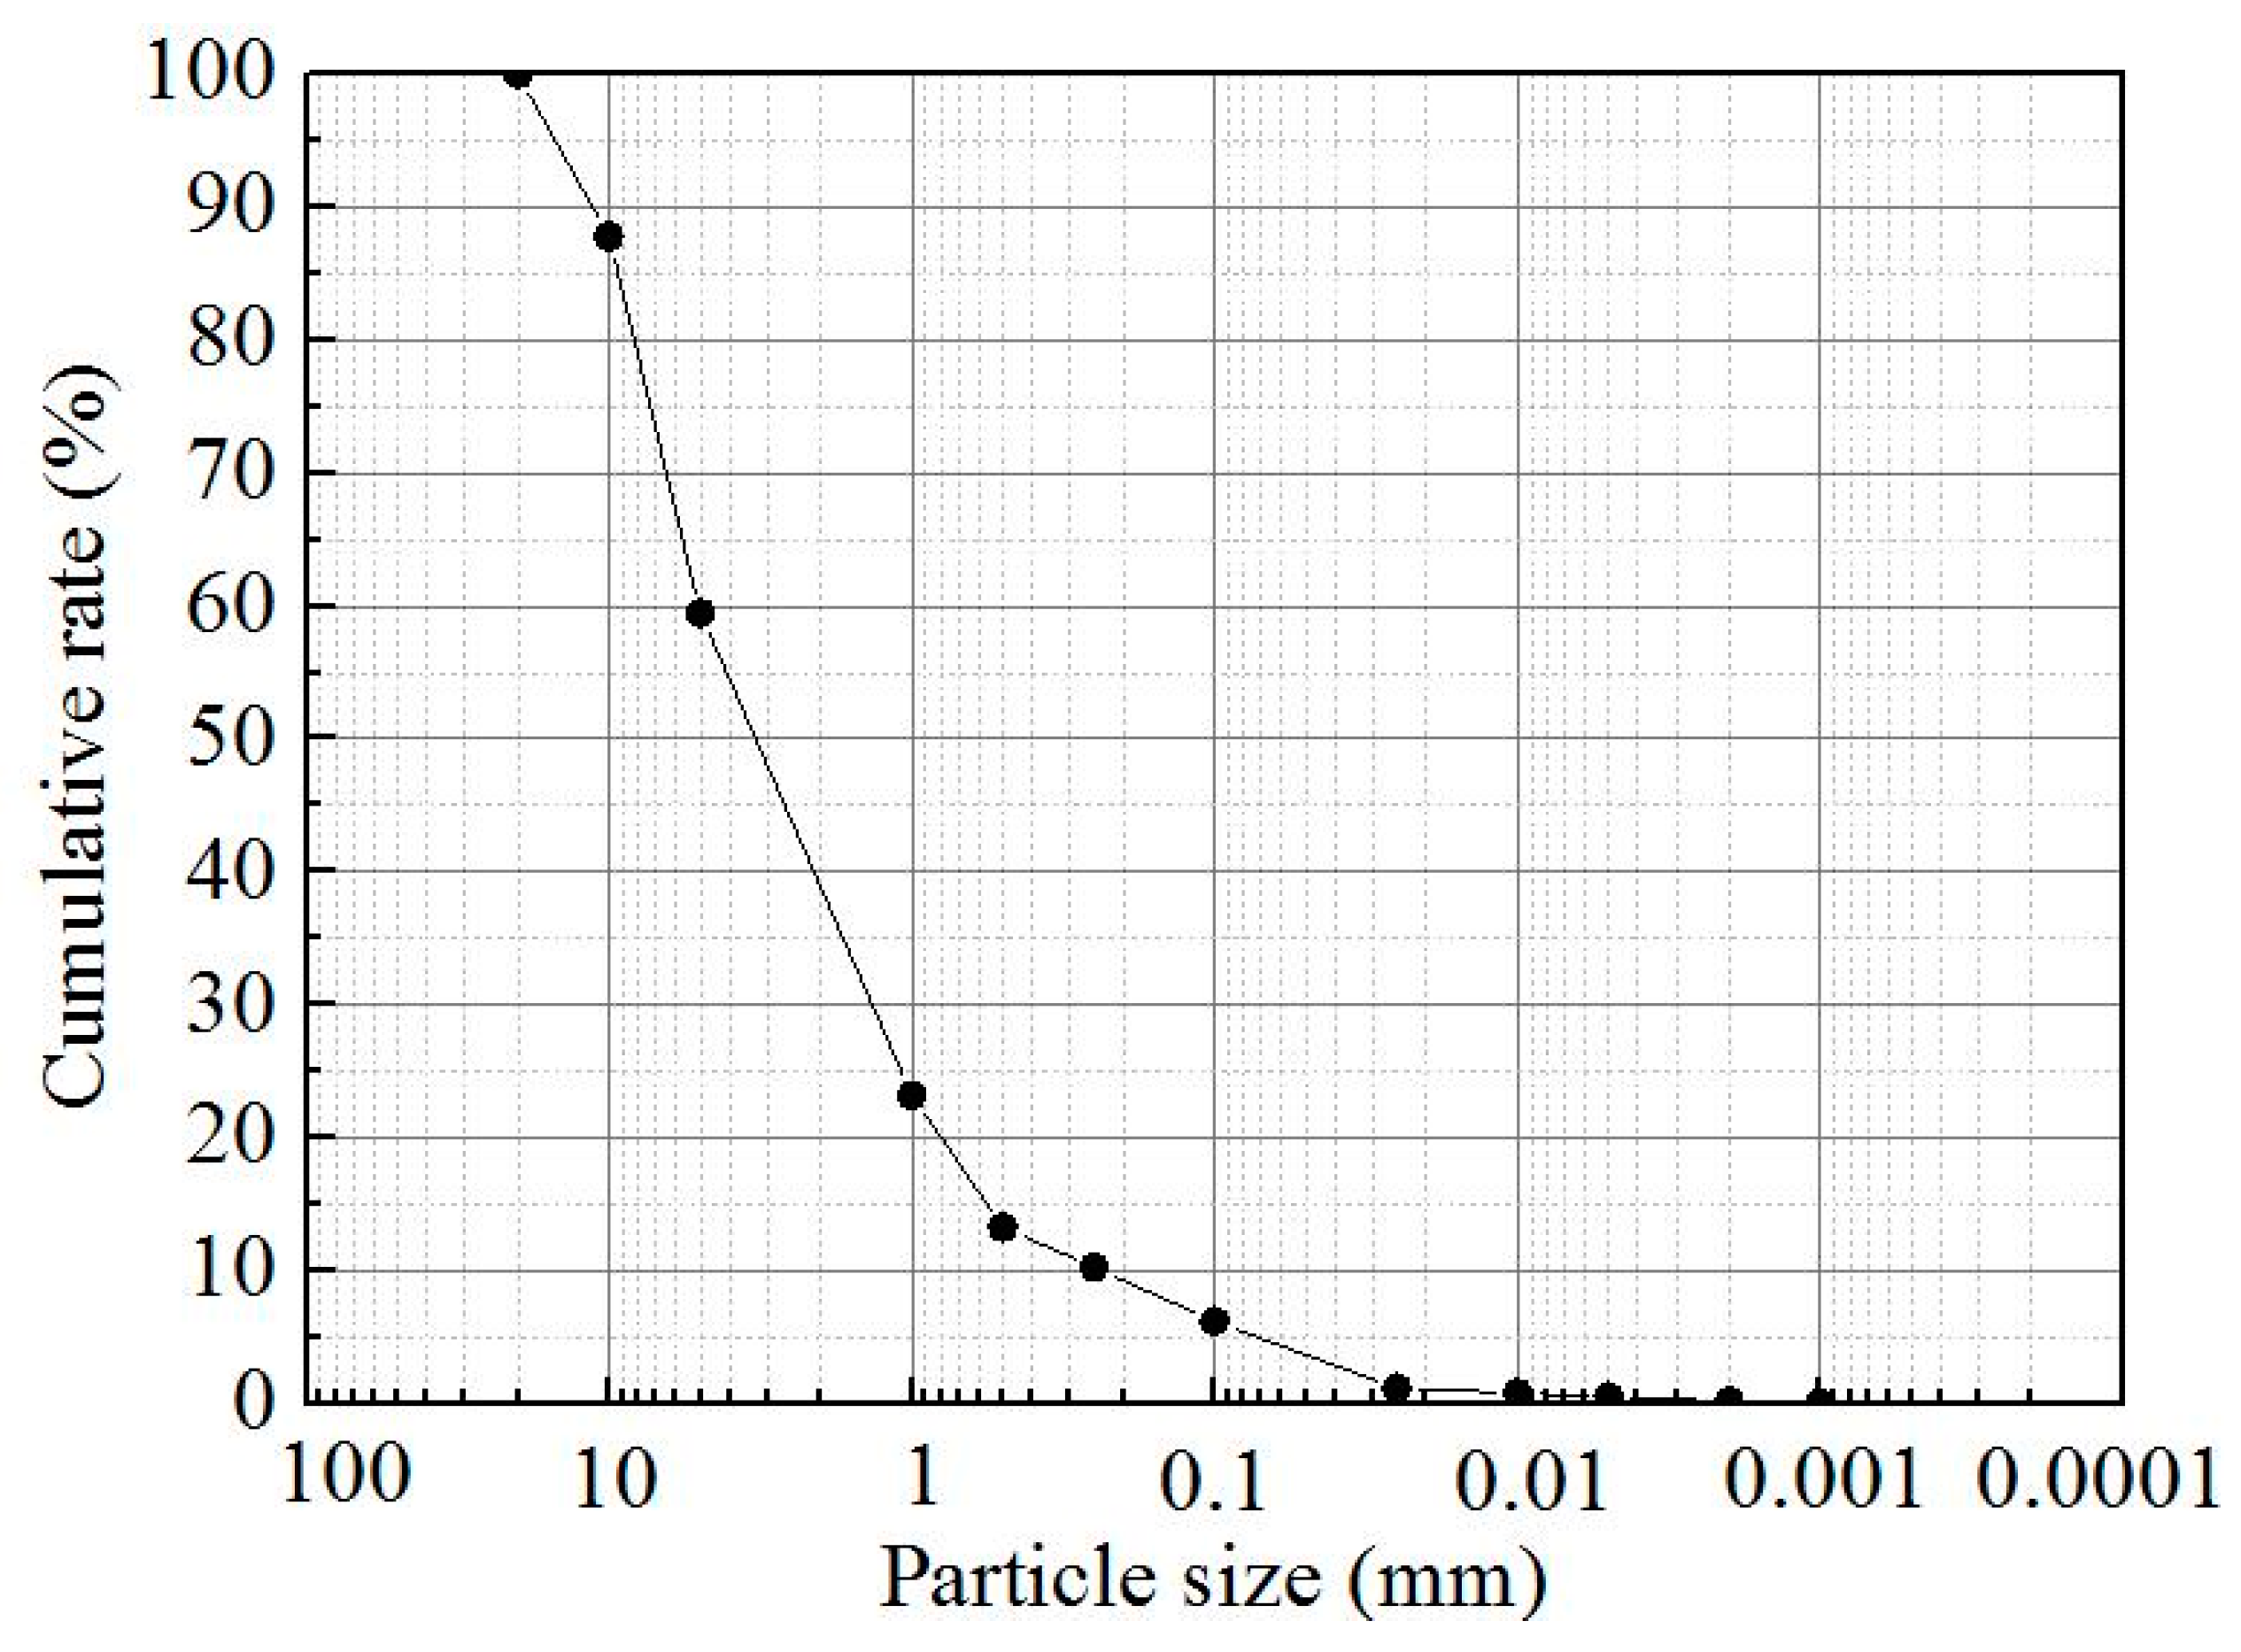
In situ debris-flow materials were chosen to carry out the experiment. In situ materials were collected from the Jiangjia Ravine, Yunnan Province, China, which is referred to as a debris-flow museum. Approximately ten debris-flow events occur on average each year, and numerous properties of debris flows are reflected [27]. Because of the limitation of the drainage channel boundary, the flume width should be at least five times as large as the maximum particle size [5]. Hence, the in situ experimental materials were sieved through a 20 mm × 20 mm steel mesh to eliminate the influence of the flume boundary. The particle size distribution curve of the experimental material is shown in Figure 2, and d90 is equal to 11.7 mm (d90 indicates that 90% of the particles are smaller than this diameter).
In order to evaluate the scale effect, the Froude number (Fr) is selected to describe the dynamic similarity between the model and the prototype debris flow. The Fr is a dimensionless parameter that is widely used to express the relative value of fluid inertial and gravitational forces. The is shown as follows:
where v is the velocity of debris flow (m/s), g is the gravitational acceleration (m/s2), h the flow depth (m), and θ is the channel slope (°).
2.2. Experimental Design
2.2.1. Main Factor Selection
The influencing factors of the flexible net barrier in regard to its debris-flow control and interception characteristics are very complicated. The regulation and interception effects are not only related to the structural parameters of the barrier and longitudinal slope of the channel but also closely related to the debris-flow particle material gradation, bulk density and total amount of primary flow.
The higher the content of fine particles in the debris-flow particle gradation, the higher the debris-flow viscosity and material integrity are. Moreover, it is difficult to separate water and sediments when the debris flow passes through the flexible net barrier, which is prone to blocking. Moreover, the size and cumulative percentage of coarse particles determine the difficulty of blocking a flexible net barrier. The larger the particle size and the higher the coarse particle content, the more likely the barrier is to be blocked. Moreover, the debris-flow bulk density is closely related to the control and interception characteristics of the flexible net barrier. The debris-flow bulk density may be considered to characterize the concentration of debris-flow solid particles and material integrity. The higher the bulk density, the higher the solid particle concentration and integrity are and the more likely the flexible barrier will be blocked.
The control and interception results between debris flow and flexible net barrier are not only associated with the abovementioned effects on the properties of debris flows but also the structural parameters of flexible net barriers (such as the opening size), longitudinal slope of gullies and relative scale of debris flows, which cannot be ignored. The larger the opening size of the flexible net barrier, the easier a debris flow passes through. The longitudinal slope of a gully affects the flow velocity and depth of a debris flow. The larger the relative scale of the debris flow, the more easily it is blocked by the dam.
Therefore, in this paper, the flume slope θ, bulk density γ, and dimensionless parameters b/dr (relative opening size) and Vr (relative volume) are selected as the main indexes to evaluate the effect of a flexible net barrier on debris-flow interception and mitigation, where b is the opening space of the flexible net barrier and dr is the particle size of the debris flow. In this paper, d90 is chosen as the research target. In addition, Vr = V/Vtotal, where V denotes the experimental debris-flow volume, and Vtotal is the storage capacity of the dam.
2.2.2. Experimental Scheme
Orthogonal experimental design is a method suitable for multifactor experiments, which scientifically arranges and analyzes experimental results. Representative factors are selected from the horizontal combination of comprehensive experiments for execution, which exhibits the characteristics of close comparability and uniform dispersion. Compared to the comprehensive test design method, its advantages are as follows: (1) in orthogonal experimental design, a small number of typical trials is selected from the comprehensive trials; (2) via analysis of a limited number of experimental results, important information is obtained, such as the suitable working conditions, influence degree and tendency of each factor [28,29]
To study the regulation and interception characteristics of flexible net barriers in regard to debris flows, four variables were selected, namely, the flume slope θ, net barrier interval b, bulk density γ and relative volume Vr, and 4 levels were considered for each variable (Table 1). For each control variable, four values are set, namely, levels. For example, for the control variable “Flume slope”, the four levels are 6°, 9°, 12°, and 15°; for the control variable “Net barrier interval”, the four levels are 18 mm, 30 mm, 38 mm, and 50 mm. Without considering the interaction between the various factors, a total of 256 groups would be required under the comprehensive experimental approach. However, under the orthogonal design method, the number of tests required was 16, and L16 (45) was selected to design the test scheme (Table 2); “16” stands for the orthogonal table rows, namely the number of experiments; “4” means the level of the factors; “5” represents the orthogonal array. Thus, the maximum number of factors can be arranged. There are only 4 factors in this experiment, and the extra blank column is used as the error term.
2.3. Target Selection
Through field investigation and engineering practice, it has been found that, from a macroscopic perspective, the debris-flow volume, bulk density and flow velocity all exhibit obvious changes within a certain range as a debris flow continues to evolve downstream through the flexible net barrier. Moreover, the flexible network is blocked to a certain extent.
To quantitatively analyze the flexible net barrier control and intercepting characteristics in regard to debris flows, the interception ratio, blocking ratio, velocity reduction ratio and bulk density attenuation ratio were selected as evaluation targets. The influence degree and trend in the flume slope, relative opening size, bulk density and relative volume were investigated.
The interception ratio can be defined as [7]:
where is the interception ratio, %, is the sediment mass after the dam, kg, and is the sediment mass before the dam, kg.
The blocking ratio is expressed as:
where D is the blocking ratio, %, Sb is the blocked area after the debris flow passes the dam, mm2, and Sa is the effective through-area of the flexible dam, mm2.
The velocity reduction ratio can be expressed as:
where P is the velocity reduction ratio, %, v1 is the debris-flow velocity before the dam, m/s, and v2 is the debris-flow velocity after the dam, m/s.
The bulk density attenuation ratio can be defined as:
where is the bulk density attenuation ratio, %, is the debris-flow bulk density before the dam, kN/m3, and is the debris-flow bulk density after the dam, kN/m3.
3. Analytical Methods of Experiment Results
To compensate for the shortcomings and errors of a single statistical method and to comprehensively investigate the influence of the above four factors on the test results, in this paper, the two methods of range and variance analysis are adopted to compare the test results and better understand the control and interception characteristics of flexible net barriers in regard to debris flows.
3.1. Range Analysis
Range analysis is an important method to measure the volatility of data. The range is the difference between the highest and lowest levels of a certain factor. The main factors influencing a given index are readily identified via range analysis.
First, the average value of each factor can be calculated with the following equation:
where is the arithmetic mean of . Subscript i (i = 1, 2, 3, 4) indicates the level of each factor, and j (j = A, B, C, D) indicates a certain factor, while n is the total number of levels of each factor, which equals 4 in this paper. is the l-th test result value for the j-th factor and i-th level.
Thus, the range of factor i () can be determined as the difference between the maximum and minimum values of :
In particular, the larger is, the more important the factor.
3.2. Variance Analysis
Important test information is acquired through a small number of calculations and explicitly described via range analysis. However, range analysis also exhibits certain shortcomings, e.g., it is impossible to distinguish the error source and the data fluctuation due to changes in test conditions or test errors. Fortunately, variance analysis resolves the abovementioned problem successfully and effectively determines the significance degree.
The basic idea of variance analysis is as follows: (1) the sum of squares of the total deviation is calculated, which reflects the total deviation in the test results; (2) the degrees of freedom (DF), mean square (MS) and F value are determined; (3) the F test is carried out, and the significant factor is identified. The parameters mentioned above can be expressed as [30]:
where n is the total number of levels of the corresponding factor, m is the number of factors, T is the sum of the test indexes, is the total test time, and is the test time for the j-th factor and i-th level. SS is the sum of squared deviations, and , are the squared deviations in the experimental results caused by changing every level of factor j and the error, respectively. The other symbols are the same as those described above.
DF denotes the number of independent elements in the sum of squares. MS can be applied to eliminate the effect of the number of observations on the error. Hence, the F value can be calculated as:
where and are the MS values of each factor and the error, respectively, and and are the DF values of each factor and the error, respectively. The other symbols are the same as those mentioned above.
Notably, a new error should be established when is smaller than . This indicates that a certain factor imposes little influence on the test results. Therefore, , , and are newly expressed as follows:
where , , and are the new difference in the experimental results due to the error, the new DF value of the error, and the new MS value of the error, respectively, and is a certain factor j whose value is smaller than .
At the considered test level (degree of confidence), the critical value, , can be determined with the F distribution table. Comparing the F value to , a large F value indicates a notable effect of the test factor.
4. Results
According to the orthogonal experimental design listed in Table 2, 16 groups of physical model tests were carried out, and relevant data were obtained. The target results are summarized in Table 3 after preliminary analysis.
4.1. Range Analysis Results
With the use of the range analysis method introduced in Section 3.1, the analysis results for the four evaluation targets are listed in Table 4. Table 4 reveals that the range of each factor is not equal, which indicates that each factor imposes different influences on the test results. Generally, the larger the range is, the greater the influence of this factor on the test results, and the factor with the largest range is the main influencing factor.
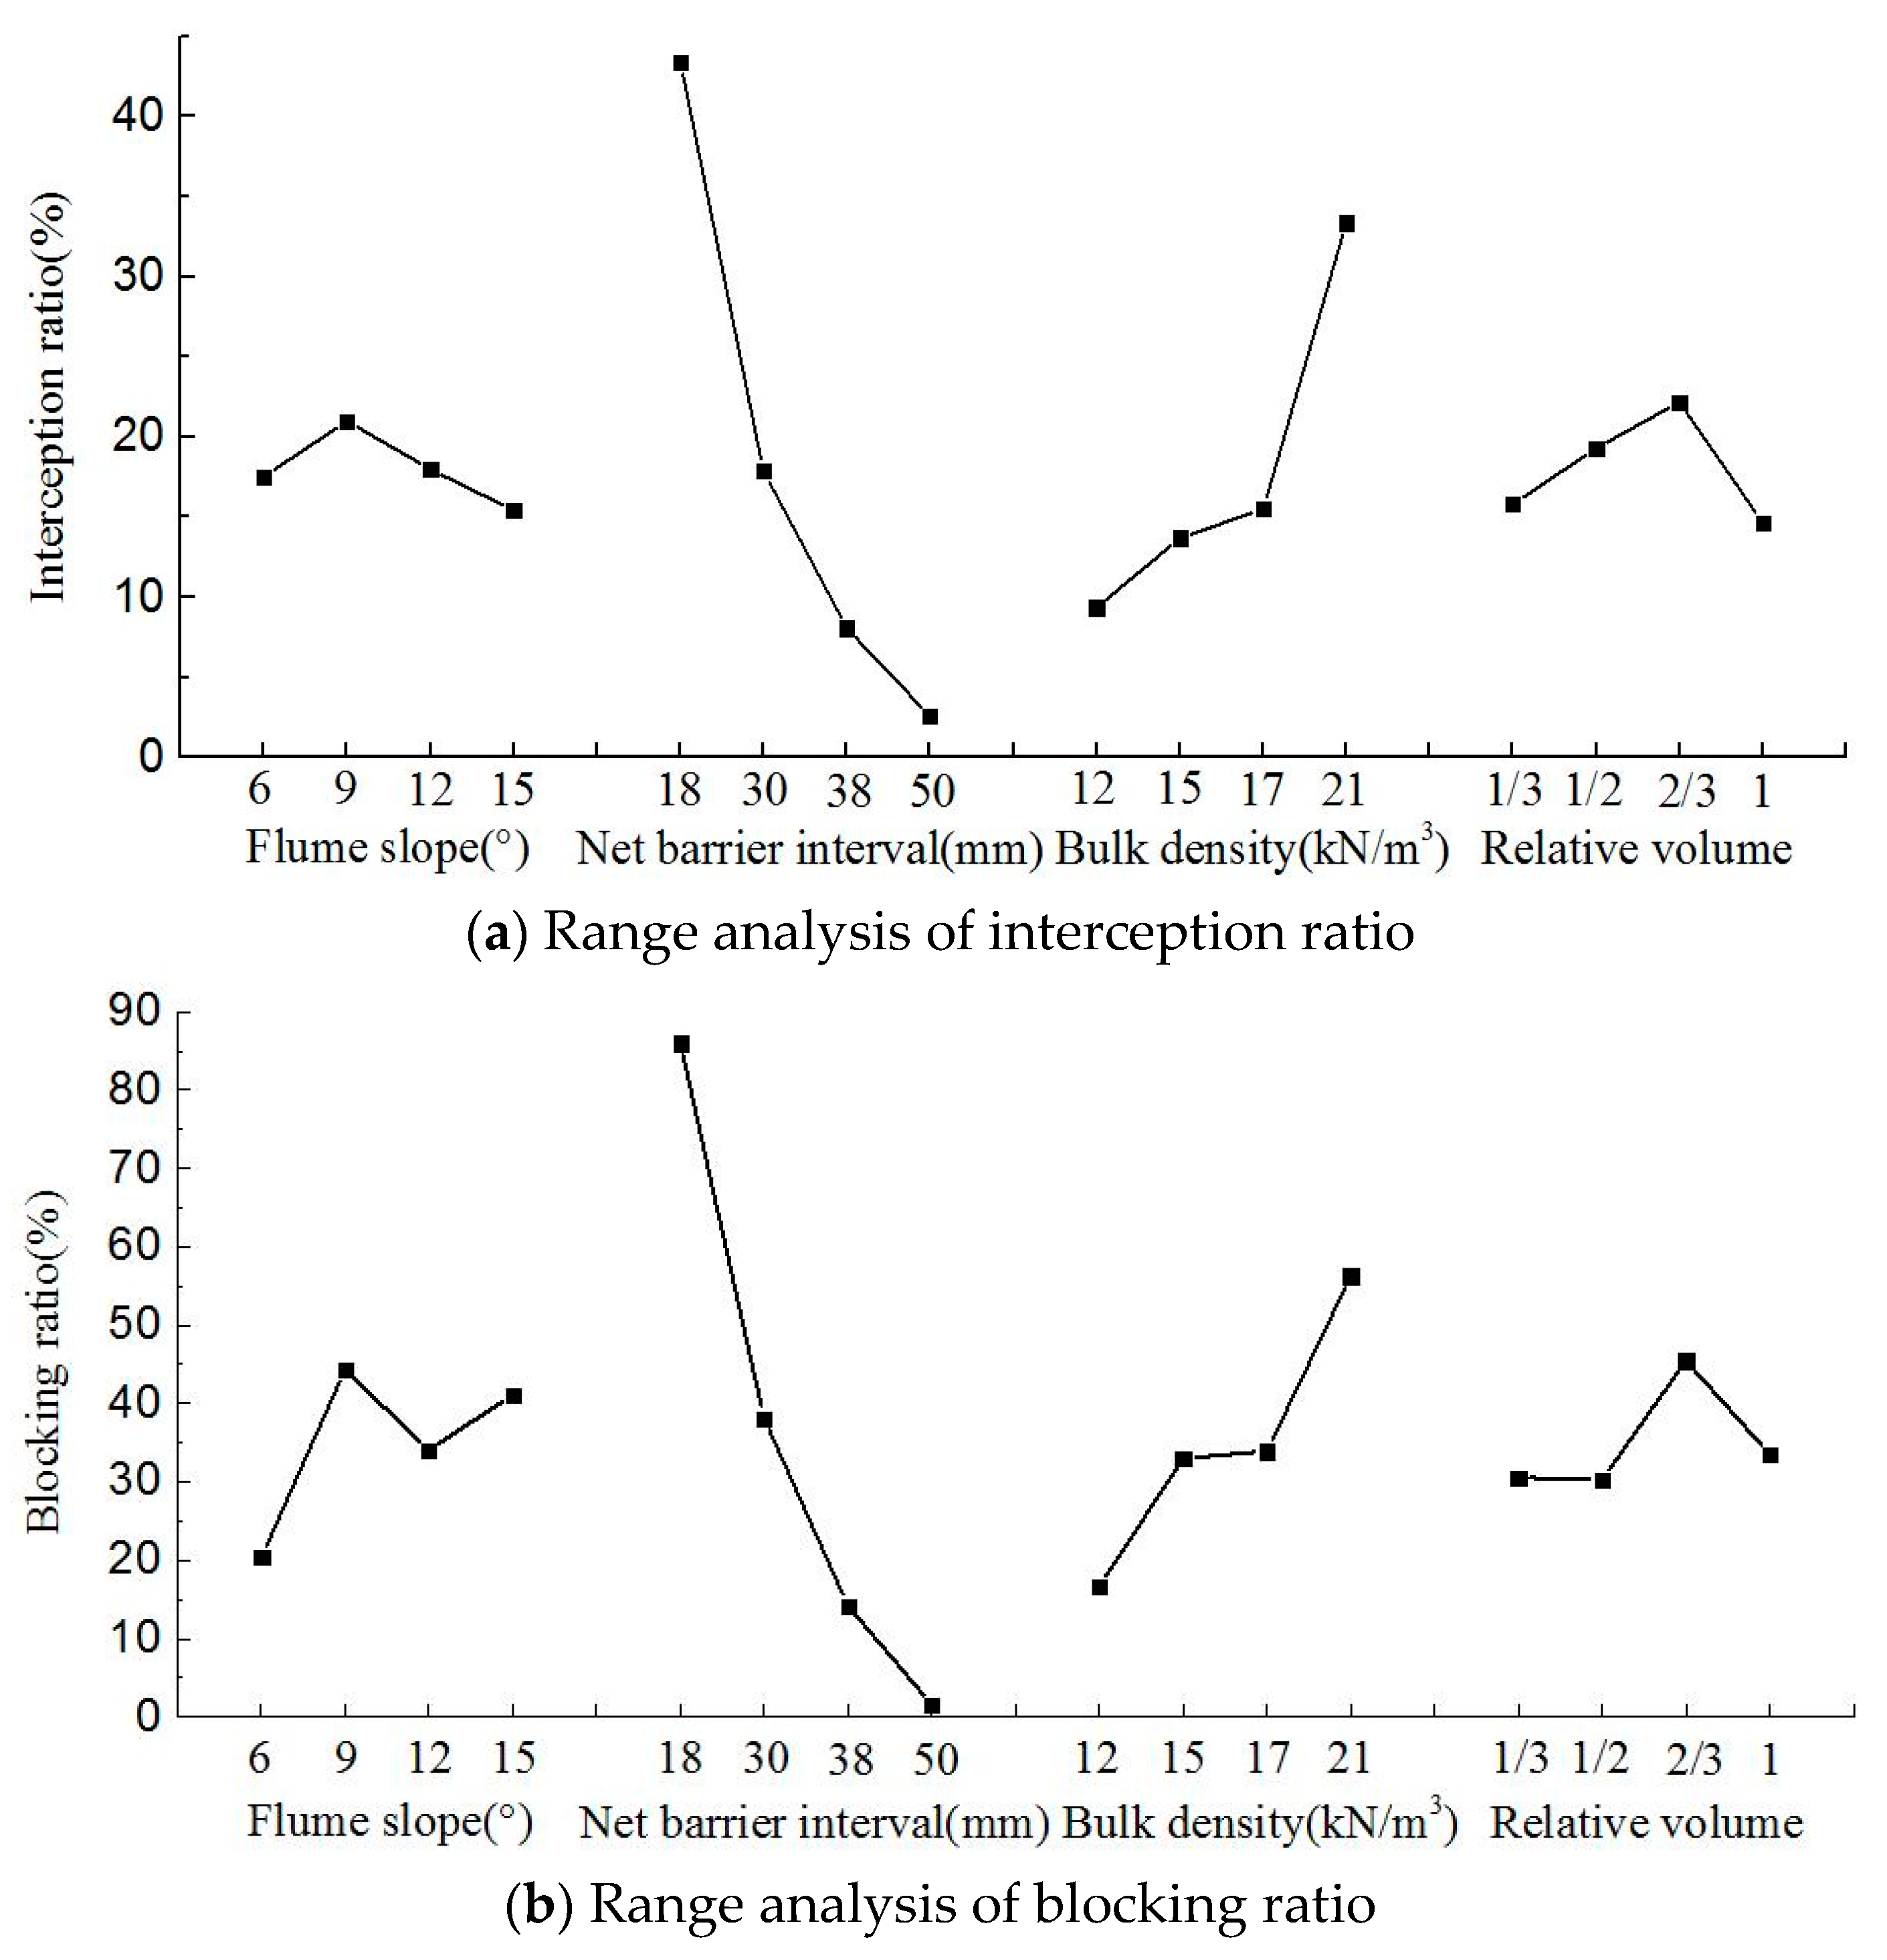
To more intuitively reveal the influence of the various factors on the evaluation indexes, a trend chart was generated to select the most significant level of each factor for a given index. A trend chart is shown in Figure 3a–d. The horizontal coordinate indicates the range analysis value of each factor, and the vertical coordinate indicates the evaluation index.
4.1.1. Interception Ratio
Based on Table 4 and Figure 3a, among the impact factors of the interception ratio, factor B (the net barrier interval) attained the widest distribution, indicating that factor B had the largest range and was the most important factor influencing the interception ratio. The distribution of factor C (the bulk density) was narrower than that of factor B, followed by factor D (the relative volume) and factor A (the flume slope). According to visual analysis of Figure 3a and comparison of the range values listed in Table 4, RB > RC > RD > RA was determined. Therefore, the primary and secondary factors influencing the interception ratio were the net barrier interval and the bulk density, relative volume and flume slope, respectively. In particular, RError > RA, but these two values were very close. A possible explanation is that this was caused by an error in the test operation.
Analysing the trend line of each factor in Figure 3a, it is observed that (1) at a flume slope of 9°, the interception ratio reached its maximum value; (2) at a net barrier interval of 18 mm, the interception ratio was the highest; (3) at a bulk density of 21 kN/m3, the interception ratio reached its maximum value; and (4) at a relative volume of 2/3, the interception ratio was the highest. In summary, the interception effect was maximized under the working condition of B1C4D3A2.
4.1.2. Blocking Ratio
According to Table 4 and Figure 3b, among the factors impacting the blocking ratio, factor B attained the widest distribution and thus had the largest range, which was the most important factor influencing the blocking ratio. Factor D exhibited the densest distribution at each point, and its range was the smallest, which was the least important factor of the blocking ratio. The distribution of factors C and A at the various points was denser than that of factor B but less dense than that of factor D. Through graphic analysis and range value comparison, RB > RC > RA > RD was determined. Therefore, the primary and secondary factors influencing the blocking ratio were the net barrier interval and the bulk density, relative volume and flume slope, respectively.
By analyzing the trend line of each factor in Figure 3b, (1) when the flume slope was 6°, the blocking ratio reached its lowest value; (2) when the net barrier interval was 50 mm, the blocking ratio was the lowest; (3) when the bulk density was 12 kN/m3, the blocking ratio reached its lowest value; and (4) when the relative volume was 1/2, the blocking ratio was the lowest. In conclusion, when the level combination of all factors was B4C1A1D2, the blocking ratio was minimized.
4.1.3. Velocity Reduction Ratio
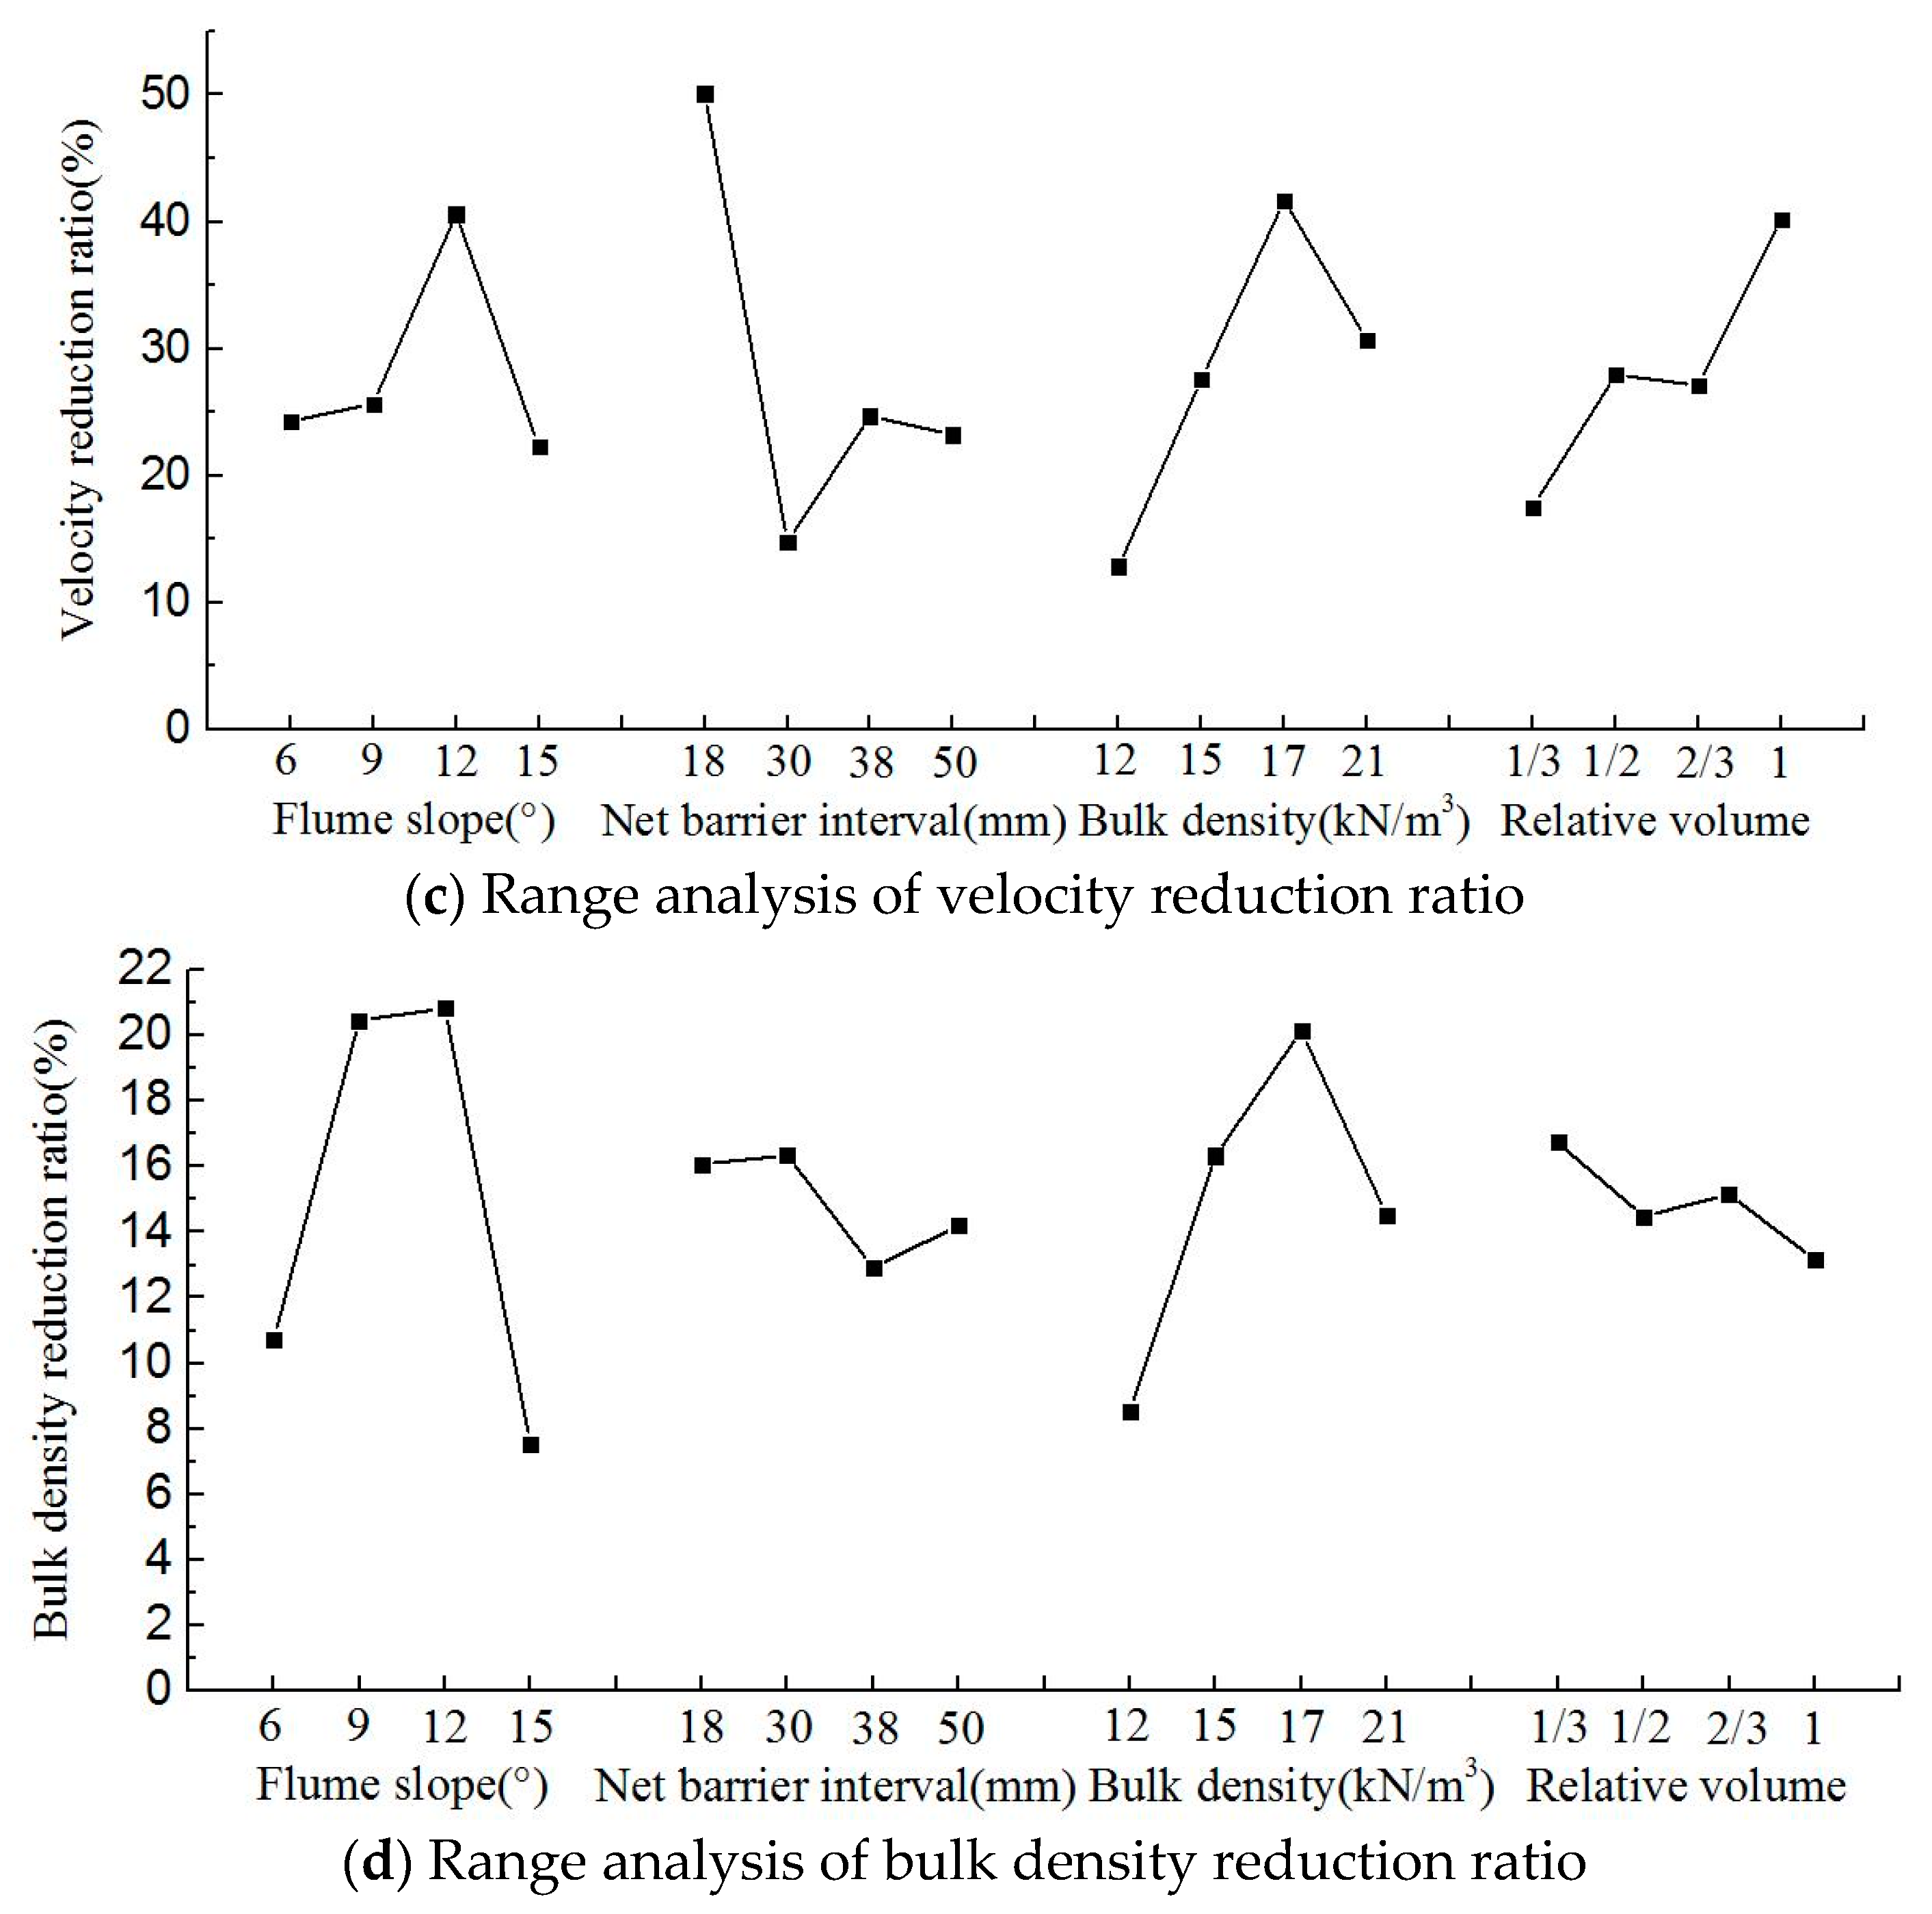
Via analysis of Table 4 and Figure 3c, among all the factors impacting the velocity reduction ratio, the points pertaining to factor B exhibited the widest spread, indicating that the range of this factor was the largest and that factor B was the most important influencing factor of the velocity reduction ratio. The second most important influencing factor was factor C, and the least important influencing factors were factors D and A. Based on the analysis of Figure 3c and comparison of the range values listed in Table 4, RB > RC > RD > RA was determined. Hence, the primary and secondary factors influencing the velocity reduction ratio were the net barrier interval and the bulk density, relative volume and flume slope, respectively.
According to the trend line of each factor in Figure 3c, (1) at a flume slope of 12°, the velocity reduction ratio reached its maximum value; (2) at a net barrier interval of 18 mm, the velocity reduction ratio was the highest; (3) at a bulk density of 17 kN/m3, the velocity reduction ratio reached its maximum value; and (4) at a relative volume of 1, the velocity reduction ratio was the highest. In summary, the velocity reduction ratio was the highest under the working condition of B1C3D4A3.
4.1.4. Bulk Density Attenuation Ratio
According to Table 4 and Figure 3d, among all the factors influencing the bulk density attenuation ratio, the points between factor A revealed the widest distribution and the maximum range, which indicated that factor A was the most important factor influencing the bulk density attenuation ratio. The distribution of the points of factor B was the densest, while its range was the smallest, and factor B was thus the least important influencing factor. The distribution of factors C and D was denser than that of factor A but less dense than that of factor B. Through graphic analysis and range value comparison, RA> RC> RD> RB was determined. Therefore, the primary and secondary factors influencing the bulk density attenuation ratio were the flume slope and the bulk density, relative volume and net barrier interval, respectively.
Based on analysis of the trend line of each factor in Figure 3b, (1) when the flume slope was 12°, the bulk density attenuation ratio was the highest; (2) when the net barrier interval was 30 mm, the bulk density attenuation ratio reached its maximum value; (3) when the bulk density attenuation ratio was 17 kN/m3, the bulk density attenuation ratio was the highest; and (4) when the relative volume was 1/3, the bulk density attenuation ratio reached its maximum value. In summary, the maximum bulk density attenuation ratio was obtained under the working condition of A3C3D1B2.
4.2. Variance Analysis Results
The variance analysis results are summarized in Table 5, and interaction between the different factors is neglected. Parameter α indicates the significance level of a given factor, including 0.1, 0.05 and 0.01. F0.1(3,3) = 5.39, F0.1(3,6) = 3.29, F0.05(3,3) = 9.28, F0.05(3,6) = 4.76, F0.01(3,3) = 29.46, F0.01(3,6) = 9.78. Table 5 reveals that the SS values (sum of squared deviations) of the considered factors were all larger than the errors except for the interception ratio. In regard to the interception ratio, the SS value of factor A (the flume slope) was smaller than the error.
Based on the F values listed in Table 5, the significance of the four considered factors is evident. For the interception ratio , the order of four influencing factors is the net barrier interval b > the bulk density γ > the relative volume Vr. For the blocking ratio (P), the order of four influencing factors is the net barrier interval b > the bulk density γ > the flume slope θ > the relative volume Vr, while for the velocity reduction ratio (D), the order of four influencing factors is the net barrier interval b > the bulk density γ > the relative volume Vr > the flume slope θ. The significance of the four considered factors for the bulk density attenuation ratio () is the flume slope θ > the bulk density γ > the net barrier interval b > the relative volume Vr.
5. Discussion
Range analysis is typically applied to characterize the discreteness of a series of data, but the corresponding results involve not only the errors originating from the variability in factors but also the errors in experimental operations, especially manually conducted flume tests. To describe the influence of the variables on the results more accurately, variance analysis, which is a statistical regression method, was applied, while range analysis served as a control and reference. Table 6 provides the rank list of the four influencing factors obtained via range and variance analysis, focusing on the interception ratio, blocking ratio, velocity reduction ratio, and bulk density attenuation ratio.
By comparing and analyzing the results of these two methods (Table 6), it was found that among the three evaluation targets of the interception ratio, blocking ratio and velocity reduction ratio, the importance order of the different influencing factors was the same.
In this regard, the most significant influencing factors of the interception ratio, blocking ratio and velocity reduction ratio were the net barrier interval and bulk density. The flume slope and relative volume were the least important influencing factors of the three evaluation targets. However, the flume slope attained the highest impact on the bulk density attenuation ratio. Moreover, the factor order in regard to the bulk density attenuation ratio revealed nuances, mainly focusing on the secondary impact factors. The range analysis result is flume slope > bulk density > net barrier interval > relative volume, and the variance analysis result is flume slope > bulk density > relative volume > net barrier interval. However, the main factors were the same, namely, the flume slope and bulk density.
Based on the orthogonal design method, it should be noted that the most important influencing factors of control and interception characteristics of debris-flow flexible net barriers are the net interval and debris flow bulk density.
When the net interval is small, the flexible net barrier is easily blocked, and the debris flow climbs the barrier and moves downstream. However, the larger the net interval is, the easier it is for the debris flow to pass through and the better the integrity of the passed debris flow.
In the interaction process, due to the debris flow impact and climb of the flexible net barrier, the slurry splash will carry a some solid particles through the barrier, so the flexible net barrier cannot completely intercept the debris flow, and the interception efficiency of debris flow cannot reach 100%. When the opening size of the flexible net barrier is too large, a small part of solid particles will remain. Most of the slurry can be effectively discharged through the barrier, the debris-slow flexible net barrier plays a very limited role in control and interception characteristics.
As the debris flow bulk density increases, the control and interception performance of the flexible net barrier begins to increase. When the debris flow accelerates to the front of the flexible net barrier, the slurry begins to block and climb the barrier. With the subsequent flow sustained impact, the initial blocked part begins to be damaged. The severity of damage is related to the viscosity of debris flow, and the higher the viscosity, the less damage will be caused. This is because of the strong integrity of debris flow with high viscosity and the closer wrapping between slurry and coarse particles.
The flume slope and the relative volume also affect the control and interception characteristics of the flexible net barrier to some extent. The flume slope mainly affects the velocity and depth of debris flow, as well as the particle composition. However, in the interaction process, the relationship between the relative volume and the control and interception characteristics are not linear. When the flexible net barrier is full of debris flow, it cannot effectively intercept debris flow.
6. Conclusions
To investigate the flexible net barrier effect on debris-flow control and interception, in this paper, the flume slope, flexible net barrier opening size, debris-flow bulk density and relative volume are chosen as the influencing factors based on the orthogonal experimental design method, and the interception ratio, blocking ratio, velocity reduction ratio and bulk density attenuation ratio are selected as the evaluation indexes. Moreover, the range and variance analysis are applied to theoretically analyze the test results. The main conclusions are as follows:
(1) As indicated in the statistical table comparing the results of the above two analysis methods, for each evaluation index, the significance order of the influencing factors is consistent, which verifies that the test result is reliable.
(2) The rank list of the variables is as follows: regarding the interception ratio, the significance order is net barrier interval > bulk density > relative volume > flume slope; regarding the blocking ratio, the significance order is net barrier interval > bulk density > flume slope > relative volume; and regarding the velocity reduction ratio, the significance order is net barrier interval > bulk density > relative volume > flume slope.
(3) In regard to the bulk density attenuation ratio, the rank list exhibits slight differences, but the main factors are the same. The primary and secondary influencing factors are both flume slope and bulk density. The significance order of range analysis result is flume slope > bulk density > net barrier interval > relative volume, and the significance order of variance analysis result is flume slope > bulk density > relative volume > net barrier interval.
(4) As shown in the statistical table of the evaluation indexes, and combined with analysis results of the different influencing factors, among the 16 groups of orthogonal experiments, the interception ratio has the largest value under working condition B1C4D3A2, the block ratio has the minimum value under working condition B4C1A1D2, the velocity reduction ratio has the maximum value under working condition B1C3D4A3, and the bulk density attenuation ratio has the largest value under working condition A3C3D1B2.
Author Contributions
Conceptualization, Z.X. and X.-Q.C.; methodology, Z.X. and X.-Q.C.; software, Z.X.; validation, Z.X.; formal analysis, Z.X. and J.-G.C.; investigation, Z.X.; resources, Z.X.; data curation, Z.X.; writing—original draft preparation, Z.X.; writing—review and editing, Z.X. and J.-G.C.; visualization, Z.X.; supervision, X.-Q.C.; project administration, X.-Q.C.; funding acquisition, X.-Q.C. All authors have read and agreed to the published version of the manuscript.
Funding
This research was funded by the National Science Fund for Distinguished Young Scholars, grant number 41925030.
Data Availability Statement
All data generated or used during the study are available from the corresponding author by request.
Conflicts of Interest
The authors declare no conflict of interest.
References
- Cui, P. Impact of Debris Flow on River Cannel in the upper Reaches of the Yangtse River. Intern J. Sediment Res. 1999, 14, 201–203. [Google Scholar]
- Iverson, R.M. The physics of debris flows. Rev. Geophys. 1997, 35, 245–296. [Google Scholar] [CrossRef]
- Hungr, O.; Leroueil, S.; Picarelli, L. The Varnes classification of landslide types, an update. Landslides 2014, 11, 167–194. [Google Scholar] [CrossRef]
- Tang, C.; Zhu, J.; Li, W.; Liang, J.T. Rainfall-triggered debris flows following the Wenchuan earthquake. Bull. Eng. Geol. Environ. 2009, 68, 187–194. [Google Scholar] [CrossRef]
- Zhou, B.F.; Li, D.J.; Luo, D.F. Guide to Prevention of Debris Flow; Science Press: Beijing, China, 1991; pp. 12–90. (In Chinese) [Google Scholar]
- Li, D.J. Theory and Practice of Debris Flow Disaster Mitigation; Science Press: Beijing, China, 1997; pp. 32–164. (In Chinese) [Google Scholar]
- Fei, X.J.; Shu, A.P. Movement Mechanism and Disaster Control for Debris Flow; Tsinghua University Press: Beijing, China, 2004; pp. 236–268. (In Chinese) [Google Scholar]
- He, Y.; Cheng, M. Research on the application of flexible system to mitigation of mudflow. Res. Soil Water Conserv. 2004, 14, 292–294. (In Chinese) [Google Scholar]
- Mizuyama, T. Structural countermeasures for debris flow disasters. Int. J. Eros. Control. Eng. 2008, 1, 38–43. [Google Scholar] [CrossRef]
- Wendeler, C.; McArdell, B.W.; Rickenmann, D.; Volkwein, A.; Roth, A.; Denk, M. Field Testing and Numerical Modeling of Flexible Debris Flow Barriers. In Proceedings of the International Conference on Physical Modelling in Geotechnics, Hong Kong, 4–6 August 2006. [Google Scholar]
- Volkwein, A.; Wendeler, C.; Mcardell, B.; Roth, A. Mitigation of Debris Flow Hazard by Means of Flexible Barriers. In Proceedings of the International Disaster Reduction Conference, Davos, Switzerland, 31 August 2006; pp. 616–618. [Google Scholar]
- Wendeler, C.; Volkwein, A. Laboratory tests for the optimization of mesh size for flexible debris-flow barriers. Nat. Hazards Earth Syst. Sci. 2015, 15, 2597–2604. [Google Scholar] [CrossRef]
- Armanini, A. On the dynamic impact of debris flows. Recent Dev. Debris Flows 2007, 64, 208–226. [Google Scholar]
- Brighenti, R.; Segalini, A.; Ferrero, A.M. Debris flow hazard mitigation: A simplified analytical model for the design of flexible barriers. Comput. Geotech. 2013, 54, 1–15. [Google Scholar] [CrossRef]
- Canelli, L.; Ferrero, A.M.; Migliazza, M.; Segalini, A. Debris flow risk mitigation by the means of rigid and flexible barriers—Experimental tests and impact analysis. Nat. Hazards Earth Syst. Sci. 2012, 12, 1693–1699. [Google Scholar] [CrossRef]
- Song, D.; Bai, Y.; Chen, X.Q.; Zhou, G.G.; Choi, C.E.; Pasuto, A.; Peng, P. Assessment of debris flow multiple-surge load model based on the physical process of debris-barrier interaction. Landslides 2022, 19, 165–1177. [Google Scholar] [CrossRef]
- Huo, M.; Zhou, J.-W.; Yang, X.-G.; Zhou, H.-W. Dynamical evolution properties of debris flows controlled by different mesh-sized flexible net barriers. Arab. J. Geosci. 2018, 11, 465. [Google Scholar] [CrossRef]
- Liu, C.Q.; Xu, C.J.; Chen, X. Failure cause analysis and countermeasures design of flexible debris flow protection system. J. Water Resour. Archit. Eng. 2017, 15, 6–11. [Google Scholar]
- Ng, C.W.W.; Song, D.; Choi, C.E.; Koo, R.C.H.; Kwan, J.S.H. A novel flexible barrier for landslide impact in centrifuge. Géotechnique Lett. 2016, 6, 221–225. [Google Scholar] [CrossRef]
- Ng, C.; Song, D.; Choi, C.; Liu, L.; Kwan, J.; Koo, R.; Pun, W. Impact mechanisms of granular and viscous flows on rigid and flexible barriers. Can. Geotech. J. 2017, 54, 188–206. [Google Scholar] [CrossRef]
- Sun, H.W.; Law, R.P.H. A preliminary study on impact of landslide debris on flexible barriers. GEO Rep. No. 2015, 309, 47. [Google Scholar]
- Huo, M.; Zhou, J.-W.; Yang, X.-G.; Zhou, H.-W. Effects of a flexible net barrier on the dynamic behaviours and interception of debris flows in mountainous areas. J. Mt. Sci. 2017, 14, 1903–1918. [Google Scholar] [CrossRef]
- Song, D.; Zhou, G.G.; Xu, M.; Choi, C.; Li, S.; Zheng, Y. Quantitative analysis of debris-flow flexible barrier capacity from momentum and energy perspectives. Eng. Geol. 2019, 251, 81–92. [Google Scholar] [CrossRef]
- Kwan, J.S.H.; Chan, S.L.; Cheuk, J.C.Y.; Koo, R.C.H. A case study on an open hillside landslide impacting on a flexible rockfall barrier at Jordan Valley, Hong Kong. Landslides 2014, 11, 1037–1050. [Google Scholar] [CrossRef]
- Li, X.; Zhao, J. A unified CFD—DEM approach for modeling of debris flow impacts on flexible barriers. Int. J. Numer. Anal. Methods Geomech. 2018, 42, 1643–1670. [Google Scholar]
- Sha, S.; Dyson, A.P.; Kefayati, G.; Tolooiyan, A. Simulation of debris flow-barrier interaction using the smoothed particle hydrodynamics and coupled Eulerian Lagrangian methods. Finite Elem. Anal. Des. 2023, 214, 103864. [Google Scholar] [CrossRef]
- Li, Y.; Liu, J.; Su, F.; Xie, J.; Wang, B. Relationship between grain composition and debris flow characteristics: A case study of the Jiangjia Gully in China. Landslides 2015, 12, 19–28. [Google Scholar] [CrossRef]
- Fang, K.T.; Liu, M.Q.; Zhou, Y.D. Design and Modeling of Experiments; Higher Education Press: Beijing, China, 2011; pp. 52–127. (In Chinese) [Google Scholar]
- Li, Y.Y.; Hu, C.R. Experiment Design and Data Processing; Chemical Industry Press: Beijing, China, 2017; pp. 153–192. (In Chinese) [Google Scholar]
- Jia, C.; Zhang, K.; Zhang, Q.Y.; Xu, K. Research on multifactor optimization of underground laminated salt rock storage group based on orthogonal experimental design. Rock Soil Mech. 2014, 35, 1718–1726. (In Chinese) [Google Scholar]
Figure 1.
Schematic diagram and plan view of the experimental facility.


Figure 2.
Particle size distribution of the debris-flow material.

Figure 3.
Relationships between the factors and targets.


Table 1.
Factors and levels of the orthogonal experiment.
| Level | A | B | C | D |
|---|---|---|---|---|
| Flume Slope θ (°) | Net Barrier Interval b (mm) | Bulk Density γ (kN/m3) | Relative Volume Vr | |
| 1 | 6 | 18 | 12 | 1/3 |
| 2 | 9 | 30 | 15 | 1/2 |
| 3 | 12 | 38 | 17 | 2/3 |
| 4 | 15 | 50 | 21 | 1 |
Table 2.
Experimental schemes.
| No. | Factors | ||||
|---|---|---|---|---|---|
| θ (°) | b (mm) | Error | γ (kN/m3) | Vr | |
| 1 | 6 | 18 | 1 | 12 | 1/3 |
| 2 | 6 | 30 | 2 | 15 | 1/2 |
| 3 | 6 | 38 | 3 | 17 | 2/3 |
| 4 | 6 | 50 | 4 | 21 | 1 |
| 5 | 9 | 18 | 2 | 17 | 1 |
| 6 | 9 | 30 | 1 | 21 | 2/3 |
| 7 | 9 | 38 | 4 | 12 | 1/2 |
| 8 | 9 | 50 | 3 | 15 | 1/3 |
| 9 | 12 | 18 | 3 | 21 | 1/2 |
| 10 | 12 | 30 | 4 | 17 | 1/3 |
| 11 | 12 | 38 | 1 | 15 | 1 |
| 12 | 12 | 50 | 2 | 12 | 2/3 |
| 13 | 15 | 18 | 4 | 15 | 2/3 |
| 14 | 15 | 30 | 3 | 12 | 1 |
| 15 | 15 | 38 | 2 | 21 | 1/3 |
| 16 | 15 | 50 | 1 | 17 | 1/2 |
Table 3.
Experimental results.
| No. | Targets | |||
|---|---|---|---|---|
| Interception Ratio (%) | Blocking Ratio (%) | Velocity Reduction Ratio (%) | Bulk Density Attenuation Ratio (%) | |
| 1 | 33.25 | 46.72 | 12.74 | 7.5 |
| 2 | 16.26 | 24 | 12.42 | 13.33 |
| 3 | 10.25 | 4.55 | 32.65 | 15.88 |
| 4 | 10.34 | 6.25 | 39.34 | 6.19 |
| 5 | 42.38 | 100 | 75.41 | 25.29 |
| 6 | 41.57 | 77.2 | 6.15 | 21.9 |
| 7 | 0 | 0 | 12.13 | 10 |
| 8 | 0 | 0 | 8.88 | 24.67 |
| 9 | 60.96 | 97.22 | 64.22 | 22.86 |
| 10 | 9.43 | 31.2 | 35.56 | 27.65 |
| 11 | 1.6 | 7.95 | 41.11 | 18.67 |
| 12 | 0 | 0 | 21.53 | 14.17 |
| 13 | 36.88 | 100 | 48.1 | 8.67 |
| 14 | 4.25 | 20 | 5 | 2.5 |
| 15 | 20.5 | 44.32 | 12.9 | 7.14 |
| 16 | 0 | 0 | 23.08 | 11.76 |
Table 4.
Range analysis of the experimental results.
| Targets | Range Analysis | Factors | ||||
|---|---|---|---|---|---|---|
| A | B | Error | C | D | ||
| Interception ratio (%) | K1 | 70.10 | 173.47 | 76.42 | 37.50 | 63.18 |
| K2 | 83.95 | 71.51 | 79.14 | 54.74 | 77.22 | |
| K3 | 71.99 | 32.35 | 75.46 | 62.06 | 88.70 | |
| K4 | 61.63 | 10.34 | 56.65 | 133.37 | 58.57 | |
| k1 | 17.53 | 43.37 | 19.11 | 9.38 | 15.80 | |
| k2 | 20.99 | 17.88 | 19.79 | 13.69 | 19.31 | |
| k3 | 18.00 | 8.09 | 18.87 | 15.52 | 22.18 | |
| k4 | 15.41 | 2.59 | 14.16 | 33.34 | 14.64 | |
| R | 5.58 | 40.78 | 5.62 | 23.97 | 7.53 | |
| Primary and secondary factors | B C D A | |||||
| Blocking ratio (%) | K1 | 81.52 | 343.94 | 131.87 | 66.72 | 122.24 |
| K2 | 177.20 | 152.40 | 168.32 | 131.95 | 121.22 | |
| K3 | 136.37 | 56.82 | 121.77 | 135.75 | 181.75 | |
| K4 | 164.32 | 6.25 | 137.45 | 224.99 | 134.20 | |
| k1 | 20.38 | 85.99 | 32.97 | 16.68 | 30.56 | |
| k2 | 44.30 | 38.10 | 42.08 | 32.99 | 30.31 | |
| k3 | 34.09 | 14.21 | 30.44 | 33.94 | 45.44 | |
| k4 | 41.08 | 1.56 | 34.36 | 56.25 | 33.55 | |
| R | 23.92 | 84.42 | 11.64 | 39.57 | 15.13 | |
| Primary and secondary factors | B C A D | |||||
| Velocity reduction ratio (%) | K1 | 97.15 | 200.47 | 83.08 | 51.40 | 70.08 |
| K2 | 102.57 | 59.13 | 122.26 | 110.51 | 111.85 | |
| K3 | 162.42 | 98.79 | 110.75 | 166.70 | 108.43 | |
| K4 | 89.08 | 92.83 | 135.13 | 122.61 | 160.86 | |
| k1 | 24.29 | 50.12 | 20.77 | 12.85 | 17.52 | |
| k2 | 25.64 | 14.78 | 30.57 | 27.63 | 27.96 | |
| k3 | 40.61 | 24.70 | 27.69 | 41.68 | 27.11 | |
| k4 | 22.27 | 23.21 | 33.78 | 30.65 | 40.22 | |
| R | 18.34 | 35.34 | 13.01 | 28.83 | 22.70 | |
| Primary and secondary factors | B C D A | |||||
| Bulk density attenuation ratio (%) | K1 | 42.90 | 64.32 | 59.83 | 34.17 | 66.96 |
| K2 | 81.86 | 65.38 | 59.93 | 65.34 | 57.95 | |
| K3 | 83.35 | 51.69 | 65.91 | 80.58 | 60.62 | |
| K4 | 30.07 | 56.79 | 52.51 | 58.09 | 52.65 | |
| k1 | 10.73 | 16.08 | 14.96 | 8.54 | 16.74 | |
| k2 | 20.47 | 16.35 | 14.98 | 16.34 | 14.49 | |
| k3 | 20.84 | 12.92 | 16.48 | 20.15 | 15.16 | |
| k4 | 7.52 | 14.20 | 13.13 | 14.52 | 13.16 | |
| R | 13.32 | 3.42 | 3.35 | 11.60 | 3.58 | |
| Primary and secondary factors | A C D B | |||||
Table 5.
Variance analysis of the experimental results.
| Targets | Factors | Sum of Squared Deviations | Degrees of Freedom | Mean Square | Values of F | α |
|---|---|---|---|---|---|---|
| Interception ratio | Flume slope | 63.48 | 3 | 21.16 | ||
| Barrier interval | 3917.61 | 3 | 1305.87 | 54.79 | *** | |
| Bulk density | 1338.31 | 3 | 446.10 | 18.72 | *** | |
| Relative volume | 141.06 | 3 | 47.02 | 1.97 | ||
| Error | 79.52 | 3 | 26.51 | |||
| New error | 143 | 6 | 23.83 | |||
| Total | 5539.98 | 15 | ||||
| Blocking ratio | Flume slope | 1352.08 | 3 | 450.69 | 4.48 | |
| Barrier interval | 16,638.29 | 3 | 5546.10 | 55.15 | *** | |
| Bulk density | 3169.01 | 3 | 1056.34 | 10.50 | ** | |
| Relative volume | 611.18 | 3 | 203.73 | 2.03 | ||
| Error | 301.72 | 3 | 100.57 | |||
| Total | 22,072.28 | 15 | ||||
| Velocity reduction ratio | Flume slope | 843.59 | 3 | 281.2 | 2.29 | |
| Barrier interval | 2790.39 | 3 | 930.13 | 7.56 | * | |
| Bulk density | 1694.16 | 3 | 564.72 | 4.59 | ||
| Relative volume | 1038.69 | 3 | 346.23 | 2.82 | ||
| Error | 368.90 | 3 | 122.97 | |||
| Total | 6735.73 | 15 | ||||
| Bulk density attenuation ratio | Flume slope | 552.62 | 3 | 184.21 | 24.50 | ** |
| Barrier interval | 31.53 | 3 | 10.51 | 1.40 | ||
| Bulk density | 280.52 | 3 | 93.51 | 12.43 | ** | |
| Relative volume | 26.56 | 3 | 8.85 | 1.18 | ||
| Error | 22.56 | 3 | ||||
| Total | 913.79 | 15 |
Notes: * means significance at α = 0.1; ** means significance at α = 0.05; and *** means significance at α = 0.01.
Table 6.
Summary of the range and variance analysis results.
| Targets | Rank | Range Analysis | Variance Analysis | |
|---|---|---|---|---|
| Interception ratio | 1 | Net barrier interval | = | Net barrier interval |
| 2 | Bulk density | Bulk density | ||
| 3 | Relative volume | Relative volume | ||
| 4 | Flume slope | Flume slope | ||
| Blocking ratio | 1 | Net barrier interval | = | Net barrier interval |
| 2 | Bulk density | Bulk density | ||
| 3 | Flume slope | Flume slope | ||
| 4 | Relative volume | Relative volume | ||
| Velocity reduction ratio | 1 | Net barrier interval | = | Net barrier interval |
| 2 | Bulk density | Bulk density | ||
| 3 | Relative volume | Relative volume | ||
| 4 | Flume slope | Flume slope | ||
| Bulk density attenuation ratio | 1 | Flume slope | ≈ | Flume slope |
| 2 | Bulk density | Bulk density | ||
| 3 | Relative volume | Net barrier interval | ||
| 4 | Net barrier interval | Relative volume |
Disclaimer/Publisher’s Note: The statements, opinions and data contained in all publications are solely those of the individual author(s) and contributor(s) and not of MDPI and/or the editor(s). MDPI and/or the editor(s) disclaim responsibility for any injury to people or property resulting from any ideas, methods, instructions or products referred to in the content. |
© 2023 by the authors. Licensee MDPI, Basel, Switzerland. This article is an open access article distributed under the terms and conditions of the Creative Commons Attribution (CC BY) license (https://creativecommons.org/licenses/by/4.0/).
Share and Cite
MDPI and ACS Style
Xiong, Z.; Chen, X.-Q.; Chen, J.-G. Control and Interception Characteristics of the Debris-Flow Flexible Net Barrier Based on Orthogonal Design. Water 2023, 15, 1809. https://doi.org/10.3390/w15101809
AMA Style
Xiong Z, Chen X-Q, Chen J-G. Control and Interception Characteristics of the Debris-Flow Flexible Net Barrier Based on Orthogonal Design. Water. 2023; 15(10):1809. https://doi.org/10.3390/w15101809
Chicago/Turabian StyleXiong, Zhen, Xiao-Qing Chen, and Jian-Gang Chen. 2023. "Control and Interception Characteristics of the Debris-Flow Flexible Net Barrier Based on Orthogonal Design" Water 15, no. 10: 1809. https://doi.org/10.3390/w15101809
Note that from the first issue of 2016, this journal uses article numbers instead of page numbers. See further details here.