Article

Removal of Cefixime from Wastewater Using a Superb nZVI/Copper Slag Nanocomposite: Optimization and Characterization

1
Department of Nano-Chemical Engineering, Faculty of Advanced Technologies, Shiraz University, Shiraz 71557-13876, Iran
2
Nanotechnology Research Institute, Shiraz University, Shiraz 71557-13876, Iran
3
Department of Chemical Engineering, School of Chemical and Petroleum Engineering, Shiraz University, Shiraz 71557-13876, Iran
4
Nanomaterials and Polymer Nanocomposites Laboratory, School of Engineering, University of British Columbia, Kelowna, BC V1V 1V7, Canada
5
Department of Chemical Engineering, National Taiwan University of Science and Technology, Taipei City 106335, Taiwan
*
Authors to whom correspondence should be addressed.
Water 2023, 15(10), 1819; https://doi.org/10.3390/w15101819
Submission received: 18 February 2023 / Revised: 4 May 2023 / Accepted: 5 May 2023 / Published: 10 May 2023

Abstract

:
Nowadays, hospital wastewater contains a high concentration of toxic pharmaceutical contaminants, posing a significant threat to the environment, and human and animal life. Cefixime (CFX) is one such toxic contaminant that has a detrimental impact on both aquatic and terrestrial ecosystems. Therefore, it is essential to remove this compound using non-toxic and environmentally friendly procedures to ensure healthy drinking water. In this study, a low-cost and eco-friendly nano adsorbent (nZVI/copper slag) was synthesized and characterized using FESEM, XRD, EDX, FTIR, and zeta potential to remove CFX from wastewater. The Response Surface Methodology (RSM) was used to evaluate the effects of experimental factors including adsorbent dosage (2–10 g/L), pollutant concentration (10–30 mg/L), pH (2–10), and contact time (10–50 min) for efficient CFX elimination. The optimal conditions (adsorbent dosage: 7.79 g/L, pollutant concentration: 19.42 mg/L, pH: 4.59, and reaction time: 36.17 min) resulted in 98.71% CFX removal. The adsorption isotherm and kinetics data showed that the pseudo-second-order kinetics and Langmuir isotherm models were appropriate for CFX elimination. Furthermore, the nano adsorbent demonstrated 90% CFX elimination after up to six repeated cycles in regeneration and reusability testing. Finally, the nZVI/CS nano adsorbent can be an effective and promising solution for removing CFX from wastewater.

1. Introduction

The production of safe drinking water is one of the most critical issues that has received international attention [1,2]. In addition, it is worth noting that only 1.2% of the world’s water supply is comprised of freshwater, and of that, only 0.02% is considered suitable for human use [3].
Aquatic ecosystems are contaminated by a variety of pollutants, including organic and inorganic substances [4,5,6]. Most of these pollutants are non-biodegradable, difficult to remove, and do not completely permeate the subsurface due to their polar structure. Pharmaceuticals are specifically known as “Emerging Contaminants” (ECs) because of their potential for damaging both humans and the environment. Environmental contaminants can enter the environment from various sources, including untreated hospital sludge, domestic waste, emissions from commercial antibiotic manufacturers, and others [7]. Medications are extensively used and are highly hazardous, as their presence in water supplies can cause antibiotic resistance (ABR) in harmful elements in the environment [8].
Cefixime trihydrate (CFX) is one of the most effective third-generation cephalosporin antibiotics used to treat various bacterial infections in both humans and animals, including gonorrhea, syphilis, and ear infections [7,9]. However, due to its poor solubility in water and chemical instability, it has restricted bioavailability of approximately 40 to 50%. Additionally, various dosages of biologically non-active CFX metabolites can be detected in the urine or blood after 24 h [10]. Nowadays, the growth of antibiotic-resistant bacteria and genes in wastewater is one of the biggest health concerns. Therefore, it is crucial to develop an effective method for removing them from water sources [11].
Nowadays, in order to remove CFX in wastewater, many different methods have been presented, including photocatalysis [12,13,14], membrane [15,16,17], photo-Fenton [18], biological [19,20], and adsorption [21,22,23,24]. Indeed, the mentioned approaches not only have a couple of cons, but they also come with a large number of costs, which is why they are not suggested for this application and some of the treatment routes can result in the change in structures of organic molecules and the production of secondary products that are more perilous. Hence, providing a successful method for removing pharmaceutical pollutants is vital. Actually, adsorption is one of the easiest, healthiest, most economical, and environmentally friendly methods for eliminating a variety of contaminants from an aquatic solution. Adsorption mechanisms involve the removal of contaminants from wastewater by attaching them to the surface of an adsorbent material. There are several types of adsorption mechanisms used in wastewater treatment, including physical adsorption (attachment of contaminants to the surface of an adsorbent material through weak van der Waals forces), chemisorption (formation of chemical bonds between the adsorbent material and the contaminants), and ion exchange (exchange of ions between the adsorbent material and the contaminants), resulting in the removal of the contaminants from the wastewater. It is important to stress that there are four necessary variables such as pH, reaction time, adsorbent dosage, and pollutant concentration, that affect the performance of elimination in the adsorption process. Azadeh et al. [25] examined the removal of CFX at contact time (120 min) and pollutant concentration (10 mg/L) and found 95.6% removal efficiency. Moreover, at a contaminant concentration of 10 mg/L and pH = 5, the Fe3O4@MWCNT-CdS nanocomposite was able to eliminate CFX with an efficiency of 87.44% [19]. In general, a few previous works have several problems: (1) low pollutant concentration, (2) high contact time, and (3) a shortage of optimal operating parameters. It is to be noted that the longer reaction time is this work’s flaw. In other words, the high amount of contact time is not economical, while the current work provides a suitable adsorbent for the removal of pollution in the wastewater treatment process. Finally, the current study has solved the problems mentioned above. It should be emphasized that the current work optimizes these significant parameters with the aid of successful Design-Expert software.
Recently, a couple of adsorbents were synthesized, such as poly 3-methacryloyl amino propyl-trimethylammonium chloride (PMA PTAC) [26], Fe3O4@MWCNTs-CdS Nanocomposite [19], magnetic nanoparticles–rGO-chitosan composite beads [27], and a variety of multiples of them, including iron oxide-coated sand [28], and others, have been utilized toward the removal of CFX from aqueous media. Nowadays, zero-valent iron (nZVI) is one of the most impressive adsorbents in wastewater treatment applications ranging from removing antibiotics to various other uses. Nevertheless, the drawbacks of (nZVI) in powder form include a high inclination to accumulate, poor stability, a decline in specific surface area, a lower percentage of different pollutants elimination, and their ability to enter subsurface water supplies, causing a variety of environmental hazards. Hence, providing a remarkable approach toward improving the efficiency of nZVI is significant.
Although numerous methods [29,30,31,32,33,34] were utilized to fix nZVI on a wide variety of substrates in order to boost performance and lessen shortcomings, such as agglomeration, and prevent the creation of big particles, the current work provides a high-candidate substrate to improve the yield of nZVI. Indeed, it is significant to stress that the current study uses copper slag (CS) to synthesize nZVI/CS as a superb composite toward removal of cefixime in water sources for the first time. Copper slag is a by-product resulting from the pyrometallurgical processes used to produce copper from copper concentrates [35]. It is also known as ferro sand and is typically composed mainly of silicon and iron oxide. Additionally, it includes aluminum oxide, alkali metal oxides, lime, and trace amounts of other metals such as antimony, zinc, and arsenic [36]. Copper slag has many benefits in supporting the adsorption of pharmaceutical pollutants because it is cost-effective [29], has a large surface area [37] that enhances the support’s adsorption capacity, has high porosity that increases the accessibility of the adsorbate to the support’s active sites, is environmentally friendly, and is stable and reusable [38,39].
Actually, these concerns and expenses can be considerably lessened through recycling or repurposing industrial by-products. Industrial by-products of metallic operations such as iron sand [40], sand with an iron-manganese oxide coating and steel industry blast furnace slag, copper slag [41], blast furnace slag [42], sulfuric acid acidified laterite [43], and similar sources have recently been utilized for contaminant elimination from aqueous solutions due to their accessibility and flexibility of use. On the other hand, these adsorbents have significant drawbacks, such as a poor capacity for adsorption and a slow rate of reaction. In order to improve these defects and boost the removal efficiency, CS, as a kind of material produced from matte smelting and Cu purifying, was used in this study. The great mechanical strength, stability, abrasion resistance, and high density of this by-product are all advantages [44,45].
The primary goal of this study is to employ the synthesized nZVI/CS nanocomposite to eliminate cefixime from wastewater. To the best of our knowledge, there is no investigation in the literature focusing on the elimination of CFX using nZVI/CS with the help of Response Surface Methodology (RSM). Furthermore, the synthesized nanocomposite was characterized by employing FESEM, XRD, EDX, FTIR, and zeta potential analyses. The performance of the adsorbent in cefixime elimination was investigated as a function of adsorbent dosage, pollutant concentration, contact time, and pH to optimize the operating conditions. Likewise, adsorption isotherms and the kinetic study of cefixime elimination from aqueous solutions were assessed.

2. Experimental

2.1. Materials

The Pishro Ravesh Parseh Company provides pure CS towards utilization in current research and is produced from the Sarcheshmeh Copper Mine in Kerman, Iran. In addition, the aqueous ferric chloride hexahydrate (FeCl3·6H2O), sodium borohydride (NaBH4), hydrochloric acid (37%) (HCl), absolute ethanol (99%), sodium hydroxide (NaOH), sulfuric acid (98%) (H2SO4), and sodium meta arsenite were bought from Merck Company.

2.2. Preparation of nZVI/CS

In order to synthesize the nZVI/copper slag nanocomposite, firstly, 10 g of copper slag was mixed with 50 mL of 0.1 M H2SO4 solution and stirred for 3 h at 60 °C. The copper slag was then removed from the acidic solution, washed repeatedly with deionized water and ethanol, and dried in an oven for 15 h at 100 °C. Next, the traditional method of reducing Fe(III) by NaBH4 and using copper slag as a support material was employed to prepare nZVI. In a three-neck flask, 0.8 g of copper slag and FeCl3·6H2O were added to a solution of water and ethanol (20 mL, 3:2 v/v) and stirred with a magnetic stirrer for 20 min at ambient temperature and atmospheric pressure. Subsequently, 1 g of NaBH4 solution in 20 mL of deionized water was gradually added to the flask solution, and the solution was stirred continuously for another 20 min under a pure nitrogen atmosphere to prevent oxidation of the adsorbent. The resulting black and white foul was then washed thoroughly with a 50 mL, 3:2 v/v water/ethanol solution to remove any impurities and dried for 24 h at 60 °C in an N2 atmosphere to prevent oxidation and efficiency loss. Finally, the manufactured adsorbent was placed in a lidded container to maintain its quality. Figure 1 shows the synthesis process of the nZVI/copper slag nanocomposite.

2.3. Characterization of Nanocomposite

To analyze the structure and morphology of both nZVI/copper slag nanocomposite and pure CS, a TESCAN MIRA3 model Field Emission Scanning Electron Microscope (FE-SEM) equipped with a SAMX detector was used. In addition, the elemental composition of the adsorbent was studied using energy-dispersive X-ray spectroscopy (EDX) with a TESCAN-Vega 3. The X-ray diffraction (XRD) was performed on a PW1730 PHILIPS device (Netherlands) equipped with Cu K radiation at a voltage of 40 kV and a flow of 30 mA with a step size of 0.05. The chemical structure of the synthesized adsorbent, including the surface functional groups, was analyzed using Fourier-transform infrared (FT-IR) spectroscopy from Germany. The specific surface area of the nano adsorbent was determined using Brunauer–Emmett–Teller (BET) N2 adsorption technique on a BELSORP Mini II (Japan) after drying the samples with a steady N2 flow for 12 h at 120 °C. The point of zero-charge and zeta potential of the nanocomposite were evaluated using a Horiba system (Japan) before measuring the As (I) content of the solution using a coupled plasma mass spectrometer model.

2.4. Experimental Design and Statistical Analysis of Cefixime Elimination

The effectiveness of 4 significant parameters on the performance of adsorption of pollutants by the generated nanocomposite was examined via the Design-Expert software. The adsorption performance of CFX was assessed as a response, and the response surface methodology (RSM) utilizing the central composite design (CCD) approach was implemented in order to design and optimize the adsorption process utilizing four independent parameters, including reaction time (min), adsorbent dosage (g/L), initial CFX concentration (mg/L), and pH. According to this method, each factor has 5 levels, and the distance between each level and the amount of the parameter is measured between the experiment’s center point and its axis points. Overall, Table 1 summarizes the outcomes of the 30 experimental runs that the program recommended.

2.5. Adsorption Experiments

In the current study, the adsorption performance of CFX from aqueous solutions was evaluated by adding 10 mL of a known concentration solution of cefixime to a test tube containing an adsorbent while the solution was stirred continuously for 40 min at room temperature (25 °C) and ambient conditions (aerobic) using a magnetic stirrer. Subsequently, the samples were centrifuged for 3 min at 7000 rpm after 5 min. Moreover, to investigate the influence of four key parameters, the experiments were conducted in a test tube using a volume of 10 mL, and pH was adjusted using diluted solutions of HCl and NaOH. Finally, the percentages of removal of CFX were calculated using (Equation (1)):
R e % = ( C 0 C t ) C 0 × 100
where Re is the percentage of removal, C0 and Ct are the initial and final pollutant concentrations, respectively.

3. Results and Discussion

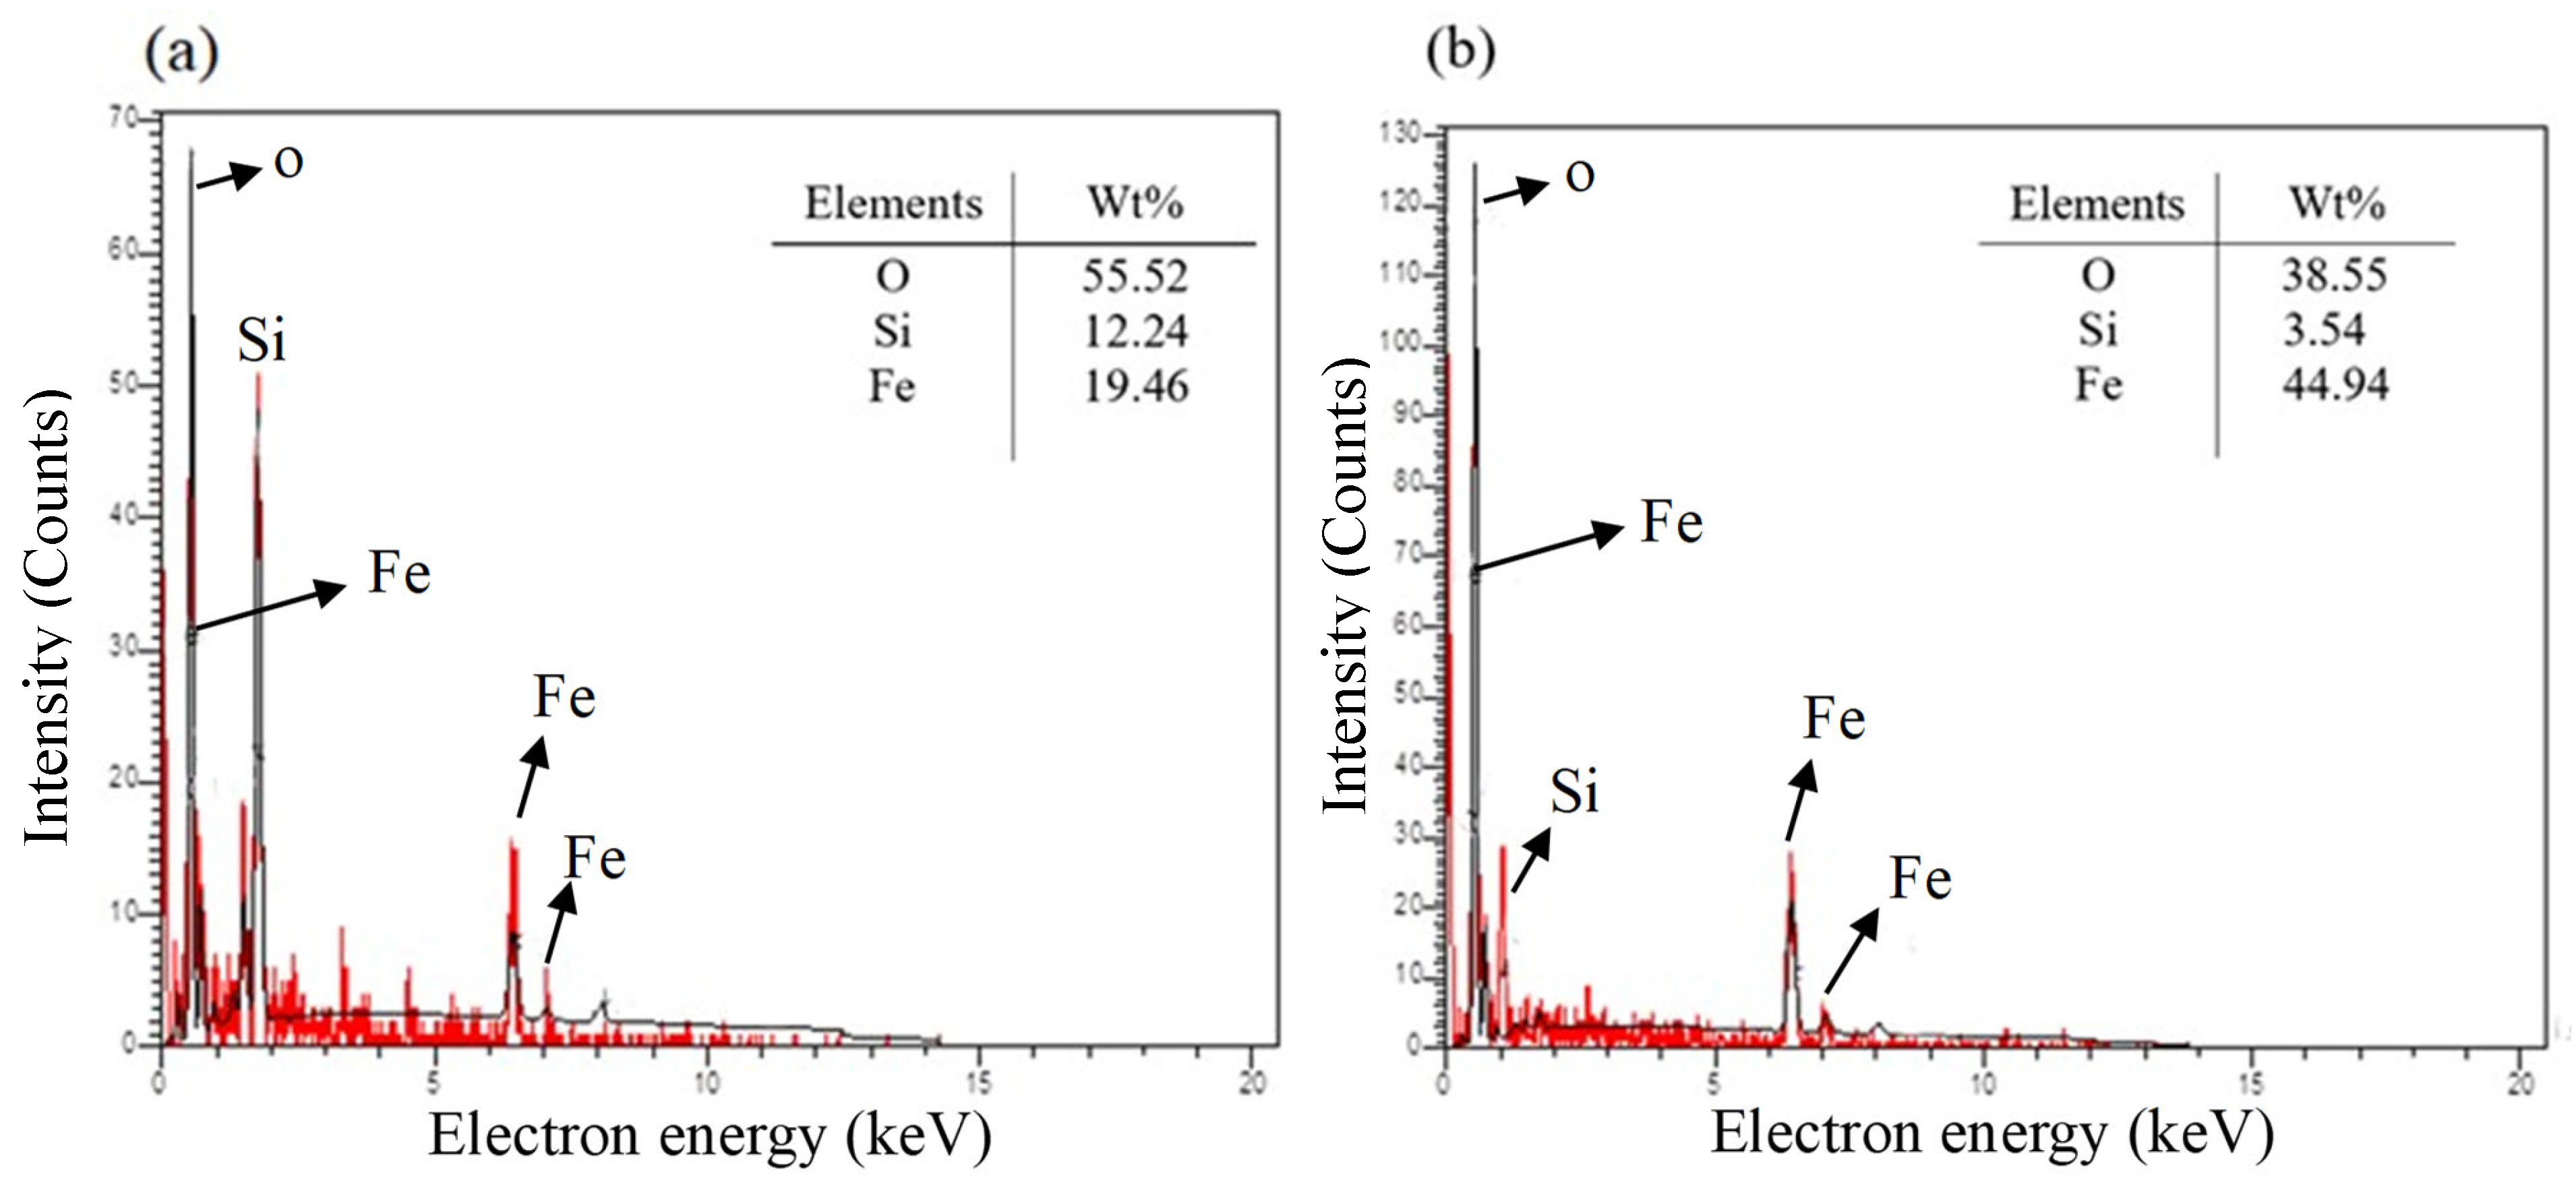
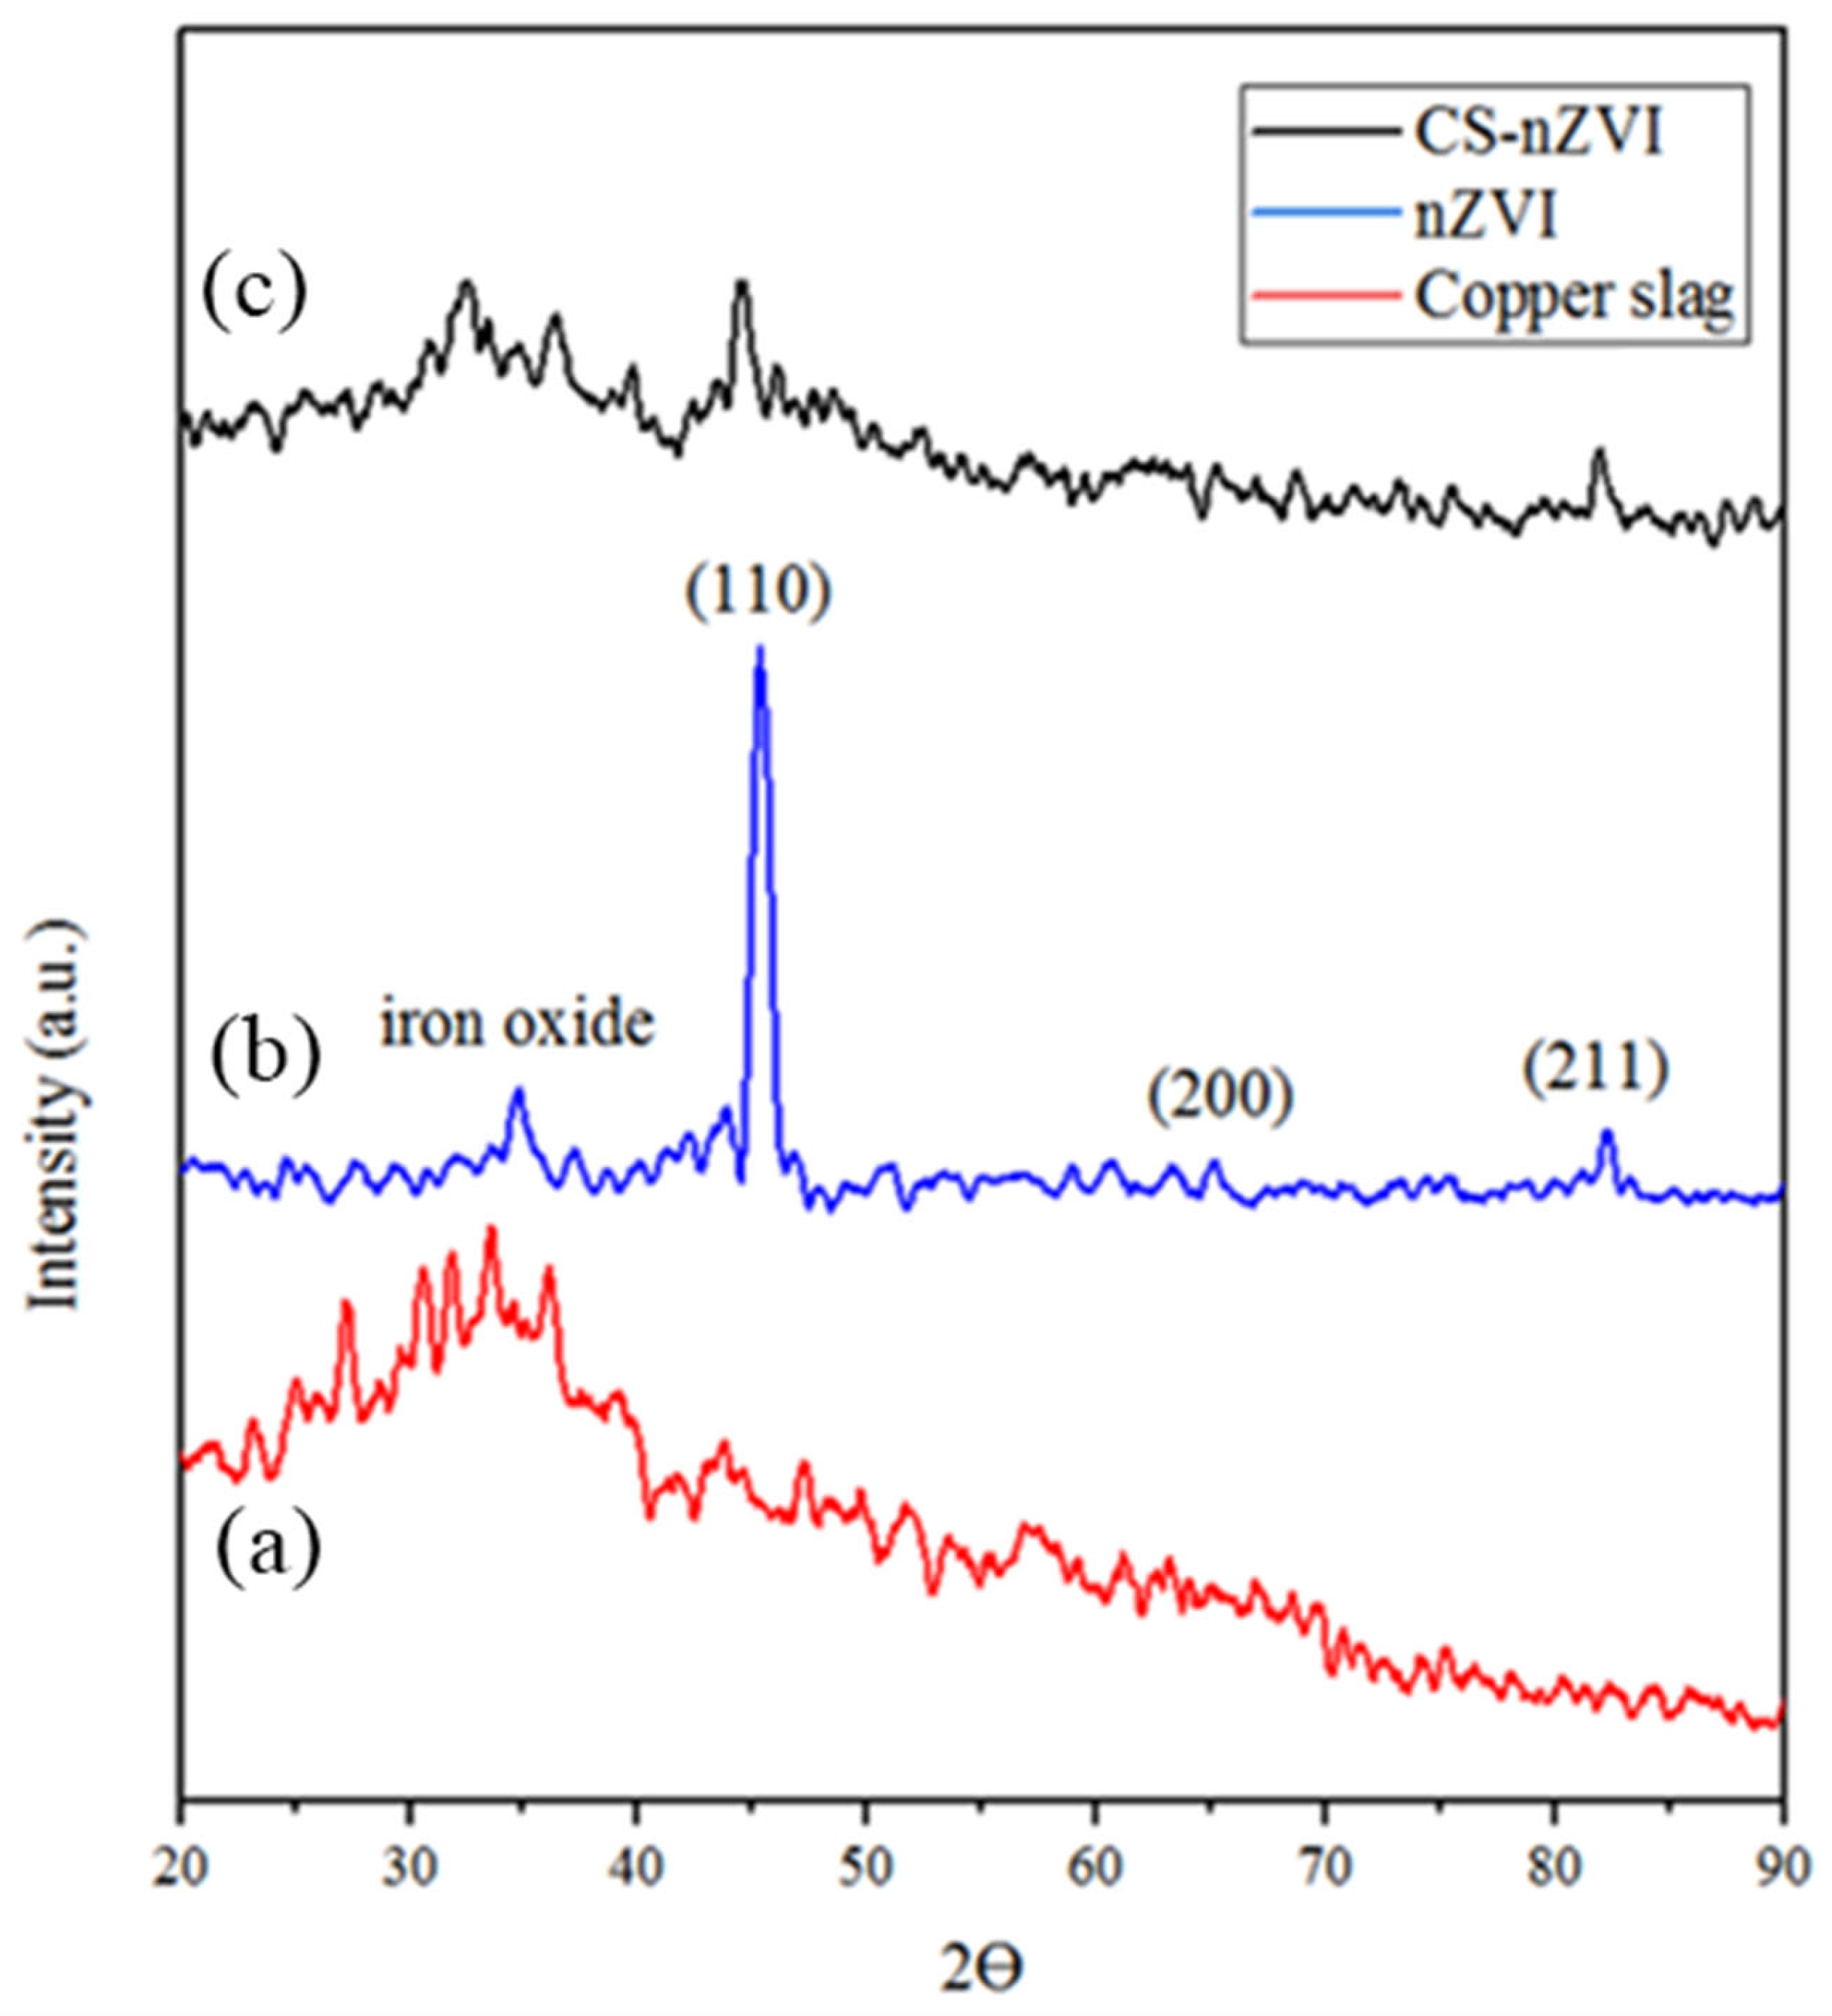
3.1. Characterization

The surface morphology was determined through FE-SEM analysis. Figure 2 shows FE-SEM images of the nZVI/CS nanocomposite and pure CS. Disordered particles associated with magnetite particles are depicted in Figure 2a,c. Heterogeneous nZVI particles loaded on the surface of CS tend to form chain-like structures due to their magnetic characteristics, van der Waals forces, and high surface energy, as shown in Figure 2b,d. According to the results obtained from a particle size analyzer used to measure the particle size of nZVI/CS, the average size of nZVI particles is 32 nm.
The EDX analysis was used to investigate the elemental composition of the nZVI/CS nanocomposite. The results showed the presence of major elements such as oxygen (O), iron (Fe), and silicon (Si), as seen in Figure 3. The experimental results revealed that the addition of nZVI increased the iron weight percentage (wt.%) in CS from 19.46% to 44.71%. This suggests that nZVI was successfully loaded onto the CS structure. The XRD measurements also provided further evidence to support these findings. In comparison to other adsorbents, the nZVI/CS nanocomposite had a higher iron weight percentage: Mof-nZVI (16.7%) [34], d-nZVI (8.61%) [32], kaolin-nZVI (20%) [46], and AC-nZVI (8.2%) [47]. Therefore, the nZVI/CS adsorbent performs and removes CFX from aqueous solutions more effectively.
With the help of the X-ray diffraction (XRD) method, the material structure of the nanocomposite was detected and verified. Figure 4 depicts the XRD pattern for nZVI, pure CS, and nZVI/CS at diffraction angles ranging from 20° to 90°. As shown in Figure 4b, the three peaks at 2θ are 44.49°, 65.05°, and 82.34°, respectively, pointing to the associated iron plains of (110), (200), and (211) (JCPDS No. 06-0696) [48,49]. It should be mentioned that, because of the oxidation of nZVI throughout the fabrication procedure, a diffraction peak of 2θ = 35.72° is created, which can be attributed to magnetite properties [48].
On the other hand, the Scherrer correlation (Equation (2)) [50,51] was employed to determine the average crystal size at 2θ = 44.49°:
d = K λ c o s θ . β
where K is a shape index with the assistance of an amount close to unity, λ is the wavelength of the X-ray emitted to the sample (0.15406 nm), θ is the Bragg diffraction angle, and β is the line broadening at half the maximum intensity. Additionally, the crystalline size was determined at 30 nm, which is explained by the FE-SEM findings. Finally, the amounts revealed were less than the average nZVI crystallite size, such as 59.08 nm [52], 72 nm [53], and 42 nm [54]. Generally, these characteristics lead to a boost in the performance of the manufactured adsorbent.
Figure 4a shows the XRD patterns of pure CS, which comprise one broad peak at a range of 2θ = 20° to 40°. As can be seen in this finding the amorph peak of pure CS has a vast peak in the diffraction at 2θ = 35.5° which can be elucidated by the presence of iron oxide variants due to nZVI oxidation all across the synthesis operation (JCPDS No. 83-2074) [55]. Notably, the peak of 2θ = 44.49° is observed in Figure 4c, which can be attributed to the existence of nZVI on the surface of the nZVI/CS nanocomposite, as well as the peak at 2θ = 81.9° being attributed to the nZVI of oxide form of Fe. In addition, the wide peak in the range of 2θ = 20° to 40° is associated with the CS structure, which can be confirmed by the nZVI/CS pattern (JCPDS No. 01-082-0241). It demonstrates that the structure of the CS following the reaction with nZVI has not changed. Incidentally, after nZVI loading, the intensity of this peak becomes weaker [56].
Moreover, with the use of XRD deconvolution and (Equation (3)), the grade of crystallinity of the samples is calculated as follows:
X c ( % ) = A c A c + A a × 100
where Ac indicates the area of the peaks, which represents the whole crystalline zone, and Aa explains the area beneath the peaks, which denotes the complete amorphous zone. Thereby, the amount of crystallinity for nZVI, CS, and nZVI/CS nanocomposite, respectively, were 34.28, 13.39, and 22.14%.
With the use of FTIR spectroscopy, the chemical structure of nZVI, nZVI/CS, and pure CS was investigated. Figure 5 illustrates the materials’ observed FTIR spectra in the range of 400–4000 cm−1. On the other hand, the peak at 3346 cm−1 corresponds to the damping vibration of the O–H link, considering nZVI [57]. Additionally, the adsorption peak at 463 cm−1 depicts the connection of Fe–O strength in Fe3O4 and Fe2O3 [58].
It is crucial to note that the recorded peak at 1337 cm−1 could be explained by the formation of FeOOH around nZVI, the Fe3O4 and Fe2O3 links, and the fact that nZVI has been synthesized.
Furthermore, it has been known that the peaks at 3444 and 1635 cm−1 are with respect to the tension of H–O–H on the pure CS surface (Figure 5a) [31]. Moreover, the peaks at 424 and 867 cm−1 are attributed to Fe-O in Fe2O3 and tension vibration of Si-O of tetrahedrons in silicates present inside pure CS, respectively. As a result, these findings confirmed the outcomes from the EDX experiment and demonstrated the attendance of Fe and Si components together with the pure CS structure. As illustrated in Figure 5c, a novel adsorption peak for different oxide forms of iron at 1384.8 cm−1 is discovered as a result of the nZVI interaction on the CS surface. Generally, the FTIR survey supports the XRD and FE-SEM findings, revealing that the nZVI/CS nanocomposites were profitably prepared.
The effect of operational parameters on the characteristics of the synthesized adsorbent and the optimization of nZVI/CS nanocomposites were investigated using Brunauer–Emmett–Teller (BET) analysis on samples of CS and nZVI/CS. Table 2 depicts the CS and adsorbent’s BET surface area, pore volume, adsorption Langmuir, and pore diameter. Table 2 shows that the BET surface area of the nZVI/CS is 3.34 m2/g, which is greater than the CS surface area of 1.83 m2/g. This can be explained by the presence of nZVI. Thus, it can be said that the adsorption effectiveness of nZVI/CS improved as a result of a boost of approximately 82% in the surface area of CS after nZVI loading. Additionally, the pores’ diameters in CS and the nZVI/CS nanocomposite are 4.3225 nm and 3.426 nm, respectively. The findings show that the filling of the holes by nZVI has caused the pores’ diameters to drop. According to the observations, it can be claimed that the nZVI particles can both dope into the CS pores and impregnate the surface of the support, resulting in reduced pore volume. Moreover, it is well understood that there is an inverse relationship between pore diameter and BET surface; the smaller the surface area, the larger the pore diameter, and the BET analysis confirmed this relationship. According to the IUPAC classification, the structure of porous materials can be divided into three categories based on the average size of the holes: micropores, mesopores, and macropores. Micropores are holes smaller than 2 nm, mesopores are holes between 2 and 50 nm, and macropores are holes larger than 50 nm. Figure 6 shows the N2 adsorption–desorption isotherms of support and the nZVI/CS nanocomposite. Based on the IUPAC classification of isotherms, the isotherms of the adsorbents are of classical type IV, by H2 hysteresis between the adsorption and desorption graphs, showing the existence of a variety of mesopore structures. In addition, the results indicate that the narrower graphs show the homogeneity and regularity of the pore size, which is better shown in the nZVI/CS nano-absorbent. On the other hand, the CS particles have a wider hole size than the nZVI/CS nanocomposite, and this is due to the difference in the substructure of the two particles. In addition, the BJH diagram displays the size distribution of nZVI/CS nanocomposite in the 1.2–2 nm range and CS particles between 1.2–2 nm. The adsorbent’s ability to absorb can be affected by the existence of moisture. In other words, the adsorption efficiency is decreased by greater water content. In this research, we used approximately 6 g of nZVI/CS nanocomposite, and after being heated at 120 °C for 3 h, its weight was again measured. The humidity content of the adsorbent was calculated with the help of (Equation (4)):
M o i s t u r e   c o n t e n t % = W 1 W 1 W 2 × 100
where W1 and W2 represent, respectively, the sample weights before and after heating. However, we achieved a moisture content of less than 9% for the nZVI/CS in this experiment.
The pHpZC and surface charge for adsorbents at initial pH values ranging from 2 to 10 were measured by constructing a zeta potential diagram, as shown in Figure 7. The diagram was created based on the initial pH of the suspension. It was determined that the pHPZC for the nZVI/CS nanocomposite is 7.4. At acidic pH, multiple H+ cations are present and can be adsorbed onto the surface of the nanocomposite, resulting in an accumulation of (+) charges. In this condition, non-homogeneous ions are expected to be adsorbed onto the nanocomposite surface. In contrast, when the pH exceeds the pHPZC, the adsorbent surface becomes negatively charged because the H+ concentration decreases and the surface concentration of OH anions increases.

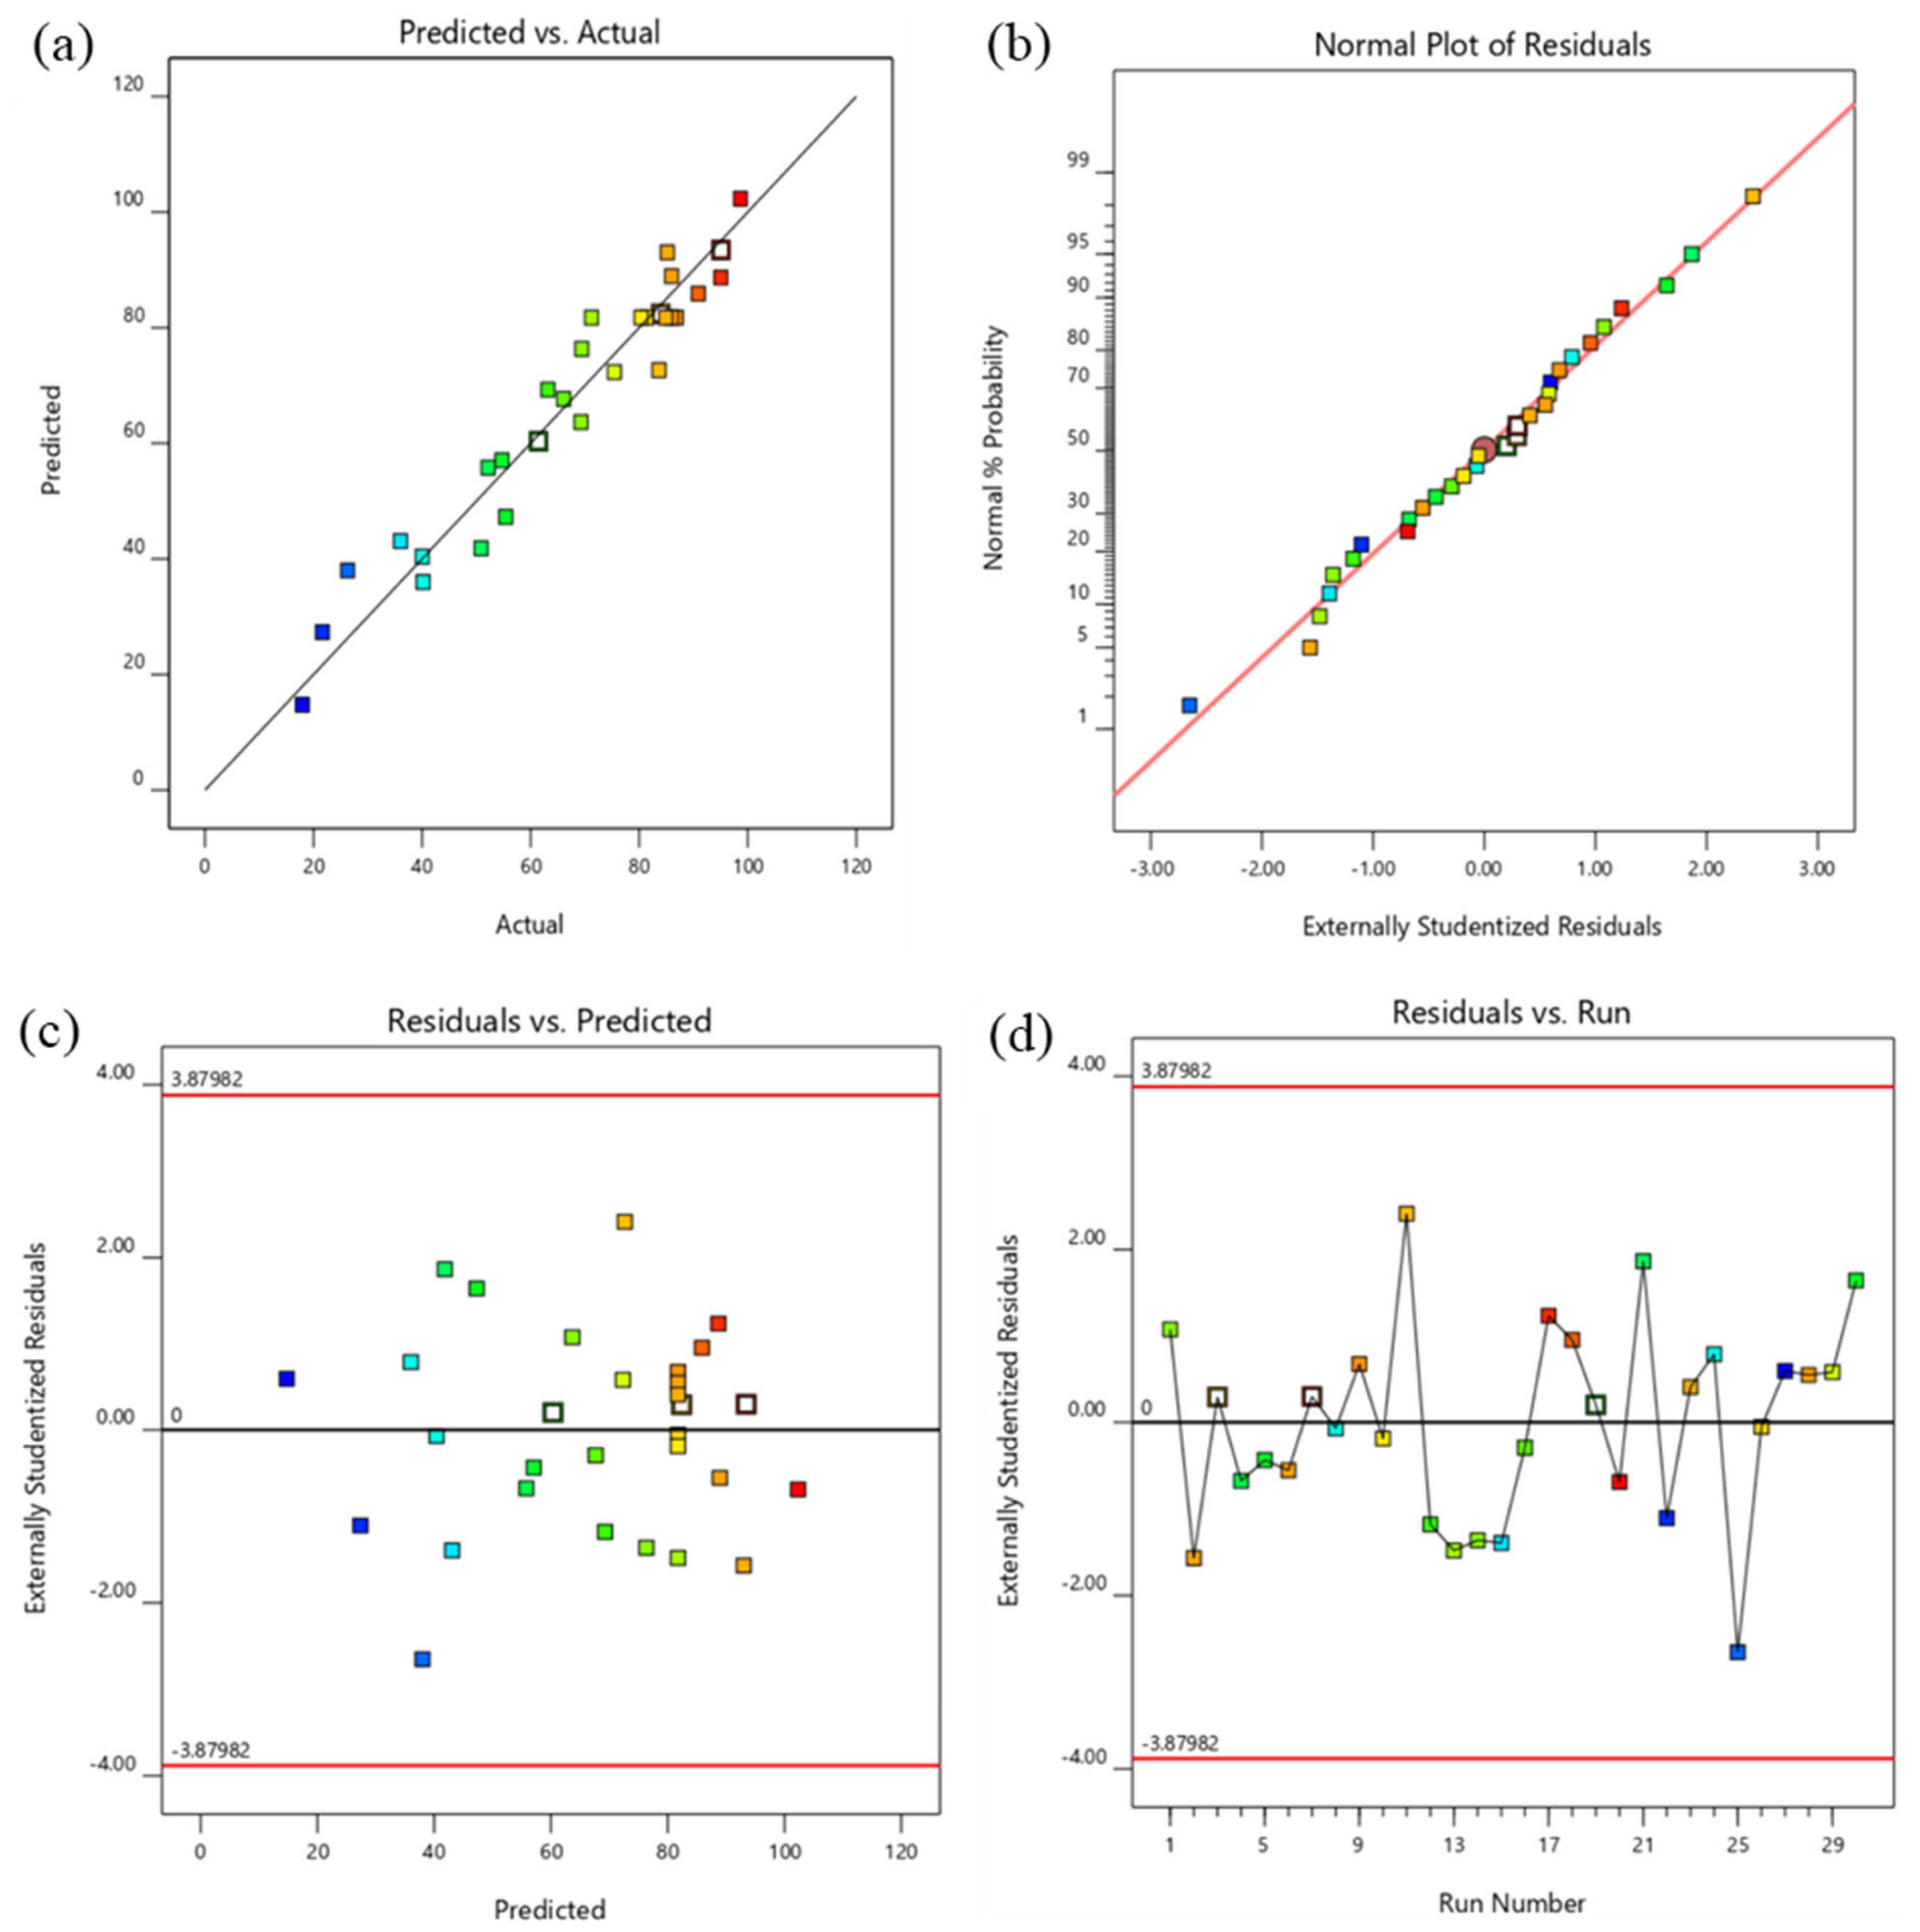
3.2. Statistical Analysis and Investigation of Experimental Data

The adsorption of cefixime using the nZVI/CS nanocomposite was evaluated and modeled using Response Surface Methodology-Central Composite design, which includes five levels of independent variables including CFX concentration, adsorbent dose, pH, and contact time. Statistical evaluation was carried out using several R2 values, such as adjusted R2, p-value, and index of lack of fit, to determine the adequacy of the model. Table 3 shows the experimental design of cefixime elimination and the data obtained by Design-Expert software. The results indicate that each component has a significant impact when the p-value is less than 0.05.
Additionally, the synergistic and opposite interactions are emphasized by the positive and negative signs placed in front of the interaction phrases, respectively. It is crucial to emphasize that the positive sign of each term suggests that, in terms of process efficiency, increasing adsorbent dosage is preferred to lowering CFX concentration. The calculated R2 value was around 0.93, meaning that the recommended model can accurately forecast the system variables inside the experimental ranges and that the derived model (quadratic) can explain 93% of the variations. To put it another way, the R2 value of 0.93, which is very close to 1, demonstrates a strong correlation between the independent variables and response values. Additionally, the anticipated R2 (0.676) and modified R2 (0.875), which have a modest difference, further support the notion that the model is theoretically sound and capable of describing facts that agree strongly between experiments and models (less than 0.2).
The modified R2 value is the reformed amount of the estimated model after the insignificant terms have been eliminated. These factors together lead to the produced regression model’s order being found to be adequate based on the lack of fit, and the acquired mathematical model can be utilized to estimate the optimal cefixime elimination condition. The model can match prediction amounts with response values because the p-value lack of fit index (0.165) indicates that it was not statistically significant (lack of fit > 0.05) in comparison to the pure error. An analysis of variance (ANOVA) was employed to examine the model’s sufficiency, validity, and relevance with a 93% confidence level (p < 0.05). The ANOVA results in Table 4 display that the model has a high F-value and a low p-value, revealing that it is significant. Likewise, a signal-to-noise ratio of 15.28 was attained, confirming the accuracy of the developed models (a ratio greater than 4 is desirable). Based on the findings of the ANOVA, all variables significantly affected the efficiency of elimination, and their F-values demonstrated the significant order of independent variables, with the contact time, adsorbent dose, CFX concentration, and pH as the most crucial operational elements for CFX elimination, respectively. Figure 8 depicts the residuals’ normal probability plot together with the curve fitting of the predicted and experimental cefixime elimination rates. The experimental data did not statistically deviate from their predicted counterparts. The appropriateness of the model was examined using residual analysis. The residuals in Figure 8b,c were on a straight line, showing that the errors were distributed normally. A quadratic polynomial equation was created to forecast the response (CFX elimination efficiency (Y)) as a function of the analyzed independent components and their interactions, according to the actual equation of the regression models (Table 4). The exact equation for optimizing the dependent parameter (response) is given in Equation (5):
R e m o v a l ( % ) = 81.64516 0.48704 A + 16.94271 B + 3.89486 C + 18.63214 D + 0.061594 A B + 0.019281 A C 0.072719 A D 0.013947 A 2 1.08117 B 2 0.059672 C 2 1.47773 D 2
Equation (4) was solved using Microsoft Excel’s Solver Add-Ins. This equation was used to predict the values required for achieving the highest level of CFX efficiency (the optimization outcome), which is displayed in Figure 8a. To study the model’s suitability for response prediction, the optimized projected value was evaluated under real test and operational conditions. The calculated average outcome of three repeats of the real cefixime elimination rate was then investigated, which resulted in a rate of 99.69%. The plots in Figure 8 from a to d verify the results obtained from the software.

3.3. Effect of Effective Variables on CFX Elimination

3.3.1. Examining the Effect of CFX Concentration on the Elimination Yield

The initial concentration is one of the most effective parameters affecting the removal efficiency of pollutants. The results obtained at a constant pH value of 7, an adsorbent dosage of 6 g/L, and a reaction time of 5 min are presented in Figure 9, Figure 10 and Figure 11. The obtained data demonstrate that the adsorption efficiency decreases when the concentration is increased from 10 mg/L to 30 mg/L. This can be attributed to the competition among the CFX molecules to occupy the active sites on the surface of the nanocomposite. In other words, the removal percentage has an inverse relationship with the increase in pollutant concentration. Indeed, during the adsorption process, the active sites are occupied by pollutants. As the pollution level increases, the active sites become saturated and unable to adsorb more pollutants. Consequently, the removal efficiency, which is associated with the adsorption of pollutants on the adsorbent surface, decreases.

3.3.2. Impact of Adsorbent Dosage on the Performance of CFX Elimination

Figure 9 shows the effect of the dosage of the nZVI/CS nanocomposite on the pollutant adsorption performance, while keeping the cefixime concentration constant at 20 mg/L, reaction time at 30 min, and pH at 6. The graph clearly demonstrates that increasing the amount of adsorbent in the solution from 2 g/L to 10 g/L leads to a rise in CFX elimination from 36.02% to 95.03%. This can be explained by the availability of active sites for CFX absorption and the amount of surface area of the nanocomposite utilized for adsorption. In other words, increasing the dosage of adsorbent results in more CFX being adsorbed, as there are more active sites for adsorption and more effective interactions between the adsorbent and pollutant molecules.

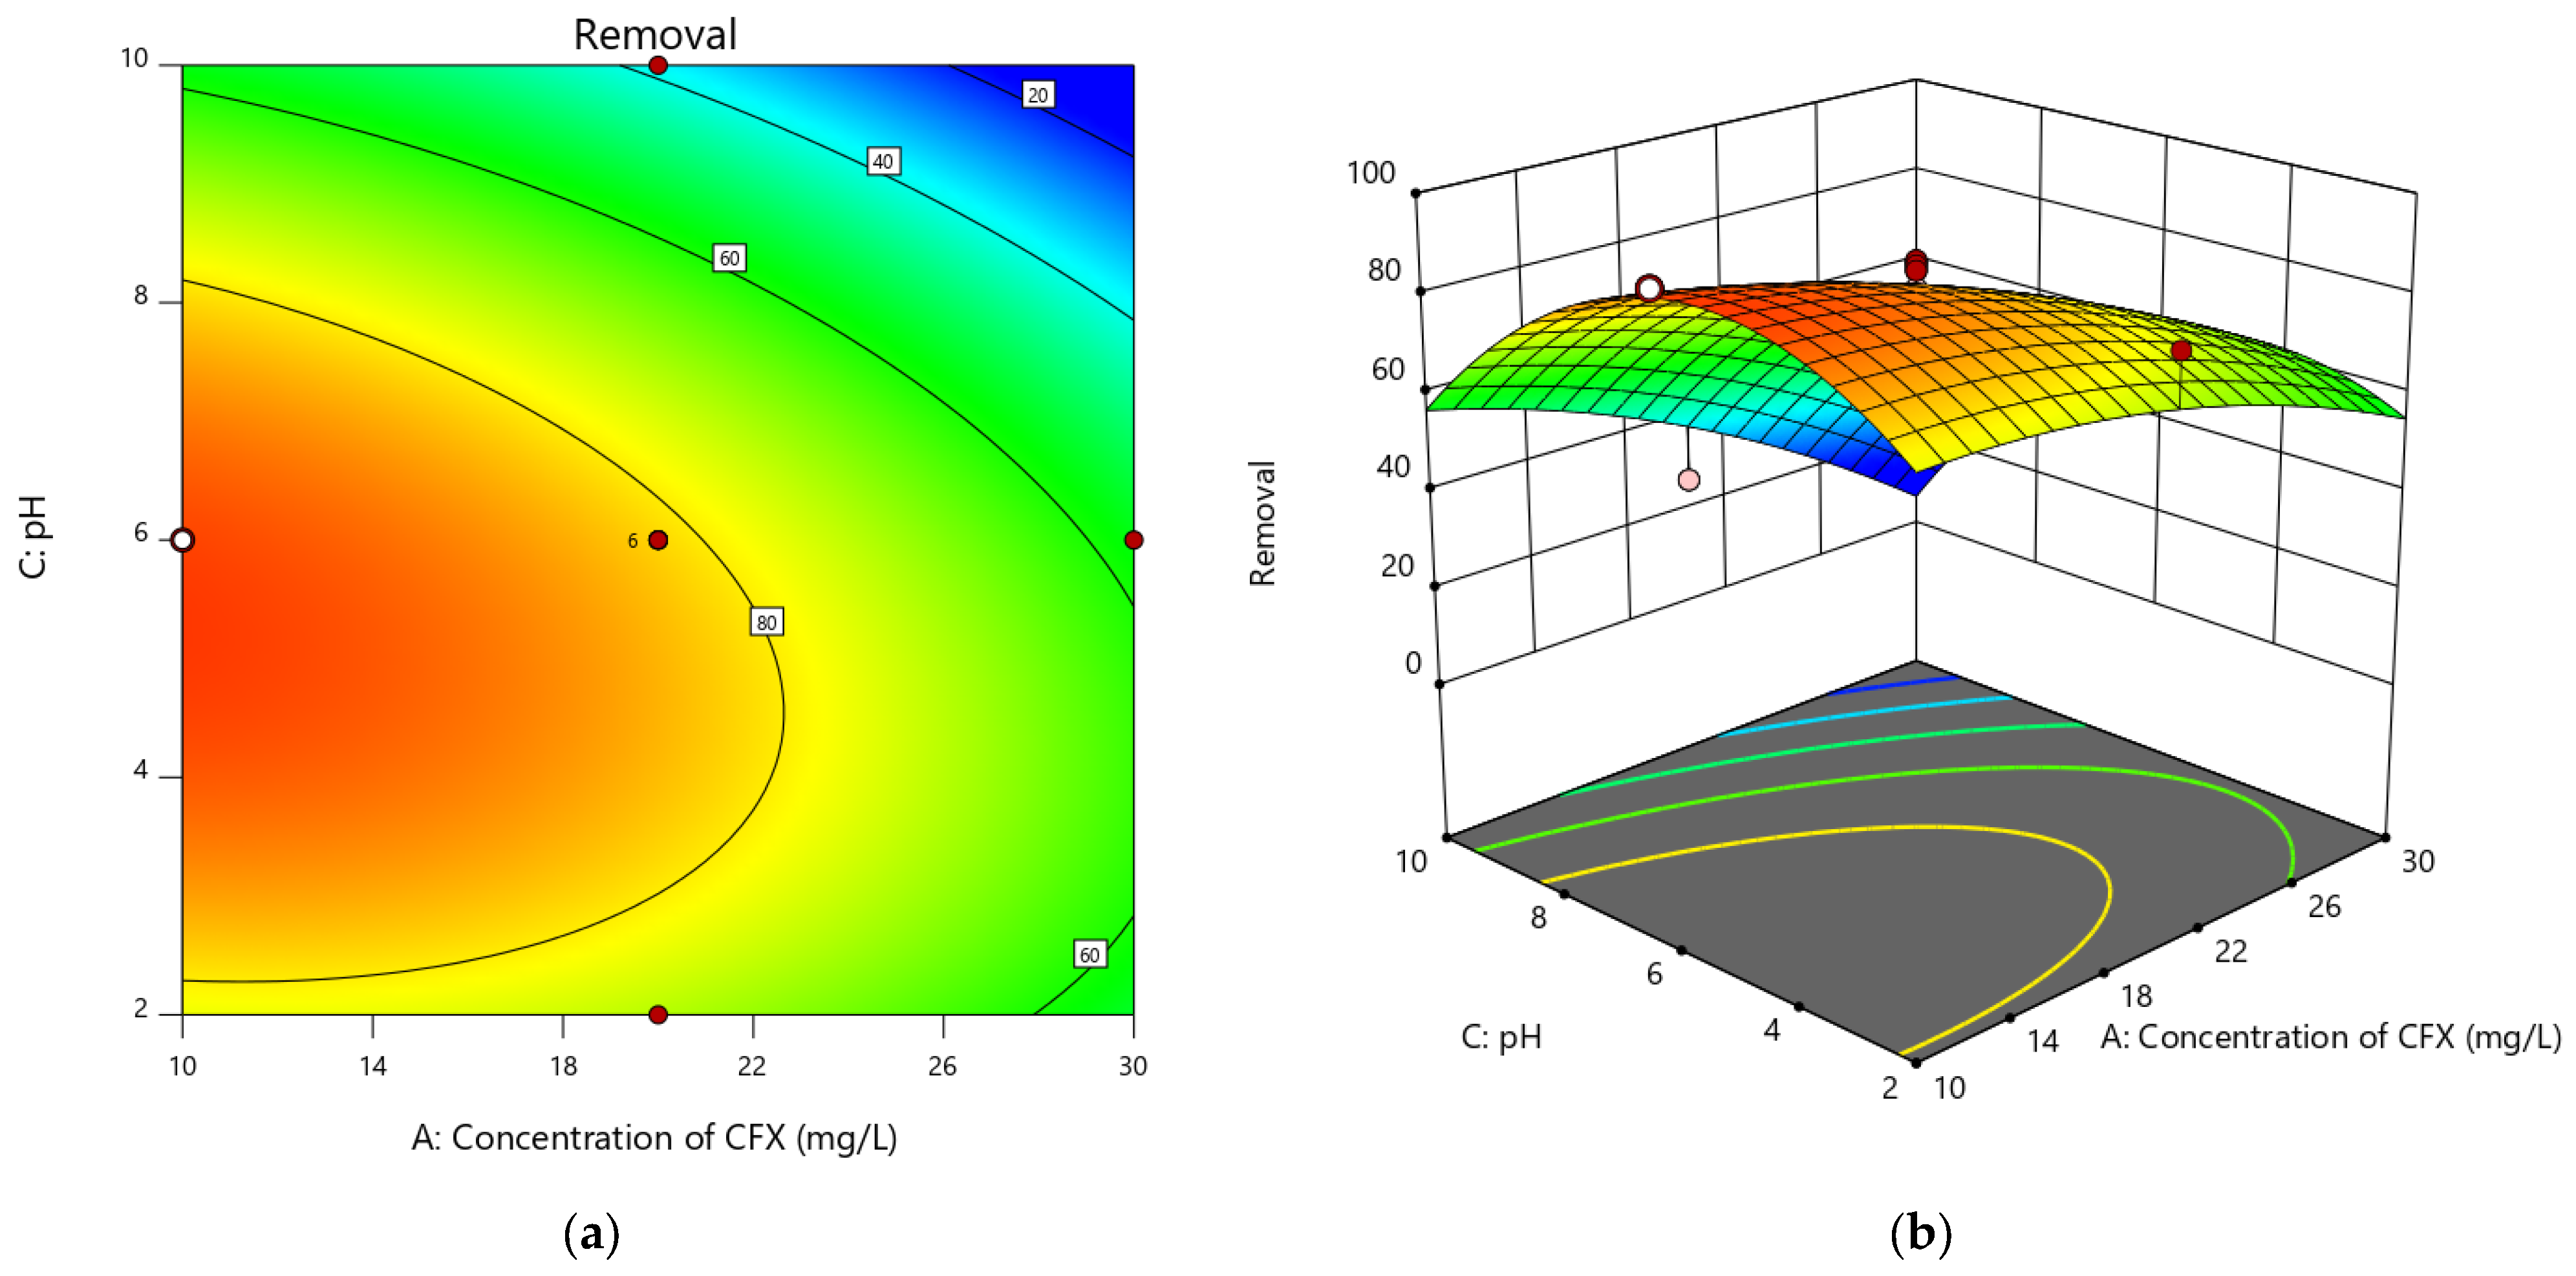
3.3.3. Examining the Impact of the pH of the Solution on the CFX Elimination Percentage

Another variable that affects the removal percentage of cefixime is the pH of the process. Figure 10 shows that the percentage of cefixime removal decreases from 83.64% to 26.28% with an increase in pH from 2 to 10, with the acidic range showing the highest percentage of cefixime removal. The removal of CFX gradually decreases from acidic (pH 4.7) to alkaline (pH > 7), as there is a larger positive charge at pH above 4.7 and a more negative charge at pH below 4.7. This can be explained by the presence of positive functional groups (H+) on the absorbent surface, which dominate the CFX solution at pH > 4.7. The percentage of absorption increases as the attractive forces between positive charges on the absorbent surface and the cefixime solution increase. However, when pH > 7, the amount of negative functional groups (OH-) on the surface of the absorbent increases, leading to a repulsive force between the negative charges, which reduces the effectiveness of absorption. As a result, a decrease in removal is observed when the pH increases, or when transitioning from an acidic environment to an alkaline environment. It is important to stress that the results indicate that pH values of more than 10 and less than 2 (according to the pre-test) are unhelpful for CFX removal. The electrostatic repulsion or attraction force between catalyst particles and pollutant molecules, can all affect efficiency. The pKa values of CFX molecules are 2.56 and 6.88, thus in the pH range of 2.56–6.88 CFX shows an amphoteric behavior such that, at pH values less than or greater than 2.56, its surface charge is positive or negative is changed. On the other hand, the pHpzc (point of zero charge) of the catalyst was measured at 7.4 and has zero net charge at this point. Therefore, for pH values less than 7.4 (acidic environment), the net charge on the catalyst surface is positive, while at higher pH values (basic environment) it is negatively charged. CFX is in a zwitterion form between two pKa values, possessing both ionic states at the same time, with the isoelectric point at pH 4.5. On the other hand, in pH = 4.5, using Design-Expert software, the optimal amount of cefixime removal was 98.71%. Furthermore, it should be noted that the natural pH of CFX at a concentration of 19–21 ppm is approximately 4.3–4.7. At this pH, the CFX molecules are in their zwitterionic form and adsorption between the positively charged catalyst and the negatively charged CFX molecules occurs. CFX is also less stable in its protonated form (amine and amid groups), making it more prone to elimination.

3.3.4. Effect of Contact Time on CFX Removal Using NZVI/CS Nanocomposite

In Figure 11, the effect of contact time on CFX elimination was studied at various times ranging from 10 to 50 min, with an initial constant CFX concentration of 20 mg/L, an adsorbent dose of 6 g/L, and a pH of 6. It can be observed that the efficiency of cefixime removal increased from 21.63% to 90.89% with a gradual increase in reaction time. This can be attributed to the fact that at the beginning of the adsorption process, the nanocomposite surface has numerous pores and functional groups that provide sufficient adsorption sites, making it easy for pollutant molecules and ions to attach to the surface. However, as adsorption progresses, the availability of suitable adsorption sites gradually decreases until equilibrium is reached. This means that the surface becomes saturated with pollutants or fouling occurs, reducing the available surface area for adsorption. Additionally, changes in the physical and chemical properties of the adsorbent over time, such as changes in pH or temperature, can affect its ability to adsorb pollutants and result in reduced efficiency.

3.4. Interactive Influence of Process Factors

3.4.1. Adsorbent Dosage and CFX Concentration Impact on the Adsorption Efficiency

Figure 9 depicts the effect of CFX concentration and catalyst dosage on CFX adsorption percentage at the center point of pH and contact time. The absorbent dosage values range from 2 to 10 g/L, and the CFX concentration ranges from 10 to 30 mg/L. As shown in Figure 9a,b, with a constant amount of 8 g/L adsorbent, pH of 8, and time of 20 min, the removal percentage declined from 69.27% to 40.03% as the concentration of cefixime increased. Moreover, at an adsorbent dose of 4 g/L, this removal value decreased from 52.18% to 40.19%, resulting in a change in slope compared to the adsorbent dose of 8 g/L. As a result, the removal rate is much higher at low CFX concentrations compared to high CFX concentrations because the active sites of the adsorbent surface become saturated by cefixime at high concentrations, leading to a reduction in the removal efficiency.
Figure 9a depicts a contour diagram, whereas Figure 9b depicts a three-dimensional diagram based on the interaction between the starting concentration of cefixime and the absorbent dose. The red area demonstrates a high percentage of removal, while the blue area illustrates a low percentage of removal. In order to achieve a clearance rate of greater than 90% of cefixime, a large value of nanocomposite dosage and a low starting concentration of cefixime are required. With the initial concentration of cefixime increasing from 5 mg/L to 30 mg/L, the amount of absorption falls significantly, and in high concentrations of cefixime, more adsorbent is required to raise the percentage of absorption.

3.4.2. pH and CFX Concentration Impact on the Adsorption Efficiency

Figure 10 illustrates the relationship between the initial concentration of cefixime and the elimination percentage at different pH values. As shown in Figure 10, the removal percentage decreases with an increase in pH for constant cefixime concentrations, adsorbent dosage, and contact time. For instance, when the pH is increased from 6 to 10, the removal percentage decreases significantly from 81.36% to 26.28%. This trend can be attributed to the decrease in acidity and increase in alkalinity, resulting in a decrease in the concentration of (H+) and an increase in the concentration of (OH) ions. Consequently, the removal efficiency decreases. It can be inferred that a lower pH has a greater impact on the elimination efficiency. Figure 10a represents a contour diagram, whereas Figure 10b shows a three-dimensional plot based on the relationship between the initial concentration of cefixime and pH. The red spots indicate a removal percentage above 90%, while the blue areas indicate a low removal percentage. A clearance rate of over 80% can be achieved by reducing the concentration of cefixime at a low or acidic pH. Additionally, the adsorption percentage decreases with an increase in the concentration of cefixime.

3.4.3. Contact Time and CFX Concentration Impact on the Adsorption Efficiency

Figure 11 illustrates the interaction between the initial concentration of cefixime and contact time on its elimination efficiency. The figure shows that as the contact time increased from 20 to 40 min, the removal rate increased from 69.27% to 85.96%, with a slower rate of removal, whereas from 30 to 50 min, the removal percentage increased from 84.88% to 90.89%, showing a decreasing rate of cefixime removal. The results indicate that the removal of cefixime has an inverse relationship with time and initial concentration, as the removal percentage decreases as the pollutant concentration increases during the fixed contact duration. At high concentrations, the active areas of the absorbent surface become saturated and filled, resulting in a decrease in removal. Figure 11a shows the contour diagram, while Figure 11b illustrates the three-dimensional plot based on the interaction between the initial cefixime concentration and contact time. Due to the low concentration of the pollutant and the high contact duration, the number of adsorptions increases, and the percentage of elimination increases with increasing starting cefixime concentration. However, by decreasing the contact time, the elimination percentage decreases significantly since, at the beginning of the reaction, there is no progress in the elimination process due to insufficient active surface in the solution.
Using CCD optimization, the optimal amounts of the impacting parameters are identified, contributing to the highest CFX adsorption. Equation (5) is numerically analyzed utilizing Design-Expert software, as illustrated in Figure 12, to determine the variables’ optimum values. At optimum values of parameters, the estimated highest removal yields are 98.71%, and the associated performances are above 95%, which is similar to the expected amounts for the specified experimental conditions and shows that the model is suitable and practicable to calculate the highest performance. Indeed, the optimum values of the significant factors were achieved with the desirability of 1.000 at 7.79 g/L catalyst dosage, pH 4.59, CFX concentration 19.42, and contact time of 36.17 min. Additionally, the effectiveness of pure CS (8.26%), and nZVI/CS (98.66%) as adsorbents under ideal conditions were compared with the aid of several experiments. The findings show that, whereas nZVI modification increases the efficiency of CS and increases the removal rate by nearly 12 times, pure CS can only remove around 8.26% of CFX from an aqueous solution. Generally, the amount of Fe leaching rises when pure nZVI is used without a substrate, which worsens environmental pollution. It is important to stress that the experiments showed that the initial solution contained 19.42 mg/L of cefixime antibiotic in synthetic wastewater before adsorption. Following the adsorption process using the nZVI/copper slag nanocomposite, the concentration of cefixime antibiotic in the treated solution was approximately 0.2 mg/L, indicating a removal efficiency of over 98%.

3.5. Adsorption Kinetic

One of the key analyses for measuring the rate of the limiting mechanism and the rate constant of CFX adsorption from aqueous solution by nZVI/CS is adsorption kinetic. The adsorption results were analyzed using the widely utilized pseudo-first-order Equation (6) and pseudo-second-order Equation (7) kinetic models.
Ln   ( C t C 0 ) = K o b s t
t q t = 1 k 2 q e 2 + t q e
where qe (mg/g) and qt (mg/g) are values of CFX absorbed onto the solid phase (nZVI/CS) at equilibrium and time (t), respectively. kobs (1/min) and k2 (g/mg min) are rate constants for pseudo-first-order and pseudo-second-order, respectively [59].
It is to be noted that, in order to survey the reaction kinetics, CFX elimination was explored at a CFX concentration of 15 mg/L, catalyst dosage of 8 g/L, pH 4, and 10–90-min reaction time. According to the findings, the adsorption efficiency increased dramatically (93.59%) from 0 to 40 min before reducing the reaction rate to reach equilibrium, and after 90 min, equilibrium was reached and 1.84 mg/g (98.66%) of cefixime was absorbed. It is explained by the fact that the available active sites on the surface of the nZVI/CS nanocomposite are more frequent, and the reaction with CFX occurs quickly in the first instance. Over time, it may be possible to notice repulsion between the adsorbed CFX molecules on the surface of the adsorbent and the remaining molecules in the solution, which makes occupying active sites on the surface of the adsorbent exceedingly challenging. Generally, a saturation of the nZVI/CS absorber’s active surface occurs over time. Rapid initial uptake resulted from easy access to the active surface of the nZVI/CS nanocomposite. Table 5 shows that the pseudo-second-order has a greater correlation coefficient (R2) than the pseudo-first-order and that the estimated qe of the pseudo-second-order model correlates extremely well with the experimental qe. These findings suggest that chemisorption is the dominant regulating mechanism in CFX adsorption onto the nZVI/CS surface. These findings further suggest that the negative groups of CFX are attracted to the positively charged groups on the surface of the absorbent.

3.6. Adsorption Isotherms of CFX

An essential function for understanding the nZVI/CS-CFX interaction is the adsorption isotherm. Hence, the adsorption behavior of CFX by nZVI/CS was investigated, and the adsorption capacity of nZVI/CS was measured, employing two different isotherm models [60]. Langmuir’s and Freundlich’s non-linear mathematical expressions are depicted in Equations (8) and (9), respectively.
q = Q m ( K a C e q ) n ( K a C e q ) n + 1
q e = K F . C e 1 n f
It is important to stress that the Langmuir isotherm demonstrates monolayer adsorption, and there are only a finite number of identical active sites on the nanocomposite surface. where Ce (mg/L) and qe (mg/g) stand for the equilibrium molecule concentration and the couple of molecules that are simultaneously adsorbed on the surface of the nanocomposite, respectively. In addition, qmax is the highest adsorption capacity of the adsorbent (mg/g) and KL is the constant of Langmuir (L.mg) that are determined as the slope and intercept of the plots of Ce/qe versus Ce, respectively. On the other hand, multilayer adsorption is theoretically described with the assistance of the Freundlich isotherm, where Freundlich constants KF (mg/g) and n (adsorption intensity) represent the adsorption capacity and adsorption strength, respectively [59].
In order to survey the CFX adsorption isotherm on nZVI/CS nanocomposite, on both models, tests have been carried out at set adsorbent doses of 8 g/L, fixed contact times of 40 min, and pH 4 with cefixime concentrations of ppm 10, 15, 20, 25, and 30. Figure 13 displays the outcomes of the adsorption studies for two Langmuir and Freundlich isotherms. According to the findings in Table 6, the Freundlich model (R2 = 0.853) performs less well than the Langmuir model (R2 = 0.992) in describing CFX elimination on nZVI/CS nanocomposite surface. Likewise, it was discovered that the Freundlich constant for n was greater than 2.97, showing that the adsorption of CFX on nZVI/copper slag was a successful operation. Furthermore, the results show that the absorption of cefixime using the nZVI/CS nanocomposite is a single layer, and the absorption capacity in the Langmuir model is equal to 11.11 (KL), which is greater than in previous studies [30,31], indicating a meaningful interaction between the adsorbent (nanocomposite) and the pollutant element.
The constant “Separation Factor (RL)” is one of the key constants in Langmuir adsorption since it allows one to anticipate or estimate the affinity between the nanocomposite and the contaminant substance. Indeed, this component can characterize the basic properties of the Langmuir isotherm and forecast whether an adsorption model is eligible or ineligible with the use of Equation (10):
R L = 1 ( 1 + K C 0 )
where K and C0 are the Langmuir constant and concentration of CFX, respectively, they are used to determine what is favorable (0 < RL < 1) and unfavorable (1 < RL).
It can be seen in Figure 14 that the computed RL values of the adsorption isotherms of Langmuir at various concentrations of CFX were less than 1, indicating a positive tendency for CFX adsorption on the surface of nZVI/CS nanocomposite. The trend of the graph shows that there is a definite link between RL value and CFX concentration. The more the CFX concentration enhances, the more removal efficiency decreases.

3.7. Reusability and Regeneration of nZVI/CS Adsorbent

The adsorbent’s capacity to be reused and regenerated is of extreme significance and is essential to the adsorption operation for its practical uses in industrial sectors. Two separate methods of reusability empty of any manufacture and regeneration using washing via a solvent were employed to evaluate the adsorbent’s effectiveness and reusability in the elimination of CFX. In order to ensure uniformity, the experiments in both approaches were conducted three times. Reusability and regeneration of nZVI/CS nanocomposite were surveyed at optimum conditions (catalyst dosage: 7.80 g/L, pH: 4.26, CFX concentration: 19.73, and contact time: 39.8 min). In the first method, the reusability of the nanocomposite was surveyed without any post-cycle adsorbent treatment.
After each cycle, the nanocomposite was separated from the solution with the aid of a centrifuge, and with the assistance of UV-Vis spectroscopy, and the undergraduate pollutant concentration in the solution was determined utilizing UV-Vis spectroscopy. After that, a subsequent cycle was performed using the separated adsorbent without regeneration. The percentage of CFX elimination using nZVI/CS as an adsorbent over the course of six continuous cycles is illustrated in Figure 15a. The outcomes show that the removal percentage of CFX using nZVI/CS significantly decreased from 98.66% to 57.5, which can be attributed to the nZVI being oxidized and the active sites on the surface of the adsorbent becoming saturated. The regeneration process of the nZVI/CS was investigated via the second route (Figure 15b). The adsorbent is regenerated using stirring with a 0.1 M hydrochloric acid solution on a stirrer for two hours following the completion of each cycle. The absorbent was then exposed to nitrogen gas for 24 h to dry it. The goal of washing the absorbent with a diluted acid solution is to dissolve the iron oxyhydroxides that have developed on the surface of the absorbent. In each cycle, a new cefixime solution is used, and the results indicate that the adsorbent performed adequately across a total of six cycles. Therefore, washing with solvent across multiple cycles was more effective and resulted in a higher efficiency of elimination than washing with no treatment or modification.
It is important to stress that adsorption is a common method for removing contaminants from wastewater. In the case of the removal of cefixime from wastewater using a Superb nZVI/Copper Slag Nanocomposite, the adsorption mechanism involves the attachment of cefixime molecules to the surface of the nanocomposite material. The Superb nZVI/Copper Slag Nanocomposite has a large surface area and a high affinity for organic molecules such as cefixime. The composite material is made up of nanoscale zero-valent iron (nZVI) particles that are embedded in a matrix of copper slag. The nZVI particles are highly reactive and can react with organic molecules such as cefixime, while the copper slag provides a stable matrix for the particles and enhances their adsorption properties. During the adsorption process, the cefixime molecules are attracted to the surface of the composite material and form weak chemical bonds with the nZVI particles. This process occurs due to several mechanisms, including van der Waals forces, hydrogen bonding, and electrostatic interactions. The adsorption process is facilitated by the high surface area of the nanocomposite material, which provides a large number of active sites for the cefixime molecules to attach to. Once the cefixime molecules are adsorbed onto the surface of the Superb nZVI/Copper Slag Nanocomposite, they are effectively removed from the wastewater. The adsorption process is reversible, meaning that the cefixime molecules can be desorbed from the surface of the composite material using an appropriate desorption agent. Overall, the adsorption mechanism in this process provides an effective and efficient means of removing cefixime from wastewater.

3.8. Comparison of the Removal Performance with the Previous Studies

Several studies have investigated the use of various adsorbents to remove CFX. Table 7 provides information on the experimental conditions and compares the effectiveness of our approach with that of other researchers. Based on the literature review, our nanocomposite demonstrates greater removal efficiency and a shorter contact time compared to other studies. Therefore, it can be inferred that this type of nanocomposite may be utilized in the treatment of antibiotics as it exhibits promising results in removing cefixime. It is important to note that an adsorbent’s capability refers to its ability to attract and adsorb molecules of a particular substance from a liquid onto its surface. This capability is measured in terms of the amount of pollutant that can be adsorbed per unit mass or surface area of the adsorbent material. In this study, it is true that the adsorption capacity is lower than in other studies, but it should be noted that the initial concentration of the pollutant was also lower. In other words, the lower adsorption capacity indicates that less concentration of pollutant was removed. Therefore, the amount of adsorption capacity and initial concentration are not in conflict with each other. Moreover, it is worth emphasizing that this adsorbent was synthesized from waste using a simple method for the removal of non-biodegradable pollutants. Because we used waste materials to synthesize an adsorbent in this study via an easy method for the removal of non-biodegradable pollutants, the study can be considered a significant contribution to sustainable waste management and environmental remediation.

4. Conclusions

To summarize, the objective of this study was to evaluate the efficacy of nZVI/CS for removing CFX from a water-based solution. Various adsorption parameters, such as adsorbent dosage, pollutant concentration, contact time, and pH, were investigated through experiments, and the response surface methodology (RSM) was used to systematically analyze their effects on the adsorption performance. The results indicated that increasing the adsorbent dosage and contact time enhanced the removal efficiency. The optimum conditions for removal were found to be 7.79 g/L of adsorbent dosage, a contact time of 36.17 min, and a CFX concentration of 19.42 mg/L, resulting in a removal efficiency of 98.71%. The maximum adsorption capacity was estimated to be 4.31 mg/g, and the adsorption equilibrium was shown to follow the Langmuir adsorption isotherm. The adsorption kinetics followed a pseudo-second-order model.
Furthermore, the maximum adsorption capacity of nZVI/CS was significantly higher than that of other adsorbents reported in previous studies, making it a promising candidate for CFX removal from wastewater. Therefore, the synthesized nZVI/CS can be considered a suitable option for CFX removal from aqueous solutions due to its high efficiency and potential for regeneration. However, it is important to note that this study was conducted at the laboratory scale, and further investigation is required to evaluate the long-term stability and cost-effectiveness of nZVI/CS in practical applications.

Author Contributions

A.M.: Conceptualization, Methodology, Data curation, Visualization, Software, Review and editing. S.S. and S.M.M.: Conceptualization, Resources, Supervision, Project administration, Funding acquisition, Methodology, Review and editing. J.R.: Writing—original draft, Conceptualization, Methodology, Software, Formal analysis, Investigation, Visualization, Review and editing. K.R.: Writing—original draft, Methodology, Software, Review and editing. S.A.H.: Writing—original draft, Methodology, Software, Review & editing. W.-H.C.: Writing—original draft, Methodology, Software, Review & editing. All authors have read and agreed to the published version of the manuscript.

Funding

This work is sponsored by Ministry of Science and Technology, Taiwan (grant number: MOST 110-2628-E-011-003, MOST 109-2923-E-011-003-MY, MOST 111-NU-E-011-001-NU).

Data Availability Statement

All data generated or analyzed during this study are included in this published article.

Conflicts of Interest

The authors declare no conflict of interest.

References

  1. Fereidooni, M.; Esmaeilzadeh, F.; Zandifar, A. Innovatively-synthesized CeO2/ZnO photocatalysts by sono-photochemical deposition: Catalyst characterization and effect of operational parameters on high efficient dye removal. J. Mater. Sci. 2022, 57, 16228–16244. [Google Scholar] [CrossRef]
  2. Liang, J.; Lin, H.; Singh, B.; Wang, A.; Yan, Z. A global perspective on compositions, risks, and ecological genesis of antibiotic resistance genes in biofilters of drinking water treatment plants. Water Res. 2023, 233, 119822. [Google Scholar] [CrossRef] [PubMed]
  3. Madhav, S.; Ahamad, A.; Singh, A.K.; Kushawaha, J.; Chauhan, J.S.; Sharma, S.; Singh, P. Water Pollutants: Sources and Impact on the Environment and Human Health. In Sensors in Water Pollutants Monitoring: Role of Material; Pooja, D., Kumar, P., Singh, P., Patil, S., Eds.; Springer: Singapore, 2020; pp. 43–62. [Google Scholar]
  4. Benrighi, Y.; Nasrallah, N.; Chaabane, T.; Sivasankar, V.; Darchen, A.; Baaloudj, O. Photocatalytic performances of ZnCr2O4 nanoparticles for cephalosporins removal: Structural, optical and electrochemical properties. Opt. Mater. 2021, 115, 111035. [Google Scholar] [CrossRef]
  5. Mirbagheri, N.S.; Sabbaghi, S. A Ti-doped γ-Fe2O3/SDS nano-photocatalyst as an efficient adsorbent for removal of methylene blue from aqueous solutions. J. Environ. Manag. 2018, 213, 56–65. [Google Scholar] [CrossRef]
  6. Gonbadi, M.; Sabbaghi, S.; Saboori, R.; Derakhshandeh, A.; Narimani, M.; Fatemi, A. Sulfide adsorption by “green synthesized Fe3O4@ ZnO core/shell” nanoparticles from aqueous solution and industrial rich amine solution: Kinetic and equilibrium study. Int. J. Environ. Sci. Technol. 2023, 20, 1–20. [Google Scholar] [CrossRef]
  7. Asadi-Ghalhari, M.; Mostafaloo, R.; Ghafouri, N.; Kishipour, A.; Usefi, S.; Baaloudj, O. Removal of Cefixime from aqueous solutions via proxy electrocoagulation: Modeling and optimization by response surface methodology. React. Kinet. Mech. Catal. 2021, 134, 459–471. [Google Scholar] [CrossRef]
  8. Kafaei, R.; Papari, F.; Seyedabadi, M.; Sahebi, S.; Tahmasebi, R.; Ahmadi, M.; Sorial, G.A.; Asgari, G.; Ramavandi, B. Occurrence, distribution, and potential sources of antibiotics pollution in the water-sediment of the northern coastline of the Persian Gulf, Iran. Sci. Total Environ. 2018, 627, 703–712. [Google Scholar] [CrossRef]
  9. Zhang, T.; Zhou, R.; Wang, P.; Mai-Prochnow, A.; McConchie, R.; Li, W.; Zhou, R.; Thompson, E.W.; Ostrikov, K.; Cullen, P.J. Degradation of cefixime antibiotic in water by atmospheric plasma bubbles: Performance, degradation pathways and toxicity evaluation. Chem. Eng. J. 2021, 421, 127730. [Google Scholar] [CrossRef]
  10. Patel, S.; Sharma, J.; Gole, V.L. Removal of antibiotic cefixime from wastewater using UVC/Sodium persulphate system. Mater. Today Proc. 2023, 78, 69–73. [Google Scholar] [CrossRef]
  11. Vasseghian, Y.; Dragoi, E.-N.; Almomani, F.; Le, V.T. Graphene-based materials for metronidazole degradation: A comprehensive review. Chemosphere 2022, 286, 131727. [Google Scholar] [CrossRef]
  12. Rasouli, K.; Alamdari, A.; Sabbaghi, S. Ultrasonic-assisted synthesis of α-Fe2O3@TiO2 photocatalyst: Optimization of effective factors in the fabrication of photocatalyst and removal of non-biodegradable cefixime via response surface methodology-central composite design. Sep. Purif. Technol. 2023, 307, 122799. [Google Scholar] [CrossRef]
  13. Mohammadi, M.; Sabbaghi, S.; Sadeghi, H.; Zerafat, M.; Pooladi, R. Preparation and characterization of TiO2/ZnO/CuO nanocomposite and application for phenol removal from wastewaters. Desalination Water Treat. 2016, 57, 799–809. [Google Scholar] [CrossRef]
  14. Mirzaei, M.; Sabbaghi, S.; Zerafat, M.M. Photo-catalytic degradation of formaldehyde using nitrogen-doped TiO2 nano-photocatalyst: Statistical design with response surface methodology (RSM). Can. J. Chem. Eng. 2018, 96, 2544–2552. [Google Scholar] [CrossRef]
  15. Khan, M.A.; Raza, N.; Manzoor, S.; Shuja, R.; Raza, H.; Khan, M.I.; Azam, M.; Shanableh, A. Experimental design by response surface methodology for efficient cefixime uptake from hospital effluents using anion exchange membrane. Chemosphere 2023, 311, 137103. [Google Scholar] [CrossRef]
  16. Malekshahi, M.; Sabbaghi, S.; Rasouli, K. Preparation of α-alumina/γ-alumina/γ-alumina-titania ceramic composite membrane for chloride ion removal. Mater. Chem. Phys. 2022, 287, 126218. [Google Scholar] [CrossRef]
  17. Ghaee, A.; Zerafat, M.; Askari, P.; Sabbaghi, S.; Sadatnia, B. Fabrication of polyamide thin-film nanocomposite membranes with enhanced surface charge for nitrate ion removal from water resources. Environ. Technol. 2017, 38, 772–781. [Google Scholar] [CrossRef]
  18. Nabizad, M.; Dadvand Koohi, A.; Erfanipour, Z. Removal of Cefixime Using Heterogeneous Fenton Catalysts: Alginate/Magnetite Hydroxyapatite Nanocomposite. J. Water Environ. Nanotechnol. 2022, 7, 14–30. [Google Scholar]
  19. Sereshti, H.; Beyrak-Abadi, E.; Esmaeili Bidhendi, M.; Ahmad, I.; Shahabuddin, S.; Rashidi Nodeh, H.; Sridewi, N.; Wan Ibrahim, W.N. Sulfide-Doped Magnetic Carbon Nanotubes Developed as Adsorbent for Uptake of Tetracycline and Cefixime from Wastewater. Nanomaterials 2022, 12, 3576. [Google Scholar] [CrossRef]
  20. Hashemi, S.F.; Sabbaghi, S.; Saboori, R.; Zarenezhad, B. Photocatalytic degradation of ammonia with titania nanoparticles under UV light irradiation. Environ. Sci. Pollut. Res. 2022, 29, 68600–68614. [Google Scholar] [CrossRef]
  21. Emami, N.; Farhadian, M.; Solaimany Nazar, A.R.; Tangestaninejad, S. Adsorption of cefixime and lamotrigine on HKUST-1/ZIF-8 nanocomposite: Isotherms, kinetics models and mechanism. Int. J. Environ. Sci. Technol. 2022, 20, 1645–1672. [Google Scholar] [CrossRef]
  22. Arizavi, A.; Mirbagheri, N.; Hosseini, Z.; Chen, P.; Sabbaghi, S. Efficient removal of naphthalene from aqueous solutions using a nanoporous kaolin/Fe3O4 composite. Int. J. Environ. Sci. Technol. 2020, 17, 1991–2002. [Google Scholar] [CrossRef]
  23. Salehia, F.; Sabbaghia, S.; Mirbagherib, N.S. Modification of graphitic carbon nitride photocatalyst by Pb-contaminated water for efficient removal of cefixime from aqueous media. Desalination Water Treat. 2021, 229, 331–342. [Google Scholar] [CrossRef]
  24. Moradi, H.; Sabbaghi, S.; Mirbagheri, N.S.; Chen, P.; Rasouli, K.; Kamyab, H.; Chelliapan, S. Removal of chloride ion from drinking water using Ag NPs-Modified bentonite: Characterization and optimization of effective parameters by response surface methodology-central composite design. Environ. Res. 2023, 223, 115484. [Google Scholar] [CrossRef] [PubMed]
  25. Mehrdoost, A.; Jalilzadeh Yengejeh, R.; Mohammadi, M.K.; Babaei, A.A.; Haghighatzadeh, A. Comparative analysis of UV-assisted removal of azithromycin and cefixime from aqueous solution using PAC/Fe/Si/Zn nanocomposite. J. Health Sci. Surveill. Syst. 2021, 9, 39–49. [Google Scholar]
  26. Truong, T.T.T.; Vu, T.N.; Dinh, T.D.; Pham, T.T.; Nguyen, T.A.H.; Nguyen, M.H.; Nguyen, T.D.; Yusa, S.-i.; Pham, T.D. Adsorptive removal of cefixime using a novel adsorbent based on synthesized polycation coated nanosilica rice husk. Prog. Org. Coat. 2021, 158, 106361. [Google Scholar] [CrossRef]
  27. Ciğeroğlu, Z.; Küçükyıldız, G.; Erim, B.; Alp, E. Easy preparation of magnetic nanoparticles-rGO-chitosan composite beads: Optimization study on cefixime removal based on RSM and ANN by using Genetic Algorithm Approach. J. Mol. Struct. 2021, 1224, 129182. [Google Scholar] [CrossRef]
  28. Gupta, V.K.; Saini, V.K.; Jain, N. Adsorption of As(III) from aqueous solutions by iron oxide-coated sand. J. Colloid Interface Sci. 2005, 288, 55–60. [Google Scholar] [CrossRef]
  29. Mirhosseininia, J.; Sabbaghi, S.; Mirbagheri, N.S.; Zerafat, M.M. Treatment of As-contaminated drinking water using a nano zero-valent iron/copper slag nanocomposite. J. Water Process Eng. 2022, 49, 103011. [Google Scholar] [CrossRef]
  30. Bhowmick, S.; Chakraborty, S.; Mondal, P.; Van Renterghem, W.; Van den Berghe, S.; Roman-Ross, G.; Chatterjee, D.; Iglesias, M. Montmorillonite-supported nanoscale zero-valent iron for removal of arsenic from aqueous solution: Kinetics and mechanism. Chem. Eng. J. 2014, 243, 14–23. [Google Scholar] [CrossRef]
  31. Yadav, R.; Sharma, A.K.; Babu, J.N. Sorptive removal of arsenite [As(III)] and arsenate [As(V)] by fuller’s earth immobilized nanoscale zero-valent iron nanoparticles (F-nZVI): Effect of Fe0 loading on adsorption activity. J. Environ. Chem. Eng. 2016, 4, 681–694. [Google Scholar] [CrossRef]
  32. Pojananukij, N.; Wantala, K.; Neramittagapong, S.; Lin, C.; Tanangteerpong, D.; Neramittagapong, A. Improvement of As (III) removal with diatomite overlay nanoscale zero-valent iron (nZVI-D): Adsorption isotherm and adsorption kinetic studies. Water Sci. Technol.: Water Supply 2017, 17, 212–220. [Google Scholar] [CrossRef]
  33. Awang, N.A.; Wan Salleh, W.N.; Aziz, F.; Yusof, N.; Ismail, A.F. A review on preparation, surface enhancement and adsorption mechanism of biochar-supported nano zero-valent iron adsorbent for hazardous heavy metals. J. Chem. Technol. Biotechnol. 2022, 98, 22–44. [Google Scholar] [CrossRef]
  34. Liu, T.; Zhang, Z.; Wang, Z.; Wang, Z.-L.; Bush, R. Highly efficient and rapid removal of arsenic (iii) from aqueous solutions by nanoscale zero-valent iron supported on a zirconium 1, 4-dicarboxybenzene metal–organic framework (uio-66 mof). RSC Adv. 2019, 9, 39475–39487. [Google Scholar] [CrossRef]
  35. Wu, Y.; Li, H.; Zhao, Z.; Yi, X.; Deng, D.; Zheng, L.; Luo, X.; Cai, Y.; Luo, W.; Zhang, M. Low-cost and high-efficiency metallurgical copper slag@polyaniline core–shell composite as an adsorbent for the removal of Cr(VI) from aqueous solution. J. Alloys Compd. 2021, 851, 156741. [Google Scholar] [CrossRef]
  36. Mithun, B.; Narasimhan, M. Performance of alkali activated slag concrete mixes incorporating copper slag as fine aggregate. J. Clean. Prod. 2016, 112, 837–844. [Google Scholar] [CrossRef]
  37. Zeynolabedin, R.; Mahanpoor, K. Preparation and characterization of nano-spherical CoFe2O4 supported on copper slag as a catalyst for photocatalytic degradation of 2-nitrophenol in water. J. Nanostructure Chem. 2017, 7, 67–74. [Google Scholar] [CrossRef]
  38. Sun, J.; Zhou, C.; Shen, H.; Du, J.; Li, Q.; Wu, W.; Guo, B.; Liu, G. Green synthesis of ceramsite from industrial wastes and its application in selective adsorption: Performance and mechanism. Environ. Res. 2022, 214, 113786. [Google Scholar] [CrossRef]
  39. Ji, R.; Liu, T.-J.; Kang, L.-L.; Wang, Y.-T.; Li, J.-G.; Wang, F.-P.; Yu, Q.; Wang, X.-M.; Liu, H.; Guo, H.-W. A review of metallurgical slag for efficient wastewater treatment: Pretreatment, performance and mechanism. J. Clean. Prod. 2022, 380, 135076. [Google Scholar] [CrossRef]
  40. Vickers, N.J. Animal communication: When I’m calling you, will you answer too? Curr. Biol. 2017, 27, R713–R715. [Google Scholar] [CrossRef]
  41. Türk, T.; Alp, I.; Sezer, R.; Arslan, C. Removal of arsenic from water using copper slag. J. S. Afr. Inst. Min. Metall. 2020, 120, 313–318. [Google Scholar] [CrossRef]
  42. Kanel, S.R.; Choi, H.; Kim, J.-Y.; Vigneswaran, S.; Shim, W.G. Removal of arsenic (III) from groundwater using low-cost industrial by-products-blast furnace slag. Water Qual. Res. J. 2006, 41, 130–139. [Google Scholar] [CrossRef]
  43. Glocheux, Y.; Pasarín, M.M.; Albadarin, A.B.; Allen, S.J.; Walker, G.M. Removal of arsenic from groundwater by adsorption onto an acidified laterite by-product. Chem. Eng. J. 2013, 228, 565–574. [Google Scholar] [CrossRef]
  44. Wu, W.; Zhang, W.; Ma, G. Mechanical properties of copper slag reinforced concrete under dynamic compression. Constr. Build. Mater. 2010, 24, 910–917. [Google Scholar] [CrossRef]
  45. Phiri, T.C.; Singh, P.; Nikoloski, A.N. The potential for copper slag waste as a resource for a circular economy: A review—Part I. Miner. Eng. 2022, 180, 107474. [Google Scholar] [CrossRef]
  46. Zhang, X.; Lin, S.; Lu, X.-Q.; Chen, Z.-l. Removal of Pb(II) from water using synthesized kaolin supported nanoscale zero-valent iron. Chem. Eng. J. 2010, 163, 243–248. [Google Scholar] [CrossRef]
  47. Kanel, S.R.; Manning, B.; Charlet, L.; Choi, H. Removal of Arsenic(III) from Groundwater by Nanoscale Zero-Valent Iron. Environ. Sci. Technol. 2005, 39, 1291–1298. [Google Scholar] [CrossRef]
  48. Wu, C.; Tu, J.; Liu, W.; Zhang, J.; Chu, S.; Lu, G.; Lin, Z.; Dang, Z. The double influence mechanism of pH on arsenic removal by nano zero valent iron: Electrostatic interactions and the corrosion of Fe0. Environ. Sci. Nano 2017, 4, 1544–1552. [Google Scholar] [CrossRef]
  49. Rao, W.; Lv, G.; Wang, D.; Liao, L. Enhanced degradation of Rh 6G by zero valent iron loaded on two typical clay minerals with different structures under microwave irradiation. Front. Chem. 2018, 6, 463. [Google Scholar] [CrossRef]
  50. Zahedany, F.A.; Sabbaghi, S.; Saboori, R.; Rasouli, K. Investigation of the synergistic effect of TiO2 nanofluid and biomaterials derived from three bacteria in various culture media: Implications for enhanced oil recovery. Chem. Eng. Res. Des. 2022, 186, 50–63. [Google Scholar] [CrossRef]
  51. Sadeghalvaad, M.; Reza Razavi, S.; Sabbaghi, S.; Rasouli, K. Heating performance of a large-scale line heater by adding synthesized carbon- nanodots to the heater bath fluid: CFD simulation and experimental study. Adv. Powder Technol. 2023, 34, 103960. [Google Scholar] [CrossRef]
  52. Tandon, P.K.; Shukla, R.C.; Singh, S.B. Removal of Arsenic(III) from Water with Clay-Supported Zerovalent Iron Nanoparticles Synthesized with the Help of Tea Liquor. Ind. Eng. Chem. Res. 2013, 52, 10052–10058. [Google Scholar] [CrossRef]
  53. Hamdy, A. Experimental Study of the Relationship Between Dissolved Iron, Turbidity, and Removal of Cu(II) Ion From Aqueous Solutions Using Zero-Valent Iron Nanoparticles. Arab. J. Sci. Eng. 2021, 46, 5543–5565. [Google Scholar] [CrossRef]
  54. Abd El-Lateef, H.M.; Khalaf Ali, M.M.; Saleh, M.M. Adsorption and removal of cationic and anionic surfactants using zero-valent iron nanoparticles. J. Mol. Liq. 2018, 268, 497–505. [Google Scholar] [CrossRef]
  55. Mantry, S.; Behera, D.; Satapathy, A.; Jha, B.B.; Mishra, B.K. Deposition of plasma sprayed copper slag coatings on metal substrates. Surf. Eng. 2013, 29, 222–227. [Google Scholar] [CrossRef]
  56. Zhao, C.; Yang, J.; Wang, Y.; Jiang, B. Well-dispersed nanoscale zero-valent iron supported in macroporous silica foams: Synthesis, characterization, and performance in Cr (VI) removal. J. Mater. 2017, 2017, 1–13. [Google Scholar] [CrossRef]
  57. Khasawneh, O.F.S.; Palaniandy, P.; Ahmadipour, M.; Mohammadi, H.; Bin Hamdan, M.R. Removal of acetaminophen using Fe2O3-TiO2 nanocomposites by photocatalysis under simulated solar irradiation: Optimization study. J. Environ. Chem. Eng. 2021, 9, 104921. [Google Scholar] [CrossRef]
  58. Zhang, Y.; Xu, H.; Ma, S.; Chen, M.; Tian, L.; Gou, G.; Chen, Y. A research on the removal characteristics of naphthol Green B from wastewater using nanomaterials nZVI/CS/APT. Phys. Chem. Liq. 2022, 60, 219–232. [Google Scholar] [CrossRef]
  59. Mansourian, R.; Mousavi, S.M.; Alizadeh, S.; Sabbaghi, S. CeO2/TiO2/SiO2 nanocatalyst for the photocatalytic and sonophotocatalytic degradation of chlorpyrifos. Can. J. Chem. Eng. 2022, 100, 451–464. [Google Scholar] [CrossRef]
  60. Tao, W.; Zhong, H.; Pan, X.; Wang, P.; Wang, H.; Huang, L. Removal of fluoride from wastewater solution using Ce-AlOOH with oxalic acid as modification. J. Hazard. Mater. 2020, 384, 121373. [Google Scholar] [CrossRef]
  61. Hasanzadeh, V.; Rahmanian, O.; Heidari, M. Cefixime adsorption onto activated carbon prepared by dry thermochemical activation of date fruit residues. Microchem. J. 2020, 152, 104261. [Google Scholar] [CrossRef]
  62. Al-husseiny, R.A.; Kareem, S.L.; Naje, A.S.; Ebrahim, S.E. Effect of green synthesis of Fe3O4 nanomaterial on the removal of cefixime from aqueous solution. Biomass Convers. Biorefin. 2023, 48, 1028. [Google Scholar] [CrossRef]
  63. Esmaeili Bidhendi, M.; Poursorkh, Z.; Sereshti, H.; Rashidi Nodeh, H.; Rezania, S.; Afzal Kamboh, M. Nano-size biomass derived from pomegranate peel for enhanced removal of cefixime antibiotic from aqueous media: Kinetic, equilibrium and thermodynamic study. Int. J. Environ. Res. Public Health 2020, 17, 4223. [Google Scholar] [CrossRef] [PubMed]
Figure 1. Schematic of nZVI/copper slag synthesis process.
Water 15 01819 g001
Figure 2. FE-SEM images of pure copper slag (a,c) and nZVI/copper slag (b,d) at 500 and 200 nm magnification.
Water 15 01819 g002
Figure 3. EDX Elemental percentage composition of the (a) pure copper slag and (b) nZVI/copper slag.
Water 15 01819 g003
Figure 4. XRD patterns of the (a) pure copper slag, (b) nZVI, and (c) nZVI/copper slag.
Water 15 01819 g004
Figure 5. FTIR spectra of the (a) nZVI, (b) pure copper slag and (c) nZVI/copper slag.
Water 15 01819 g005
Figure 6. Particle size distribution of (a) adsorbent (nZVI/CS) and (b) copper slag and N2 adsorption–desorption isotherm of (c) adsorbent (nZVI/CS) and (d) copper slag. p/p0 is the relative pressure (where p0 = 1 atm and p is the saturated vapor pressure of nitrogen gas at a temperature of 77 K).
Water 15 01819 g006
Figure 7. Electrophoretic mobility of the nZVI/CS at different pH.
Water 15 01819 g007
Figure 8. (a) Predicted vs. Actual plot, (b) Normal plot of Residuals, (c) Residuals vs. Predicted plot, and (d) Residuals vs. Run plot.
Water 15 01819 g008
Figure 9. Diagrams of (a) 3D surface and (b) contour of the effect of pollutant concentration and adsorbent dosage on cefixime removal.
Water 15 01819 g009
Figure 10. Diagrams of (a) three-dimensional and (b) contour of the effect of pollutant concentration and pH on cefixime removal.
Water 15 01819 g010
Figure 11. Diagram (a) three-dimensional and (b) contour of the effect of initial concentration and contact time on cefixime removal.
Water 15 01819 g011
Figure 12. Operating conditions of the optimum point of cefixime removal from the aquatic environment.
Water 15 01819 g012
Figure 13. (a) The pseudo-first-order and (b) the pseudo-second-order depicts the regression lines of these models, which were obtained from plotting ln ((Ct)/C0) and t/(qt) versus time (h), separately and (c) Variation of adsorption capacity versus time at 8 g/L adsorbent dosage, 15 mg/L CFX concentration.
Water 15 01819 g013
Figure 14. Separation factor of cefixime adsorbed on nZVI/copper slag adsorbent.
Water 15 01819 g014
Figure 15. (a) investigating the effectiveness of nZVI/CS in removing CFX across 6 consecutive cycles, and (b) Performance of regenerated CS-nZVI nano adsorbent to remove cefixime in consecutive cycles.
Water 15 01819 g015
Table 1. List of recommended software experiments.
Run No.ABCD
CFX Concentration (mg/L)Adsorbent Dosage (g/L)pHTime
(min)
1158820
2258440
3154440
4154420
5306630
6158840
7106630
8258820
9206630
10206630
11206230
12254440
13206630
14158420
15202630
16154840
172010630
18206650
19258420
20158440
21154820
22206610
23206630
24254420
252061030
26206630
27254820
28206630
29258840
30254840
Table 2. BET analysis results.
ParameterBET Surface Area (m2/mg)Langmuir Surface Area (m2/mg)Pore Diameter (nm)Pore Volume (cm3/g)
CS 1.831726.9494.32250.0019
CS-nZVI Absorbent3.342463.0083.4260.0028
Table 3. Arrangement of the CCD for the four independent parameters and the CFX removal efficiency.
Run No.CFX Concentration (mg/L)Adsorbent Dosage (g/L)pHTime (min)Removal of CFX (%)Predicted Removal (%)
115882069.2763.67
225844085.1993.02
315444083.9782.38
415442052.1855.78
530663054.7257.07
615884085.9688.93
710663095.0693.44
825882040.0340.41
920663086.8581.76
1020663080.3381.76
1120623083.6472.65
1225444063.1969.28
1320663071.2281.76
1415842069.476.33
1520263036.0243.09
1615484066.0967.67
17201063095.0388.69
1820665090.8985.88
1925842061.4560.36
2015844098.6699.33
2115482050.8641.82
2220661021.6327.36
2320663084.8881.76
2425442040.1936.01
25206103026.2837.99
2620663081.3681.76
2725482017.9414.76
2820663085.9281.76
2925884075.4372.32
3025484055.4147.27
Table 4. ANOVA for Quadratic Model response for CFX elimination by nZVI/CS nanocomposite and values of actual equation.
SourceSum of SquaresDFMean SquareF-Valuep-Value
Model14,312/50141022/3215/57<0.0001
A- Cefixime concentration1984/5311984/5330/22<0.0001
B-Adsorbent dosage3118/5813118/5847/49<0.0001
C-pH1801/9711801/9727/440.0001
D-Time5136/3015136/3078/22<0.0001
AB14/10114/400/21930/6463
AC53/22153/220/81040/3822
AD44/36144/360/67550/4240
BC1/7011/700/00550/8742
BD0/360010/36000/00860/9420
CD0/562510/56251/110/9275
A272/61172/616/580/3096
B2431/941431/9418/250/0216
C21198/2611198/2616/500/0007
D21083/3211083/32-0/0010
Residual984/951565/66--
Lack of Fit818/711081/872/460/1659
Pure Error166/24533/25--
Cor Total15,297/4629---
Table 5. Kinetic variables for the CFX removal using the nZVI/CS adsorbent.
Kinetic ModelKobs (h−1)K2 (g/mg/h)R2
Pseudo-first-order model0.62----0.738
Pseudo-second-order model----0.0320.95
Table 6. Equilibrium model parameters for CFX adsorption onto the nZVI/CS nanocomposite.
Equilibrium ModelParametersnZVI/CS
Langmuir isothermqm (mg g−1)4.38
b (L mg−1)0.09
R20.99
Freundlich isotherm (L mg−1)1.88
n2.97
R20.85
Table 7. Maximum adsorption capacity (qm) of cefixime antibiotics onto various adsorbents.
PollutantAdsorbentPollutant Concentration (mg/L)Adsorbent Dosage (g/L)Contact Time (min)pHAdsorption Capacity (mg/g)Removal Percentage (%)Ref.
CefiximeNAC
KAC
50011804557.9
571.5
-
-
[61]
CefiximePAC/Fe/Si/Zn100.081209–115.7695.6[25]
CefiximeHKUST-1/ZIF-82000.1240711090[21]
CefiximeFe3O4 and
T-Fe3O4
40
50
0.005120541.32
56.49
-
-
[62]
CefiximeFe3O4@
MWCNT-CdS
100.04605105.2687.44[19]
CefiximeNano-sized activated carbon501604181.8195[63]
CefiximenZVI/CS19.427.7936.174.594.3198.71This study
Disclaimer/Publisher’s Note: The statements, opinions and data contained in all publications are solely those of the individual author(s) and contributor(s) and not of MDPI and/or the editor(s). MDPI and/or the editor(s) disclaim responsibility for any injury to people or property resulting from any ideas, methods, instructions or products referred to in the content.

