

Experimental and Analytical Evaluations of Ground Behaviors on Changing in Groundwater Level in Bangkok, Thailand

1
Graduate School of Engineering and Science, Shibaura Institute of Technology, 3-7-5 Toyosu, Ko-to-Ku, Tokyo 135-8548, Japan
2
College of Engineering, Shibaura Institute of Technology, 3-7-5 Toyosu, Koto-Ku, Tokyo 135-8548, Japan
*
Author to whom correspondence should be addressed.
Water 2023, 15(10), 1825; https://doi.org/10.3390/w15101825
Submission received: 23 March 2023
/
Revised: 29 April 2023
/
Accepted: 7 May 2023
/
Published: 10 May 2023
(This article belongs to the Special Issue Environmental Impact Assessment on Soil and Water Conservation)
Abstract
:Groundwater level changes have numerous effects on buildings, such as differential ground deformation and cracking on the wall. In Bangkok, Thailand, change in groundwater levels changing was caused by groundwater pumping that took place from 1978 to 1997. This is the main effect of ground deformation in a wide area of the Bangkok plain. According to the regulation of groundwater pumping in Bangkok and urban areas, the trend of groundwater level tended to recover around the year 1997. However, the ground settlement still occurs for a while after groundwater recovery. The objective of this study is to evaluate and compare the capability of each approach for the ground deformation and the pile capacity in the situation of groundwater level change. Data in this study were obtained from the previous centrifuge test which had been modeled for the Bangkok area. The ground behavior and pile load capacity behavior were verified using numerical modeling. Both experimental modeling and numerical modeling represent very similar trends of ground deformation. The pile capacity results from both models’ increase while the groundwater level decreases and the pile capacity decreases when groundwater is recovered. The numerical modeling results reveal an overestimate of the ground behavior. However, both results present the loss of pile capacity in the range of 8 to 25% of maximum load when the groundwater level reach to the minimum level.
1. Introduction
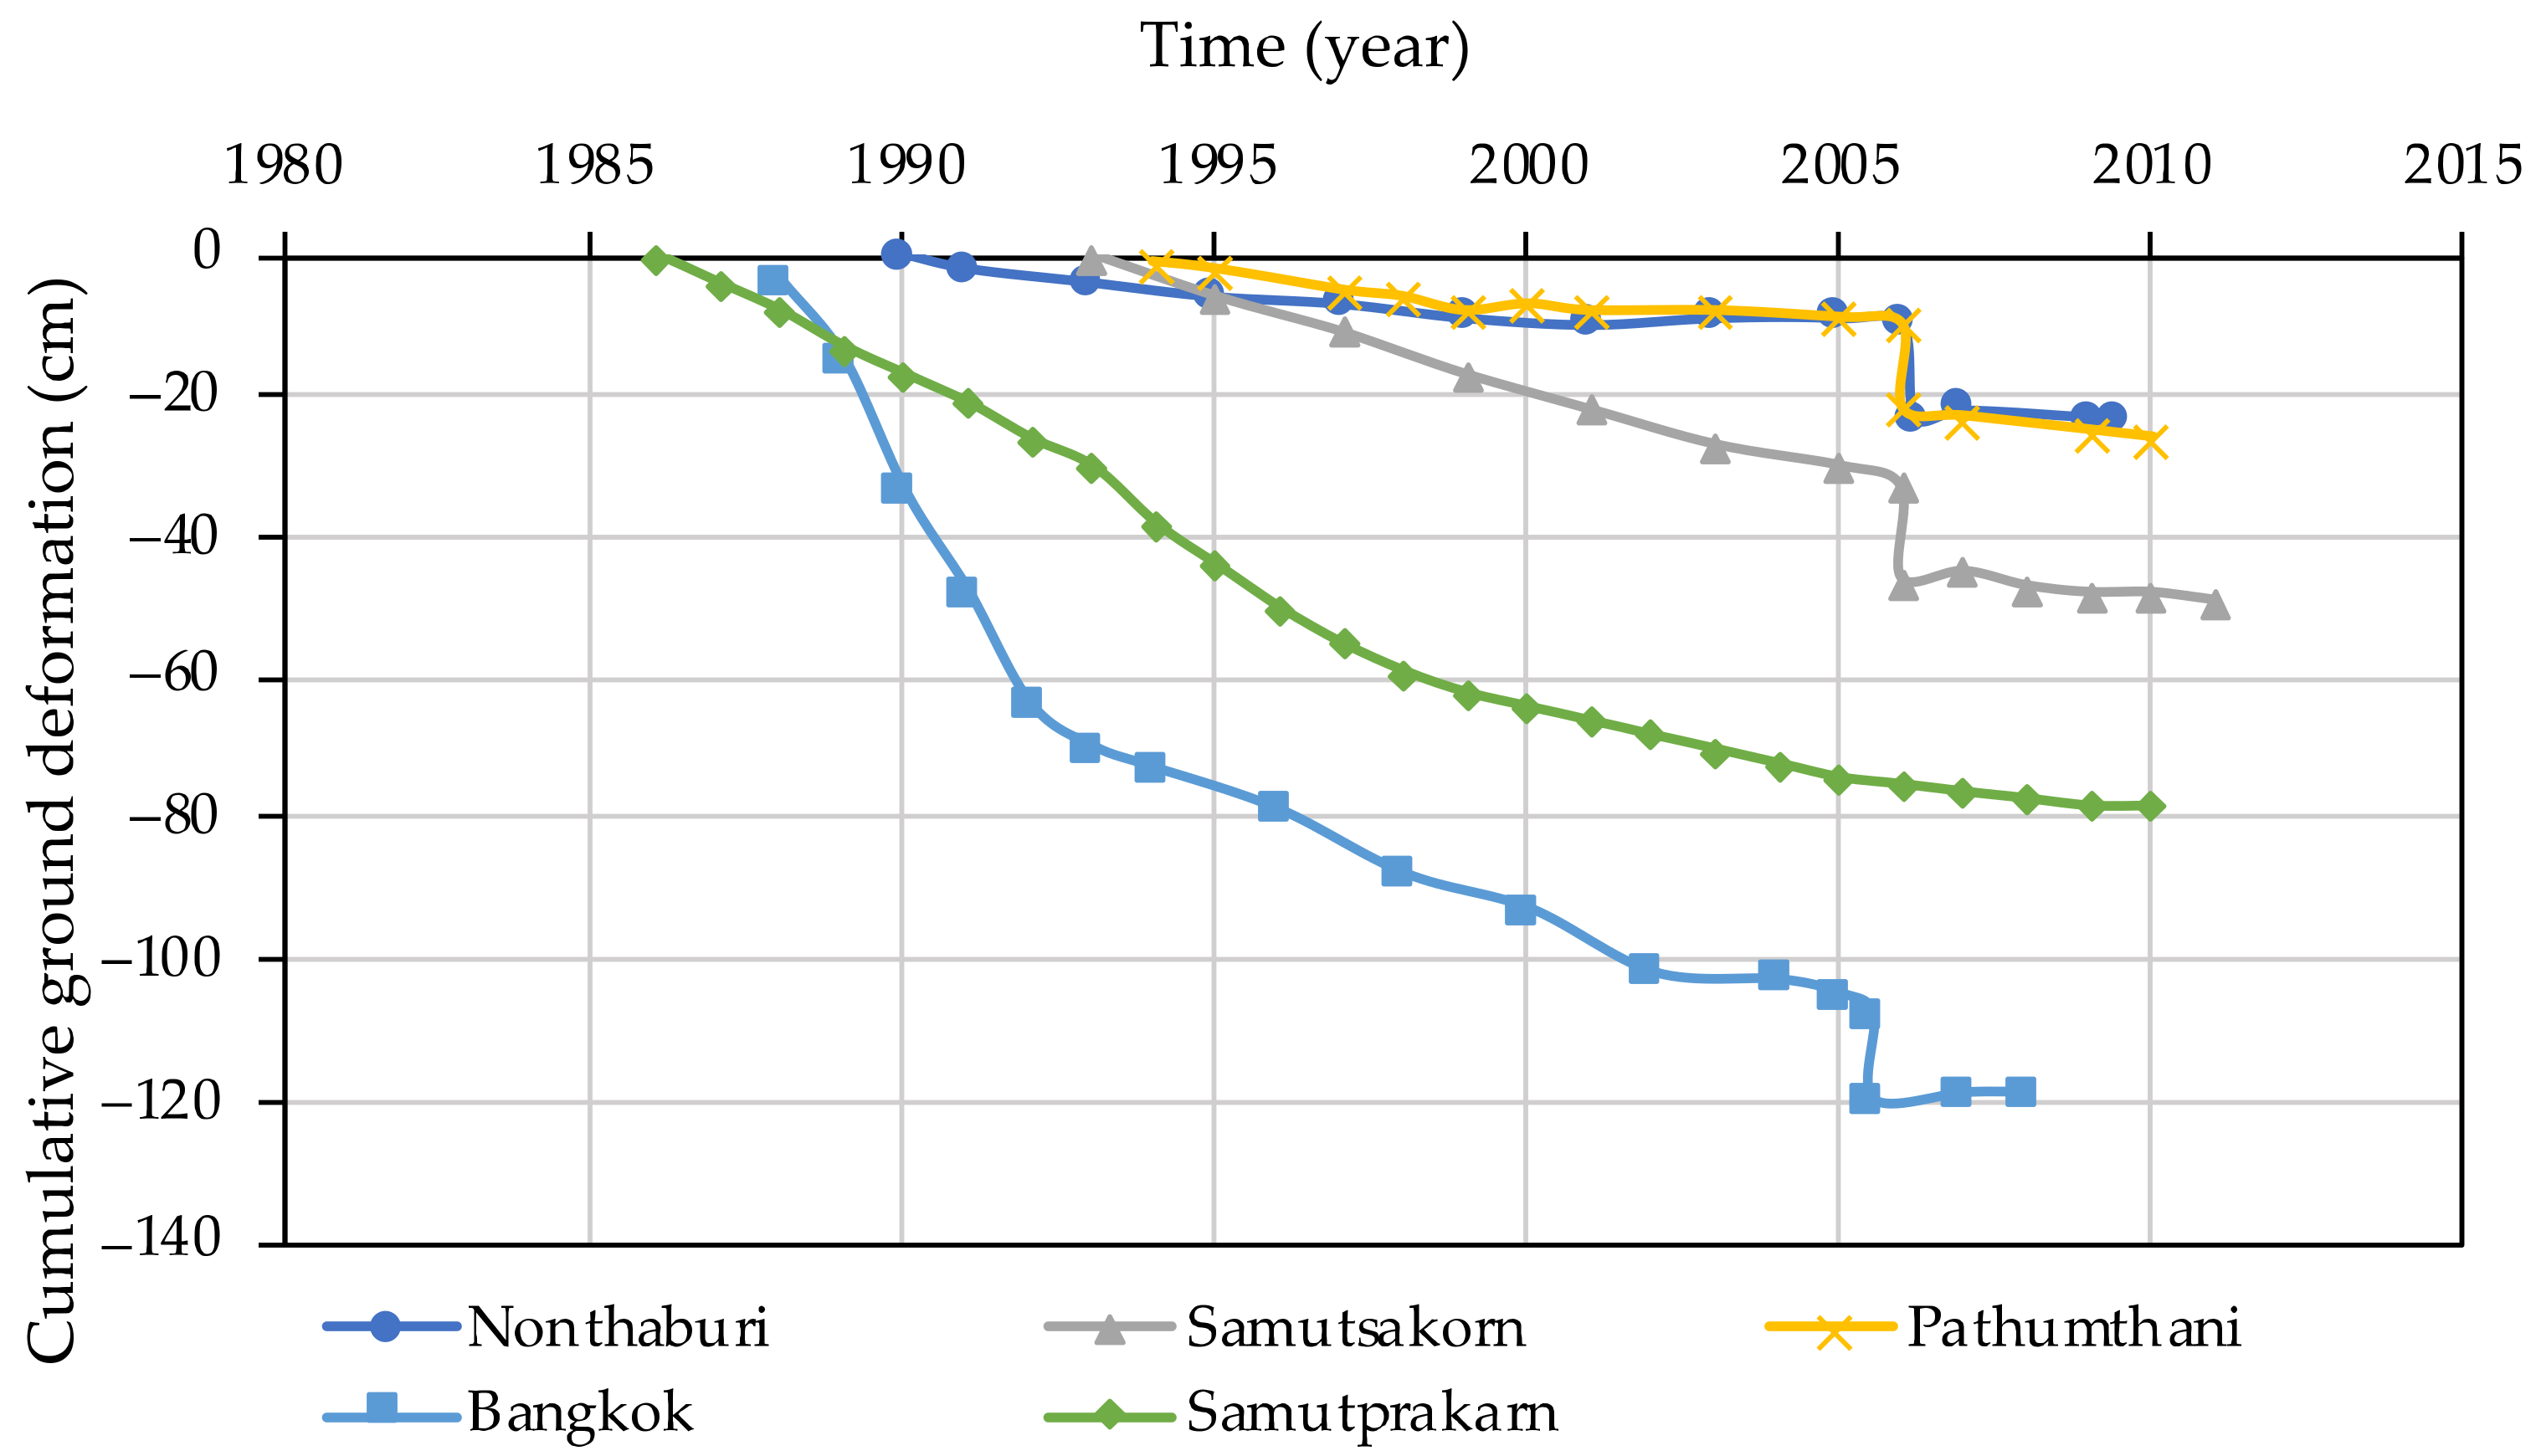
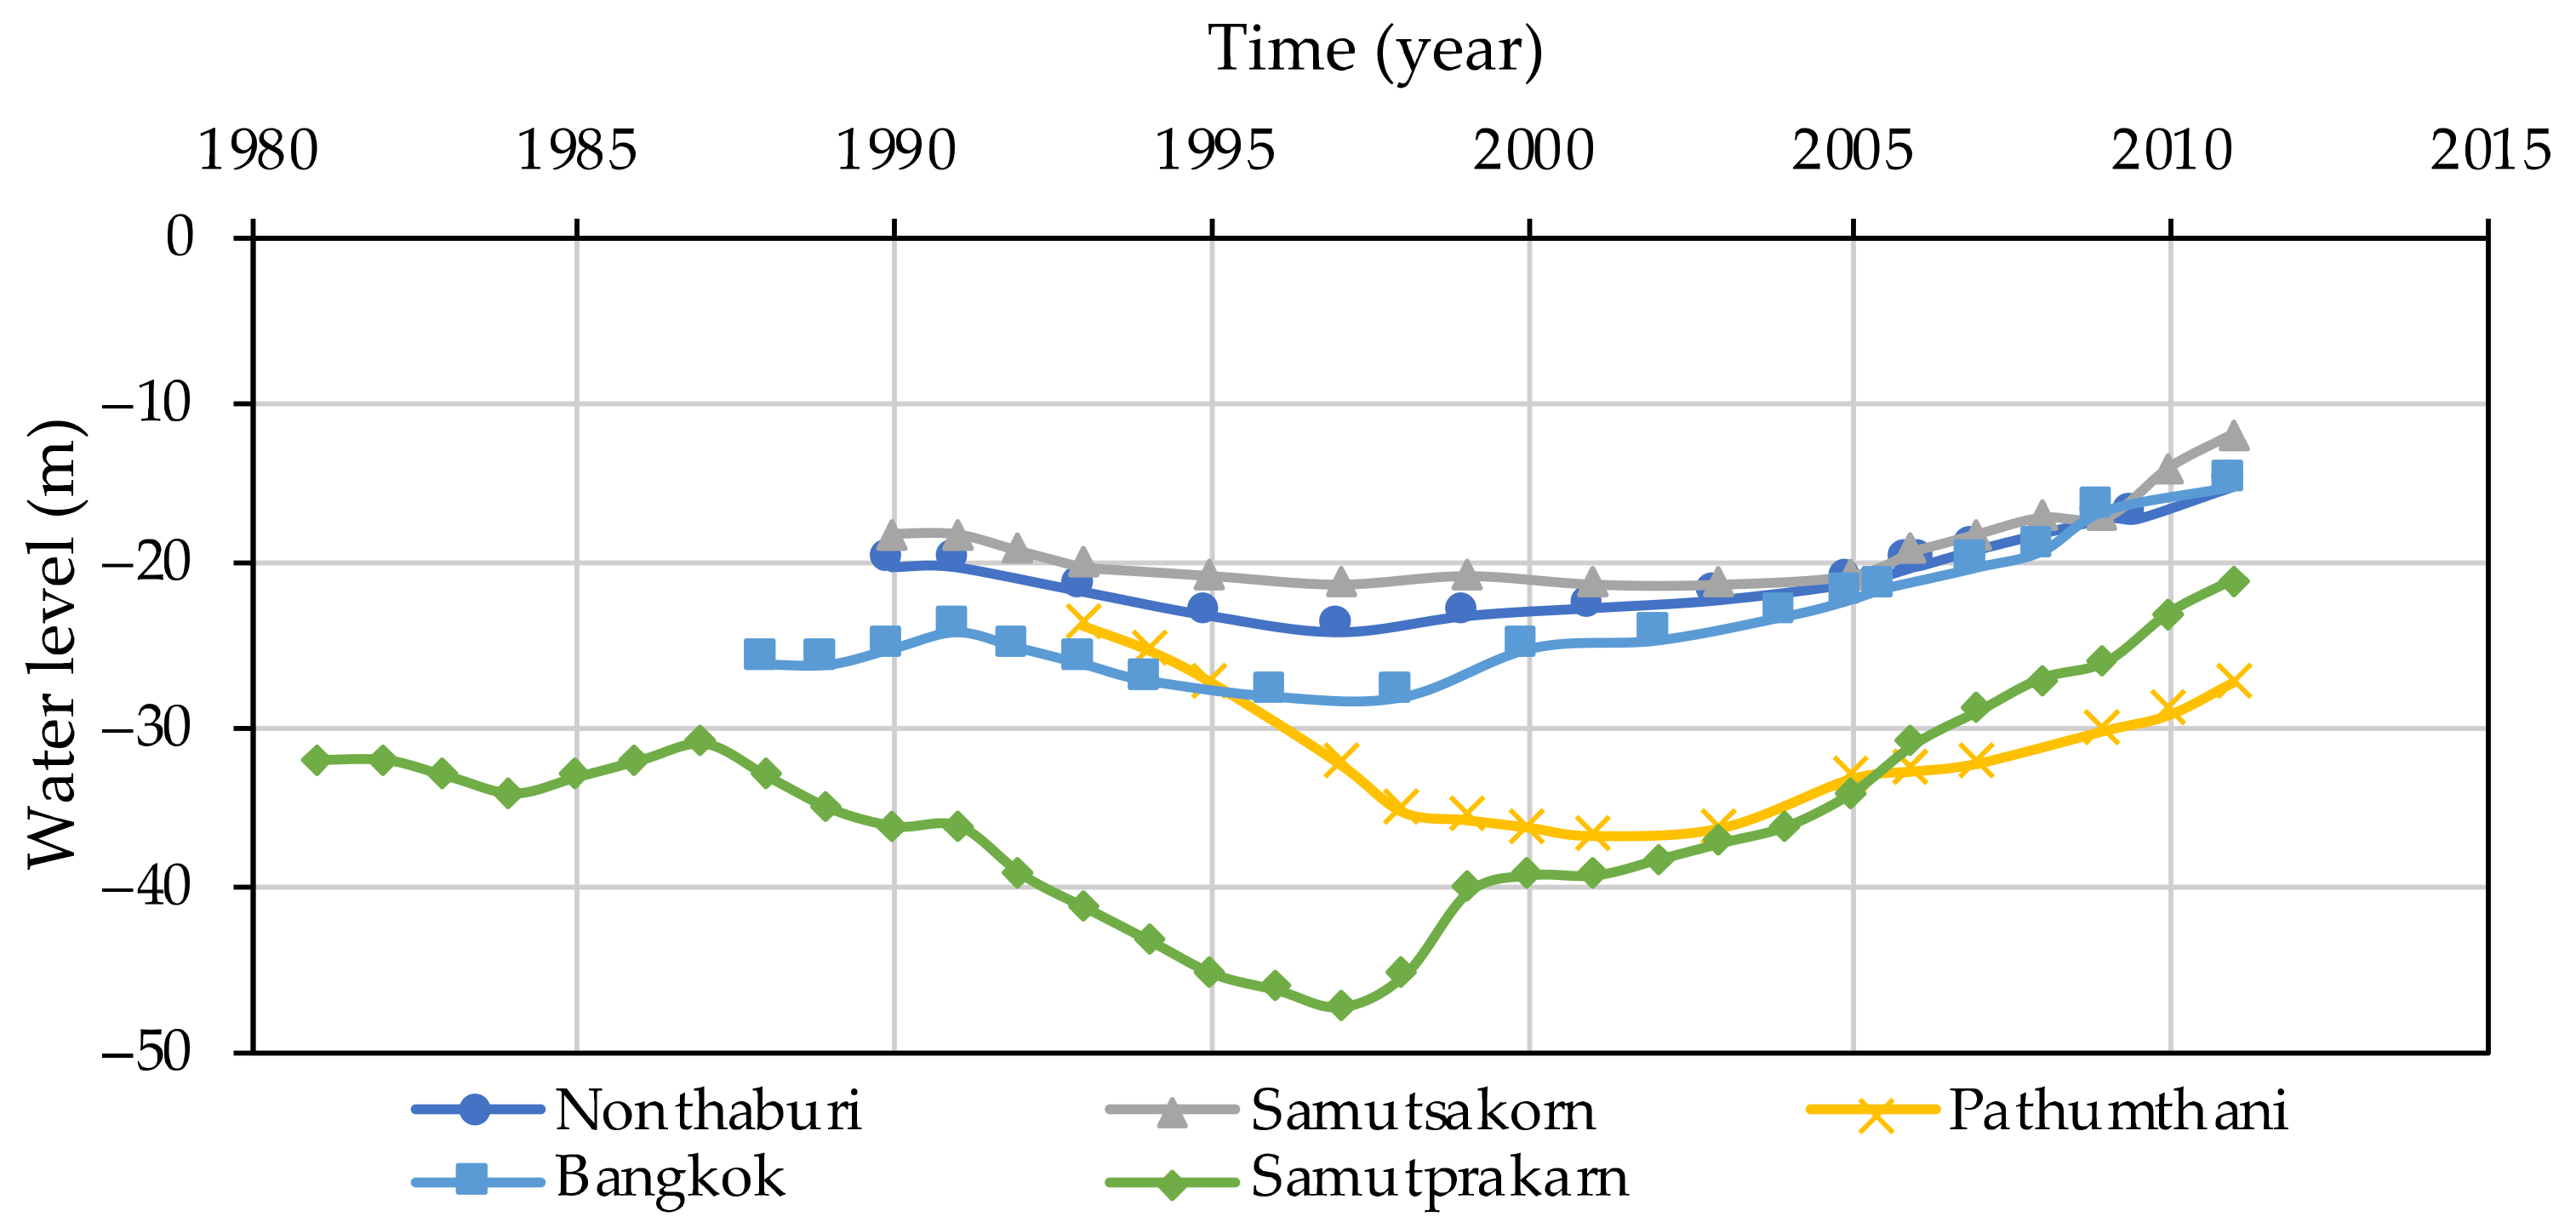
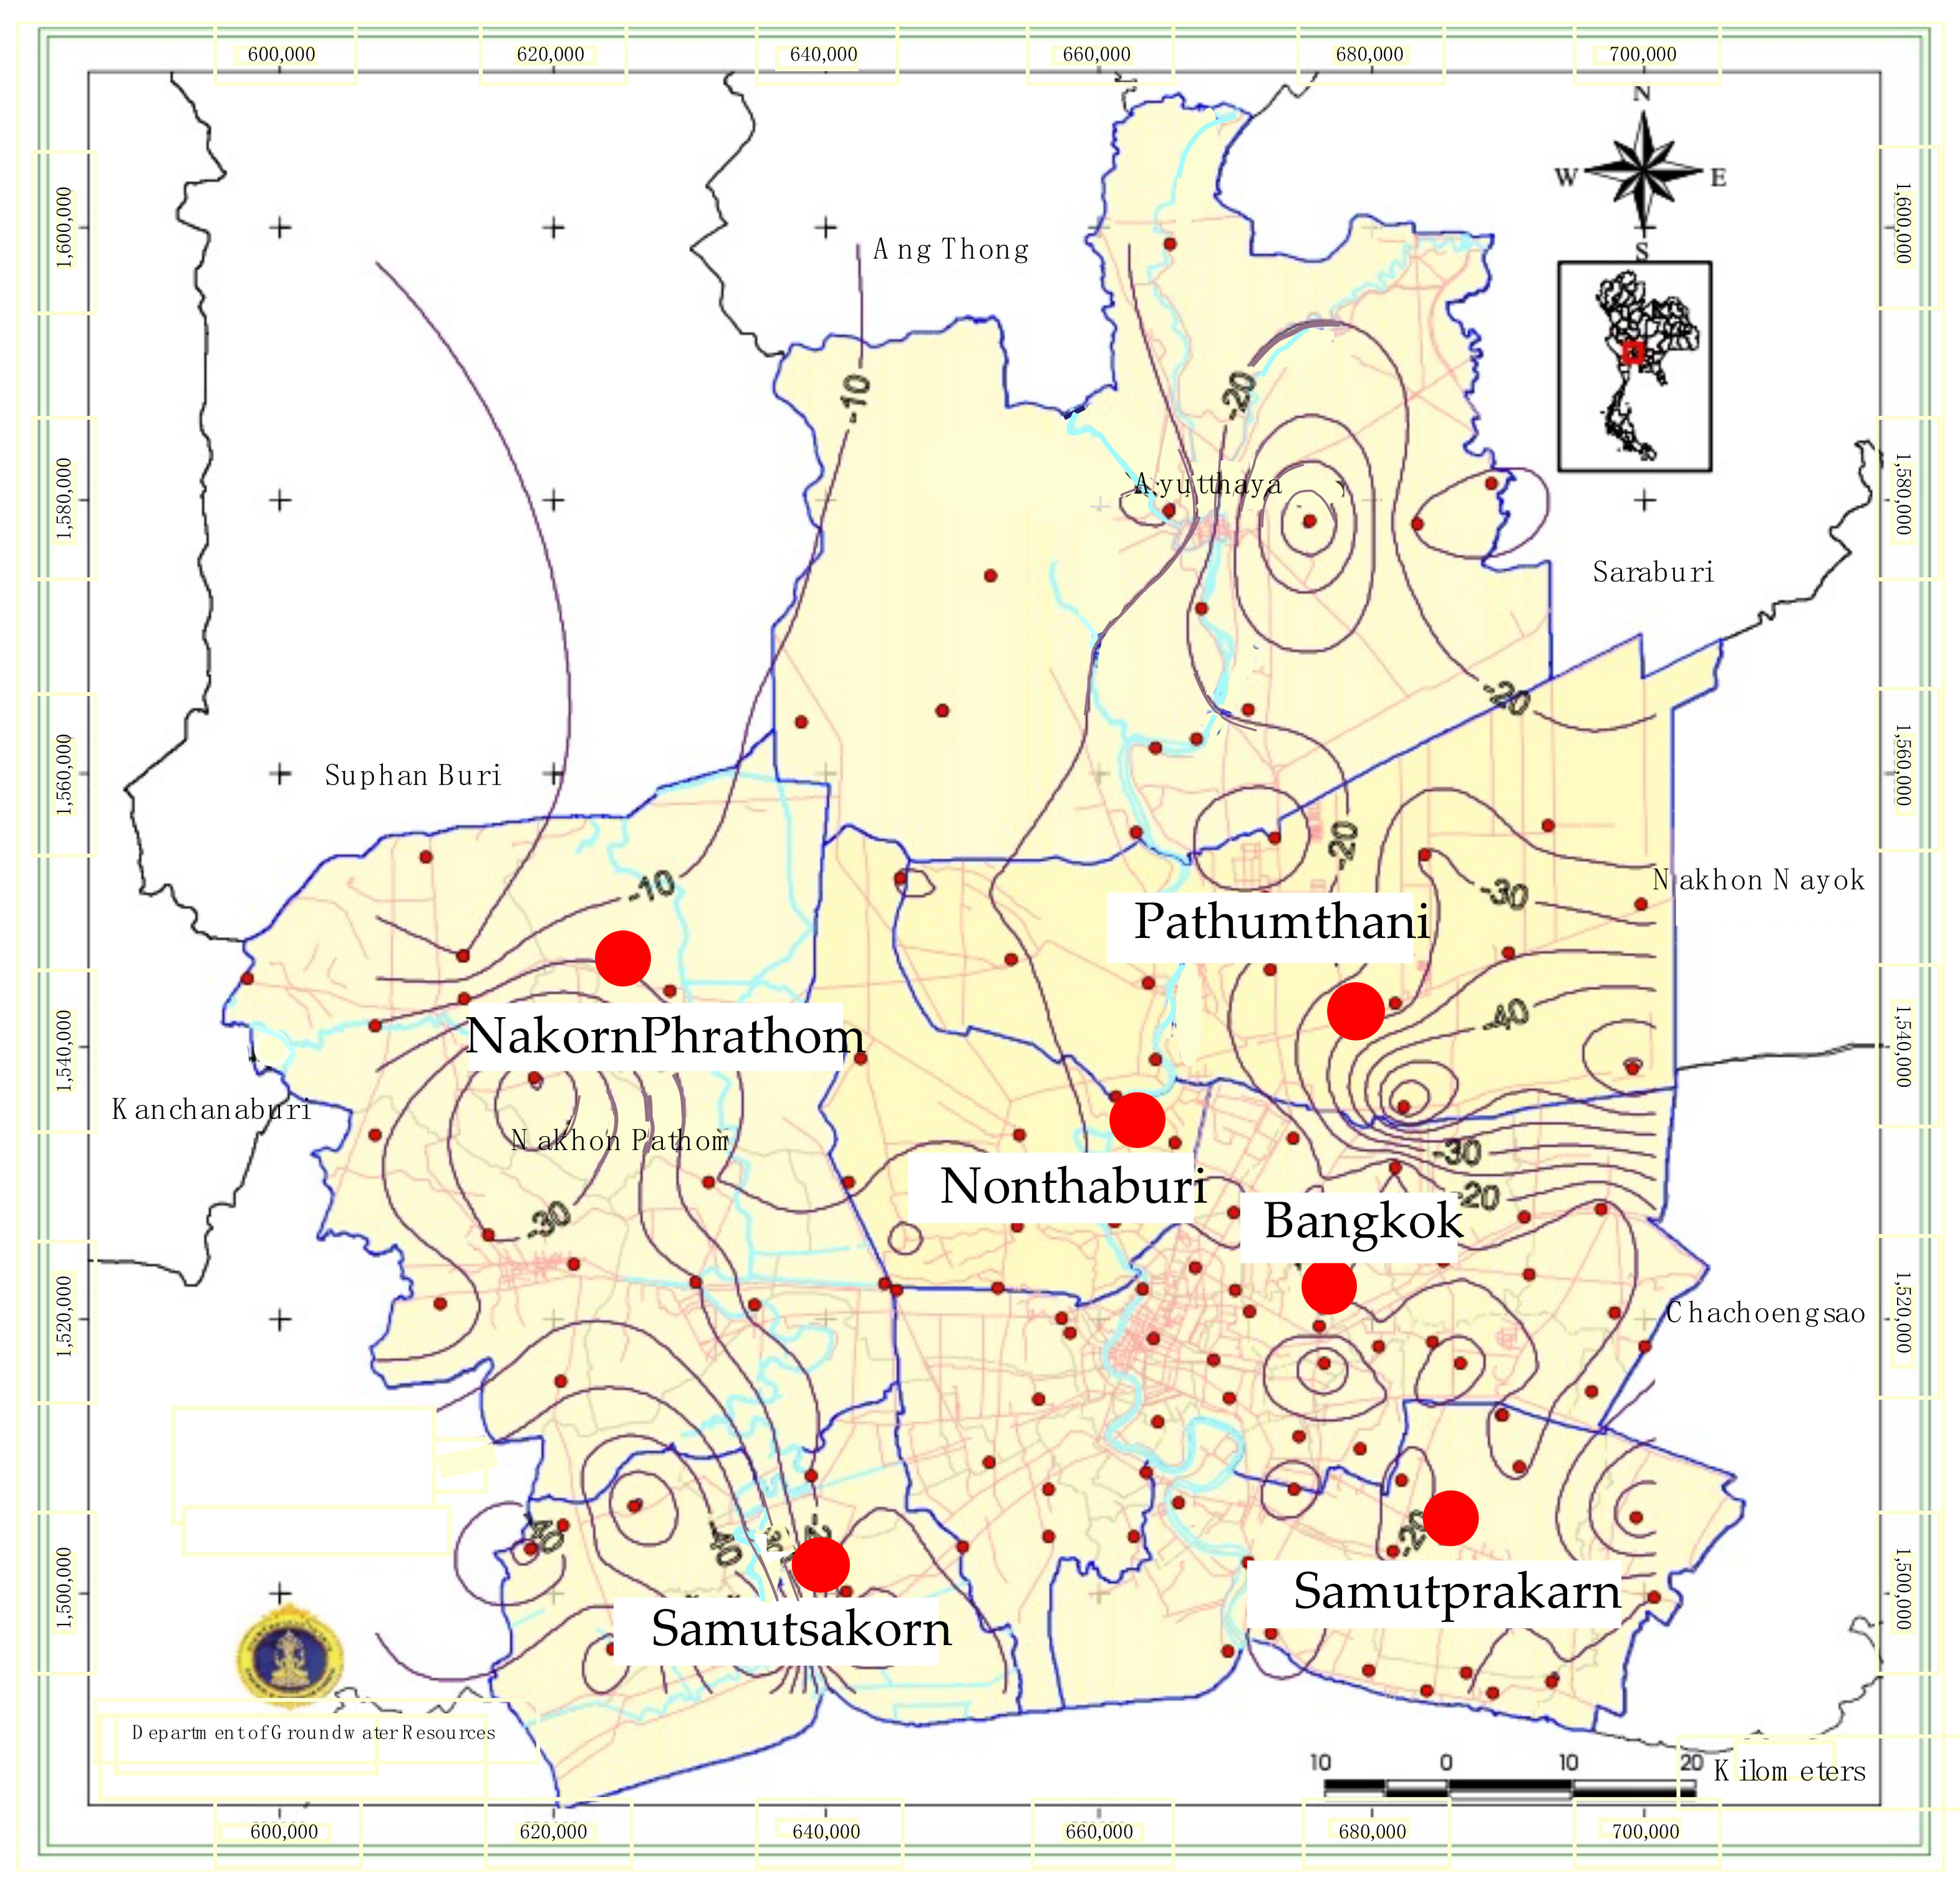
Ground deformation is a global problem in big cities, especially cities located on low land and soft soil area. Bangkok Thailand is located in the soft clay area. Before 1997, decreasing in the groundwater level occurred due to its significant consumption by industries and the people in the city area. From the record in the part, the ground deformation rate rapidly increased since 1978 [1]. In 1997, the Thai government announced the regulation of groundwater pumping strictly. The volume of groundwater pumping decreased because of groundwater regulation, and the recovery started after that period. The groundwater pumping laws successfully controlled groundwater levels because the ground deformation rate in this period was lower than the groundwater decreasing period. Using groundwater pumping laws is still important to control groundwater levels. Department of Groundwater Resources (DGR), Thailand, presented the data from the observation station in the Bangkok Plain, Thailand. Ground deformation rates in many areas were very small compared with other areas which still have high ground deformation rates continuously. Figure 1 represents the characteristic of the ground deformation which is related to the groundwater level changing in Figure 2. The observation station of DGR is shown in Figure 3.
Changes in groundwater levels not only affect ground deformation but also the soil strength in terms of porewater pressure changing. In the past, many researchers assessed the bearing capacity to estimate and predict the ground behavior by using many methods such as the finite element method (FEM), differential method, and experimental method. Inthachai et al. calculated the bearing capacity based on the basic theory for the short pile and long pile in Bangkok, Thailand [2]. The study evaluated the state of groundwater level recovery from the year 1997 to 2027 at a groundwater level equal to 5 m below the ground surface. The bearing capacity of both types of piles decreased especially in the short pile which had decreased more than the long pile. The pile capacity of the short pile decreased by about 48% but the long pile decreased by about 25 to 30%. Morrison and Taylor studied the performance of the bearing capacity for the deep pile foundation during groundwater recovery in London by using the centrifuge machine. The study found that the shaft and base load capacity had reduced [3]. Fleming also represented that pile settlement continues to occur even without the loading on the pile [4]. Skempton investigated pile settlement in London and found that the pile settlement was about 8.5% of the diameter of the pile [5].
For a long time, the numerical model is often used to analyze and verify the experimental model. Different software is used for detecting geotechnical problems such as ABAQUS, GeoStudio, and PLAXIS by using the constitutive model. Schweiger summarizes the constitutive model in five categories depending on the material property. Each model was used according to the appropriate soil characteristic and construction [6]. Surasak et al. also used the PLAXIS software by using the hardening soil model (HSM) to explain the soil behavior [7]. Phoban et al. also used the PLAXIS2D software to simulate the pile capacity reduction of 17% during groundwater recovery in Bangkok, Thailand [8]. Saowiang and Giao used the ABAQUS software to estimate the ground deformation and the loss of pile capacity. The ground deformation rates rebounded around 0.21–0.32 cm/year from 1997 to 2016. The loss of pile capacity is about 16% [9].
Therefore, this study mentions using the PLAXIS3D software to verify and compare the soil behavior with the centrifuge geotechnical machine. The centrifuge machine was used to study the soil behavior because it can model the stress as in a field test. It also reduces the time and testing cost for the complex problem.
2. Geology and Hydrogeology in Bangkok Plain
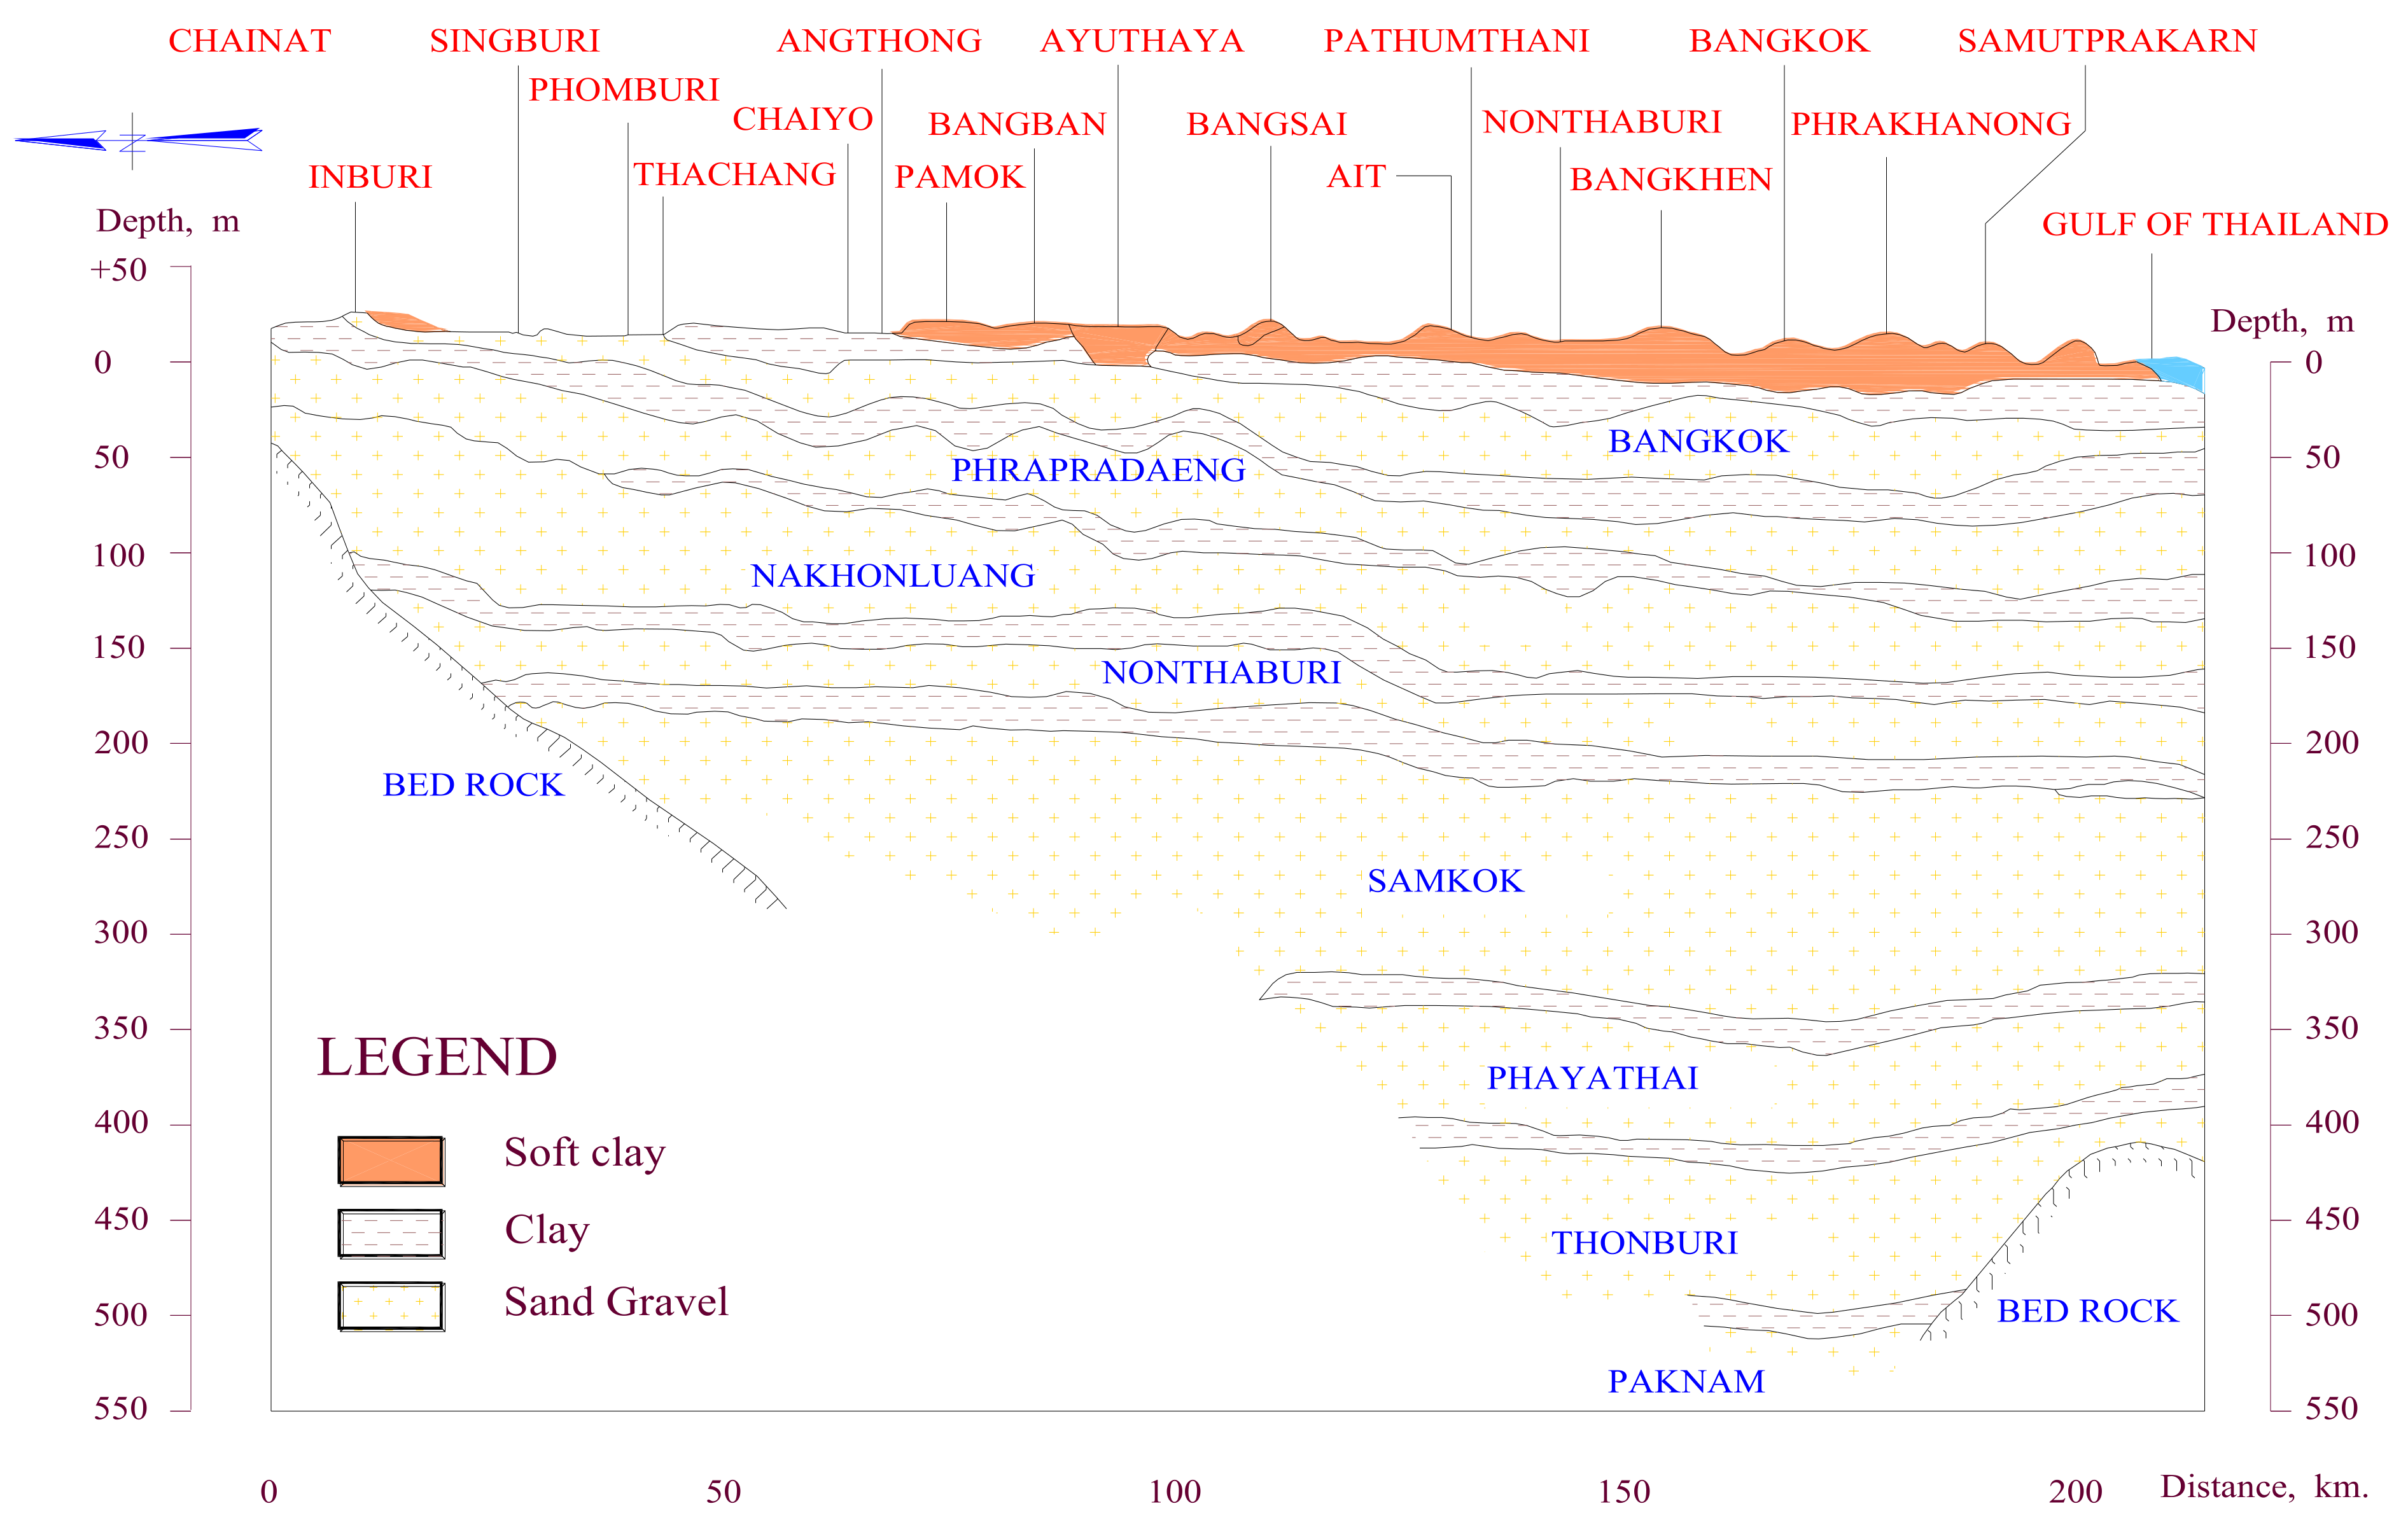
The Bangkok Plain is located in the Chao Phraya River Basin. Many provinces were situated on soft soil according to The Department of Mineral Resources (DMR) investigated [10]. Figure 4 presents the characteristic of subsurface geology which occurred because of soil deposits. Accumulation of sediment has a huge deltaic area as soft clay in the Chao Phraya River Basin called marine clay or the Bangkok Clay. Figure 5 represents the arrangement of soil layers and aquifer layers in the Chao Phraya River Basin area. The clay layer was alternated with the sand layer which is the aquifer layer. The upper zone of the soil layer is the zone of the soft clay layer called Soft Bangkok Clay, about 14 m from the ground surface. The soil layer below the Soft Bangkok Clay is medium stiff clay to stiff clay about 25 m depth, medium dense sand about 35 m depth, hard clay about 50 m depth, and dense sand about 60 m depth, respectively [11]. Normally, every sand layer was used for groundwater pumping, which called for aquifer layers. There are eight aquifers according to Figure 5. The name of each aquifer is the Bangkok Aquifer, the Phra Pradaeng Aquifer, the Nakorn Luang Aquifer, the Nonthaburi Aquifer, the Sam Khok Aquifer, the Phaya Thai Aquifer, the Thon Buri Aquifer, and the Pak Nam aquifer, respectively. The upper aquifer zone is mostly salty and has some contaminants, such as the Bangkok and Nonthaburi aquifer. The Nakorn Luang aquifer has good water quality in some areas. Therefore, this aquifer layer has been heavily extracted. The Sam Khok Aquifer and the Phraya Thai Aquifer also have good water quality, but it is not popular because it is very deep and expensive. The Thon Buri aquifer also has good water quality but it is not productive because this aquifer has a clay mixture in horizontal thickness. The Pak Nam aquifer has the best water quality located from about 550 m downward but it is very deep for pumping [12].
The Department of Groundwater Resources (DGR) observed the groundwater level using piezometers in Bangkok Plain, Thailand. The collecting of groundwater levels changing and ground deformation was around 1978. The groundwater level decreased related to the volume of groundwater pumping [1]. In evidence, the data investigated groundwater drawdown due to groundwater pumping and recovery due to controlling of groundwater pumping. For example, the Ratchathewi area in Bangkok had a ground deformation rate of 3.2 cm/year from the year 1978 to 1985. After groundwater level recovery in 1997, the ground deformation rate occurred at about 1.3 cm/year in the year 2006. At Ramkhamhaeng University, the ground deformation rate was about 9.72 cm/year from 1978 to 1985 and 2.15 cm/year from 1985 to 1999. After groundwater recovery, ground deformation was about 1.3 cm/year. Hua-Mak in Bangkok also show a similar trend of deformation. The ground deformation rate was 10 com/year from 1978 to 1985. Then the ground deformation rate declined by about 1.3 cm/year in the year 2005. According to the trend of the ground deformation rate, the ground deformation rate during the groundwater recovery period was lower than the groundwater level decreasing period. Currently, the ground deformation rate has decreased and was lower than the groundwater over-pumping period. DGR still observes the groundwater level and ground deformation in Bangkok Plain, Thailand. The six observation stations are in six provinces. They are Pathum Thani Province, Nonthaburi Province, NakornPhathom Province, Bangkok, Samut Prakan Province, and SumutSakhon Province. All trends of groundwater level have recovered. The groundwater levels were at about 13 m to 27 m depth in 2011.
3. Experimental Modelling by Centrifuge Test
The experimental model such as the centrifuge test has been widely used for solving the complex geotechnical problems. The centrifuge test can demonstrate and explain the soil behavior using the hydraulic gradient techniques of changing water levels [13]. Therefore, the situation of groundwater level change can be duplicated by using the centrifuge machine.
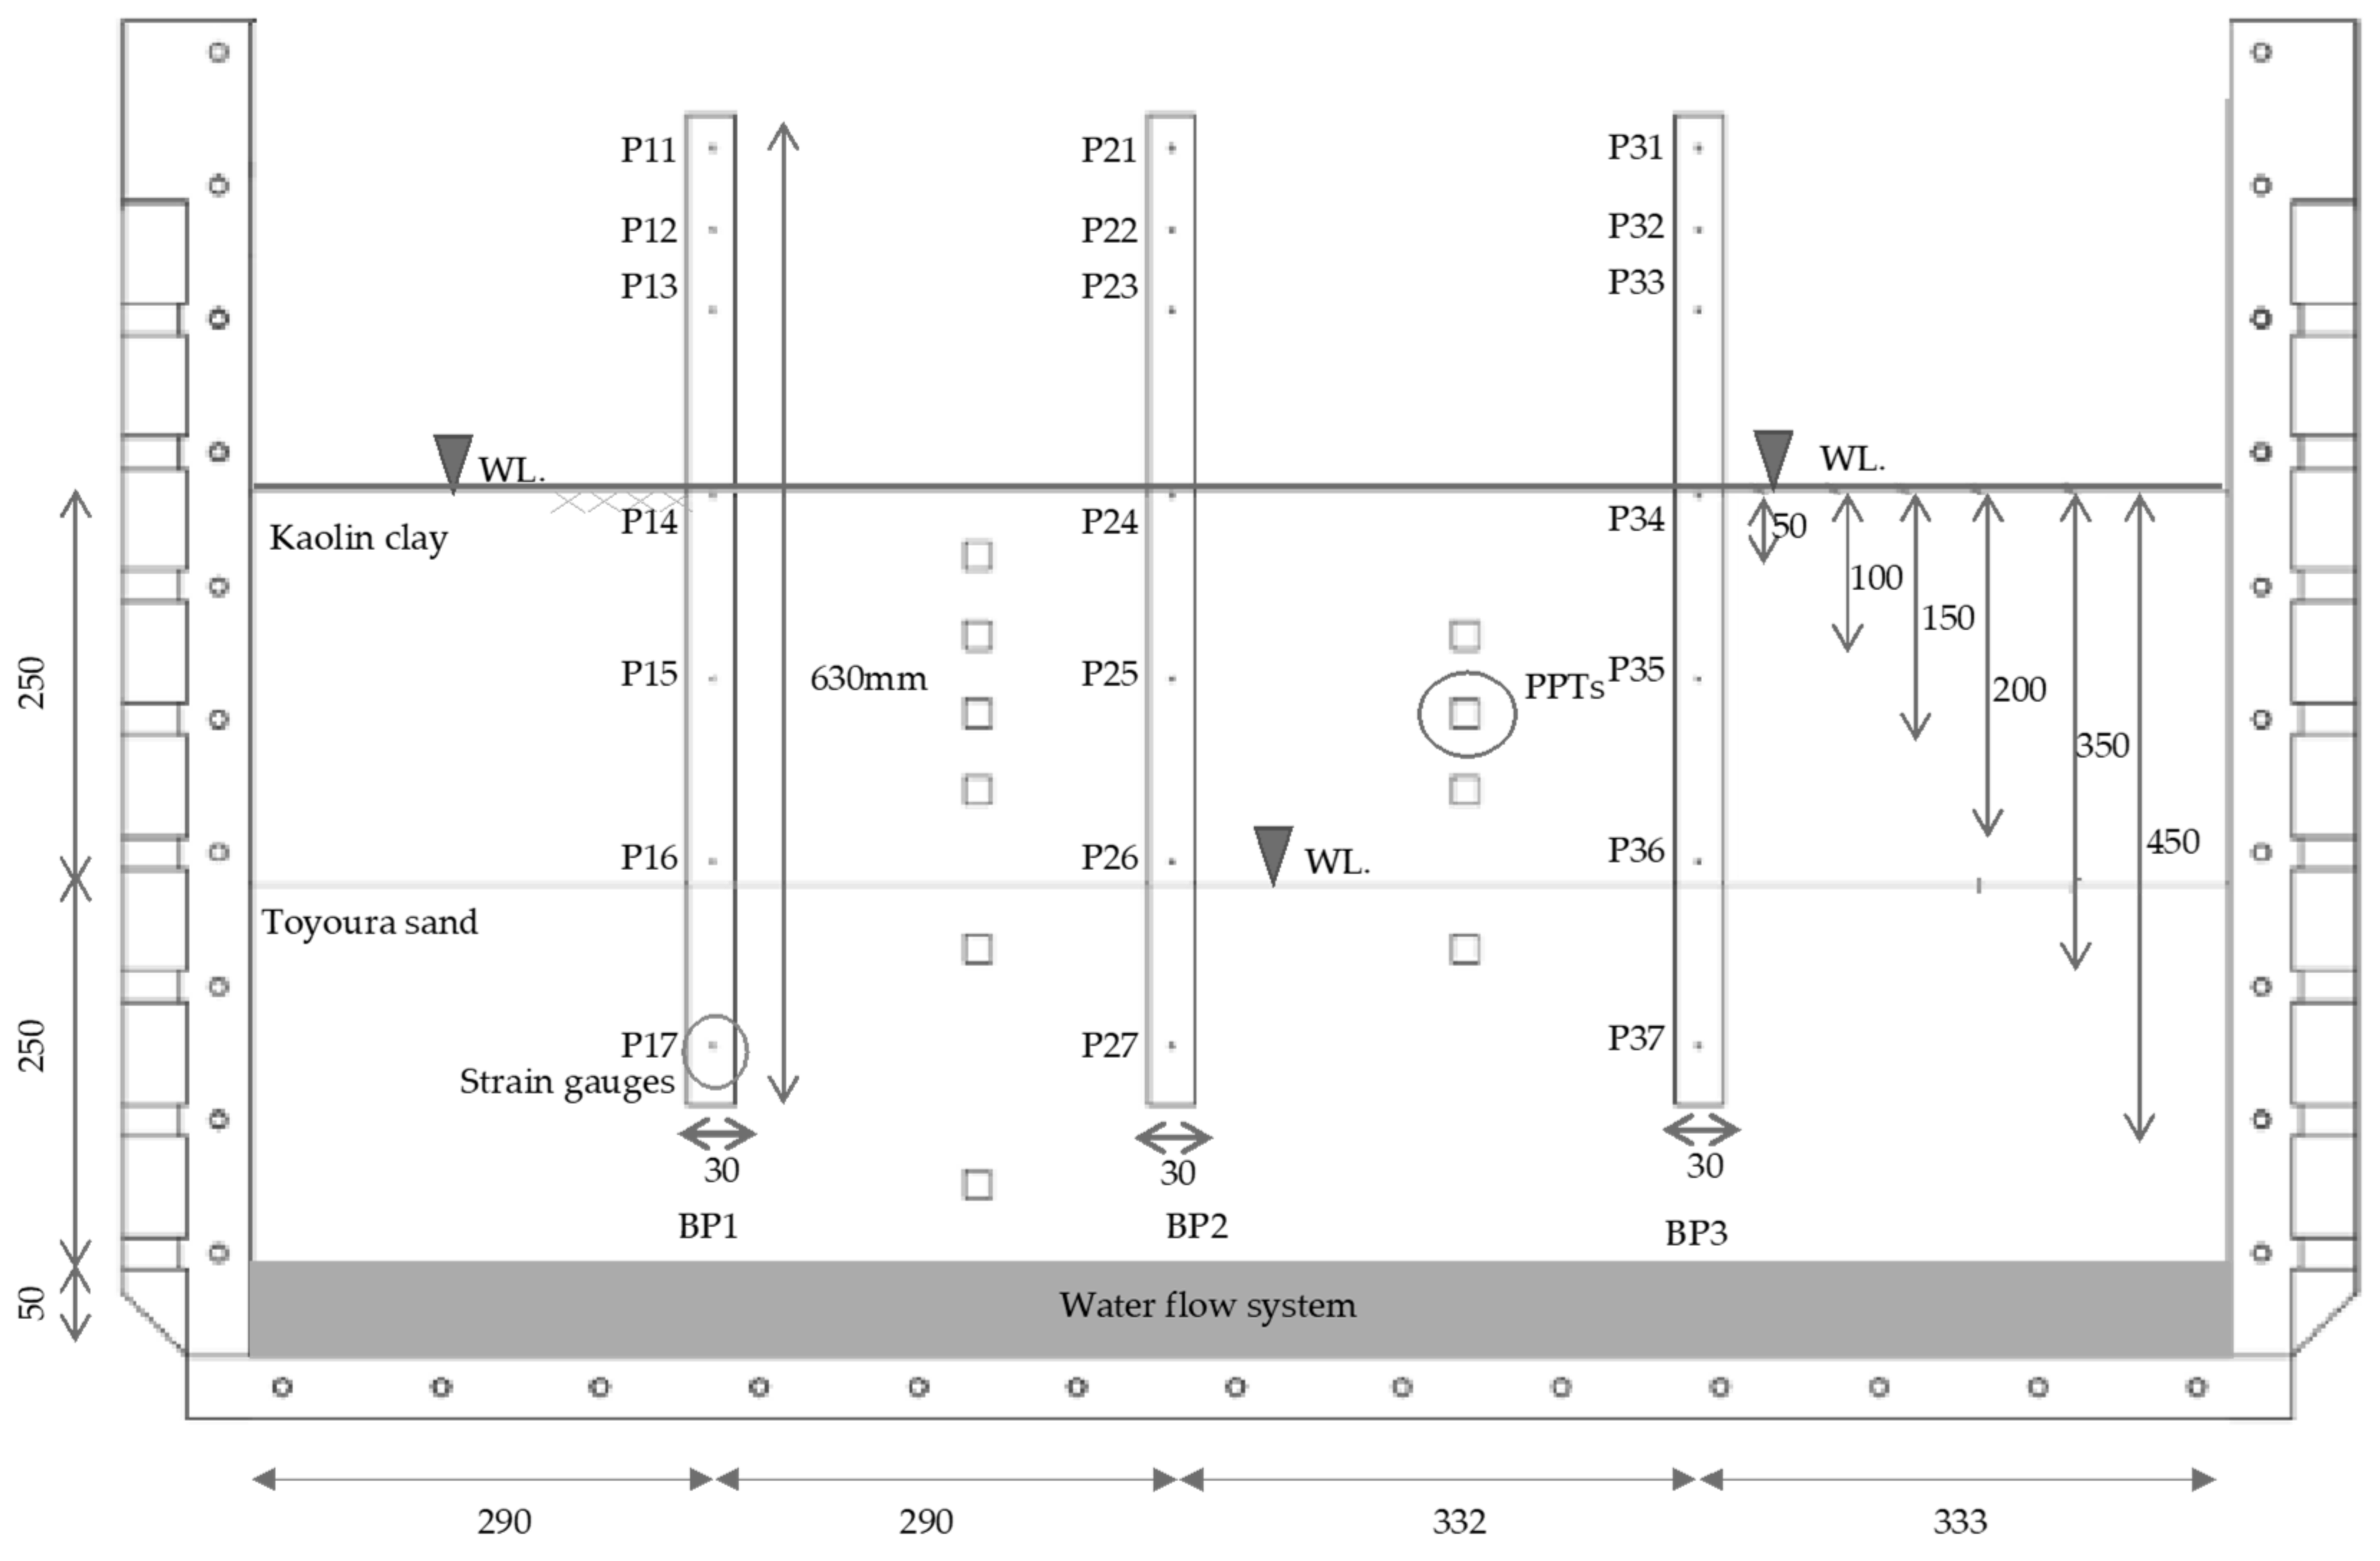
The centrifuge test was designed to simulate the groundwater levels fluctuating through the soil layers related to the hydrological history in Bangkok, Thailand. The soil behavior was explained as the ground deformation and the single pile capacity by using the pile load test [14,15,16]. The experimental model is presented in Figure 6. The presented soil layers were chosen based on the maximum load transfer from the pile load test of the bored pile and barrette pile in Bangkok, Thailand [11]. The study considered that stiff clay and medium-dense sand have a high effect on percent load transfer and it is in a zone of groundwater level change.
The dimension of the model box prepared for the model is 350 mm × 750 mm × 1245 mm. First of all, the water system was installed at the bottom of the model box. According to the model preparation, the Speswhite kaolin clay was prepared based on the soil properties of stiff clay, and the Toyoura sand was prepared for medium-dense sand. Both soil models were reduced scale by scaling law. The Toyoura sand was distributed on the water system by the sand hopper. The specific density was 1.53 t/m3 [17]. Then, the Speswhite kaolin clay was compacted above the Toyoura sand layer. The arrangement of the soil layer was determined as the soil profile of Bangkok, Thailand. The Speswhite kaolin clay was prepared at 27% water content and compacted by controlling the density at 1.65 t/m3 [18].
According to the study of the soil deformation and pile capacity during groundwater level changes, three single-bored piles and instrumentations were in the model box. The three single piles represented different conditions of groundwater levels in Bangkok. The first pile refers to the groundwater level equal to the ground surface before groundwater pumping was started. The second pile refers to the groundwater level equal to the minimum groundwater level due to groundwater over-pumping. The third pile refers to the situation of groundwater recovery to the ground surface due to controlling groundwater pumping. All single bored piles were designed using aluminum material in the model and attached the strain gauges inside the pile segment by Wheatstone bridge circuit at every depth of the pile. The strain gauges can interpolate the load on the pile. Moreover, the study installed the porewater pressure transducers (PPTs) in each depth of the soil model as shown in Figure 6. PPTs were installed to check the state of the water level in the model during testing. The linearly variable differential transformers (LVDTs) were installed in the model to measure the ground deformation and vertical pile settlement. The hydraulic jack was installed above the pile to control the load applied to the pile cap during the pile load test.
The testing procedure was determined related to the situation of groundwater drawdown and recovery in Bangkok. The testing procedure was separated into three testing stages depending on the water level. In the first testing stage, called BP1, the water level increased to the ground surface from the water flow system at the bottom of the model box. The water flows through the sand and clay layers, respectively. Then, the load was performed on the pile cap until the load was constant. The model box was spin-down to 1 g to move the hydraulic jack to the second pile for the second testing stage, called BP2. The model box was spun to 80 g again. The water level was decreased by 20 m from the ground surface as the half-height of the model box. The load was performed on the pile cap till the load was constant. The model box was spined down to 1 g again, and the hydraulic jack was moved to the third pile, called BP3. The model was spun up to 80 g, and the water level was increased until it reached the ground surface. The load was performed on the pile cap till the load was constant. Then, the model box spun down to 1 g. The test revealed that the porewater pressure reached hydrostatic equilibrium in the testing stage of BP1 and BP3 at 80 g according to the PPTs reading during testing.
4. Analytical Modelling by Finite Element Method
The finite element method (FEM) was adopted to solve and study geotechnical problems such as differential deformation, stability, and flow analysis. The finite element of PLAXIS3D can also analyze the soil behavior in both saturated soil and unsaturated soil. The coupled hydro-mechanical approach considers the ground deformation and groundwater flow depending on time. In general formulation, Biot’s theory explains a non-linear behavior for consolidation behavior. They were used to evaluate the deformation and groundwater flow with time-dependent boundary conditions of saturated and unsaturated soil [19]. The accuracy of the result was depending on the groundwater increment rate and consolidation time. However, Booker and Small proved that PLAXIS3D is stable for analyzing and evaluating soil and groundwater flow behavior [20]. This study chooses the numerical model to verify the result of the centrifuge model using the finite element method (FEM). This study adopted the PLAXID3D version 21 to study the behavior of ground deformation and pile capacity. The PLAXIS3D model was simulated following the centrifuge model such as the soil model, the dimension of the model, and the testing procedure related to the situation of groundwater level in Bangkok, Thailand.
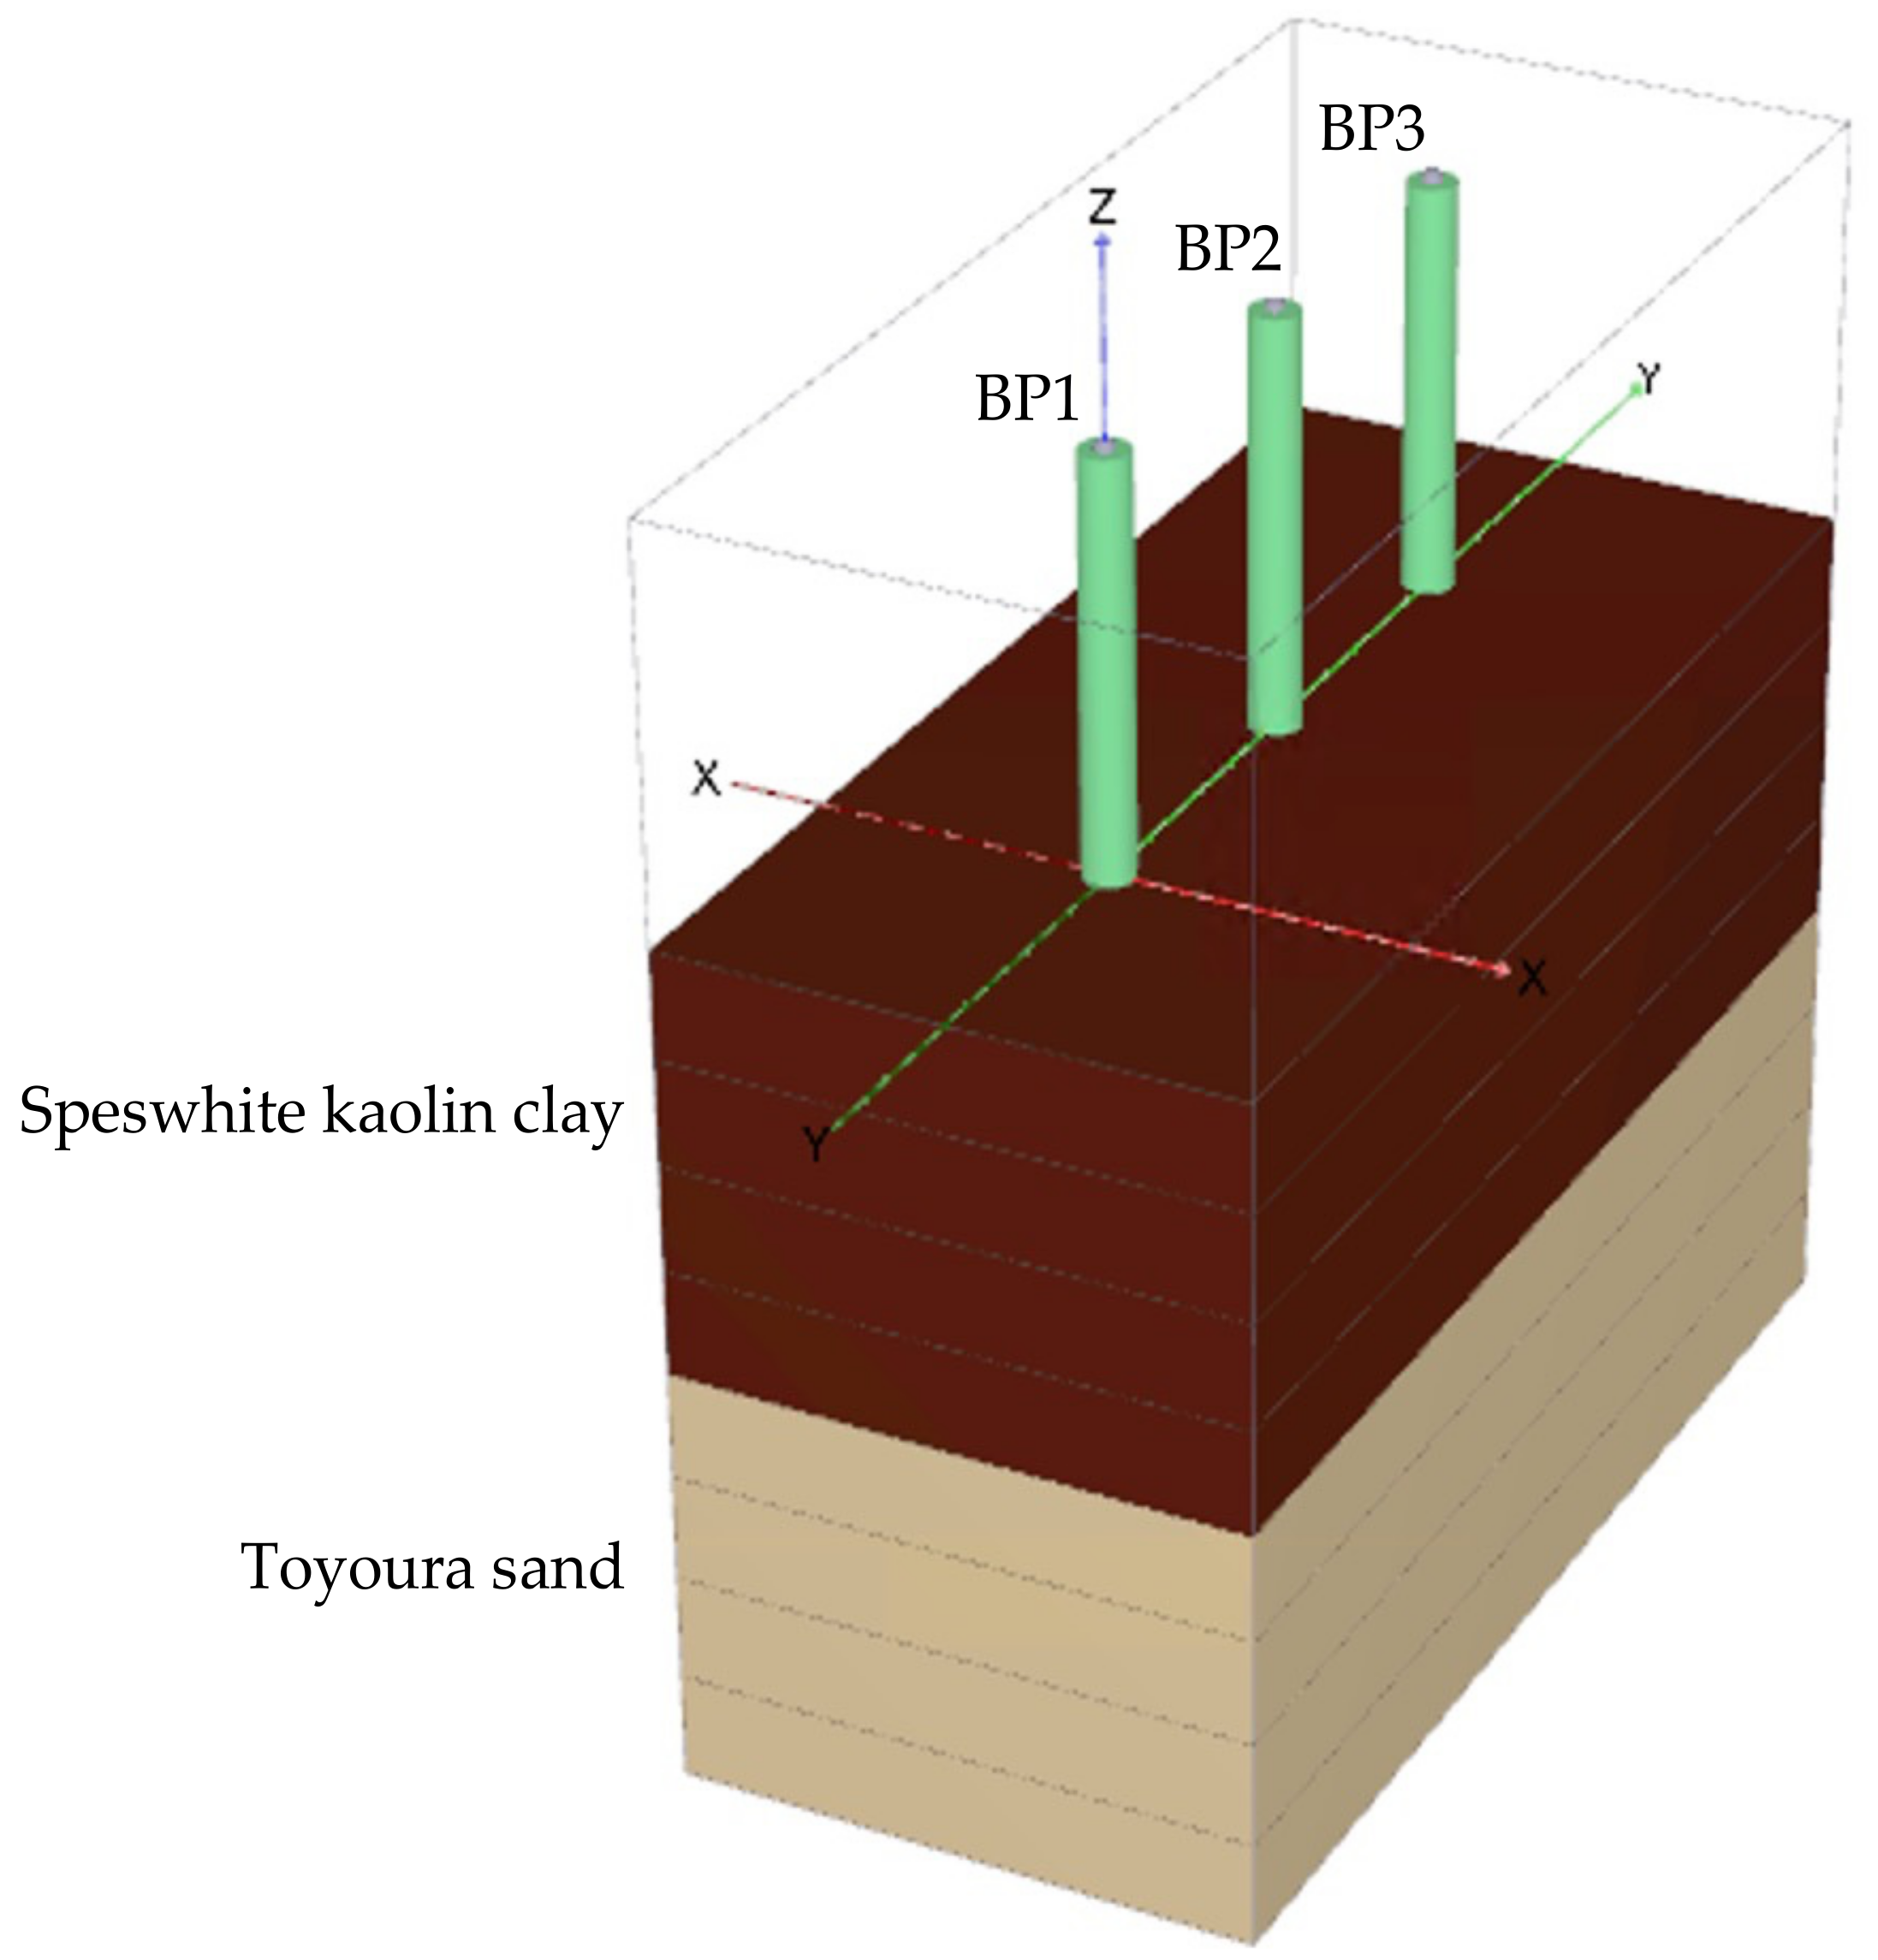
4.1. Geometric Model and Boundary Conditions
Finite element modeling has been designed according to the model of the centrifuge test to verify the results from the centrifuge test. This study focuses on the ground deformation and pile capacity during groundwater level change. In the PLAXIS3D model, the piles interact with the soil along the pile shaft and the end of the pile. The pile–soil interaction-independent mesh of PLAXIS3D was created by calculating the kernel automatically using geometric boundary. The model has been designed with the distance between each pile and edge of the model more than three times of pile diameter to prevent interference in each test. The soil types and structures in PLAXIS3D followed the soil model in the centrifuge test that consisted of the Toyoura sand below the Speswhite Kaolin Clay and three bored piles. The model box of the PLAXIS3D model is shown in Figure 7. The dimension of the model box was 350 mm wide, 750 mm long, and 1245 mm high. The thickness of Toyoura sand was 250 mm as same as the thickness of Speswhite Kaolin clay. The pile diameter and pile length were 30 mm and 630 mm, respectively. All the experimental model dimensions were scaled down following the scaling law. The scaled down factor following the scaling law was calculated according to the ratio of physical model and prototype model which was equal to 80. This study used the target g-level at 80 g. Therefore, the diameter and length of the prototype pile equal 2.4 m and 50.4 m, respectively. The PLAXIS3D model simulated the numerical model following the dimension and location of each pile as same as the full scale of the centrifuge model which is represented in Figure 7. The BP refers to the name of the type of pile, which refers to a bored pile. The numbers behind the BP are the consequence of the testing stage. The piles were fully attached with Spestwhite kaolin clay and Toyoura sand layer for interface friction between the pile and soil. The load was applied on the pile head when the groundwater level reached the target level of each stage under the plane strain condition in three dimensions.
4.2. Associated Parameters for Material
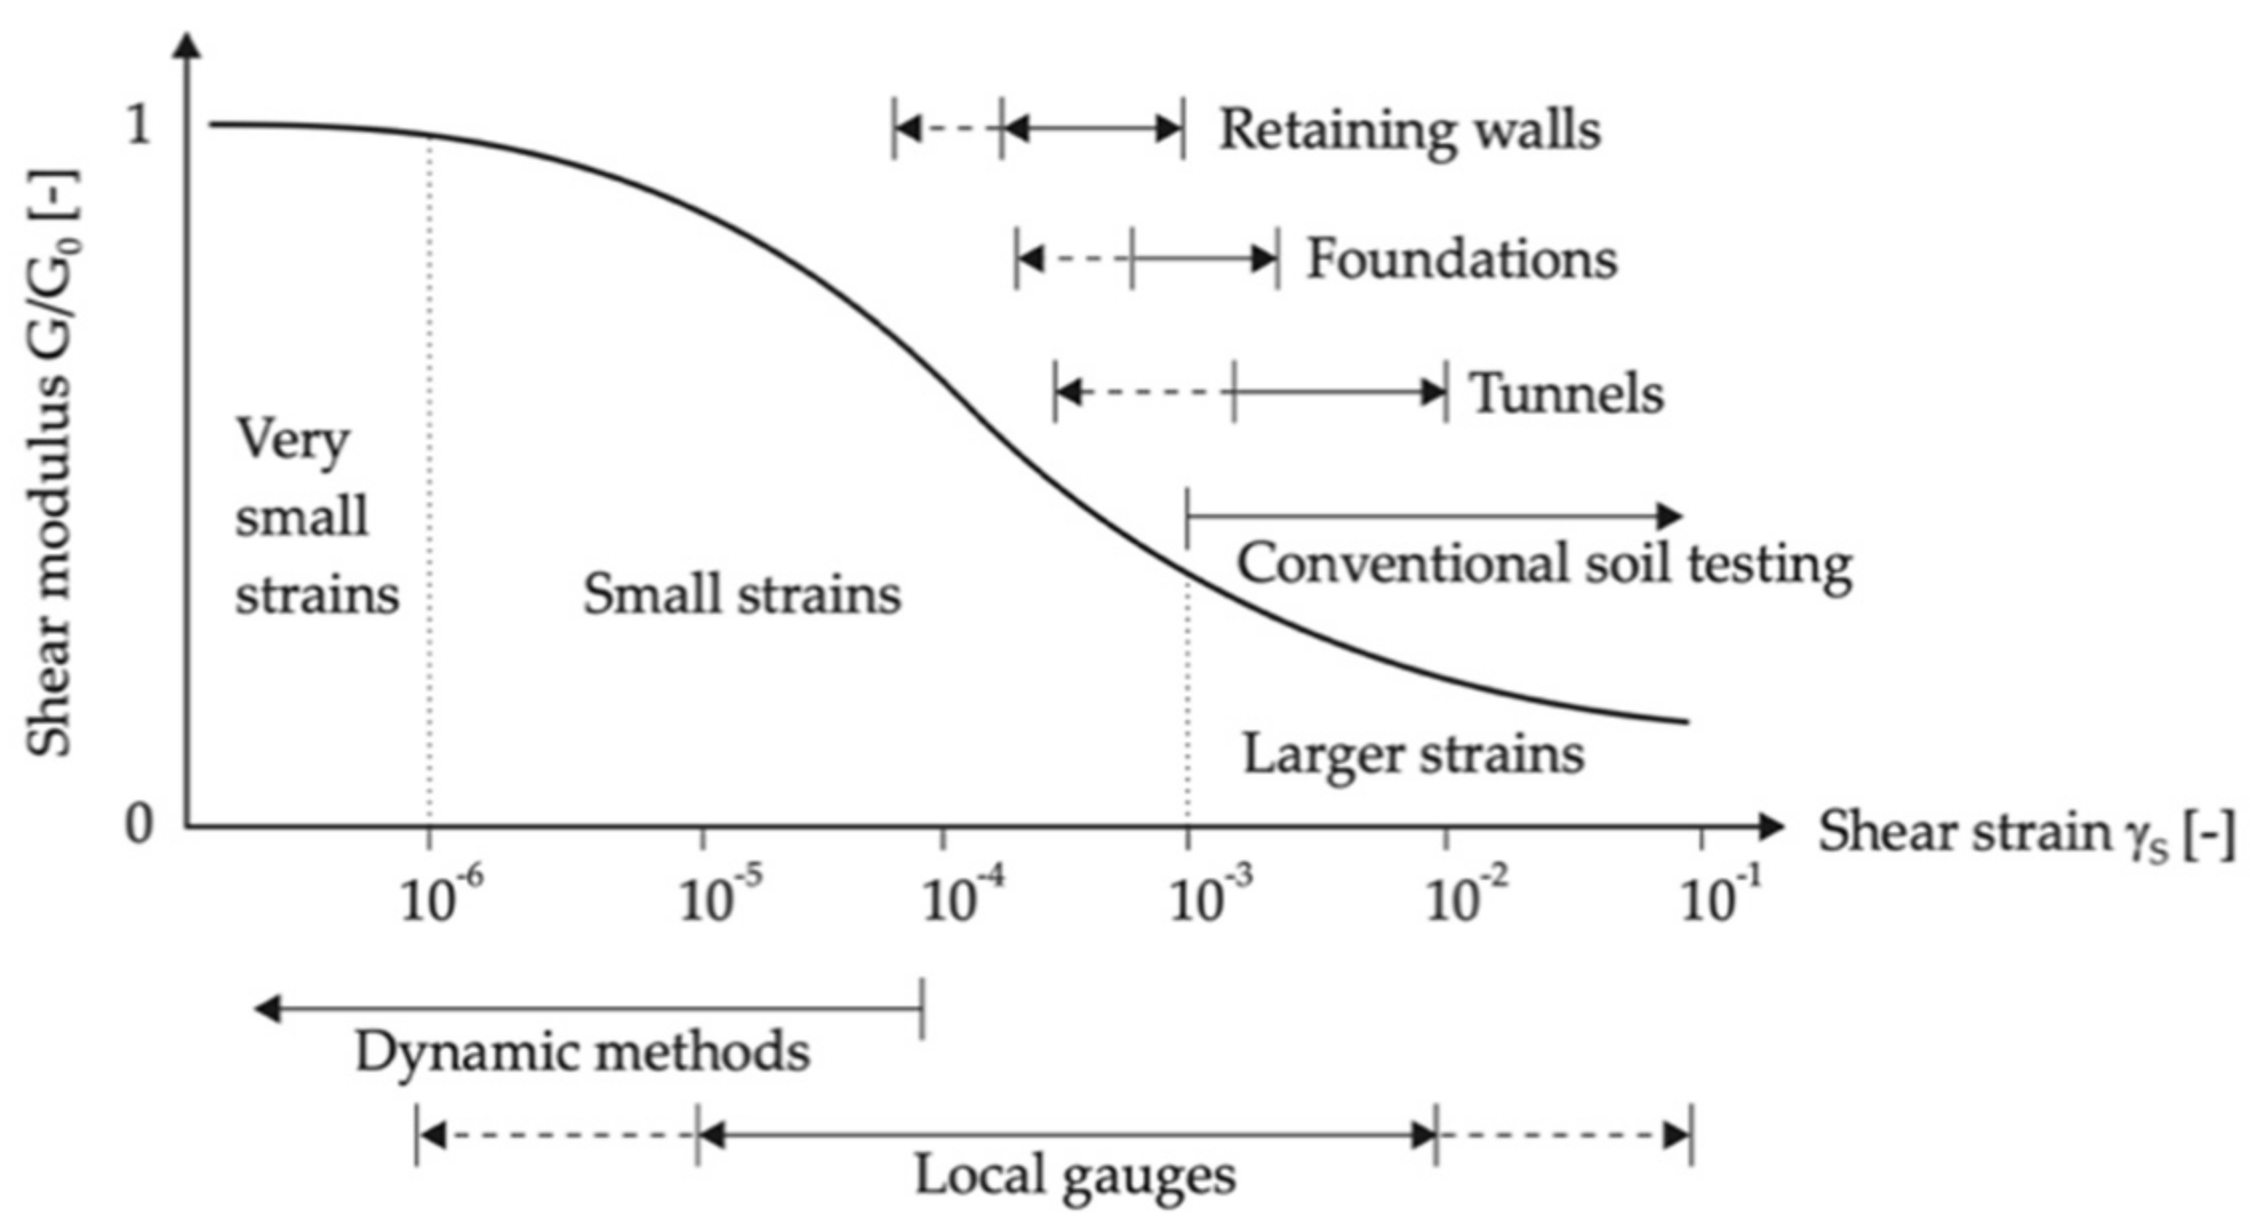
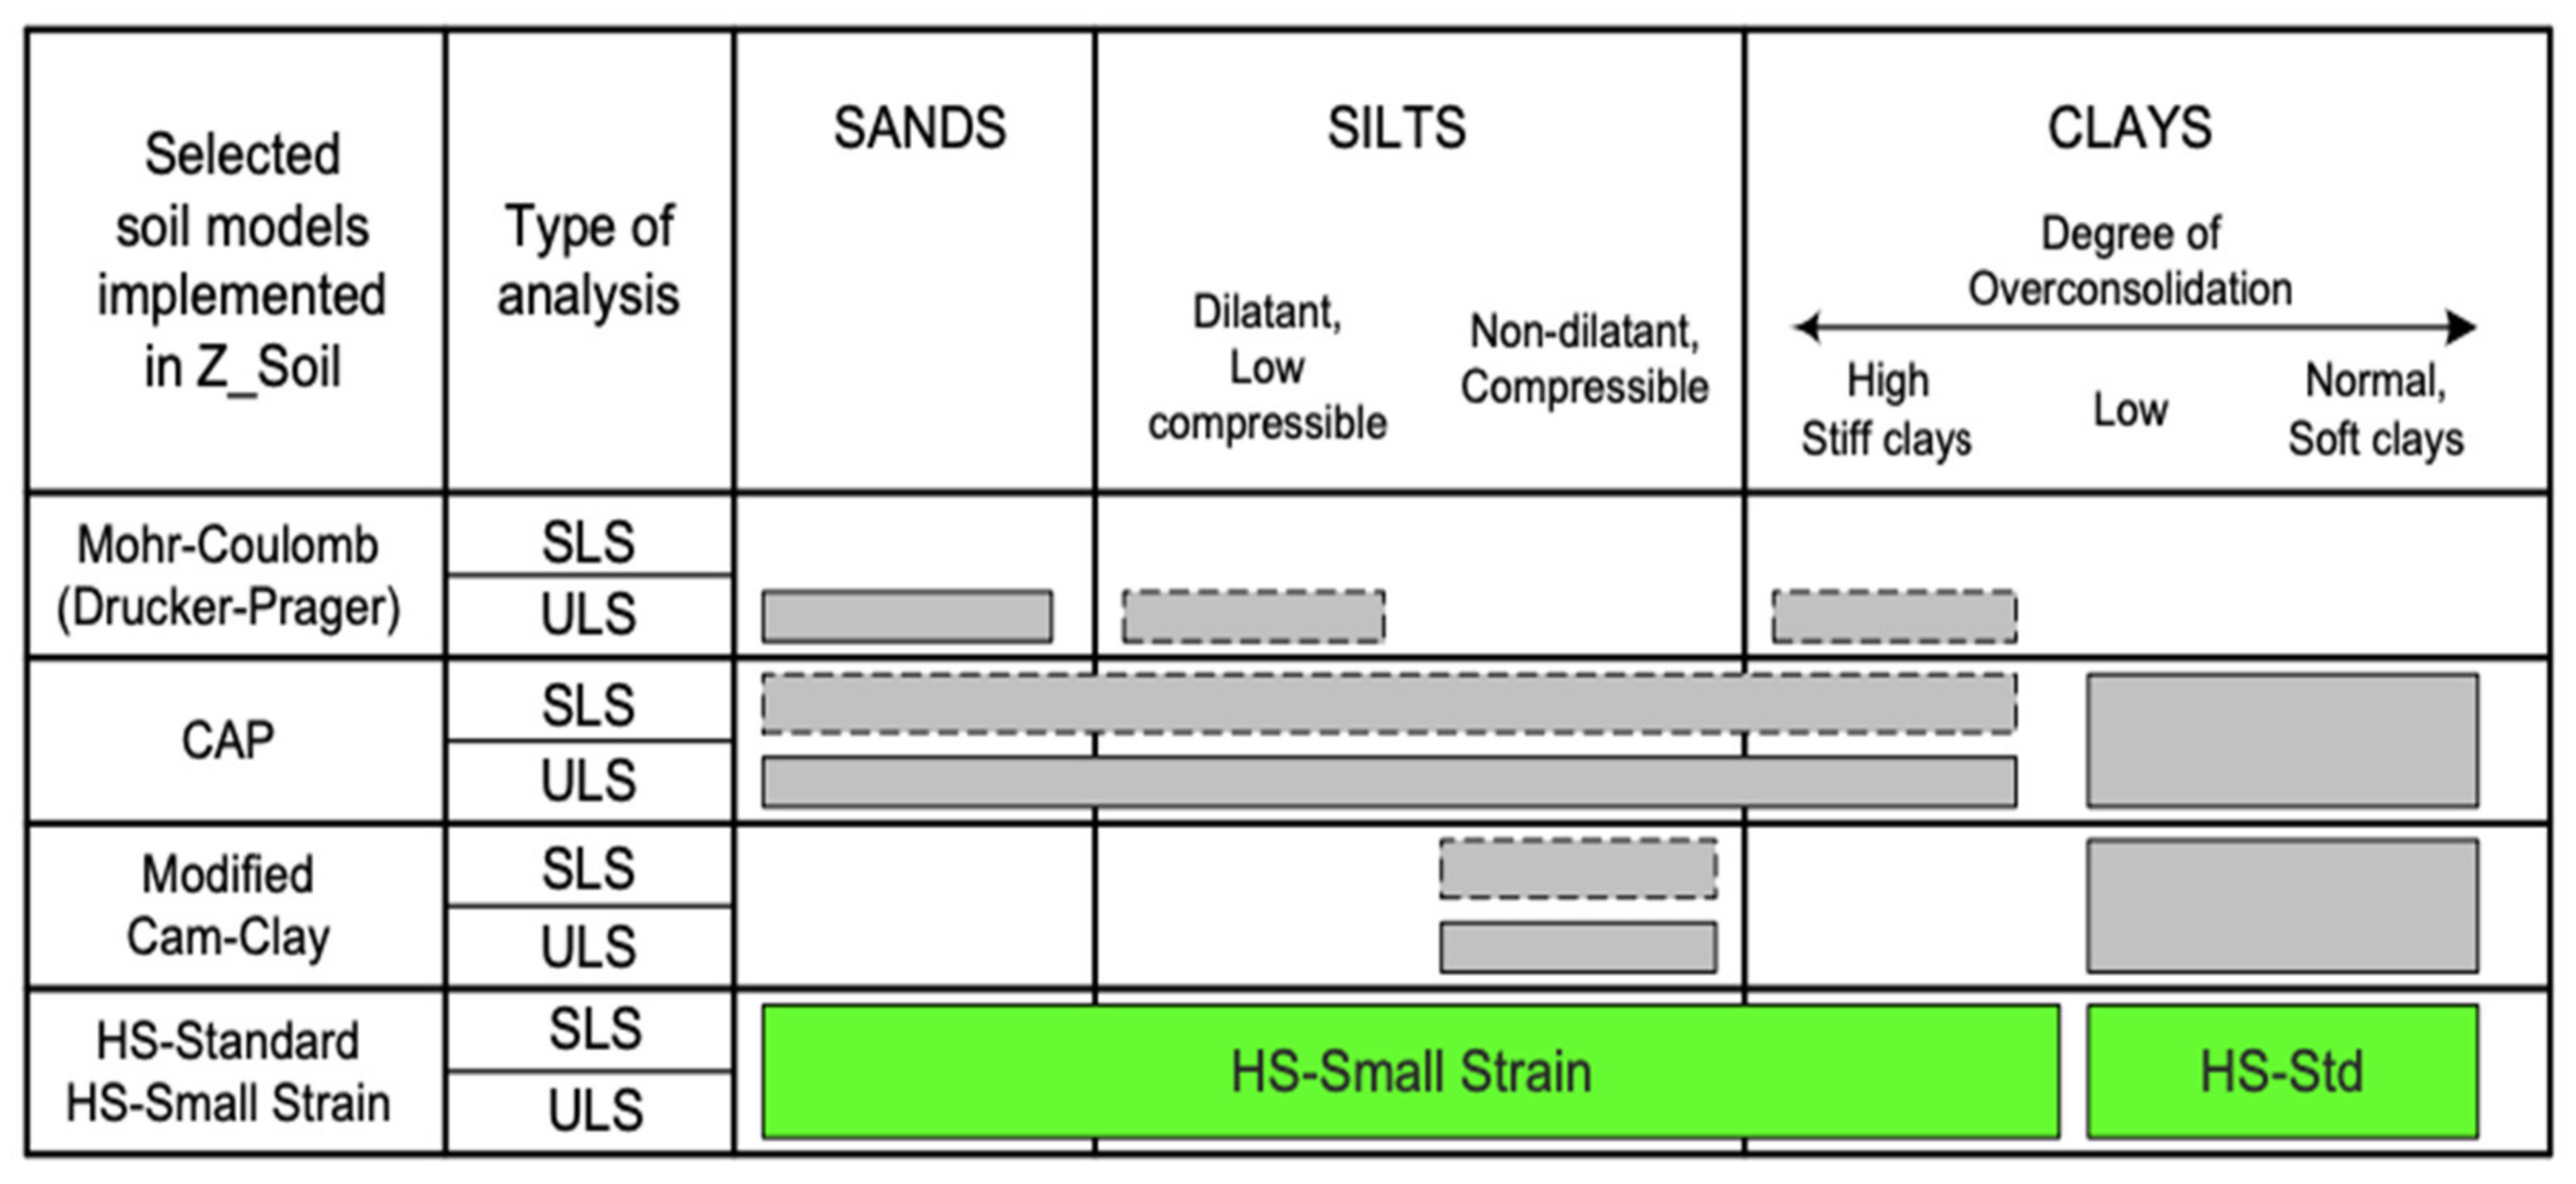
The finite element method (FEM) was conducted to evaluate and predict soil behavior based on the constitutive model. Lim et al. explained the three relevant soil constitutive models for finite element analysis, such as the Hardening soil model, the Hardening Soil-Small model, and the Mohr-Coulomb model [21]. PLAXIS3D model is a type of semi-complete software for geotechnical users. It can simulate the soil behavior and construction sequence under groundwater fluctuation and loading conditions. This study demonstrated the single pile to evaluate the ground deformation and pile capacity using the PLAXIS3D connect Edition Version 21, and verified the results from the centrifuge test. The three single piles were installed in stiff clay and medium-dense sand, respectively. Both soil layers need to determine the appropriate constitutive model. Following the increase in stiffness related to the shear strain, in Figure 8 it is represented that the retaining walls, foundations, and tunnels are in the range of small strains and large strains in local gauges [22]. The pile model is one type of foundation. As shown in Figure 9, it is also recommended to use the hardening soil small strain for stiff clay. Therefore, the hardening soil small strain (HS-small) was used for Speswhite Kaolin clay in this model. Figure 9 also recommended the Mohr-Coulomb model for medium-dense sand as Toyoura sand [23]. In addition, the Mohr-Coulomb model has a few general input parameters to reduce errors from complex input parameters. The sand layer also has less effect on the water level than the clay layer in terms of consolidation and permeability process.
Table 1 presents the associated parameters for the Speswhite kaolin clay and Toyoura sand for the soil model which was adapted and modified from the Bangkok subsoil. For Speswhite kaolin clay, the input soil properties of Speswhite kaolin clay represent the soil preparation in the centrifuge model. The unit weight value followed the density of compacted kaolin clay in centrifuge test. The unit weights of soil below or above the phreatic level were 1.65 t/m3 and 1.70 t/m3, respectively. Other parameters were adopted from the general properties of Speswhite kaolin clay in the model. The stiffness used in the model, such as the Secant stiffness in the standard drained triaxial test (E50ref) is 16,000 kN/m2, the tangent stiffness of the oedometer test (Eoedref) is 20,000 kN/m2, and the ratio of unloading and reloading stiffness (Eurref) was 70,000 kN/m2. The shear strain (γ0.7) was equal to 0.001 which was considered at Gs = 0.722Go. The shear modulus (Goref) was equal to 90,000 kN/m2 at a very small strain. The Poisson’s ratio can be replaced by the name of νur′, which was about 0.2 for the Spestwhite Kaolin clay. The reference pressure (Pref) equals 100. The coefficient of lateral earth pressure for normally consolidated clay (K0nc) was 0.485. The failure ratio was given as 0.9, according to the default value. The interface reduction factor was 0.75. The value of the initial void ratio was 0.8 [24]. The input parameters of groundwater property were adopted for the unsaturated soil parameters which were obtained by using the fitting parameters from Van Genuchten such as gn, ga, and gl, the residual saturation (Sres), and saturation (Ssat). The permeability parameters were assumed in three dimensions such as Kx, Ky, and Kz, which are equal to 8.64 × 10⁻⁴ m/day for Speswhite kaolin clay, as shown in Table 2 [25].
For the Toyoura sand, the sand model was determined to use the Mohr-Coulomb as the constitutive model according to Figure 8. The input soil parameters require to follow the soil preparation of Toyoura sand based on the soil properties of the medium-dense sand in the centrifuge test. Input soil parameters were modified and are shown in Table 1. The unit weights of unsaturated and saturated soil were the same value, which equals 15.3 kN/m3. Due to the limitation of soil parameters, the other values for Mohr-Coulomb were modified based on the medium-dense sand of the Bangkok area [26]. The stiffness of soil was assumed to be equal to 85,000 kPa from the Triaxial test and 115,500 kPa from the Oedometer test. Cohesion was 0.1 kPa. The friction angle was 36 degrees. The Dilatancy angle is 5 degrees. The shear modulus was 33,000 kPa at a very small strain. The Poisson’s ratio is 0.3. The interface reduction factor was 0.75. The over consolidation ratio or OCR was 0.73 [24]. The permeability values used in three dimensions such as Kx, Ky, and Kz, were equal to 1.25 × 10⁻² m/day from grain size distribution data in the software.
For the pile model, these single piles were modeled in the linear elastic material and are non-porous. The modulus of the pile was 2.7 × 10⁷ kN/m2 and Poisson’s ratio was determined to be 0.15.
5. Result and Discussions
5.1. Porewater Pressure
Groundwater level changes indicated the characteristic of porewater pressure in the soil. Groundwater levels in the model were increased and decreased by 5 m/time until the target level which related to the testing procedures of the centrifuge test. The names of the testing stage were followed by the testing stage of the centrifuge test. In the first testing stage of PLAXIS3D, the water level was increased from the bottom of the model to the ground surface. The porewater pressure of the first stage is shown at the stage of WL_0 as in Figure 10a. Groundwater level seeped through the sand and clay layer until the ground surface which took around 53,390 days (146 years). The increasing period took a long time because the water seeped through the soil during unsaturated soil conditions. The voids between the soil were the air and the water. Therefore, the void needs to be replaced with water in every void both sand and clay, respectively until the porewater pressure becomes the hydrostatic stage. After the pile load test of the first, the water level was reduced from the ground surface to the soil interface between sand and clay which was 20 m from the ground surface. The reducing groundwater level period took 6010 days (around 16.5 years) as shown at the stage of WL_20 in Figure 10b. The second testing stage took less than the first testing stage because the water still remained in the void between the soil particles of the clay layer. After finishing the second pile load test, the water level increased from the interface of soil to the ground surface, which was about 20 m height. This stage refers to the third testing stage, called BP3. The groundwater level increased to the ground surface by 34,020 days (93.2 years). The porewater pressure of the groundwater almost reached hydrostatic pressure at the stage of WL_0, as shown in Figure 10c. The porewater pressure changing of each stage was compared in Figure 10.
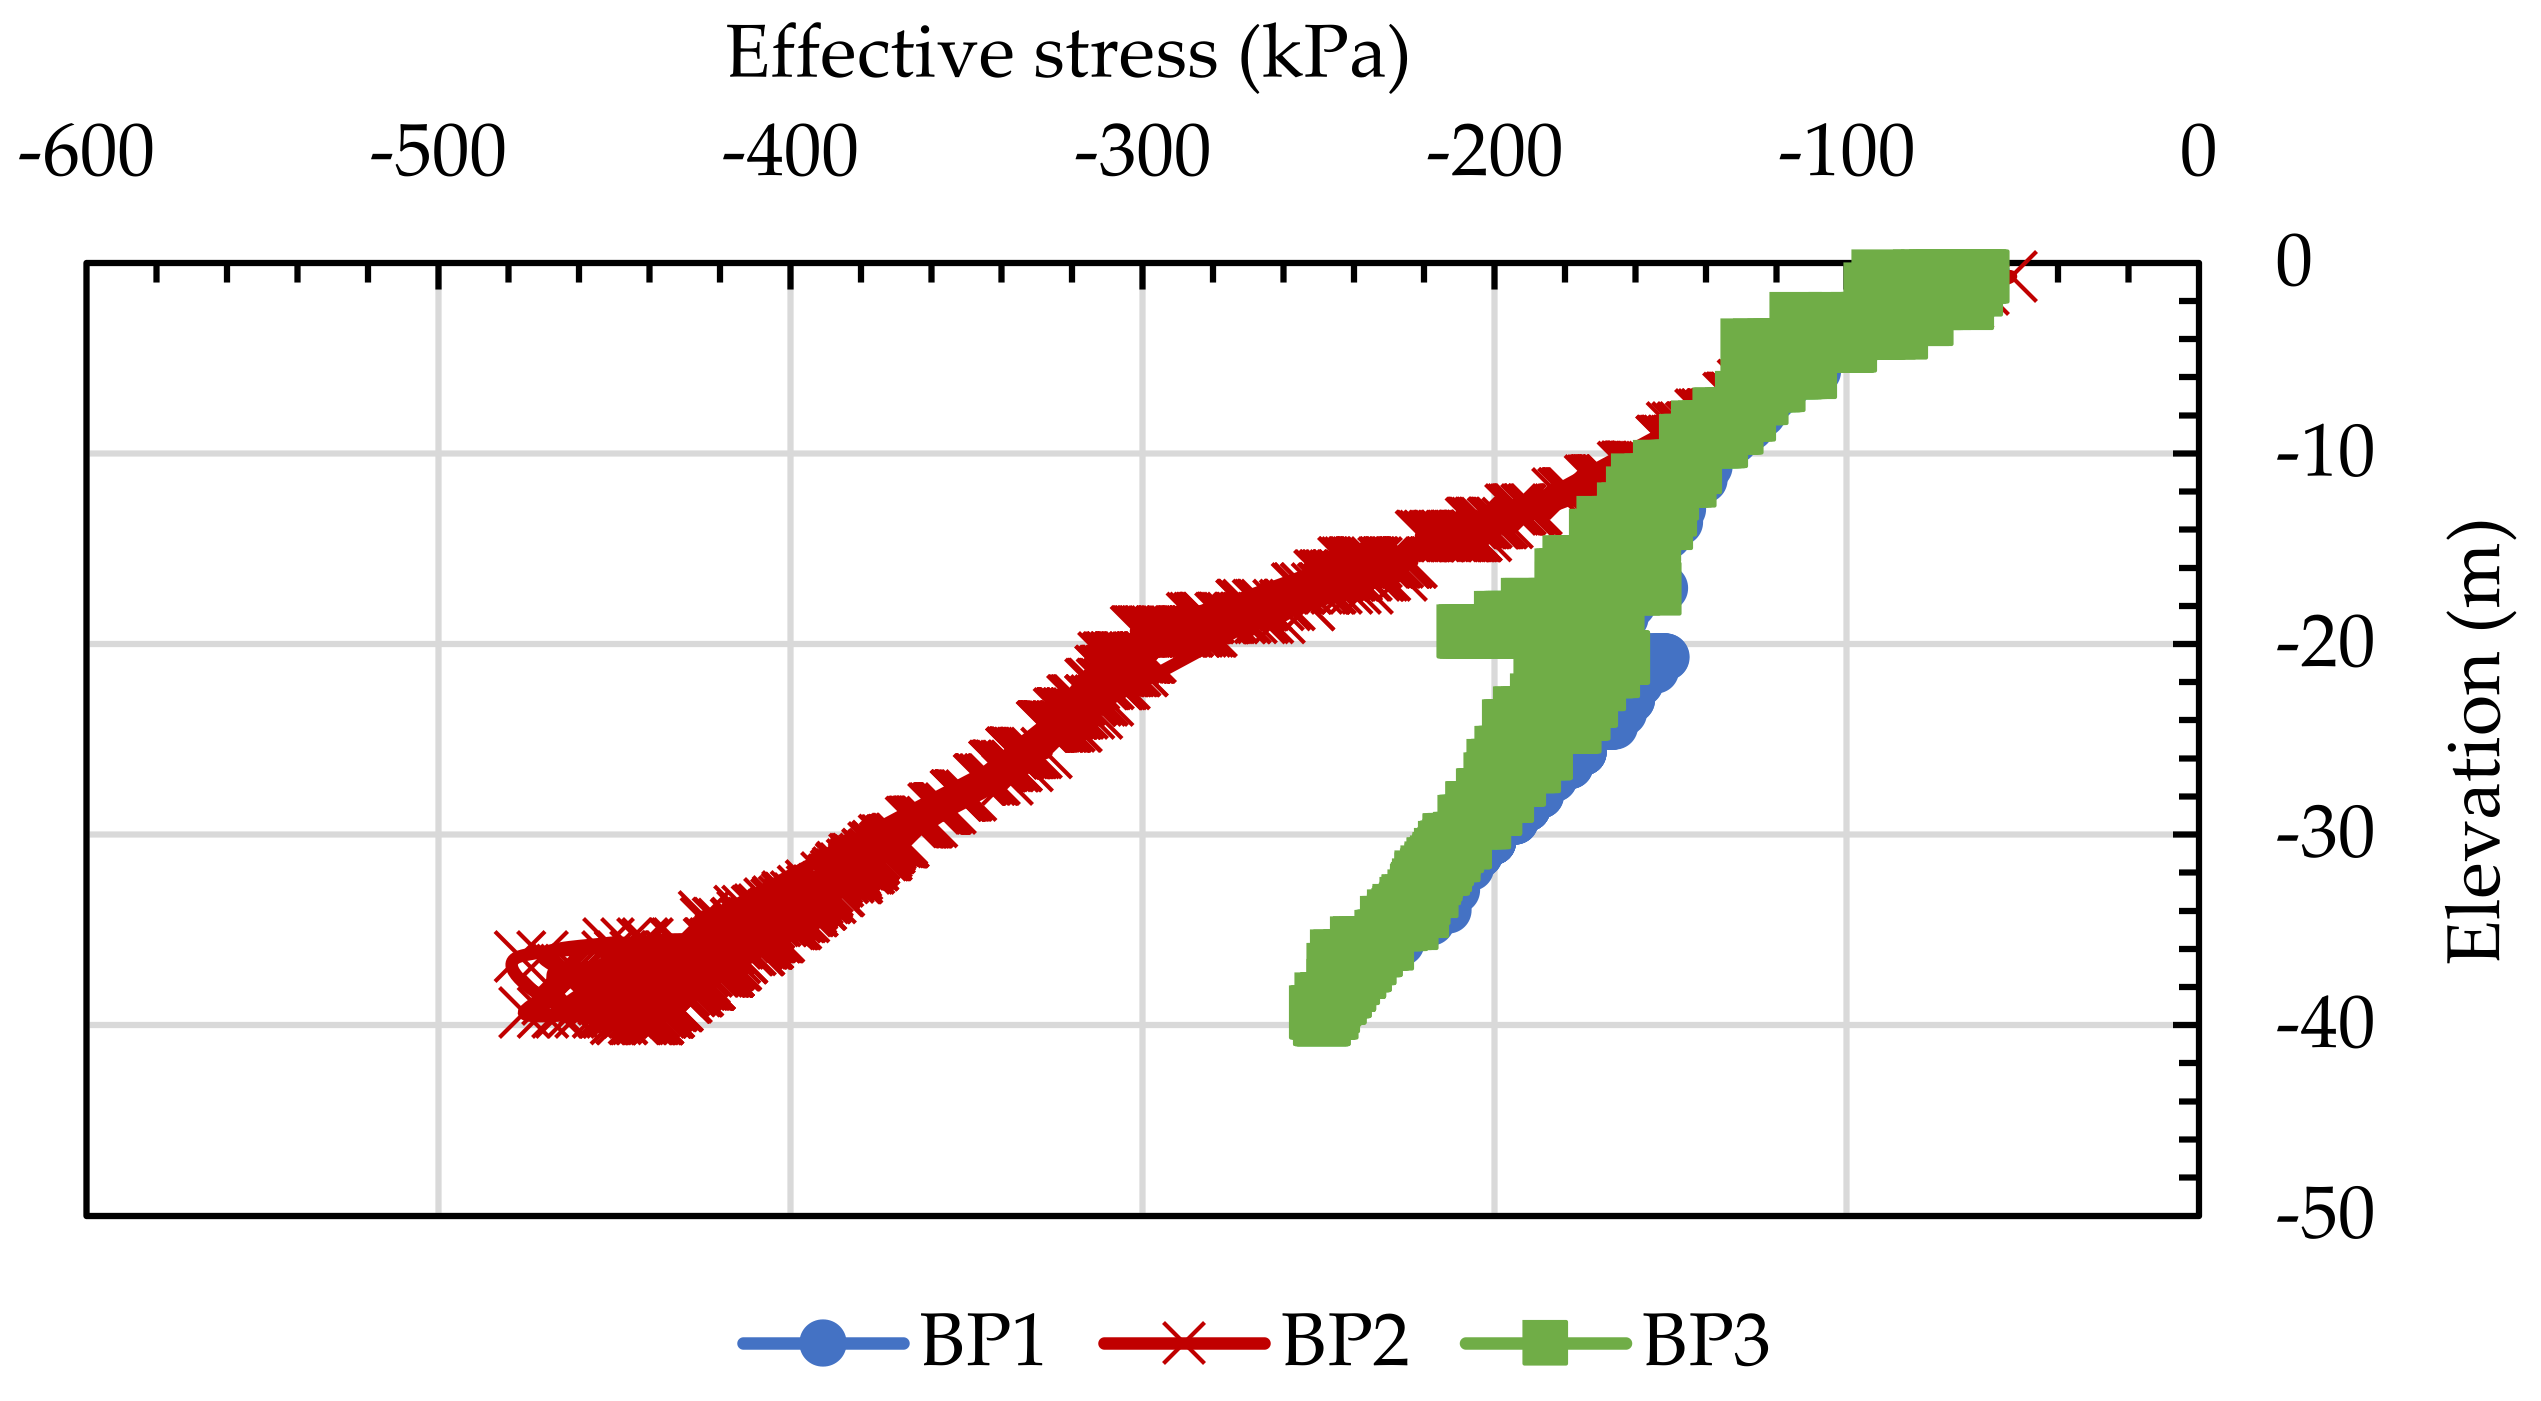
5.2. Effective Stress
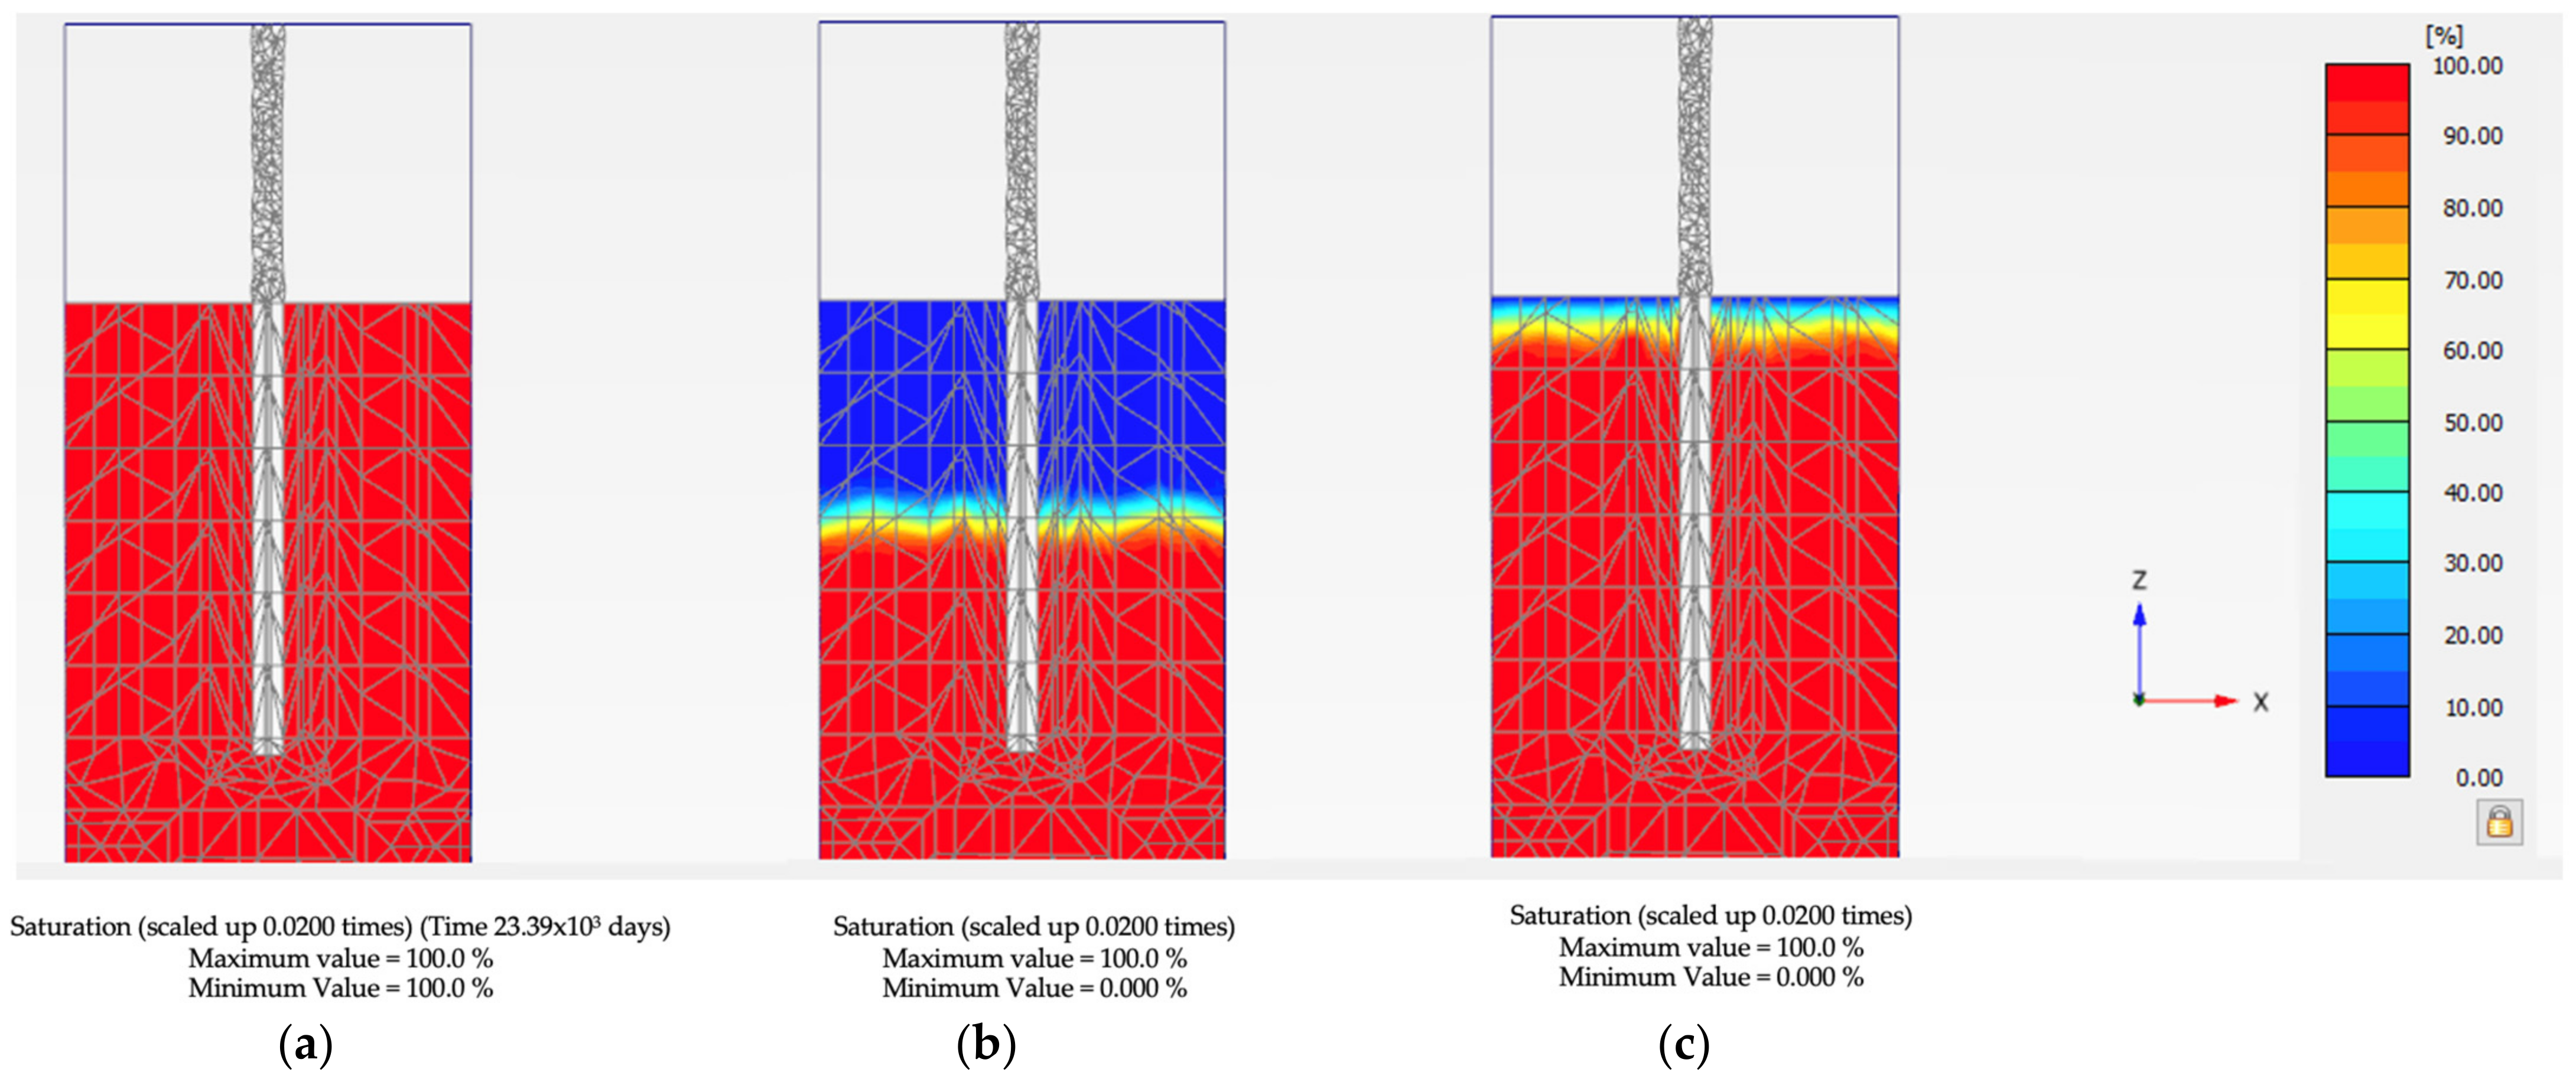
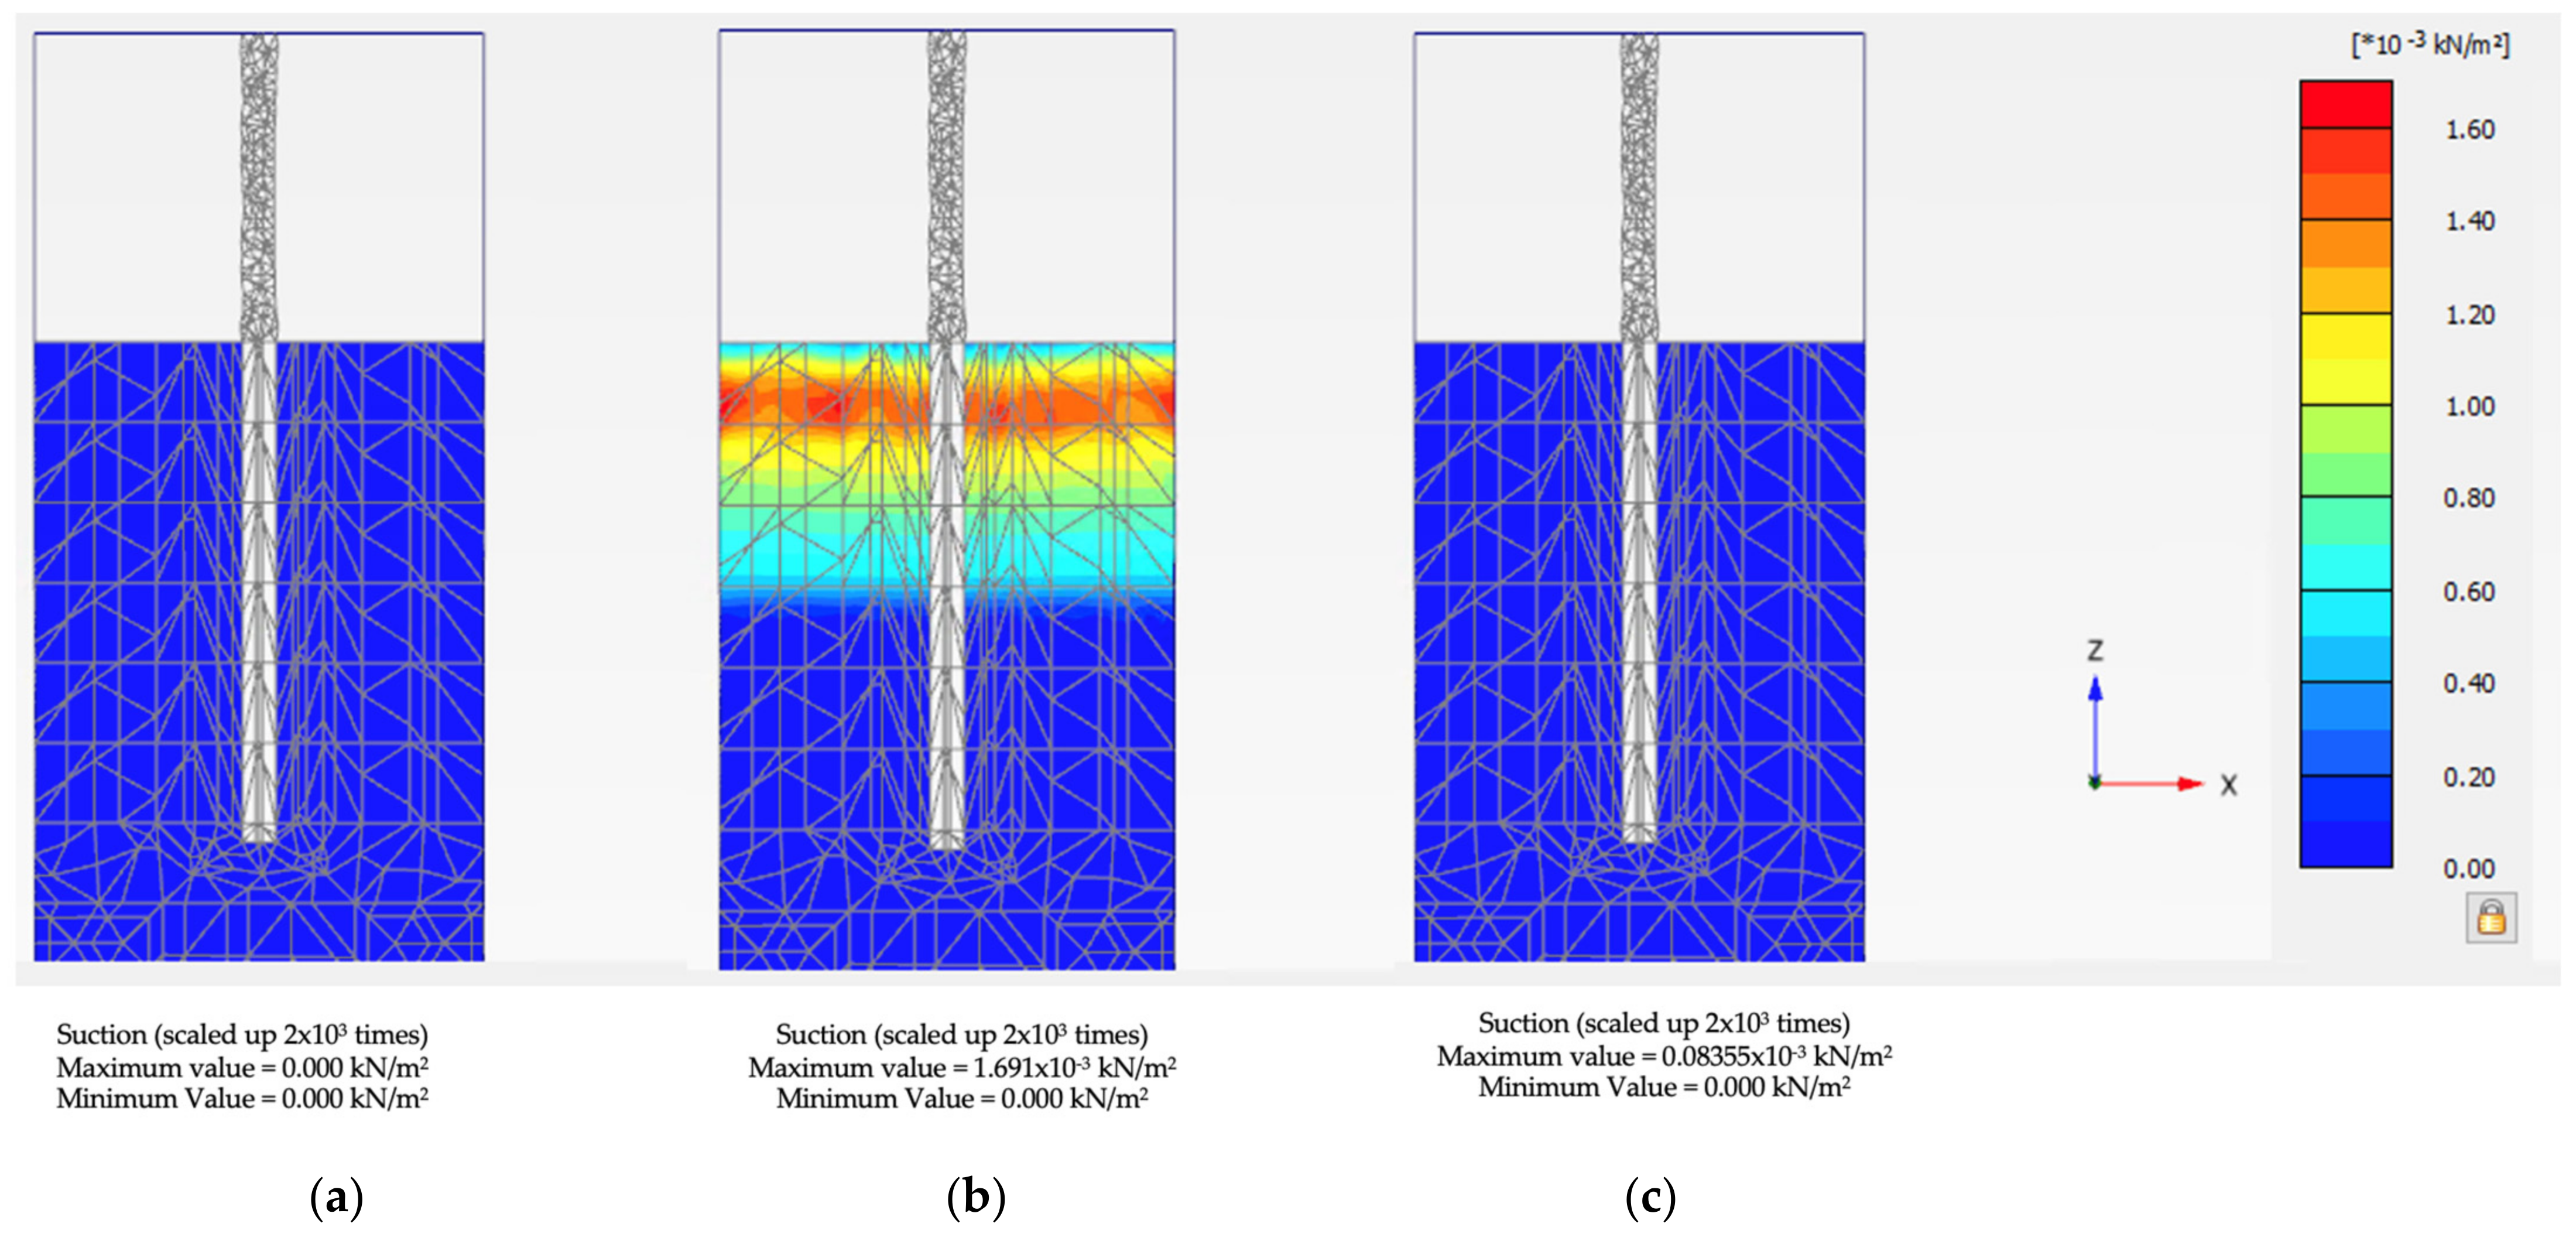
The effective stress is the soil strength parameter related to porewater pressure or groundwater level in this study. The general equation of effective stress is total stress minus porewater pressure. The first testing stage and the third testing stage that the groundwater level equals to the ground surface or porewater pressure became the hydrostatic state. The porewater pressure also decreased in the second testing stage. The effective stress increased in the second testing stage, and the porewater pressure still remains in the clay layer. The effective stress changings in each testing stage were compared in Figure 11. The effective stress results also presented a state of the unsaturation zone in Figure 12b and the suction zone in Figure 13b in each testing stage. A decrease in groundwater level led to the unsaturated zone and suction zone at around 18 m depth of the upper soil model. Moreover, the effective stress is related to the OCR because the OCR is the ratio of the maximum past pressure and the present pressure. The OCR value in BP2 was more than BP1 in every depth. But the OCR values in BP2 and BP3 have almost the same boundary value, which is between 1.5 and 3.4.
5.3. Pile Capacity
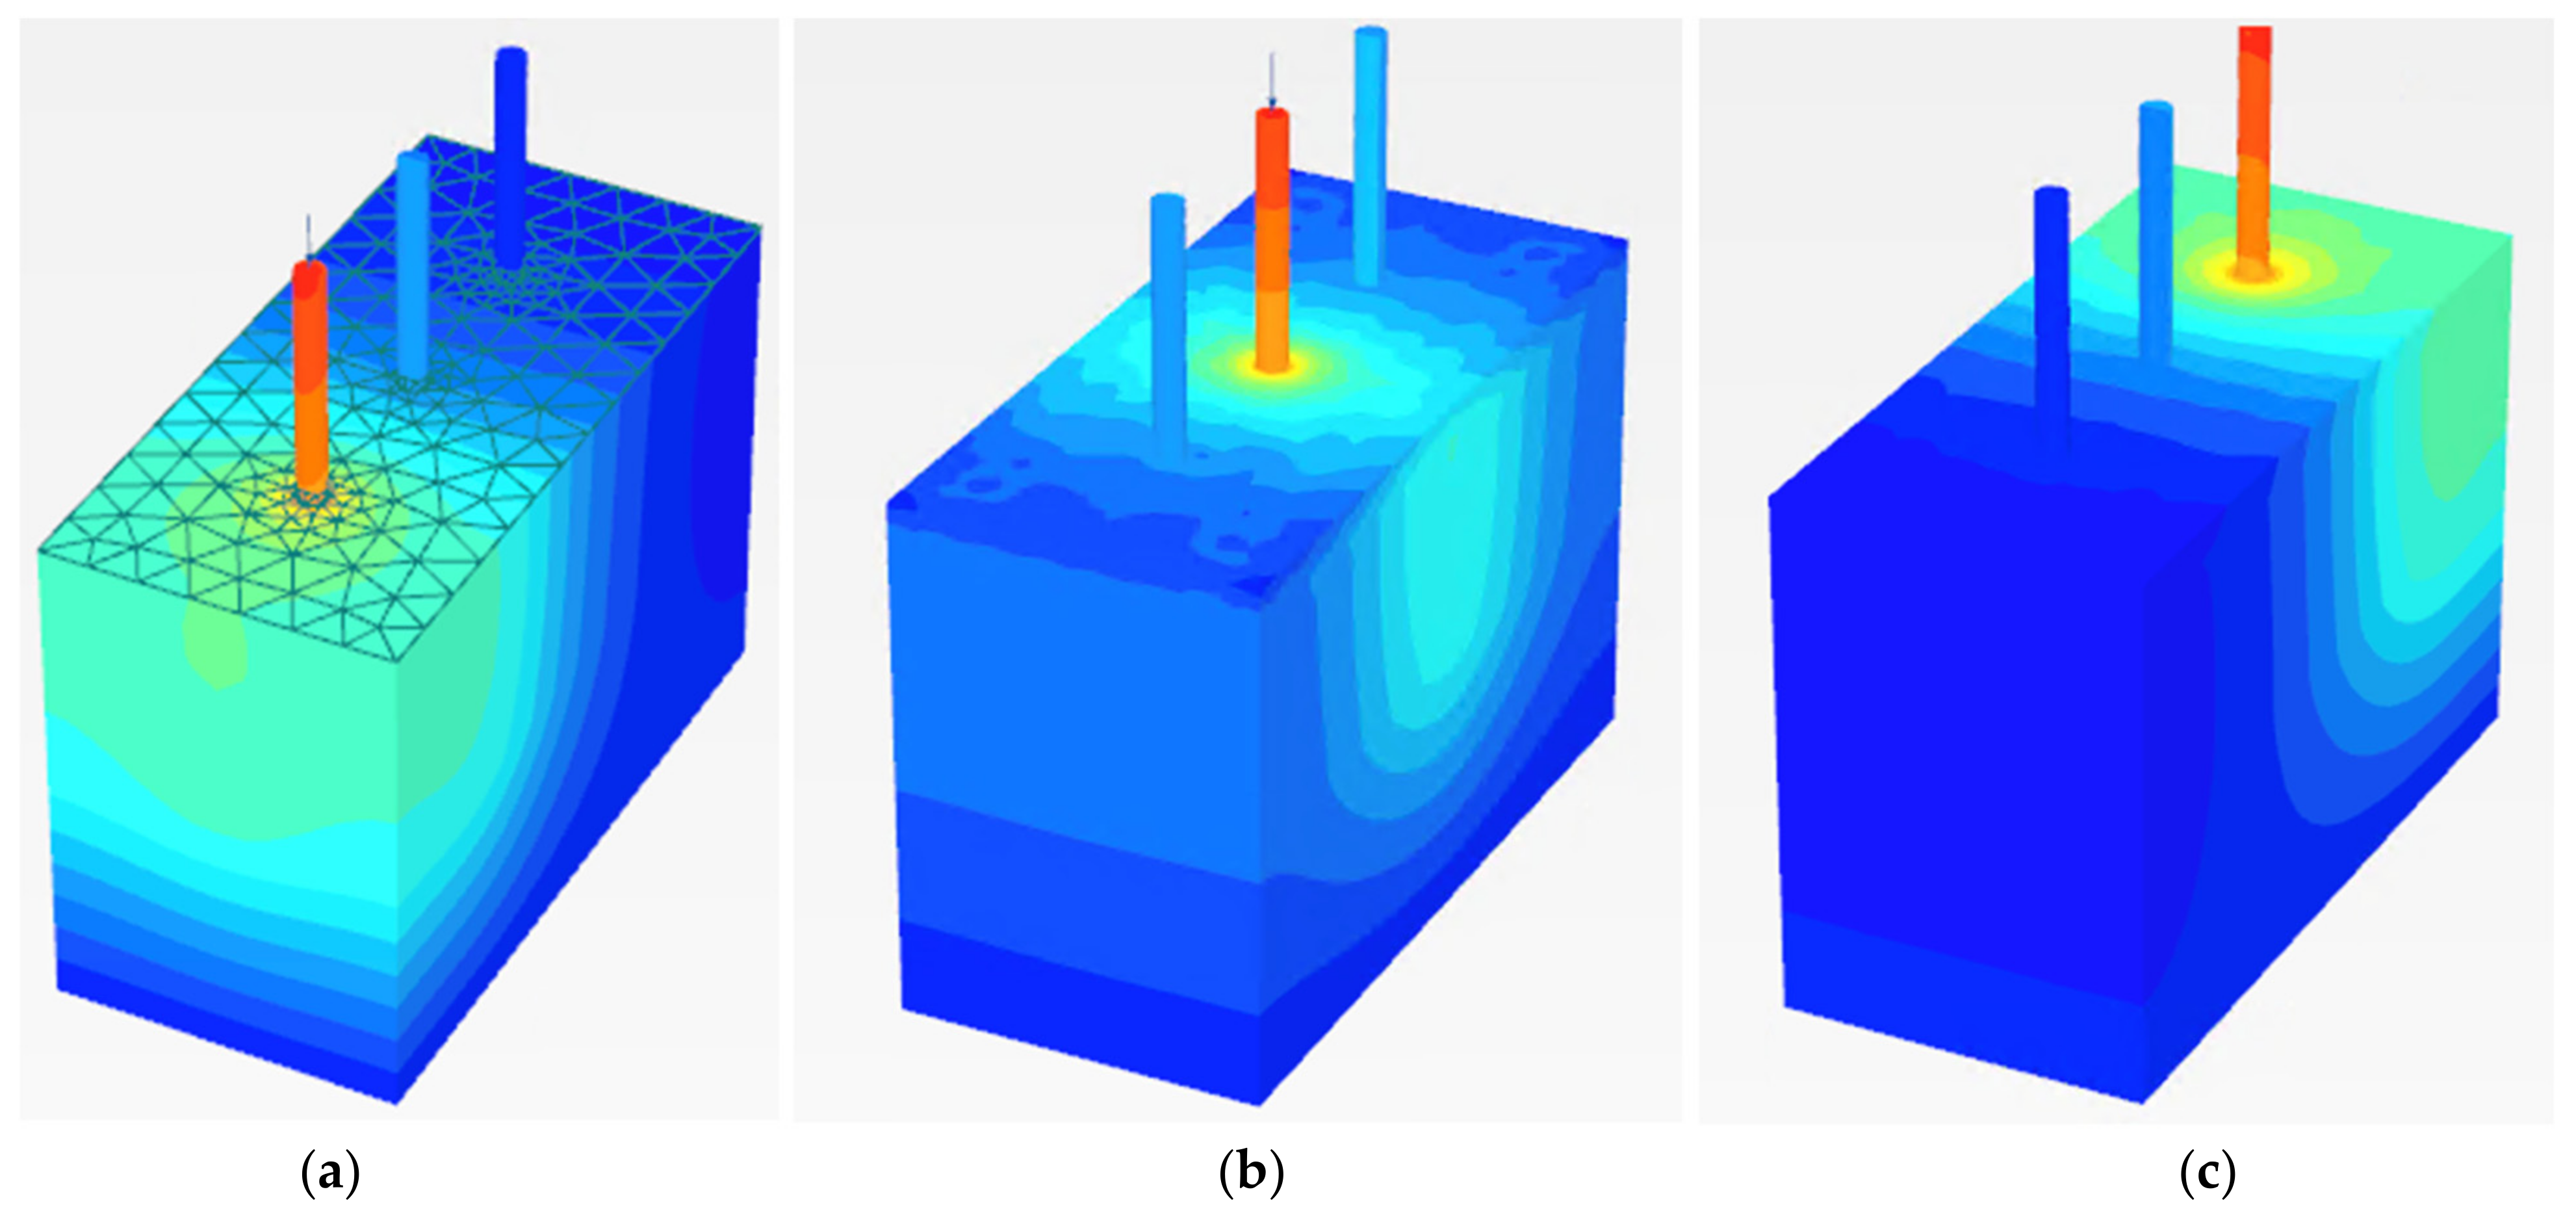
The pile capacity behavior in each stage of groundwater level was explained by following the pile load test results. The three single-bored piles were simulated to construct before the groundwater level decreased due to groundwater over-pumping. The result of the pile load test reveals that the values of pile capacity relate to the situation of groundwater level changing over time in the Bangkok area. The status of three single piles during the pile load test was compared in Figure 14. Figure 14 also showed the affected zone of the pile load test and indicated that the boundary condition of each test did not affect the nearby pile. According to the decrease in groundwater level in the second testing stage (BP2), the load value from PLAXIS3D was increased due to the effective stress increase. Every pile load test performed the load on the top of the single pile. The first and third testing stage had almost the same pile settlement value because they were demonstrated at the same groundwater level. The pile capacity behavior was almost the same in terms of load and pile settlement. The pile capacity behavior of the second pile load test had a higher value than the first and second testing stages as mentioned about the effective stress.
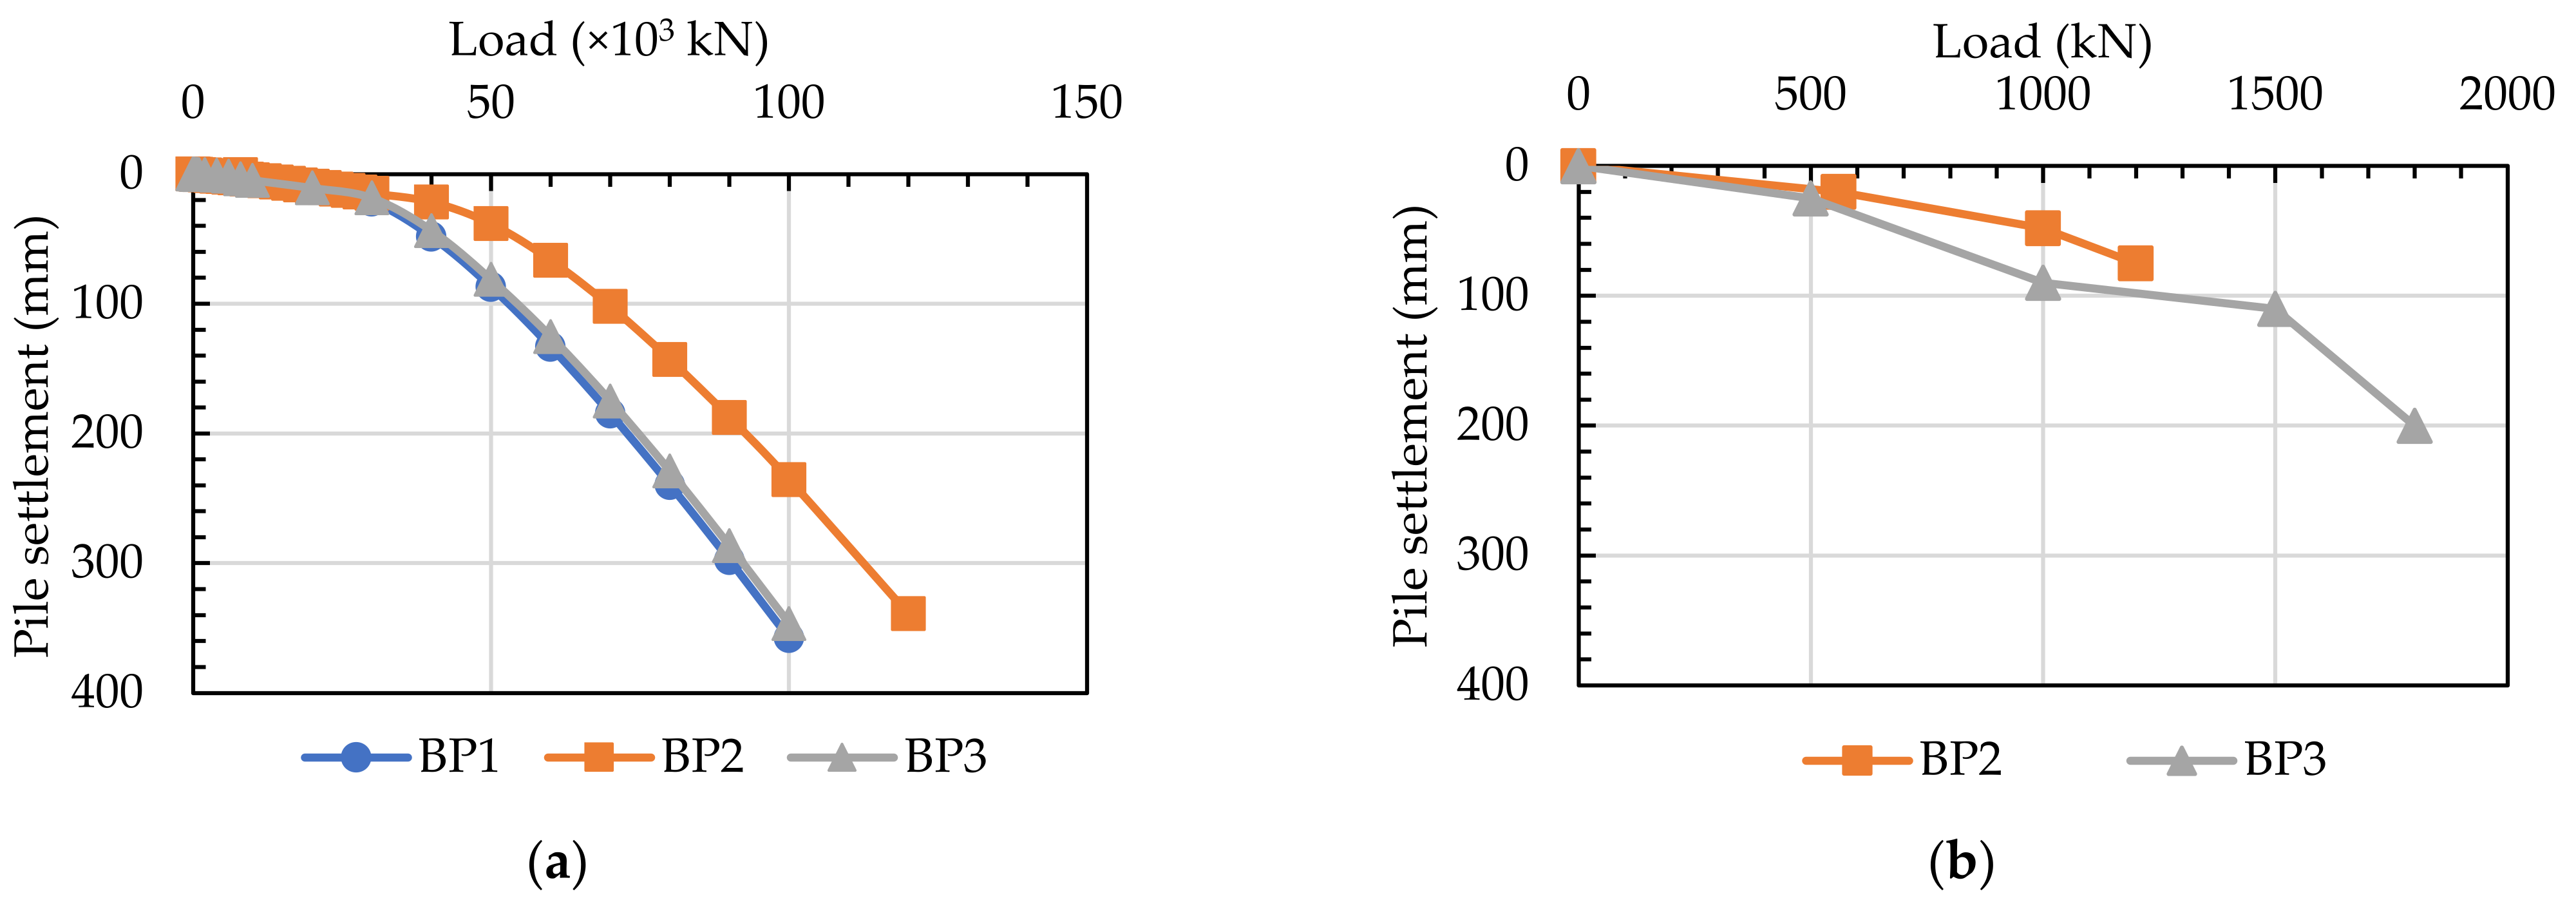
All the load and pile settlement trends of the PLAXIS3D were compared with the centrifuge results. The first testing stage of the centrifuge test cannot be compared because the strain gauges were broken during testing. The loads were performed on the pile until the load was constant by monitoring the load value during the test. Therefore, Figure 15b presents only the result of the second testing stage and third testing stage. Comparing Figure 15a,b it was found that every pile capacity in each testing stage of the centrifuge test has a value less than the results from PLAXIS3D. The pile load test in the centrifuge test applied load on the top of the pile until the load seemed constant by monitoring, but the load in PLAXIS3D was applied until the failure point. According to the limitation of the centrifuge test and the complicated input soil parameters in the PLAXIS3D software, this study focused on comparing the pile capacity in the second stage and the third testing stage. The results found that the load decreases by about 8.33 percent in PLAXIS3D. They are less than the results of the centrifuge test which has decreased by about 25 percent of the maximum load. Both the results of pile capacity have a loss during groundwater recovery to the ground surface. However, the results of the loss pile capacity are still in the range of previous research.
5.4. Ground Deformation
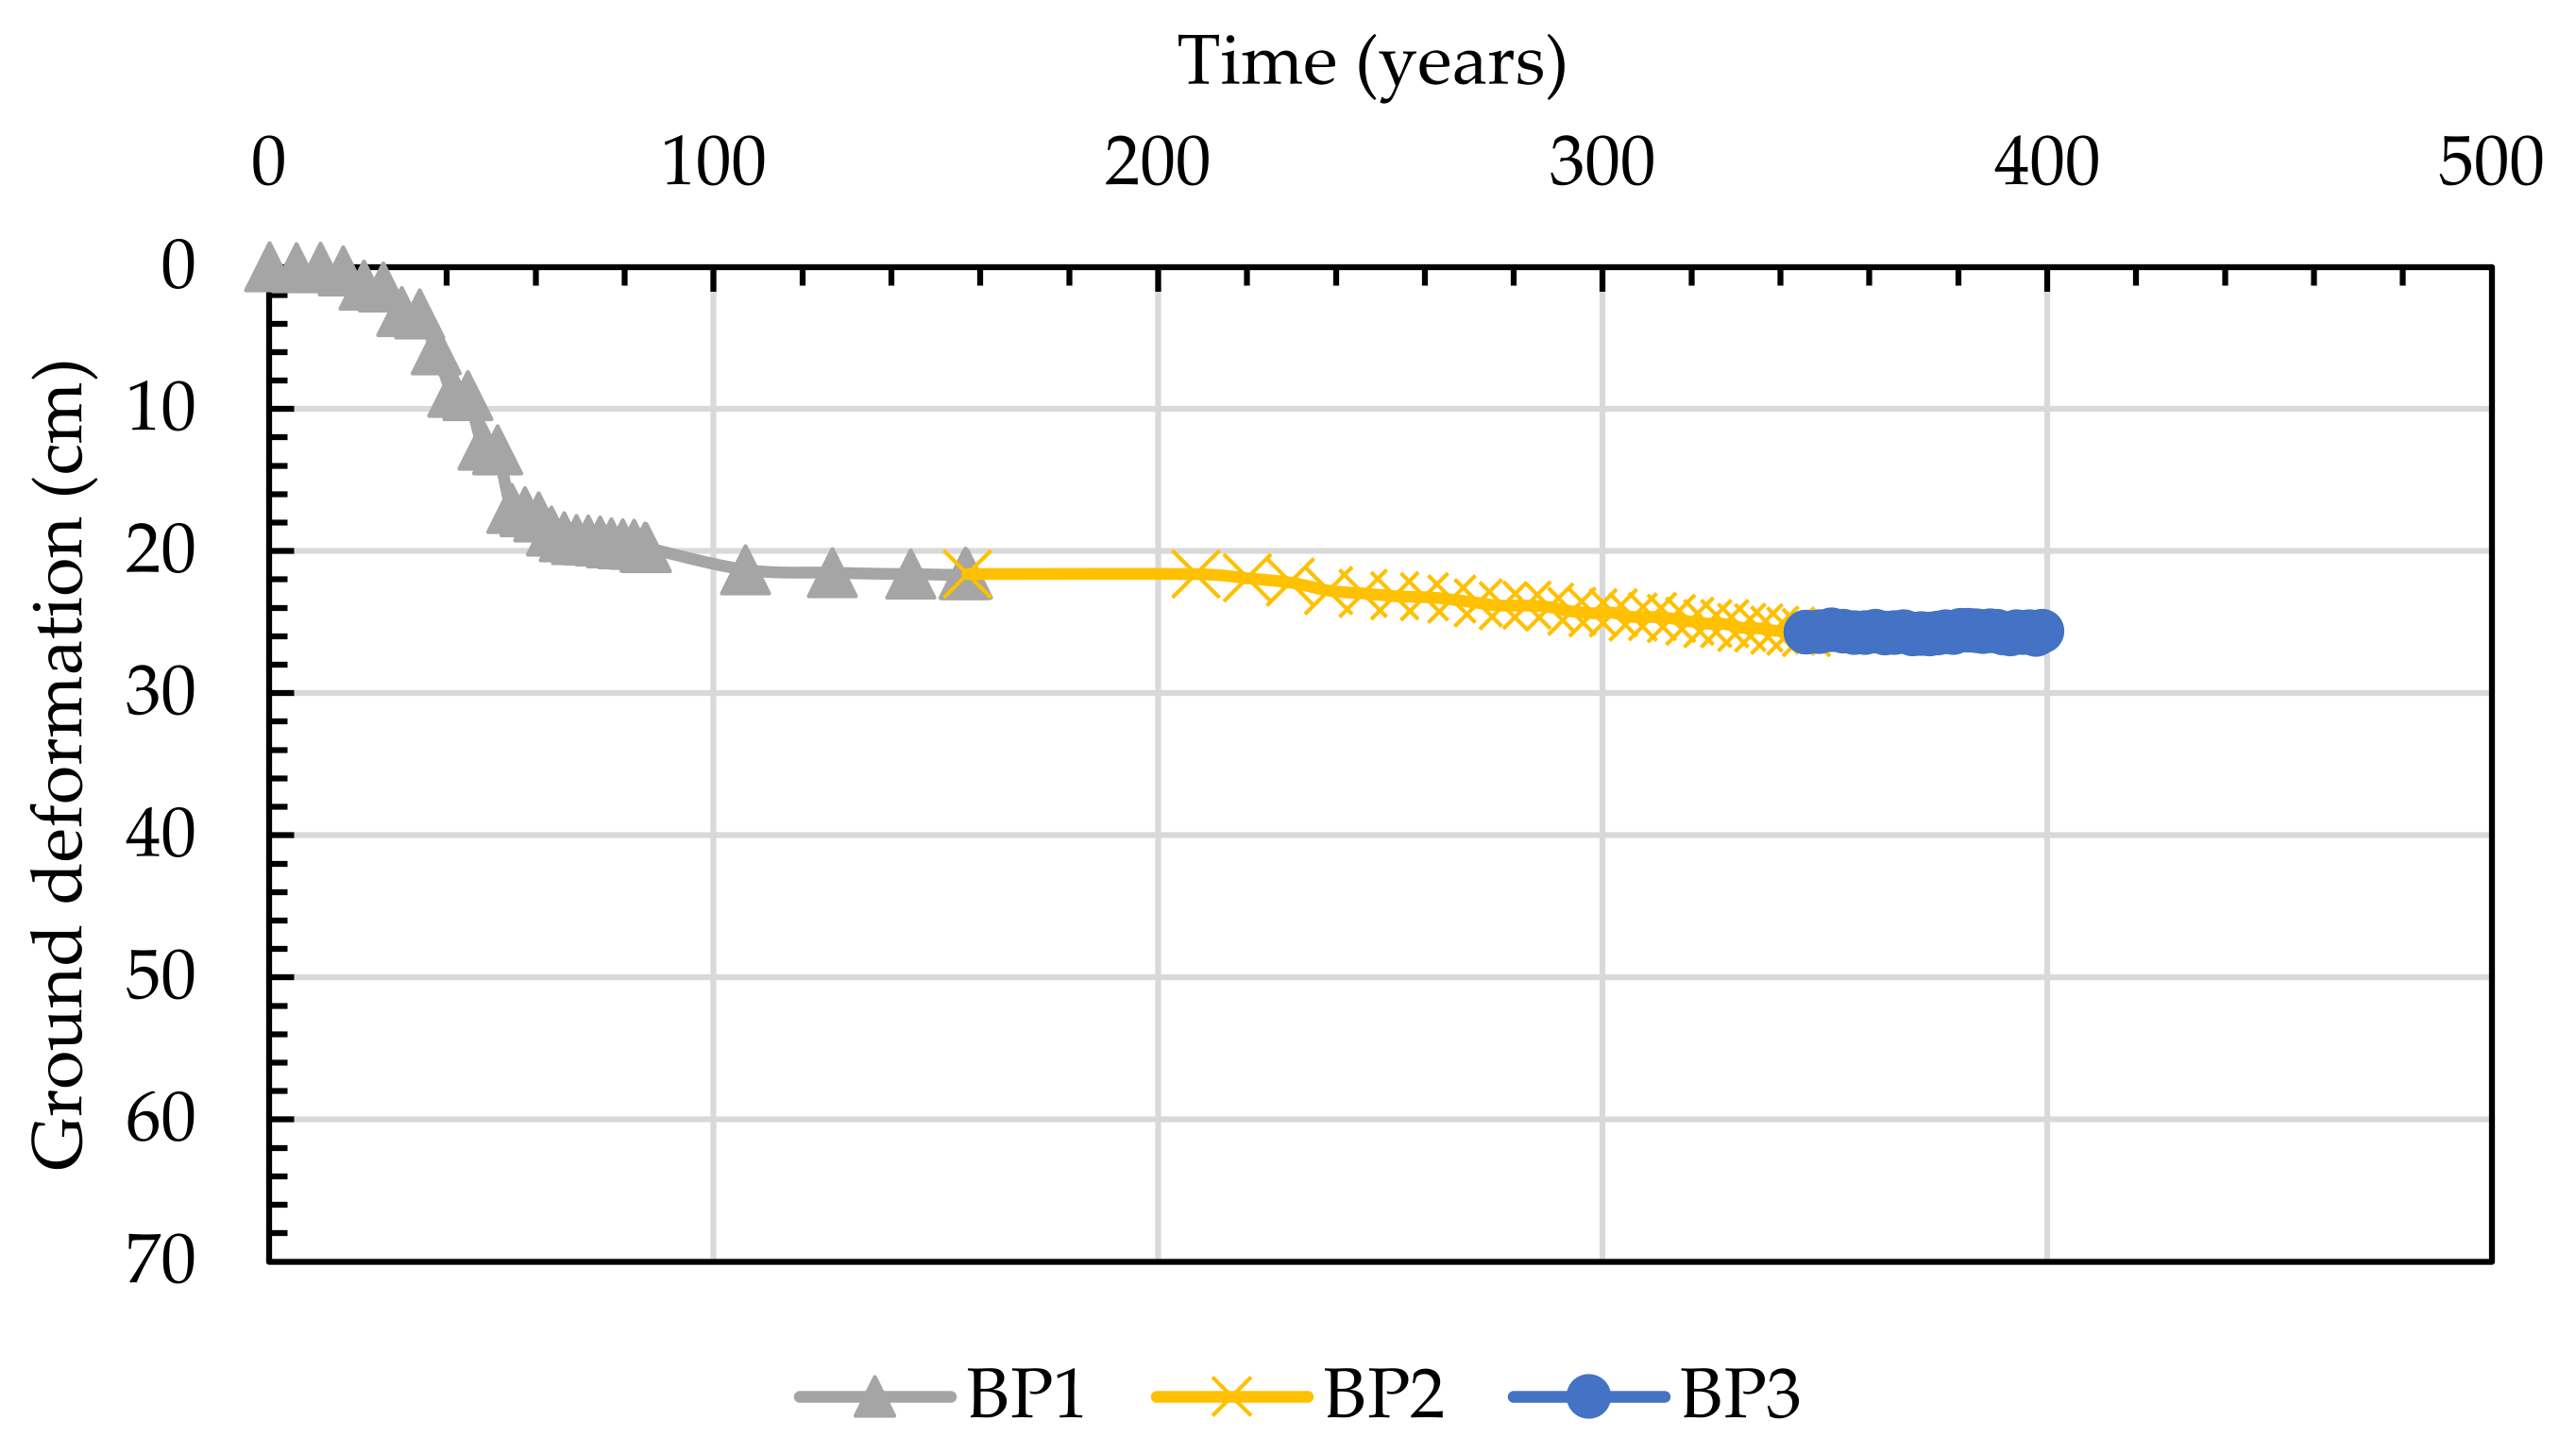
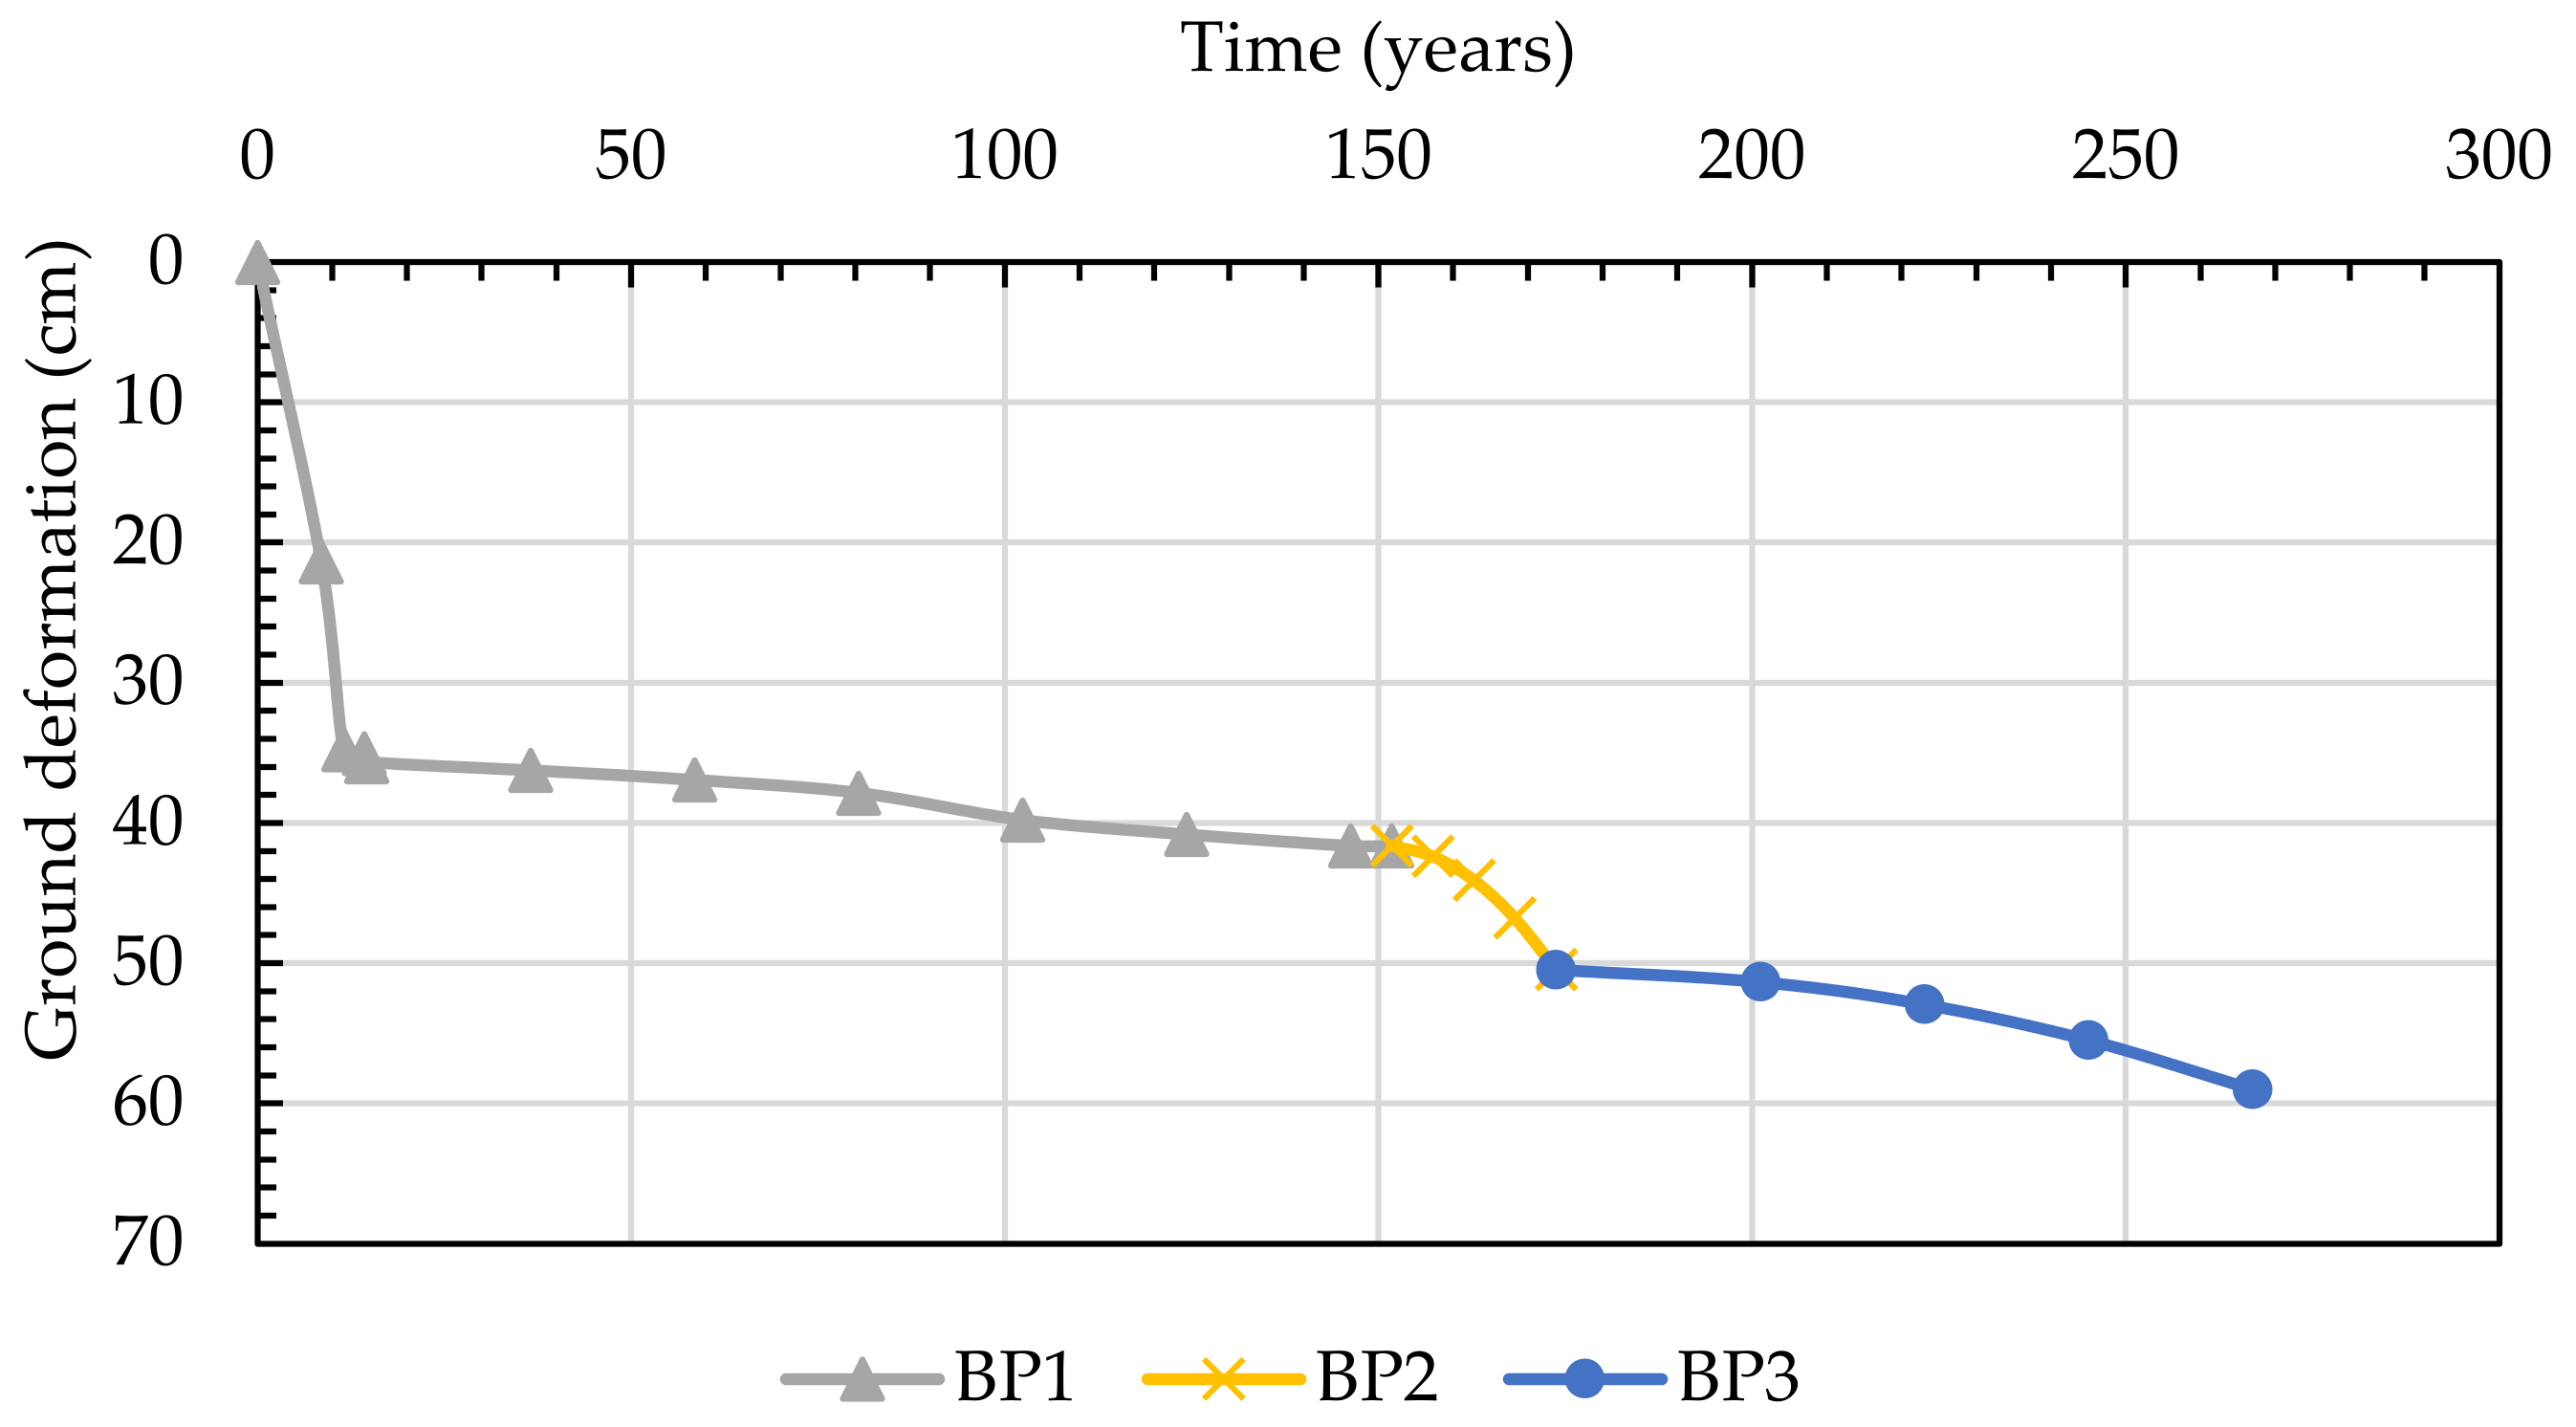
The ground deformation results obtained from the PLAXIS3D model were separated into three testing stages depending on the groundwater level change. The consolidation process was the main reason of ground deformation in the kaolin clay layer while the groundwater level increased and decreased. For the centrifuge test, Figure 16 reveals the rapid increase in ground deformation in the first testing stage. After that, the ground deformation still occurred continuously. The ground deformation rate decreased. The ground deformation rate of the centrifuge in each testing stage was 0.14 cm/year, 0.02 cm/year, and 0.001 cm/year, respectively. Figure 17 shows similar trend of ground deformation as centrifuge test, but the ground deformation rates were different. The ground deformation rate in PLAXIS3D model was 0.28 cm/year, 0.40 cm/year, and 0.09 cm/year for first to third testing stage. Both Figure 16 and Figure 17 show the comparison of the behavior of ground deformation during groundwater level changes which had a similar behavior. The different thing was the timing of the water level change. The centrifuge test took more time to ensure that the groundwater level reached the target level in each stage. The time was accounted during the centrifuge model spin. It also includes the timing of the spin-down and spin-up of the model. Moreover, some input parameters in PLAXIS3D were adopted for Toyoura sand and Speswhite kaolin clay. Moreover, the determination of the consolidation time in model during groundwater level increased and decreased in the PLAXIS3D model. This study preferred the simulation of the soil behavior under condition of the groundwater change. The ground deformation of both methods was proposed and compared with the observation data in the Bangkok area. Ground deformation results of both methods still settle with a small rate, similar to the observation data in many stations.
Using the experimental model and numerical model is a complicated method. But both models are required for solving complex problems in geotechnical engineering. All results of this study were compared with the centrifuge test at every testing stage in Table 3. Both these results cannot say exactly the value but the results can explain the ground deformation trend and the pile capacity trend when considering the groundwater level fluctuating as a case study in Bangkok, Thailand. And the numerical model was noted to study about the effect of input parameters for the future work. This effect may know about the exacted results that realistically occur.
6. Conclusions
This study focuses on explaining the soil deformation and bearing capacity under the condition of groundwater level changing by using PLAXIS3D software. The PLAXIS3D results were verified with previous research of the centrifuge test. The model was designed by following the situation of groundwater level change in Bangkok, Thailand. The result represented in terms of ground deformation and pile capacity is as follows.
- (1)
- The ground deformation continues to occur in the condition of groundwater drawdown due to void between soil particles and self-weight consolidation in term of time. After groundwater begin to recover, ground deformation continues to occur but the rate of ground deformation was less than the period of groundwater drawdown. In the case of groundwater recovery to the ground surface, the ground deformation rate of PLAXIS3D was about 0.09 cm/year while the centrifuge test was about 0.001 cm/year. These values were different due to limitations of the PLAXIS3D model and the centrifuge model such as the time of the consolidation process, soil preparation in the centrifuge test, and input soil parameters in the PLAXIS3D model. However, the trend of the ground deformation from both results demonstrated that the results have similar trends to the previous data of the observation station in Bangkok, Thailand.
- (2)
- The bearing capacity demonstrated by using the pile load test depends on the state of the groundwater level. The PLAXIS3D result reveals the pile capacity increased during groundwater drawdown due to the effective stress increase. The clay layer also shows the unsaturated zone and suction zone in the model. For the same reason, the pile capacity decreases when the groundwater was on the ground surface. The clay layer found the suction value almost zero and the saturated zone is almost 100%. The loss of pile capacity occurred in PLAXIS3D and the centrifuge test by around 8 to 25%.
The results of this study represent the soil behavior in part of the ground deformation and pile capacity in groundwater changing. It also proposes the limitation of soil preparation in the centrifuge test and the input soil parameters in PLAXIS3D. They were mentioned to explain the different values between the centrifuge test and PLAXIS3D. Moreover, the results can be a guide for future research on the effect of soil preparation and input parameters. This study can also help future researchers to get more accurate values of ground deformation and pile capacity when groundwater increases to the ground surface. Moreover, the numerical model and experimental model are still important for solving the complex problems in geotechnical engineering.
Author Contributions
Conceptualization, S.I. (Shinya Inazumi); methodology, S.I. (Shinya Inazumi); software, S.I. (Sutasinee Intui); validation, S.I. (Shinya Inazumi); formal analysis, S.I. (Sutasinee Intui); investigation, S.I. (Sutasinee Intui); resources, S.I. (Shinya Inazumi); data curation, S.I. (Sutasinee Intui); writing—original draft preparation, S.I. (Sutasinee Intui); writing—review and editing, S.I. (Shinya Inazumi); visualization, S.I. (Shinya Inazumi); supervision, S.I. (Shinya Inazumi); project administration, S.I. (Shinya Inazumi); funding acquisition, S.I. (Shinya Inazumi) All authors have read and agreed to the published version of the manuscript.
Funding
This research received no external funding.
Data Availability Statement
Data is contained within the article.
Conflicts of Interest
The authors declare no conflict of interest.
References
- Department of Groundwater Resource. The Report of the Project Studied the Impact of Underground Structures Due to the Water Pressure Recovery of Groundwater in Bangkok and Metropolitan Areas; Seven Associated Consultants Co., LTD.: Bangkok, Thailand, 2012. [Google Scholar]
- Inthachai, K.; Phein-Wej, N.; Sarakshetrin, D. Impact of deep well pumping termination to mitigate land subsidence of Bangkok on stability of piled foundation. In Proceedings of the 22nd National Convention on Civil Engineering, Nakhon Ratchasima, Thailand, 18–20 July 2017. [Google Scholar]
- Morrison, P.R.J.; Taylor, R.N. Foundation in a rising groundwater environment. In Groundwater Problems in Urban Areas: Proceedings of the International Conference Organized by the Institution of Civil Engineers and Held in London, UK, 2–3 June 1993; Thomas Telford Publishing: London, UK, 1994; pp. 342–354. [Google Scholar]
- Fleming, W.G.K. A new method for single pile settlement prediction and analysis. Geotechnique 1992, 42, 411–425. [Google Scholar] [CrossRef]
- Skempton, A.W. Cast in-situ bored pile in London clay. Geotechnique 1959, 9, 153–173. [Google Scholar] [CrossRef]
- Schweiger, H. Design of deep excavations with FEM—Influence of constitutive model and comparison of EC7 design approaches. In Earth Retention Conference; American Society of Civil Engineers: Reston, VA, USA, 2010; pp. 804–817. [Google Scholar]
- Surasak, C.; Likitlersuang, S.; Wanatowski, D.; Balasubramaniam, A.; Oh, E.; Guan, H. Stiffness and strength parameters for hardening soil model of soft and stiff Bangkok clays. Soil Found. 2012, 52, 682–697. [Google Scholar] [CrossRef]
- Phoban, H.; Seeboonruang, U.; Lueprasert, P. Numerical modeling of single pile behaviors due to groundwater level rising. Appl. Sci. 2021, 11, 5782. [Google Scholar] [CrossRef]
- Saowiang, K.; Giao, P.H. Numerical analysis of subsurface deformation induced by groundwater level changes in the Bangkok aquifer system. Acta Geotech. 2021, 16, 1265–1279. [Google Scholar] [CrossRef]
- Sinsakul, S. Late Quaternary geology of the Lower Central Plain, Thailand. J. Asian Earth Sci. 2000, 18, 415–426. [Google Scholar] [CrossRef]
- Singtokaew, K.; Submaneewong, C.; Tanseng, P. The highest static load which ever been tested on piles in Bangkok subsoils. In 40th Anniversary; The Foundation of Success: Bangkok, Thailand, 2014; pp. 103–108. [Google Scholar]
- David, G.Z.; Wakshal, E. Land Subsidence Analysis in Urban Areas: The Bangkok Metropolitan Area Case Study; Springer Environmental Science and Engineering: Berlin/Heidelberg, Germany, 2013. [Google Scholar]
- Zelikson, A. Geotechnical models using the hydraulic gradient similarity method. Geotechnique 1969, 19, 495–508. [Google Scholar] [CrossRef]
- Intui, S.; Soralump, S. The Vertical Bearing Capacity Behavior of Single Pile by Geotechnical Centrifuge. Kasetsart Eng. J. 2018, 31, 55–68. [Google Scholar]
- Intui, S.; Soralump, S.; Inazumi, S.; Shishido, K. Application of centrifuge model tests to settlement behavior under groundwater recovery. Int. J. GEOMATE Geotech. Constr. Mater. Environ. 2021, 21, 34–40. [Google Scholar] [CrossRef]
- Intui, S.; Soralump, S.; Inazumi, S. Behavior of bearing capacity on pile foundation during fluctuating groundwater level. Int. J. GEOMATE Geotech. Constr. Mater. Environ. 2022, 22, 24–31. [Google Scholar] [CrossRef]
- Ali, S.M. Effect of Advancing Twin Tunnels on Pile Group. Ph.D. Thesis, The Hong Kong University of Science and Technology, Hong Kong, China, 2013. [Google Scholar]
- Wheeler, S.J.; Sivakumar, V. An elastoplastic critical state framework for unsaturated soil. Géotechnique 1995, 45, 35–53. [Google Scholar] [CrossRef]
- Biot, M.A. General theory of three-dimensional consolidation. J. Appl. Phys. 1941, 12, 155–164. [Google Scholar] [CrossRef]
- Booker, J.R.; Small, J.C. An investigation of the stability of numerical solutions of Biot’s equations of consolidation. Int. J. Solids Struct. 1975, 11, 907–917. [Google Scholar] [CrossRef]
- Atkinson, J.H.; Sallfors, G. Experimental determination of soil properties. In Proceedings of the 10th ECSMFE, Florence, Italy, 26 May 1991; Volume 3, pp. 915–956. [Google Scholar]
- Lim, A.; Ou, C.Y.; Hsieh, P.G. Evaluation of clay constitutive models for analysis of deep excavation under undrained conditions. J. GeoEng. 2010, 5, 9–20. [Google Scholar]
- Schanz, T.; Vermeer, P.A.; Bonnier, P.G. The hardening soil model: Formulation and verification. In Beyond 2000 in Computational Geotechnics—10 Years PLAXIS; Balkema: Rotterdam, The Netherlands, 1999. [Google Scholar]
- Benz, T. Small-Strain Stiffness of Soils and its Numerical Consequences; Institut fur Geotechnik: Stuttgart, Germany, 2007. [Google Scholar]
- Gallipoli, D.; Wheeler, S.; Karstunen, M. Modelling the variation of degree of saturation in a deformable unsaturated soil. Géotechnique 2003, 53, 105–112. [Google Scholar] [CrossRef]
- Likitlersuang, S.; Teachavorasinskun, S.; Surarak, C.; Oh, E.; Balasubramaniam, A. Small strain stiffness and stiffness degradation curve of Bangkok Clays. Soils Found. 2013, 53, 498–509. [Google Scholar] [CrossRef]
Figure 1.
Ground deformation in Bangkok and urban areas [1].
Figure 1.
Ground deformation in Bangkok and urban areas [1].

Figure 2.
Changing groundwater level in the Bangkok Plain, Thailand.

Figure 3.
Location of the ground deformation measurement in Bangkok region [1].
Figure 3.
Location of the ground deformation measurement in Bangkok region [1].

Figure 4.
Soil sediment in the Chao Phraya River basin.

Figure 5.
Characteristic of aquifer layers in Bangkok plain, Thailand.

Figure 6.
Model box for the centrifuge test.

Figure 7.
PLAXIS3D model.

Figure 8.
Characteristic shear modulus and shear strain.

Figure 9.
Constitutive soil model for each soil type.

Figure 10.
Variation of groundwater level. (a) Increasing groundwater level to ground surface. (b) Decreasing groundwater level to soil interface (c) Groundwater level recovered to ground surface.
Figure 10.
Variation of groundwater level. (a) Increasing groundwater level to ground surface. (b) Decreasing groundwater level to soil interface (c) Groundwater level recovered to ground surface.

Figure 11.
Comparison of the effective stress at the different water levels.

Figure 12.
Comparison of saturation stage. (a) The first testing stage. (b) The second testing stage. (c) The third testing stage.
Figure 12.
Comparison of saturation stage. (a) The first testing stage. (b) The second testing stage. (c) The third testing stage.

Figure 13.
Comparison of suction value during the changing water levels. (a) Suction of the first testing stage. (b) Suction of the second testing stage. (c) Suction of the third testing stage.
Figure 13.
Comparison of suction value during the changing water levels. (a) Suction of the first testing stage. (b) Suction of the second testing stage. (c) Suction of the third testing stage.

Figure 14.
Schematic of the pile load test (a) the first pile load test, (b) the second pile load test, and (c) the third pile load test.
Figure 14.
Schematic of the pile load test (a) the first pile load test, (b) the second pile load test, and (c) the third pile load test.

Figure 15.
Comparison of the load distribution results (a) PLAXIS3D result. (b) The centrifuge result.
Figure 15.
Comparison of the load distribution results (a) PLAXIS3D result. (b) The centrifuge result.

Figure 16.
Behavior of ground deformation by the centrifuge test.

Figure 17.
Behavior of ground deformation by PLAXIS3D result.


Table 1.
Associated parameters for the material property.
| Parameters | Speswhite Kaolin Clay | Toyoura Sand |
|---|---|---|
| The saturated unit weight (), kN/m3 | 16.5 | 15.3 |
| The unsaturated unit weight (), kN/m3 | 17 | 15.3 |
| Secant stiffness (), kN/m2 | 16,000 | E’ = 85,800 |
| Tangent stiffness (), kN/m2 | 20,000 | - |
| The ratio of stiffness (), kN/m2 | 70,000 | 115,500 |
| Power for stress level | 1 | - |
| Cohesion (), kN/m2 | 35 | 0.1 |
| Friction angle (), degree | 31 | 36 |
| Dilatancy angle () | 0 | 5 |
| Shear strain (), degree | 0.001 | - |
| Shear modulus (), kN/m2 | 90,000 | 33,000 |
| Poisson’s ratio () | 0.2 | 0.3 |
| Reference pressure | 100 | - |
| Coefficient of lateral earth pressure () | 0.485 | - |
| Failure ratio () | 0.9 | - |
| Interface reduction factor () | 0.75 | 0.75 |
| OCR | 1 | - |
| Initial void ratio () | 0.8 | 0.73 |
| References | Modified Benz (2006) [24] | Modified Likitlersuang et al. (2013) [26] |
Table 2.
Associated parameters for groundwater property.
| Parameters | Speswhite Kaolin Clay |
|---|---|
| Residual saturation | 0.05 |
| Saturated saturation | 1 |
| Fitting parameters (gn) | 1.6 |
| Fitting parameters (ga) | 0.04 |
| Fitting parameters (gl) | 0.5 |
| Horizontal permeability, m/day | 8.64 × 10⁻⁴ |
| Horizontal permeability, m/day | 8.64 × 10⁻⁴ |
| Vertical permeability, m/day | 8.64 × 10⁻⁴ |
Table 3.
Comparison results between centrifuge test and PLAXIS3D model.
| Description | Centrifuge Modeling | PLAXIS3D Modeling | ||||
|---|---|---|---|---|---|---|
| BP1 | BP2 | BP3 | BP1 | BP2 | BP3 | |
| Time period of water level change | 157 | 192 | 49 | 157 | 16 | 94 |
| Porewater pressure (kPa) | ||||||
| At 20 m from ground surface | 194.64 | 33.10 | 195.32 | 202 | 26 | 185 |
| At 35 m from ground surface | 348.48 | 136.11 | 349.33 | 352 | 159 | 344 |
| Effective stress at interface of soil (kPa) | 184 | 277 | 184 | 205 | 300 | 205 |
| Ground displacement rate (cm/year) | 0.14 | 0.02 | 0.001 | 0.4 | 0.28 | 0.09 |
| Total ground displacement (cm) | 21.62 | 25.69 | 25.66 | 41.6 | 50.5 | 58.9 |
| Maximum pile load (kN) | 100,000 | 120,000 | 100,000 | N/A | 1200 | 1800 |
| Pile settlement (mm) | 346 | 339 | 346 | N/A | 75 | 200 |
Disclaimer/Publisher’s Note: The statements, opinions and data contained in all publications are solely those of the individual author(s) and contributor(s) and not of MDPI and/or the editor(s). MDPI and/or the editor(s) disclaim responsibility for any injury to people or property resulting from any ideas, methods, instructions or products referred to in the content. |
© 2023 by the authors. Licensee MDPI, Basel, Switzerland. This article is an open access article distributed under the terms and conditions of the Creative Commons Attribution (CC BY) license (https://creativecommons.org/licenses/by/4.0/).
Share and Cite
MDPI and ACS Style
Intui, S.; Inazumi, S. Experimental and Analytical Evaluations of Ground Behaviors on Changing in Groundwater Level in Bangkok, Thailand. Water 2023, 15, 1825. https://doi.org/10.3390/w15101825
AMA Style
Intui S, Inazumi S. Experimental and Analytical Evaluations of Ground Behaviors on Changing in Groundwater Level in Bangkok, Thailand. Water. 2023; 15(10):1825. https://doi.org/10.3390/w15101825
Chicago/Turabian StyleIntui, Sutasinee, and Shinya Inazumi. 2023. "Experimental and Analytical Evaluations of Ground Behaviors on Changing in Groundwater Level in Bangkok, Thailand" Water 15, no. 10: 1825. https://doi.org/10.3390/w15101825
Note that from the first issue of 2016, this journal uses article numbers instead of page numbers. See further details here.