
Groundwater Potentiality of Wadi Fatimah, Western Saudi Arabia: Geophysical and Remote Sensing Integrated Approach

1
Abdullah Alrushaid Chair for Earth Science Remote Sensing Research, Geology and Geophysics Department, College of Science, King Saud University, Riyadh 11451, Saudi Arabia
2
Department of Geology and Geophysics, College of Science, King Saud University, Riyadh 11451, Saudi Arabia
*
Authors to whom correspondence should be addressed.
Water 2023, 15(10), 1828; https://doi.org/10.3390/w15101828
Submission received: 30 March 2023
/
Revised: 28 April 2023
/
Accepted: 5 May 2023
/
Published: 11 May 2023
(This article belongs to the Special Issue Novel Perspective for Interactions between Water and the Geology Using GRACE and Remote Sensing Data)
Abstract
:To detect groundwater-bearing potential zones in Wadi Fatimah, western Saudi Arabia, geophysical data from three profiles of two-dimensional electrical resistivity tomography (ERT) and remote sensing data were gathered, integrated, and evaluated. The DEM and slope maps indicate that Wadi Fatimah has a high potential to store great amounts of groundwater. The maximum elevations range from 0 to 933 m, with an average elevation of 466 m AMSL. The amount of surface water that infiltrates into the ground is affected by the slope. Rainwater can be collected in low-sloped areas and percolate into the subsurface, replenishing groundwater. In the study area, the slope ranged from 0° to 38°. The slopes of Wadi Fatimah ranged from 0° to 9.1°, with highlands having slopes ranging from 9.1° to 38°. Wadi Fatimah has a high stream density. Furthermore, because it is unconfined, the groundwater-bearing zone reaches the ground surface and recharges continuously during the rainy season. The drainage density is 0.433 km/km2, which is considered normal for coarse drainage. Lithology, infiltration capacity, and topographic relief all have an impact on drainage texture. Because of the basement rocks’ low slope, a coarse drainage texture of 0.059 was calculated, indicating additional groundwater recharge from precipitation. Moreover, based on the 2D inversion results of the ERT data, Wadi Fatimah’s unconfined aquifer has a high potential for groundwater. This aquifer is distinguished by a zone of low resistivity (less than 100 Ω.m) and a depth of up to 50 m below the ground surface. This aquifer is underlain by the weathered/fractured and/or fresh basement rocks. Wadi Fatimah basin is recharged by rainfall creating a promising or strategic area for groundwater supply for future planning and urbanization projects in surrounding areas.
1. Introduction
Because Saudi Arabia is considered an arid region with limited surface water resources, the exploration of groundwater resources becomes an urgent necessity for drinking, irrigation, and other related activities. In arid environments, such as Saudi Arabia, less frequent rainfall, and high evaporation rates can result in fractionation processes that have a significant impact on shallow groundwater. This is valid for the alluvium deposits in the western part of the Kingdom. The majority of previous studies on the principal wadis in the Western Area revealed that rock types and agricultural activities are the primary factors of groundwater salinity [1,2]. Furthermore, location-dependent, local geological, morphological, tectonic, and climatological factors influence the availability of groundwater supplies [3,4,5,6,7,8,9,10]. In arid areas, the alluvium fractures and also fills with the majority of the water. Any evaluation of a groundwater supply is mostly influenced by geological characteristics. These characteristics support the recharge phenomena by linking surface runoff to the groundwater reservoir. The composition of the geological formation, which includes faults, voids, fissures, fractures, crevices, solution cavities, and other structural geological features, is what determines whether such a relationship exists [11,12,13].
Together with worn and cracked basement rocks, wadis in western Saudi Arabia are mostly made up of Quaternary deposits. The majority of groundwater reserves, it is believed, are buried within Quaternary layers. Moreover, groundwater is frequently found in the form of unconfined aquifers in the wadi alluviums of arid regions, with saturation thickness seldom exceeding 100 m. For instance, the highest depth of alluvium in Wadi Fatimah is roughly 60 m. Deeper wells cannot be drilled in order to collect additional groundwater. As a result, one of the limiting elements in the strategic planning of groundwater resources in the western region of the Kingdom of Saudi Arabia is depth. The overlying unsaturated thickness will also be considered in this study for potential post-recharge groundwater reservoir augmentation. Of course, one of the factors affecting spatial availability in addition to thickness is the area of the groundwater reservoir.
One of the traditional geophysical methods is direct-current (DC) resistivity exploration. It makes use of two electrodes to inject electric current into the ground and two additional electrodes to measure the electric potential difference. The measurements are frequently taken along a line or in a specific area on the earth’s surface, and the observed potential differences are then converted into sounding curves or pseudo-sections of apparent resistivities, which indicate resistivity changes in subsurface rocks. These data analyses allow us to identify underground resistivity anomalies and outline the subsurface geological structure. Accurate numerical simulations of subsurface electrical fields and acquiring a large amount of data in fields became possible with the development of computer technology and numerical computational techniques [14,15,16], so the traditional DC resistivity exploration was developed into a computerized tomography technique called electrical resistivity tomography (ERT), which employs multielectrode equipment or systems to automatically acquire a large number of data [17,18] and uses computer software to reconstruct the subsurface resistivity structure using observed data [19,20,21,22,23]. ERT is now widely used in mineral exploration, civil engineering, hydrological prospecting, environmental investigations, and archaeological mapping due to its conceptual simplicity, low equipment cost, and ease of use [24].
Electrical resistivity surveys have long been used for groundwater exploration in arid regions due to their dependability and ease of obtaining subsurface information in the most non-destructive way possible based on resistivity contrasts between different layers [25,26,27]. The majority of groundwater investigations have employed the geoelectrical exploration technique of electrical resistivity tomography (ERT) to correlate the electrical properties of geologic formations with their fluid content [28,29,30,31]. In other studies, the shape of the aquifers has attracted a lot of attention [32]. The main factors affecting electrical resistivity are formation fluid salinity, saturation, aquifer lithology, and porosity [33]. This technique has been used successfully all over the world to examine groundwater quality. The limits of aquifers and the depth, type, and thickness of alluvium are routinely determined using the electrical resistivity approach [34,35,36]. Additionally, freshwater/saline water interfaces [37,38], aquifer porosity [39], water content [40], and hydraulic conductivity [41,42,43,44] are defined by ERT. In Saudi Arabia, ERT has been applied regionally in complex geological environments for groundwater potentiality in hard rocks [45,46,47,48,49,50], seawater intrusion [51], and cavity detection [52,53].
Groundwater investigation in hard rock medium necessitates the identification of structures such as geological contacts, faults, and joints. The Wadi Fatimah geology, which is a part of the Arabian Shield, significantly affects the potential for groundwater. Groundwater research in hard rock terrain is a very difficult undertaking when possible groundwater zones are related to fractured and fissured media. The primary factor affecting the groundwater potential in this environment is the thickness of the weathered/fractured layer that lies above the basement. In the current study, the detailed soil properties, competent bedrock depth, layer boundaries, and depth of the groundwater table have been studied to identify the groundwater-bearing layers and their extension through the Wadi Fatimah pathway. Wadi Fatimah goes through basement rocks that have suffered substantial deformation and fracture. Hence, it is expected that both the Quaternary wadi fill deposits and the fissures and cracks in the bedrock will recharge the groundwater. This study is an integration work between remote sensing, geological, and geophysical datasets that is applied to the study area for the first time. The remote sensing dataset will be represented by the Digital Elevation Model (DEM), while the geological dataset will be illustrated by a detailed geological map showing the lithological variations and accompanying structures and tectonics. The geophysical data will be illustrated through three geoelectrical cross-sections of electrical resistivity tomography (ERT).
1.1. Description of the Study Area
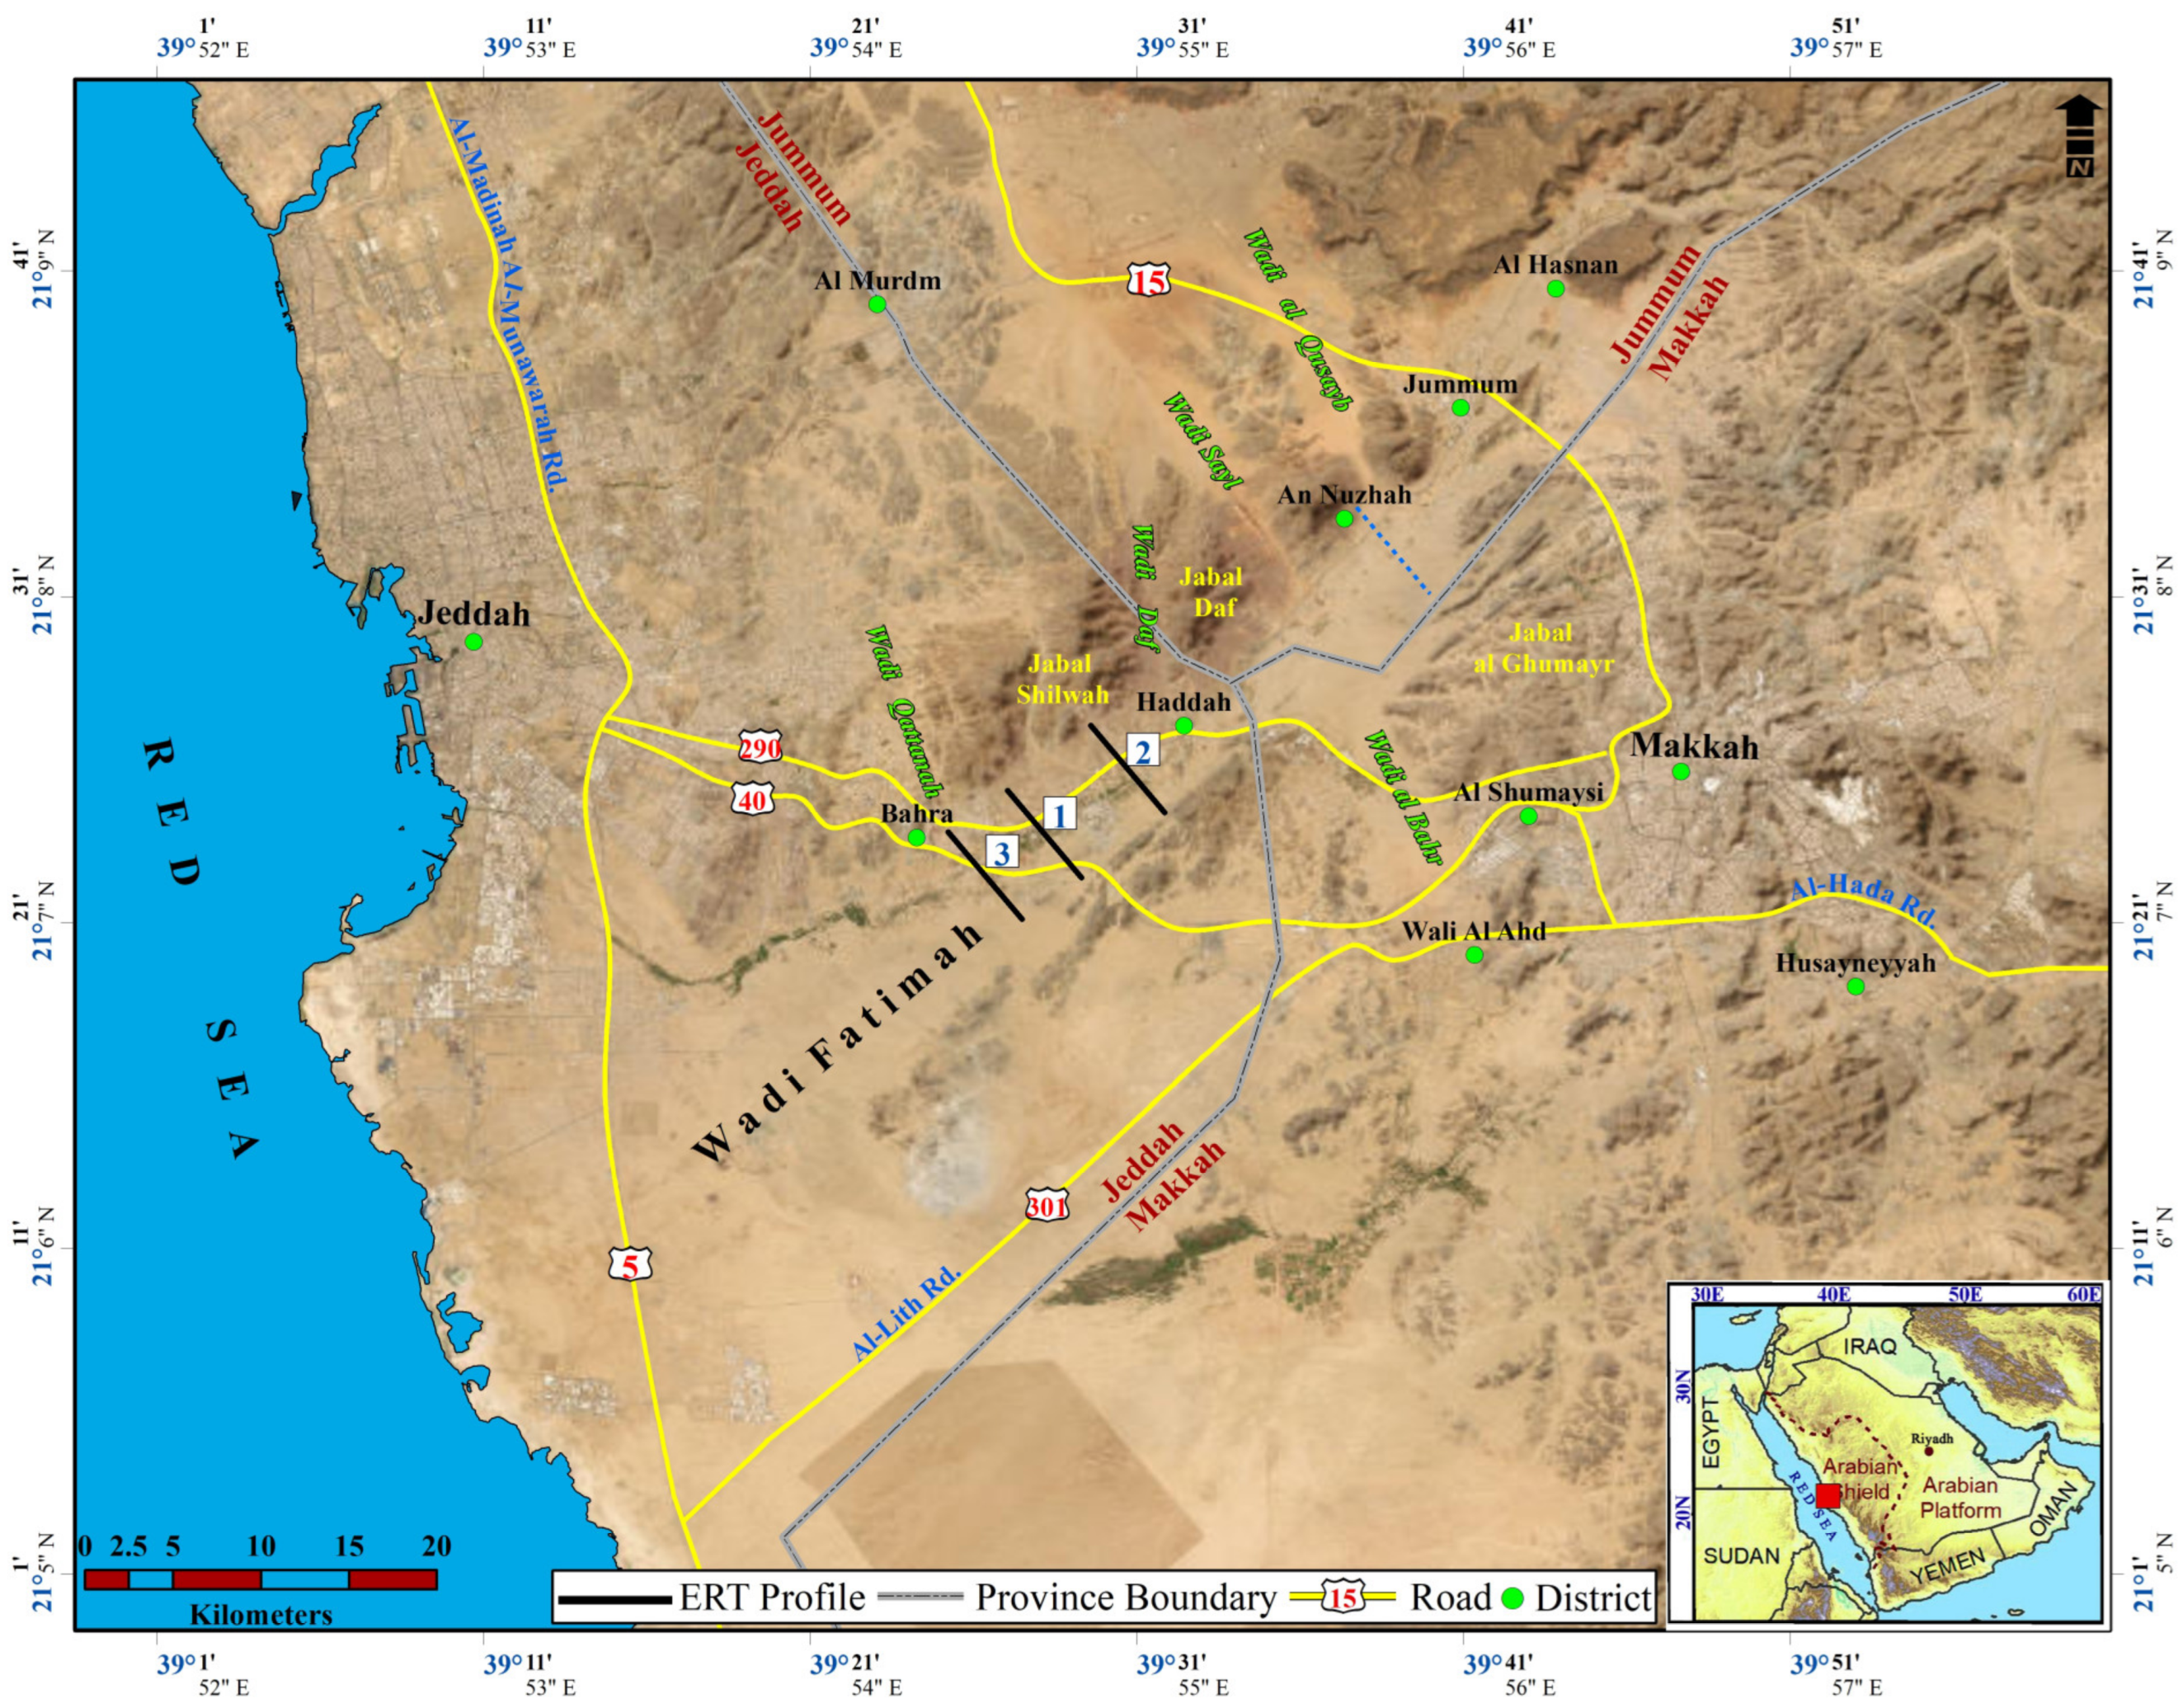
The study site is situated in the southern part of Wadi Fatimah (Figure 1). Wadi Fatimah is a part of the Yamaniyah-Az Zibarah-Fatima drainage system, which extends from As Sayl Al Kabir, which is situated 125 km to the east of Jeddah city, western Saudi Arabia. The A1-Jumum city is situated roughly 55 km east of Jeddah and 30 km northwest of Makkah. Wadi Fatimah is supposed to be one of the primary drainage basins in Saudi Arabia’s Western Region. It provides the main groundwater supply for Makkah and Jeddah cities. At its upper reaches, the yearly average rainfall is about 280 mm. Over 70% of the annual rainfall falls between December and January, during the rainy season, which lasts from December through May. During the rest of the year, there is very little rain. The bottom areas of the basin are among the driest in the region, receiving less than 70 mm of rain annually on average. The considerable yearly evaporative capacity (>1000 mm yr−1) does appear to be quantitatively significant for both the overall quality and balance of water. In the summer (June and July), the average maximum temperature is between 30 and 35 °C. A substantial amount of rainwater is diverted into surface water in the upper catchment region because of the lithologies that are impermeable to water. The aeration zone considerably facilitates the process of runoff fast infiltrating the water table, which has generally been regarded as the main source of the aquifer’s recharge. During recharge processes, the thin Quaternary layers that are on top of the bedrock get partially wet. After the floodwater recedes, the combined effects of subsurface drainage and evaporation processes cause the water level to drastically drop for a short while. Most of the existing wells were created by drilling through a variety of rocks, almost all of which were fractured and weathered. Although supplies from the surficial deposits above these rocks are often irregular and may run out completely during the dry season, the biggest groundwater abstractions originate from these zones, where the water table is extremely shallow.
1.2. Physiography and Hydrogeological Setting of Wadi Fatimah
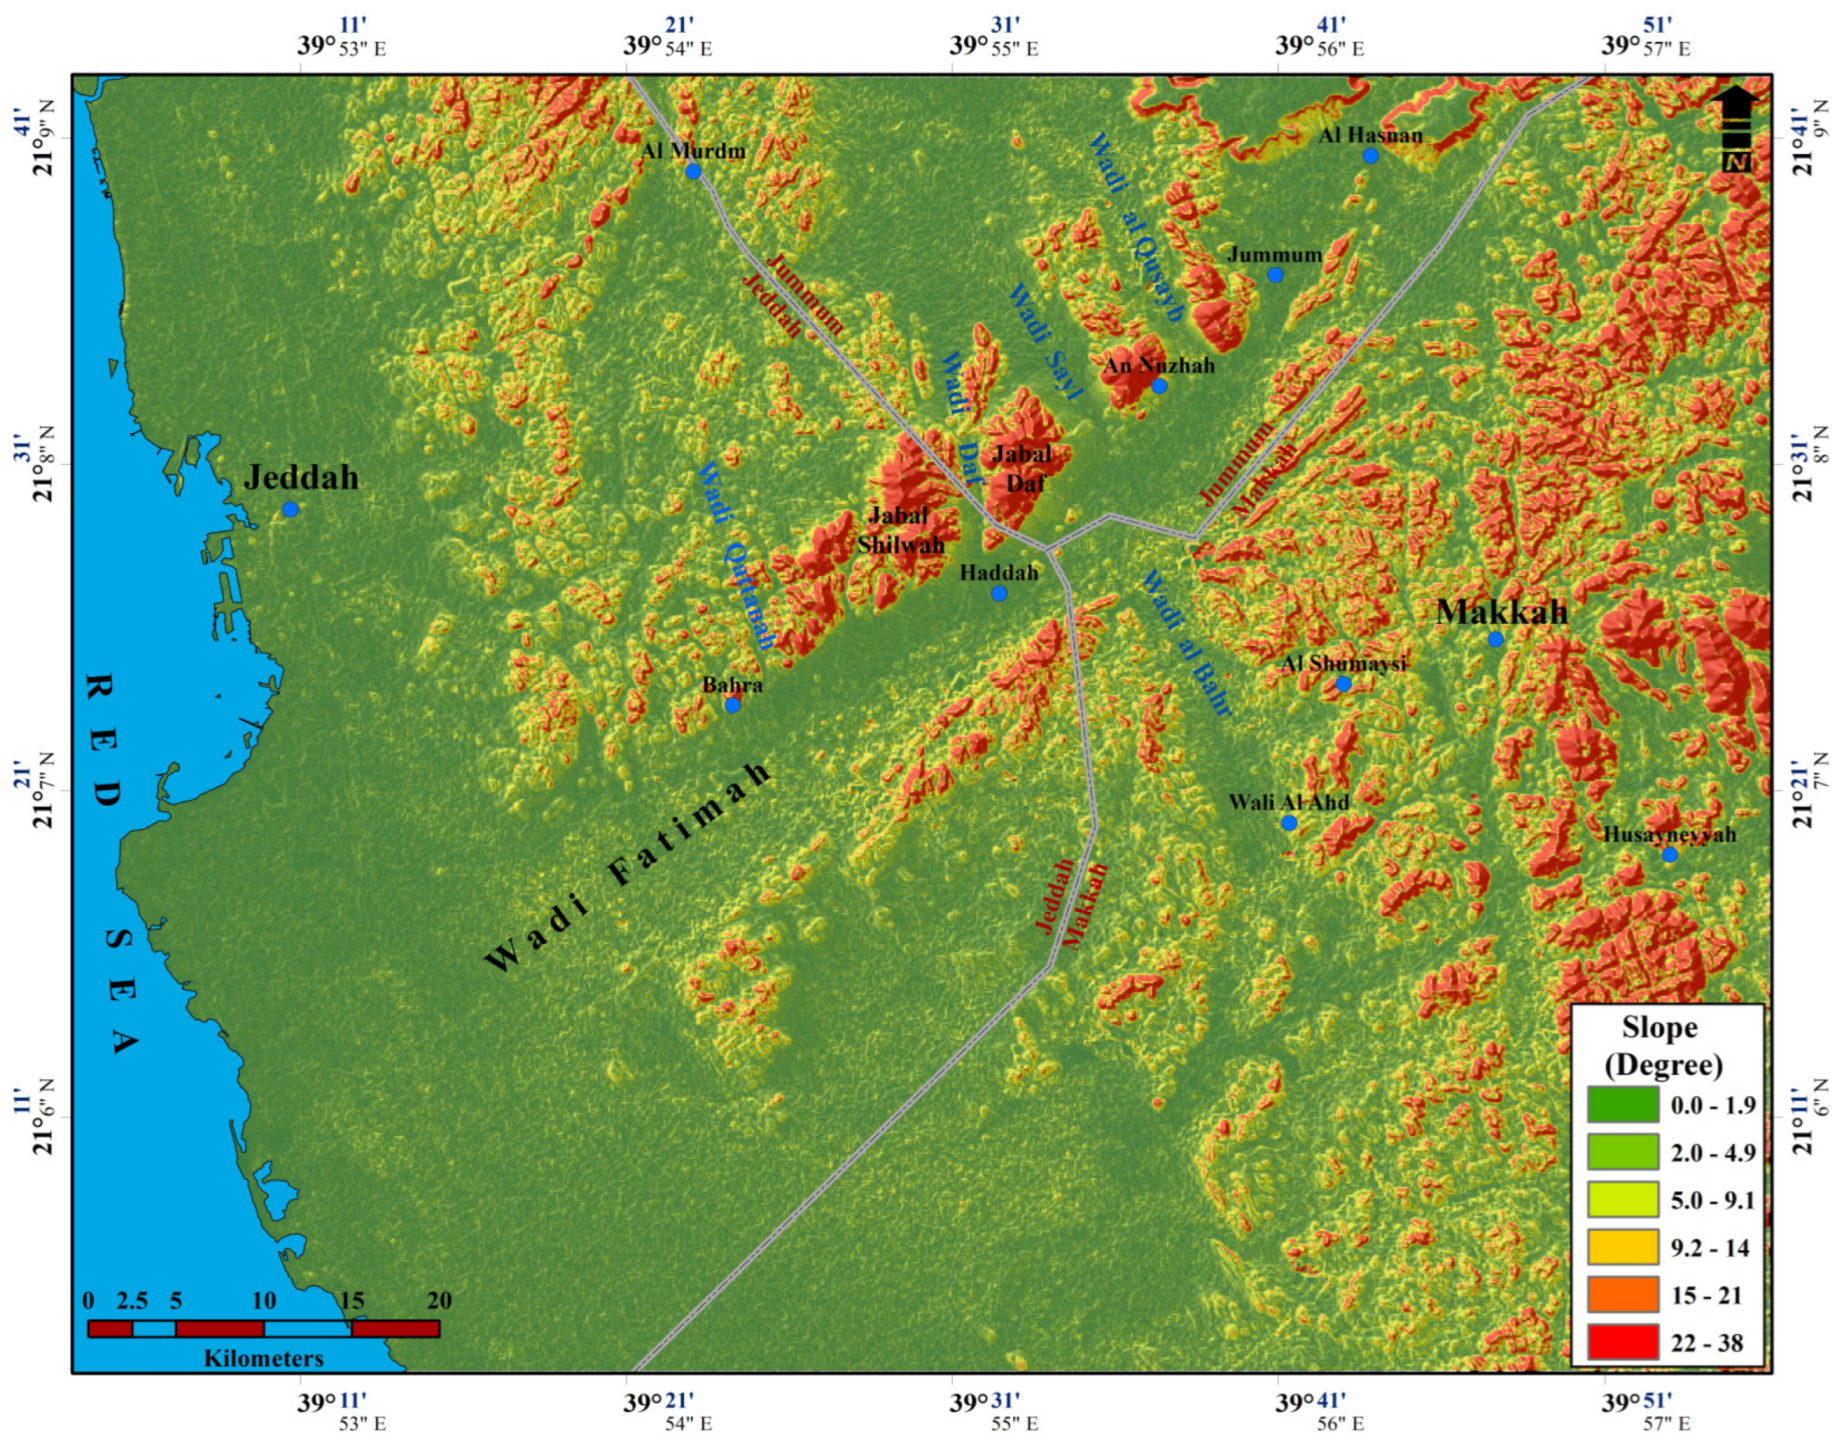
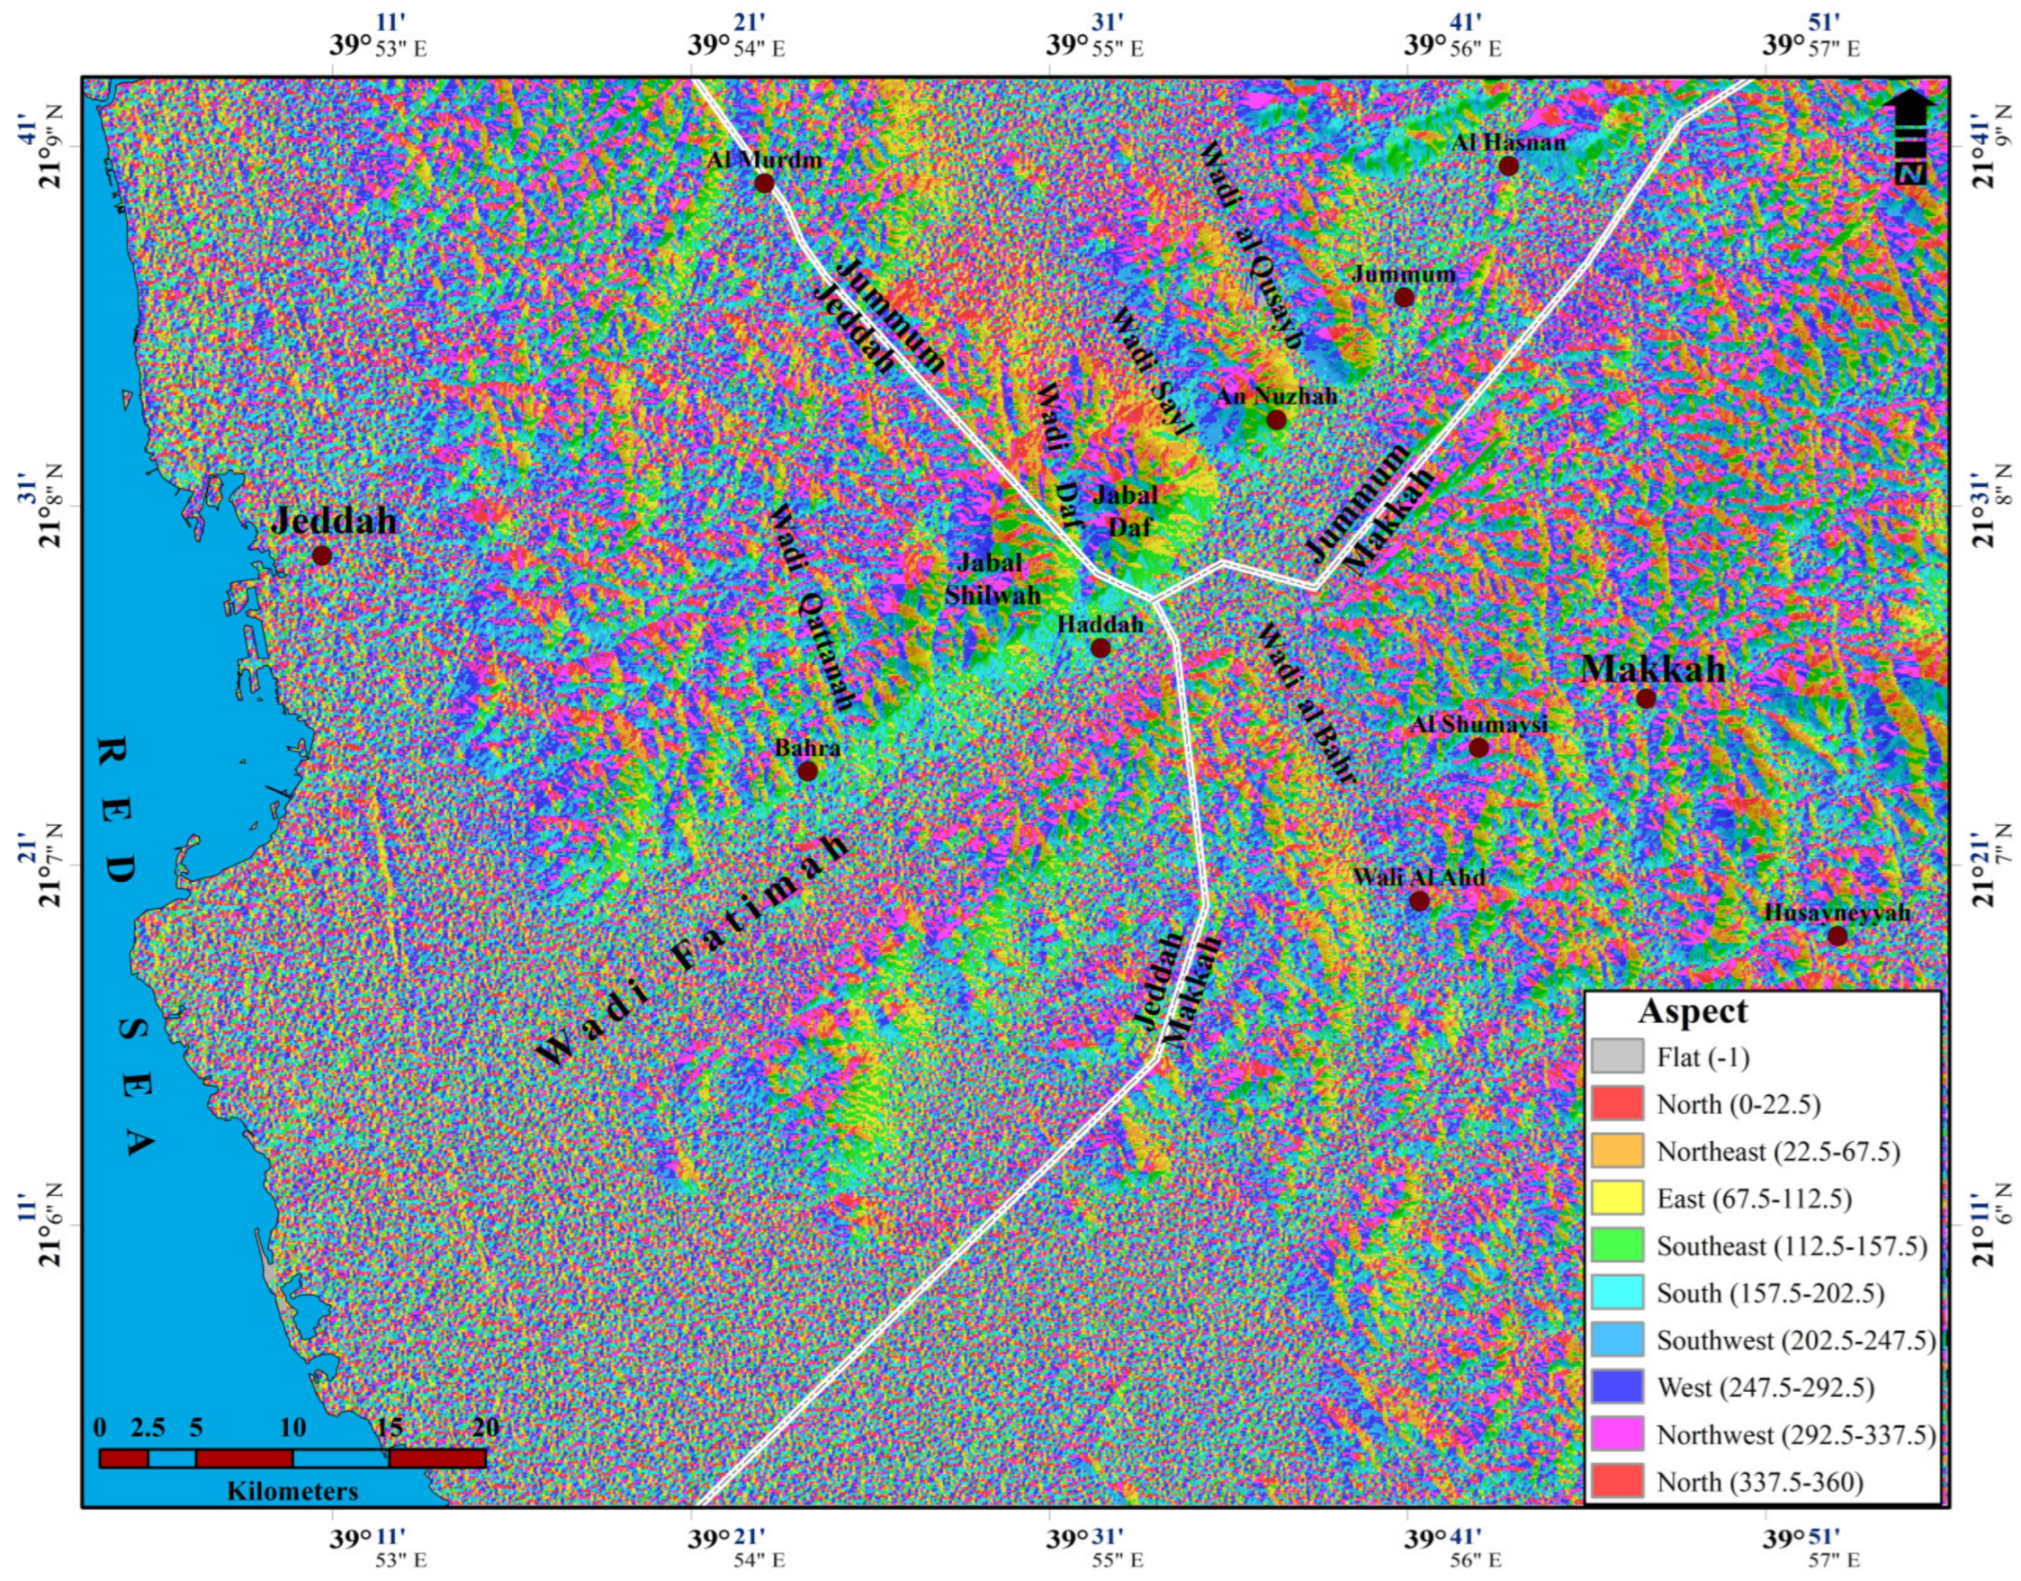
Jeddah city is located on a 15 km wide coastal plain with rising coral reefs and unconsolidated Quaternary deposits. To the east are the foothills of the Precambrian-rocked Sarawat mountains. Twenty-five kilometers south of Jeddah, Wadi Fatimah opens up onto the coastal plain. The wadi is a sizable, southwest-trending Wadi that has eroded along a significant structural zone or fault system. The Jeddah region’s fault zone is its most noticeable and persistent structural feature. One of the major tributaries in the Jeddah-Mekkah area is Wadi Fatimah. Broad alluvial fans and fluvial terraces made of material washed out of the rock exposures in Wadi Fatimah were created by extensive erosional processes [54,55,56]. In this study, the following spatial products and datasets were created. A 30 m resolution digital elevation model (DEM) was obtained. Such a DEM and resolution are crucial for mapping and evaluating disaster risks, as well as for preparing for, responding to, and preventing disasters. Each pixel in the DEM was used to represent an elevation value. The hydrological processing tool in ArcGIS was used to delineate the Wadi Fatimah basin from the Global Digital Elevation Map (http://earthexplorer.usgs.gov/ (accessed on 23 February 2023)). The basin’s minimum and maximum elevations range from 0 to 933 m, with an average elevation of 466 m AMSL (Figure 2). Furthermore, the slope degree has a significant impact on how much surface water infiltrates into the ground. When it comes to groundwater, low-sloped areas can hold rainwater and allow it to percolate into the subsurface, replenishing groundwater. A steep slope, on the other hand, causes runoff to travel faster, allowing less time for water to settle on the ground surface and, as a result, lowering the capacity for groundwater recharge. Because the slope varies with elevation, this information necessitates the recognition of topographic features. The slope in the study area ranged from 0° to 38° (Figure 3). The majority of Wadi Fatimah had slopes ranging from 0° to 9.1°, with highlands having slopes ranging from 9.1° to 38°. The ground surface typically slopes toward the Red Sea. Surface features are determined by various lithologies, tectonic movements, weathering, erosion, climatic influences, and geological formations. Moreover, the slope aspect with a 10 m spatial resolution was retrieved from the DEM. The slope aspect is the horizontal direction that mountain slopes face (Figure 4). The Wadi Fatimah basin’s morphology and weather characteristics are affected by this layer.
The geological setting is the key element of aquifer hydrogeological properties because it governs how aquifers recharge [57]. Wadi Fatimah is a sedimentary basin with a diverse range of geological rock units ranging from Quaternary to Jurassic formations, with a Tertiary predominance. The Granite dominates the study area’s center. The thickness of the Quaternary wadi fill deposits in the Fatimah basin ranges from 10–20 m upstream to about 80 m downstream. Mudstones, sandstones, and conglomerates make up these deposits. Wadi Fatimah, whose bedrock is made up of severely worn, fractured Arabian Shield igneous and metamorphic rocks, is another good location for groundwater preservation [58]. Furthermore, the porosity of this shallow aquifer ranges between 14% and 30%, with an average transmissivity of 140 m2/day and an average storativity of 0.1 [1,59]. These characteristics, taken together, indicate that the aquifer is unconfined and has moderate potential.
According to [60], the deeply cut gorges serve as gathering pathways for greater floods following the intense rains that fall on the higher portions of the Arabian Shield. These chasms (deep fissures) rise to elevations of more than 2000 m above sea level in the Wadi’s surrounding areas. Because surface characteristics are among the most important controlling variables for rainwater dispersion across the catchment, groundwater recharge points can be found in both main and sub-catchments. The sub-basins of the Fatimah catchment exhibit typical arid or semiarid characteristics, such as multiple segments of shallow and narrow ephemeral flow systems with irregular recharges. This catchment contains steep slopes with significant running water energy in the region of the Harrat Rahat basaltic area in the northeast and close to the Hijaz Escarpment in the east, which reduces towards the lowlands where thick silt accumulations occur. Because higher locations are predicted to have higher hydraulic conductivity values than lower locations, these locations are predicted to have high longitudinal groundwater seepages. The aquifer thickness in this location is the thinnest along the entire wadi.
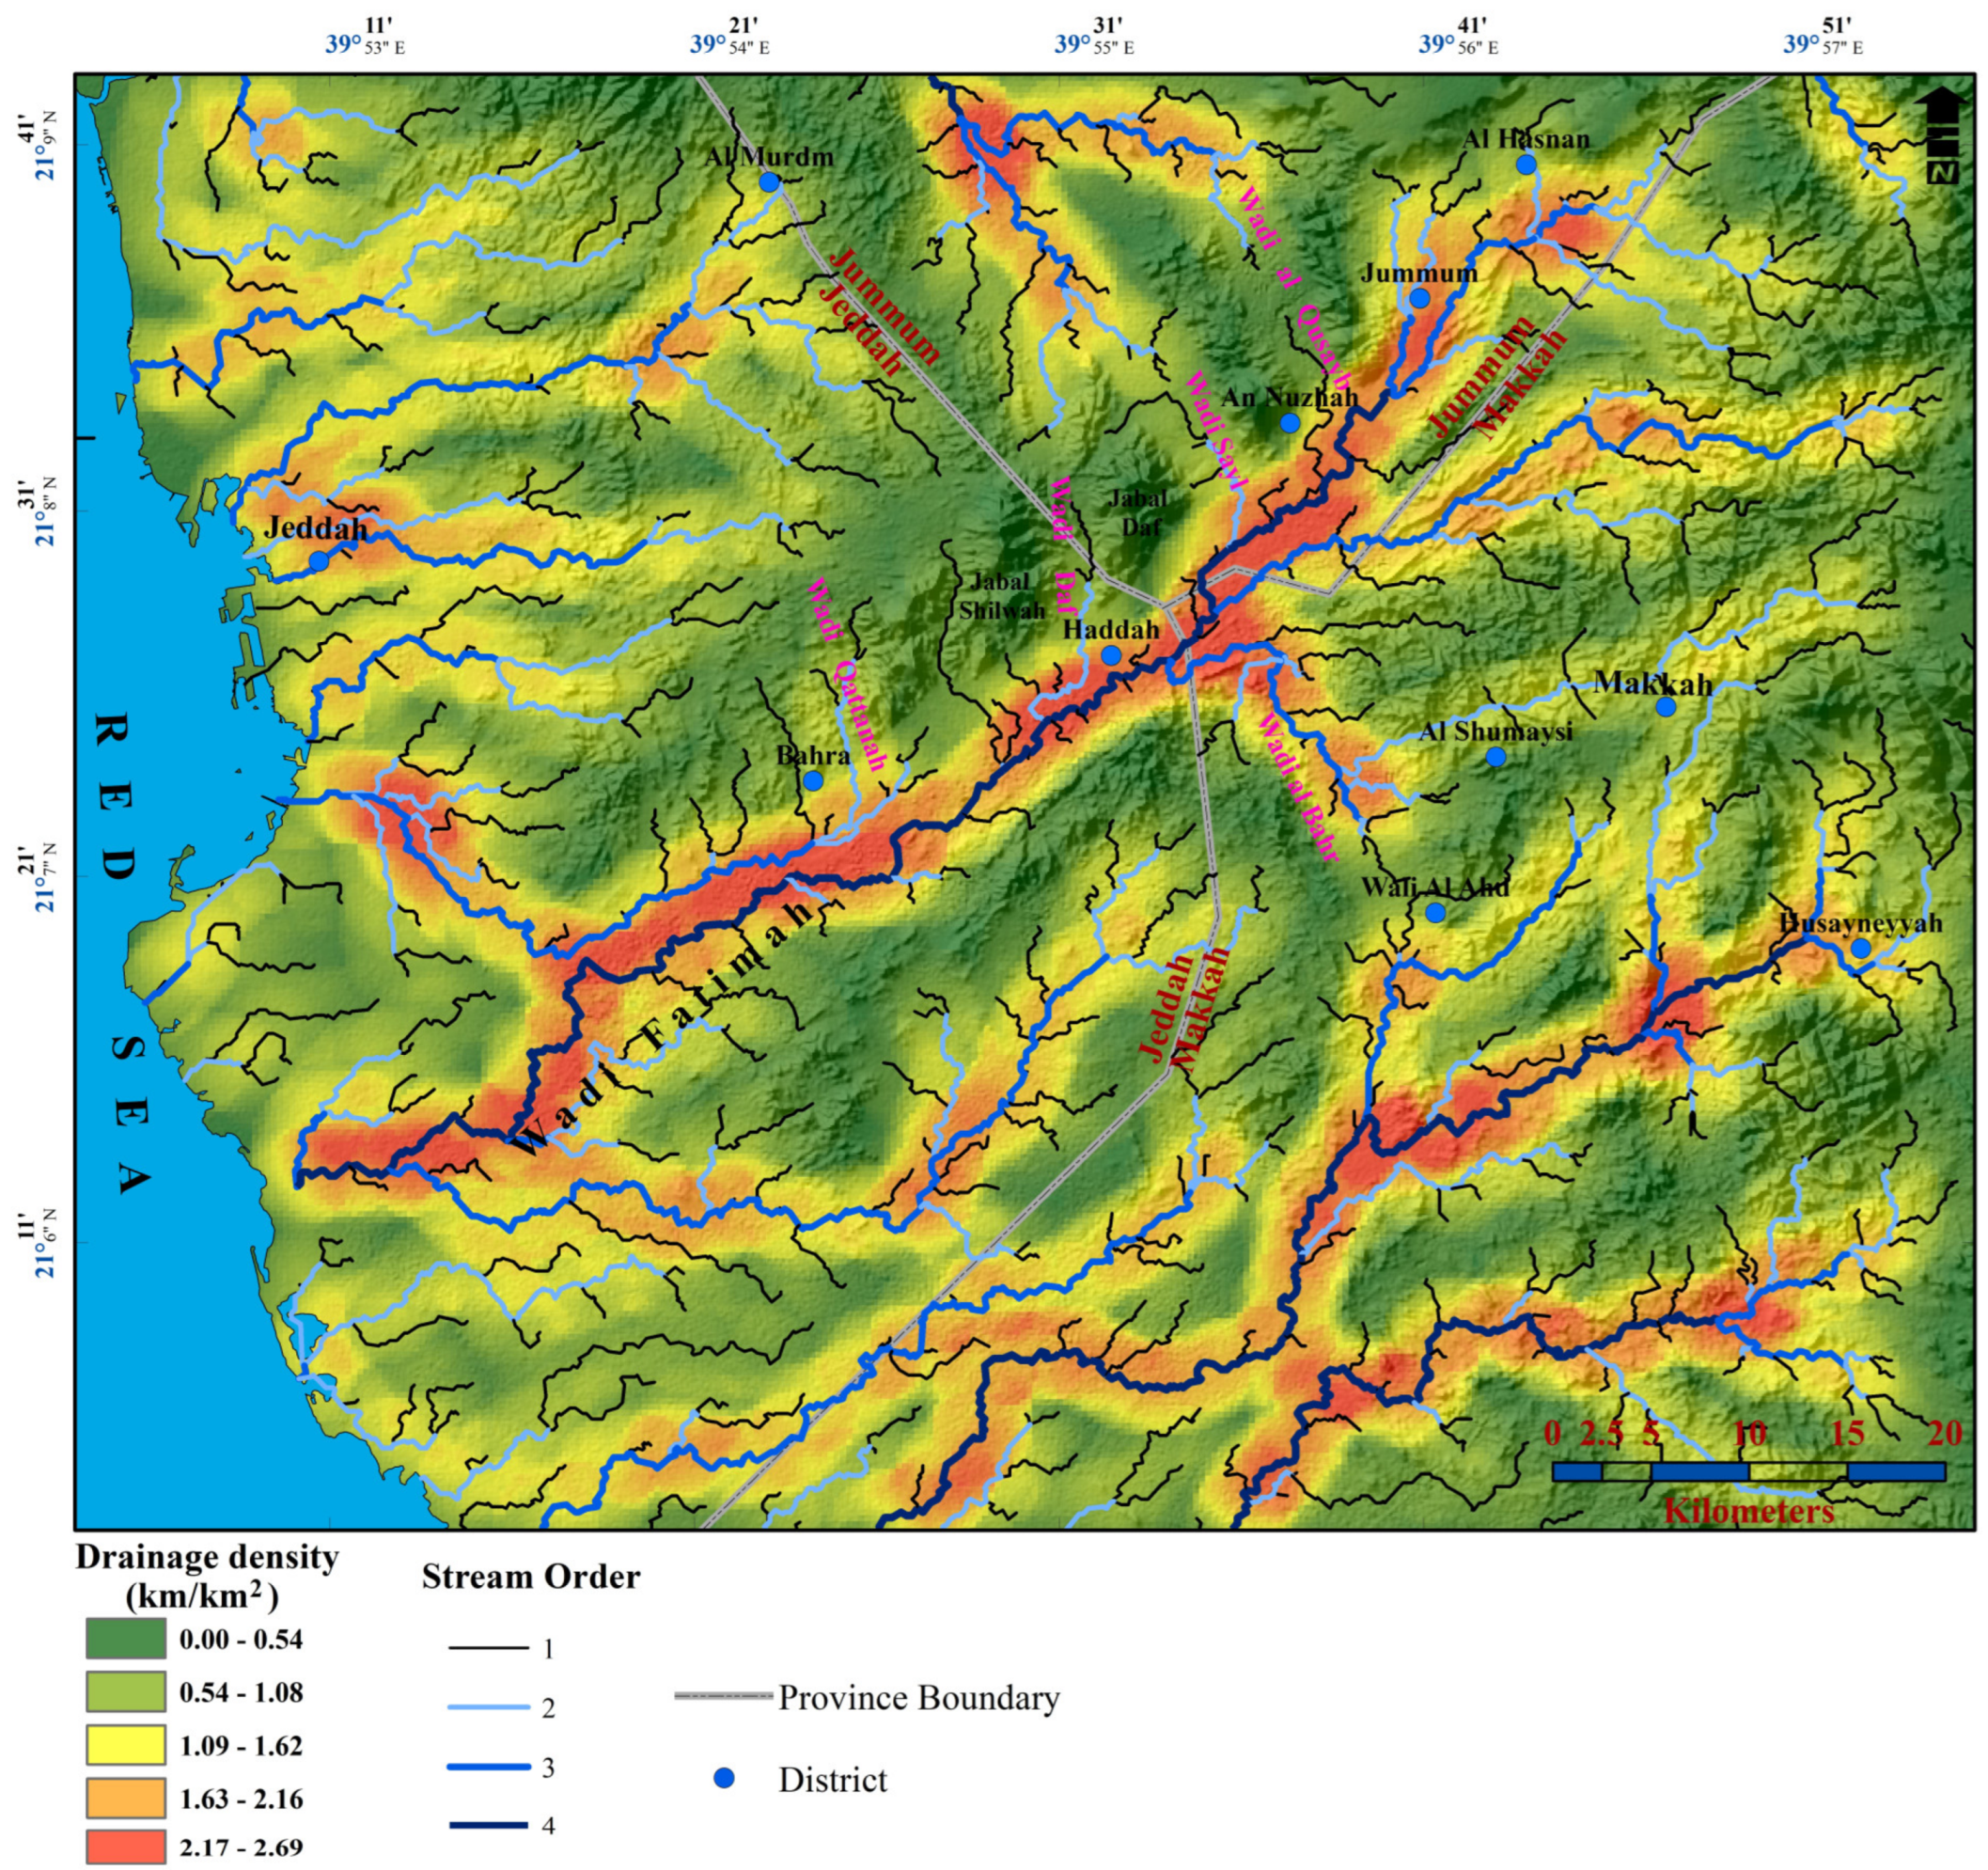
Drainage density is one of the most important factors to consider when assessing potential runoff [61]. A drainage basin with many tributaries has a higher stream density than a basin with few tributaries. Drainage density varies by watershed and is determined by infiltration capacity, or the soil’s ability to absorb water [62]. Water will flow overland and form streams when infiltration is low. Infiltration is greatest in sand, gravel, and limestone, while it is least in shale or clay. The drainage network in the current study (Figure 5) is dendritic in nature and is influenced by topography. Stream ordering [63], the mean of the branching ratio, total drainage length, drainage frequency, and drainage density are all examples of linear physiognomies. Strahler’s method of stream delineation indicates that the study area in Wadi Fatimah is drained by a fourth-order stream that flows northeast to southwest. The drainage density was calculated to better understand the underlying geological formations. Drainage density spatial and temporal evolution is influenced by a number of factors, including subsurface geology [64], climate [65], and topographic relief and slope [66,67,68,69]. A high drainage density indicates a resistant subsurface material, which results in more runoff during rainfall events. The drainage density is 0.433 km/km2 and is typical of coarse drainage. Lithology, infiltration capacity, and topographic relief all influence drainage texture [70]. The low slope of the basement rocks has resulted in a coarse drainage texture (less than 2), which was calculated as 0.059, indicating further groundwater recharge from precipitation. The coarse drainage network represents permeable lithological units and sediments. The surface runoff is influenced by drainage density, with the risk of flooding increasing as drainage density increases.
2. Geologic Background of the Study Area
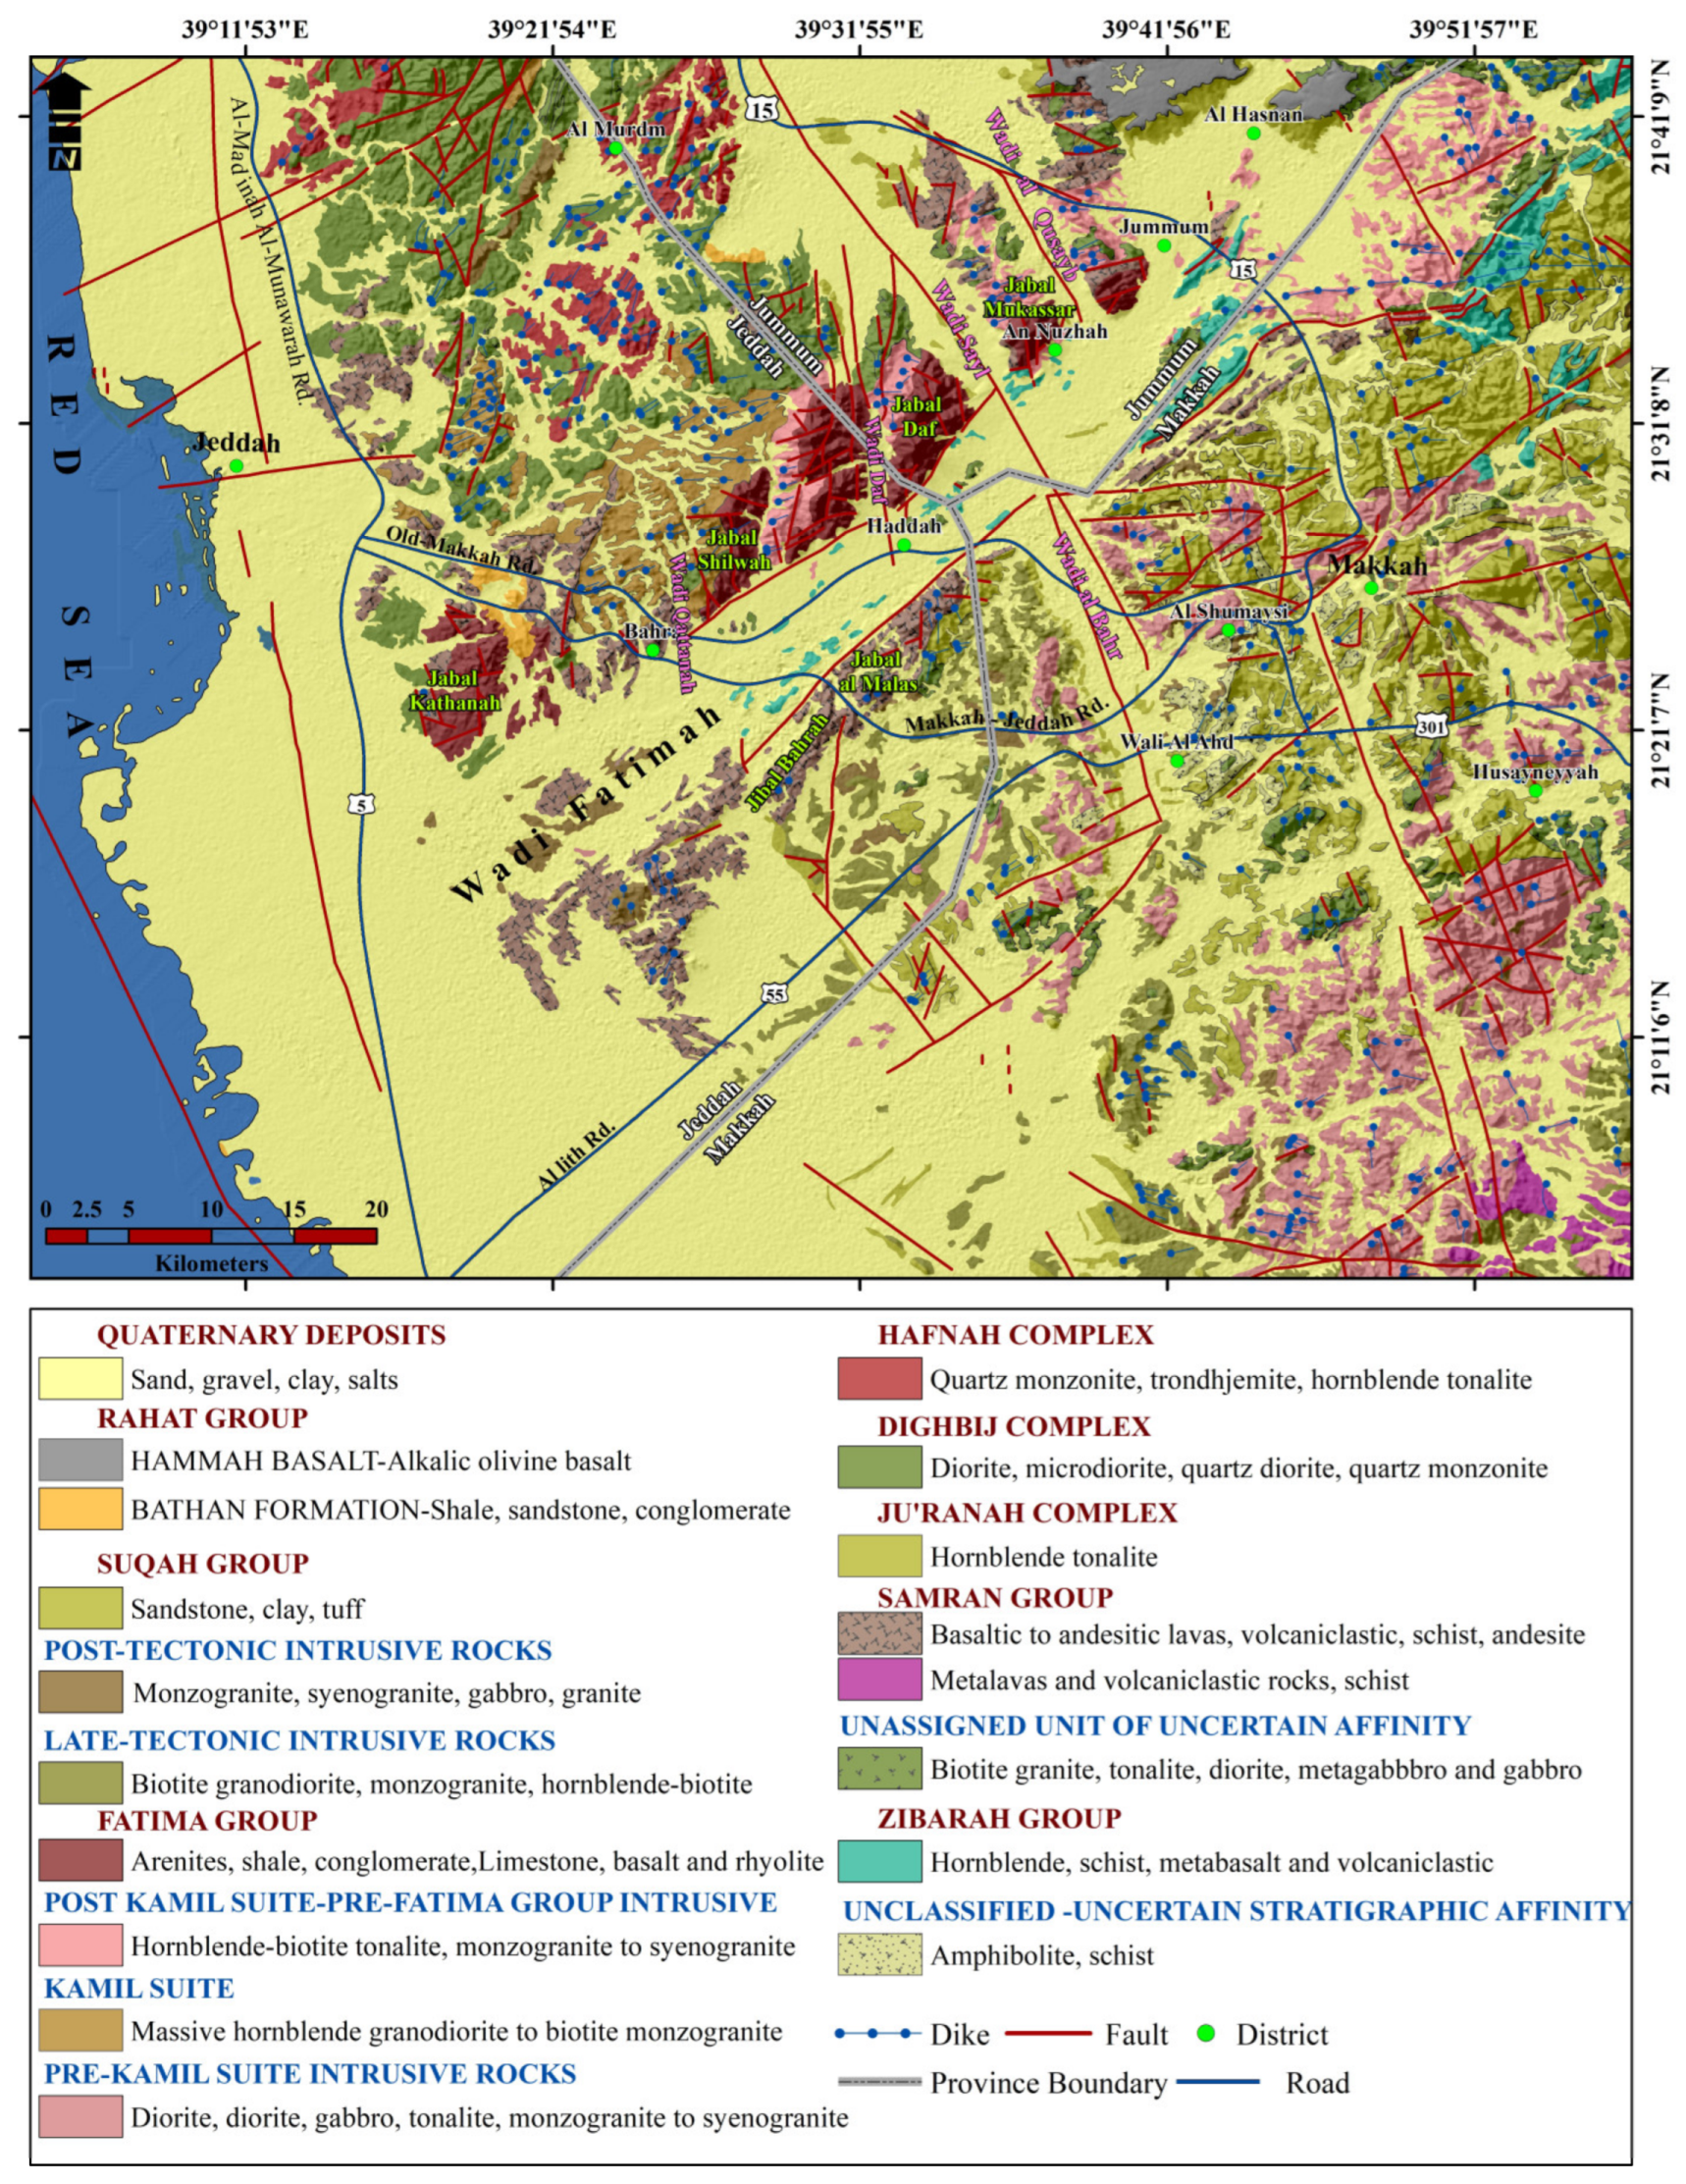
The western third (670,000 km2) of the Arabian Peninsula is made up of the Arabian Shield, a block of Pre-Cambrian rocks [71]. The main constituents of the Upper Proterozoic-aged shield are metamorphosed volcanic and volcaniclastic rocks that have been penetrated by several varieties of granites. The Arabian Shield and its counterpart, the Nubian Shield of Egypt and Sudan, was split apart from one another as the Red Sea began to open in Tertiary. The Arabian Shield is overlain by a vast arc of Phanerozoic sedimentary rocks from the Arabian Platform. The geological map of the Makkah quadrilateral produced [72] indicated that Wadi Fatimah is one of the main streams in the Jeddah-Mekkah area (Figure 6). With a downstream movement toward the SW and a NE–SW pattern, the Wadi empties into the Red Sea. A major graben with a fault boundary, Wadi Fatimah is up to 10 km broad at its southwest end and about 50 km long. The NE–SW major graben has an ancient faulting trend that is separated by numerous NW–SE faults because of Red Sea tectonics. The latter trend, which significantly affects the rock exposures on the NW side of Wadi Fatimah, has produced a series of steep horst blocks that are split by graben-controlled wadies. Wadi Faj, Wadi Al Kur, Wadi Daf, Wadi Shobairim, and Wadi Shoba are the most prominent horse blocks, and Wadi Abu Ghurrah, Wadi Mukasser, Wadi Daf, and Wadi Shubairim are the most notable tributaries. The younger faulting trend also has little impact on the SE flank of the wadi. The Precambrian limestones, mudstones, sandstones, and conglomerates that make up these mountainous horst blocks are composed of the Fatimah Formation, which rests unconformably on gabbroic, granitic, metavolcanic, and metasedimentary rocks [73]. The Fatimah Formation and older strata are invaded by younger Precambrian granites that make up enormous batholiths to the north of Wadi Fatimah. The exposed basement rocks have an extremely complex structural history, as shown by multiphase bending and thrusting, widespread faulting, and fracture [74].
The Oligocene conglomerates, sandstones and red siltstones from the Shumaysi Formation are exposed in the graben floors as sporadic, inconsequential-sized sloping outcrops. Large alluvial fans and fluvial terraces constructed of debris that washed off of the exposed sandstone have been left behind by the significant erosion that has taken place on the Wadi Fatimah flanks. The fans have come together to form an almost continuous apron at the base of the hills that spread out to form the fill of the main Wadi channel. The tilted Oligocene Shumaysi Formation is expected to be part of the subsurface succession that covers the basement rocks in Wadi Fatimah’s floor. The area under study contains Quaternary fan deposits, alluvial terraces, eolian sand, and alluvial wadi infill materials. This stratum is composed mostly of Tertiary sediments related to the Shumasysi Formation. Wadi Fatimah enlarge with the granite rocks exposed on their northern side as fractured mountains. On top of the granites, further sequences of sedimentary and meta-sedimentary rocks are deposited. The meta-sedimentary rocks are located on the Wadi’s southern side; sand and gravel that are unconsolidated, and moderately to poorly sorted, comprise the Wadi fills that make up the Tertiary and Quaternary deposits. The size, shape, sorting, and alluvium thickness of these deposits all vary significantly [72,75]. The Quaternary sediments, which are mostly the product of the parent rock’s weathering, are the largest of the surficial deposits. In the downstream section of the research area, the wadi deposits transition from layers of coarse sand, gravel, and pebbles to layers of fine sand and clay. The thickness of the alluvium varies widely; in the upper part of the area, it is only about 4 m thick, and in the lower areas, it gradually increases to 15–20 m. Hence, it is expected that both the Quaternary wadi fill deposits and the fissures and cracks in the bedrock will recharge the groundwater.
3. Materials and Methods
A multi-electrode resistivity meter system is now used primarily for 2D electrical resistivity tomography. Such surveys employ a series of electrodes spaced evenly along a straight line. The active electrodes for each measurement are then automatically selected by a computer-controlled system [76,77]. The length of the array limits the maximum depth penetration in ERT investigations. A combination of four electrodes is used to measure the apparent electrical resistivity distribution of the subsurface. It is possible to calculate apparent resistivity using a derivation of Ohm’s Law by injecting a DC, or very low-frequency AC, between a pair of electrodes and measuring the resulting electrical potential difference with the second pair of electrodes. The resistivity method is used to determine the resistivity distribution of subsurface materials. The resistivity values of some common rocks and soil materials are shown in Table 1 [77]. High resistivity values are common in igneous and metamorphic rocks. The degree of fracturing determines the resistivity of these rocks. Since the water table is generally shallow, fractures are frequently filled with groundwater. The greater the fracturing, the lower the rock’s resistivity value. For example, the resistivity of granite varies from 5000 Ω.m in wet conditions to 10,000 Ω.m in dry conditions. When these rocks are saturated with groundwater, the resistivity values range from a few Ω.m to less than a hundred Ω.m. Soils above the water table are drier and have higher resistivity values in the hundreds to thousands of Ω.m range, whereas soils below the water table typically have resistivity values of less than 100 Ω.m. Furthermore, clay has a much lower resistivity than sand. A soil’s or rock’s resistivity is determined by several factors, including the amount of interconnected pore water, porosity, total dissolved solids such as salts and mineral composition [31,78,79,80].
3.1. ERT Data Acquisition
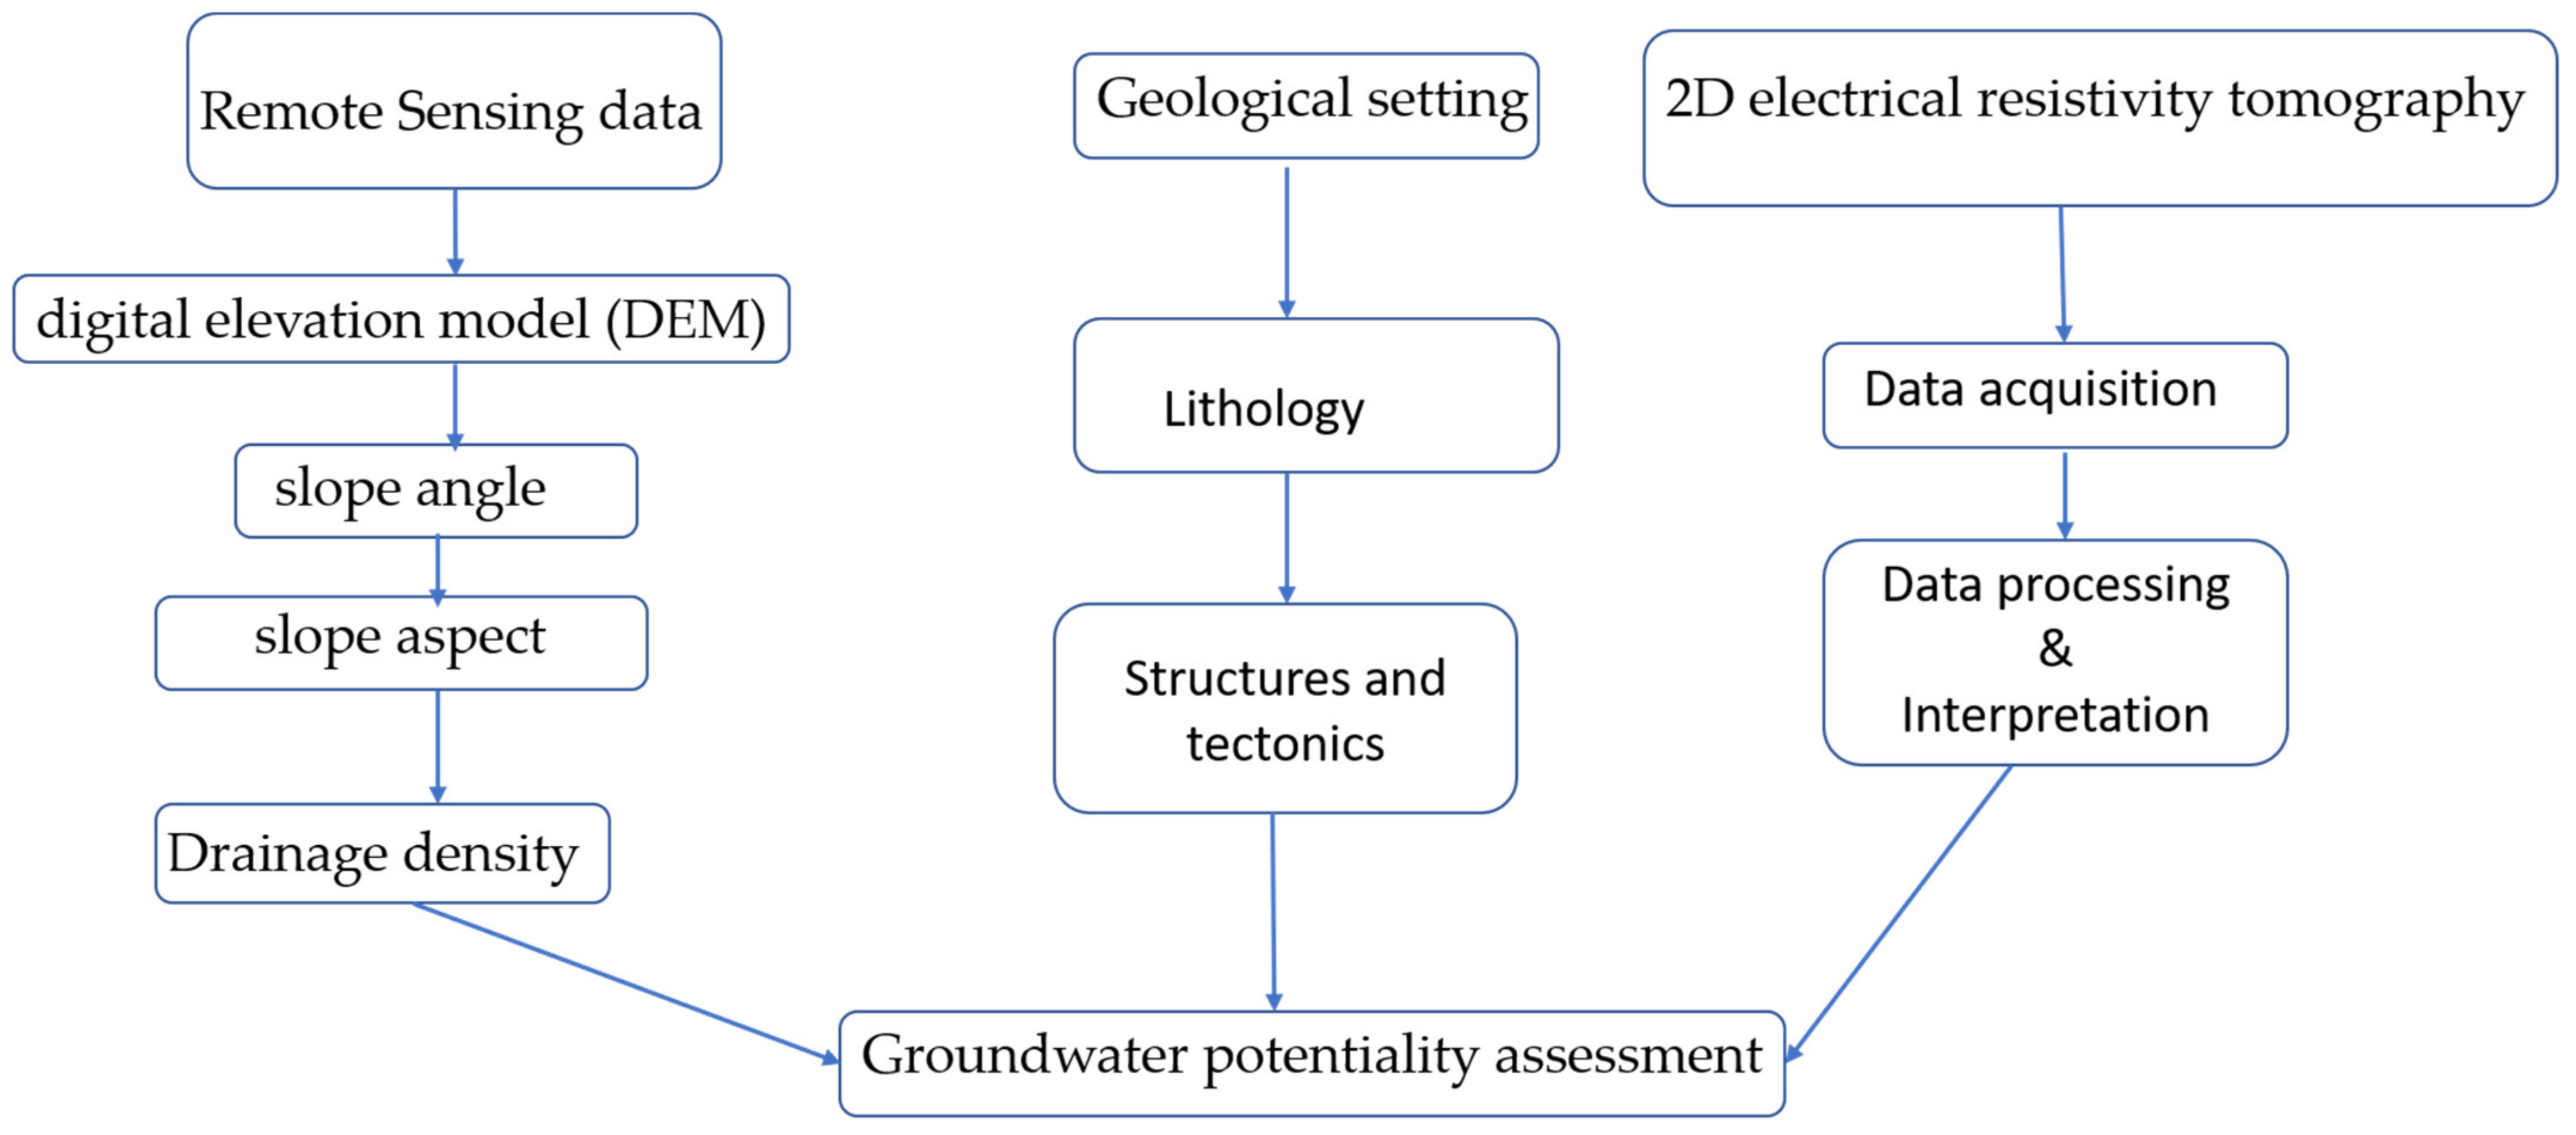
Electrical Resistivity Tomography (ERT) is a near-surface geophysical method that measures the earth’s resistivity using direct current. When an electric field is created in the ground, the electric voltage varies depending on the electric resistance of the various materials in the ground. The principle underlying surface electrical resistivity surveying is that the distribution of electrical potential in the ground around a current-carrying electrode is determined by the electrical resistivities and distribution of the surrounding soils and rocks. In the current study, data from the electrical resistivity tomography (ERT) survey were collected in January 2022 along with three profiles (Figure 1). The majority of electrical resistivity approaches demand that electrical currents be introduced into the subsurface using two electrodes that are firmly planted in the earth. It is possible to determine the variations in resistivity by measuring the consequent variations in electrical potential at other pairs of planted electrodes [81,82,83]. The resistivity survey was carried out in the current investigation using IRIS Instrument’s Iris Syscal Pro resistivity equipment (Oreland, France), which uses 922 electrode locations and a dipole-dipole array to offer good resolution [84,85]. For each profile, a varied number of electrodes were used to conduct a resistivity survey, with the electrodes spaced 3 m apart (Table 2). Using the Garmin Navigation System, stations were designated along survey lines (Garmin Ltd., Southampton, UK). The methodology followed in the present study is described in the Flowchart (Figure 7).
3.2. Data Processing and Results
The apparent resistivity pseudo-sections, which provide an approximation of the subsurface resistivity, are used to depict geoelectric data gathered during field measurements. IRIS Instruments’ Prosys II software was used to process resistivity field data. To create a realistic model that accurately depicts the continuous distribution of calculated electrical resistivity in the subsurface, noise and spiky values were removed. To eliminate measurements that are substantially impacted by noise, the electrical resistivity data were filtered. Moreover, the high and low resistivity values at several stations relative to the values at the nearby stations have been eliminated. Then, the software for quick two-dimensional (2D) resistivity inversion, RES2DINV, was used to perform the inversion technique [19,86]. The inversion algorithm is intended for the interpolation and interpretation of field data from electrical geophysical prospecting (2D sounding) of electrical resistivity. It is based on the finite element and finite difference regularized least-squares optimization approach [87,88,89]. The recent availability of automated data acquisition systems and efficient user-friendly inversion software has made it possible to obtain more reliable images of the subsurface using the electrical resistivity imaging technique [90].
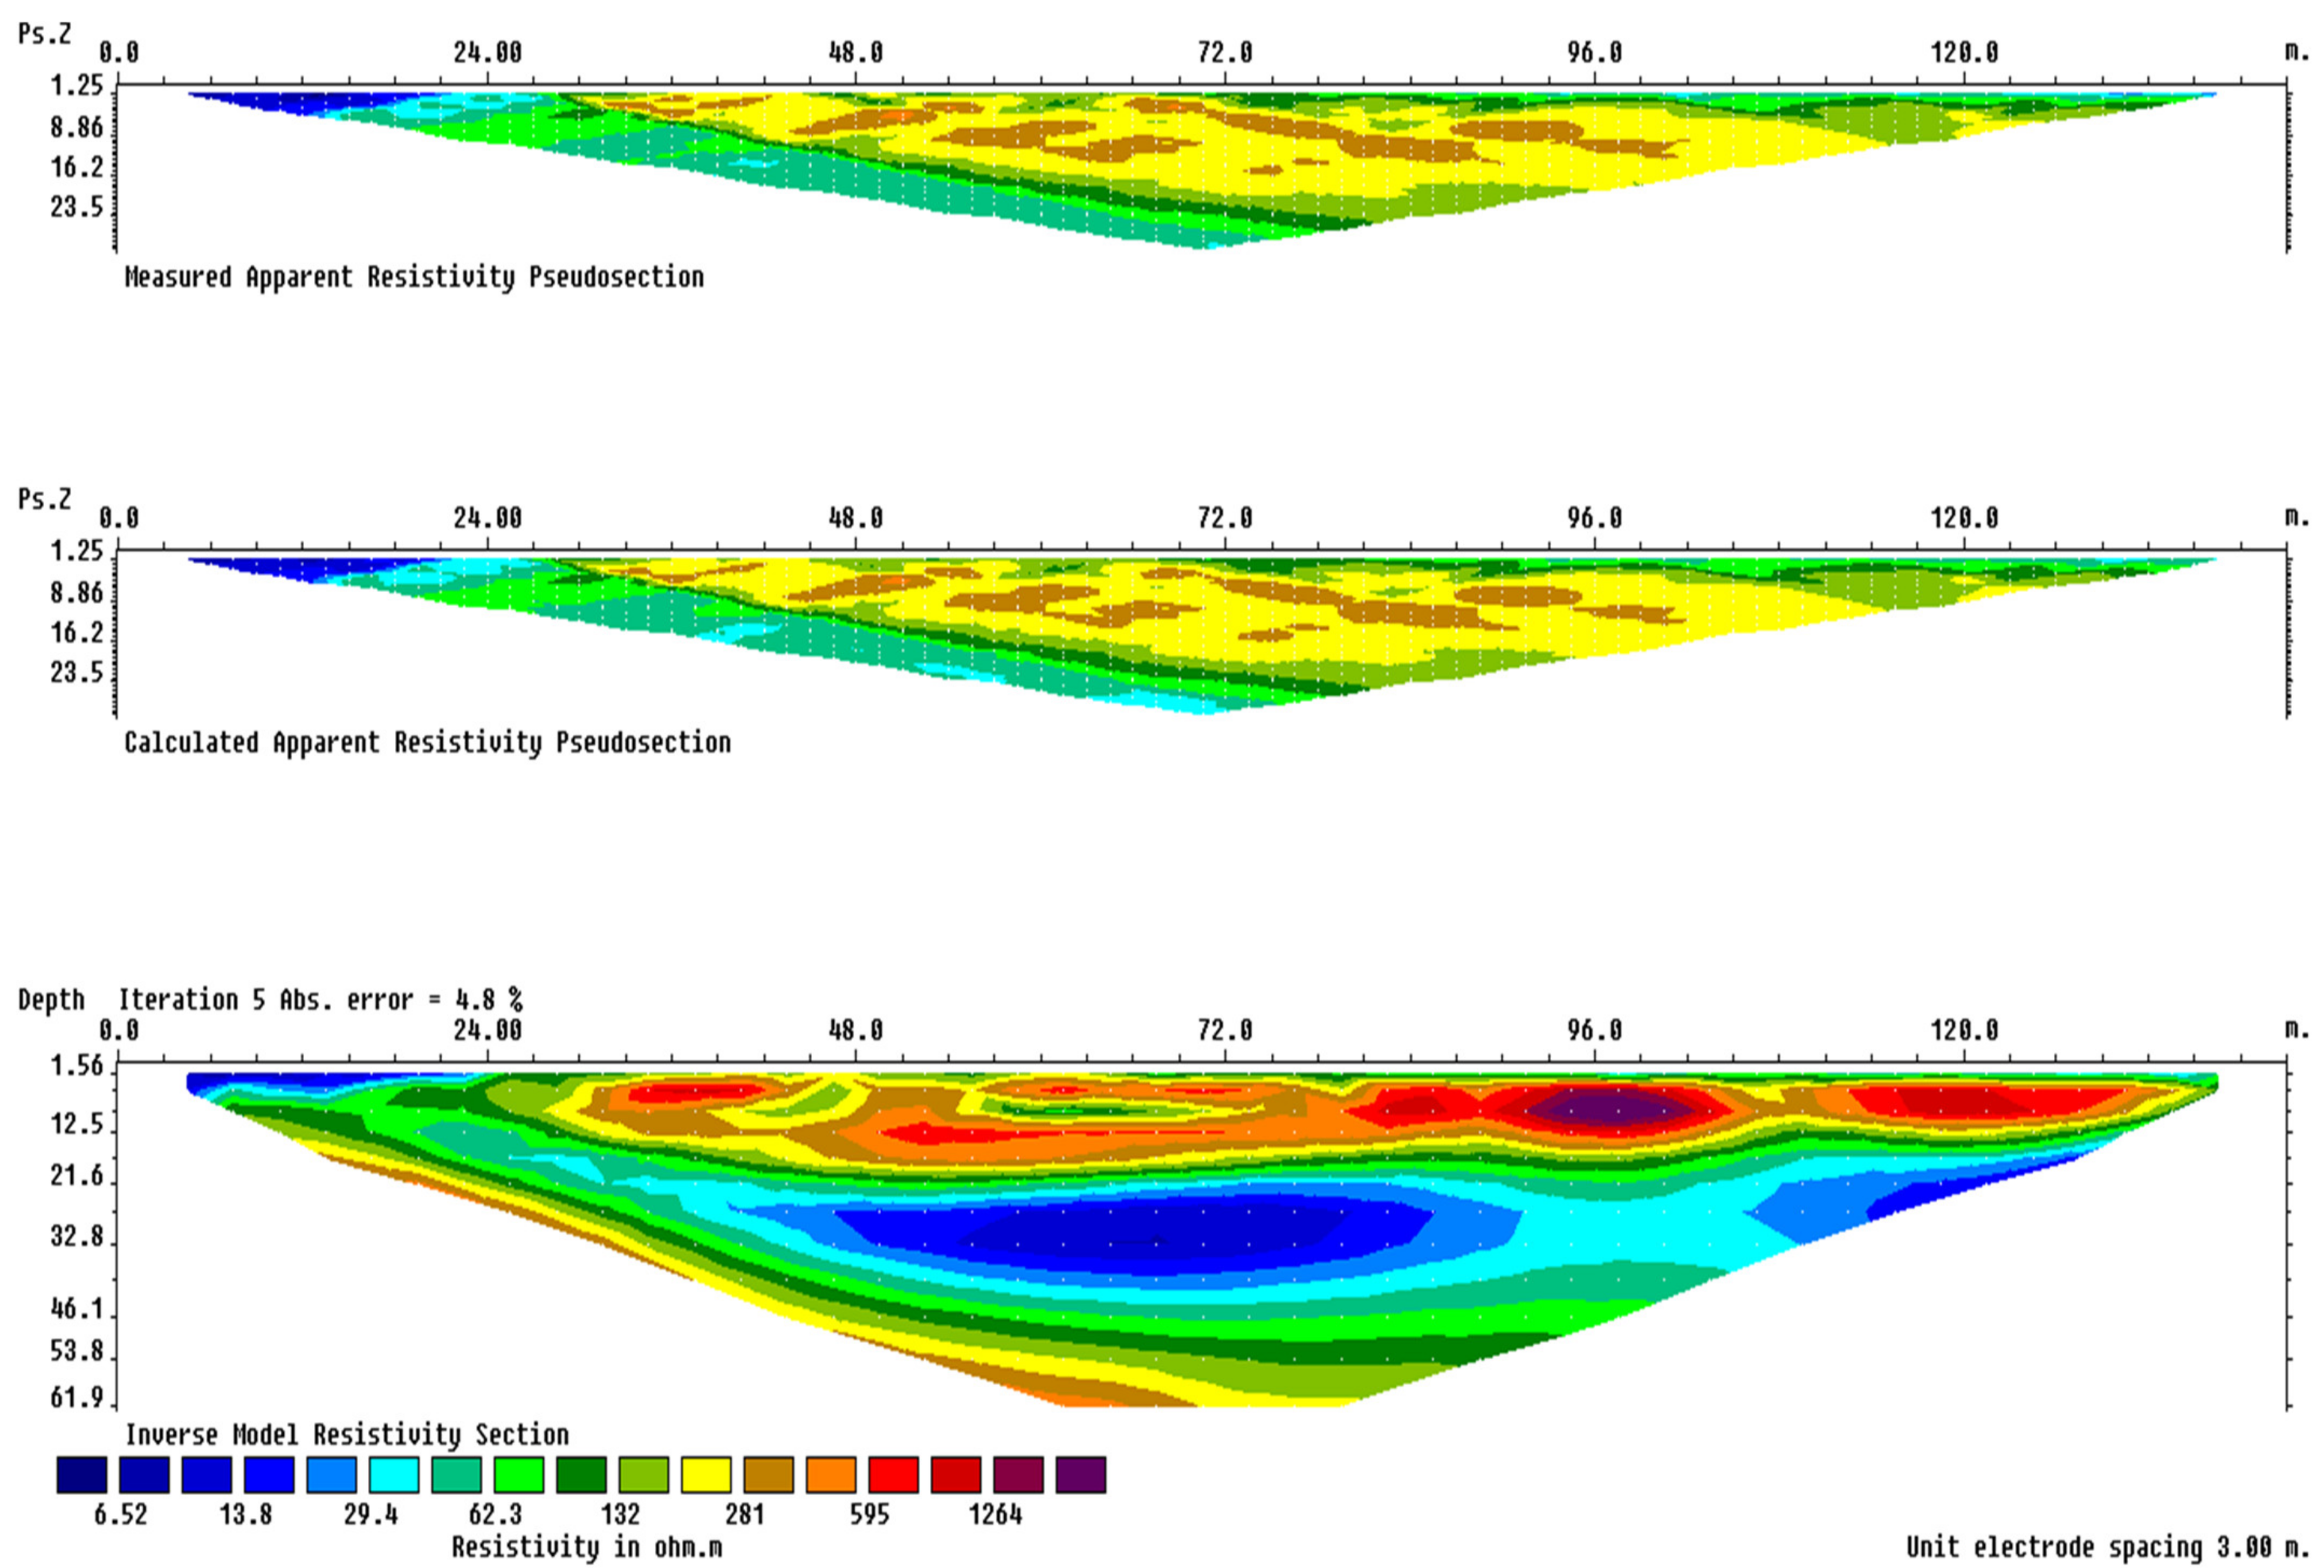
The model’s resistivity was changed via a number of iterations in order to lessen the discrepancy between the calculated and observed apparent resistivity values. A root-mean-square value can be used to quantify and depict this discrepancy between calculated and observed values (RMS). Although the final model should have a low RMS, this does not always mean that it is the most accurate geological model. Because of the substantial discrepancy in the resistivity values in our situation, some models exhibit low RMS error (less than 5%), while others exhibit high RMS error (more than 10%). If models with high RMS are more consistent with other profiles and better match the geologic background, they may be adopted in some circumstances. According to the ERT profiles, local variability in the subsurface resistivity caused resistivity values to vary vertically. The data inversion process, which is based on calculating the subsurface model in close proximity to the apparent resistivity one, was carried out using the optimization method. Once a good match between the calculated and measured parts was made, the model was modified iteratively. Figure 8 shows the results (pseudo, calculated, and the inverse model of the cross section) of the survey carried out at site 3 after inversions as an example.
4. Interpretation and Discussion
Row data with uncorrected apparent resistivity values are recorded as ERT data. This is due to the fact that the recorded values are a function of all parts of the subsurface through which the current has passed between electrodes. The apparent resistivity is converted to true resistivity using a numerical inversion or regression process, which produces a model with a theoretical apparent resistivity distribution similar to that of the field data. The first step in creating an electrical image is to build a pseudo-section. Each pseudo-section represents unprocessed apparent resistivity values visually. To evaluate anomalies observed in the inversion, compare an inverted cross-section with raw data.
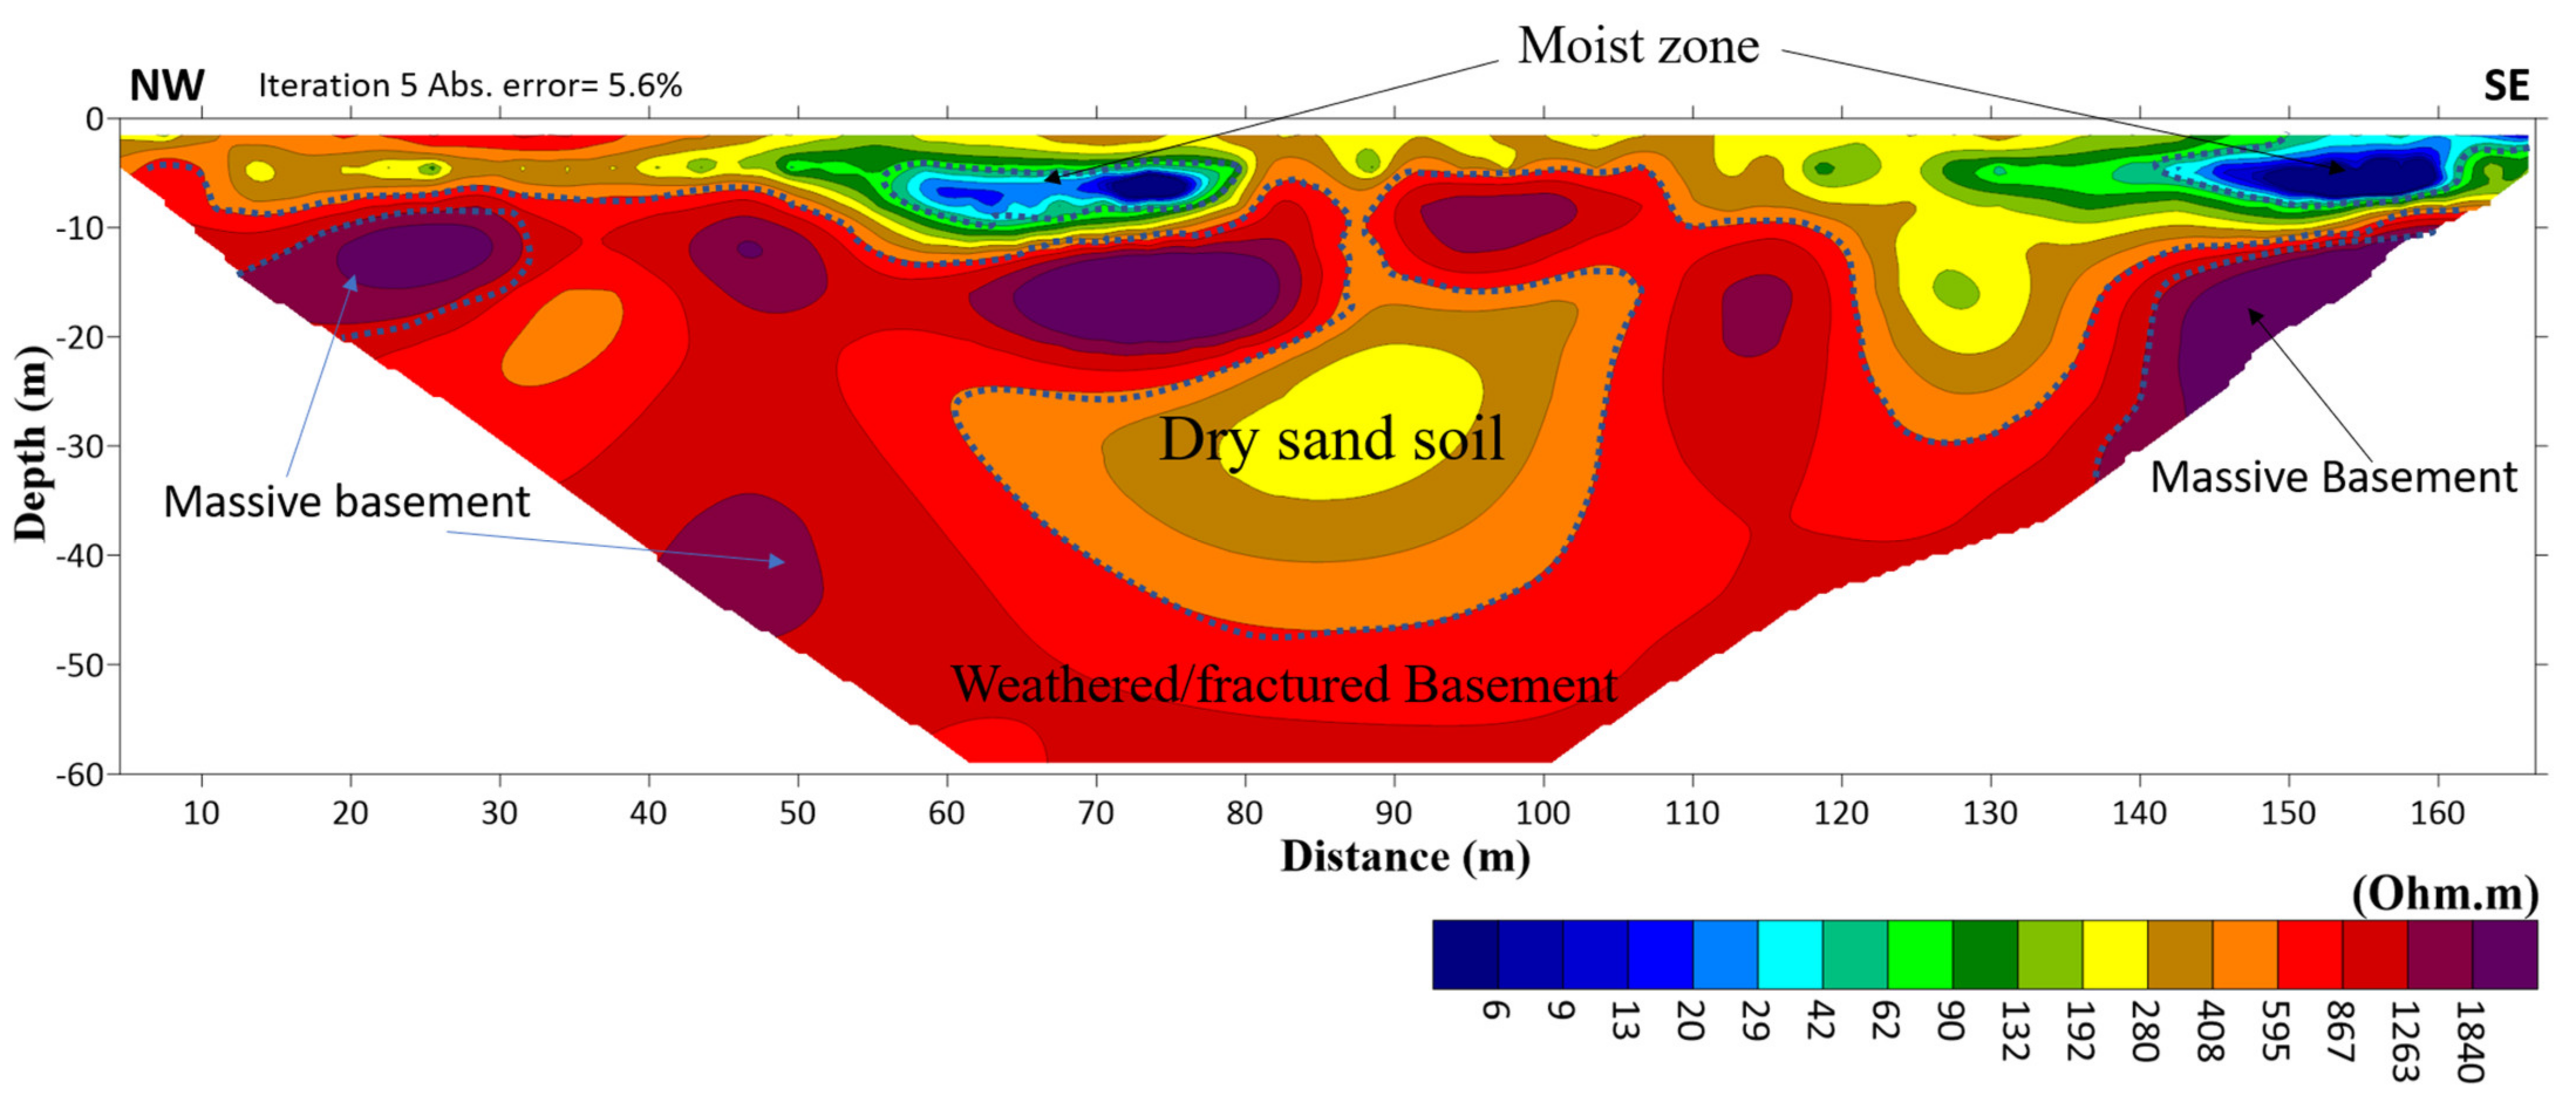
The 2D geoelectric cross-section of Profile no. 1 (Figure 9) extends E–W with fifty-eight electrodes and 3 m electrode spacings. The total length of this profile was 170 m. According to this section, the resistivity extends in the range of 9.17–1836 Ω.m through the whole profile. This profile shows two pockets of low resistivity (less than 10 Ω.m). The first one extends horizontally from 48 to 80 m (about 32 m) from the beginning of the profile, while the second pocket starts from 126 m and extends to the end of the profile (more than 40 m). Both pockets are of shallow depths (reaching 10 m in depth). These pockets represent moist zones of sandy soil deposits. Below these pockets, a high resistive zone appears where resistivity reaches 800 Ω.m. This zone extends down to a 50-meter depth and is represented by alluvial deposits. While there are some disseminated pockets of high resistivity values (more than 800 Ω.m), these small pockets represent the fractured/weathered basement rocks.
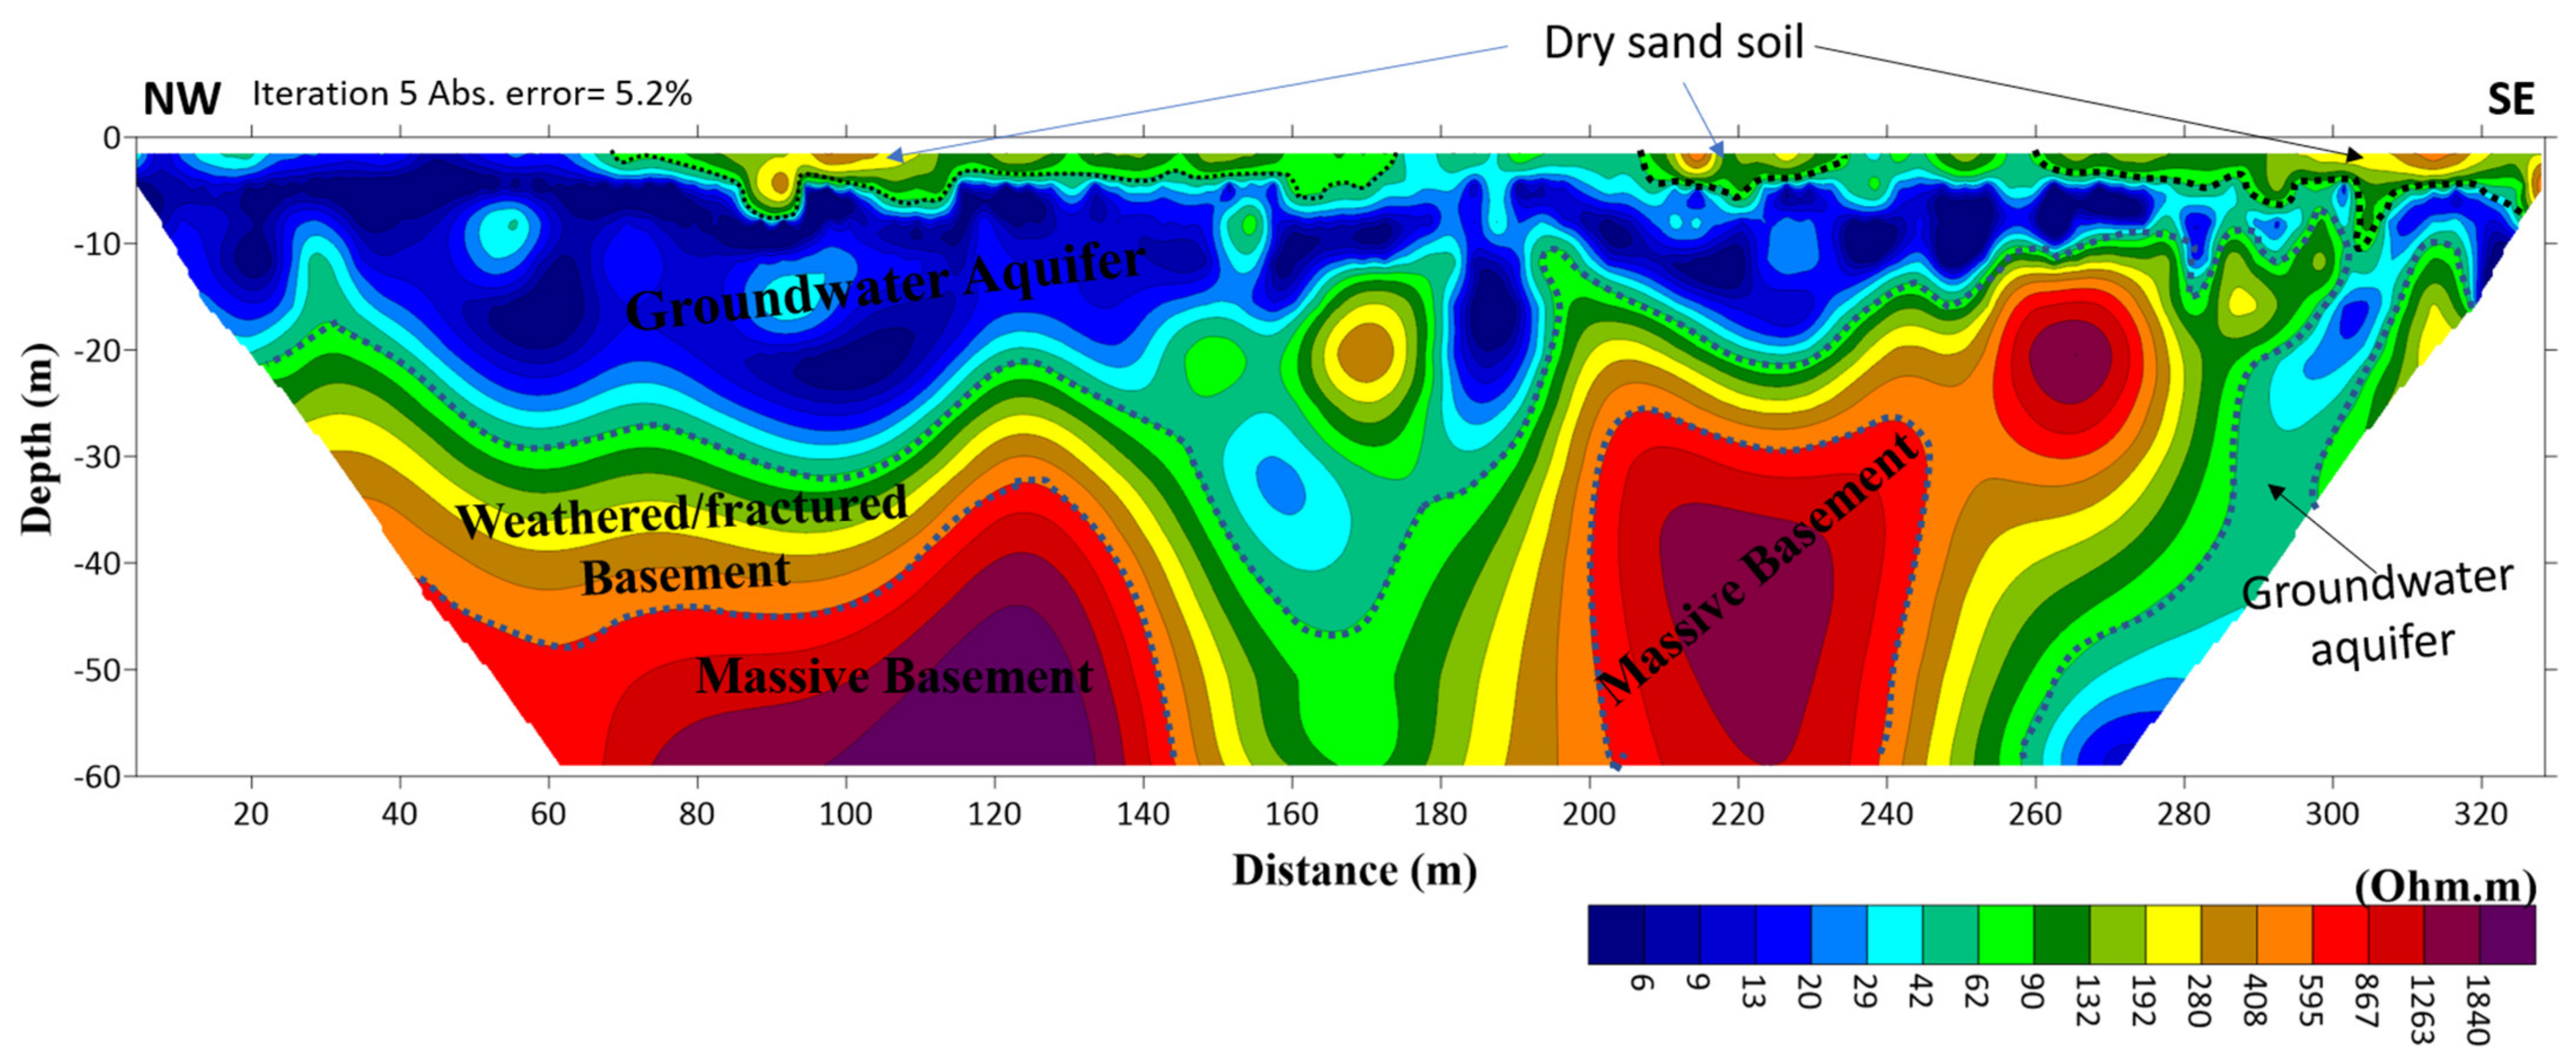
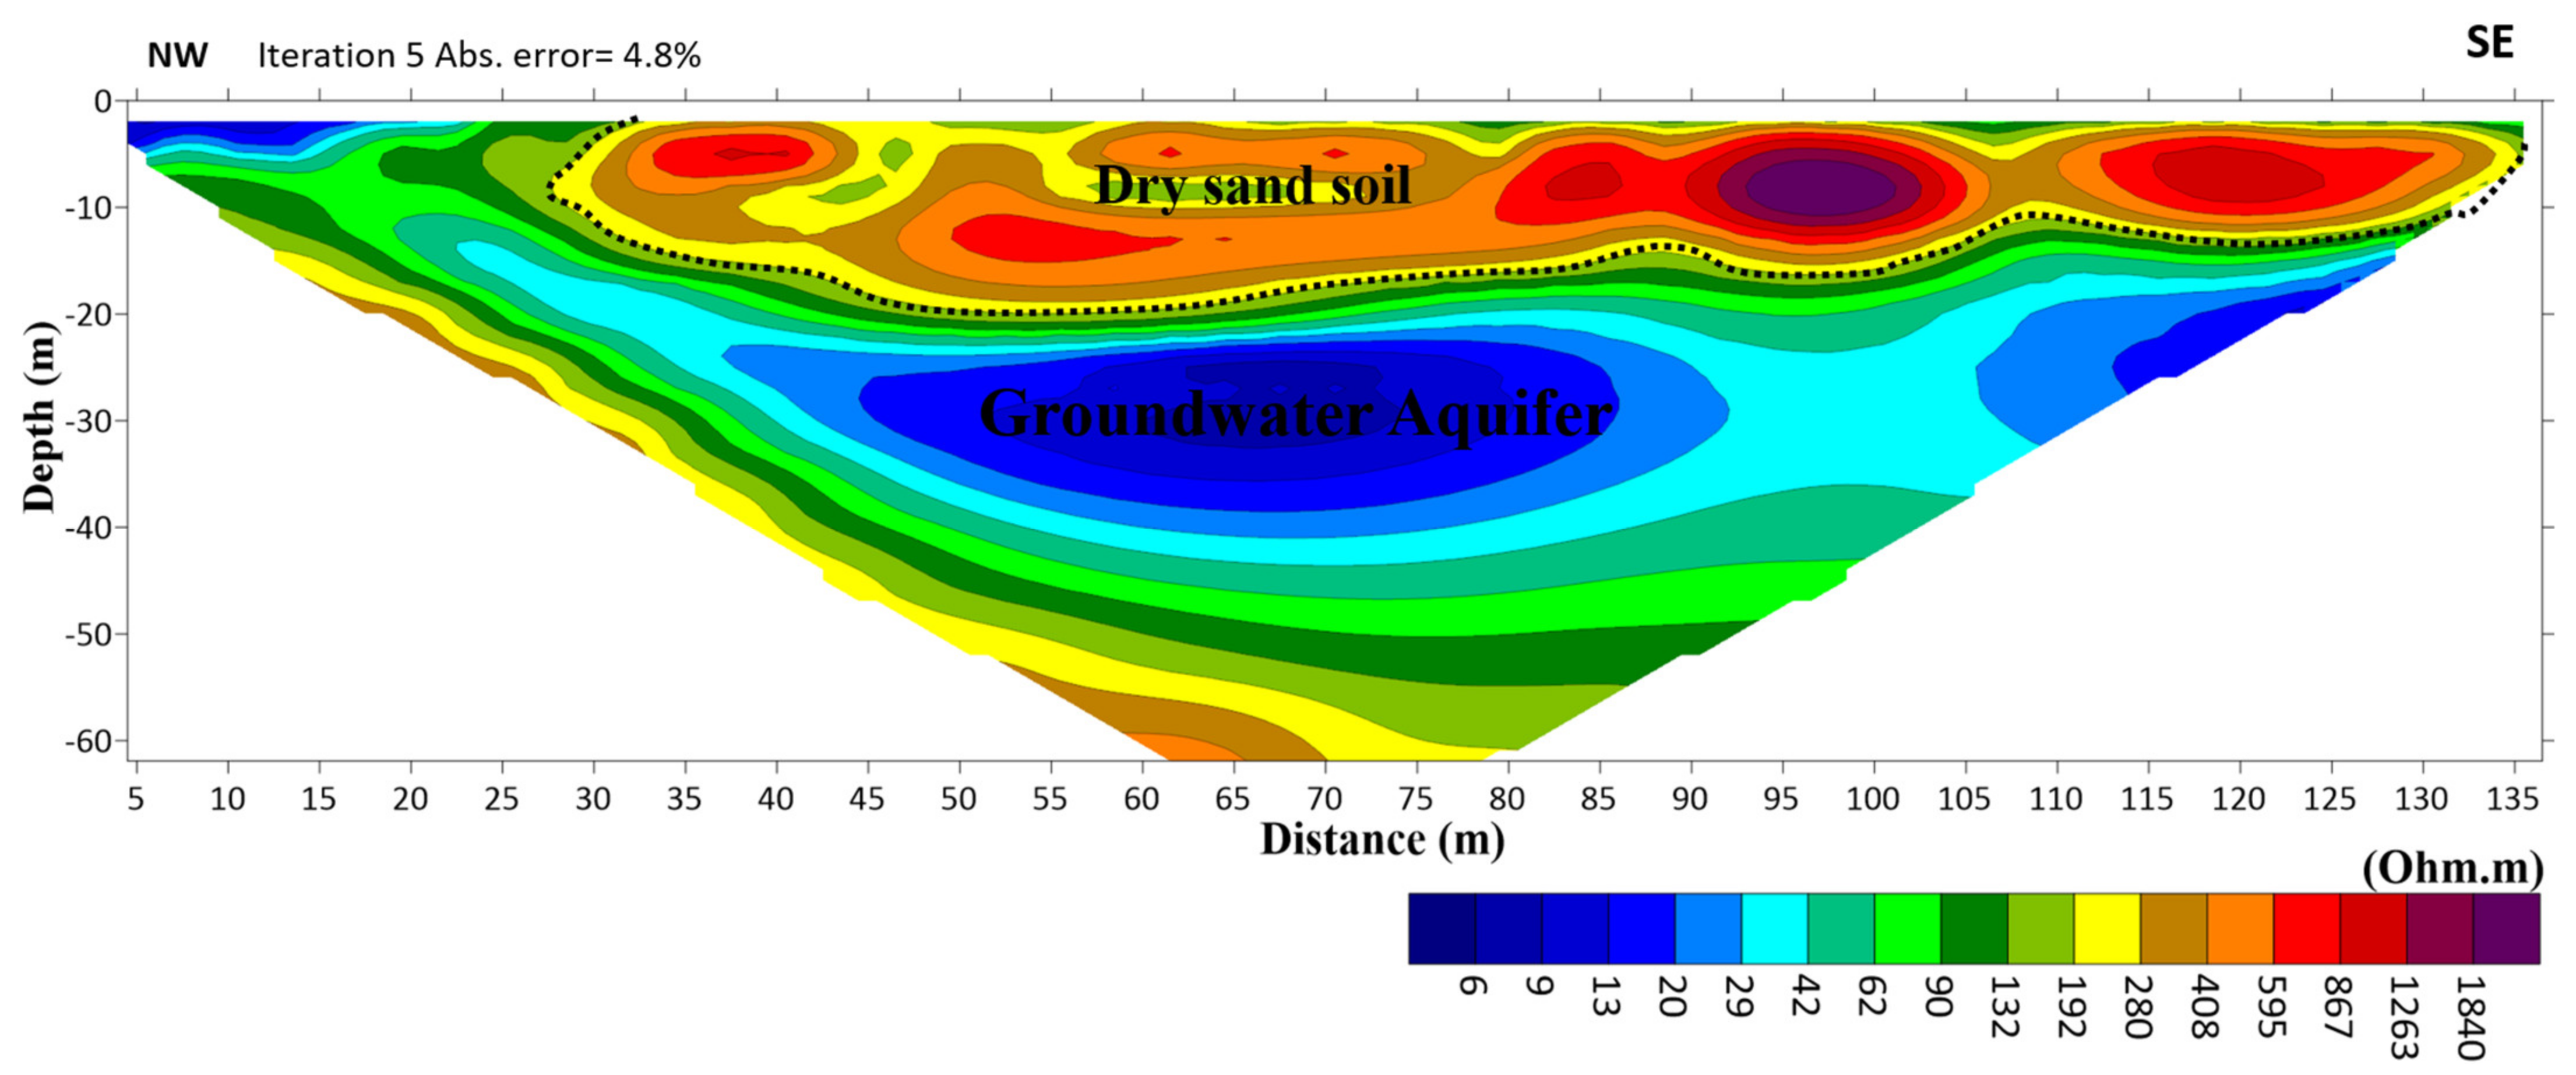
Figure 10 represents the geoelectric 2D model for Profile no. 2 where the range of resistivity varies between 6–1840 Ω.m. This figure illustrates a zone of low resistivity (less than 50 Ω.m) that covers the whole profile. This zone extends down to depth indicating the groundwater-bearing zone. Another zone has resistivity values from 50 to 800 Ω.m representing dry alluvial deposits. There are small and localized blocks with slightly high resistivity values (greater than 1000 Ω.m) in the southeastern and southwestern zones of the wadi. These blocks may be transmitted blocks of weathered /fractured basement rocks. In Profile No. 3 (Figure 11), the geoelectrical cross-section presents the shallow zone with high resistivity values indicating alluvial deposits, while the lower part of the section is characterized by a low resistivity zone (less than 50 Ω.m) representing the groundwater-bearing zone. This zone starts from 20 m depth and extends down to 50 m below the ground surface. Then, the high resistivity values appear again in the south and western zones of the profile indicating alluvial deposits or fractured/weathered basement rocks.
Based on the abovementioned results, it is revealed that groundwater potentiality in Wadi Fatimah is identified through ERT 2D geoelectric profiles. The type of groundwater aquifer is unconfined (please see Figure 7 and Figure 8 where the groundwater reached the ground surface) and has a significant thickness and lateral extension. Rainfall causes the unconfined aquifers to be recharged, which is evident by the rise in water levels along the wadi in the rainy season [91], where the upstream of Wadi Fatimah receives an annual rainfall of 300 to 360 mm. Moreover, recharge was calculated to occur at a rate of roughly 72 mm/year [92] and 85 mm/year [1]. Moreover, the transmissivity values ranged from 300 to 1800 m2/day, indicating that the layer’s yields range from mid to high potential [93], while the storativity values averaged 0.06 and the specific yield values ranged from 0.12 to 0.2 when compared to the material grain size [94]. According to [91], Wadi Fatimah can be considered a groundwater source with a high possibility of increasing the recharge artificially by constructing subsurface dams, particularly in Wadi Elaf, which protects the quality of the water in addition to the rising water level in the wadi, or by building infiltration basins in the upper parts of the wadi to increase the amount of water recharge.
5. Conclusions
The DEM maps and slope indicate a high potential for massive amounts of groundwater in Wadi Fatimah. Minimum and maximum elevations in the basin range from 0 to 933 m, with an average elevation of 466 m AMSL. The slope degree influences how much surface water infiltrates into the ground. Low-sloped areas can collect rainwater and allow it to percolate into the subsurface, replenishing groundwater. A steep slope, on the other hand, causes runoff to travel faster, giving water less time to settle on the ground surface and, as a result, lowering groundwater recharge capacity. Because the slope varies with elevation, this data necessitates the identification of topographic features. The slope ranged from 0° to 38° in the study area. Wadi Fatimah’s slopes ranged from 0° to 9.1°, with highlands having slopes ranging from 9.1° to 38°. Wadi Fatimah is a drainage basin with a high stream density compared to a basin with few tributaries. The density of drainage varies according to watershed and is determined by infiltration capacity, or the soil’s ability to absorb water. When infiltration is low, water will flow overland and form streams. Sand, gravel, and limestone have the highest infiltration rates, while shale and clay have the lowest. The drainage network is dendritic and topographically influenced. Linear physiognomies include stream order, the mean of the branching ratio, total drainage length, drainage frequency, and drainage density. It indicates that the Wadi Fatimah study area is drained by a fourth-order stream that flows north to south. According to the stream order map, Wadi Fatimah is drained by a fourth-order stream that flows north to south. This, in turn, confirms that there is a high possibility of surface water infiltration into alluvial sediments during runoff along the main pathway. Furthermore, because it is unconfined, this aquifer recharges continuously during the rainy season as the groundwater-bearing layer reaches the ground surface. Furthermore, the high drainage density suggests a resistant subsurface material, resulting in more runoff during rainfall events. The drainage density is 0.433 km/km2, which is normal for coarse drainage. Drainage texture is influenced by lithology, infiltration capacity, and topographic relief. Because of the low slope of the basement rocks, a coarse drainage texture (less than two) was calculated as 0.059, indicating additional groundwater recharge from precipitation.
The Wadi Fatimah unconfined aquifer has a high potential for groundwater occurrence based on the 2D inversion results of the ERT data. This aquifer is distinguished by a low resistivity aerial extension (less than 100 m) and a depth extending from the ground surface to 50 m. This aquifer is underlain by weathered/fractured and/or fresh basement rocks. Because the Wadi Fatimah basin receives an annual rainfall of 300 to 360 mm, this unconfined aquifer can be easily recharged by rainfall, making it a promising strategic area for groundwater supply for future planning and urbanization projects in nearby areas.
Author Contributions
Both authors (F.A. and K.A.) contributed in all phases of the manuscript. All authors have read and agreed to the published version of the manuscript.
Funding
The Deputyship for Research and Innovation, “Ministry of Education” in Saudi Arabia for funding this research work through the project number (IFKSUDR_F157).
Data Availability Statement
The data used in this study will be available from the authors upon request.
Acknowledgments
The authors extend their appreciation to the Deputyship for Research and Innovation, “Ministry of Education” in Saudi Arabia for funding this research work through the project number (IFKSUDR_F157).
Conflicts of Interest
The authors declare no conflict of interest.
References
- Memon, B.A.; Kazi, A.; Bazuhair, A.S. Hydrology of Wadi Al-Yammaniyah, Saudi Arabia. Groundwater 1984, 22, 406–411. [Google Scholar] [CrossRef]
- Jamman, A.M. Hydrogeology of Wadi Naman, Saudi Arabia. Master’s Thesis, Faculty of Earth Science, King Abdulaziz University, Jeddah, Saudi Arabia, 1978; 132p. [Google Scholar]
- Alshehri, F.; Sultan, M.; Karki, S.; Alwagdani, E.; Alsefry, S.; Alharbi, H.; Sahour, H.; Sturchio, N. Mapping the distribution of shallow groundwater occurrences using Remote Sensing-based statistical modeling over southwest Saudi Arabia. Remote Sens. 2020, 12, 1361. [Google Scholar] [CrossRef]
- Alshehri, F.; Zaidi, F.K.; Alzahrani, H. Hydrochemical characterization of geothermal and non-geothermal waters from Wadi Fatima, western Saudi Arabia. J. King Saud Univ.-Sci. 2022, 34, 101717. [Google Scholar] [CrossRef]
- Alshehri, F.; Abdelrahman, K. Groundwater aquifer detection using the time-domain electromagnetic method: A case study in Harrat Ithnayn, northwestern Saudi Arabia. J. King Saud Univ.-Sci. 2022, 34, 101684. [Google Scholar] [CrossRef]
- Elsaka, B.; Abdelmohsen, K.; Alshehri, F.; Zaki, A.; El-Ashquer, M. Mass Variations in Terrestrial Water Storage over the Nile River Basin and Mega Aquifer System as Deduced from GRACE-FO Level-2 Products and Precipitation Patterns from GPCP Data. Water 2022, 14, 3920. [Google Scholar] [CrossRef]
- Alzahrani, Y.; Alshehri, F.; El-Sorogy, A.S.; Alzahrani, H. Environmental assessment of heavy metals in soils around Al-Janabeen Dam, southwest Saudi Arabia. J. King Saud Univ.-Sci. 2023, 35, 102503. [Google Scholar] [CrossRef]
- Alshehri, F.; Mohamed, A. Analysis of Groundwater Storage Fluctuations Using GRACE and Remote Sensing Data in Wadi As-Sirhan, Northern Saudi Arabia. Water 2023, 15, 282. [Google Scholar] [CrossRef]
- Alshehri, F.; Abdelrahman, K. Integrated approach for the investigation of groundwater quality using hydrochemical and geostatistical analyses in Wadi Fatimah, western Saudi Arabia. Front. Earth Sci. 2023, 11, 1166153. [Google Scholar] [CrossRef]
- Alshehri, F.; El-Sorogy, A.S.; Almadani, S.; Aldossari, M. Groundwater quality assessment in western Saudi Arabia using GIS and multivariate analysis. J. King Saud Univ.-Sci. 2023, 35, 102586. [Google Scholar] [CrossRef]
- Mondal, B.K.; Sahoo, S.; Das, R.; Mishra, P.K.; Abdelrahman, K.; Acharya, A.; Lee, M.-A.; Tiwari, A.; Fnais, M.S. Assessing Groundwater Dynamics and Potentiality in the Lower Ganga Plain, India. Water 2022, 14, 2180. [Google Scholar] [CrossRef]
- Benjmel, K.; Amraoui, F.; Aydda, A.; Tahiri, A.; Yousif, M.; Pradhan, B.; Abdelrahman, K.; Fnais, M.S.; Abioui, M. A Multidisciplinary Approach for Groundwater Potential Mapping in a Fractured Semi-Arid Terrain (Kerdous Inlier, Western Anti-Atlas, Morocco). Water 2022, 14, 1553. [Google Scholar] [CrossRef]
- Ekwok, S.E.; Ben, U.C.; Eldosouky, A.M.; Qaysi, S.; Abdelrahman, K.; Akpan, A.E.; Andráš, P. Towards understanding the extent of saltwater incursion into the coastal aquifers of Akwa Ibom State, Southern Nigeria using 2D ERT. J. King Saud Univ.-Sci. 2022, 34, 102371. [Google Scholar] [CrossRef]
- Smith, N.C.; Vozoff, K. Two-dimensional DC resistivity inversion for dipole–dipole data. IEEE Trans. Geosci. Remote Sens. 1984, 22, 21–28. [Google Scholar] [CrossRef]
- Sasaki, Y. Resolution of resistivity tomography inferred from numerical simulation. Geophys. Prospect. 1992, 40, 453–464. [Google Scholar] [CrossRef]
- Dahlin, T. 2D resistivity surveying for environmental and engineering applications. First Break 1996, 14, 275–283. [Google Scholar] [CrossRef]
- Zhe, J.; Greenhalgh, S.A.; Marescot, L. Multi-channel, full waveform, and flexible electrode combination resistivity imaging system. Geophysics 2007, 72, F57–F64. [Google Scholar] [CrossRef]
- La Brecque, D.; Miletto, M.; Daily, W.; Ramirez, A.; Owen, E. The effects of noise on “Occam” inversion of resistivity tomography data. Geophysics 1996, 61, 538–548. [Google Scholar] [CrossRef]
- Loke, M.H.; Barker, R.D. Rapid least-squares inversion of apparent resistivity pseudo-sections by a quasi-Newton Method. Geophys. Prospect. 1996, 44, 131–152. [Google Scholar] [CrossRef]
- Mauriello, P.; Monna, D.; Patella, D. 3-D geoelectric tomography and archaeological applications. Geophys. Prospect. 1998, 46, 543–570. [Google Scholar] [CrossRef]
- Mauriello, P.; Patella, D. Resistivity anomaly imaging by probability tomography. Geophys. Prospect. 1999, 47, 411–429. [Google Scholar] [CrossRef]
- Zhou, B.; Greenhalgh, S.A. Explicit expressions and numerical calculations for the Fréchet and second derivatives in 2.5D Helmholtz equation inversion. Geophys. Prospect. 1999, 47, 443–468. [Google Scholar]
- Loke, M.H.; Chambers, J.E.; Rucker, D.F.; Kuras, O.; Wilkinson, P.B. Recent development in the direct-current geoelectrical imaging method. J. Appl. Geophys. 2013, 95, 135–156. [Google Scholar] [CrossRef]
- Dahlin, T.; Zhou, B. A numerical comparison of 2D resistivity imaging with 10 electrode arrays. Geophys. Prospect. 2004, 52, 379–398. [Google Scholar] [CrossRef]
- Pellerin, L. Applications of electrical and electromagnetic methods for environmental and geotechnical investigations. Surv. Geophys. 2002, 23, 101–132. [Google Scholar] [CrossRef]
- Yadav, G.S.; Singh, S.K. Integrated resistivity surveys for delineation of fractures for groundwater exploration in hard rock area. J. Appl. Geophys. 2007, 62, 301–312. [Google Scholar] [CrossRef]
- Store, H.; Storz, W.; Jacobs, F. Electrical resistivity tomography to investigate geological structures of earth’s upper crust. Geophys. Prospect. 2000, 48, 455–471. [Google Scholar] [CrossRef]
- Flathe, H. Possibilities and limitations in applying geoelectrical methods to hydrogeological problems in the coastal areas of northwest Germany. Geophys. Prospect. 1955, 3, 95–110. [Google Scholar] [CrossRef]
- Flathe, H. Interpretation of geoelectrical resistivity measurements for solving hydrogeological problems. In Mining and Groundwater Geophysics: Geological Survey of Canada Economic Geological Report No. 26; Morely, E.W., Ed.; Geological Survey of Canada: Ottawa, ON, Canada, 1970; pp. 580–597. [Google Scholar]
- Ogilvy, A.A. Geophysical prospecting for groundwater in the Soviet Union. In Mining and Groundwater Geophysics: Geological Survey of Canada Economic Geological Report No. 26; Morely, E.W., Ed.; Geological Survey of Canada: Ottawa, ON, Canada, 1970; pp. 536–543. [Google Scholar]
- Zohdy, A.A.R.; Eaton, G.P.; Mabey, D.R. Application of Surface Geophysics to Groundwater Investigations: Techniques of Water-Resources Investigations of the United States Geological Survey, Book 2; U.S. Dept. of the Interior, Geological Survey: Reston, VI, USA, 1974; Chapter D1; p. 116. [CrossRef]
- Robain, H.; Braun, J.J.; Albouy, Y.; Ndam, J. An electrical monitoring of an elementary watershed in the rain forest of Cameroon. In Proceedings of the 1st Environmental and Engineering Geophysics Meeting, Torino, Italy, 25–29 September 1995; pp. 411–414. [Google Scholar]
- Shaaban, F. Vertical electrical for groundwater investigation in northwestern Egypt: A case study in a coastal area. J. Afr. Earth Sci. 2002, 33, 673–686. [Google Scholar] [CrossRef]
- Lashkaripour, G.R.; Sadeghi, H.; Qushaeei, M. Vertical electrical soundings for groundwater assessment in southeastern Iran: A case study. J. Appl. Geophy. 2005, 5, 973–977. [Google Scholar]
- Al-Garni, M.A.; Hassanein, H.I.; Gobashy, M. Ground-magnetic survey and Schlumberger sounding for identifying the subsurface factors controlling the groundwater flow along Wadi Lusab, Makkah Al-Mukarramah, Saudi Arabia. J. Appl. Geophys. 2005, 4, 59–74. [Google Scholar]
- Hassanein, H.; El-Kaliouby, H.; Al-Garni, M.A. The use of DC-resistivity to outline the subsurface hydrogeological and structural setting beneath a proposed site for the subsurface dam building, Makkah Al-Mukarramah, Saudi Arabia. J. King Abdulaziz Univ. Earth Sci. 2007, 18, 117–138. [Google Scholar] [CrossRef]
- El-Waheidi, M.M.; Merlanti, F.; Pavan, M. Geoelectrical resistivity survey of the central part of Azraq plain (Jordan) for identifying saltwater/freshwater interface. J. Appl. Geophy. 1992, 29, 125–133. [Google Scholar] [CrossRef]
- Choudhury, K.; Saha, D.K.; Chakraborty, P. Geophysical study for salain water intrusion in a coastal alluvial terrain. J. Appl. Geophy. 2001, 46, 189–200. [Google Scholar] [CrossRef]
- Jackson, P.N.; Taylor, S.D.; Stanford, P.N. Resistivity-porosity-particle shape relationships for marine sands. Geophysics 1978, 43, 1250–1268. [Google Scholar] [CrossRef]
- Kesseles, W.; Flentge, I.; Kolditz, H. DC geoelectric sounding to determine water content in the salt mine asse (FRG). Geophys. Prospect. 1985, 33, 446–456. [Google Scholar] [CrossRef]
- Yadav, G.S.; Abolfazli, H. Geoelectric soundings and their relationship to hydraulic parameters in semiarid regions of Jalore, northwestern India. J. Appl. Geophy. 1998, 39, 35–51. [Google Scholar] [CrossRef]
- Troisi, S.; Fallicos, C.; Straface, S.; Migliari, E. Application of kriging with external drift to estimate hydraulic conductivity from electrical resistivity data in unconsolidated deposites near Montato Uffugo, Italy. Hydrogeol. J. 2000, 8, 356–367. [Google Scholar] [CrossRef]
- Kelly, E.W. Geoelectric sounding for delineating groundwater contamination. Ground Water 1976, 14, 6–11. [Google Scholar] [CrossRef]
- Kaya, G.K. Investigation of groundwater contamination using electric and electromagnetic methods at open waste-disposal site, a case study from Isparta, Turkey. Environ. Geol. 2001, 40, 725–731. [Google Scholar]
- Almadani, S.; Alfaifi, H.; Al-Amri, A.; Fnais, M.; Ibrahim, E.; Abdelrahman, K.; Shehata, M.; Zaidi, F. Hydrochemical characteristics and evaluation of the granite aquifer in the Alwadeen area, southwest Saudi Arabia. Arab. J. Geosci. 2017, 10, 139. [Google Scholar] [CrossRef]
- Al Wagdani, E.O.; Basamed, A.S.; Al-Shorbaji, H.H.; Thabit, M.; Al Ashi, W.A.; Al Hery, H.A. The Exploration and Development of Water Resources in Harrat Khaybar; Technical Report SGS-TR-2012-10; Saudi Geological Survey: Jeddah, Saudi Arabia, 2016; 73p, 67 figs., 19 tables, 1 app.
- Alshehri, F.; Abdelrahman, K. Groundwater resources exploration of Harrat Khaybar area, northwest Saudi Arabia, using electrical resistivity tomography. J. King Saud Univ.-Sci. 2021, 33, 101468. [Google Scholar] [CrossRef]
- Alshehri, F.; Abdelrahman, K.; Alyousef, R. An integrated approach for the identification of potential shallow groundwater zones in west-central Saudi Arabia. J. King Saud Univ.-Sci. 2022, 34, 101915. [Google Scholar] [CrossRef]
- Alarifi, S.S.; Abdelrahman, K.; Hazaea, B.Y. Depicting of groundwater potential in hard rocks of southwestern Saudi Arabia using the vertical electrical sounding approach. J. King Saud Univ.-Sci. 2022, 34, 102221. [Google Scholar] [CrossRef]
- Alarifi, S.S.; Abdelrahman, K.; Hazaea, B.Y. Near-surface groundwater exploration using the geoelectrical resistivity method: A case study of Wadi Nisah, Riyadh, Saudi Arabia. J. King Saud Univ.-Sci. 2022, 34, 102207. [Google Scholar] [CrossRef]
- Alfaifi, H.; Kahal, A.; Albassam, A.; Ibrahim, E.; Abdelrahman, K.; Zaidi, F.; Alhumidan, S.a. Integrated geophysical and hydrochemical investigations for seawater intrusion: A case study in southwestern Saudi Arabia. Arab. J. Geosci. 2019, 12, 372. [Google Scholar] [CrossRef]
- Zaidi, F.; Kassem, O. Use of electrical resistivity tomography in delineating zones of groundwater potential in arid regions: A case study from Diriyah region of Saudi Arabia. Arab. J. Geosci. 2012, 5, 327–333. [Google Scholar] [CrossRef]
- Alzahrani, H.; Abdelrahman, K.; Hazaea, S. Use of geoelectrical resistivity method for detecting near-surface groundwater potential zones at Riyadh city, Saudi Arabia. J. King Saud Univ.-Sci. 2022, 34, 102253. [Google Scholar] [CrossRef]
- Al-Garni, M.A. Geophysical Investigations for Groundwater in a Complex Subsurface Terrain, Wadi Fatima, KSA: A Case History. Jordan J. Civ. Eng. 2009, 3, 118–136. [Google Scholar]
- Al-Shanti, A.M.S. Geology of the Arabian Shield of Saudi Arabia; Scientific Publishing Center, King Abdulaziz University: Jeddah, Saudi Arabia, 2009; p. 190. [Google Scholar]
- Hamimi, Z.; Matsah, M.; El-Shafei, M.; El-Fakharani, A.; Shujoon, A.; Al-Gabali, M. Wadi Fatima thin-skinned foreland FAT belt: A post amalgamation marine basin in the Arabian Shield. Open J. Geol. 2012, 2, 271. [Google Scholar] [CrossRef]
- Ganapuram, S.; Kumar, G.V.; Krishna, I.M.; Kahya, E.; Demirel, M.C. Mapping of groundwater potential zones in the Musi basin using remote sensing data and GIS. J. Adv. Eng. Softw. 2009, 40, 506–518. [Google Scholar] [CrossRef]
- Sharaf, M.A.M.; Alyamani, M.S.; Subyani, A.M. The Regional Study of the Rare and Trace Elements in the Groundwater of the Major Wadi Basins (An Numan, Usfan, and Fatimah) in Western Saudi Arabia and Their Suitability for Various Purposes; Project No. (204/423); King Abdulaziz University: Jeddah, Saudi Arabia, 2004. [Google Scholar]
- Es-Saeed, M.; Şen, Z.; Basamad, A.; Dahlawi, A. Strategic Groundwater Storage in Wadi Numan, Makkah Region, Saudi Arabia; Technical Report-SGSTR-2004-1; Saudi Geological Survey: Jeddah, Saudi Arabia, 2004.
- Jado, A.R.; Zotl, J.G. Quaternary Period in Saudi Arabia; Springer: Vienna, Austria; New York, NY, USA, 1984; Volume 2, 360p. [Google Scholar]
- Horton, R.E. Erosional development of streams and their drainage basins: Hydrophysical approach to quantitative morphology. Bull. Geol. Soc. Am. 1945, 56, 275–370. [Google Scholar] [CrossRef]
- Shreve, R.L. Statistical law of stream numbers. J. Geol. 1966, 74, 17–37. [Google Scholar] [CrossRef]
- Strahler, A. Hypsometric (area-altitude) analysis of erosional topography. Geol. Soc. Am. Bull. 1952, 63, 1117–1142. [Google Scholar] [CrossRef]
- Kelson, K.; Wells, S. Geologic influences on fluvial hydrology and bedload transport in small mountainous watersheds, northern New Mexico, USA. Earth Surf. Proc. Land. 1989, 14, 671–690. [Google Scholar] [CrossRef]
- Gregory, K.; Gardiner, V. Drainage density and climate. Geomorphology 1975, 19, 287–298. [Google Scholar]
- Montgomery, D.; Dietrich, W. Source areas, drainage density, and channel initiation. Water Resour. Res. 1989, 25, 1907–1918. [Google Scholar] [CrossRef]
- Schumm, S. The role of creep and rain-wash on the retreat of badland slopes South Dakota. Am. J. Sci. 1956, 254, 693–706. [Google Scholar] [CrossRef]
- Oguchi, T. Drainage density and relative relief in humid steep mountains with frequent slope failure. Earth Surf. Processes Land. 1997, 22, 107–120. [Google Scholar] [CrossRef]
- Kahal, A.Y.; Alfaifi, H.J.; Kamal Abdelrahman Zaidi, F.K. Physio-chemical properties of groundwater and their environmental hazardous impact: A case study of Southwestern Saudi Arabia. J. King Saud Univ.-Sci. 2021, 33, 101292. [Google Scholar] [CrossRef]
- Zaidi, F.K.; Mukhopadhyay, M. Morphometric analysis of the Scoria Cones and drainage pattern for the Quaternary and older Volcanic Fields in parts of the Large Igneous Province (LIP), Saudi Arabia. J. Afr. Earth Sc. 2015, 110, 1–13. [Google Scholar] [CrossRef]
- Grainger, D.L. A geological excursion in the Wadi Fatima area, near Jiddah, Saudi Arabia. Geol. Today 1992, 8, 215–219. [Google Scholar] [CrossRef]
- Moore, T.A.; Al-Rehaili, M.H. Geologic Map of the Makkah Quadrangle, Sheet 21D, Kingdom of Saudi Arabia: Saudi Arabian Directorate General of Mineral Resources, Geoscience Map GM-107C, 1:250,000 Scale. 1989. Available online: https://www.scirp.org/(S(czeh2tfqyw2orz553k1w0r45))/reference/ReferencesPapers.aspx?ReferenceID=2282742 (accessed on 20 February 2023).
- Nebert, K.; Alshaibi, A.A.; Awila, M.; Bounny, I.; Nawab, Z.A.; Sharief, O.H.; Sherbini, O.A.; Yeslam, A.H. Geology of the area north of Wadi Fatima, Kingdom of Saudi Arabia. Center for Applied Geology. Minist. Pet. Miner. Resour. Bull. 1974, 1, 30–31. [Google Scholar]
- Zakir, F.A.R.; Moustafa, A.R. Structural setting of Gabal Abu Gurrah Area, Wadi Fatma, West-Central Saudi Arabia. J. King Abdul Aziz Univ. 1992, 5, 177–200. [Google Scholar]
- Johnson, P.R.; Andresen, A.; Collins, A.S.; Fowler, A.R.; Fritz, H.; Ghebreab, W.; Kusky, T.M.; Stern, R.J. Late Cryogenian-Ediacaran History of the Arabian-Nubian Shield: A Review of Depositional, Plutonic, Structural and Tectonic Events in the Closing Stages of the Northern East African Orogen. J. Afr. Earth Sci. 2011, 61, 167–232. [Google Scholar] [CrossRef]
- Griffiths, D.H.; Barker, R.D. Two-dimensional resistivity imaging and modeling in areas of complex geology. J. Appl. Geophys. 1993, 29, 211–226. [Google Scholar] [CrossRef]
- Keller, G.V.; Frischknecht, F.C. Electrical Methods in Geophysical Prospecting; Pergamon Press Inc.: Oxford, UK, 1996. [Google Scholar]
- Sumner, J.S. Principles of Induced Polarization for Geophysical Exploration; Developments in Economic Geology 5; Elsevier Science Publishing Co.: Amsterdam, The Netherlands, 1976. [Google Scholar]
- Reynolds, J.M. An Introduction to Applied and Environmental Geophysics; Wiley: New York, NY, USA, 1997; p. 796. [Google Scholar]
- Rubin, Y.; Hubbard, S.S. (Eds.) Hydrogeophysics, Water Science, and Technology Library; Springer: Dordrecht, The Netherlands, 2006; Volume 50, p. 523. [Google Scholar]
- Dobrin, M.B. Introduction to Geophysical Prospecting; McGraw-Hill: New York, NY, USA, 1988; p. 867. [Google Scholar]
- Ozcep, F.; Tezel, O.; Asci, M. Correlation between electrical resistivity and soil-water content: Istanbul and Golcuk. Int. J. Phys. Sci. 2009, 6, 362–365. [Google Scholar]
- Alile, O.M.; Ujuanbi, O.; Evbuomwan, I.A. Geoelectric investigation of groundwater in Obaretin-Iyanomon locality, Edo state, Nigeria. J. Geol. Min. Res. 2011, 3, 13–20. [Google Scholar]
- Ward, S.H. Resistivity and induced polarization methods. In Geotechnical and Environmental Geophysics, vol 1: Review and Tutorial; Ward, S.H., Ed.; Society of Exploration Geophysicists: Houston, TX, USA, 1990; pp. 147–189. [Google Scholar]
- Bernard, J.; Leite, O.; Vermeersch, F. Multi-Electrode Resistivity Imaging for Environmental and Mining Applications. 2006. Available online: http://www.iris-instrument.com (accessed on 17 January 2023).
- Loke, M.H. RES2DINV; Version 3.50; Rapid 2-D Resistivity and IP Inversion Using the Least Square Method; Geotomo Software, Penang. 2002. Available online: http://www.geoelectrical.com/contact.html (accessed on 17 January 2023).
- Sasaki, Y. Two-dimensional joint inversion of magnetotelluric and dipole-dipole resistivity data. Geophysics 1989, 54, 174–187. [Google Scholar] [CrossRef]
- DeGroot-Hedlin, C.; Constable, S. Occam’s inversion generates smooth two-dimensional models from magnetotelluric data. Geophysics 1989, 55, 1613–1624. [Google Scholar] [CrossRef]
- Loke, M.H.; Acworth, I.; Dahlin, T. A comparison of smooth and blocky inversion methods in 2-D electric imaging surveys. Explor. Geophys. 2003, 34, 182–187. [Google Scholar] [CrossRef]
- Aning, A.A.; Tucholka, P.; Danuor, S.K. 2D Electrical Resistivity Tomography (ERT) Survey using the Multi-Electrode Gradient Array at the Bosumtwi Impact Crater, Ghana. J. Environ. Earth Sci. 2013, 3, 5. [Google Scholar]
- Al Sefry, S.A.; Al Ghamdi, S.A.; Ashi, W.A.; Bardi, W.A. Wadi Fatimah Aquifer as Strategic Groundwater Storage for Makkah Area. In Proceedings of the 6th Gulf Water Conference, Riyadh, Saudi Arabia, 8–12 March 2003. 10p. [Google Scholar]
- Alyamani, M.S.; Hussein, M.T. Hydrochemical Study of Groundwater in Recharge Area, Wadi Fatimah Basin, Saudi Arabia. GeoJournal 1995, 37, 81–89. [Google Scholar] [CrossRef]
- Sen, Z. Applied Hydrogeology for Scientists and Engineers; CRC Lewis Publishers: Boca Raton, FL, USA, 1995; 465p. [Google Scholar]
- Dawson, J.W.; Istok, J.D. Aquifer Testing—Design and Analysis of Pumping and Slug Test; Lewis Publishers Inc.: Chelsea, MI, USA, 1991. [Google Scholar]
Figure 1.
Location map of the study area (black lines are ERT profiles).

Figure 2.
Digital Elevation Model (DEM) map of the study area.

Figure 3.
Slope angle assessment map of the study area.

Figure 4.
Slope aspect assessment map for the area.

Figure 5.
The drainage density and stream order map of the study area.

Figure 6.
Geological map of the study area.

Figure 7.
Flowchart showing the methodology of the present study.

Figure 8.
The resultant 2D inversion resistivity model for Profile no.1.

Figure 9.
The inverted ERT 2D geoelectric cross-section of Profile no.1.

Figure 10.
The inverted ERT 2D geoelectric cross-section of Profile no.2.

Figure 11.
The inverted ERT 2D geoelectric cross-section of Profile No. 3.


Table 1.
Resistivity values of common rocks and soil materials.
| Material | Resistivity (Ω.m) |
|---|---|
|
Igneous/metamorphic rocks Granite Weathered granite Basalt Quartz Marble Schist | 5 × 10³–108 103–105 103–106 103–2 × 10⁶ 102–2.5 × 10⁸ 2–104 |
|
Sediments Sandstone Conglomerate Shale Limestone | 8–4 × 10³ 2 × 10³–104 20–2 × 10³ 50–4 × 10³ |
|
Unconsolidated sediments Alluvium Sand Clay Marl | 10–800 60–1000 1–100 1–70 |
|
Groundwater Freshwater Saltwater | 10–100 0.2 |
Table 2.
ERT field data acquisition parameters.
| Parameter | Profile No. 1 | Profile No. 2 | Profile No. 3 |
|---|---|---|---|
| Number of spreads | 1 | 1 | 1 |
| Number of electrodes | 58 | 128 | 48 |
| Electrode spacing | 3 m | 3 m | 3 m |
| Profile total length | 174 m | 333 m | 141 m |
| Instrument used | IRIS Syscal Pro resistivity meter | IRIS Syscal Pro resistivity meter | IRIS Syscal Pro resistivity meter |
| Profile orientation relative to the main Wadi channel | cross | cross | cross |
| Surface conditions | Sandy soil and too many rocks | Sandy soil | Sandy soil |
Disclaimer/Publisher’s Note: The statements, opinions and data contained in all publications are solely those of the individual author(s) and contributor(s) and not of MDPI and/or the editor(s). MDPI and/or the editor(s) disclaim responsibility for any injury to people or property resulting from any ideas, methods, instructions or products referred to in the content. |
© 2023 by the authors. Licensee MDPI, Basel, Switzerland. This article is an open access article distributed under the terms and conditions of the Creative Commons Attribution (CC BY) license (https://creativecommons.org/licenses/by/4.0/).
Share and Cite
MDPI and ACS Style
Alshehri, F.; Abdelrahman, K. Groundwater Potentiality of Wadi Fatimah, Western Saudi Arabia: Geophysical and Remote Sensing Integrated Approach. Water 2023, 15, 1828. https://doi.org/10.3390/w15101828
AMA Style
Alshehri F, Abdelrahman K. Groundwater Potentiality of Wadi Fatimah, Western Saudi Arabia: Geophysical and Remote Sensing Integrated Approach. Water. 2023; 15(10):1828. https://doi.org/10.3390/w15101828
Chicago/Turabian StyleAlshehri, Fahad, and Kamal Abdelrahman. 2023. "Groundwater Potentiality of Wadi Fatimah, Western Saudi Arabia: Geophysical and Remote Sensing Integrated Approach" Water 15, no. 10: 1828. https://doi.org/10.3390/w15101828
Note that from the first issue of 2016, this journal uses article numbers instead of page numbers. See further details here.