
Microbial Enhancement of Selenium Removal in Chemically Modified Zeolite Columns
1
Civil Engineering Department, New Mexico State University, Las Cruces, NM 88003, USA
2
Carlsbad Environmental Monitoring & Research Center, New Mexico State University, Carlsbad, NM 88220, USA
*
Author to whom correspondence should be addressed.
Water 2023, 15(10), 1837; https://doi.org/10.3390/w15101837
Submission received: 31 March 2023
/
Revised: 6 May 2023
/
Accepted: 9 May 2023
/
Published: 11 May 2023
(This article belongs to the Special Issue Natural and Engineered Phenomena Impacting the Fate, Transport and Treatment of Environmental Contaminants)
Abstract
:Selenium (Se) is an essential micro-nutrient for living organisms, but elevated concentrations in water can adversely affect health. In this research, we investigate the removal of selenium oxyanions (selenate and selenite) in aqueous systems by integration of adsorption on modified zeolites and microbial reduction. Dynamic sorption-reduction experiments were conducted using two sets of zeolite columns for the removal of selenite and selenate oxyanions, respectively. In each case, one column was fully packed with natural, unmodified zeolites, while the other column was composed of 80% natural and 20% iron-coated zeolites, by mass. The initial selenium concentration, selenite (SeIV) or selenate (SeVI), was 790 μg/L, the pH was 7.5, and the flow rate was 3 mL/min. Initially, as expected, the higher selenate removal (34%) was observed with coated zeolite, twice as high compared to the results with unmodified zeolite. Maximum selenite removal was 89% in the column with modified zeolite. Within approximately 14 days, as the biofilm developed inside the columns, selenium reduction in all four columns reached approximately 99%. Biofilm microbial community composition, assessed by 16S rRNA sequencing, is consistent with the presence of mainly selenium-reducing bacteria (Veillonella, Bacteroides, and Escherichia). Selenium oxyanions were reduced to elemental selenium, visible within the bioreactors as red-color aggregates.
1. Introduction
Selenium (Se) is a naturally occurring metalloid and, in trace amounts, an essential element for all living organisms. However, consumption beyond 400 µg/d is considered highly toxic [1]. The selenium cycle is complex as it includes several oxidation states, namely −II, 0, +IV, and +VI. Of these, the +IV and +VI oxidation states predominate in oxygenated environments as the selenite (SeO32−) and selenate (SeO42−) oxyanions, respectively. Selenate especially is highly mobile and toxic [1]. The margin of safety between essentiality and toxicity is narrow; thus, a small increase in selenium concentration can cause toxicity [2]. Since they are toxic, selenium and its oxyanions are frequently considered as emerging contaminants of significant health and environmental concern. This led health and environmental organizations to set maximum selenium concentrations in drinking water (WHO—40 μg/L, USEPA—50 μg/L) and natural waters (USEPA—5 μg/L). Thus, generators of selenium-containing wastewaters must consider regulatory restrictions before releasing into the environment any waters with elevated selenium concentrations.
Naturally elevated selenium contaminations can originate from weathering of seleniferous rocks, whereas anthropogenic selenium contamination is caused mainly by mining, coal combustion, oil refineries, and agriculture [3]. In mining wastewaters, selenium can be found in concentrations ranging from 3 to 12,000 μg/L [4]. Therefore, industries that generate selenium-contaminated water pose challenges to achieving the allowable selenium discharge level (1–5 μg/L) [5]. Moreover, the concentration of selenium in drinking water sources is a key risk factor for the health of humans and animals from exposure to elevated selenium.
Selenium removal from aqueous solutions becomes complex and expensive because of the stringent discharge standards and the speciation of Se in water [6]. Hence, investigation and development of selenium removing processes have drawn attention in the past few decades. In terms of the removal mechanism involved, current treatment techniques can be categorized as physical, chemical, and biological. However, physicochemical processes such as chemical precipitation, adsorption, and ion exchange are primarily limited to removing selenite, while the more toxic and more mobile selenate largely remains in the effluent. Moreover, most physicochemical methods are not economical [7]. Further, conventional ion exchangers may not be selective enough with respect to a specific ion. This may induce preference by affinity and, therefore, create competition, thus leaving selenate untreated [8]. Reduction methods are more attractive as they can be used to treat both selenate and selenite anions with higher removal efficiency. For example, based on a previous study, chemical reduction using zero-valent iron (ZVI) reduced both selenate and selenite into insoluble elemental selenium, thereby reducing dissolved selenium to below 50 μg/L [9].
Biological reduction could be considered an economical alternative to chemical reduction because both methods are based on similar key reactions to convert selenium oxyanions to elemental selenium. However, biological selenium removal methods are more attractive in terms of cost-effectiveness, eco-friendliness, because of lower chemical consumption, and capacity to produce low-selenium effluent [6]. In addition, biological selenium removal is advantageous in industrial wastewater treatment because any selenium recovery could potentially offset treatment costs.
Biological selenium reduction can only occur under anaerobic conditions and with the appropriate carbon source, electron donor, and nutrients. Selenium oxyanion removal through biological reduction has been successfully used in different types of bioreactors and process configurations, such as up-flow anaerobic sludge blanket (UASB) reactors, biofilm reactors, membrane biofilm reactors, suspended sludge growth reactors, and biofilters [2]. It was found that in a UASB type reactor seeded with granular sludge, selenium levels could be reduced to less than 100 μg/L within a 24 h retention time with acetate as the electron donor [10]. In another study, in a plastic media packed reactor inoculated with Thauera selenatis the initial selenium concentration was reduced from 250 μg/L to 12 μg/L in the presence of nitrate and with 195 min average residence time [11]. In these systems, selenium-reducing microbial communities were used either as suspended growth or attached growth to a carrier material [12]. The end product of biological reduction is elemental selenium, a fine precipitate, and easily removable from the aqueous phase by sedimentation (for suspended growth systems) or backflushing through packed-bed systems [10]. The following Equations (1) to (3) summarize the overall reduction reaction of selenate and selenite.
SeO42− + 2e− + 2H+ → SeO3 2− + H2O
SeO32− + 4e− + 6H+ → Se0 + 3H2O
SeO42− + 6e− + 8H+ → Se0 + 4H2O
In attached growth reactors, specific bacteria strains are impregnated in a solid support. Commonly used media are granular activated carbon, sand, rock, ceramic, and plastic [13]. The media can be used simultaneously as the filtration and attached growth media to microorganisms. Therefore, attached growth reactors are often selected based on consideration of properties such as surface area, sorption capacity, and filtration characteristics.
To further improve selenium removal efficiency, in the current study we focus on developing and applying simultaneous adsorption and biological reduction treatment processes. The removal of selenite and selenate was investigated in a biofiltration system, with modified zeolite as the filtration medium, as a function of bioreduction and adsorption. Due to their abundance, cost effectiveness, high porosity, thermal stability, and high specific surface area, zeolites have been used over the past decades in water treatment. However, although zeolites can have very high cation exchange capacities, they have minimal anion exchange capacity. Thus, different surface modifications have been employed to increase the affinity of anions for zeolites [14]. In this study, the removal of selenate and selenite using columns filled with natural and modified zeolites was investigated. In addition, the effects of initial selenium concentration and nutrient levels were also studied to assess the system’s performance.
2. Materials and Methods
2.1. Zeolite Modification
The natural clinoptilolite zeolite was obtained from St. Cloud mining company in Winston, NM, USA. The natural zeolite was chemically modified by pretreating it with sodium and then coating it with iron. The final product was classified as a sodium-pretreated, iron-modified zeolite (SPIMZ). The pretreatment with sodium has been previously shown to enhance iron coating [15]. In turn, iron modification increases anion affinity for the zeolite surface. For the pretreating process, 200 g of natural zeolite were first sieved through a 14–40 mesh to collect a particle size fraction of 0.42–1.41 mm. The zeolite was then soaked in 500 mL of 2 M sodium chloride (NaCl) solution and stirred using magnetic stirrers. The pretreated zeolite was placed in a desiccator under vacuum for four days at room temperature to remove any air from the zeolite pore structure and allow saturation of the solid by the solution. Afterward, to remove the chloride ions, the zeolite was rinsed thoroughly with reagent grade deionized water. The sodium-pretreated zeolite was then dried in the oven for 24 h at 105 °C.
Once the sodium-pretreated zeolite was completely dry, the iron-coating process started. For iron coating, 100 mL of 0.5 N ferric nitrate (Fe(NO3)3·9H2O), 800 mL of deionized (DI) water, and the pretreated zeolite were mixed in a beaker. The mixture was stirred, and the pH was raised to approximately 9.5 by gradual addition of 3.0 N sodium hydroxide (NaOH). The mixture was then placed in the oven at 75 ± 1 °C for 96 h. During the first 24 h, the suspension was stirred. The mixture was then allowed to settle for the next 24 h. Following the 24-h settling period, the suspension was stirred for an additional 24 h. Finally, the mixture was allowed to settle in the oven at 75 ± 1 °C for 24 h. After the final settling period, the modified zeolite was rinsed several times to remove fines and excess salt. Finally, the modified zeolite was dried in the oven for 24 h at 75 ± 1 °C. By raising the pH of the Fe(NO3)3·9H2O solution, Fe(OH)3, is readily formed, because the solubility product of Fe(OH)3(s) is very small (Ksp = 2.79 × 10−39). The stirring of the suspension allows a more uniform coating of the zeolite by Fe(OH)3 [16].
The objective of using particles ranging between 0.42 and 1.41 mm was to balance surface characteristics and hydraulic properties. As the zeolite particle diameter decreases, the specific surface area tends to increase, although not in a directly inverse relationship because the majority of zeolite surface area is associated with internal porosity. On the other hand, larger particles allow larger flowrates and minimize the risk of decreased hydraulic conductivity. Finally, the larger the zeolite particle size, the slower the kinetics of anion uptake and the more difficult it becomes to coat the zeolite surface by iron uniformly because these processes depend on ion diffusion inside the zeolite pores, that in turn depends on diffusion path length. However, using too small particles is not always beneficial because surface dust might block part of the pore openings of the zeolite structure, leading to slower ion exchange and adsorption properties of the smaller zeolite particles compared to larger ones [17]. The chosen particle size appears to be a good compromise between these objectives [18]. During the sodium pretreatment step, Na+ is used to replace all other charge-balancing cations in the zeolite, including alkaline or alkaline earth cations, such as K+, Ca2+, and Mg2+ [19].
The following properties of zeolites were quantified to interpret and assess the effect of natural zeolite modification on selenium oxyanion sorption capacity: specific surface area, morphology, elemental composition, elemental distribution, and iron percentages. The morphology and elemental chemical composition of natural (NZ) and sodium-pretreated iron-modified zeolite (SPIMZ) were analyzed using an S-3400N II scanning electron microscope (SEM) equipped with an Energy-Dispersive X-ray spectrometer (EDX) (Hitachi, Tokyo, Japan). The X-ray diffraction of ground natural zeolite and chemically modified zeolite was measured using an X-ray diffractometer (MiniFlex II, PANalytical Empyrean X-Ray Diffractometer, Malvern, Worcestershire, UK) with Cu Kα radiation (wavelength = 1.540 Ǻ). The surface functional groups of natural and modified zeolite were analyzed using a Thermo Fisher (Waltham, MA, USA) Nicolet iS10 Fourier Transform Infrared Spectrometer (FTIR) equipped with OMNIC software and a wavelength range of 390–4000 cm−1. Nitrogen adsorption/desorption isotherms were used to investigate the Brunauer, Emmett, and Teller (BET) surface area and Barrett–Joyner–Halenda (BJH) pore size distribution of sodium-pretreated iron-modified zeolites and natural zeolites using an ASAP 2050 micropore analyzer (Micromeritrics, Norcross, GA, USA). The nitrogen adsorption was carried out at 77 K.
2.2. Synthetic Wastewater Preparation
Each liter of influent solution was prepared by mixing either 1 mL of 0.01 M of sodium selenite (Na2SeO3) or sodium selenate (Na2SeO4) stock solution with 1 L of DI water, which resulted in a total Se concentration of 790 μg/L (ppb). The nutrients needed for microbial growth were also added to the influent solution. The nutrients for selenium-reducing bacteria consisted of the following trace elements (concentrations shown in parentheses, in mg/L): MgSO4 (44), CaCl2·2H2O (140), FeCl2·4H2O (2), MnSO4·H2O (3.4), (NH4)6Mo7O24·4H2O (1.2), CuSO4 (0.8), Zn(NO3)2·6H2O (1.8), Ni(NO3)2·6H2O (0.3). Additionally, 1 g/L of yeast extract and 2 mL/L of minimum essential medium (MEM) vitamin solution were used to enhance the growth of selenium-reducing bacteria. The concentration of lactate, used as a carbon source and electron donor, was 2.24 g/L, while a final concentration of 114 mg/L NH4Cl and 28 mg/L Na2HPO4 were added as nitrogen and phosphorous sources, respectively. The pH was adjusted to 7.5 using sodium hydroxide.
2.3. Biofilter Setup and Operation
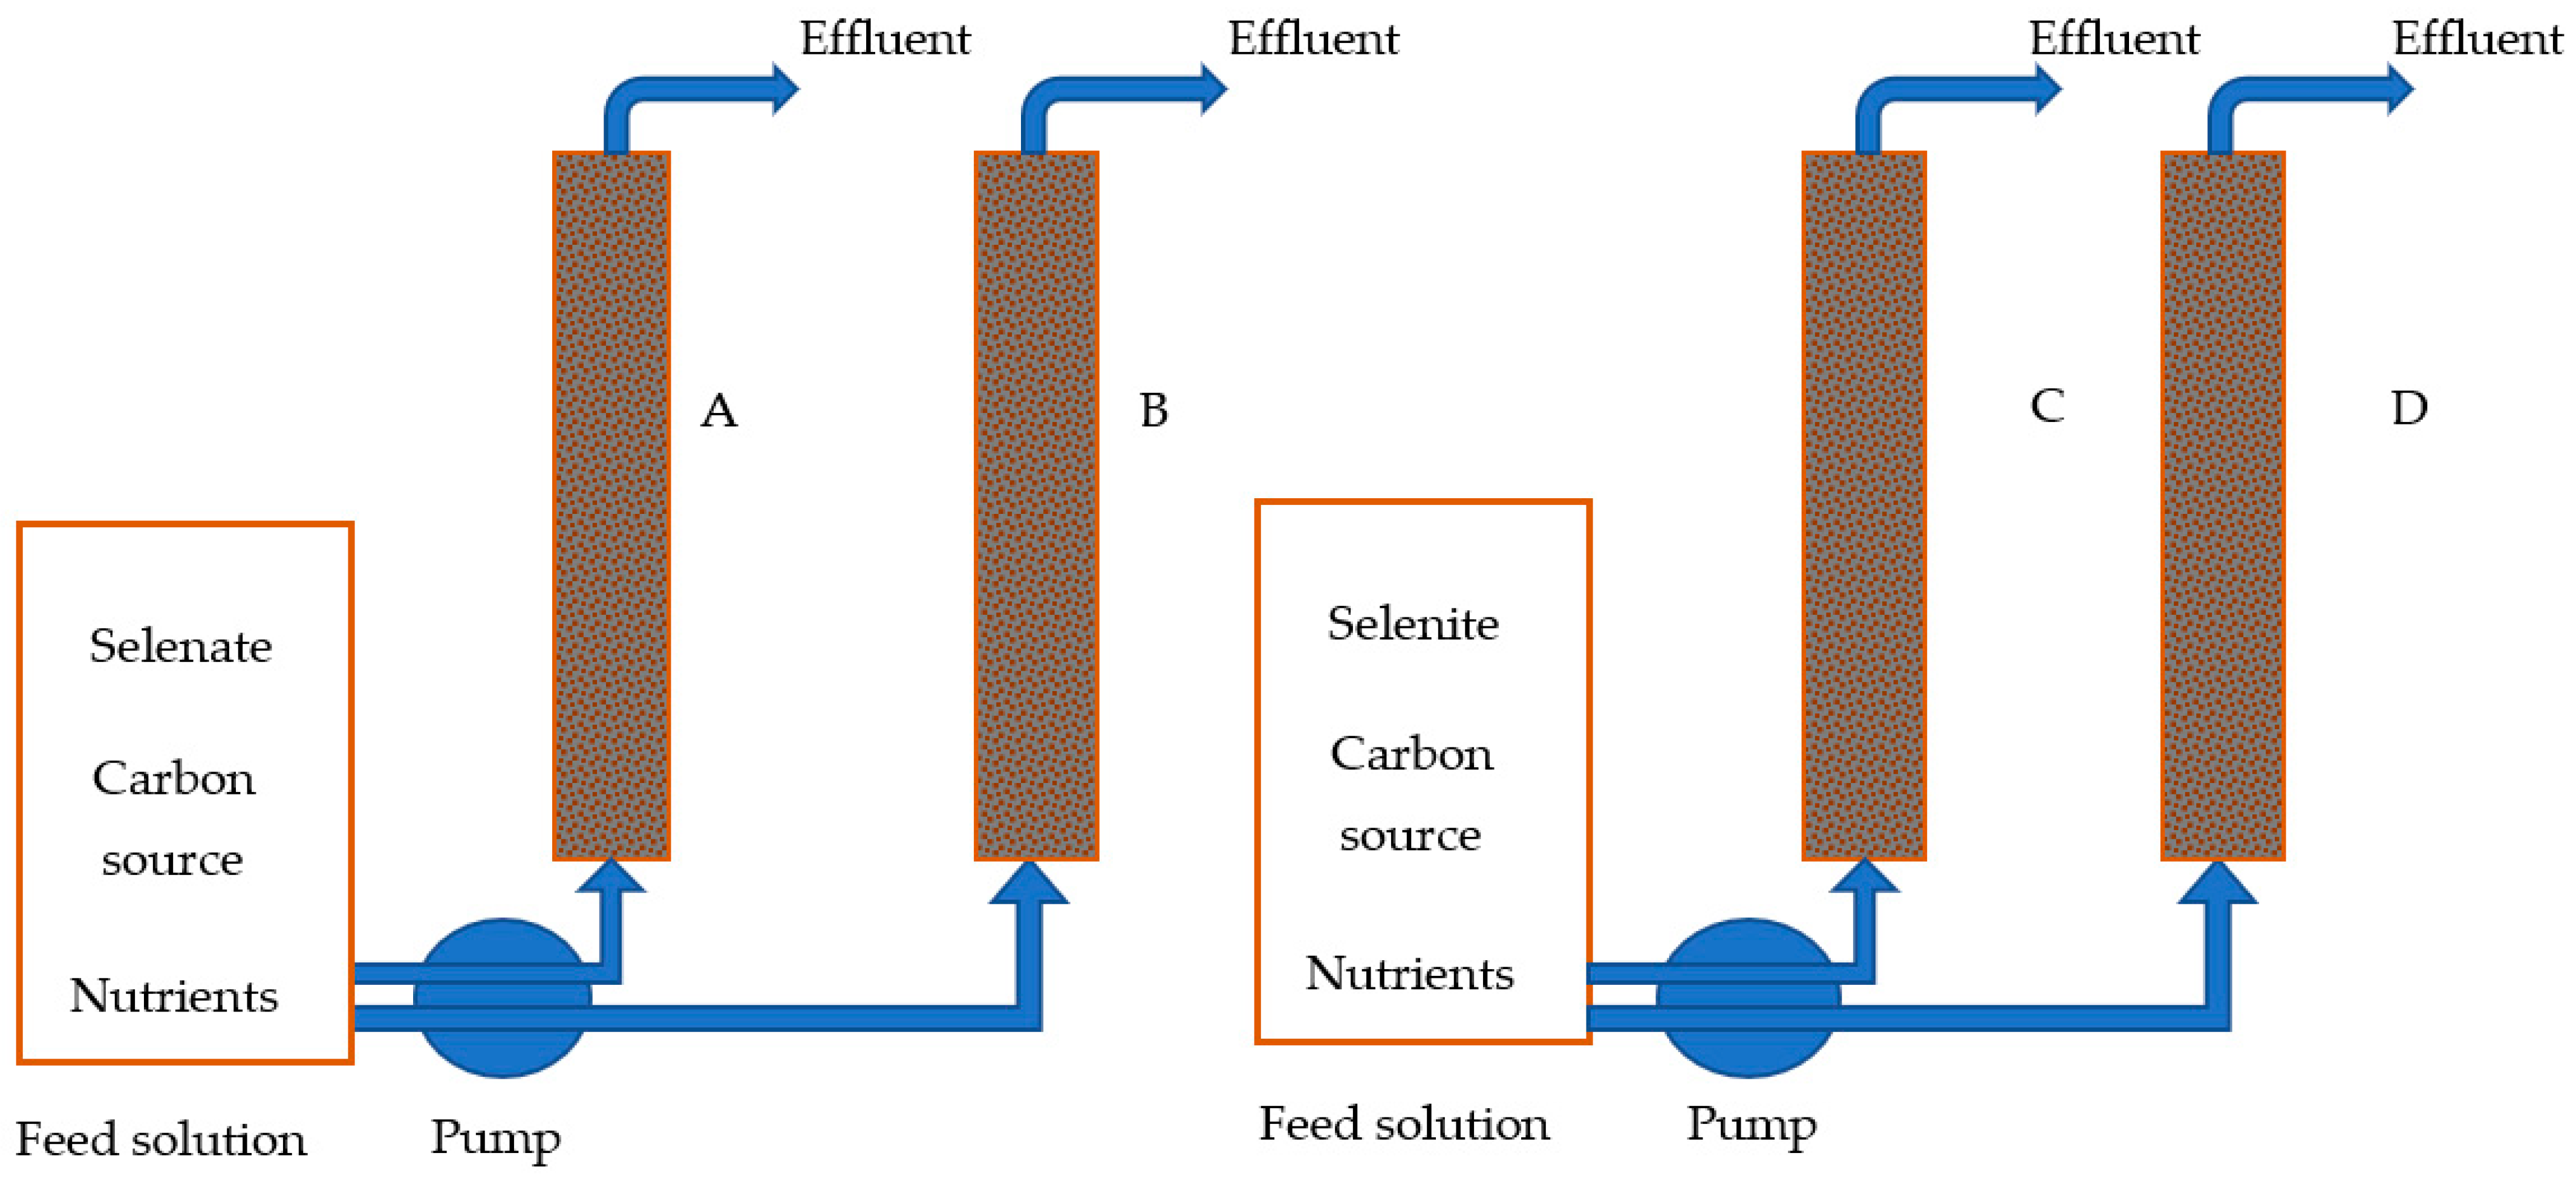
The biofiltration experiment included four filtration columns with an internal diameter of 50 mm and a filling length of 450 mm. Two columns were packed with natural (untreated and washed) zeolite while the other two were filled with 80% natural zeolite and 20% sodium-pretreated iron-modified zeolite (SPIMZ), by mass. The bed composition of each column is shown in Table 1. The schematic representation of the experimental column setup is shown in Figure 1. When packing columns A and C, natural zeolites and SPIMZ were well-mixed to achieve even distribution throughout the entire column. Approximately 200 mL of anaerobic sludge from the Las Cruces, NM, USA, Wastewater Treatment Plant was added as microbial inoculum. Sludge was added while packing the columns with the medium to ensure that the sludge was spread throughout the column. Before adding sludge, the zeolite medium was conditioned by injecting nutrient solution without selenium species or lactate. The upper and lower ends of the columns were packed with gravel layers with approximately 1-inch thickness to hold and avoid flushing out packing media. The fully packed columns were positioned vertically. The prepared influent was pumped vertically upwards continuously through the column by using a peristaltic pump at a flow rate of 3 mL/min, and the empty bed contact time of the biofilter was 300 min. This flow direction was selected to ensure that the columns were fully saturated.
2.4. Nutrient Optimization
During the first stage of operation, nutrients including ammonium chloride, sodium phosphate, and trace metals were added to the synthetic water in the amounts indicated in the synthetic wastewater preparation section. Continuous flow experiments were carried out for two weeks. During these two weeks, samples were collected and analyzed to ensure the operation of the columns was stabilized. At the same time, samples were analyzed to determine how much nitrogen and phosphorous amounts were available in the effluent samples. These values were used to determine the nutrient amounts that the microorganisms consumed. Throughout this time, the flowrate (3 mL/min), initial selenium concentration (790 μg/L), and pH (7.5) were kept constant. Based on the nutrient consumption results, sodium phosphate was reduced by 50% from the initial value while the other concentrations remained unchanged. Column experiments continued for another three weeks to determine whether the removal efficiencies remained the same under the new nutrient combination.
2.5. Effect of Initial Selenium Concentration
The bed composition was kept constant for each column run as shown in Table 1. Synthetic water containing selenate or selenite was pumped upwards at a constant flow rate of 3 mL/min. Two initial concentrations of Se (VI) and Se (IV) were used, namely 79 and 790 μg/L. Treated water sample collection and selenium ion analysis were performed as described in the following section.
2.6. Analytical Procedures
Samples from each column were collected two times per week. These samples were filtered through 0.45 µm filters to remove any biomass. Of the filtrate, 10 mL was preserved for total dissolved selenium analysis by adding 100 µL of analytical grade nitric acid. Total soluble selenium concentrations in the filtrate were analyzed using a Perkin Elmer ELAN DRC-e Inductively Coupled Plasma Mass Spectrometer (ICP-MS). Effluent samples from each column were also collected and tested for the concentration of chemical oxygen demand (COD), total nitrogen (TN), and total phosphorus (TP) using a benchtop spectrophotometer (DR 3900, HACH, Loveland, CO, USA) with the following HACH kits and reagents: COD kits (TNT 823), Nitrogen (Total) kits (TNT 826), and Phosphorus (Total) kits (TNT 843).
2.7. DNA Extraction Method and Bacterial Community Analysis
Bacterial community analysis was performed via next generation sequencing in the MiSeq Illumina platform. Amplicon sequencing of the V4 region of the 16S rRNA gene was performed with the barcoded primer set 515f/806r designed by Caporaso et al. 2011 and following the protocol by the Earth Microbiome Project (EMP) https://earthmicrobiome.org/protocols-and-standards/16s/ (retrieved on 8 May 2023) for library preparation. PCR amplifications for each sample were performed in duplicate, then pooled and quantified using an accublue kit. A no template control sample was included during the library preparation as a control for extraneous nucleic acid contamination. 240 ng of DNA per sample were pooled and then cleaned using a QIA quick PCR purification kit (QIAGEN, Hilden, Germany). The pool was quantified by using the qubit. Then, the DNA pool was diluted to a final concentration of 4 nM, then denatured and diluted to a final concentration of 4 pM with a 25% of PhiX. Finally, the DNA library was loaded in the MiSeq Illumina and run using the version 2 module, 2 × 250 paired end, following the directions of the manufacturer.
3. Results and Discussion
3.1. Characteristics of Modified Zeolite
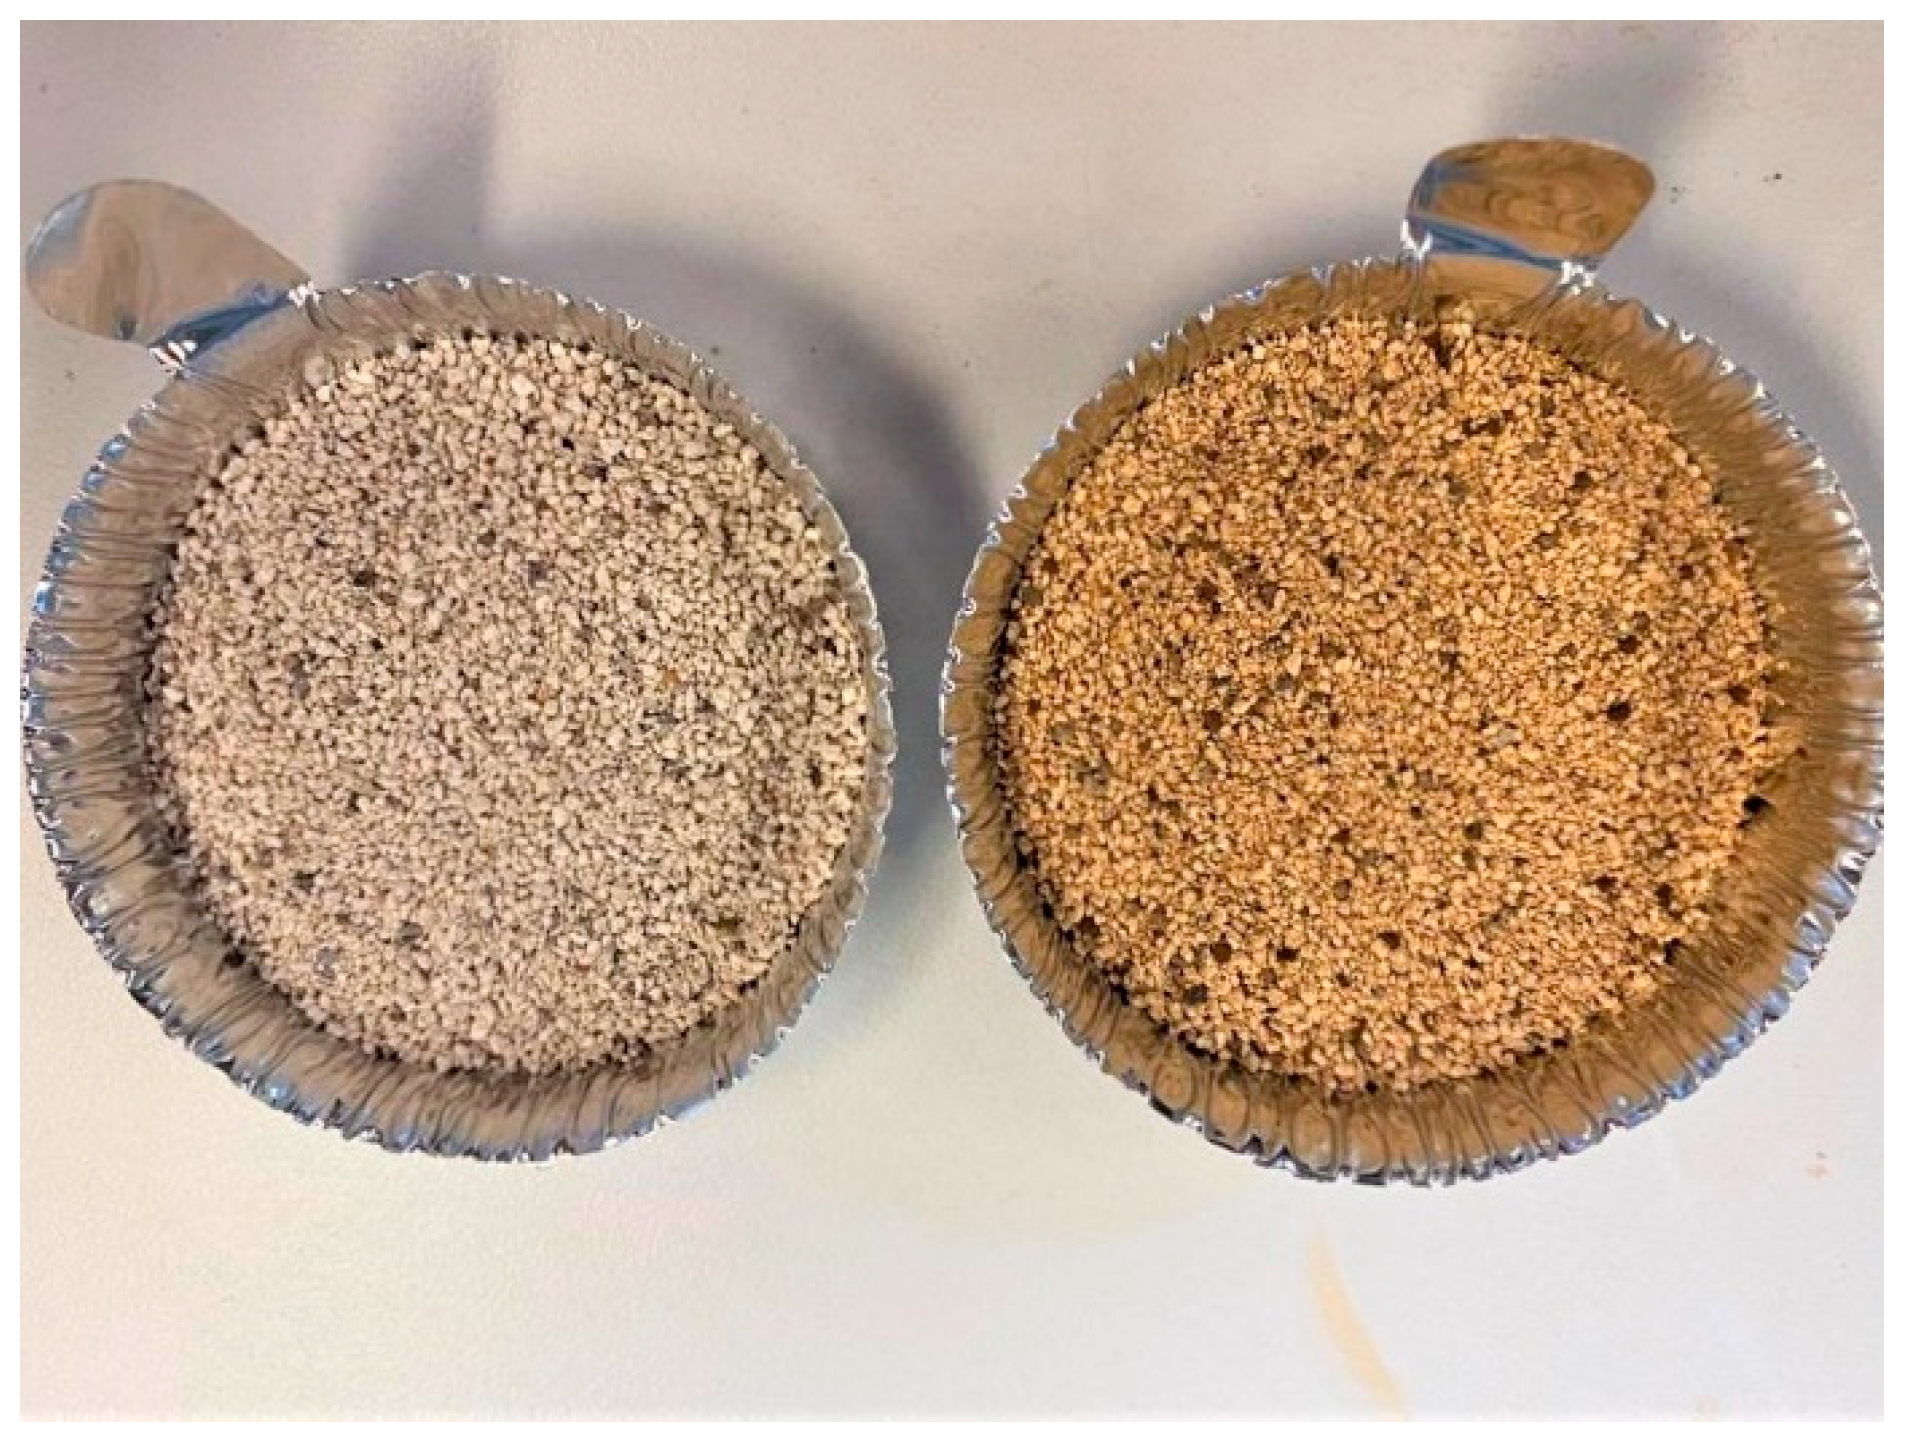
The distinct physical appearance of natural zeolite and sodium-pretreated iron-modified zeolite can be seen in Figure 2. Sodium-pretreated iron-modified zeolite has a brownish yellow color compared to the unmodified zeolite. This confirms the formation of the ferric hydroxide layer on zeolite.
Table 2 shows the elemental percentage composition, by mass, of natural and sodium-pretreated iron-modified zeolite. As expected, silicon (Si), aluminum (Al), and oxygen (O) are the main components of this aluminosilicate mineral framework, which is formed by interconnected aluminum and silicon tetrahedra coordinated through shared oxygen atoms.
Based on the results from the SEM-EDX analysis, it appears that the sodium pretreatment resulted in increased sodium concentration in SPIMZ compared to the natural zeolite (0.8 vs. 0.3%, respectively), whereas the calcium concentration was reduced from 3.3% to 2.7%. Effectively then, sodium replaced some of the calcium in the zeolite matrix, as expected. Other monovalent and divalent cations, such as magnesium and potassium, were largely unchanged (Table 2). A significant difference can be observed when comparing the iron content of modified and unmodified zeolite. As per the analytical results, natural zeolite contains 1.1% of iron, whereas in the SPIMZ the iron content increased to 4.0%, almost fourfold. The iron coating was expected to increase the number of sorption sites for anions significantly.
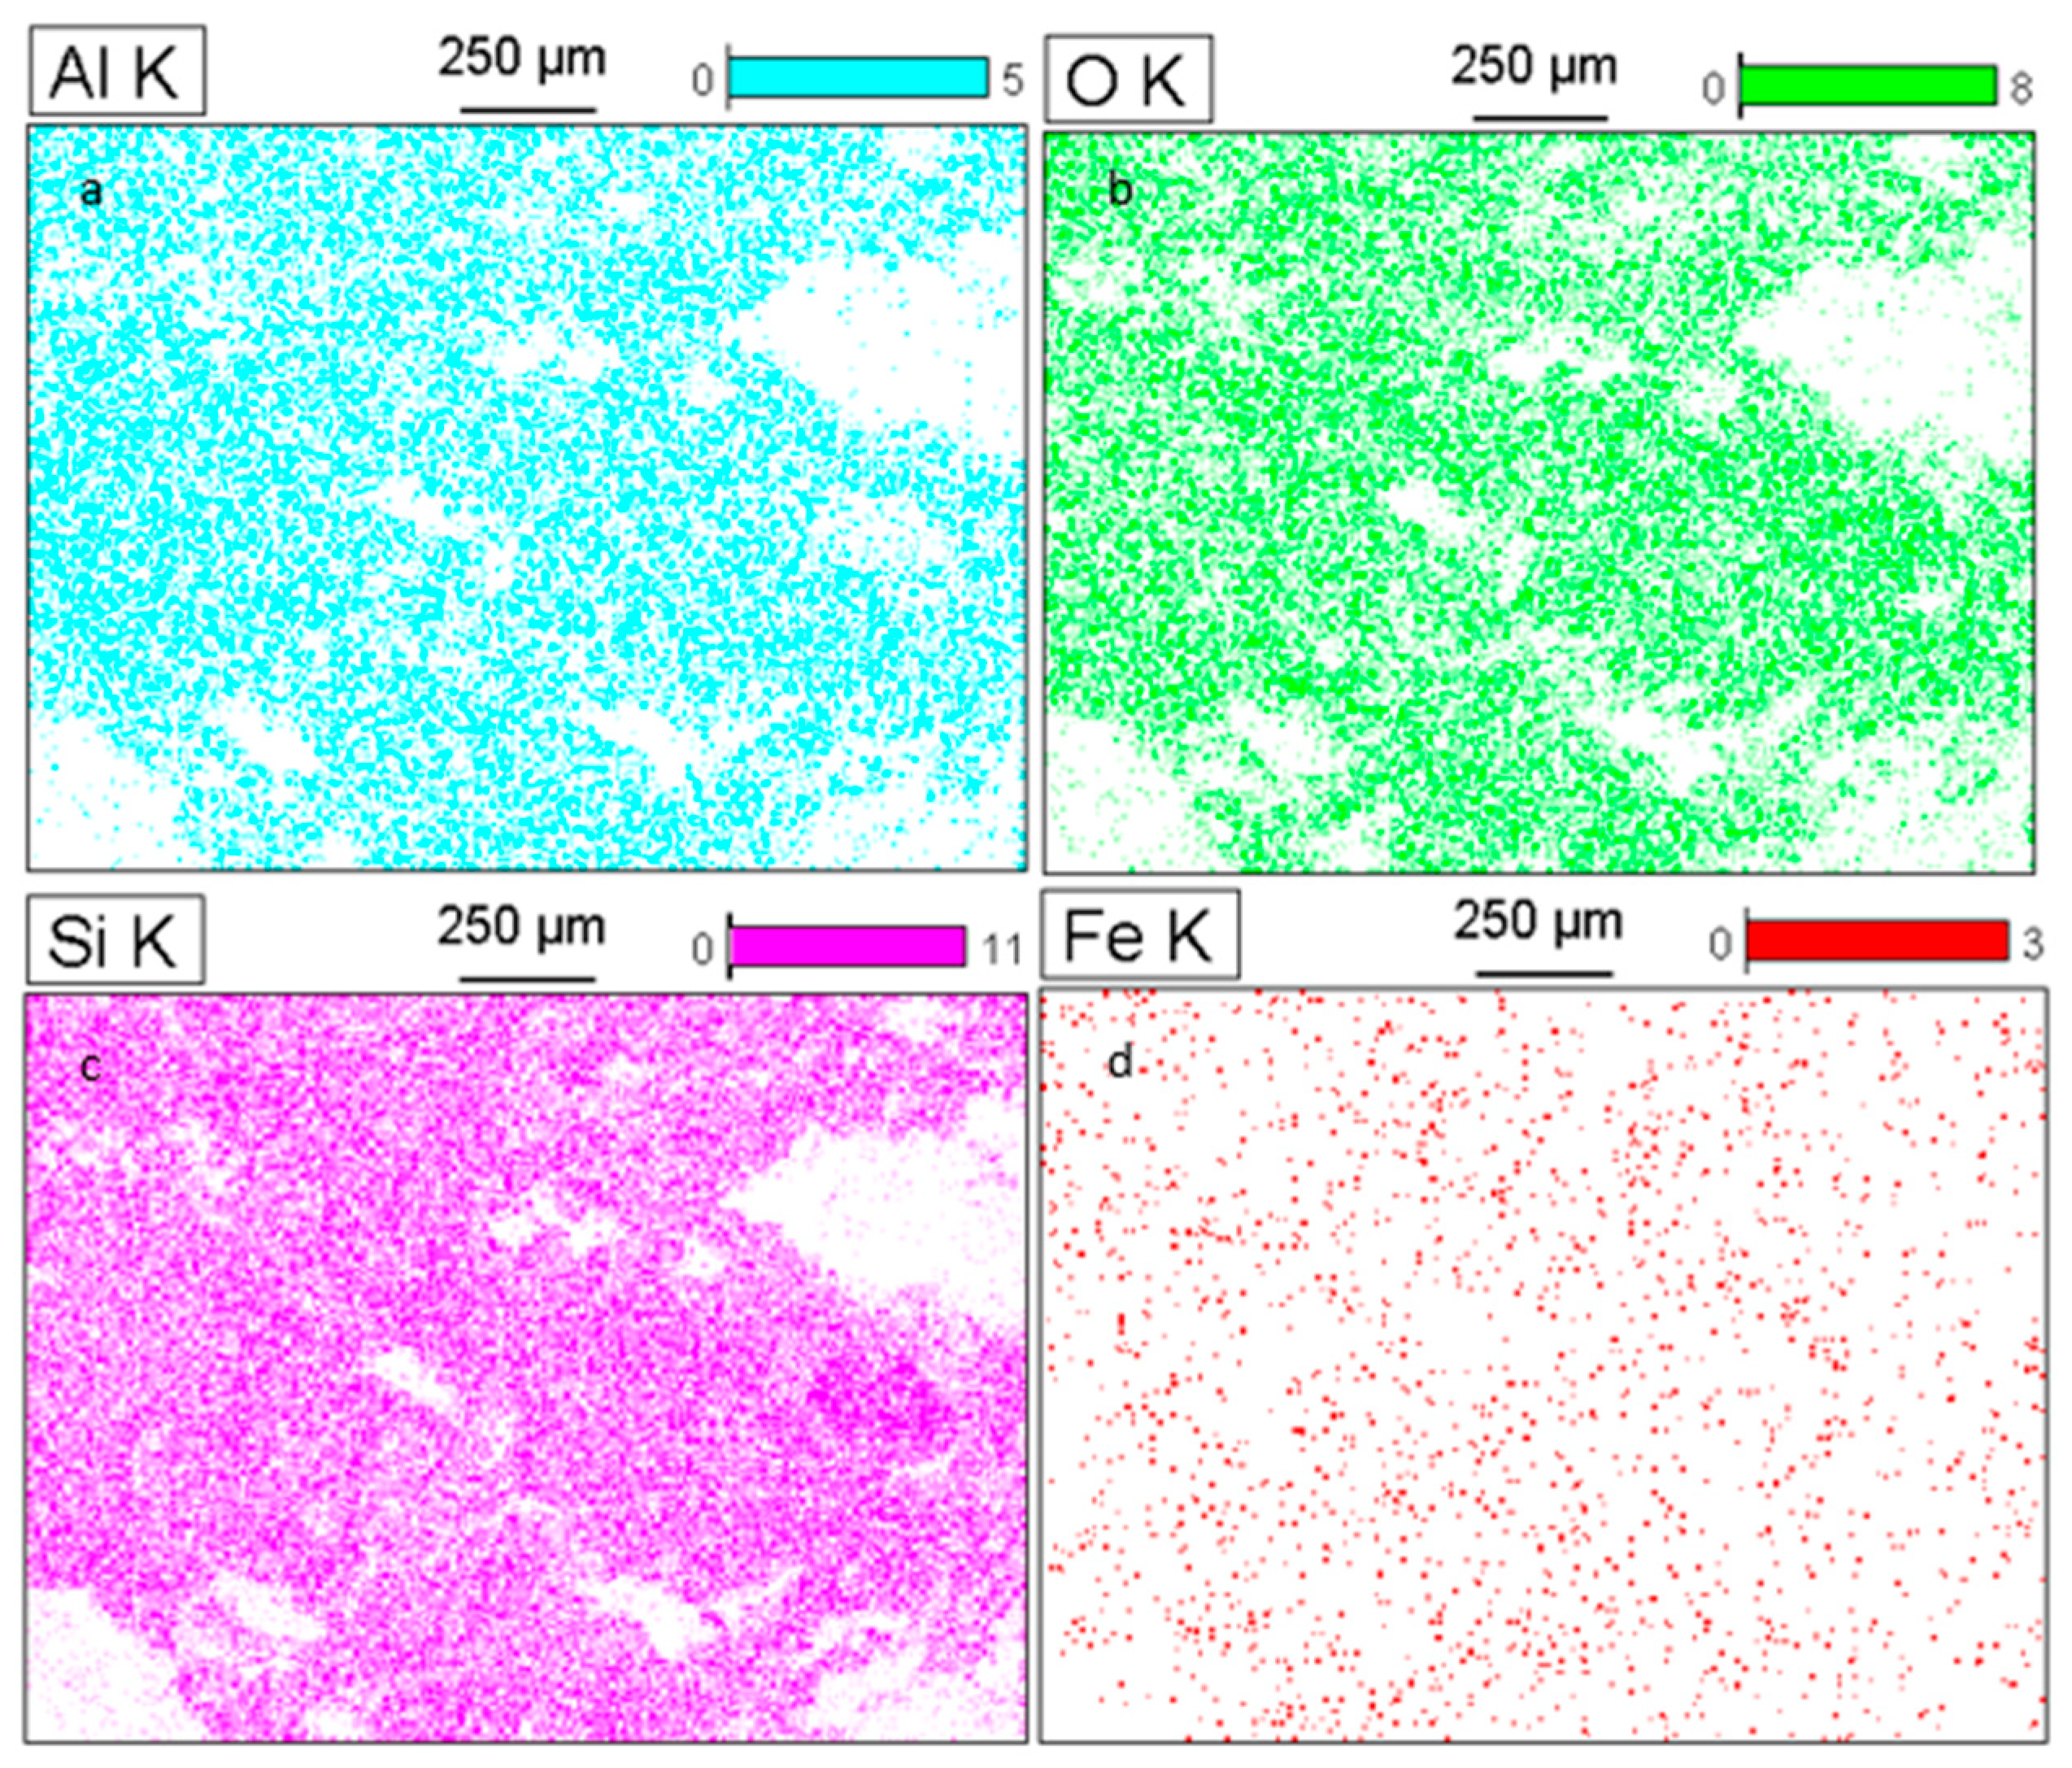
SEM-EDX elemental mapping images (Figure 3) show that aluminum, oxygen, and silicon occupy the same areas of SPIMZ, as expected given that they form the zeolite framework. The details of iron mapping reveal that the iron coating is uniform over the zeolite surface and that the iron abundance is lower compared to Al, O, and Si.
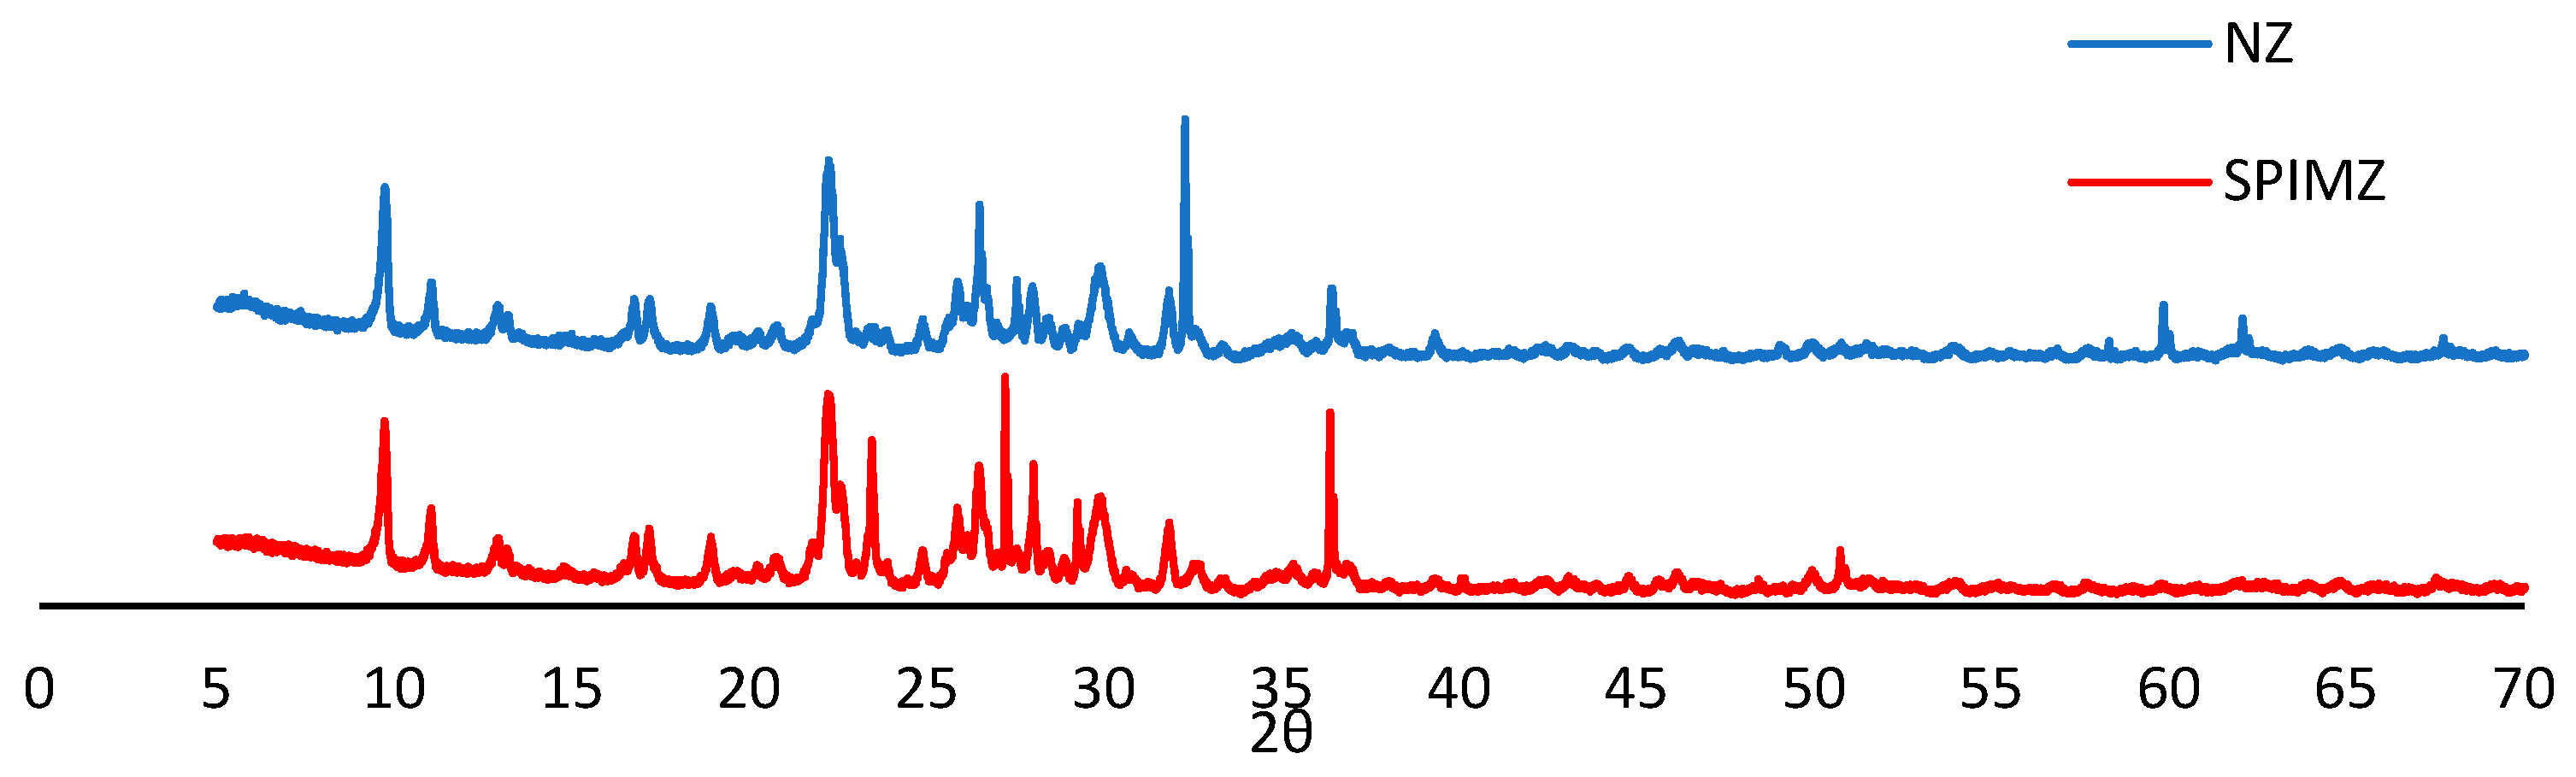
The XRD spectra of natural zeolite and SPIMZ are shown in Figure 4. The peaks at 2θ 22°, 23°, and 28° are indicative of clinoptilolite, the major component of the natural zeolite used in this study [20]. Compared to the natural zeolite, SPIMZ contains additional peaks because of the presence of the iron coating [20,21].
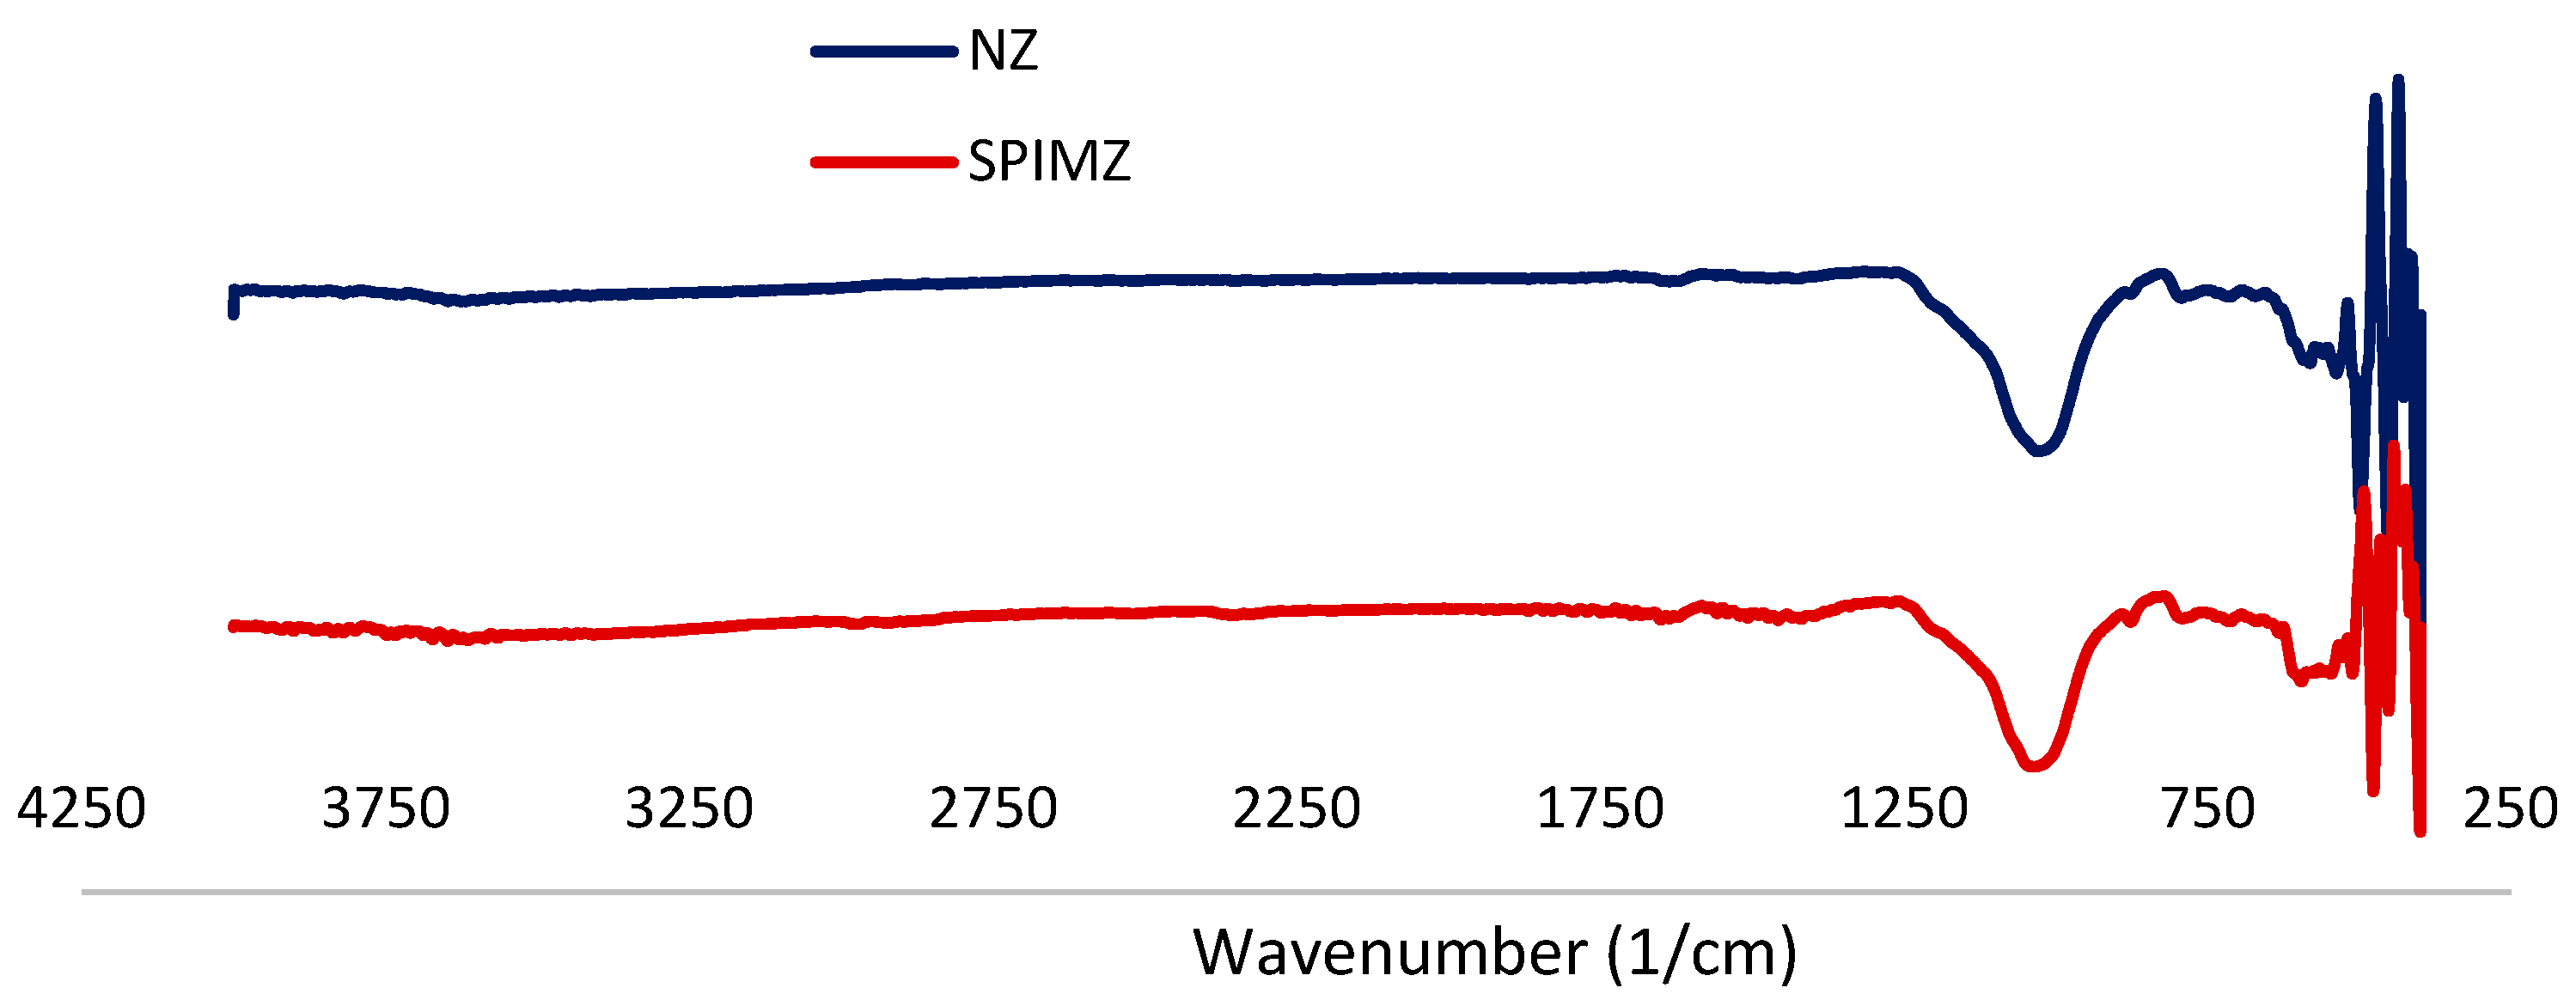
The FTIR spectra of zeolite before and after modification are shown in Figure 5. The peak at 1067 cm−1 is similar in both spectra, which can be O-Si-O and O-Al-O as 300–1300 cm−1 wave numbers are tetrahedral bonds. In both spectra, we can see peaks in the region 410–500 cm−1, which stands for the internal bonds Si-O/Al-O (Fe-O) [14]. Compared to NZ, SPIMZ contains additional patterns in the wavenumber ranges 1350–1850 and 3550–3850 cm−1. These are more likely to correspond to Fe-O and Fe-OH in the ferric oxide coating. The O-H peaks appear at 3636 cm−1 [22,23].
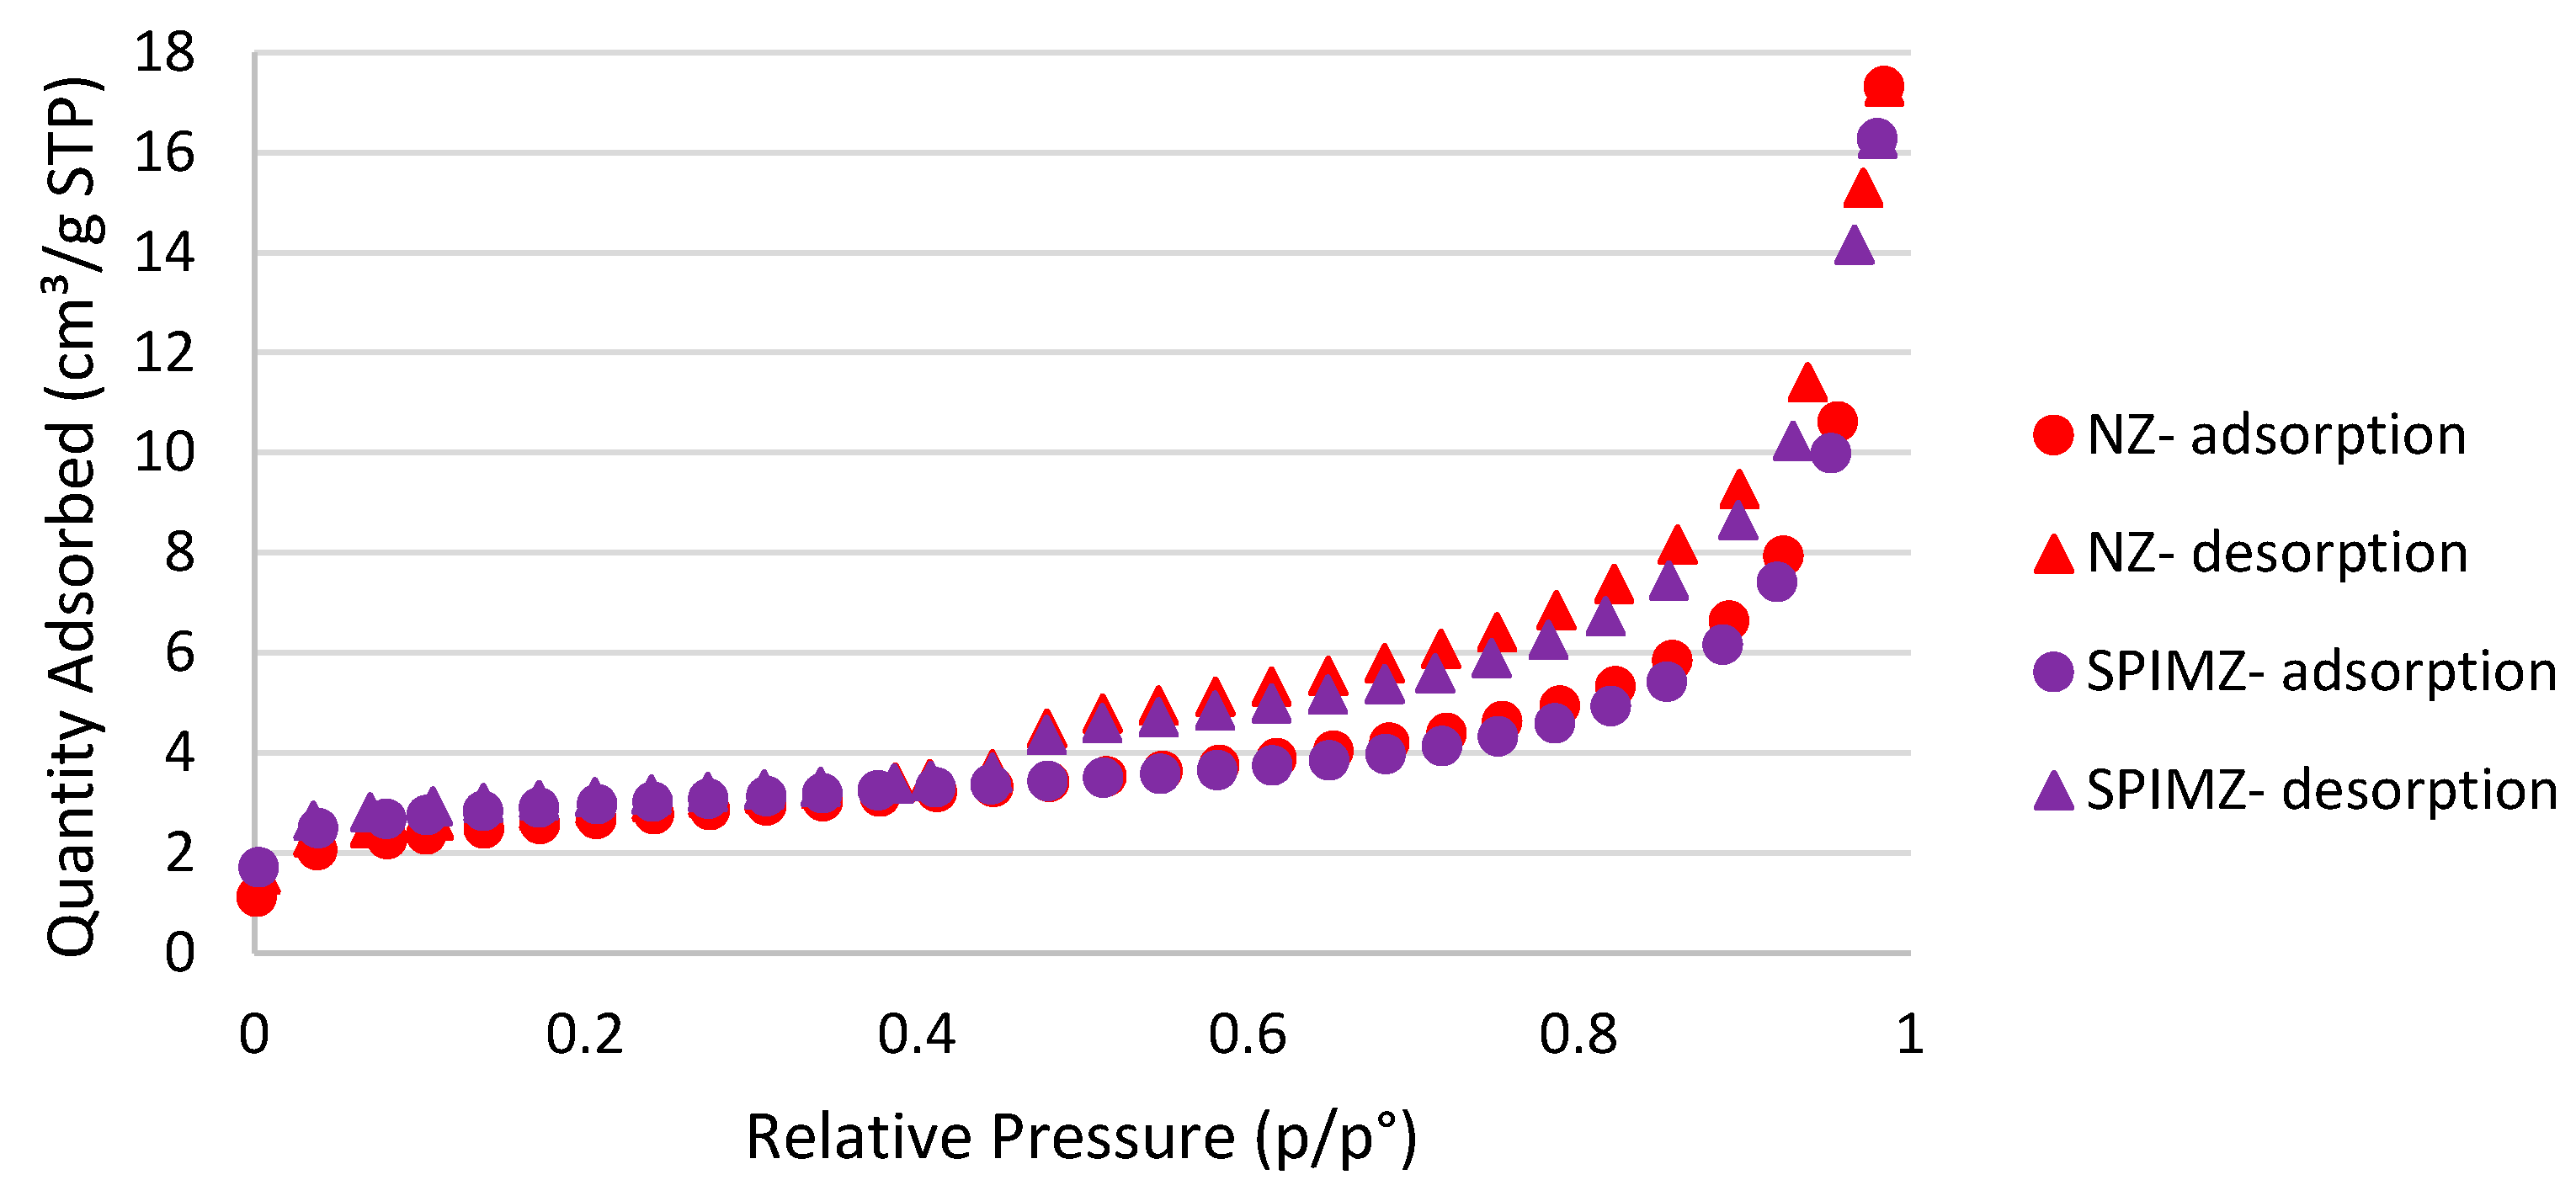
The adsorption-desorption isotherms for N2 gas on both zeolite types are type IV isotherms with type H4 hysteresis loops (Figure 6). The pore structures leading to H4 type hysteresis loops include narrow slit-like pores, particles with internal voids of irregular shape and broad size distribution, and hollow spheres with walls composed of ordered mesoporous silica. Compared to natural zeolite, SPIMZ has a slightly smaller average pore width and higher BET surface area. The iron coating is likely responsible for the increased specific surface area and reduced pore width of the zeolite particles. Pore width distribution analysis reveals that the majority of the surface area of both zeolite types was contributed by mesopores, defined as pores with diameter or width 2–50 nm. However, compared to NZ, in SPIMZ slightly less surface area is associated with mesopores. The slight increase in specific surface in SPIMZ compared to NZ can be attributed to the high surface area of disordered iron hydroxides. The summary of the surface area and porosity parameters of the adsorbents is given in Table 3.
3.2. Effect of Bed Composition and Overall Performance of Columns
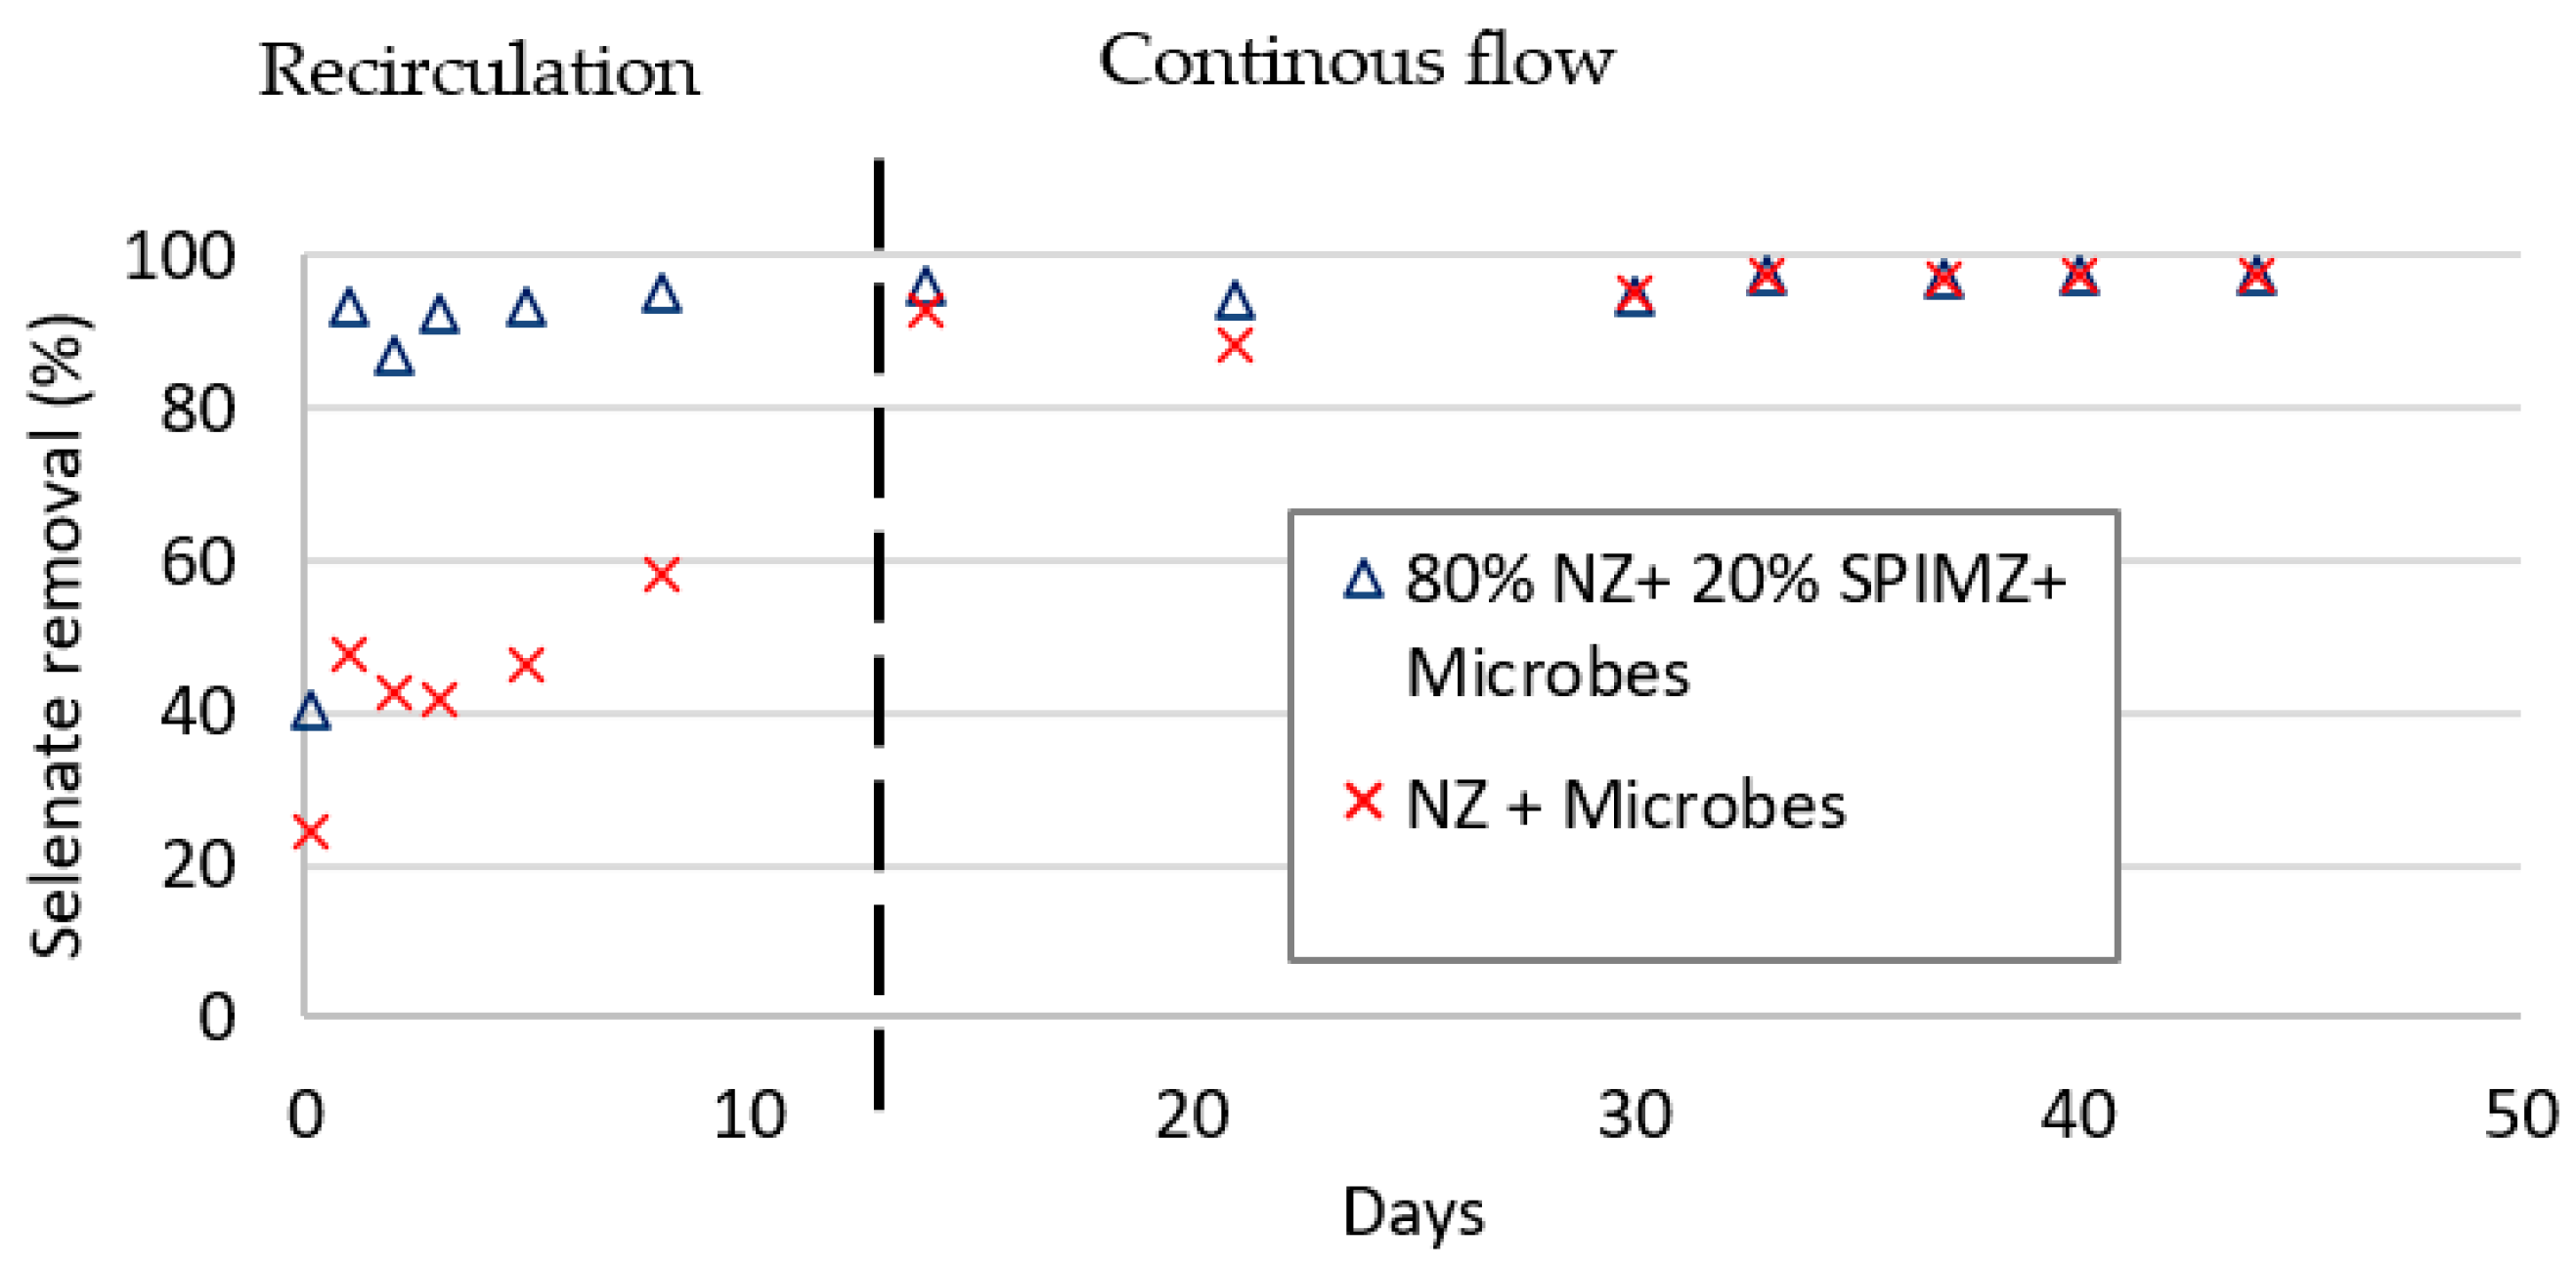
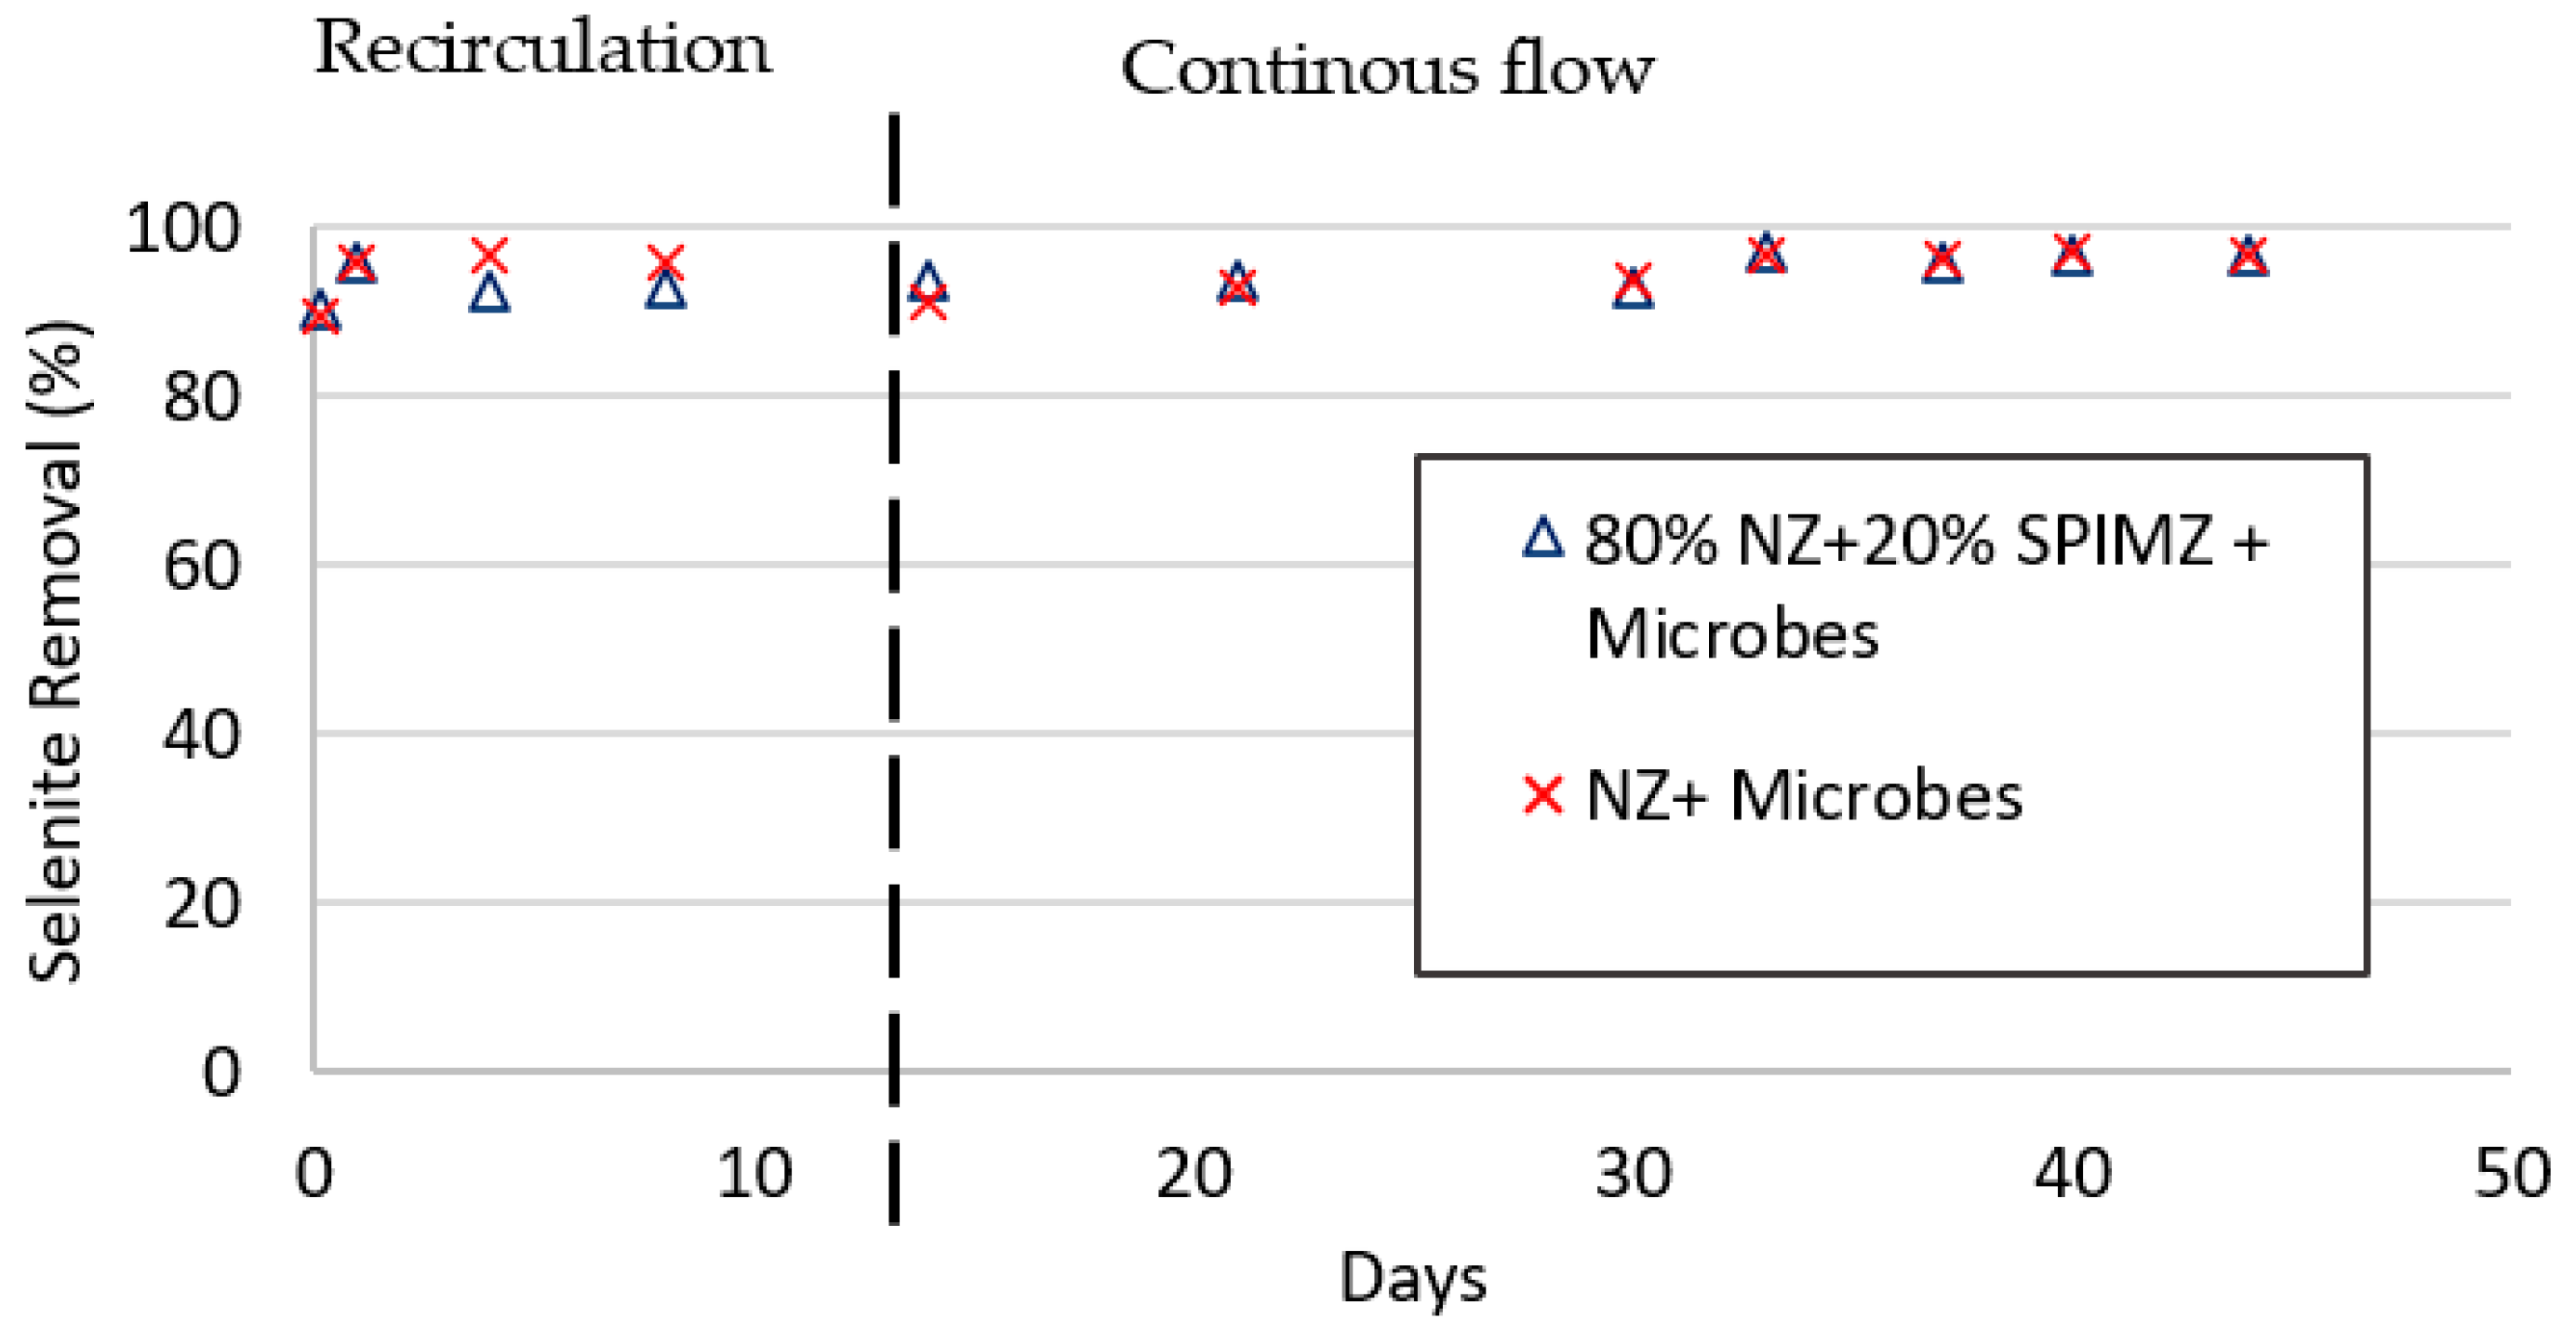
The selenium removal in all columns is shown in Figure 7 and Figure 8. During the first 14 days there was a higher removal of selenite compared to selenate. The difference between the columns fortified with SPIMZ compared to those containing natural zeolite only was more pronounced in the case of selenate, compared to the selenite columns. This behavior is consistent with selenium oxyanion sorption on iron (hydr)oxides and previous studies of selenium oxyanion partitioning at the mineral–water interface. Compared to selenate, the higher extent of selenite uptakes and higher affinity for oxide surfaces has also been reported [24,25]. The adsorption of selenite and selenate onto surface groups of mineral surfaces can be attributed to the formation of inner-sphere and outer-sphere surface complexes, respectively. During inner-sphere complex formation, a coordination bond is formed between the zeolite surface and the sorbing species. In contrast, during outer-sphere complex formation sorbing ions retain their shell of coordinated water molecules, leading to a greater distance between the sorbing ion and the surface. As a result, the bond leading to an ion pair formation is weaker and mainly of an electrostatic nature [26]. This finding is consistent with the formation of inner- and outer-sphere complexes for selenite and selenate, respectively. In addition, size exclusion effects appear to be the other reason that could explain the lower degree of selenate uptake compared to selenite. The ionic radii for selenite and selenate are 2.39 Å and 2.49 Å, respectively [27,28]. The smaller size selenite anions may access some of the internal micropores within the zeolites, while the larger selenate ion may be excluded from some portion of these internal pores [24].
Furthermore, during the first 14 days, as expected, selenate removal in the column with coated zeolite was approximately twice as high compared to the natural zeolite column. Maximum selenite removal was 89% in the column with modified zeolite. This result is evidence that the iron coating on the zeolite surface results in increased removal of selenium oxyanions. Previously conducted studies [14,25] with iron-oxide-coated adsorbents for selenium and other anion removal from waters have reported high adsorption capacities compared to unmodified adsorbents. In addition, it was reported that Se (VI) adsorption proceeds via the formation of Se–O–Fe bonds, whereas for Se (IV), it seems likely that not only Se–O–Fe bonds, but also Se–O–Si bonds are formed during adsorption [25]. Additionally, iron oxide coating has been previously identified as a factor in increasing total surface acidic groups of different adsorbents such as pumice and slag, leading to enhanced uptake of selenate and selenite oxyanions compared to the natural form. Considering the surface acidity and pH is important because oxyanion adsorption is expected to be affected by electrostatic interactions between particle surfaces and negatively charged selenate or selenite species [24]. As the pH decreases and amphoteric surfaces become increasingly more positively charged, sorption of negatively charged oxyanions is expected to increase. On the other hand, the main adsorption mechanism of selenite, and to a lesser extent selenate, anions on iron oxide surfaces may be strong surface complexation-ligand exchange reactions, in which –OH groups on iron oxide surfaces may be replaced by selenium oxyanions [29,30,31].
After 14 days, regardless of the bed composition, selenium removal reached approximately 99% removal under all conditions (Figure 7 and Figure 8). This suggests that a specialized selenium-reducing microbial population developed inside the columns. The results are consistent, with the dominant removal mechanism in the early stage being sorption on zeolite, while later microbial reduction with the growth of microorganisms was most likely the predominant selenium removal mechanism. So, initially at least, the presence of iron coated zeolites appears to be beneficial, even in columns containing a relatively small percentage (20%) of coated zeolites.
Initially, the microbial reduction was low because aerobic conditions still prevailed inside the columns. The redox state inside the columns has a substantial effect on selenium reduction, given that microbial selenium reduction can only occur under anaerobic conditions. Accumulation of red elemental selenium nanospheres could be observed inside the tubing, and the red coloration in the solids that were generated from the reaction was assumed to be indicative of elemental selenium [2,32]. The rapid appearance of elemental selenium suggests that selenium-reducing bacteria (SeRB) are ubiquitous and metabolically active in the anaerobic sludge, and that they were enriched in the zeolite column for the reduction in selenite and selenate.
In applying biological treatment methods, suspended particles in the influent and effluent represent a challenge. In field applications, a sand column can be added as pretreatment to remove suspended particles in wastewater before selenium bioreduction. Another sand column could be used as post-treatment to remove any washed-out biomass from the biofilter.
3.3. Nutrient Consumption Evaluation and Feed Source Optimization
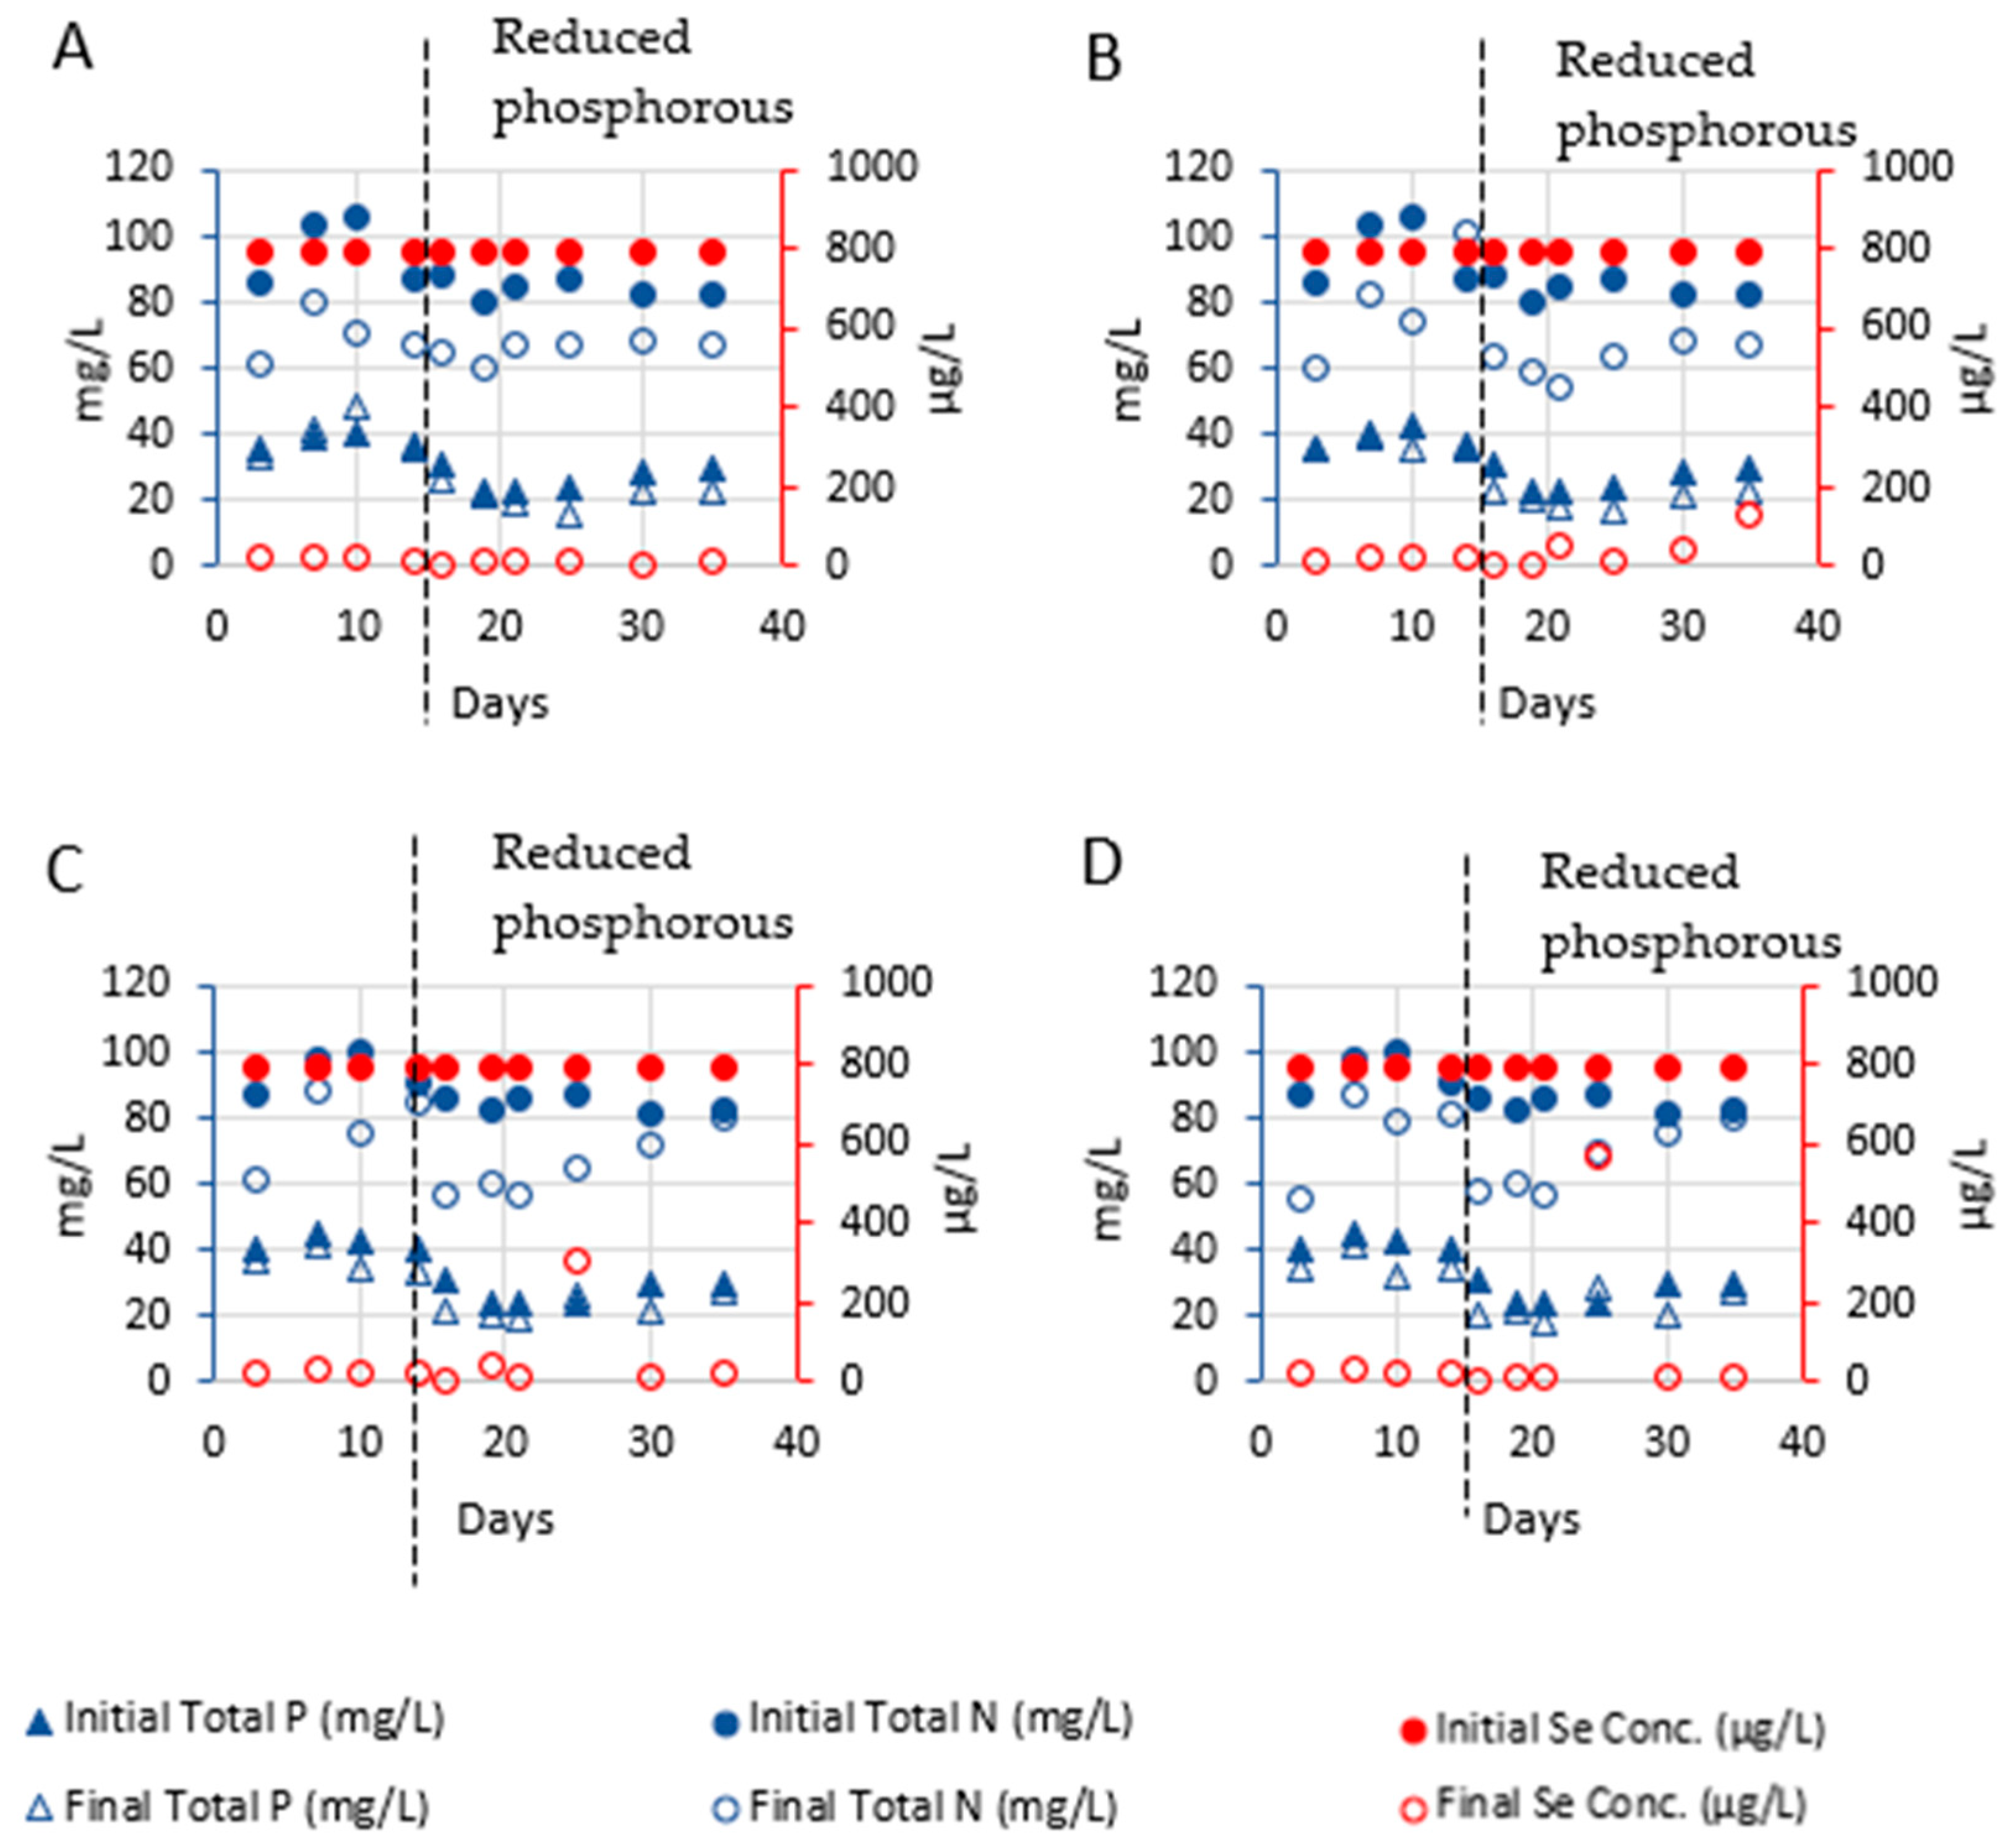
During the operation, lactate was added as an electron donor for selenium reduction, while NH4Cl and Na2HPO4 were added to provide the nutrients for bacterial growth. The nutrient concentrations were optimized in this study to enhance selenium reduction and avoid secondary contamination caused by excess nutrients. The selenium removal efficiencies, nitrogen consumption, and phosphorous consumption are shown in Figure 9. COD consumption is given in Table 4. Results were generated by monitoring the water quality parameters (selenium concentration, COD, nitrogen concentration, and phosphorous concentration) in influent water samples and effluent water samples collected from each column over five weeks under continuous flow (3 mL/min) conditions.
It can be observed that the combined systems achieved the highest level of reduction, which is about 99% for all four columns. However, nitrogen and phosphorous sources are still available in significant amounts in the treated water. Only 20–30% of the nitrogen source was used, and phosphorous consumption was even less. This suggests that the microorganisms had more than enough nutrients and could be considered to have contributed to their maximum capacity of selenium removal by biological reduction. It is essential to understand the behavior of the lactate, which serves as the primary carbon source, electron donor, and energy source for the microorganisms within the columns. The COD reduction in each column, which is approximately equal to the carbon source consumption by microbes, is shown in Table 4. COD reduction is the difference between the COD of the influent water and the COD of the effluent. Yeast and lactate make up the COD of the influent. By contrast, residual yeast, residual lactate, any new organic compound derived from the reaction, and dead microbial cells make up the COD of the treated water. In the microbial reduction process, part of the lactic acid could be reduced to propionic acid, and part of the lactic acid could be oxidized to acetate [32].
Compared to selenite reduction, selenate reduction consumes more of the electron donor. This result is obvious, as selenate needs more energy and electrons (6) to be converted to elemental selenium, while selenite needs comparably less energy and fewer electrons (4). Furthermore, selenate reduction could occur in two ways, either direct reduction to elemental selenium or intermediate reduction to selenite, followed by reduction to elemental selenium [32]. However, High-Performance Liquid Chromatography (HPLC) analysis for selenium speciation of effluent samples collected from the columns over three weeks of continuous running does not show evidence of intermediate selenite formation or selenide production. This result is consistent with the research conducted by Lenz et al. [33] and Halalsheh [15]. These earlier studies were performed at pH 7 and 30 °C and pH 7.5 and room temperature, respectively, using the same electron donor as the current study.
Besides reduction, the methylation of selenite can also contribute to electron donor losses [32]. Since the COD reduction in selenite removal shows lower values, it can be assumed that neither methylated compounds nor selenide were formed during the continuous flow experiments. This statement is consistent with the obtained speciation analysis results of the effluent obtained using HPLC. Neither methylated compounds nor selenide were detected during the speciation analysis. Even though there is residual lactate, the contact time could have been too short for methylated selenium compounds to develop. Clearly, formation of such toxic compounds would have to be addressed if the process were to be accepted. Therefore, it is important to control the electron donor concentration to avoid selenium reduction to selenide and methylation, as well as to minimize the electron donor cost [32].
One of the major costs of operating a biological reactor system is the carbon source- electron and nutrient feed [11,34]. To reduce the feed for the current bioremediation system, carbon source and nutrient consumption were evaluated. As one can observe in Figure 9, reducing the phosphorous source by 50% compared to the initial amount did not negatively impact selenium reduction. Even with the reduced amount of phosphorous introduced, there is still residual phosphorous available, which suggests that further reduction is still possible. Nitrogen and carbon sources can also be further reduced. On the other hand, reducing feed sources is advantageous because it enhances effluent quality and reduces the treatment cost. In addition, the residual nitrogen and phosphorous in the treated water increase the risk of eutrophication and adverse health impacts. In principle, the nitrogen and phosphorous amount in the feed should be reduced to minimize the concentrations available in the treated water while keeping the desired selenium removal efficiency.
Although selenite reduction in the columns stabilized after nutrient optimization, a fluctuation can be seen on the 25th day (Figure 9). This observation is likely due to the lack of anaerobic conditions at this time in the columns. However, by the 30th day, both columns show complete selenite reduction suggesting that favorable anaerobic conditions were reestablished within a short period of time.
3.4. Effect of Initial Selenium Concentration
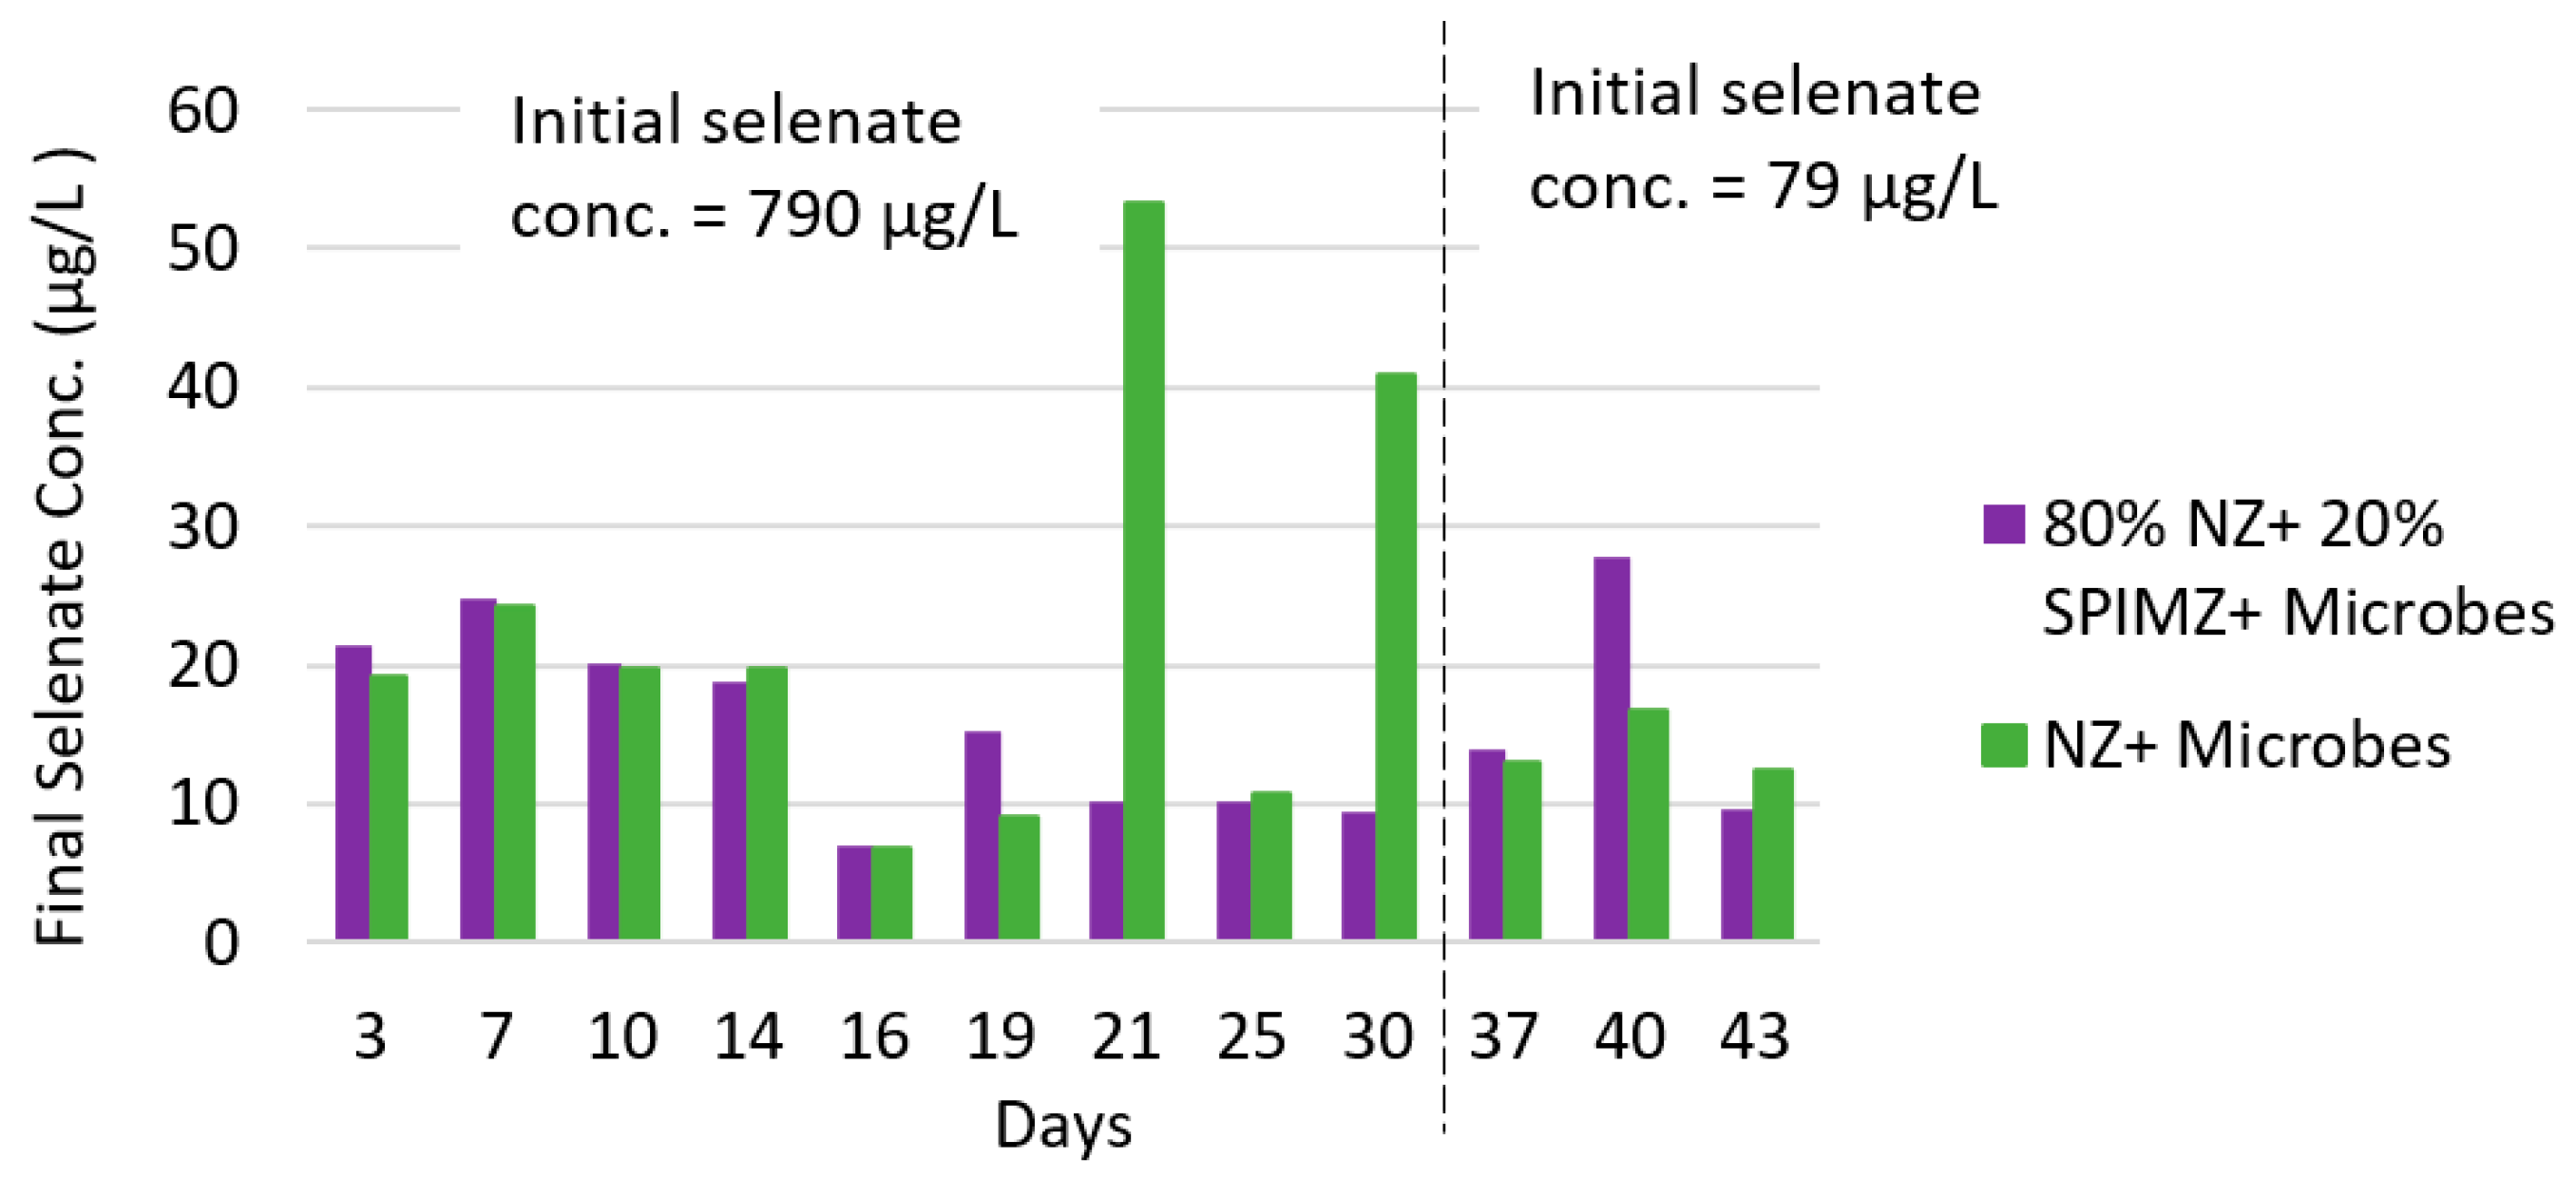
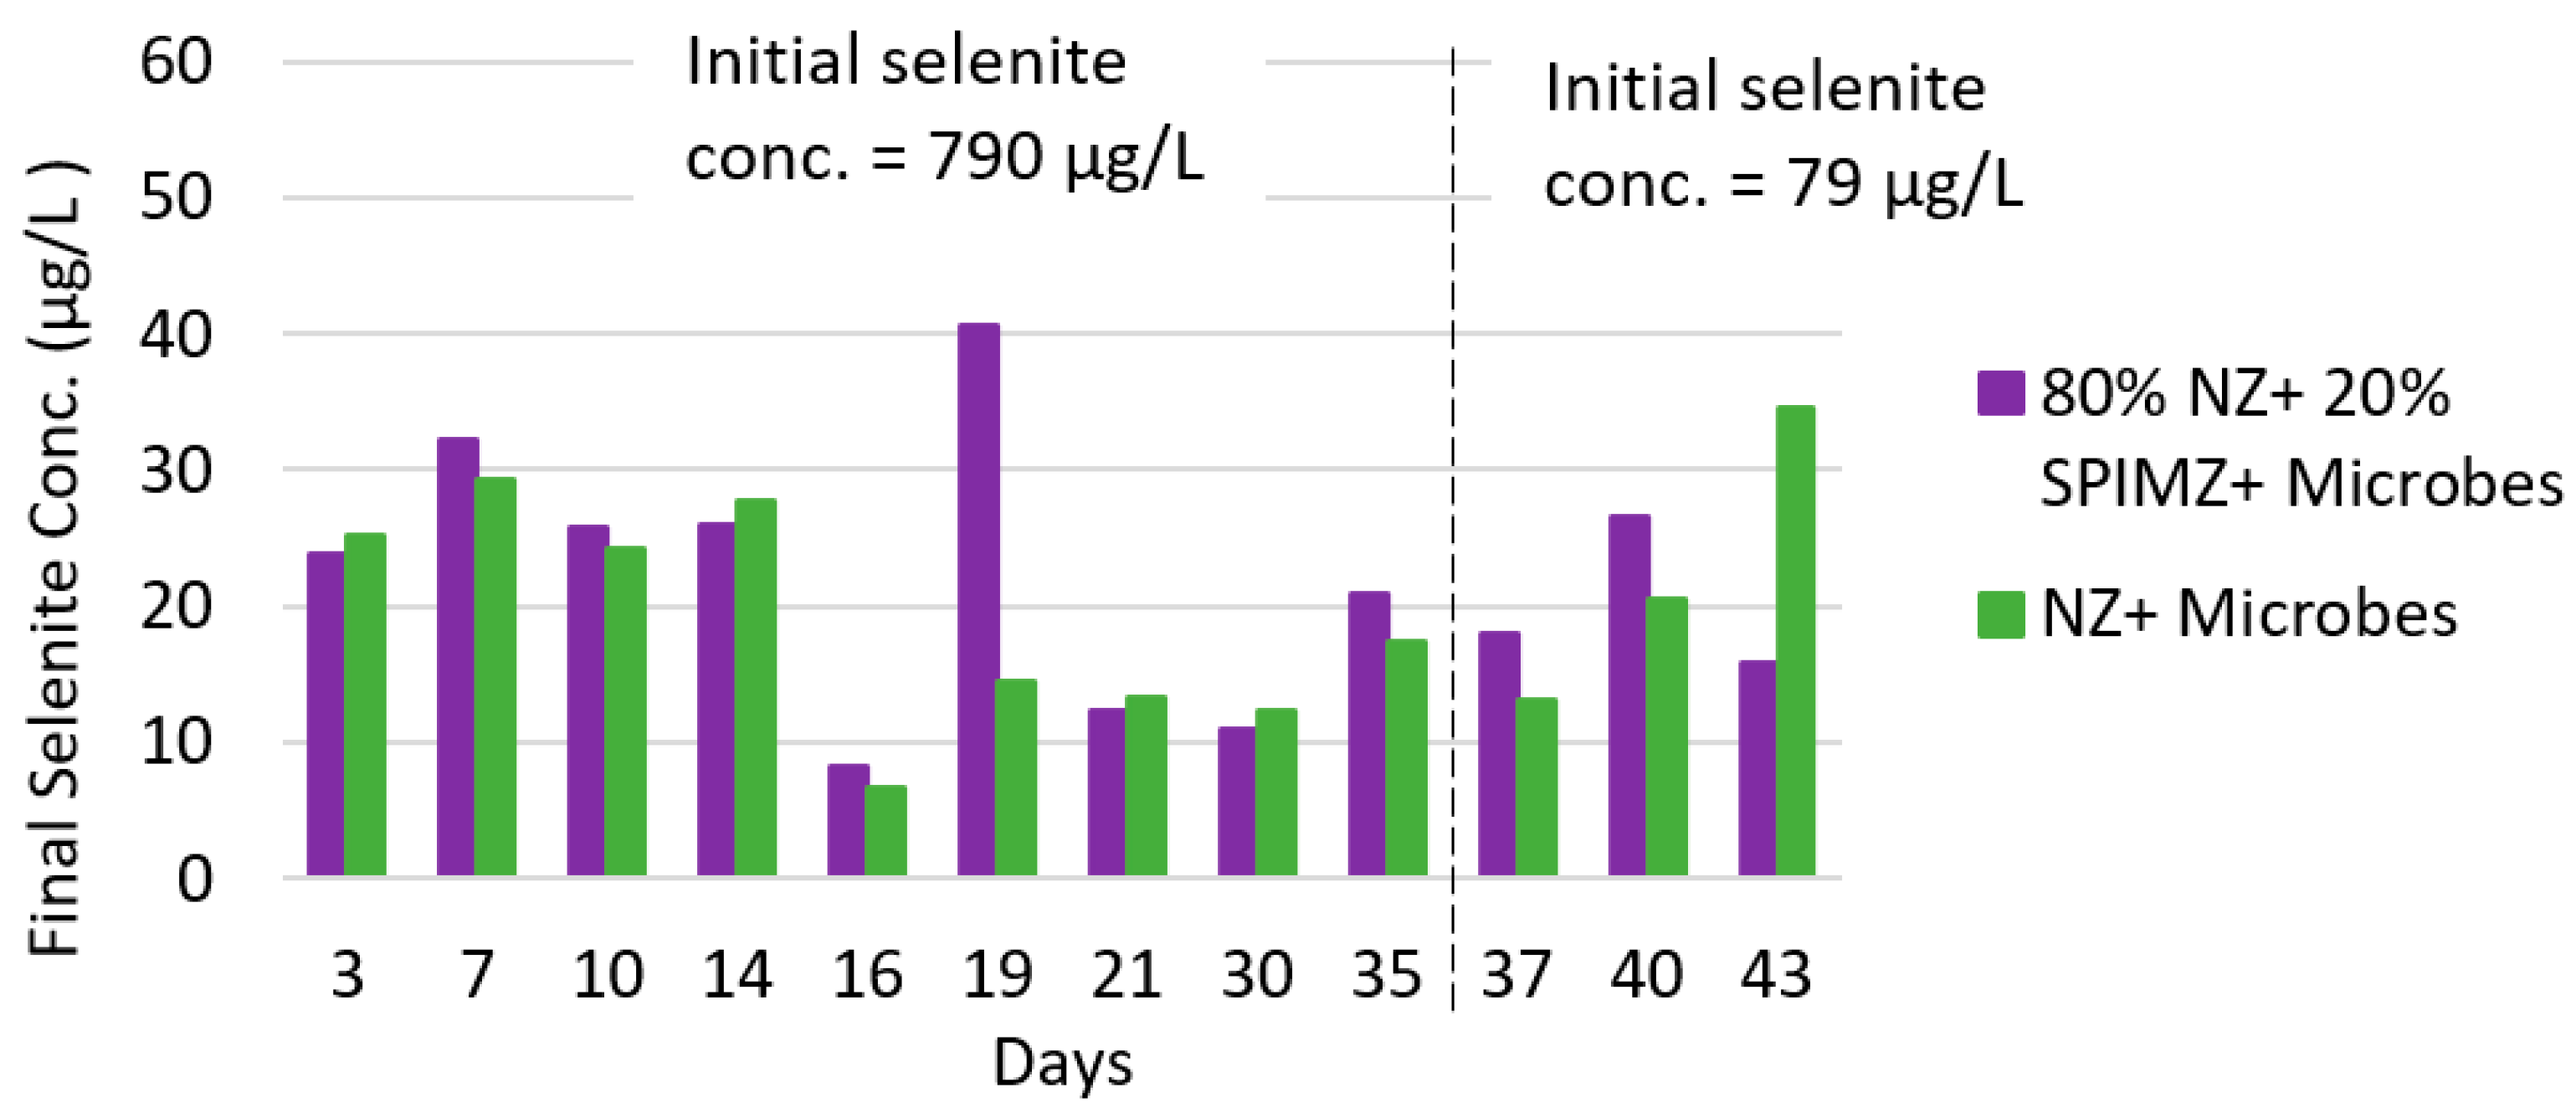
The figures below (Figure 10 and Figure 11) delineate the average values of the final selenium (selenate or selenite) concentration levels when the inlet selenium (selenate or selenite) concentrations were 790 µg/L and 79 µg/L. Selenium removal did not vary significantly in the four columns. Selenate removal in both cases was higher than selenite removal. However, in all four columns the effluent concentration was below the U.S. EPA mandated maximum contaminant level (MCL) of 50 µg/L, regardless of the initial selenium concentration.
It should be kept in mind that in the current system, both sorption and microbial reduction contribute to selenium removal. If the only mechanism for selenium removal is sorption, increasing selenium concentration would lead to lower fractional uptake (percent removal). However, during microbial reduction of selenium oxyanions to elemental selenium, this relationship is not necessarily observed, as the current experiments demonstrate.
3.5. Microbial Community Analysis
Based on DNA quantification results, there were few or no microbes in the upper end of the columns. This is most likely because the highest selenium concentration can be found at the column inlet at the bottom of the column. As the selenium concentration is reduced along the upward flow direction, progressively less dense biomass can be supported. Additionally, the zeolite medium acts as a microbial filter, one of the advantages of this selenium treatment setup.
This study reveals that anaerobic sludge from the Las Cruces, NM, USA, wastewater treatment plant contains numerous bacteria that can play an active role in reducing oxidized selenium compounds. Bacterial communities in the bioreactors display phylogenetic diversity within three major phyla (Firmicutes, Bacteroidota, and Proteobacteria) of the bacterial domain.
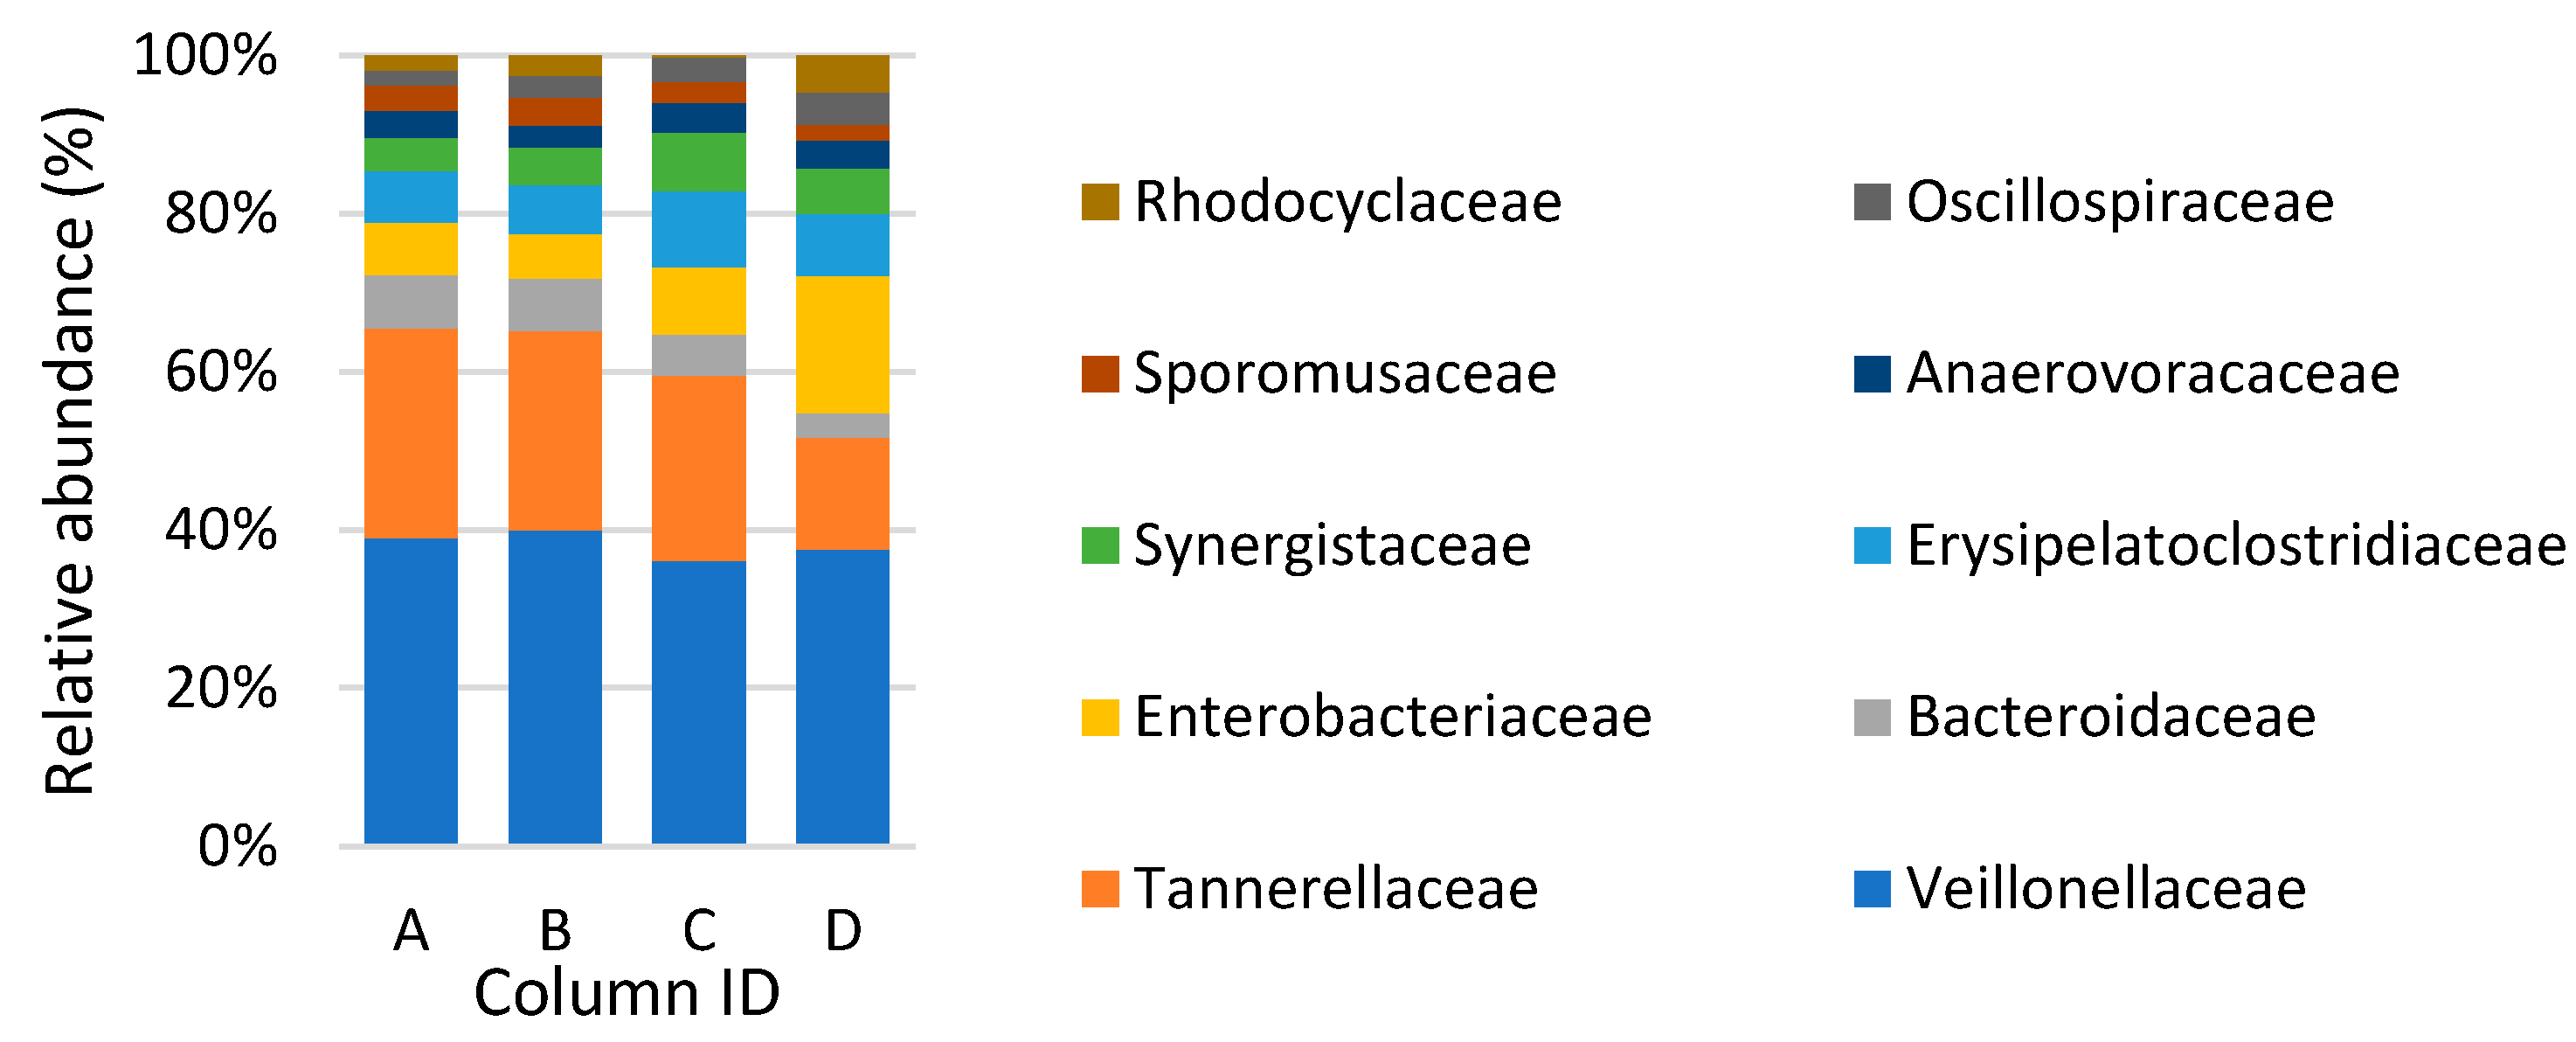
The microbial community composition at the family level (Figure 12) highlights Veillonellaceae (40%) as the most abundant bacterial family, followed by tannerellaceae (15%) and Bacteroidaceae (8%). Hence, classes of Negativicutes and Bacteroidia dominated in the columns as Veillonellaceae belongs to Negativicutes and the latter families belong to Bacteroidia. In line with previous studies, most of the selenium-reducing bacteria belong to negativicutes [35]. Members of the families Veillonellaceae, Enterobacteriaceae, and Rhodocyclaceae have been previously identified as selenium reducers [35,36,37].
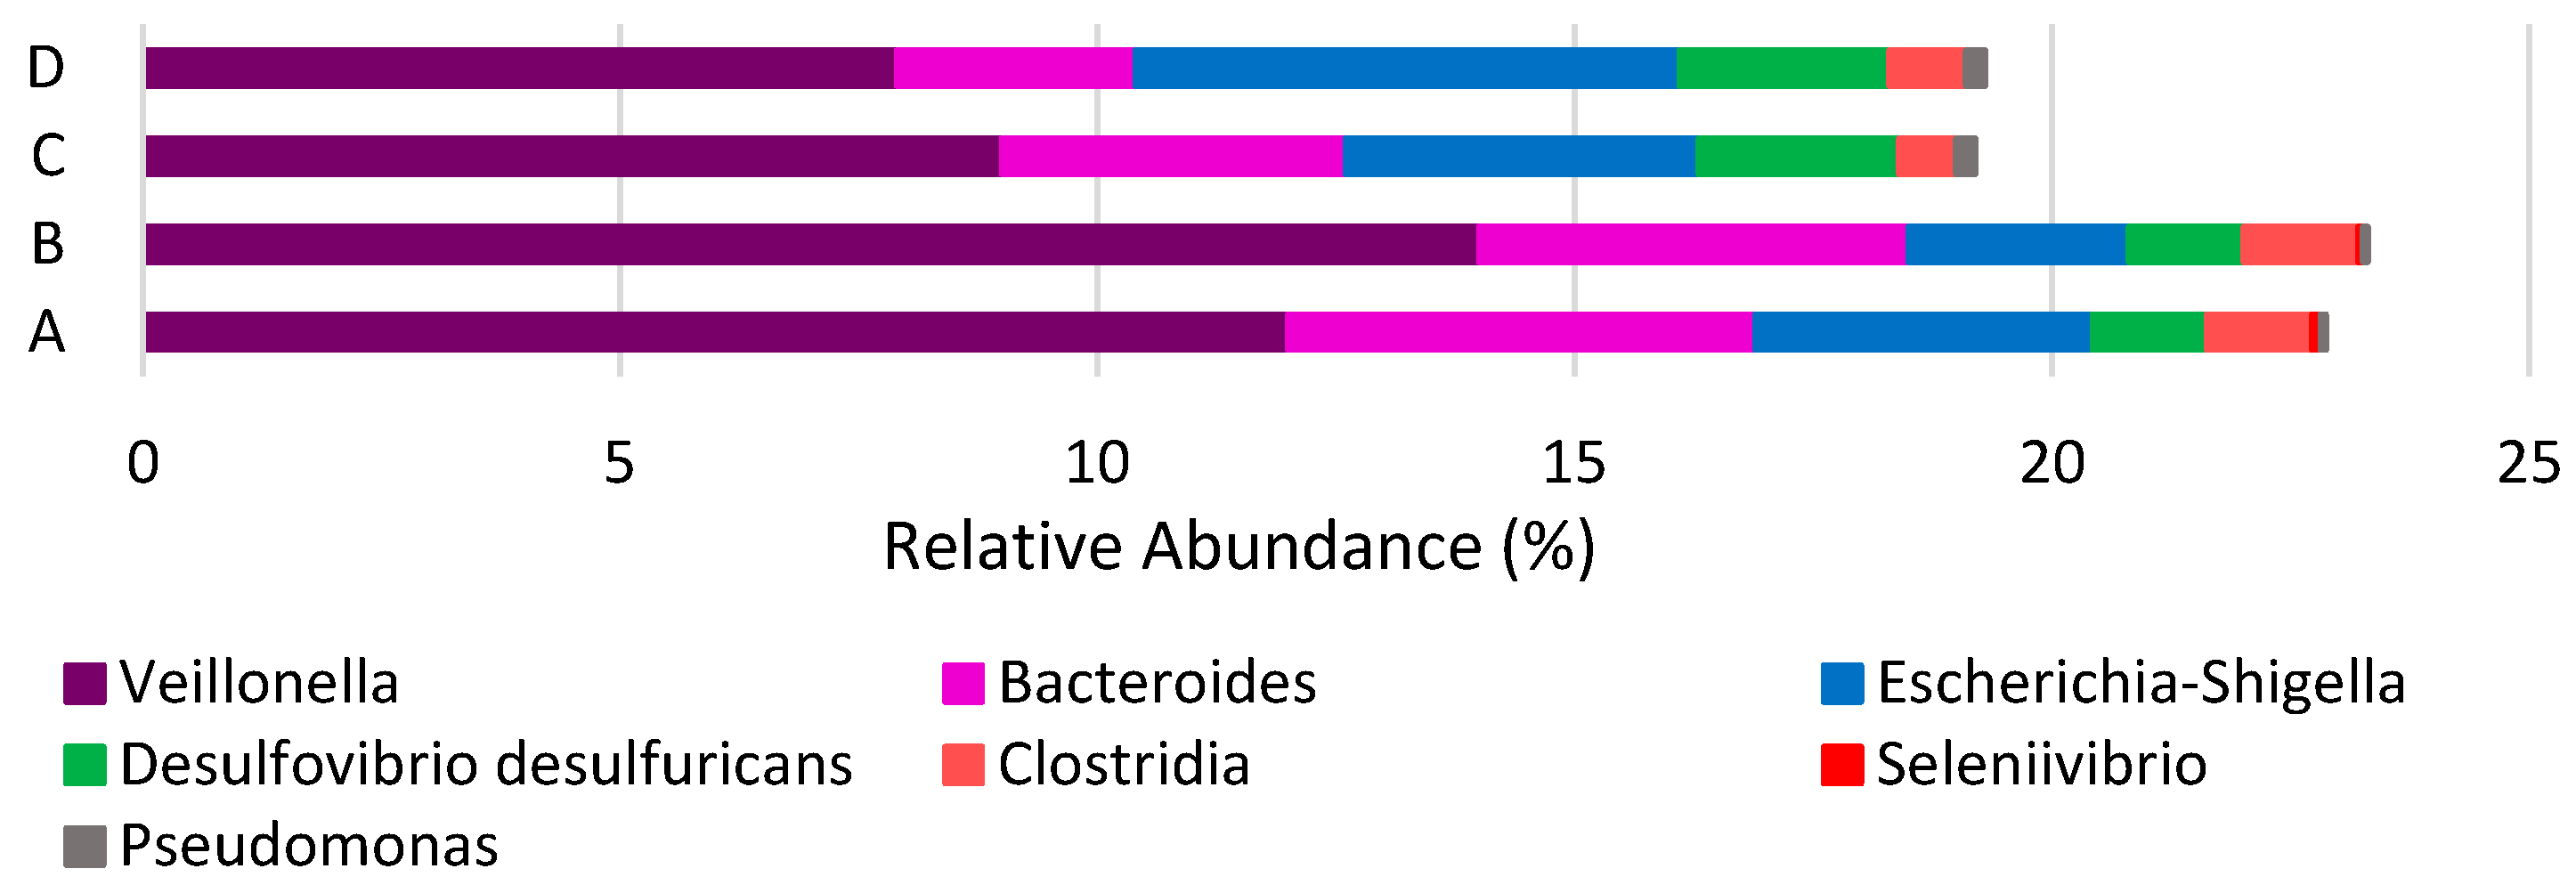
Among the dominant genera, Veillonella and Megasphaera (13–22%) are the most abundant genera in all bioreactors. However, the latter have not been previously reported as selenium-reducing bacteria. These genera belong to the family Veillonellaceae, the order Selenomonadales class of negativicutes, and the phylum of Firmicutes. The Veillonella family contains six genera, including Megasphaera and Veillonella (type genus). Bacteria belonging to this family have been identified as cocci or cocco bacilli in shape, anaerobic or microaerophilic, and non-motile. Megasphaera and Veillonella are the only species belonging to this family with the lactate fermentation capacity [38], which is consistent with the experimental conditions of this study because lactate was used as the organic source. This family has been found in numerous human clinical samples and samples of other mammals, such as sheep and pigs. Some species of this family have been identified as opportunistic pathogens for animals, including humans. Followed by Veillonella, bacteroid, Escherichia-shigella, and desulfovibrio are the most dominant genera among the previously identified selenium reducers (Figure 13). There is no significant difference among the microbial composition of the columns, either based on selenium speciation or sorbent material composition.
Most of the microorganisms present in the columns are gram-negative. Gram-negative microorganisms have a typical gram-negative cell wall structure with an outer membrane, which suggests the importance of having an outer membrane that makes periplasm, the cellular compartment where selenium respiratory enzymes have been identified [39].
Almost all microorganisms present among the dominant genera belong to gut microflora, which is not surprising given that we used sludge from a secondary digester as anaerobic microbial inoculum. The relationship between selenium and gut microbiota has been studied using bacterial and archaeal genomes in the past decade. The organisms rich in selenoproteins are the anaerobic Deltaproteobacteria and clostridia classes. Not surprisingly, these gut microorganisms are capable of enduring selenium given that they are exposed to selenium because of regular selenium consumption by humans, given that selenium is a micronutrient. About 25% of intestinal bacteria have genes that encode selenoproteins. Some of them belong to the Clostridia and Enterobacteria classes. Selenium is a critical cofactor for bacterial enzymes responsible for DNA replication and transcription, antioxidant action, and cellular respiration. Some species require selenium for normal metabolic functions [40].
Further, the richness and diversity of microbial inoculum were compared with different indices and shown in Table 5. Overall, there is no significant difference found in the microbial composition based on bed composition as the indices show small deviation from each other. However, there is a similarity in indices with similar selenium speciation in the feed. So, the diversity of the communities is closely related when they treat similar selenium oxyanions, despite the bed composition. Furthermore, these indices suggest that the diversity of communities is not similar even when they treat different oxyanions derived from the same metal. Considering Shannon’s and Faith’s PD indices, selenate treating bioreactors show comparably higher indices, which indicates that these columns have higher community evenness and richness than the selenite columns.
4. Conclusions
Compared to the natural zeolite, SPIMZ XRD spectra are different because of the presence of precipitated iron (hydr)oxides. The presence of iron oxide increases the sorption capacity of the zeolites for anions. During the first 14 days, selenate removal in the columns with coated zeolite was approximately twice as high compared to the columns with natural zeolite. Maximum selenite removal was 89% in the column with modified zeolite. After 14 days, as the biofilm developed inside the columns, selenium reduction in all four columns reached approximately 99%. Regardless of the initial selenium concentration, all four columns produced effluents that are well below contaminant levels for selenium (40 µg/L, WHO). Adsorption combined with microbial reduction is a promising method to treat selenium and generate high-quality effluent. After an appropriate acclimation, selenate-reducing bacteria are capable of enduring selenate. Within the biological reactors, zeolite not only acts as an adsorbent, but also provides a relatively high surface area to grow microbes and acts as a filter media for microbes and suspended solids.
In conclusion, the present study demonstrates a simple and environmentally sound process to treat influent water containing selenium at 790 µg/L to below 10 µg/L with only 1.5 h of hydraulic retention time.
Author Contributions
Conceptualization, C.P. and Y.Z.; methodology, H.M.I.P.K., C.P. and Y.Z.; investigation, H.M.I.P.K., Y.Z. and C.P.; writing—original draft preparation, H.M.I.P.K.; writing—review and editing, H.M.I.P.K., Y.Z. and C.P.; supervision, C.P. and Y.Z.; project administration, C.P.; funding acquisition, C.P. All authors have read and agreed to the published version of the manuscript.
Funding
This material is based upon work primarily supported by the Engineering Research Center Program of the National Science Foundation under NSF Cooperative Agreement No. EEC-1449501. Any opinions, findings and conclusions, or recommendations expressed in this material are those of the authors, and do not necessarily reflect those of the NSF.
Data Availability Statement
The data presented in this study are available on request from the corresponding author. The data are not yet publicly available as this is an ongoing study.
Conflicts of Interest
The authors declare no conflict of interest.
References
- Lenz, M.; Lens, P.N.L. The essential toxin: The changing perception of selenium in environmental sciences. Sci. Total Environ. 2009, 407, 3620–3633. [Google Scholar] [CrossRef] [PubMed]
- Nancharaiah, Y.V.; Lens, P.N.L. Ecology and Biotechnology of Selenium-Respiring Bacteria. Microbiol. Mol. Biol. Rev. 2015, 79, 61–80. [Google Scholar] [CrossRef] [PubMed]
- Zhang, Y.Y.; Kuroda, M.; Arai, S.; Kato, F.; Inoue, D.; Ike, M. Biological removal of selenate in saline wastewater by activated sludge under alternating anoxic/oxic conditions. Front. Environ. Sci. Eng. 2019, 13, 68. [Google Scholar] [CrossRef]
- Wasewar, K.L.; Prasad, B.; Gulipalli, S. Adsorption of Selenium Using Bagasse Fly Ash. Clean-Soil Air Water 2009, 37, 534–543. [Google Scholar] [CrossRef]
- Sandy, T.; DiSante, C. Review of Available Technologies for the Removal of Selenium from Water; The North American Metals Council: Washington, DC, USA, 2010. [Google Scholar]
- Santos, S.; Ungureanu, G.; Boaventura, R.; Botelho, C. Selenium contaminated waters: An overview of analytical methods, treatment options and recent advances in sorption methods. Sci. Total Environ. 2015, 521, 246–260. [Google Scholar] [CrossRef]
- Kashiwa, M.; Nishimoto, S.; Takahashi, K.; Ike, M.; Fujita, M. Factors affecting soluble selenium removal by a selenate-reducing bacterium Bacillus sp SF-1. J. Biosci. Bioeng. 2000, 89, 528–533. [Google Scholar] [CrossRef]
- Lichtfouse, E.; Morin-Crini, N.; Bradu, C.; Boussouga, Y.A.; Aliaskari, M.; Schafer, A.I.; Das, S.; Wilson, L.D.; Ike, M.; Inoue, D.; et al. Methods for selenium removal from contaminated waters: A review. Environ. Chem. Lett. 2022, 20, 2019–2041. [Google Scholar] [CrossRef]
- Larry, T.; Jay, M.; Helen, J.; Eric, D.; Andy, H. Removal of Selenium Oxyanions from Mine Waters Utilizing Elemental Iron and Galvanically Coupled Metals. In Symposium, Innovations in Natural Resource Systems, SME Annual Meeting; Miller, J.D., Ed.; Society for Mining Metallurgy & Exploration: Englewood, CO, USA, 2005. [Google Scholar]
- Soda, S.; Kashiwa, M.; Kagami, T.; Kuroda, M.; Yamashita, M.; Ike, M. Laboratory-scale bioreactors for soluble selenium removal from selenium refinery wastewater using anaerobic sludge. Desalination 2011, 279, 433–438. [Google Scholar] [CrossRef]
- Cantafio, A.W.; Hagen, K.D.; Lewis, G.E.; Bledsoe, T.L.; Nunan, K.M.; Macy, J.M. Pilot-scale selenium bioremediation of San Joaquin drainage water with Thauera selenatis. Appl. Environ. Microbiol. 1996, 62, 3298–3303. [Google Scholar] [CrossRef]
- Nancharaiah, Y.V.; Lens, P.N.L. Selenium biomineralization for biotechnological applications. Trends Biotechnol. 2015, 33, 323–330. [Google Scholar] [CrossRef]
- Shammas, N.K.; Wang, L.K. Emerging Attached-Growth Biological Processes. In Advanced Biological Treatment Processes. Handbook of Environmental Engineering; Humana Press: Totowa, NJ, USA, 2009; Volume 9. [Google Scholar]
- Suhartana; Sukmasari, E.; Azmiyawati, C. Modification of Natural Zeolite with Fe(III) and Its Application as Adsorbent Chloride and Carbonate ions. In IOP Conference Series: Materials Science and Engineering; IOP Publishing Ltd.: Bristol, UK, 2017. [Google Scholar]
- Halalsheh, N. Effect of Geochemical Conditions and Microbial Activity on Selenium Oxyanion Transport in Iron-Coated Porous Media. In Civil Engineering; New Mexico State University: Las Cruces, NM, USA, 2019. [Google Scholar]
- Du, G.X.; Li, Z.H.; Liao, L.B.; Hanson, R.; Leick, S.; Hoeppner, N.; Jiang, W.T. Cr(VI) retention and transport through Fe(III)-coated natural zeolite. J. Hazard. Mater. 2012, 221, 118–123. [Google Scholar] [CrossRef] [PubMed]
- Zorpas, A.A.; Inglezakis, V.; Loizidou, M.; Grigoropoulou, H. Particle size effects on uptake of heavy metals from sewage sludge compost using natural zeolite clinoptilolite. J. Colloid Interface Sci. 2002, 250, 1–4. [Google Scholar] [CrossRef] [PubMed]
- Sherman, J.D. Ion Exchange Separations with Molecular Sieve Zeolites. Zeolites Sci. Technol. 1983, 80, 583–623. [Google Scholar]
- Haggerty, G.M.; Bowman, R.S. Sorption of Chromate and Other Inorganic Anions by Organo-Zeolite. Environ. Sci. Technol. 1994, 28, 452–458. [Google Scholar] [CrossRef]
- Han, R.P.; Zou, L.N.; Zhao, X.; Xu, Y.F.; Xu, F.; Li, Y.L.; Wang, Y. Characterization and properties of iron oxide-coated zeolite as adsorbent for removal of copper(II) from solution in fixed bed column. Chem. Eng. J. 2009, 149, 123–131. [Google Scholar] [CrossRef]
- Popic, J.P.; Jegdic, B.V.; Bajat, J.B.; Veljovic, D.; Stevanovic, S.I.; Miskovic-Stankovic, V.B. The effect of deposition temperature on the surface coverage and morphology of iron-phosphate coatings on low carbon steel. Appl. Surf. Sci. 2011, 257, 10855–10862. [Google Scholar] [CrossRef]
- Kayani, Z.N.; Arshad, S.; Riaz, S.; Naseem, S. Synthesis of Iron Oxide Nanoparticles by Sol-Gel Technique and Their Characterization. IEEE Trans. Magn. 2014, 50, 1–4. [Google Scholar] [CrossRef]
- Ren, H.X.; Jiang, J.H.; Wu, D.J.; Gao, Z.M.; Sun, Y.M.; Luo, C.W. Selective Adsorption of Pb(II) and Cr(VI) by Surfactant-Modified and Unmodified Natural Zeolites: A Comparative Study on Kinetics, Equilibrium, and Mechanism. Water Air Soil Pollut. 2016, 227, 101. [Google Scholar] [CrossRef]
- Yigit, N.O.; Tozum, S. Removal of Selenium Species from Waters Using Various Surface-Modified Natural Particles and Waste Materials. Clean-Soil Air Water 2012, 40, 735–745. [Google Scholar] [CrossRef]
- Jevtic, S.; Arcon, I.; Recnik, A.; Babic, B.; Mazaj, M.; Pavlovic, J.; Matijasevic, D.; Niksic, M.; Rajic, N. The iron(III)-modified natural zeolitic tuff as an adsorbent and carrier for selenium oxyanions. Microporous Mesoporous Mater. 2014, 197, 92–100. [Google Scholar] [CrossRef]
- Payne, T.E.; Brendler, V.; Ochs, M.; Baeyens, B.; Brown, P.L.; Davis, J.A.; Ekberg, C.; Kulik, D.A.; Lutzenkirchen, J.; Missana, T.; et al. Guidelines for thermodynamic sorption modelling in the context of radioactive waste disposal. Environ. Model. Softw. 2013, 42, 143–156. [Google Scholar] [CrossRef]
- Vlaev, L.T.; Georgieva, V.G.; Genieva, S.D. Use of the ion polarization theory to interpret certain regularities of changes in characteristics and properties of inorganic compounds. J. Struct. Chem. 2006, 47, 813–822. [Google Scholar] [CrossRef]
- Cramer, C.; Buscher, M. Complete conductivity spectra of fast ion conducting silver iodide silver selenate glasses. Solid State Ion. 1998, 105, 109–120. [Google Scholar] [CrossRef]
- Gu, B.H.; Schmitt, J.; Chen, Z.H.; Liang, L.Y.; McCarthy, J.F. Adsorption and Desorption of Natural Organic-Matter on Iron-Oxide—Mechanisms and Models. Environ. Sci. Technol. 1994, 28, 38–46. [Google Scholar] [CrossRef] [PubMed]
- Kitis, M.; Kaplan, S.S.; Karakaya, E.; Yigit, N.O.; Civelekoglu, G. Adsorption of natural organic matter from waters by iron coated pumice. Chemosphere 2007, 66, 130–138. [Google Scholar] [CrossRef]
- Masscheleyn, P.H.; Patrick, W.H. Biogeochemical Processes Affecting Selenium Cycling in Wetlands. Environ. Toxicol. Chem. 1993, 12, 2235–2243. [Google Scholar] [CrossRef]
- Hageman, S.P.W.; van der Weijden, R.D.; Weijma, J.; Buisman, C.J.N. Microbiological selenate to selenite conversion for selenium removal. Water Res. 2013, 47, 2118–2128. [Google Scholar] [CrossRef]
- Lenz, M.; Smit, M.; Binder, P.; van Aelst, A.C.; Lens, P.N.L. Biological alkylation and colloid formation of selenium in methanogenic UASB reactors. J. Environ. Qual. 2008, 37, 1691–1700. [Google Scholar] [CrossRef]
- Squires, R.C.; Groves, G.R.; Johnston, W.R. Economics of Selenium Removal from Drainage Water. J. Irrig. Drain. Eng. 1989, 115, 48–57. [Google Scholar] [CrossRef]
- Gonzalez-Gil, G.; Lens, P.N.L.; Saikaly, P.E. Selenite Reduction by Anaerobic Microbial Aggregates: Microbial Community Structure, and Proteins Associated to the Produced Selenium Spheres. Front. Microbiol. 2016, 7, 571. [Google Scholar] [CrossRef]
- Knotek-Smith, H.M.; Crawford, D.L.; Moller, G.; Henson, R.A. Microbial studies of a selenium-contaminated mine site and potential for on-site remediation. J. Ind. Microbiol. Biotechnol. 2006, 33, 897–913. [Google Scholar] [CrossRef] [PubMed]
- Tucker, M.D.; Barton, L.L.; Thomson, B.M. Reduction of Cr, Mo, Se and U by Desulfovibrio desulfuricans immobilized in polyacrylamide gels. J. Ind. Microbiol. Biotechnol. 1998, 20, 13–19. [Google Scholar] [CrossRef] [PubMed]
- Marchandin, H.; JUmas-Bilal, E. The Family Veillonellaceae. In The Prokaryotes-Firmicutes and Tenericutes; Rosenberg, E., Ed.; Springer: Berlin/Heidelberg, Germany, 2014; p. 21. [Google Scholar]
- Staicu, L.C.; Barton, L.L. Selenium respiration in anaerobic bacteria: Does energy generation pay off? J. Inorg. Biochem. 2021, 222, 111509. [Google Scholar] [CrossRef] [PubMed]
- Ferreira, R.L.U.; Sena-Evangelista, K.C.M.; De Azevedo, E.P.; Pinheiro, F.I.; Cobucci, R.N.; Pedrosa, L.F.C. Selenium in Human Health and Gut Microflora: Bioavailability of Selenocompounds and Relationship With Diseases. Front. Nutr. 2021, 8, 685317. [Google Scholar] [CrossRef] [PubMed]
Figure 1.
Schematic representation of bioreactors used to treat selenate (columns A and B) and selenite (columns C and D). (A) 80% NZ + 20% SPIMZ + Microbes, (B) NZ + Microbes, (C) 80% NZ + 20% SPIMZ + Microbes, (D) NZ + Microbes.
Figure 1.
Schematic representation of bioreactors used to treat selenate (columns A and B) and selenite (columns C and D). (A) 80% NZ + 20% SPIMZ + Microbes, (B) NZ + Microbes, (C) 80% NZ + 20% SPIMZ + Microbes, (D) NZ + Microbes.

Figure 2.
Physical appearance of natural and iron-coated zeolite.

Figure 3.
SEM-EDX elemental mapping of sodium-pretreated iron-modified zeolite showing the distribution of (a) aluminium (Al); (b) oxygen (O); (c) silicon (Si); and (d) iron (Fe).
Figure 3.
SEM-EDX elemental mapping of sodium-pretreated iron-modified zeolite showing the distribution of (a) aluminium (Al); (b) oxygen (O); (c) silicon (Si); and (d) iron (Fe).

Figure 4.
XRD spectra of natural zeolite and SPIMZ.

Figure 5.
FTIR spectra of natural zeolite and SPIMZ.

Figure 6.
Nitrogen gas adsorption/desorption isotherms.

Figure 7.
Percent selenate removal by different columns.

Figure 8.
Percent selenite removal by different columns.

Figure 9.
Selenium, nitrogen, and phosphorous levels in influent and effluent of (A) Column A (80% NZ + 20% SPIMZ+ microbes), (B) Column B (NZ+ microbes), (C) Column C (80% NZ + 20% SPIMZ+ microbes), (D) Column D (NZ+ microbes).
Figure 9.
Selenium, nitrogen, and phosphorous levels in influent and effluent of (A) Column A (80% NZ + 20% SPIMZ+ microbes), (B) Column B (NZ+ microbes), (C) Column C (80% NZ + 20% SPIMZ+ microbes), (D) Column D (NZ+ microbes).

Figure 10.
Final selenate concentration for different initial selenate concentrations.

Figure 11.
Final selenite concentrations for different initial selenite concentrations.

Figure 12.
Microbial community structure at family level.

Figure 13.
Relative abundance of previously identified selenium-reducing bacteria present in selenate reducing columns (A) 80% NZ + 20% SPIMZ + Microbes, (B) NZ + Microbes, and selenite reducing columns (C) 80% NZ + 20% SPIMZ + Microbes, (D) NZ + Microbes.
Figure 13.
Relative abundance of previously identified selenium-reducing bacteria present in selenate reducing columns (A) 80% NZ + 20% SPIMZ + Microbes, (B) NZ + Microbes, and selenite reducing columns (C) 80% NZ + 20% SPIMZ + Microbes, (D) NZ + Microbes.


Table 1.
Column bed composition.
| Column Notation | Bed Composition | Selenium Oxyanion |
|---|---|---|
| A | 80% Natural Zeolite + 20% Modified Zeolite + Anaerobic Microbes | Selenate |
| B | Natural Zeolite + Anaerobic Microbes | |
| C | 80% Natural Zeolite + 20% Modified Zeolite + Anaerobic Microbes | Selenite |
| D | Natural Zeolite + Anaerobic Microbes |
Table 2.
SEM-EDX analysis results of zeolite chemical composition by mass (percentage).
| Sorbent Type | Percent Elemental Composition by Mass | ||||||||
|---|---|---|---|---|---|---|---|---|---|
| O | Mg | Al | Si | K | Fe | Na | Ca | Other | |
| Zeolite | 41.0 | 0.8 | 7.4 | 39.8 | 2.5 | 1.1 | 0.3 | 3.3 | 3.8 |
| SPIMZ | 40.9 | 0.9 | 7.6 | 40.7 | 2.5 | 4.0 | 0.8 | 2.7 | - |
Table 3.
Summary of specific surface area and porosity parameters of the adsorbents.
| Zeolite Type | Pore Width Å | Pore Volume cm³/g | BET Surface Area (m²/g) | Langmuir Surface Area (m²/g) |
|---|---|---|---|---|
| Natural zeolite 1 | 124.7497 | 0.028091 | 9.0071 | 13.1057 |
| SPIMZ | 109.7896 | 0.026393 | 9.6159 | 13.8434 |
Table 4.
Electron donor consumption.
| Column Details | Percent Electron Donor Consumption | |
|---|---|---|
| Selenate Columns | Selenite Columns | |
| NZ (80%) + SPIMZ (20%) + Sludge | 33 | 20 |
| NZ + Sludge | 29 | 21 |
Table 5.
Different indices for microbial communities in column biofilms.
| Column | Species | Bed Composition | Shannon’s Index | Faith’s PD Index | Pielou’s Evenness Index |
|---|---|---|---|---|---|
| A | Selenate | NZ + SPIMZ + microbes | 5.3 | 18.9 | 0.666 |
| B | Selenate | NZ + microbes | 5.5 | 20.4 | 0.682 |
| C | Selenite | NZ +SPIMZ + microbes | 5.1 | 17.0 | 0.664 |
| D | Selenite | NZ + microbes | 5.1 | 16.9 | 0.673 |
Disclaimer/Publisher’s Note: The statements, opinions and data contained in all publications are solely those of the individual author(s) and contributor(s) and not of MDPI and/or the editor(s). MDPI and/or the editor(s) disclaim responsibility for any injury to people or property resulting from any ideas, methods, instructions or products referred to in the content. |
© 2023 by the authors. Licensee MDPI, Basel, Switzerland. This article is an open access article distributed under the terms and conditions of the Creative Commons Attribution (CC BY) license (https://creativecommons.org/licenses/by/4.0/).
Share and Cite
MDPI and ACS Style
Kulasekara, H.M.I.P.; Zhang, Y.; Papelis, C. Microbial Enhancement of Selenium Removal in Chemically Modified Zeolite Columns. Water 2023, 15, 1837. https://doi.org/10.3390/w15101837
AMA Style
Kulasekara HMIP, Zhang Y, Papelis C. Microbial Enhancement of Selenium Removal in Chemically Modified Zeolite Columns. Water. 2023; 15(10):1837. https://doi.org/10.3390/w15101837
Chicago/Turabian StyleKulasekara, Herath Mudiyanselage Ishani P., Yanyan Zhang, and Charalambos Papelis. 2023. "Microbial Enhancement of Selenium Removal in Chemically Modified Zeolite Columns" Water 15, no. 10: 1837. https://doi.org/10.3390/w15101837
Note that from the first issue of 2016, this journal uses article numbers instead of page numbers. See further details here.