Article

Numerical Simulation and Analysis of the Influencing Factors of Foundation Pit Dewatering under a Coupled Radial Well and Curtain

1
Shaanxi Engineering Technology Research Center for Urban Geology and Underground Space, Xi’an 710068, China
2
Shaanxi Hydrogeology Engineering Geology and Environment Geology Survey Center, Xi’an 710068, China
3
School of Water and Environment, Chang’an University, Xi’an 710054, China
4
Kunming Prospecting Design Institute of China Nonferrous Metals Industry Co., Ltd., Kunming 650051, China
*
Author to whom correspondence should be addressed.
Water 2023, 15(10), 1839; https://doi.org/10.3390/w15101839
Submission received: 21 February 2023 / Revised: 7 May 2023 / Accepted: 9 May 2023 / Published: 11 May 2023

Abstract

:
It is crucial to use a suitable dewatering technique to prevent land subsidence and substantial decreases in groundwater levels caused by the dewatering of groundwater during the construction of underground projects. Therefore, in this study, a generalized three-dimensional numerical model of groundwater flow was implemented for an underground station pit project. The dewatering efficiency of the coupled radial well-curtain method was investigated and compared with that of a traditional method. In addition, the influence of different structures and parameters (radial pipe diameter, conductance, number of radial pipes, and shaft drawdown) on the dewatering efficiency was assessed. The results showed the following: (1) radial wells caused less disturbance to the groundwater seepage field and extracted less groundwater during the dewatering process compared with pumping wells; (2) the structure and parameters of the radial wells positively correlated with the dewatering efficiency; (3) the curtain improved the dewatering efficiency, resulting in lower amounts of groundwater discharged and less disturbance to the groundwater flow field; and (4) the coupled radial well-curtain method is an efficient dewatering method that could effectively prevent the lowering of groundwater level outside the foundation pit, thus reducing the risk of land subsidence in the surrounding area.

1. Introduction

Groundwater is a significant challenge to underground construction projects. During the excavation of the foundation pit, a high groundwater level can increase the difficulty of construction, compromise construction safety [1], and give rise to issues such as water gushing from the pit, sand flow, and slope instability [2,3,4]. To ensure construction site safety, the construction area should be dewatered prior to the construction of the foundation pit, thus ensuring that the groundwater level is lowered below the working surface [5,6,7,8].
Foundation pit dewatering techniques are well-established. However, the degree of efficiency and the environmental impacts of different dewatering methods vary significantly. At present, the two main types of pit dewatering techniques commonly used are open dewatering and well-point dewatering. While the open dewatering method is simple to and has low construction costs, it causes more pronounced damage to the surface environment and can lead to slope instability [9]. In contrast, the well-point dewatering method has a larger pumping volume and generates a greater drawdown, but it is prone to land subsidence in some areas [10]. In complex and fragile systems, foundation pit dewatering can discharge large amounts of groundwater, resulting in a significant decrease in the groundwater levels and a change in the natural groundwater flow, thus leading to land subsidence and even collapse and deformation [11,12,13,14,15,16]. Indeed, land subsidence may affect surface drainage, reduce the storage capacity of aquifer systems, cause ground cracks and damage to buildings, farmland, and infrastructure, as well as be costly to remediate [17]. The large volume of groundwater discharge can also affect the seepage field around the pit, thus affecting the natural circulation of groundwater. Therefore, ensuring efficient, safe, and cost-effective dewatering construction with minimal environmental impacts is an issue that has been explored by experts and academics worldwide.
Common methods that are used to control the groundwater levels in foundation pit dewatering are interception and well drainage [18]. The primary way to intercept water is to build impermeable walls [19,20,21], deep mixing piles [22], jet grouting piles [23,24], or curtains capable of partially or even completely blocking water. The curtain in the groundwater seepage field can change the direction, path, and section of the groundwater flow, thus changing the hydraulic gradient and preventing the horizontal flow of groundwater around the foundation pit [25]. The use of water barrier curtains during foundation pit dewatering can effectively prevent a significant decrease in the groundwater level in the external areas of the pit, thereby reducing the risk of land subsidence to some extent [26]. Suspended water trap curtains have been used in many deep foundation pit dewatering projects [27,28,29,30].
Indeed, interception and dewatering are often combined in practical engineering, which improves efficiency and reduces disturbance to the surrounding environment [31,32]. Currently, most of the research on pit dewatering methods involves the coupling of pumping wells and water barrier curtains [10,33]. For example, Wang et al. established a conceptual model of curtain depth and pumping well filter in the context of Shanghai and investigated the land subsidence under the interaction of pumping wells and curtains in a subway pit using numerical simulation methods [11]. Xu et al. studied the distribution of groundwater level and the dewatering effect of a curtain-well system with different parameters through a series of indoor dewatering tests [34]. However, the traditional well-point dewatering method needs to discharge a large amount of groundwater if the water level target is to be achieved, which can greatly interfere with the groundwater environment and seepage field. Therefore, it is essential to find a method that is efficient and less disturbing to the groundwater environment. A radial well (i.e., radial collector well) is a type of well with a large-diameter water collection shaft and several horizontal water collection pipes that extend radially in all directions that is characterized by a high and rapid capacity to extract water [35]. Radial wells are now widely used for agricultural irrigation, water extraction, and groundwater regulation. In practice, radial wells have proven to be a more efficient way to extract water. In addition, some researchers have also conducted studies on the drainage engineering of tailings dams using radial wells [36].
Radial wells are currently widely used in agricultural irrigation and other fields. However, research on their use for foundation pit dewatering remains scarce. In a few studies that have used radial wells for foundation pit dewatering, the impact of different parameters on dewatering efficiency has also been infrequently discussed. This study aims to explore the aforementioned issues. In this study, an idealized three-dimensional (3-D) numerical model of groundwater flow was established for a fictitious underground station pit project based on the hydrogeological conditions of the primary urban area of Xianyang. Using this model, the efficiencies of coupled radial well-curtain dewatering and a traditional dewatering method (i.e., the well-point dewatering method) were assessed, and the influence of different structures and parameters (radial pipe diameter, conductance, number of radial pipes, and shaft drawdown) on dewatering efficiency were investigated. Furthermore, the perturbation of groundwater seepage by radial wells for pit dewatering was explored to provide a theoretical basis for similar future pit dewatering projects.

2. Materials and Methods
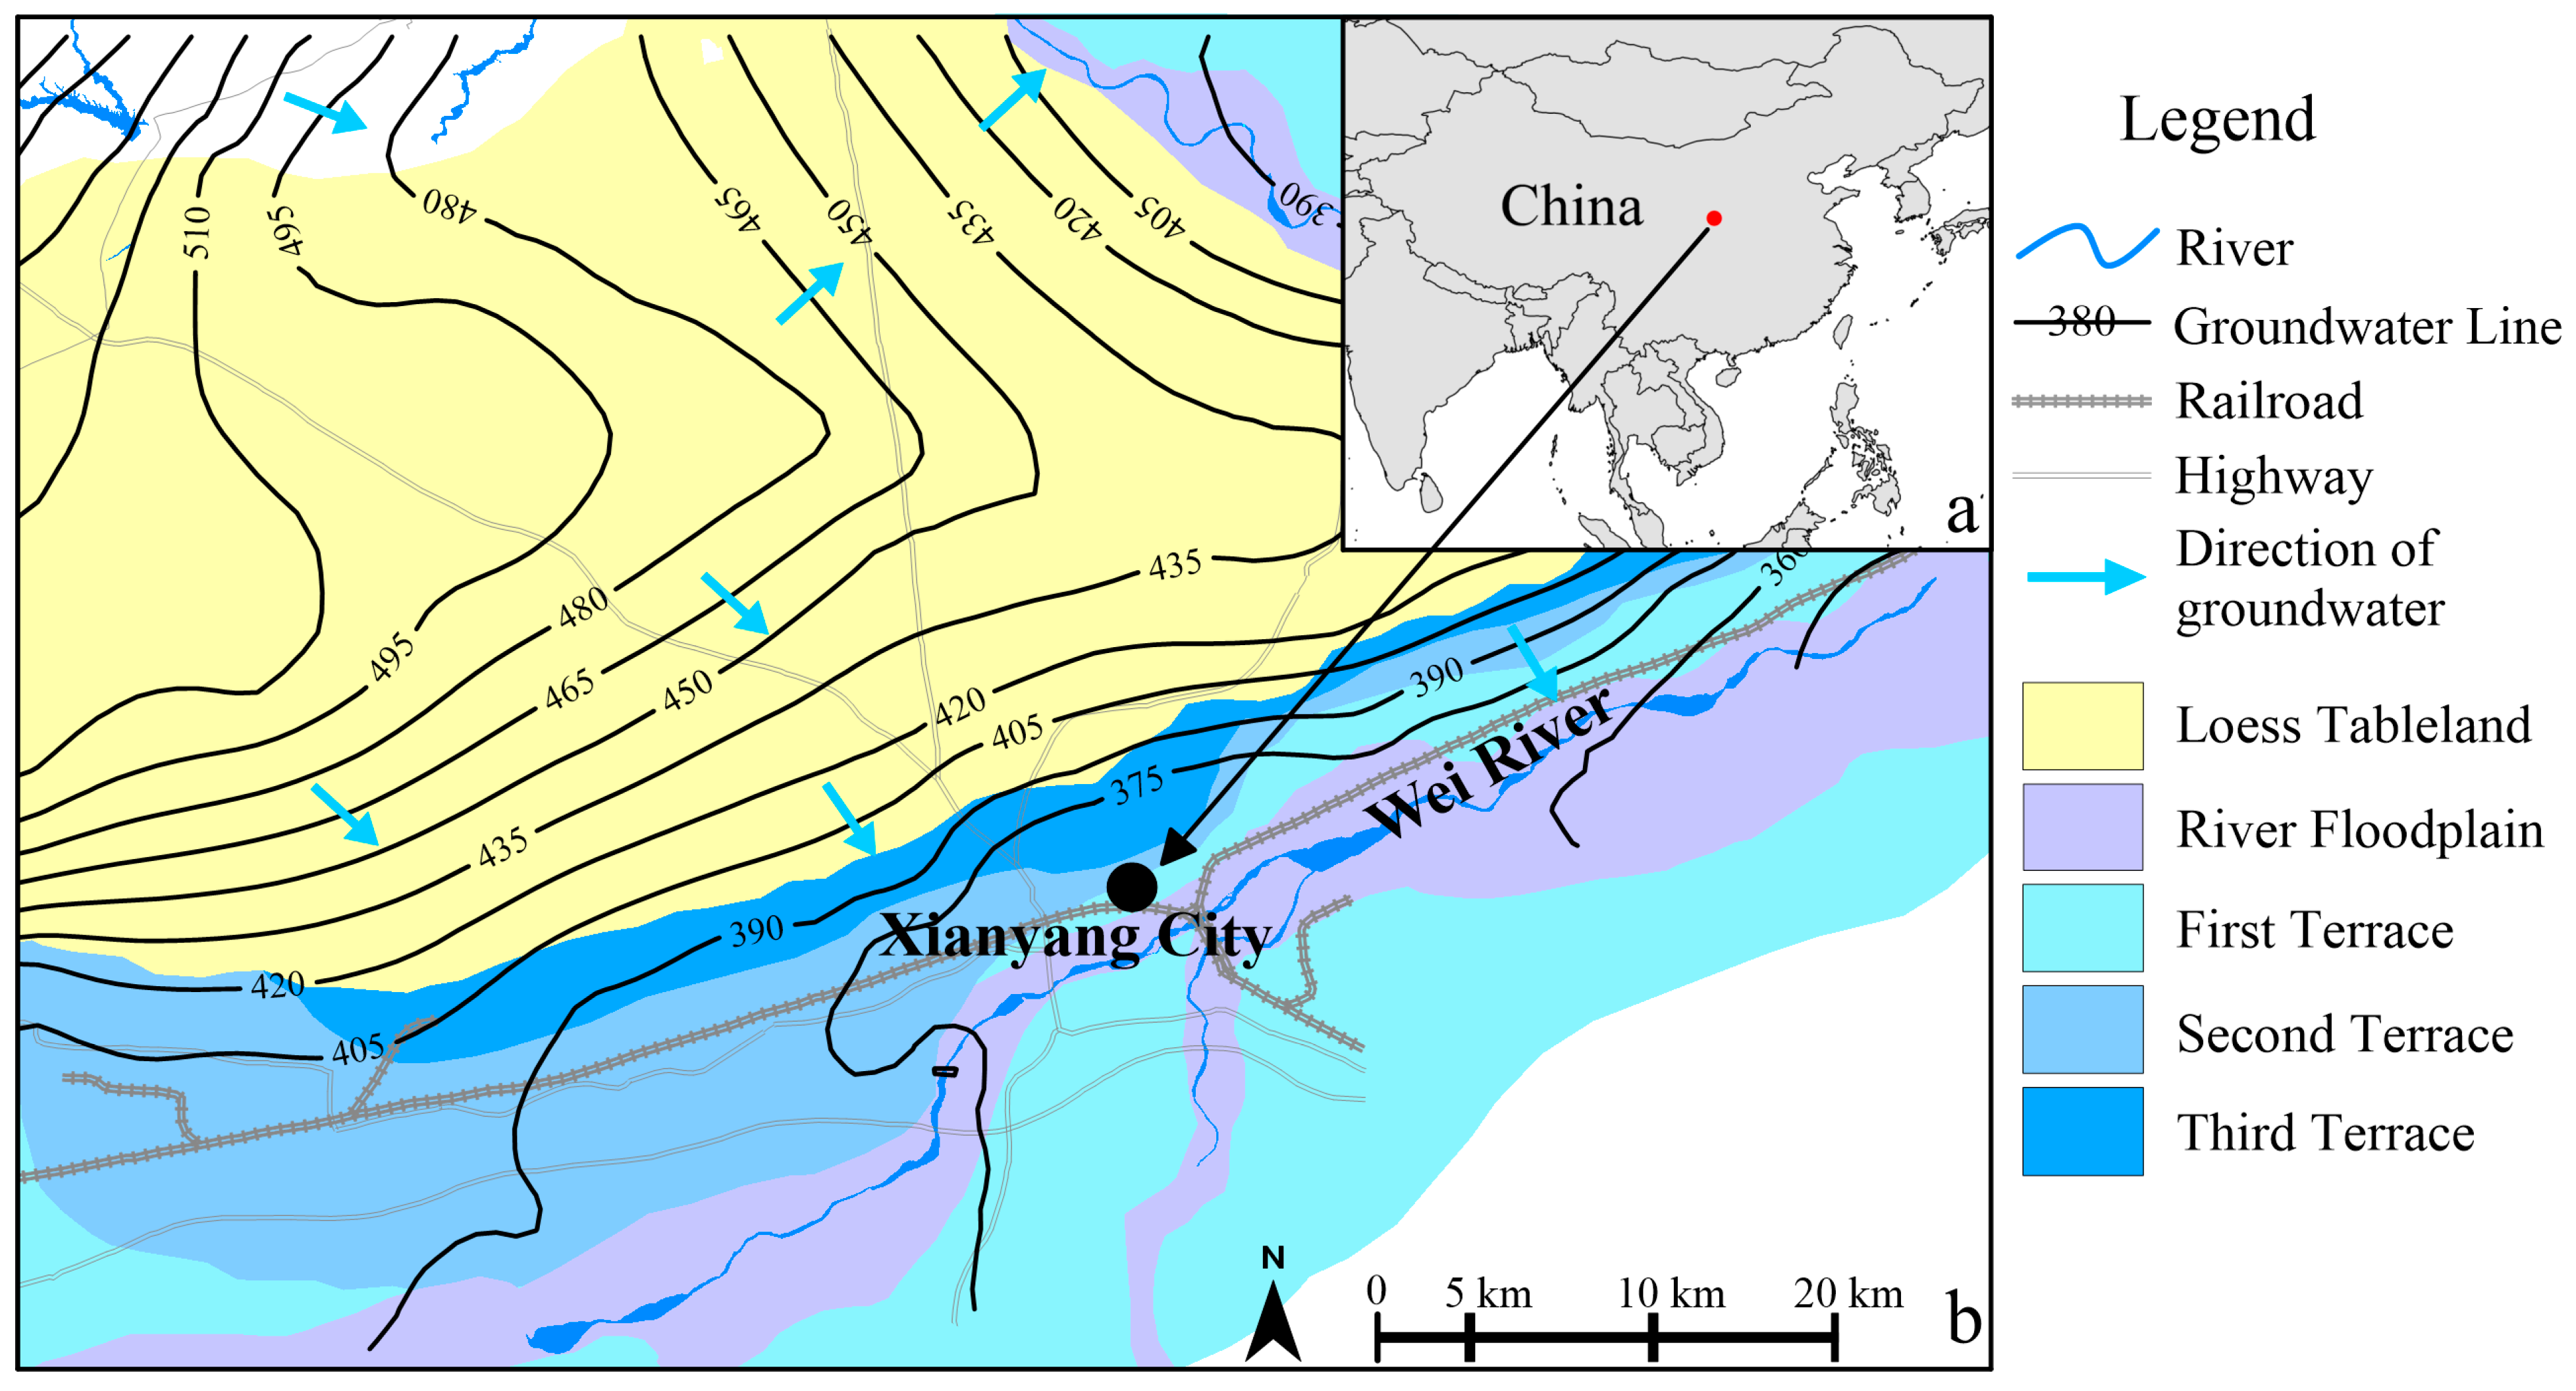
2.1. Study Area

The study area is situated in the primary urban area of Xianyang City, located between the primary and secondary terraces of the Wei River (Figure 1), in a temperate semi-arid and semi-humid climate region. The mean annual precipitation and evapotranspiration in the study area are 600–750 mm and 1000–1200 mm, respectively. The phreatic water level ranges approximately between 10–30 m deep, while the existing foundation excavation in the study area ranges from 5 to 30 m deep. The disturbance of the foundation drainage process is limited to phreatic water.
The primary aquifers distributed in the study area are as follows: (1) the unconfined aquifer in alluvial pore space, consisting of interbedded Middle to Late Quaternary alluvial sand, gravel, silt, and clay, with some areas covered by thick layers of loess. The thickness of the unconfined aquifer is greater in river floodplains and lower terraces, while it is thinner in higher terraces. (2) The unconfined aquifer in loess pore and fracture space, mainly distributed in the loess tableland region, consisting of Middle to Upper Quaternary eolian loess and paleosols with a generally thick layer structure exceeding 50 m. (3) The confined aquifer is composed of sand, gravel, and clay layers from rivers and lakes of the Lower to Middle Pleistocene. The top of the shallow confined aquifer is mainly distributed at a depth of 60–110 m, and the bottom is no deeper than 300 m. The unconfined aquifer in the study area has good water-richness and hydraulic conductivity. The hydraulic conditions of the groundwater flow field are shown in Table 1. Groundwater south of the Wei River flows from the southern mountainous area, while the northern groundwater of the Wei River recharges from the northern loess mountain ridge area.

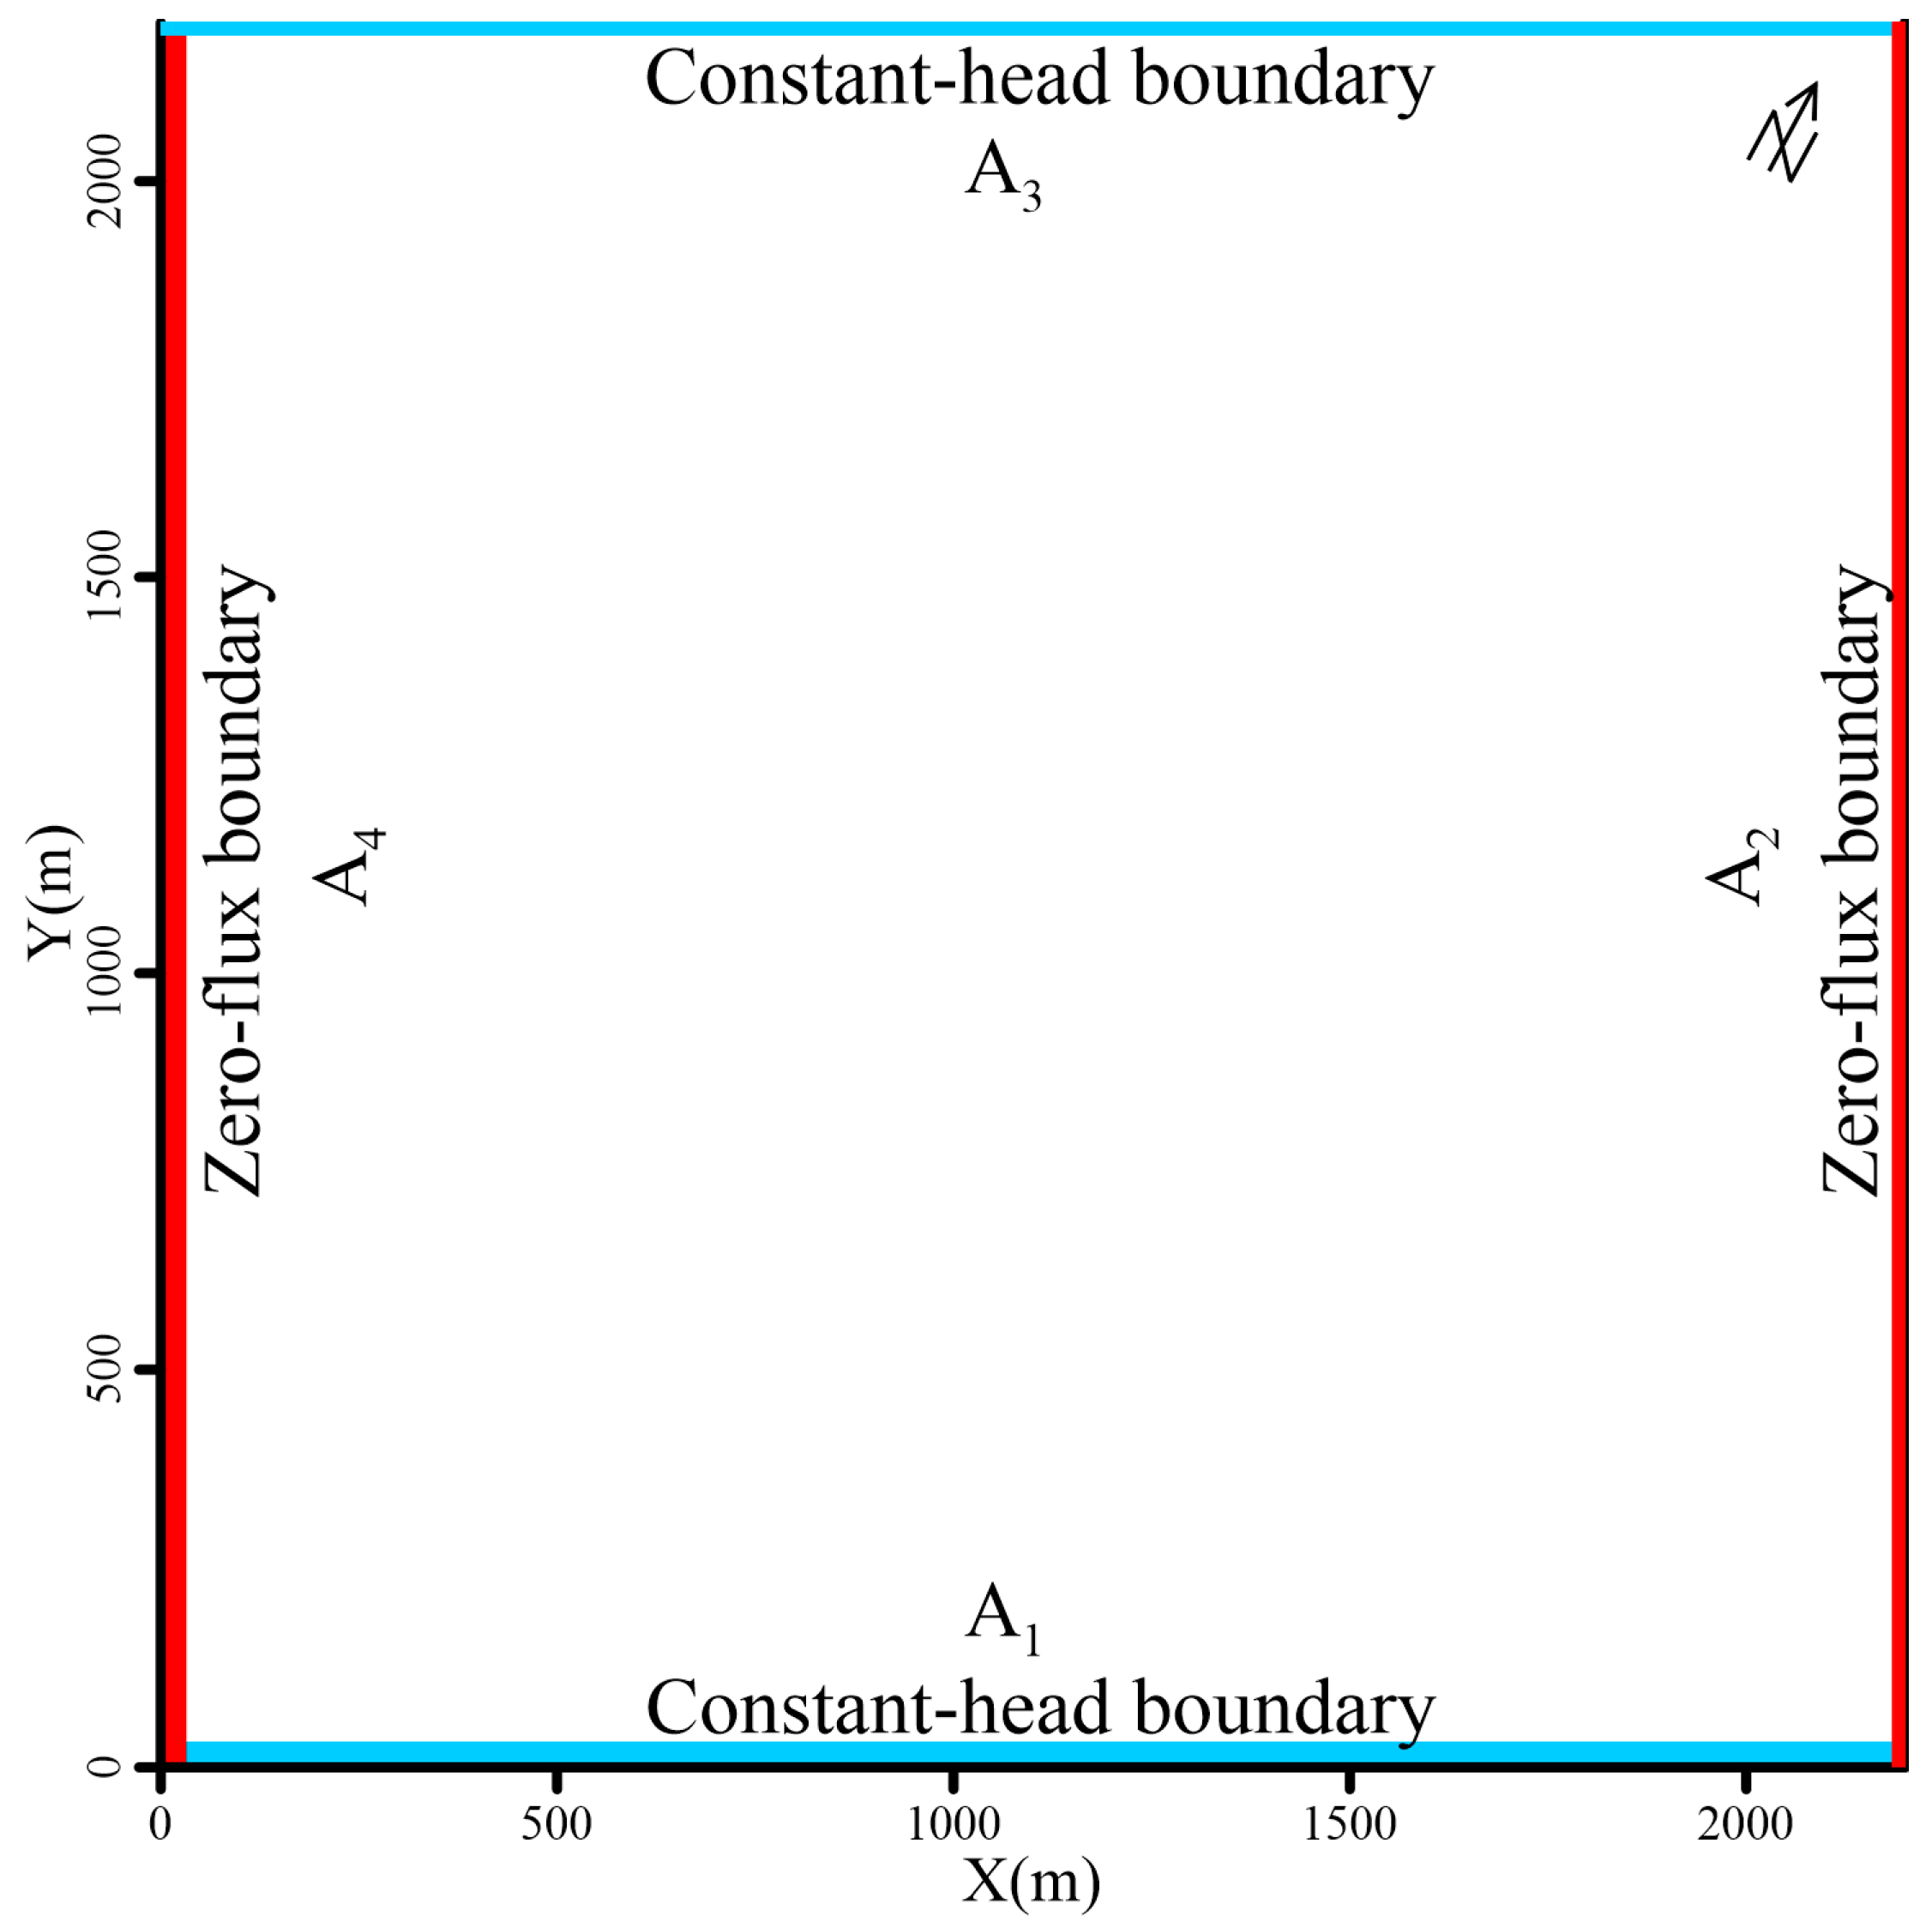
2.2. Conceptual Model

The study area was a hypothetical metro station in Xianyang city, for which a 3-D hydrogeological model was established. The domain dimensions were determined by taking the pit as the center and extending the boundary outward beyond the radius of influence of the dewatering. The domain dimensions were X = 0–2200, Y = 0–2200, and Z = 0–80 m, with a total surface area of 4.84 km2. Based on the groundwater flow field in the study area, the eastern and western boundaries of the simulation area were parallel to the groundwater flow lines and could be considered as zero-flux boundaries. Meanwhile, the southern and northern boundaries were perpendicular to the groundwater flow lines and could be considered as constant-head boundaries (Figure 2). The bottom and upper boundaries of the simulation domain were considered as impermeable and phreatic surface boundaries, respectively. The unconfined aquifer in the study area could be considered homogeneous and anisotropic, while ignoring infiltration recharge and evaporation in the study area. The vertical permeability coefficient was estimated to be one-tenth of the horizontal permeability value based on the hydrogeological investigation data, which corresponded to 20 and 2 m·d−1 for horizontal and vertical permeabilities, respectively. The aquifer in the study area consists of alluvial sand and cobble layer, thus, the specific yield was established at 0.3 without considering the elastic release of the aquifer.

2.3. Mathematical Model

The mathematical model of three-dimensional transient flow in the study area is described as follows:
Control equations:
x K x x H x + y K y y H y + z K z z H z = 0 x , y , z Ω , t 0
Initial condition:
H x , y , z , 0 = H 0 x , y , z x , y , z Ω
Zero-flux boundary:
K H n A 2 , A 4 , A 5 = 0   t 0
Constant-head boundary:
H x , y , z , t A 1 = H 1 H x , y , z , t A 3 = H 2   t 0
Phreatic surface boundary:
H x , y , z , t A 6 = z K H z A 6 = μ H t   t 0
where H is the water head (m); Kxx, Kyy, and Kzz are the hydraulic conductivity (m·d−1); μ is the specific yield; x, y, and z are the coordinate variables (m); t is the time variable (d); Ω is the range of the study area; A1 and A3 are the constant-head boundaries; A2 and A4 are the zero-flux boundaries; A5 is the impermeable boundary; A6 is the phreatic surface boundary; n is the direction of the outer normal of each boundary, and H0 is the initial head at the north and south boundaries (m).
There are generally multiple flow regimes in a radial well-aquifer system. The groundwater flow pattern in the aquifer is typically characterized by a low Reynolds number (Re < 1~10), which indicates laminar flow. The Reynolds number of the water flow is generally higher in radial wells where the hydraulic radius is higher. Thus, the water flow in these wells is generally turbulent. The flow in the aquifer is represented by seepage flow, while that in the radial well pipes is represented by tubular flow. The exchange flow between the radial pipes and the aquifer is used as the coupling point to establish a coupled seepage-tubular flow model [37].
The flow rate in the radial pipes was calculated using Equation (6) [38]:
Q p = π d 2 4 d 2 g 32 v H l        l a m i n a r f l o w π d 2 4 2 g d 0.316 d v 0.25 1 ϑ H l    s m o o t h t u r b u l e n t f l o w π d 2 4 8 g d log 10 3.71 d e 2 1 ϑ H l r o u g h t u r b u l e n t f l o w
where Q p is the flow rate of the radial well (m3·d−1); d is the diameter of the radial pipes (m); g is the acceleration of gravity (m·s−2); H is the head loss (m); v is the average flow rate in the pipes (m·d−1); l is the length of the radial pipes (m); ϑ is the kinematic viscosity of water (m2·s−1), and e is the coarseness degree of the inner wall of the pipes.
The exchange between the radial pipes and the aquifer is shown in Equation (7):
Q e = C H p H
where Q e is the exchange flow rate between the aquifer and pipes (m3·d−1); C is the conductance of pipes (m2·d−1), and H p is the head of pipe flow (m).
The conductance of the pipes could be calculated by Equation (8):
C = K p D l M p
where K p is the permeability coefficient of the pipe filter (m·d−1); M p is the thickness of the pipe filter (m); D is the wet perimeter of the pipe (m), and l is the length of the pipe (m).
At any node, the sum of groundwater inflow and outflow is always zero. Then the relationship between aquifer and radial pipe flow rate is as shown in Equation (9):
j = 1 n i Q p i , j + Q e = 0
where i is the number of nodes connected to node j; n i is the total number of nodes connected to node j, and Q p i , j is the total flow rate from node i to node j. This method can be used to calculate the coupled “seepage—tubular flow” model.

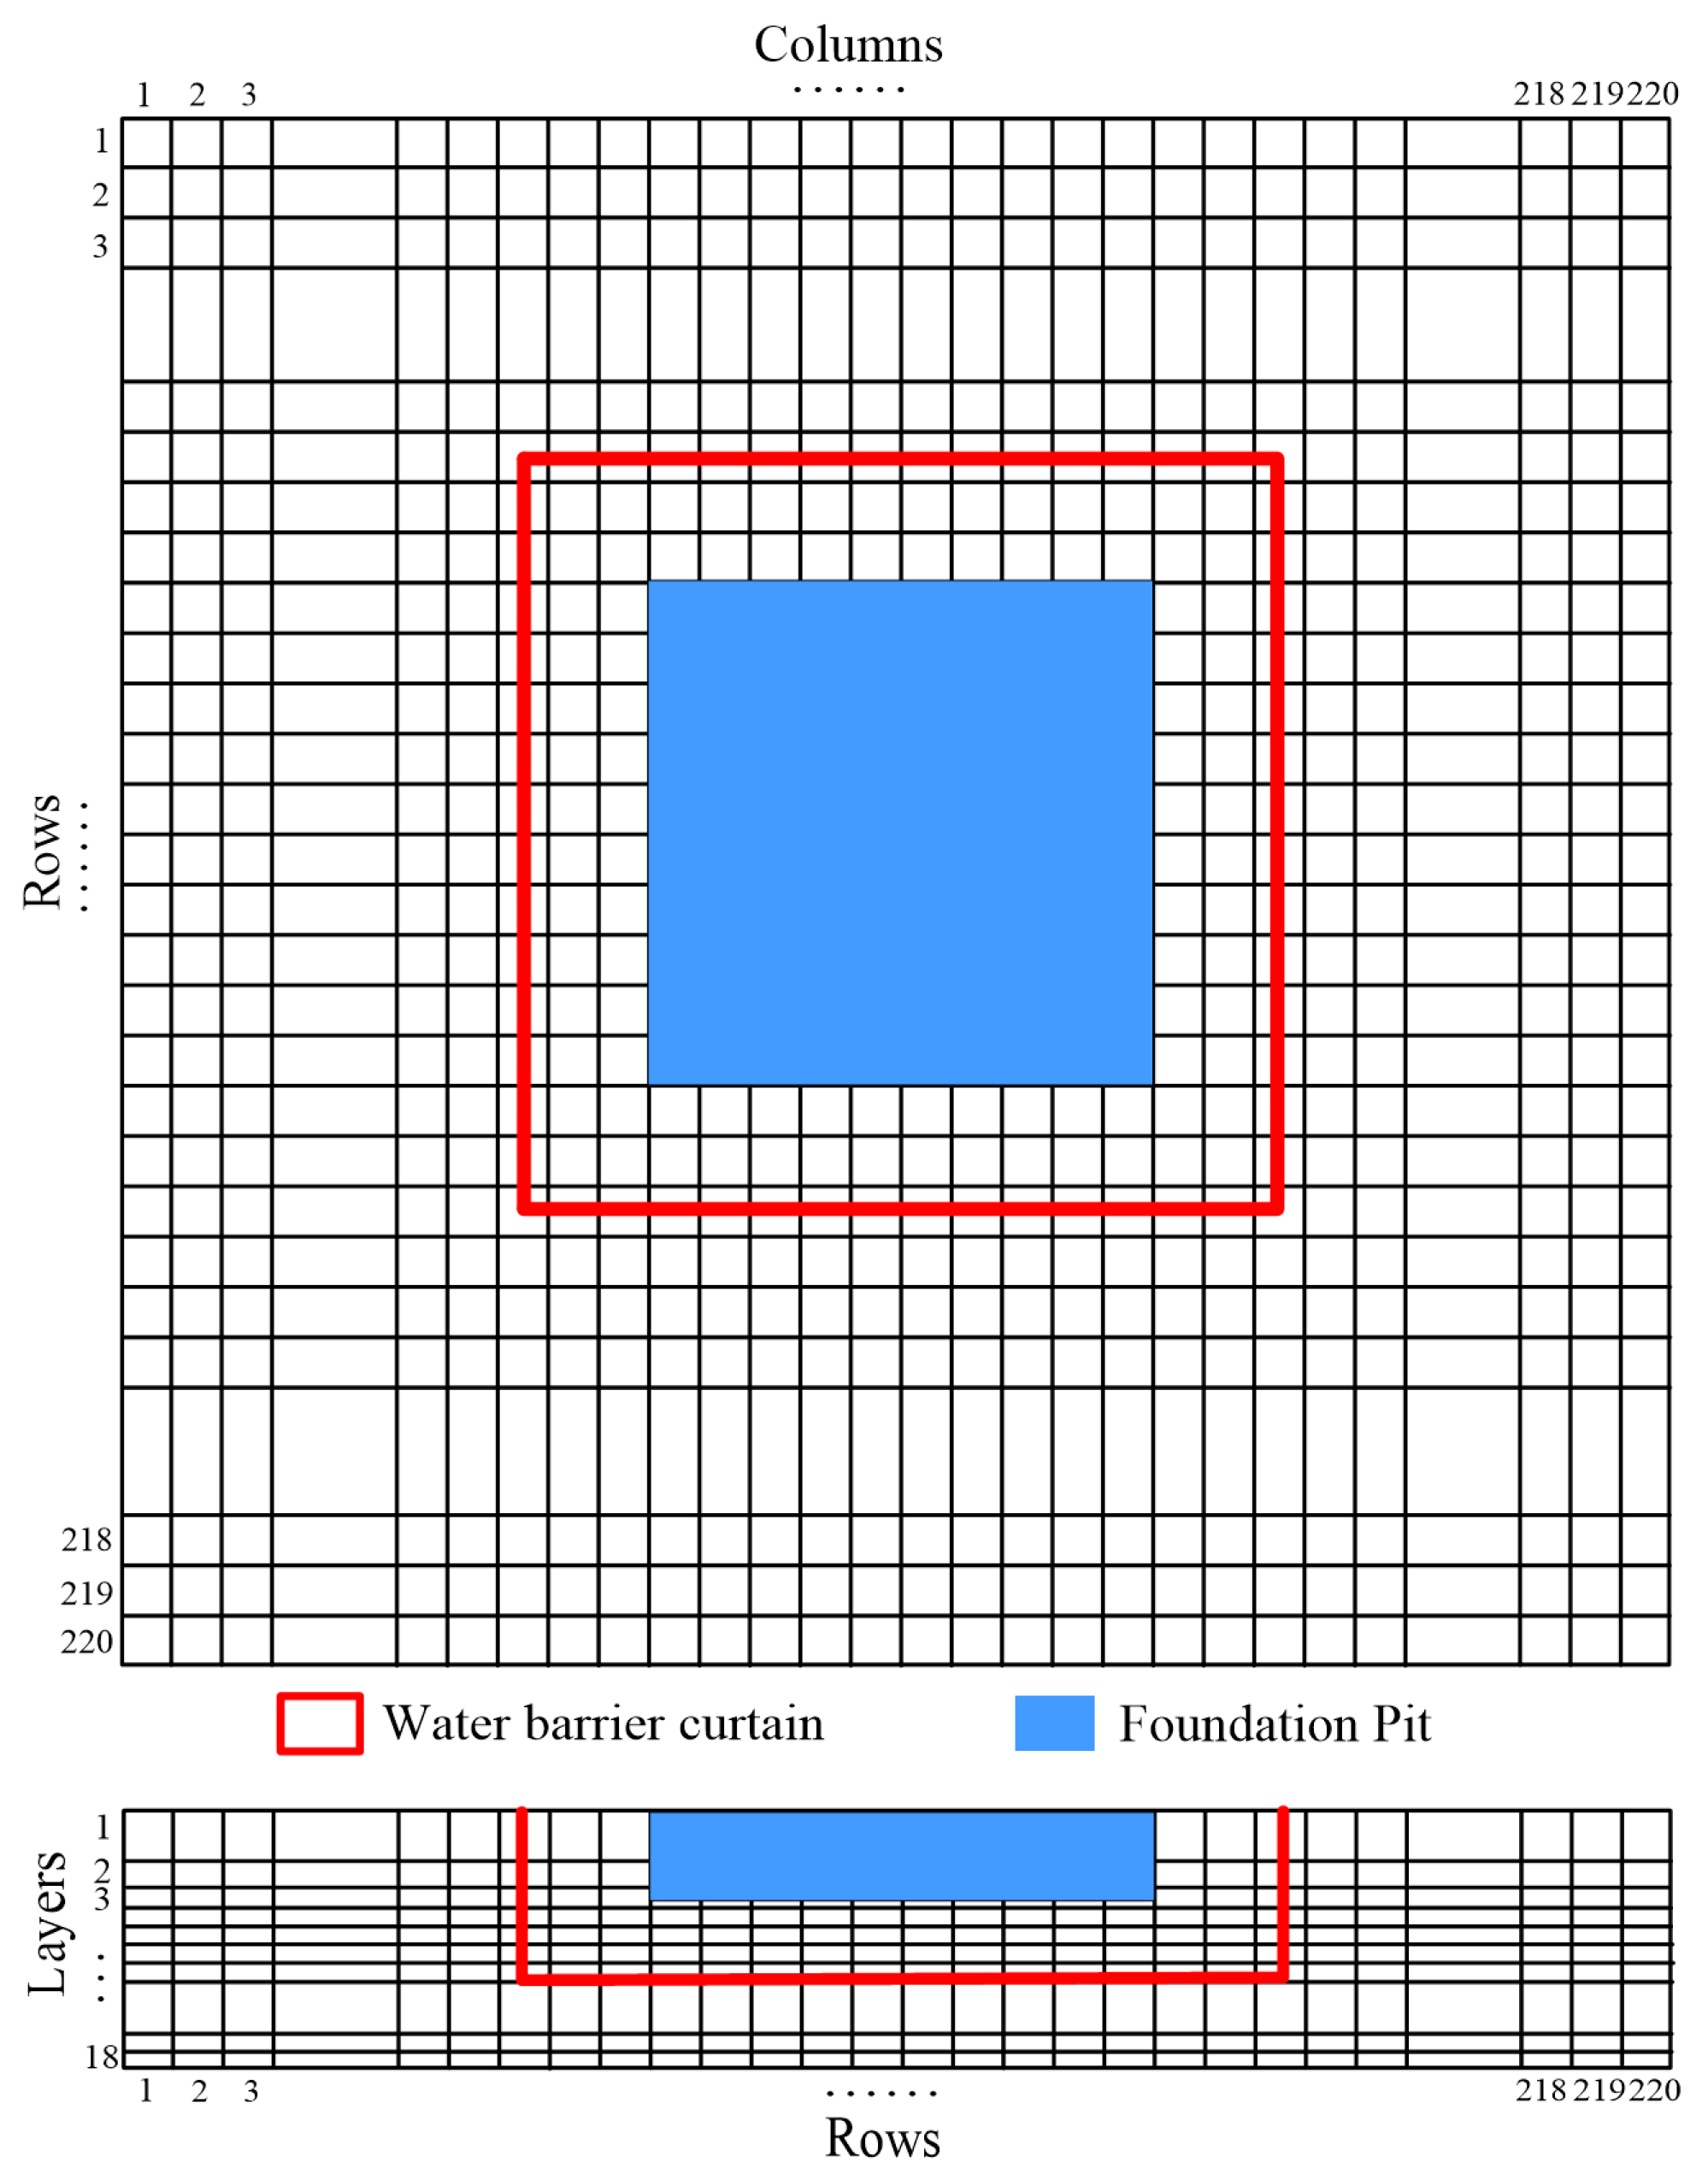
2.4. Numerical Model
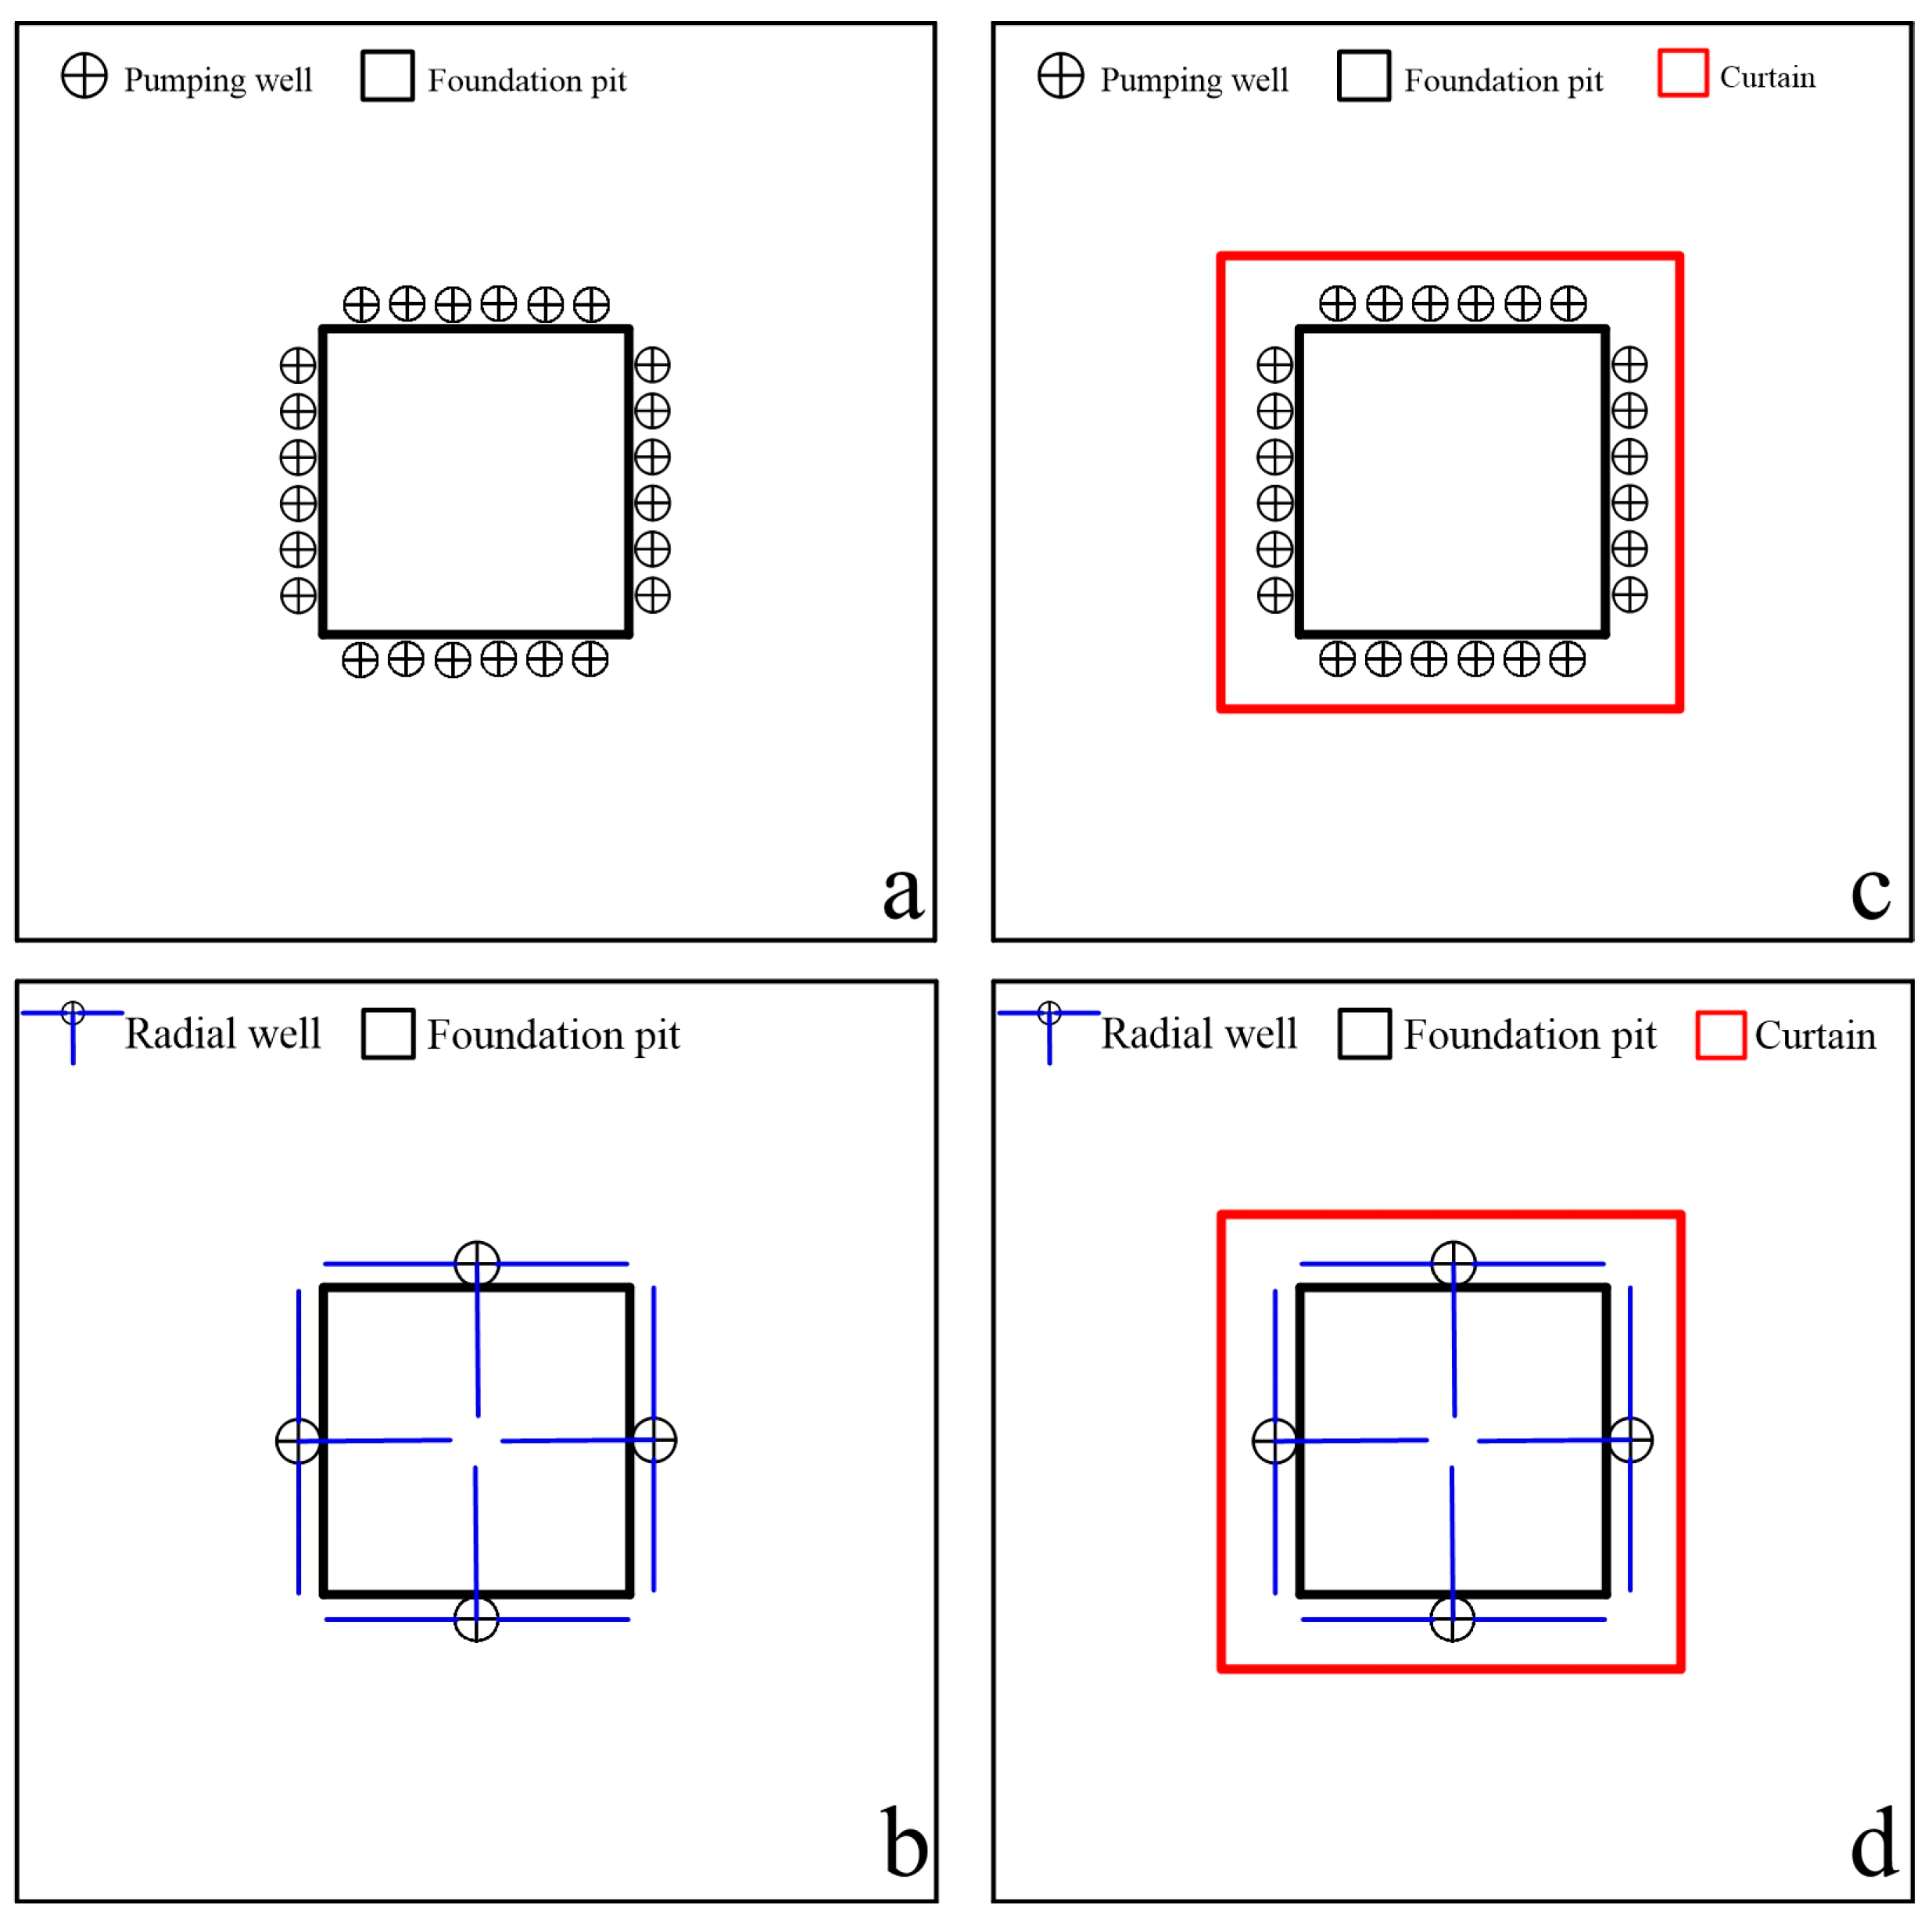
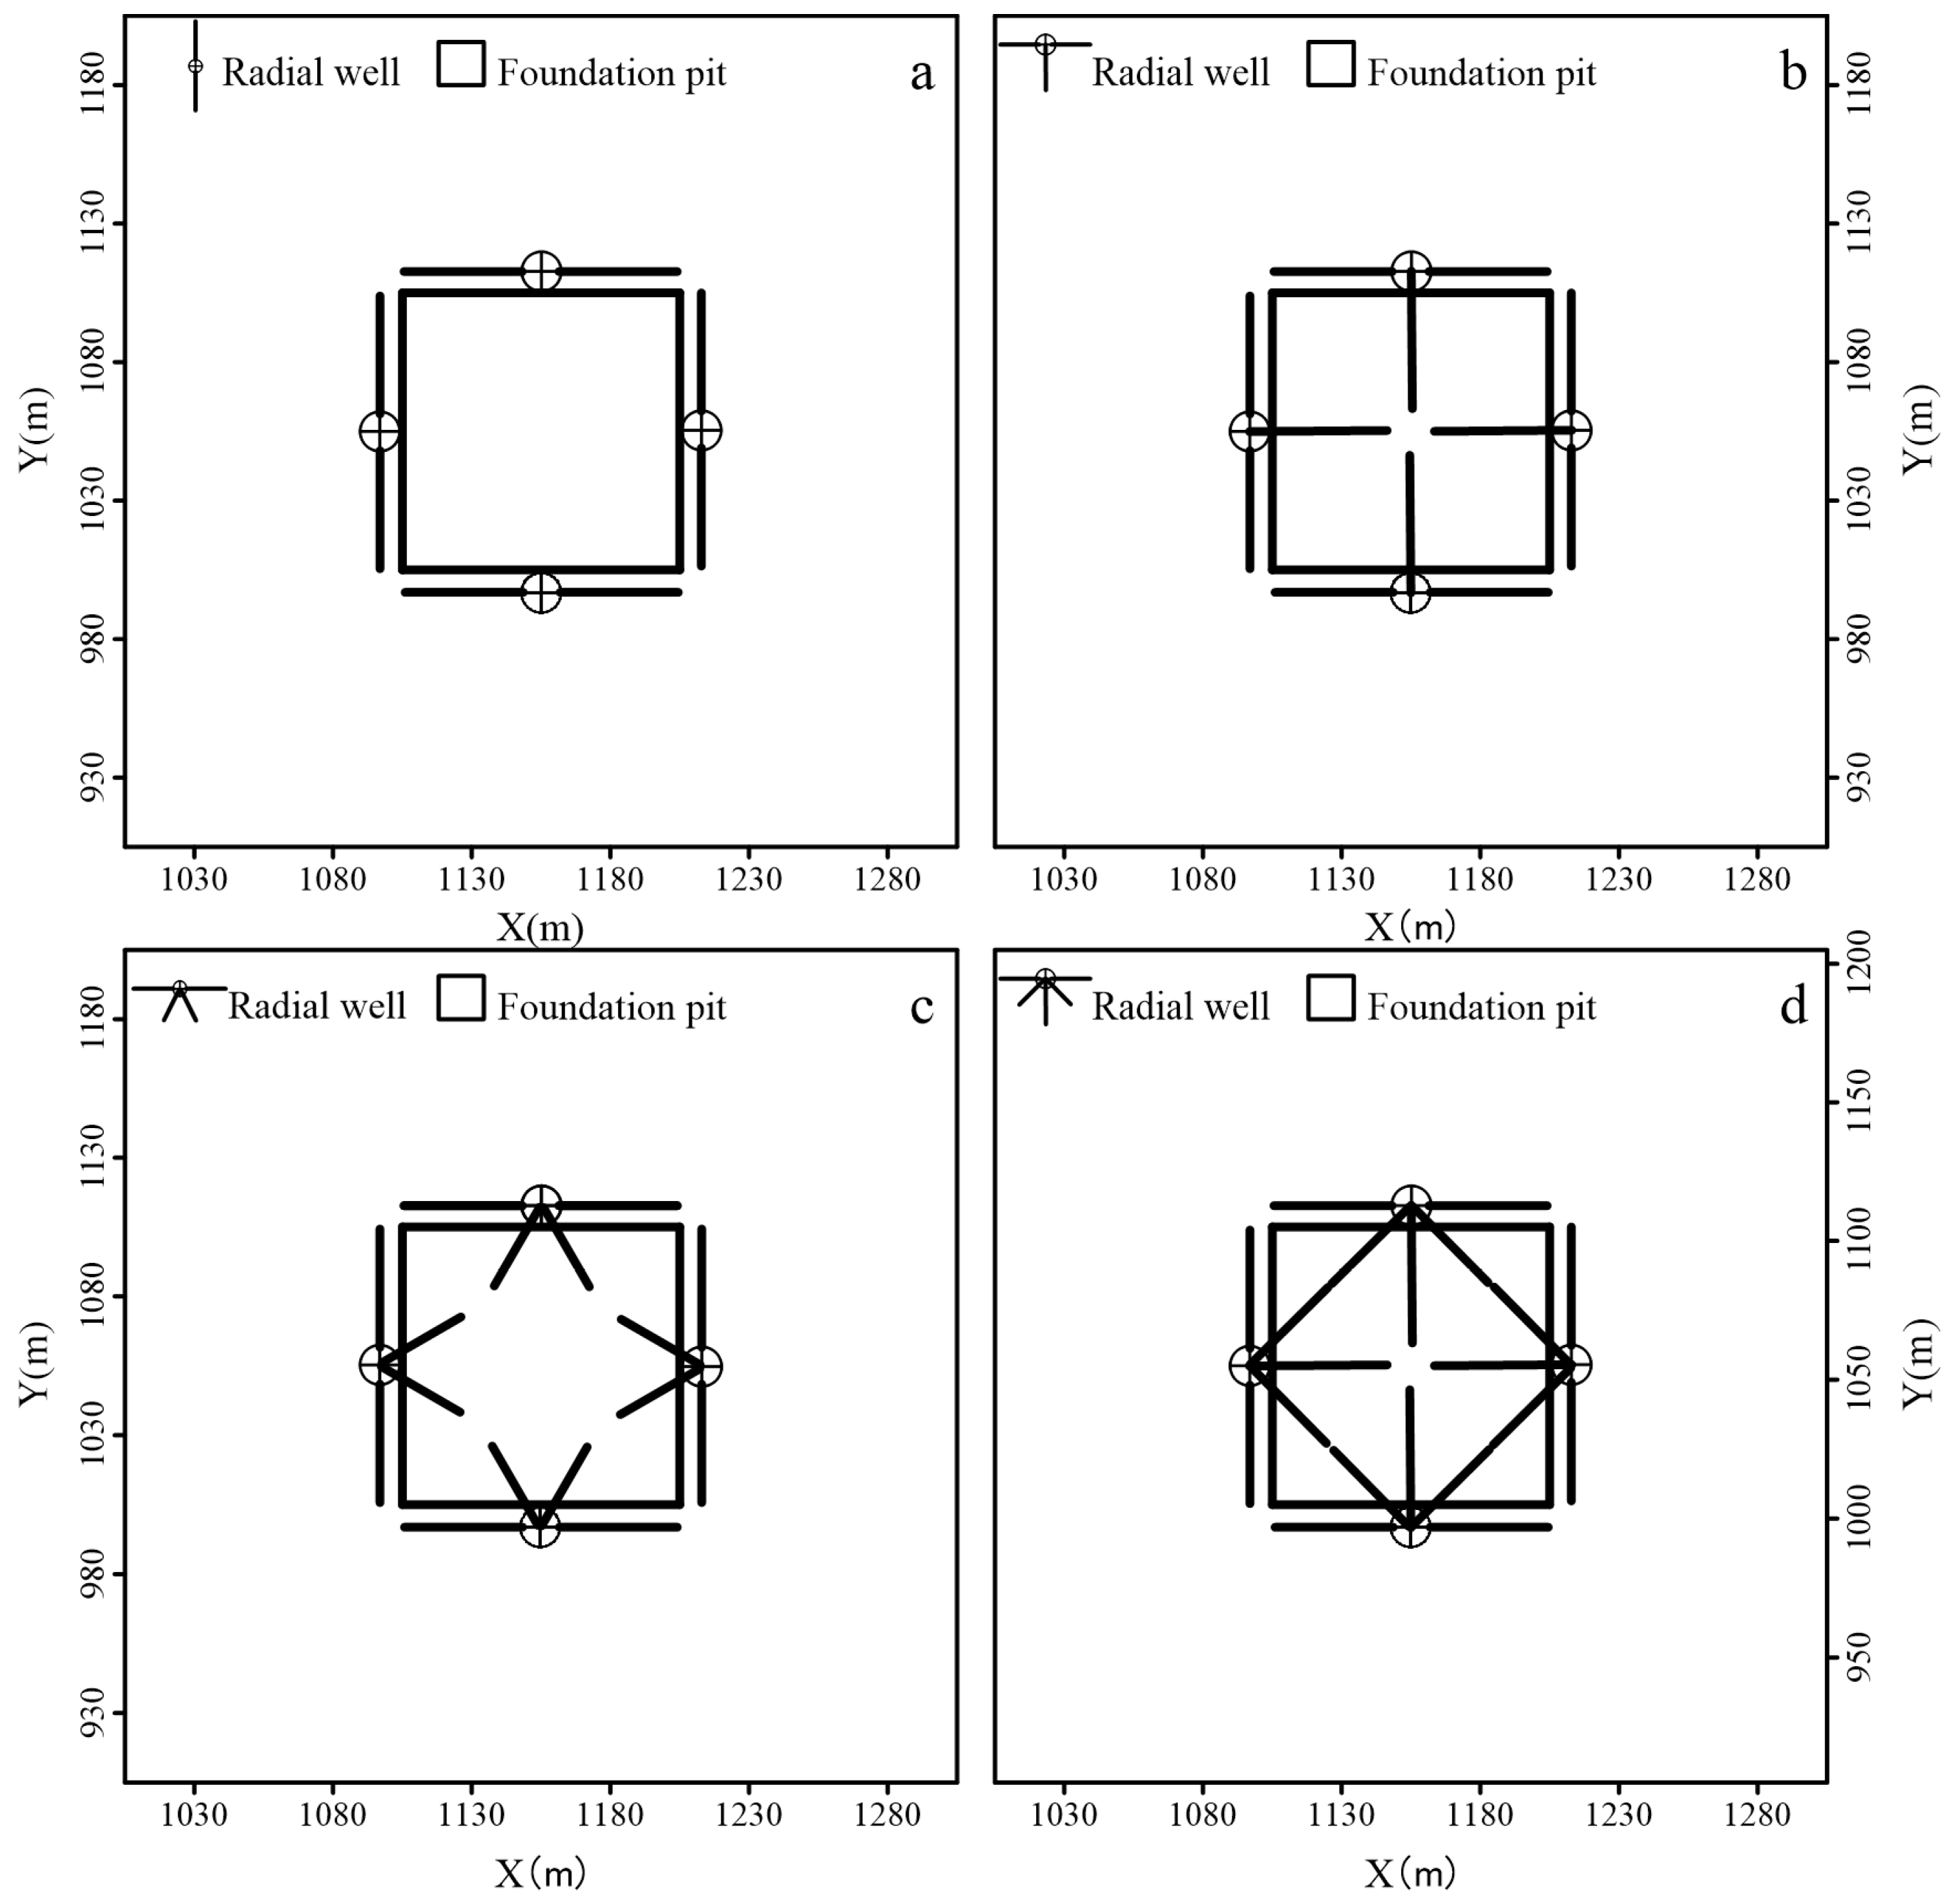
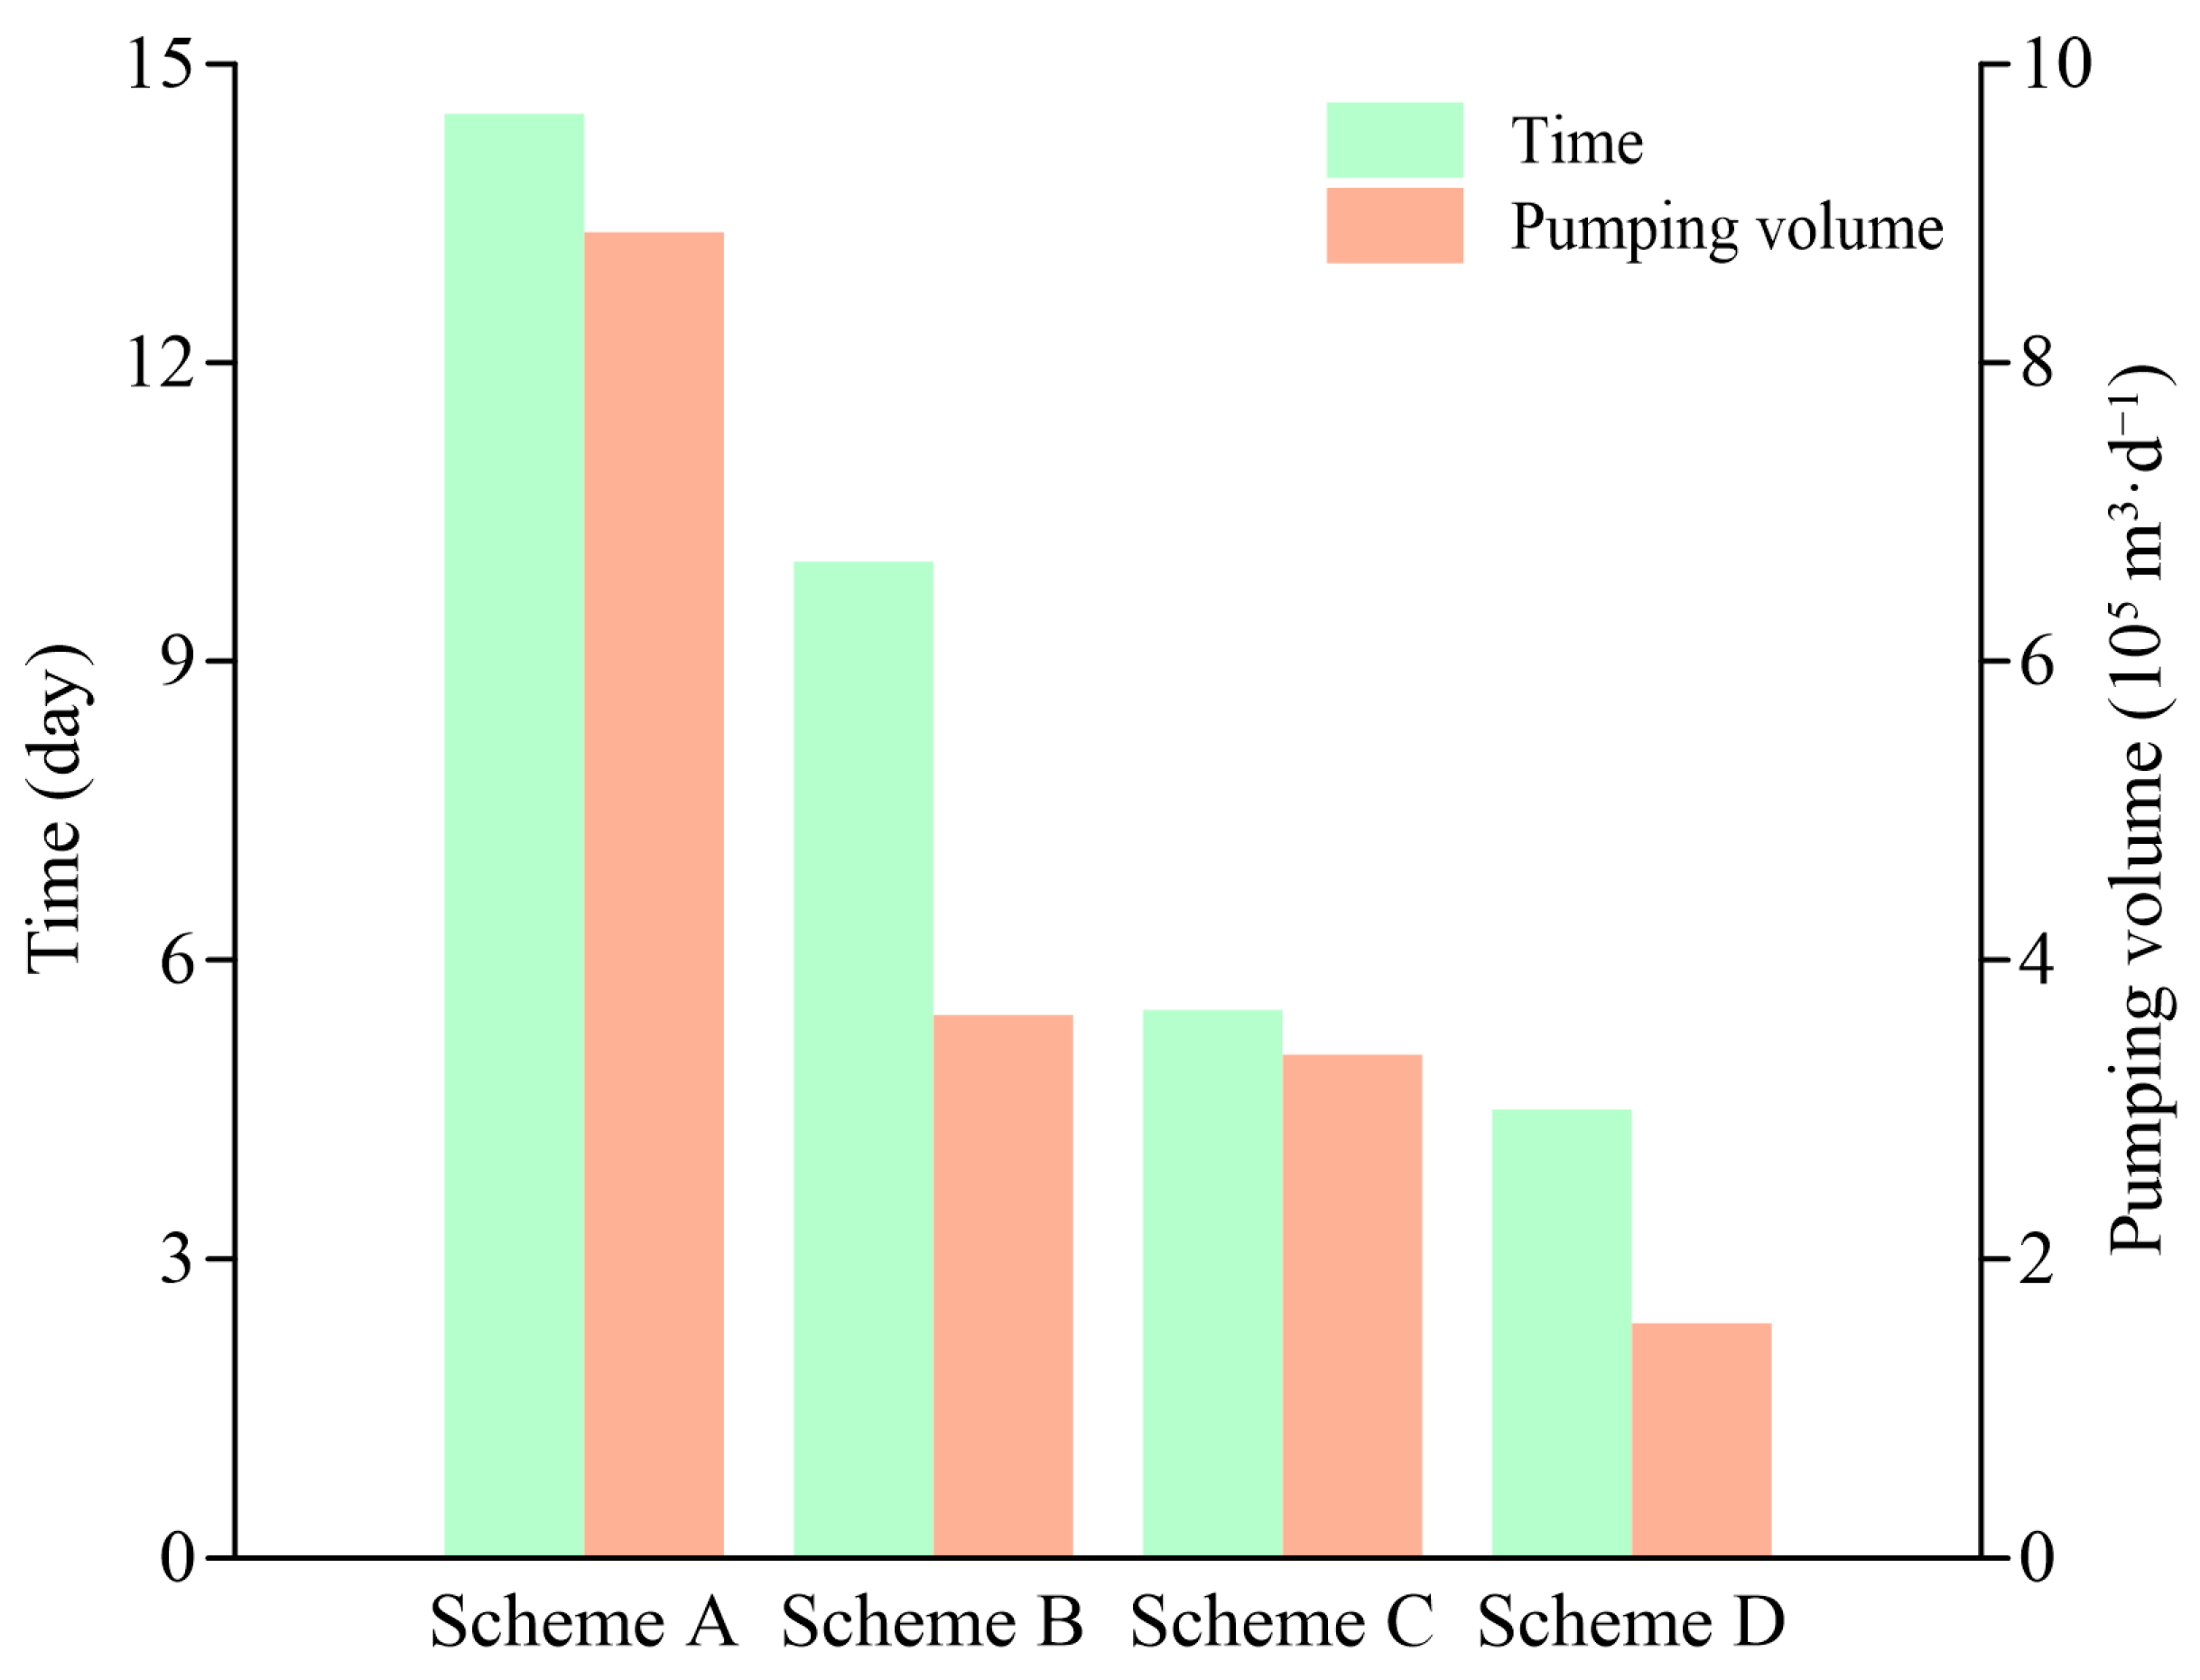
In this study, the numerical groundwater flow calculation software MODFLOW, developed by the USGS, was used to simulate and predict the state of groundwater flow during the construction of the foundation pit. The aquifer in the simulation area was a Quaternary alluvial porous unconfined aquifer, consisting of interbedded middle to late Pleistocene alluvial sands, gravels, and silt–clay. The thickness of the aquifer in the simulation area was 80 m. To simplify the model, the aquifer was considered as a homogeneous, anisotropic, and uniformly thick medium. The general conditions of the pit drainage works were described by assuming that the aquifer was homogeneous and of equal thickness. The discretization of the grid cell profile of the aquifer was as follows: in the horizontal direction, a model with 2.2 km on all four sides was divided into 220 rows and 220 columns, with a cell spacing of 10 m, and the model was then divided vertically into 18 unequally spaced layers (Figure 3). The first and second layers of the model were 10 and 5 m thick, respectively, while layers 3–18 were of equal thickness of 4 m, assuming the model’s top elevation was 80 m and the bottom elevation was 0 m. The entire model consisted of a total of 871,200 cells. In addition, the foundation pit was placed at the center of the discretized model area, with dimensions of 100 × 100 × 18 m.
The Well package and Horizontal Flow Barrier package in MODFLOW were used to represent the pumping wells and curtains, respectively. Pumping and radial wells were placed around the pit to dewater the pit. The bottom elevation of the foundation pit in the model was 62 m, which is 10 m below the phreatic water surface. The dewatering process for 365 days was simulated using a transient flow model, and the simulation was considered to have achieved the objective of dewatering the foundation pit when the water level in the foundation pit reached 0.5 m below the foundation pit bottom. In other words, the water level in the foundation pit was controlled to decrease below 61.5 m.
The radial pipes were discretized into a series of nodes based on the discretized profile. Their planar and vertical positions were first determined based on the actual position of each node, and they were then connected in a certain order to simulate the actual radial pipes [39]. The key to coupling is the exchange flow between the radial well and the aquifer. The vertical shaft was described as a head boundary. Using this extension, the seepage in the aquifer and the tubular flow in the radial well can be well coupled. As a result, a coupled seepage-tubular flow model was used to implement a numerical model of radial wells, using the Conduit Flow Process (CFP) module in MODFLOW to simulate radial wells [40].
In the model, the groundwater was assumed to flow from north to south. In addition, the phreatic water in the area was considered to be present at a depth of 8–10 m, with a hydraulic gradient of approximately 0.1%. The model used typical hydraulic and stratigraphic parameters rather than those of a specific project for its calculations, which can be changed at a later stage to simulate a specific area or project. Therefore, no actual fit correction to the model is required.

2.5. Scheme Design

Four foundation pit dewatering schemes were designed in this study, namely:
Scheme A: Pumping wells were placed around the foundation pit (Figure 4a), and the dewatering efficiency was investigated by adjusting the number of pumping wells and the volume of water pumped from a single well. As an example, 24 pumping wells were placed around the foundation pit, with 6 wells evenly distributed on each side of the pit from the center. The pumping rate of each well was uniformly adjusted, and the time required to achieve the target water level and the affected area of the groundwater seepage field were calculated. Scheme B: The shafts of radial wells were placed around the perimeter of the foundation pit, while radial pipes were placed under the bottom of the pit (Figure 4b), through which the water in the pit was drained into a shaft and pumped out. The effect of the radial wells on the dewatering efficiency of the foundation pits was investigated by varying the structure and parameters of the radial wells. The settings with different numbers of radial pipes can be seen in Figure 5. Scheme C and D: Based on scenarios A and B, impermeable curtains were added outside the pumping well or shafts of radial wells (see Figure 4c,d) to investigate the effect of impermeable curtains on drainage. Typically, the depth of the impermeable curtain should be at least 10 m below the bottom of the foundation pit, and the curtain should extend 35 m downward from the ground surface.
The different scenarios were calculated using MODFLOW-2005. The model parameters and spatial discretization were set according to the settings in Section 2.2 and Section 2.4.

2.6. Principles of Scheme Preference

Xianyang City is located in the arid and semi-arid region of northwest China, where the total amount of water resources is insufficient, and groundwater resources are particularly important [41]. To avoid the waste of resources, groundwater discharge should be minimized during pit dewatering. Excessive discharge of the groundwater is likely to cause land subsidence [42,43]. Therefore, the decrease in groundwater level in the surrounding area caused by dewatering should be controlled during the process of foundation pit dewatering to reduce the disturbance to groundwater seepage field. In addition, a shorter dewatering time can speed up the project progress and reduce the disturbance of the groundwater environment by construction. In this study, different foundation pit dewatering methods were utilized. Several schemes were first designed using the control variable method and then compared based on the following principles of preference: (1) The scheme with the shortest dewatering time when the target water level (61.5 m) was reached was considered to be the best scheme. (2) The scheme with the lowest total groundwater discharge when the target level was reached was considered to be the best scheme. (3) The scheme with the lowest spatial seepage field disturbance around the foundation pit when the target water level was reached was considered to be the best scheme.

3. Results and Discussion

3.1. Pumping Well

The results of the relationship between the pumping rate of a single well and the dewatering time (Figure 6a) showed that for a constant pumping rate, increasing the number of pumping wells deployed resulted in a shorter dewatering time and higher efficiency. In addition, an increase in the number of pumping wells in the same area and a reduction in the spacing between pumping well placements could result in a superimposed radius of influence, thus increasing the area and depth of the cone of depression and enabling more efficient pit dewatering. Alternatively, with a fixed number of pumping wells, increasing the volume of water pumped from a single well resulted in a shorter dewatering time and higher efficiency until a certain value of the volume of water pumped, at which the dewatering time became constant at a minimum value.
The area of groundwater flow field disturbed by foundation pit dewatering positively correlated with the total volume of dewatering (Figure 7). A larger total volume of pumping resulted in the disturbance of a larger area of groundwater flow field by the dewatering and a greater degree of disturbance. Figure 6 shows that when the number of pumping wells was constant, the higher the single-well pumping rate, the shorter the time required to reach the target water level. This led to a smaller total pumping volume and a reduction in disturbance to the groundwater flow field. For example, when the number of pumping wells was 36, increasing the single well pumping rate from 1000 to 1500 m³·d−1 resulted in a reduction in pumping time from 87.5 to 21.5 days and a decrease in total pumping volume from 31.5 × 10⁵ to 11.61 × 10⁵ m³. As shown in Figure 7, correspondingly, the disturbed area of the flow field decreased from 33.45 × 10⁵ to 9.04 × 10⁵ m2, indicating that a smaller total pumping volume resulted in less disturbance to the flow field.
No significant change was observed in the dewatering pattern of the pumping wells when the curtain was considered. Figure 6b shows that the time required for dewatering gradually decreased with an increase in both the pumping rate of a single well and the number of wells. Once the pumping rate of a single well reached a certain level, the influence of increasing the number of wells on the dewatering time became minimal. From Figure 7, it can be observed that the area of disturbance in the groundwater flow field decreased as the total pumping rate increased in the presence of a curtain. Increasing the pumping rate of a single well means increasing the drawdown near the pumping well. Pumping out more groundwater locally per unit time could more quickly lower the groundwater level to the target level, leading to less disturbance time and a smaller disturbance area in the groundwater flow field. However, there was no significant impact of increasing the number of pumping wells and the volume of water pumped on the dewatering efficiency when the total volume flow of water discharged was close to the recharge of the aquifer flux.
To determine the duration of drainage to reach the target water level, the total amount of pumping and the area of disturbance to the groundwater flow field were examined. Based on the results in Figure 6, the time required to reach the target water level changed very little when the pumping rate of a single well exceeded 1700 m³·d−1. When the number of pumping wells was 36 and the total pumping rate was 8.87 × 10⁵ m3, Figure 7 shows that the disturbed area of the flow field was 6.74 × 10⁵ m2. It can be seen that, when 36 wells were deployed and the pumping capacity of a single well was 1700 m³·d−1, the time to reach the target water level was relatively quick; there was a lower total amount of pumping, and there was less disturbance to the groundwater flow field. Continuing to increase the number of wells would increase the construction cost, and there would be no significant improvement in dewatering efficiency. Thus, the solution of 36 wells with a single-well pumping capacity of 1700 m³·d−1 was considered to be the preferred scheme. The disturbance of the seepage field in and near the foundation pit was analyzed using this scenario (Figure 8). Using pumping wells (Figure 8a,c), the water level in the pit was rapidly decreased to below the bottom depth of the pit, owing to the radius of influence of each pumping well being superimposed on the others around the pit, while the head distribution in the pit was relatively uniform. After the dewatering, the drawdown was highest in the vicinity of the pumping well, followed by that observed in the foundation pit, while the cone of depression was centered in the pit and decreased uniformly outwards in a sub-circular shape. Within a 100 m radius of the foundation pit, the water table dropped to a depth of more than 4 m. In addition, this scenario disturbed the seepage field to a greater extent.
The curtain prevented the exchange of groundwater between the two sides of the curtain. Without a curtain and at a constant pumping rate, a large proportion of the groundwater pumped was derived from the recharge of the aquifer at the periphery of the foundation pit, resulting in a low level of groundwater change within the pit. In contrast, in the presence of a curtain and with the same pumping rate, most of the water pumped was derived from within the curtain since the external recharge from the aquifer was insufficient. Owing to the radius of influence and drawdown of the pumping wells in the foundation pit, the water level in the pit decreased more rapidly, indicating a high improvement in the dewatering efficiency. The scheme with the presence of the curtain required less time to reach the target water level owing to the small amount of groundwater pumped. Additionally, the influence of pumping was primarily observed within and around the curtain, while the curtain reduced the disturbance to the groundwater flow field.

3.2. Radial Well

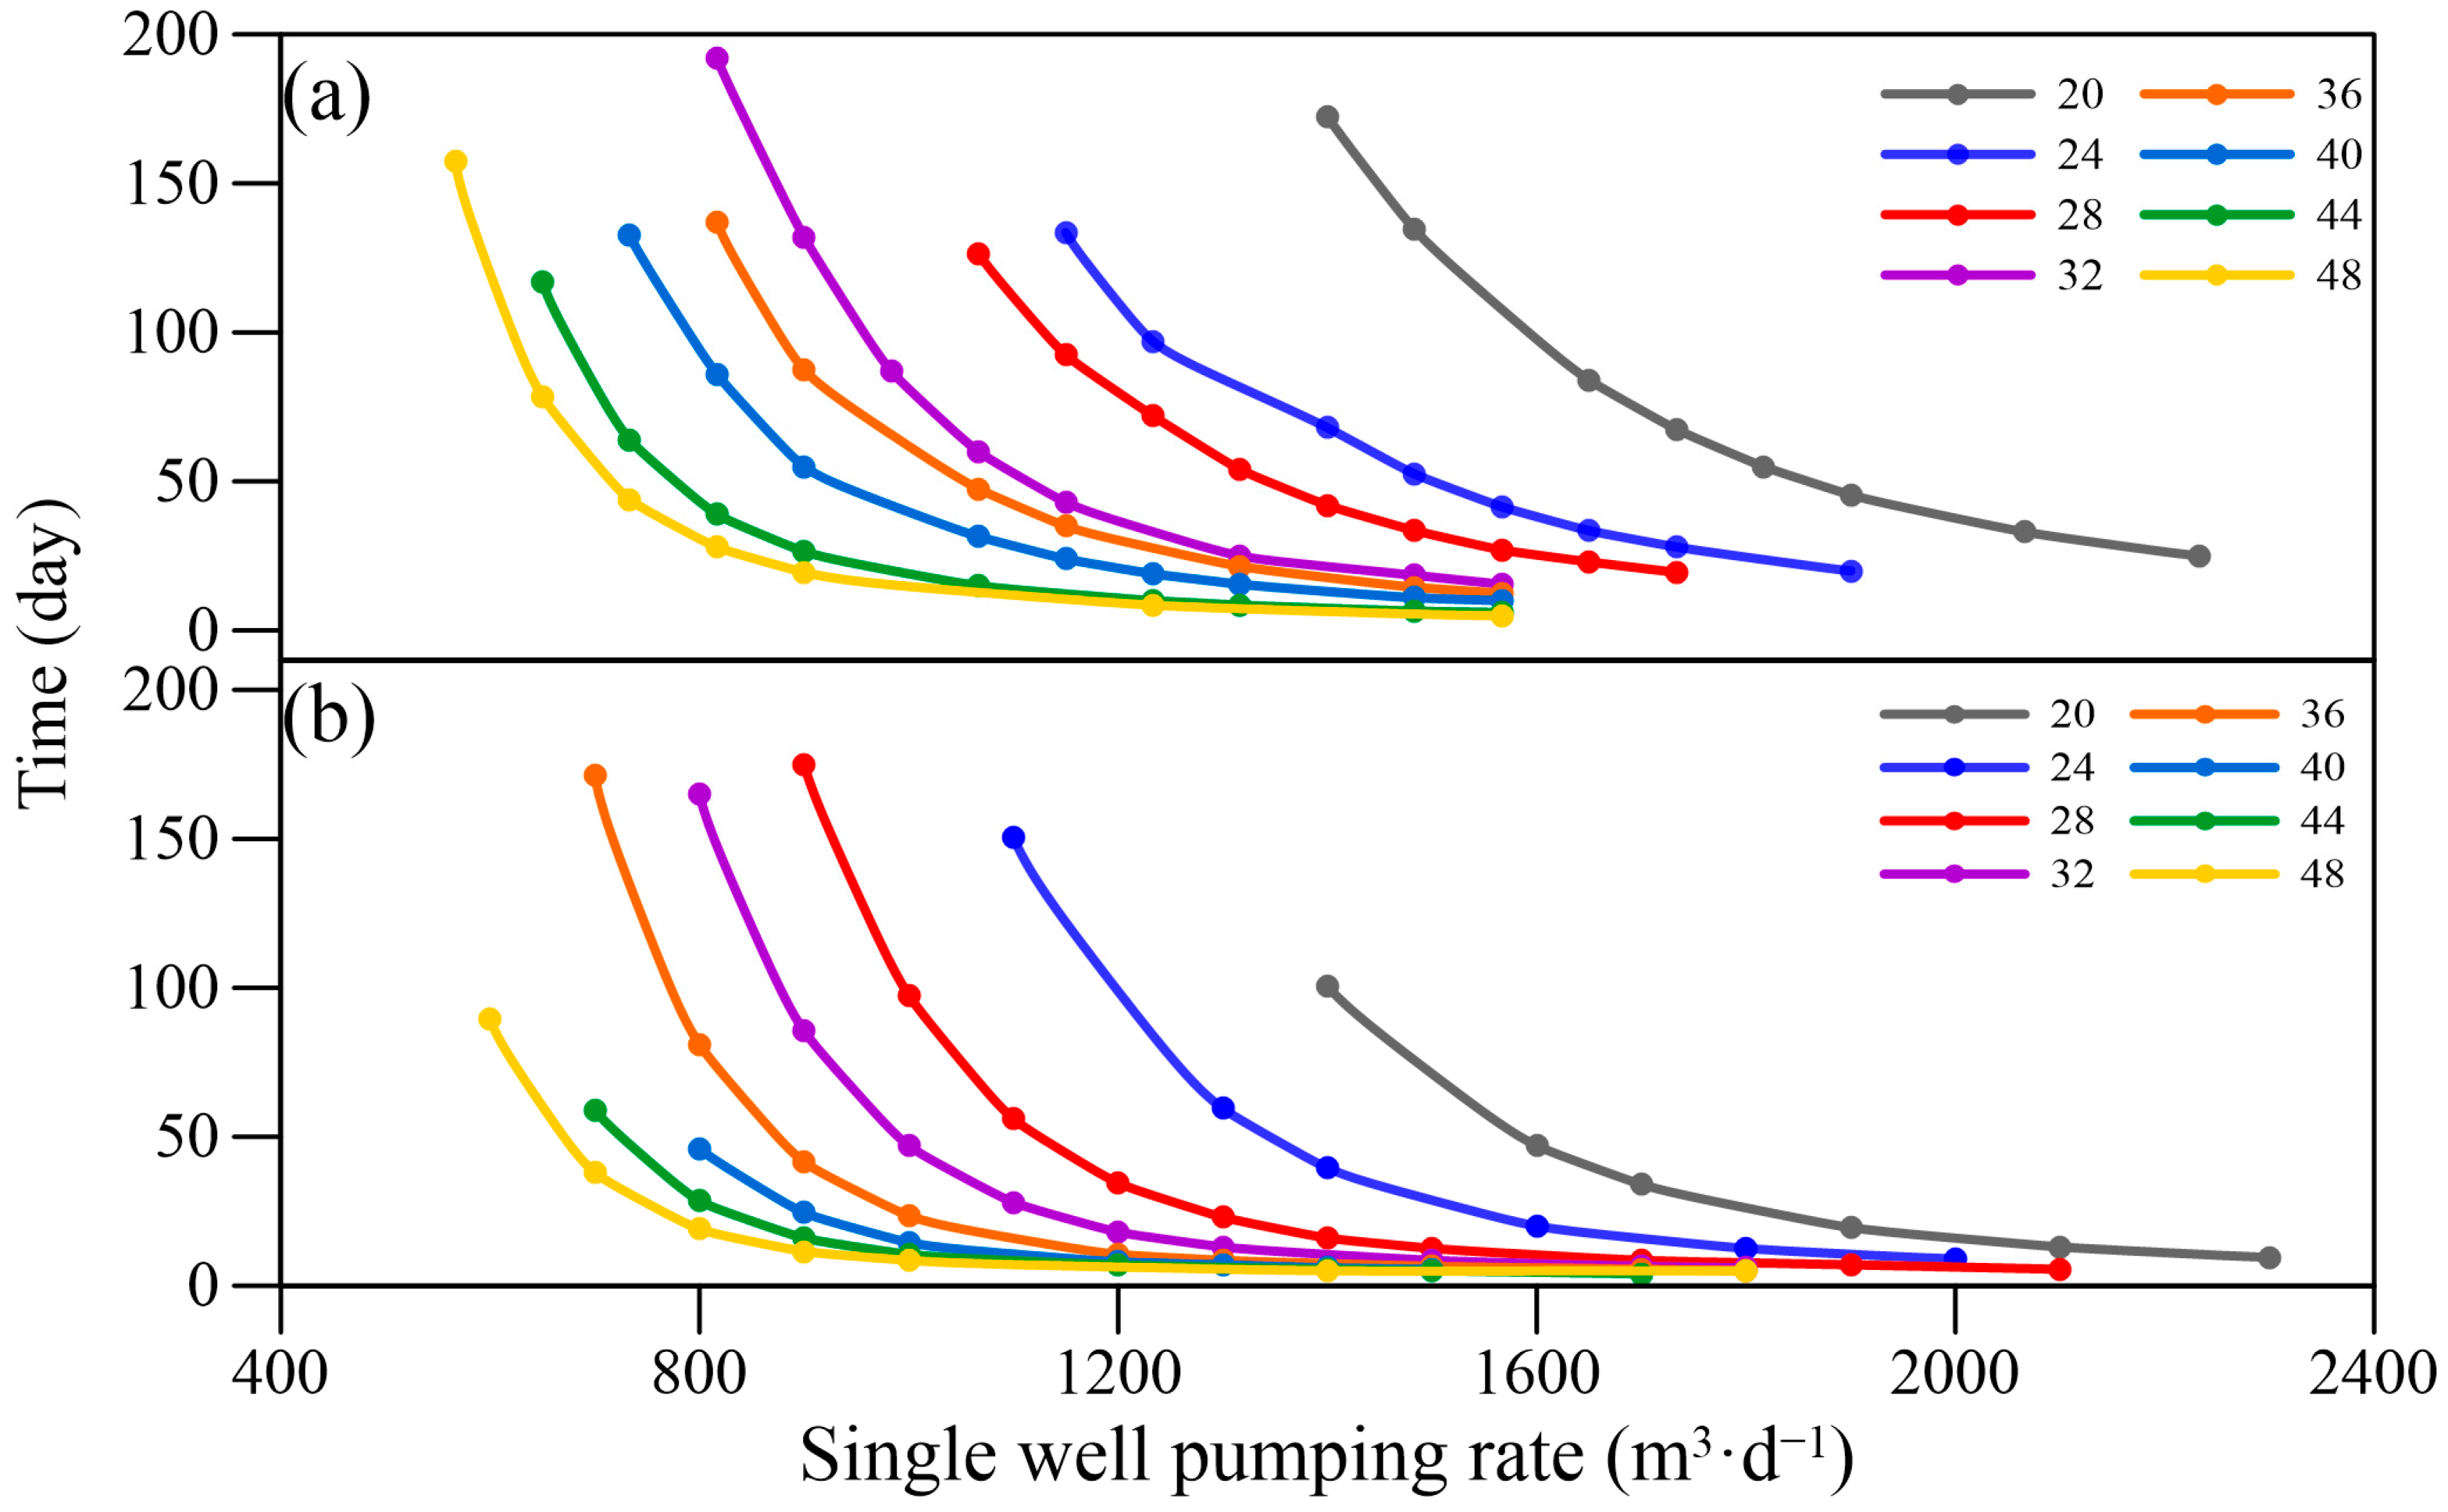
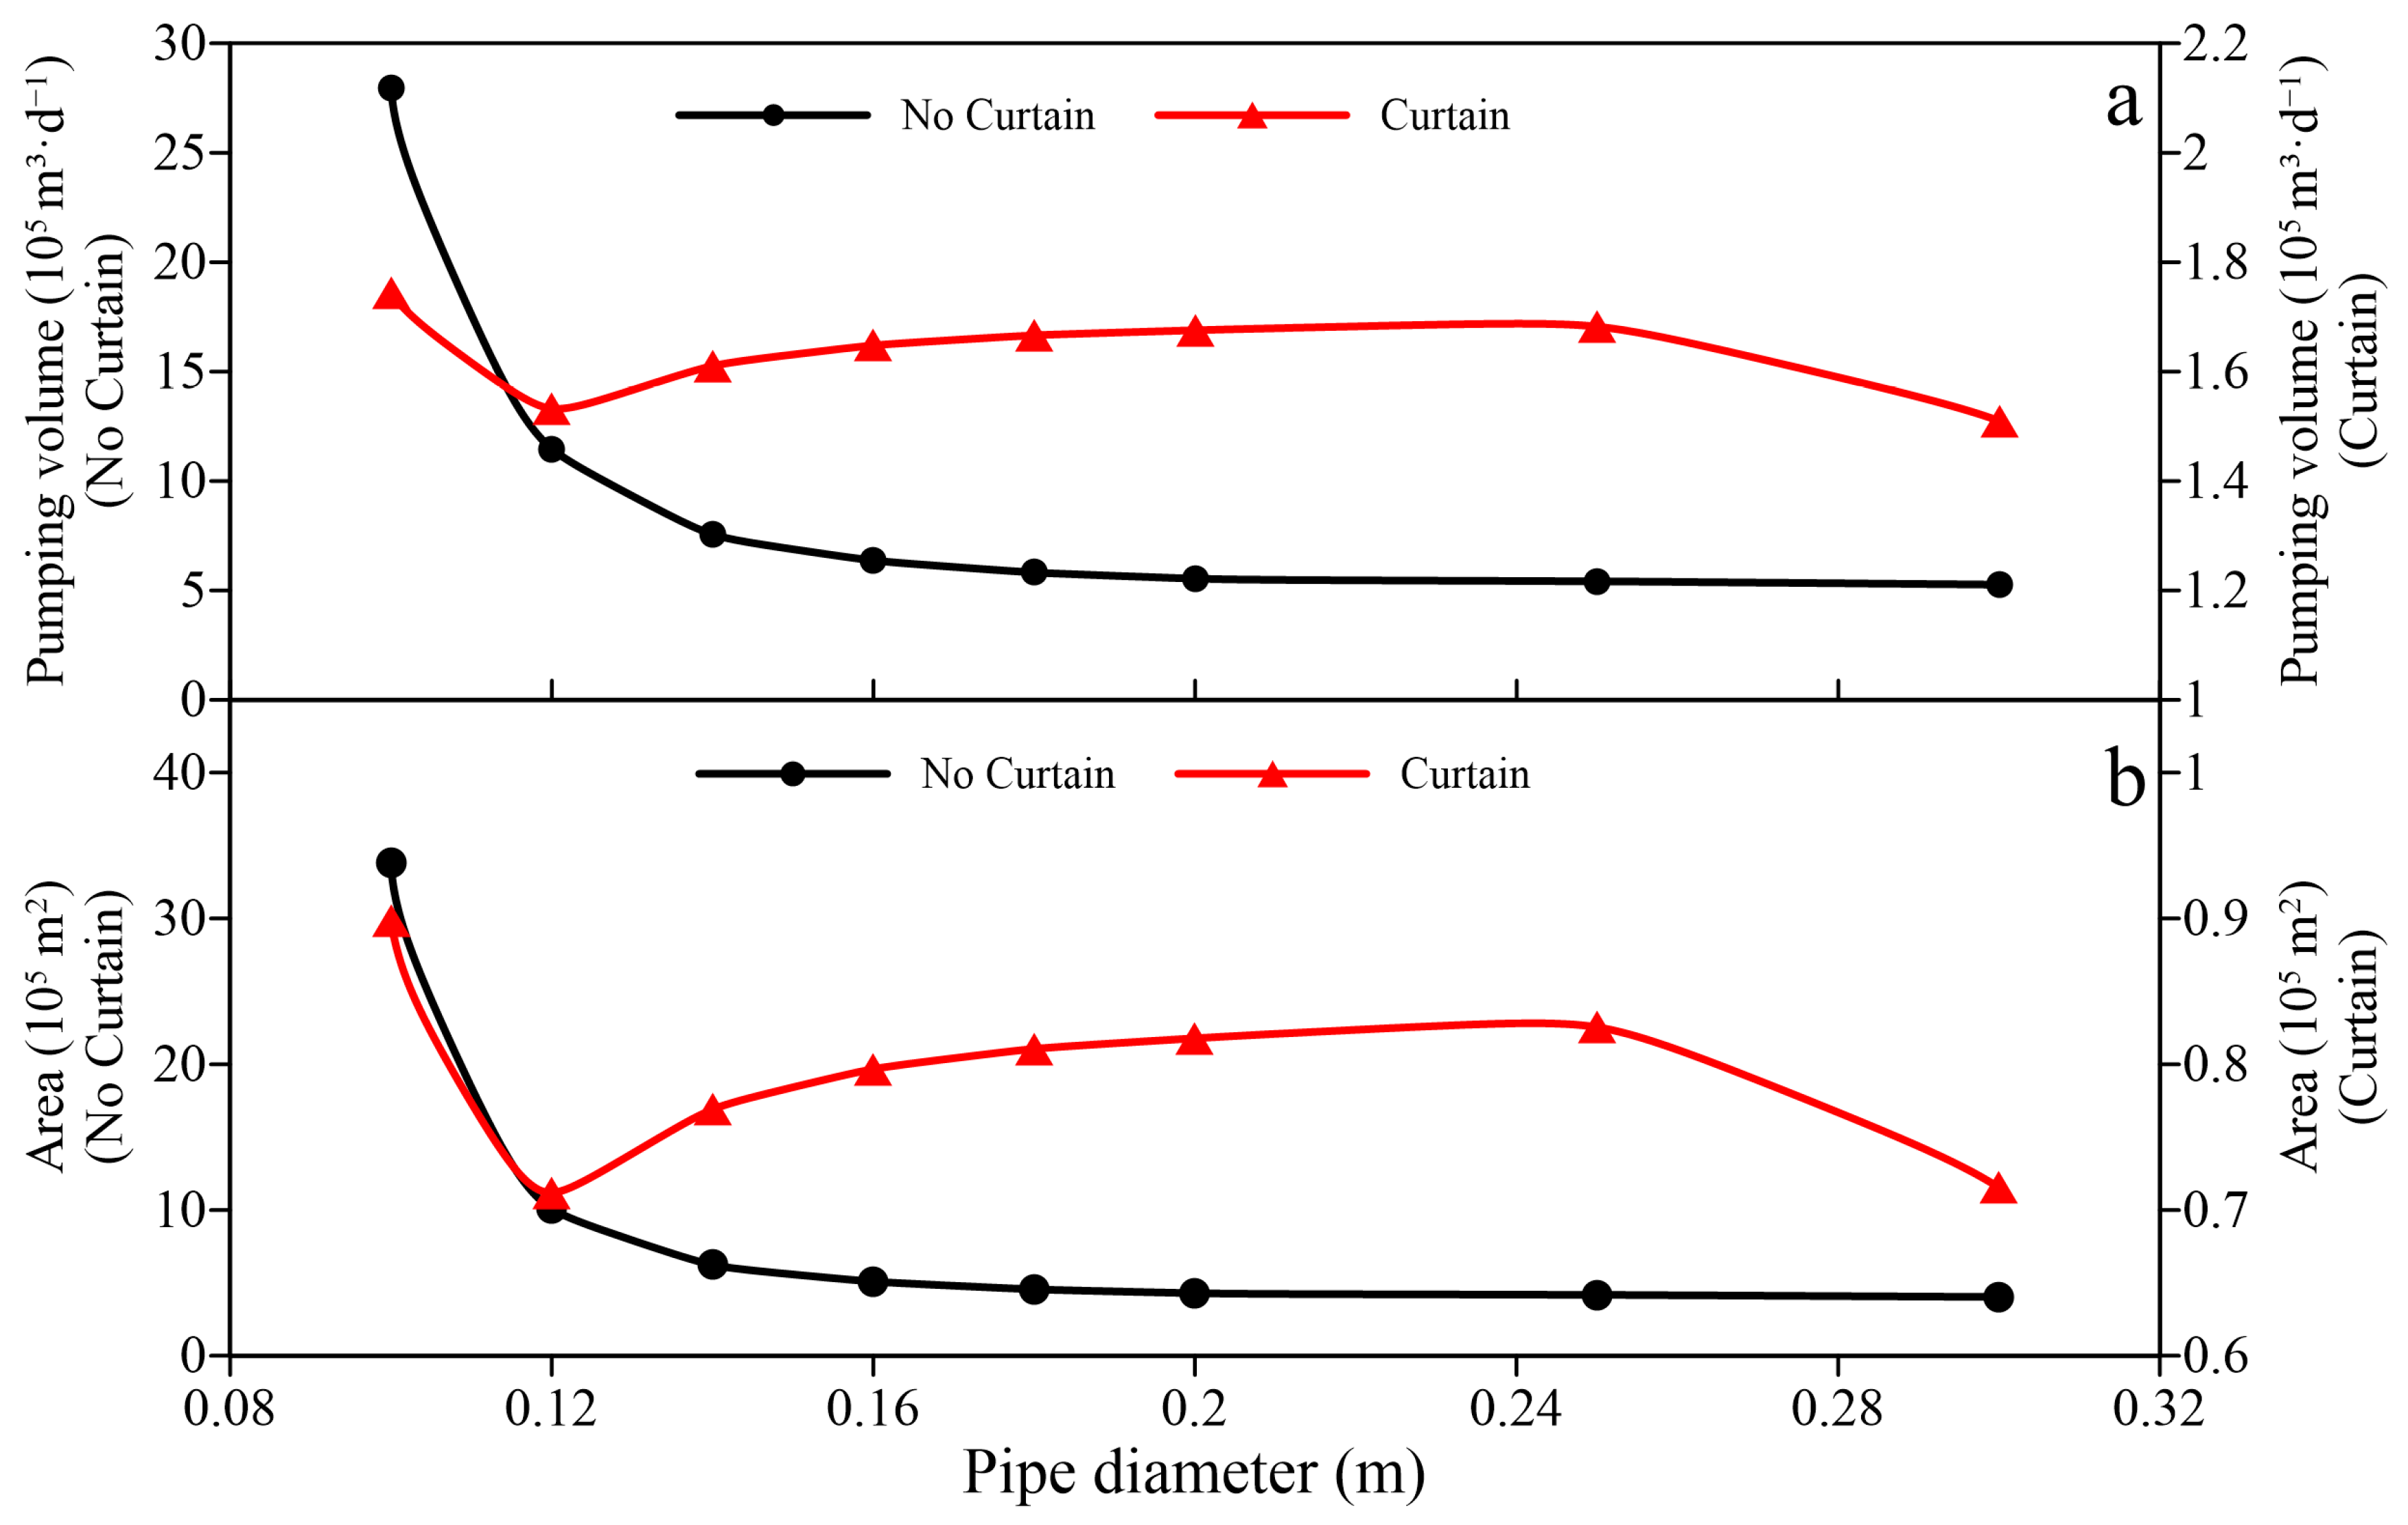
3.2.1. Diameter of the Radial Pipes

The results indicated a gradual decrease in the time required to reach the target water level (61.5 m), the total volume of water pumped, and the area of the seepage field affected, with an increase in the diameter of the radial pipes from 0.1 to 0.3 m (0.1, 0.12, 0.14, 0.16, 0.18, 0.2, 0.25, and 0.3 m) and with the other parameters constant. It is apparent in Figure 9a that increasing the pipe diameter to approximately 0.14 m resulted in a decrease in the time required to reach the target water level and the total volume of water pumped. It then stabilized as the pipe diameter continued to increase. Additionally, the results showed a lower inflow efficiency of the radial pipe when the radial pipe had a small diameter, with a lower inflow rate and a smaller area of influence on the dewatering. Increasing the diameter of the radial pipe could improve the efficiency of the radial pipe inflow and increase the area of influence per unit length of radial pipe and the volume of water pumped per unit time. This would lead to an increase in the area and degree of disturbance of the seepage field by the radial pipe per unit time and a significant reduction in the time required to reach the target water level and the total volume of groundwater pumped. However, when the amount of groundwater pumped per unit time was close to the dynamic recharge limit of the aquifer, increasing the diameter further did not enhance the inflow of water to the radial pipe.
As shown in Figure 9b, the area of influence of the foundation pit dewatering on the seepage field decreased with an increase in pipe diameter. Indeed, no increase in the area of influence of the dewatering was observed when the pipe diameter exceeded 0.14 m. The area of disturbance in the seepage field was related to the total volume of water pumped. The results revealed a decrease in the total volume of groundwater and disturbance as the diameter of the radial pipe increased.
With the presence of a curtain (Figure 9), increasing the diameter of the radial pipes resulted in a similar trend of variation in dewatering time and total pumping volume by first decreasing gradually and then remaining stable. The general pattern of variation was consistent with that of the no-curtain scheme. Due to the presence of the curtain, most of the water pumped out was derived from the groundwater inside the curtain, with a small amount of water from outside the curtain. This resulted in a significantly reduced area of disturbance of the seepage field outside the curtain caused by the foundation pit dewatering (Figure 9b).

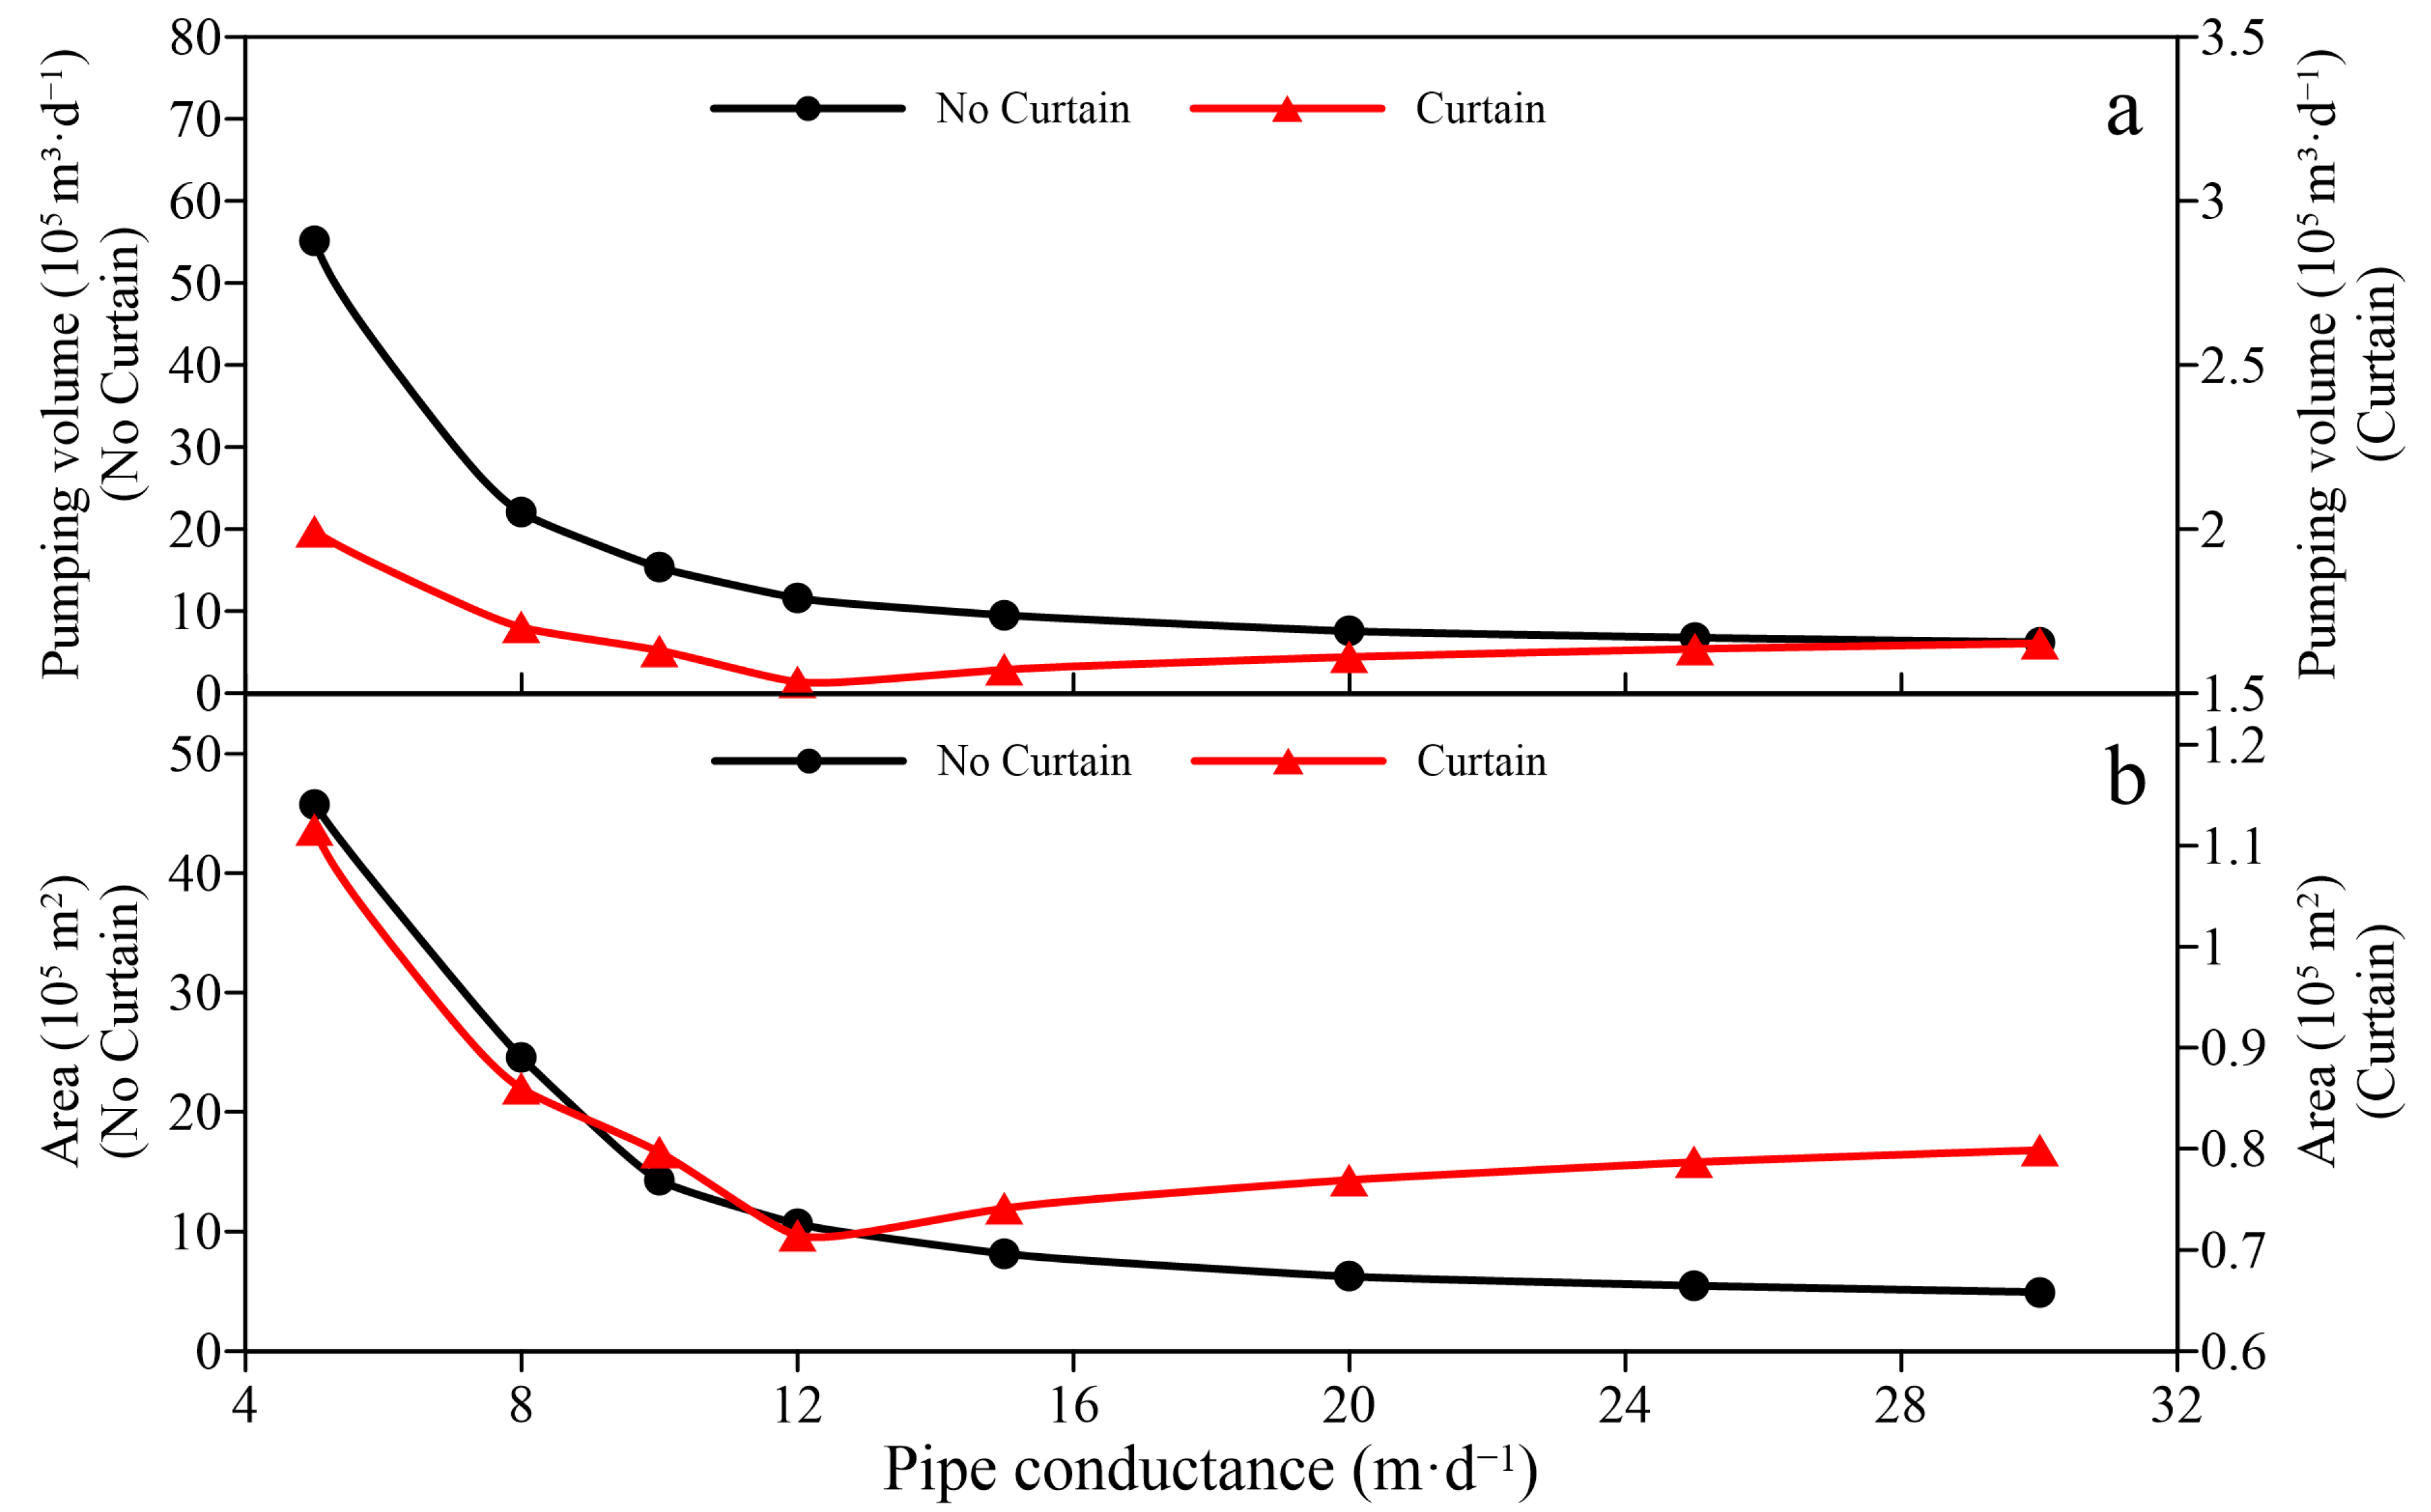
3.2.2. Conductance of the Radial Pipes

The results showed a decrease in the time required to reach the target water level and the total amount of water pumped with an increase in conductance of the radial pipes (5, 8, 10, 12, 15, 20, 25, and 30 m·d−1). The area of disturbance in the seepage field caused by the dewatering decreased due to the reduction in total volume of water pumped (Figure 10). The results showed an increase in the efficiency of the radial pipes and the spatial influence of dewatering as a result of the increased conductance of the radial pipes. Moreover, the water level in the foundation pit changed rapidly, resulting in a decrease in the water level to the target value in a relatively short time. Indeed, the efficiency of the radial pipes can be improved significantly when the conductance is equal to the aquifer hydraulic conductivity (20 m·d−1). In other words, the inflow of the radial pipes could be close to the amount of water flow in the aquifer. Therefore, increasing the conductance of the radial pipes may not significantly enhance the efficiency of the dewatering.
The trend in dewatering efficiency for the radial well-curtain coupling was found to be similar to that of the single radial well. However, the total volume of water pumped and the area of disturbance to the seepage field decreased as the conductance of the radial pipes increased. Thus, using the curtain may improve the dewatering efficiency. A relatively small amount of groundwater was stored in the aquifer inside the curtain. As a result, the effect of radial well conductance changes on the dewatering process could become less significant when the total amount of water pumped per unit time equaled the recharge amount from outside to inside the curtain.

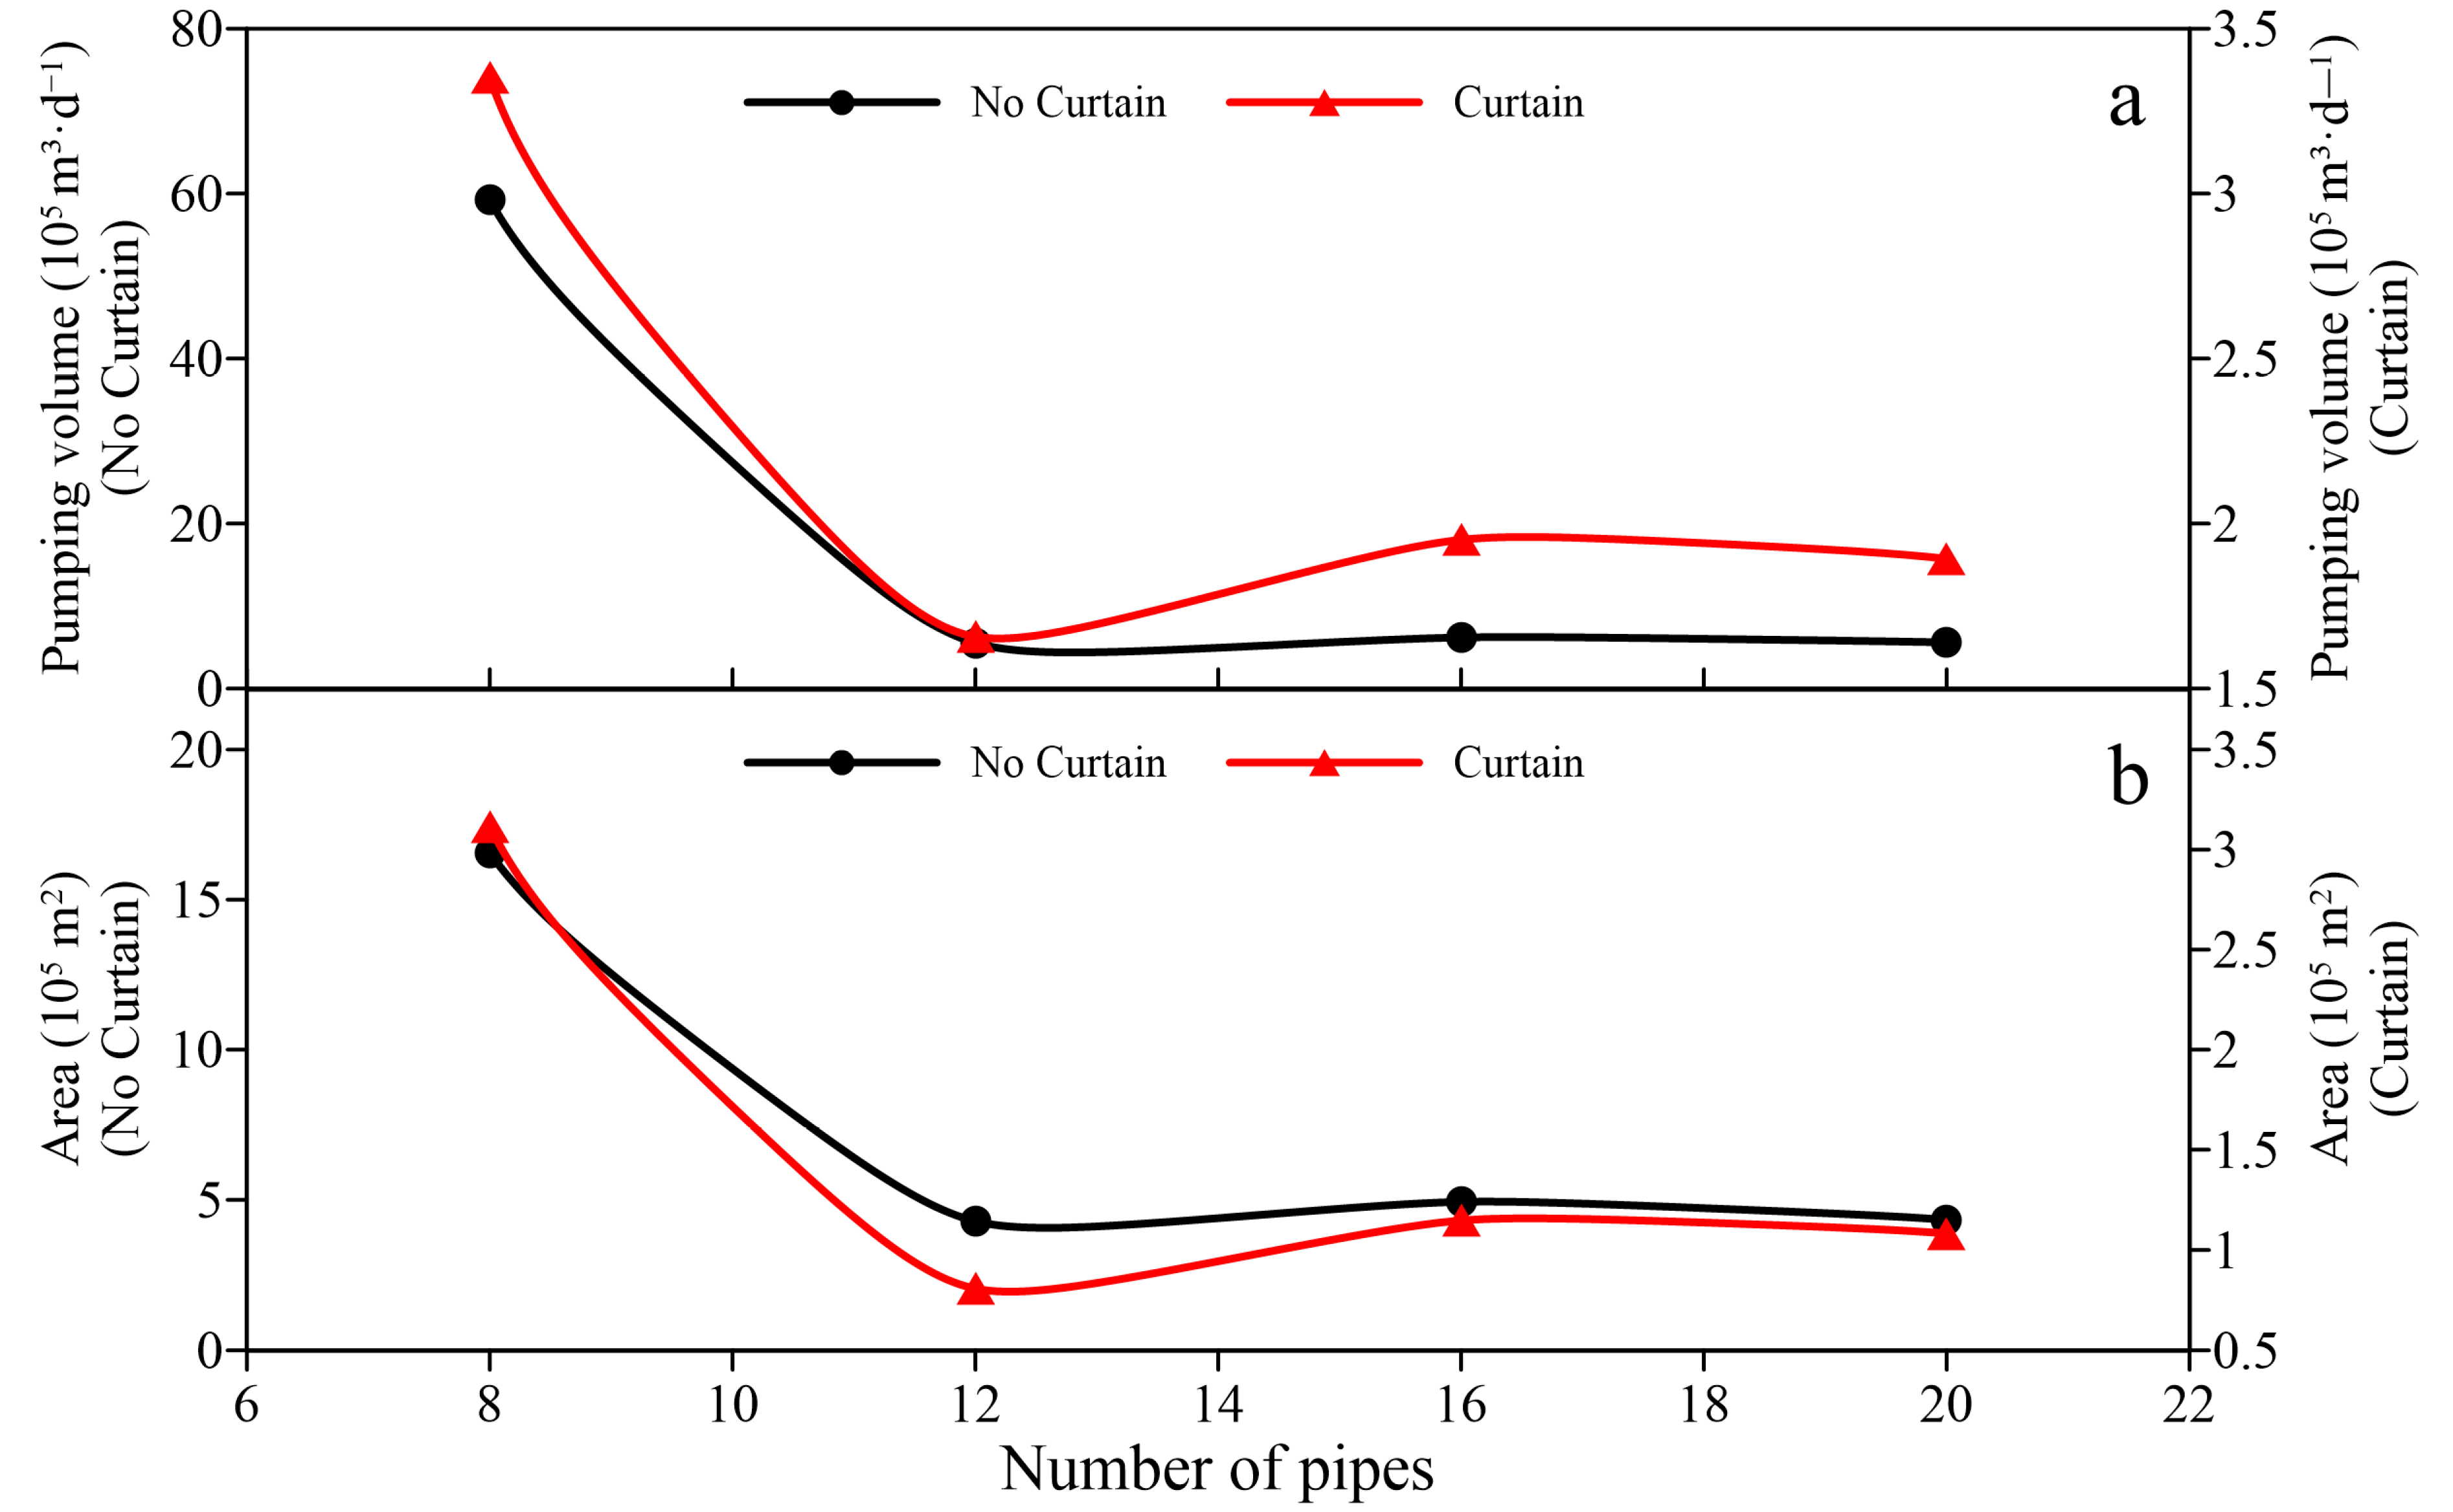
3.2.3. Number of Radial Pipes

To compare the effect of the number of radial pipes on the dewatering efficiency of the radial wells, the way in which the radial pipes are laid out needs to be considered, as shown in Figure 5.
The radial pipes were arranged in layouts according to their number: 8, 12, 16, and 20 (Figure 5). The results showed a reduction in the time taken to reach the target water level and the total amount of groundwater pumped as the number and total length of radial pipes increased (Figure 11a). Indeed, no change in the total volume of water pumped and the area of influence on the seepage field was observed when there were 12 pipes or more. With an increase in the effective length of the pipe inflow, more water was pumped per unit time from the radial wells. Consequently, less time was required to reach the target water level, a smaller total amount of water was pumped, and there was less disturbance to the seepage field (Figure 11b). However, there was no significant effect of increasing the number of pipes on the improvement of the dewatering efficiency when the water flow that entered the radial pipes was close to the discharge limit of the aquifer. In the presence of the curtain, increasing the number of radial pipes resulted in a similar trend in the total dewatering volume and time required as in the no-curtain scenario, but with a smaller area of groundwater seepage field disturbance.

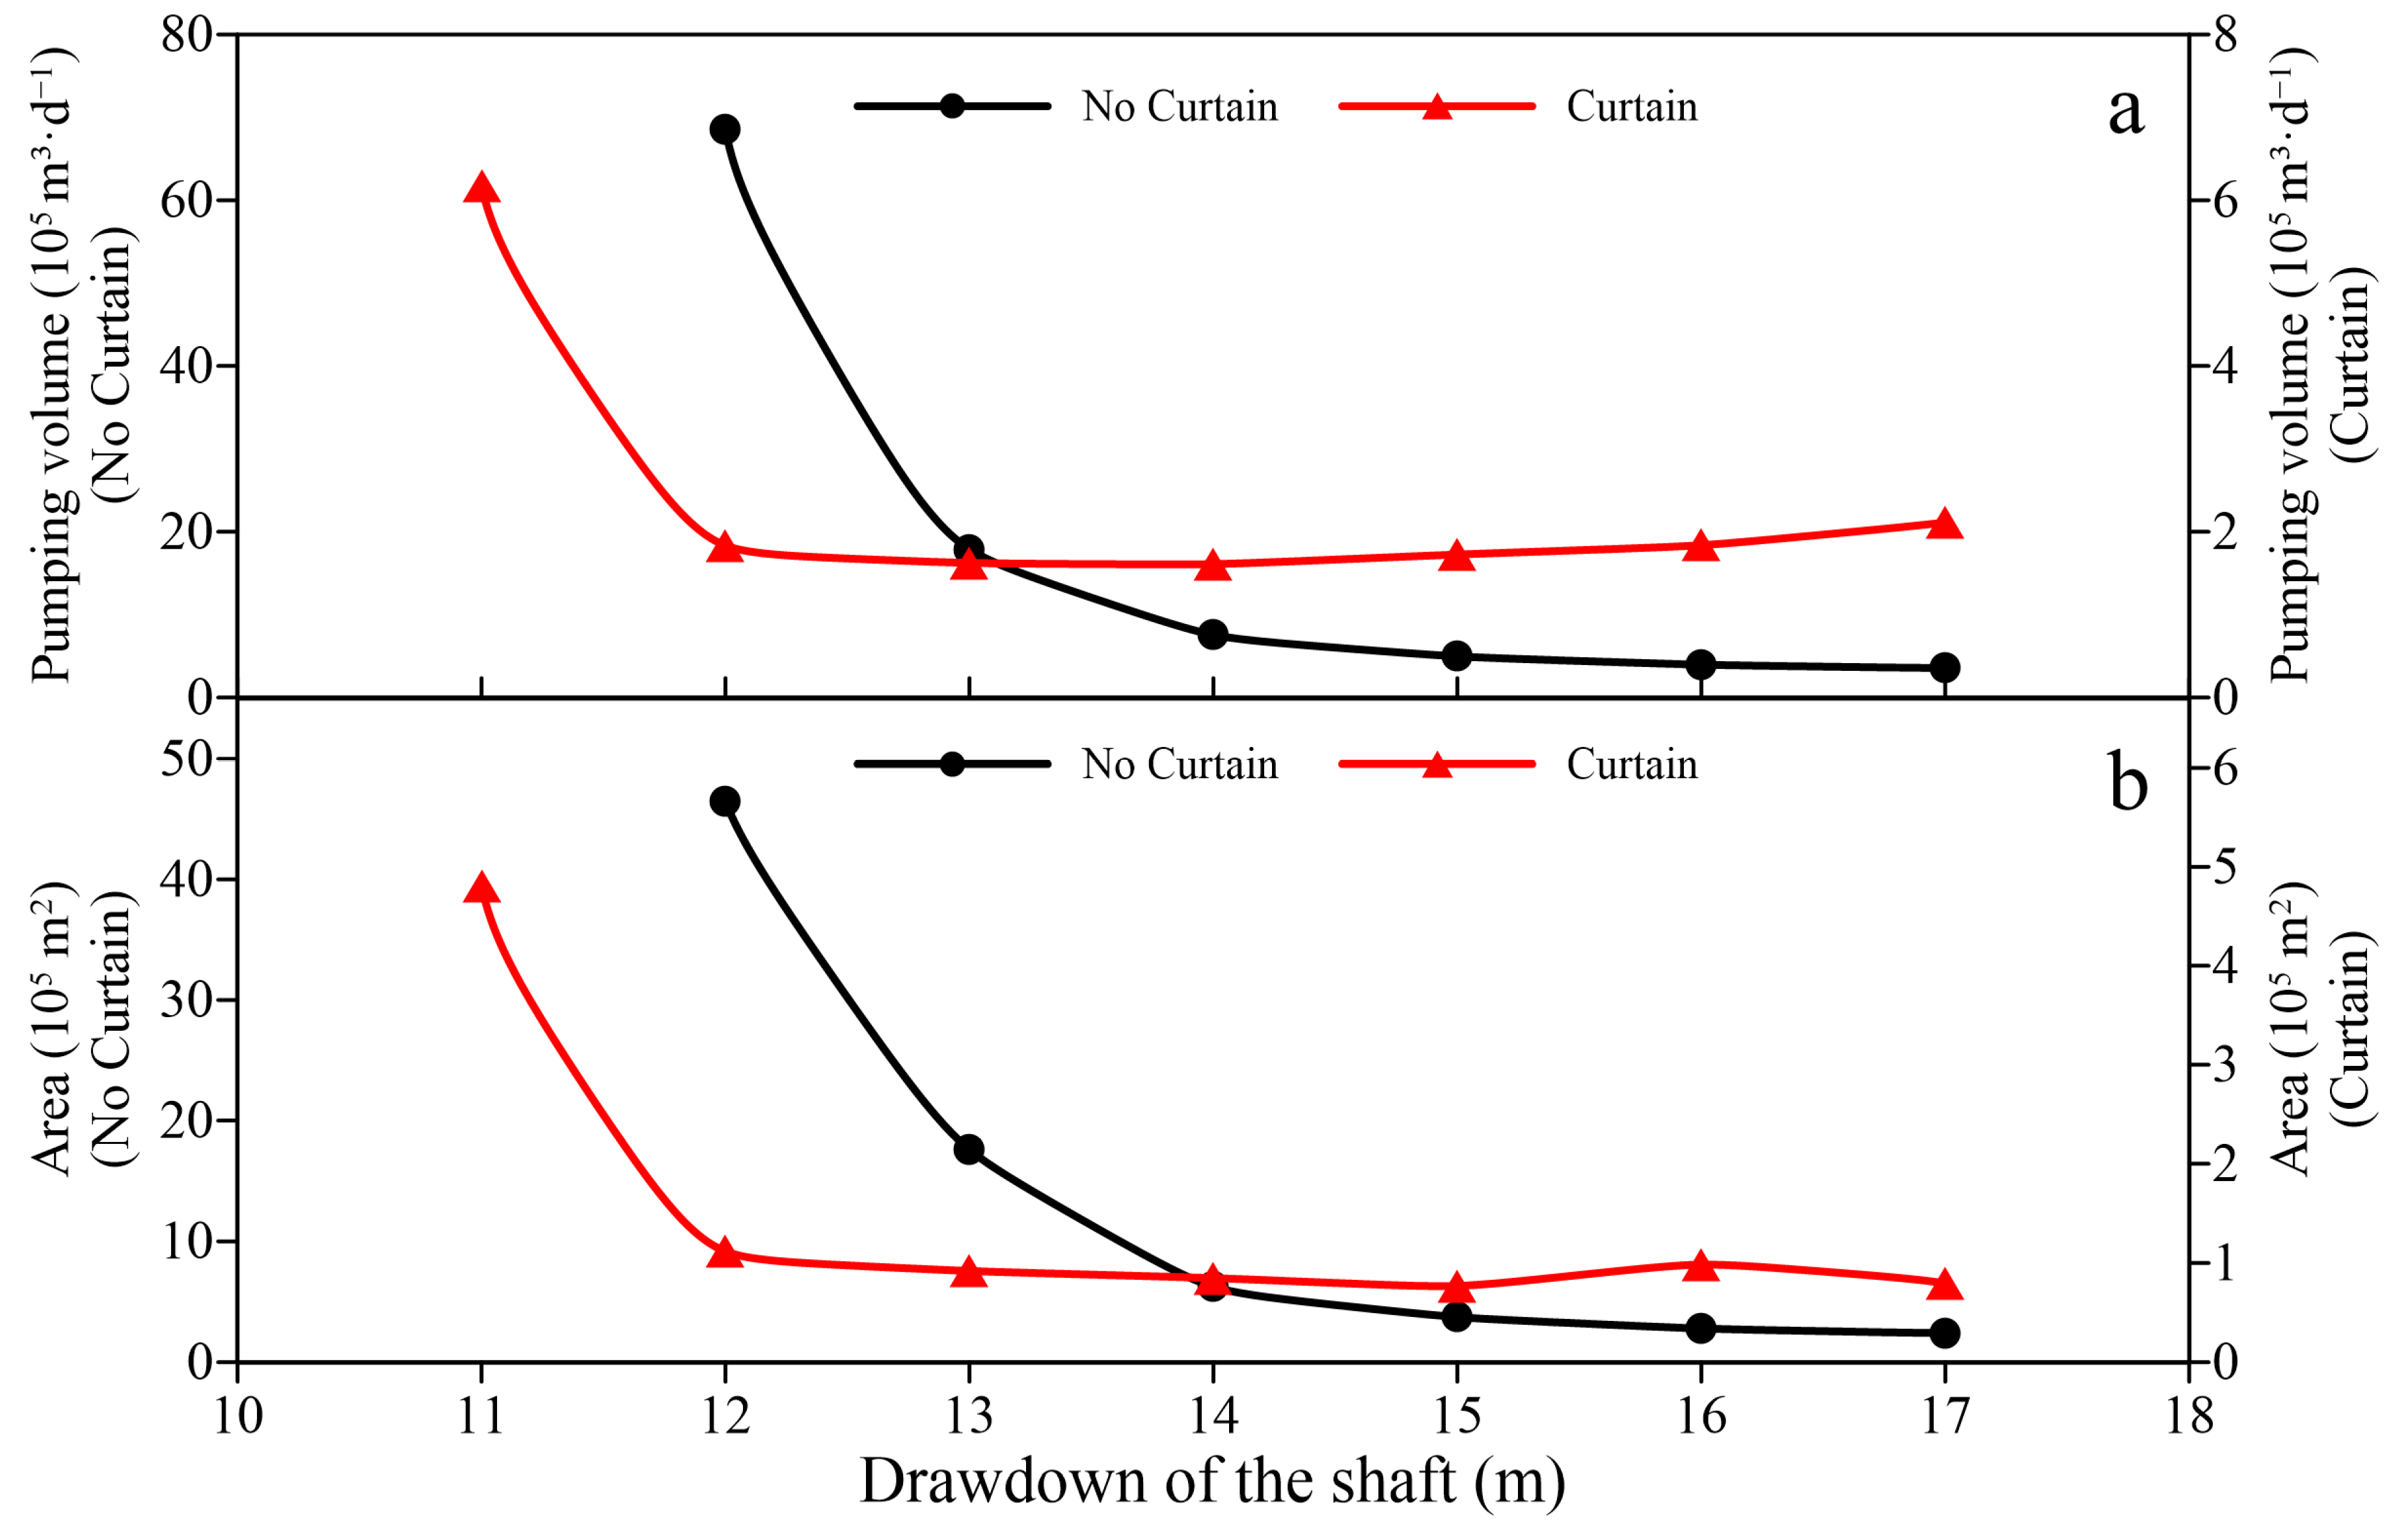
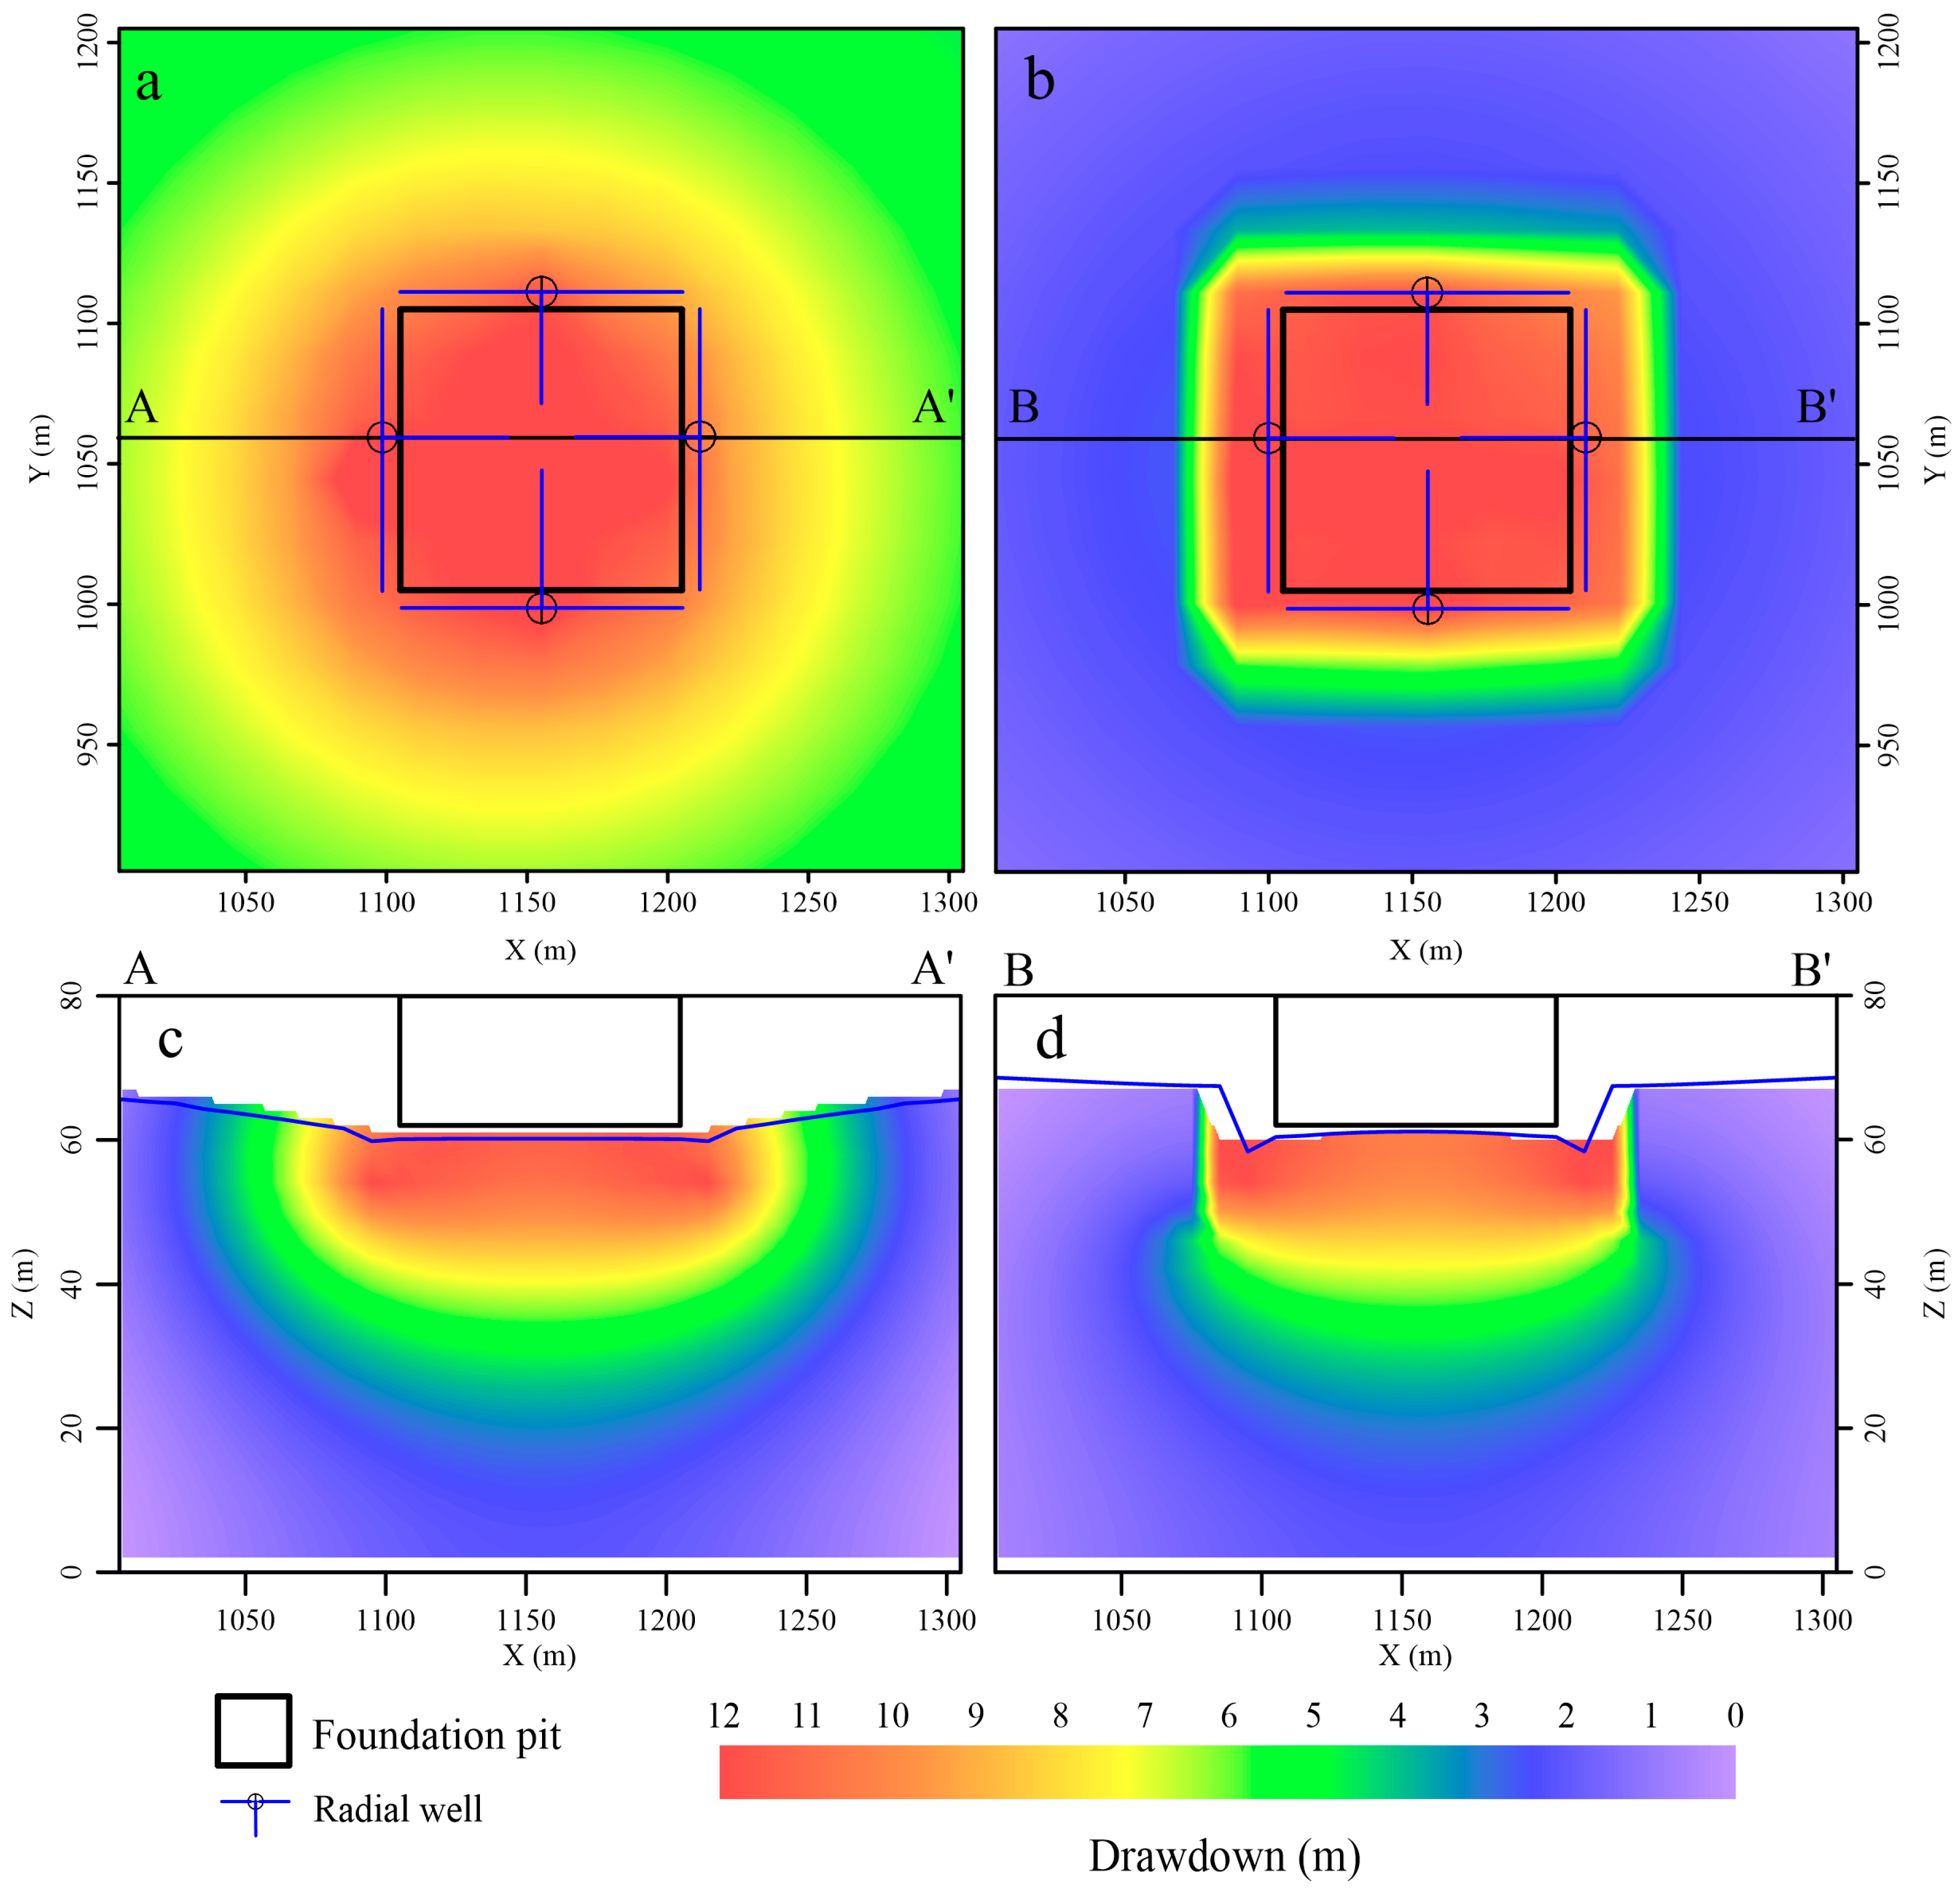
3.2.4. Drawdown of the Shaft

Apart from the structure and parameters of the radial well, the drawdown of the shaft is also a crucial factor that affects the efficiency of the foundation pit dewatering. The results showed an increase in the drawdown of the shaft with decreasing dewatering time and total water pumped. In addition, no effect of shaft drawdown on dewatering efficiency was observed above a certain drawdown value (Figure 12a). As the shaft drawdown increased, an increase in the amount of water pumped and significant variation in the groundwater level were observed, resulting in the rapid achievement of the target level. Moreover, the results revealed a reduction in the total pumping volume and the area of perturbation to the seepage field as the recharge from the external aquifer in the pit decreased (Figure 12b). However, no significant improvement in dewatering efficiency was observed at shaft drawdown values above 14 m.
The total amount of discharged groundwater and the disturbed area of groundwater seepage field decreased as the diameter of the radial pipes increased. However, the decrease was slow after the pipe diameter reached 0.14 m. The same trend was observed for the conductance, the number of radial pipes, and the shaft drawdown. However, when the radial pipe conductance reached 15 m·d−1, the number of radial pipes reached 12, and the shaft drawdown reached 14 m, there was no apparent improvement in dewatering efficiency by continuing to change the parameters. Therefore, an optimal scheme was selected with a radial pipe conductance of 15 m·d−1, a pipe diameter of 0.14 m, a radial pipe number of 12, and a shaft drawdown of 14 m. The variation in the seepage field in this scheme was analyzed, as shown in the water level variation diagram (Figure 13a). The use of radial wells for dewatering created a sub-circular cone of depression that extended from the center of the foundation pit uniformly in all directions. However, the radial well scheme provided a more suitable level of water control than the pumping well scheme. The seepage field disturbance from dewatering was primarily concentrated at the bottom of the pit and near the radial pipe, decreasing with an increasing distance from the bottom. Alternatively, the curtain resulted in a significant drop depth of the shaft in a short time compared with that of the no-curtain scheme (Figure 12).
Due to the water barrier effect of the curtain, the cone of depression did not extend outwards and was approximately box-shaped, with a large head difference between the inside and outside of the curtain. The results showed a significant difference in the cone of depression between dewatering with and without curtain conditions. The curtain prevented the exchange of groundwater outside the curtain at different depths, resulting in rapid changes in groundwater levels inside the curtain. Although the flow field outside was also disturbed to some extent, the area and magnitude of the effect were insignificant. The coupled radial well-curtain method resulted in shorter dewatering times, less total water pumping, and less disturbance to the seepage field than the other schemes.

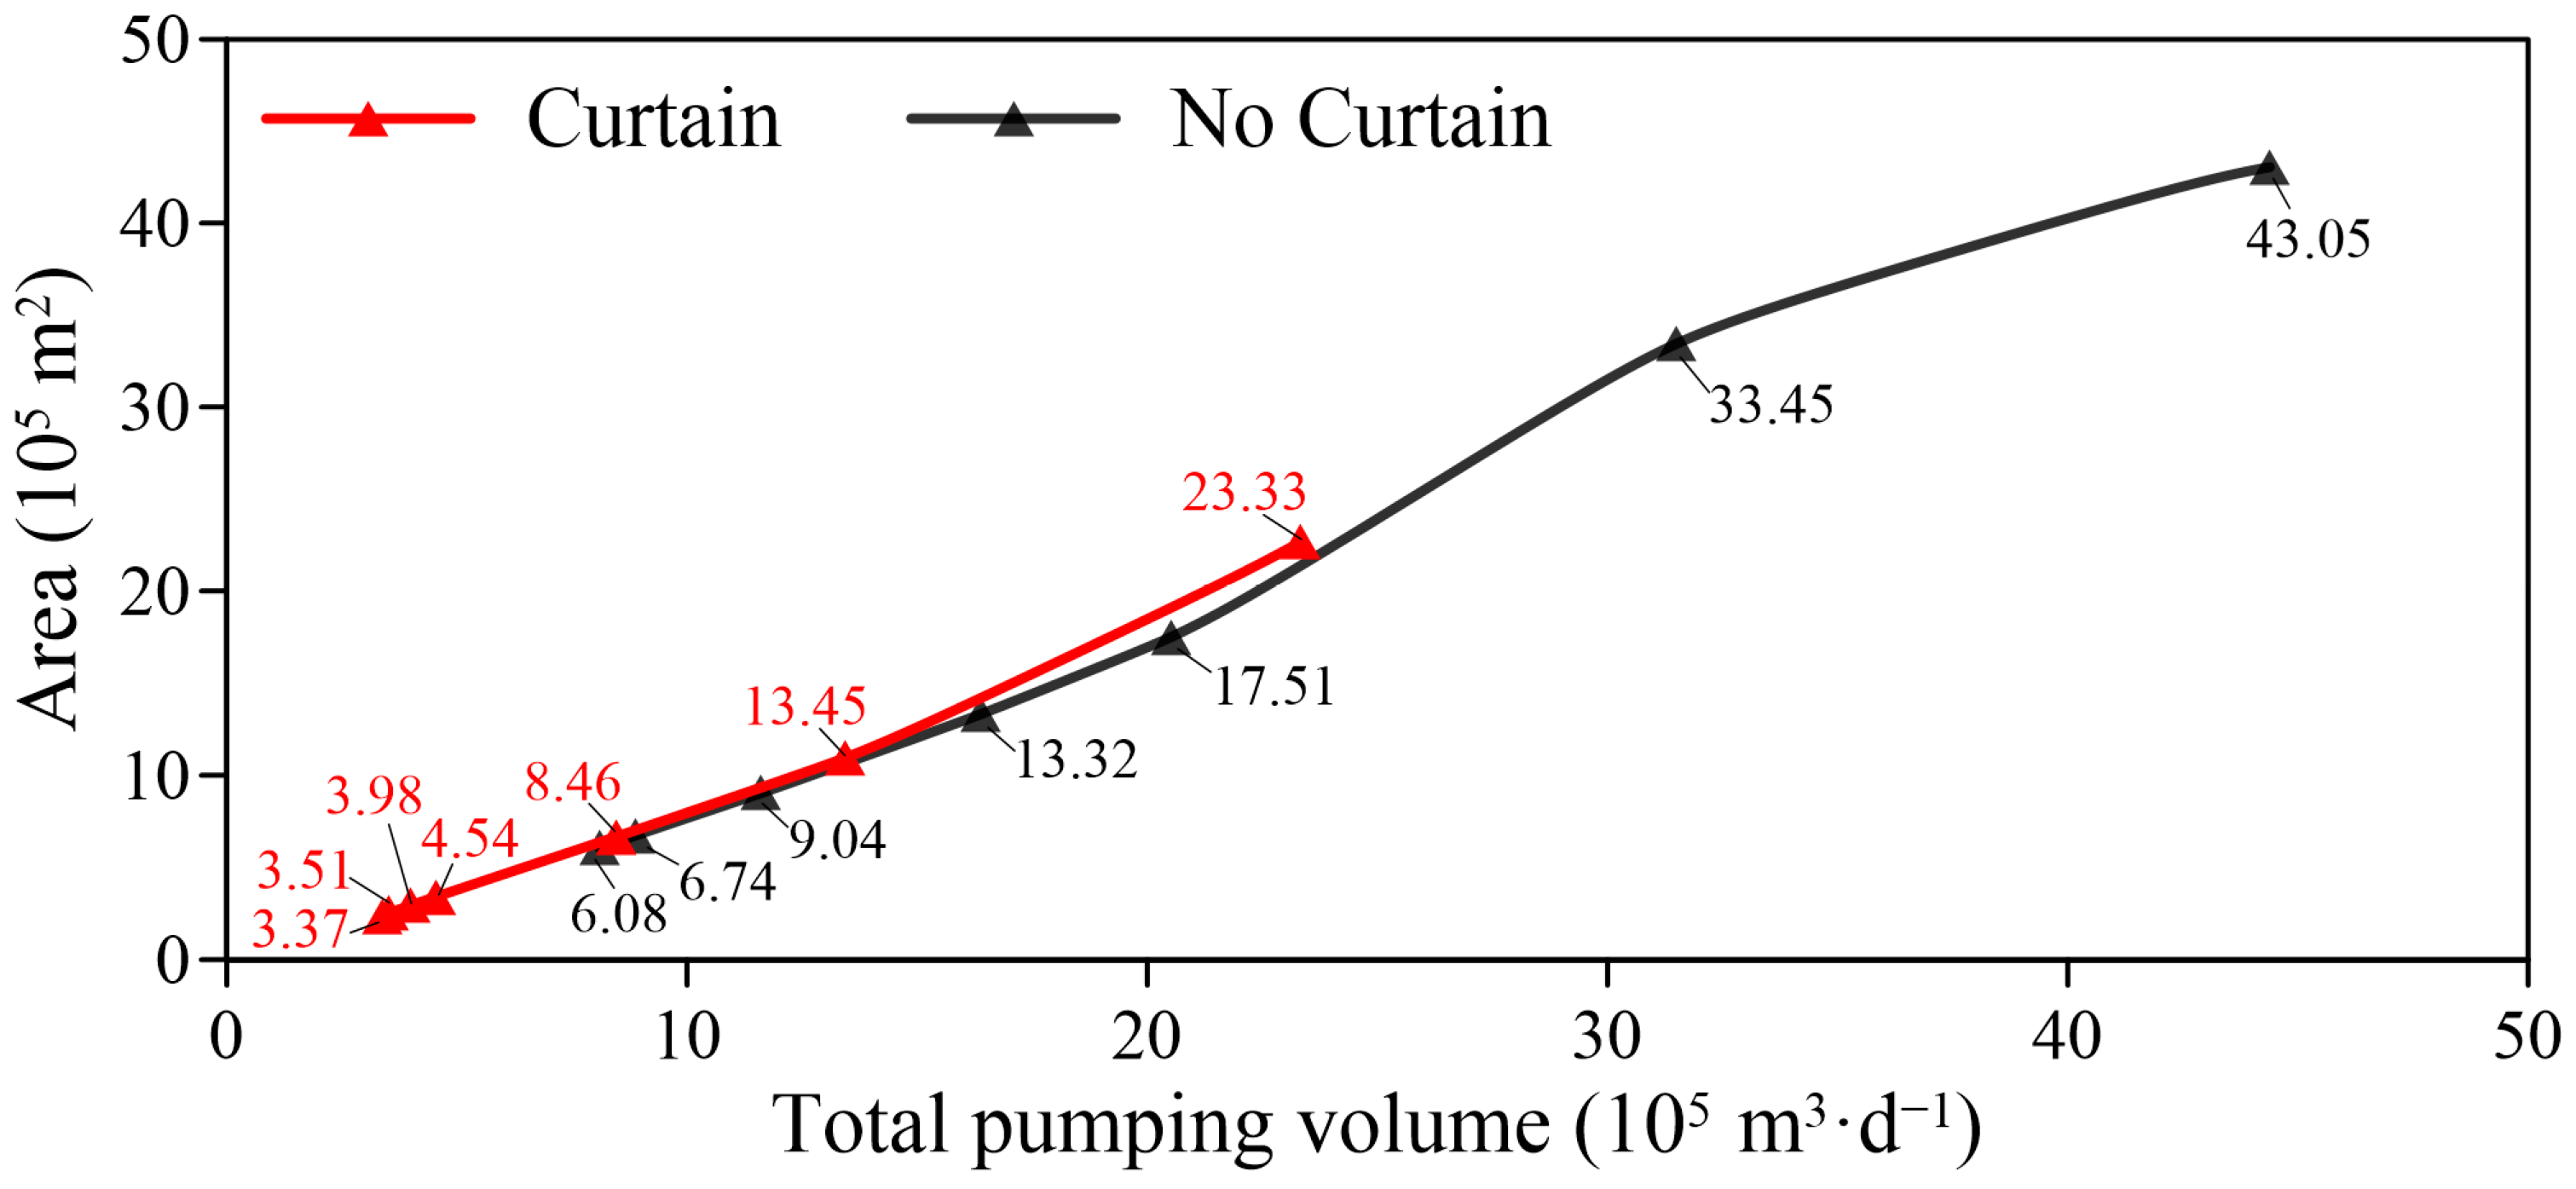
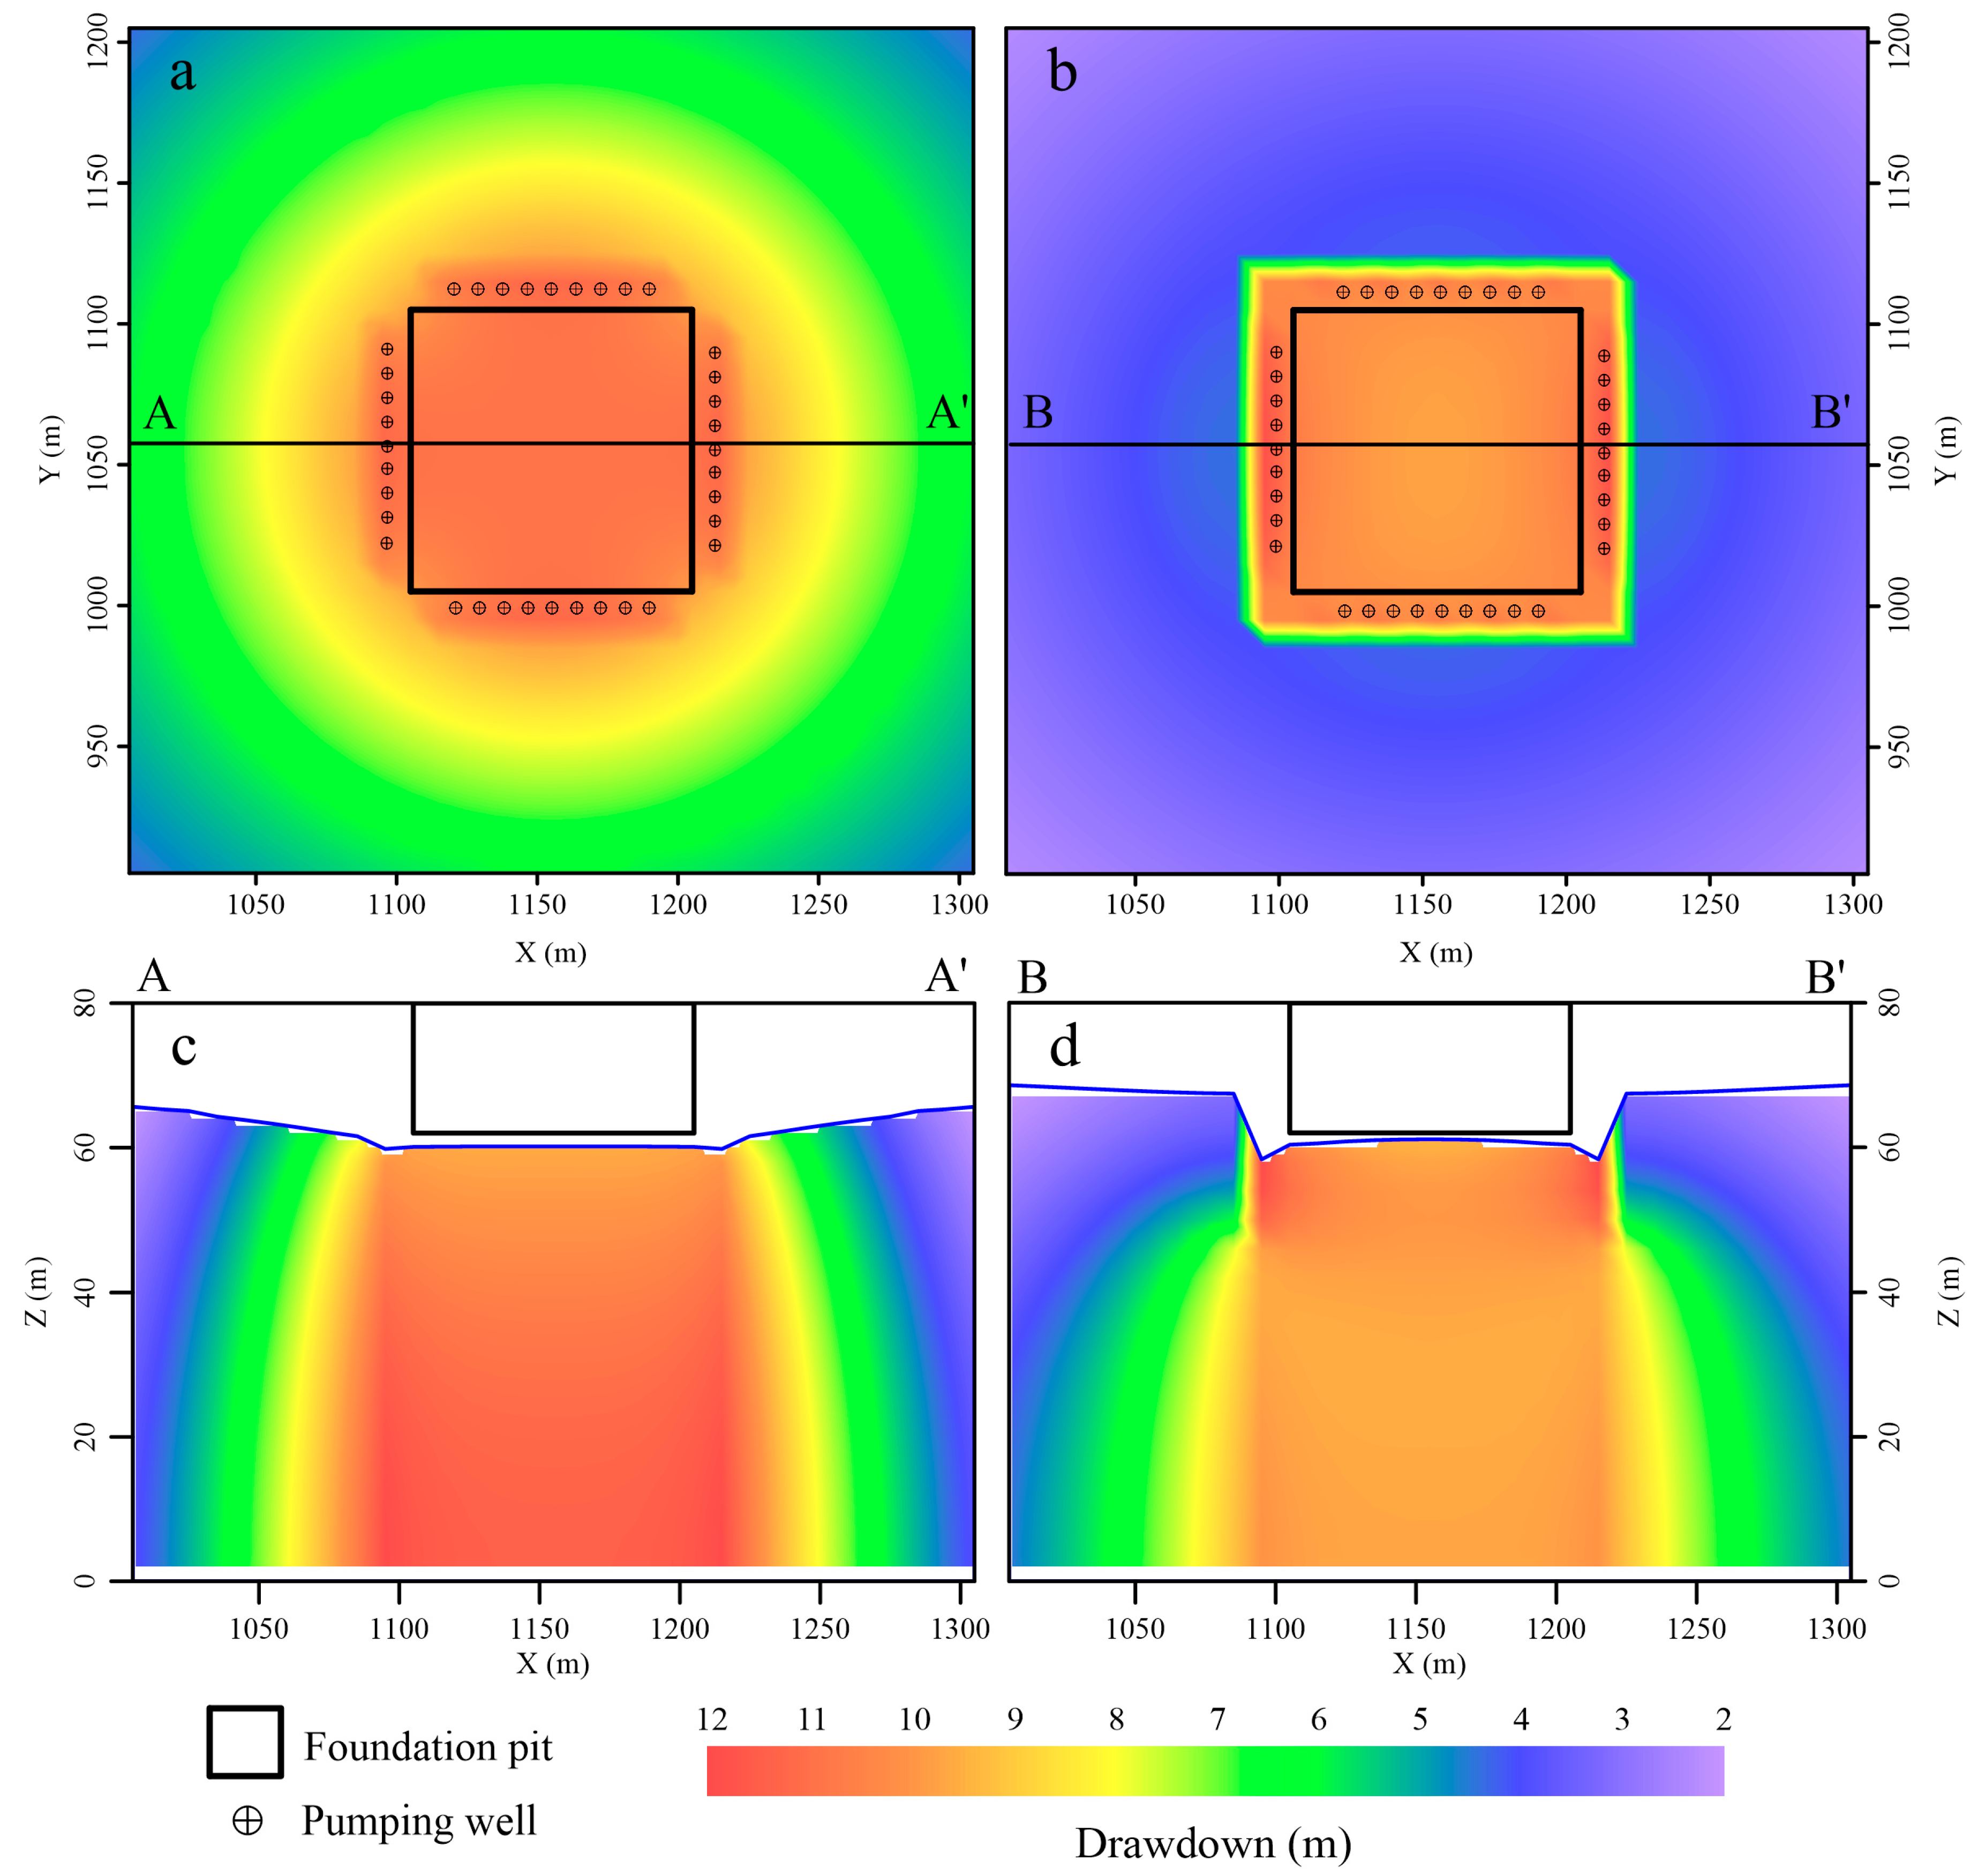
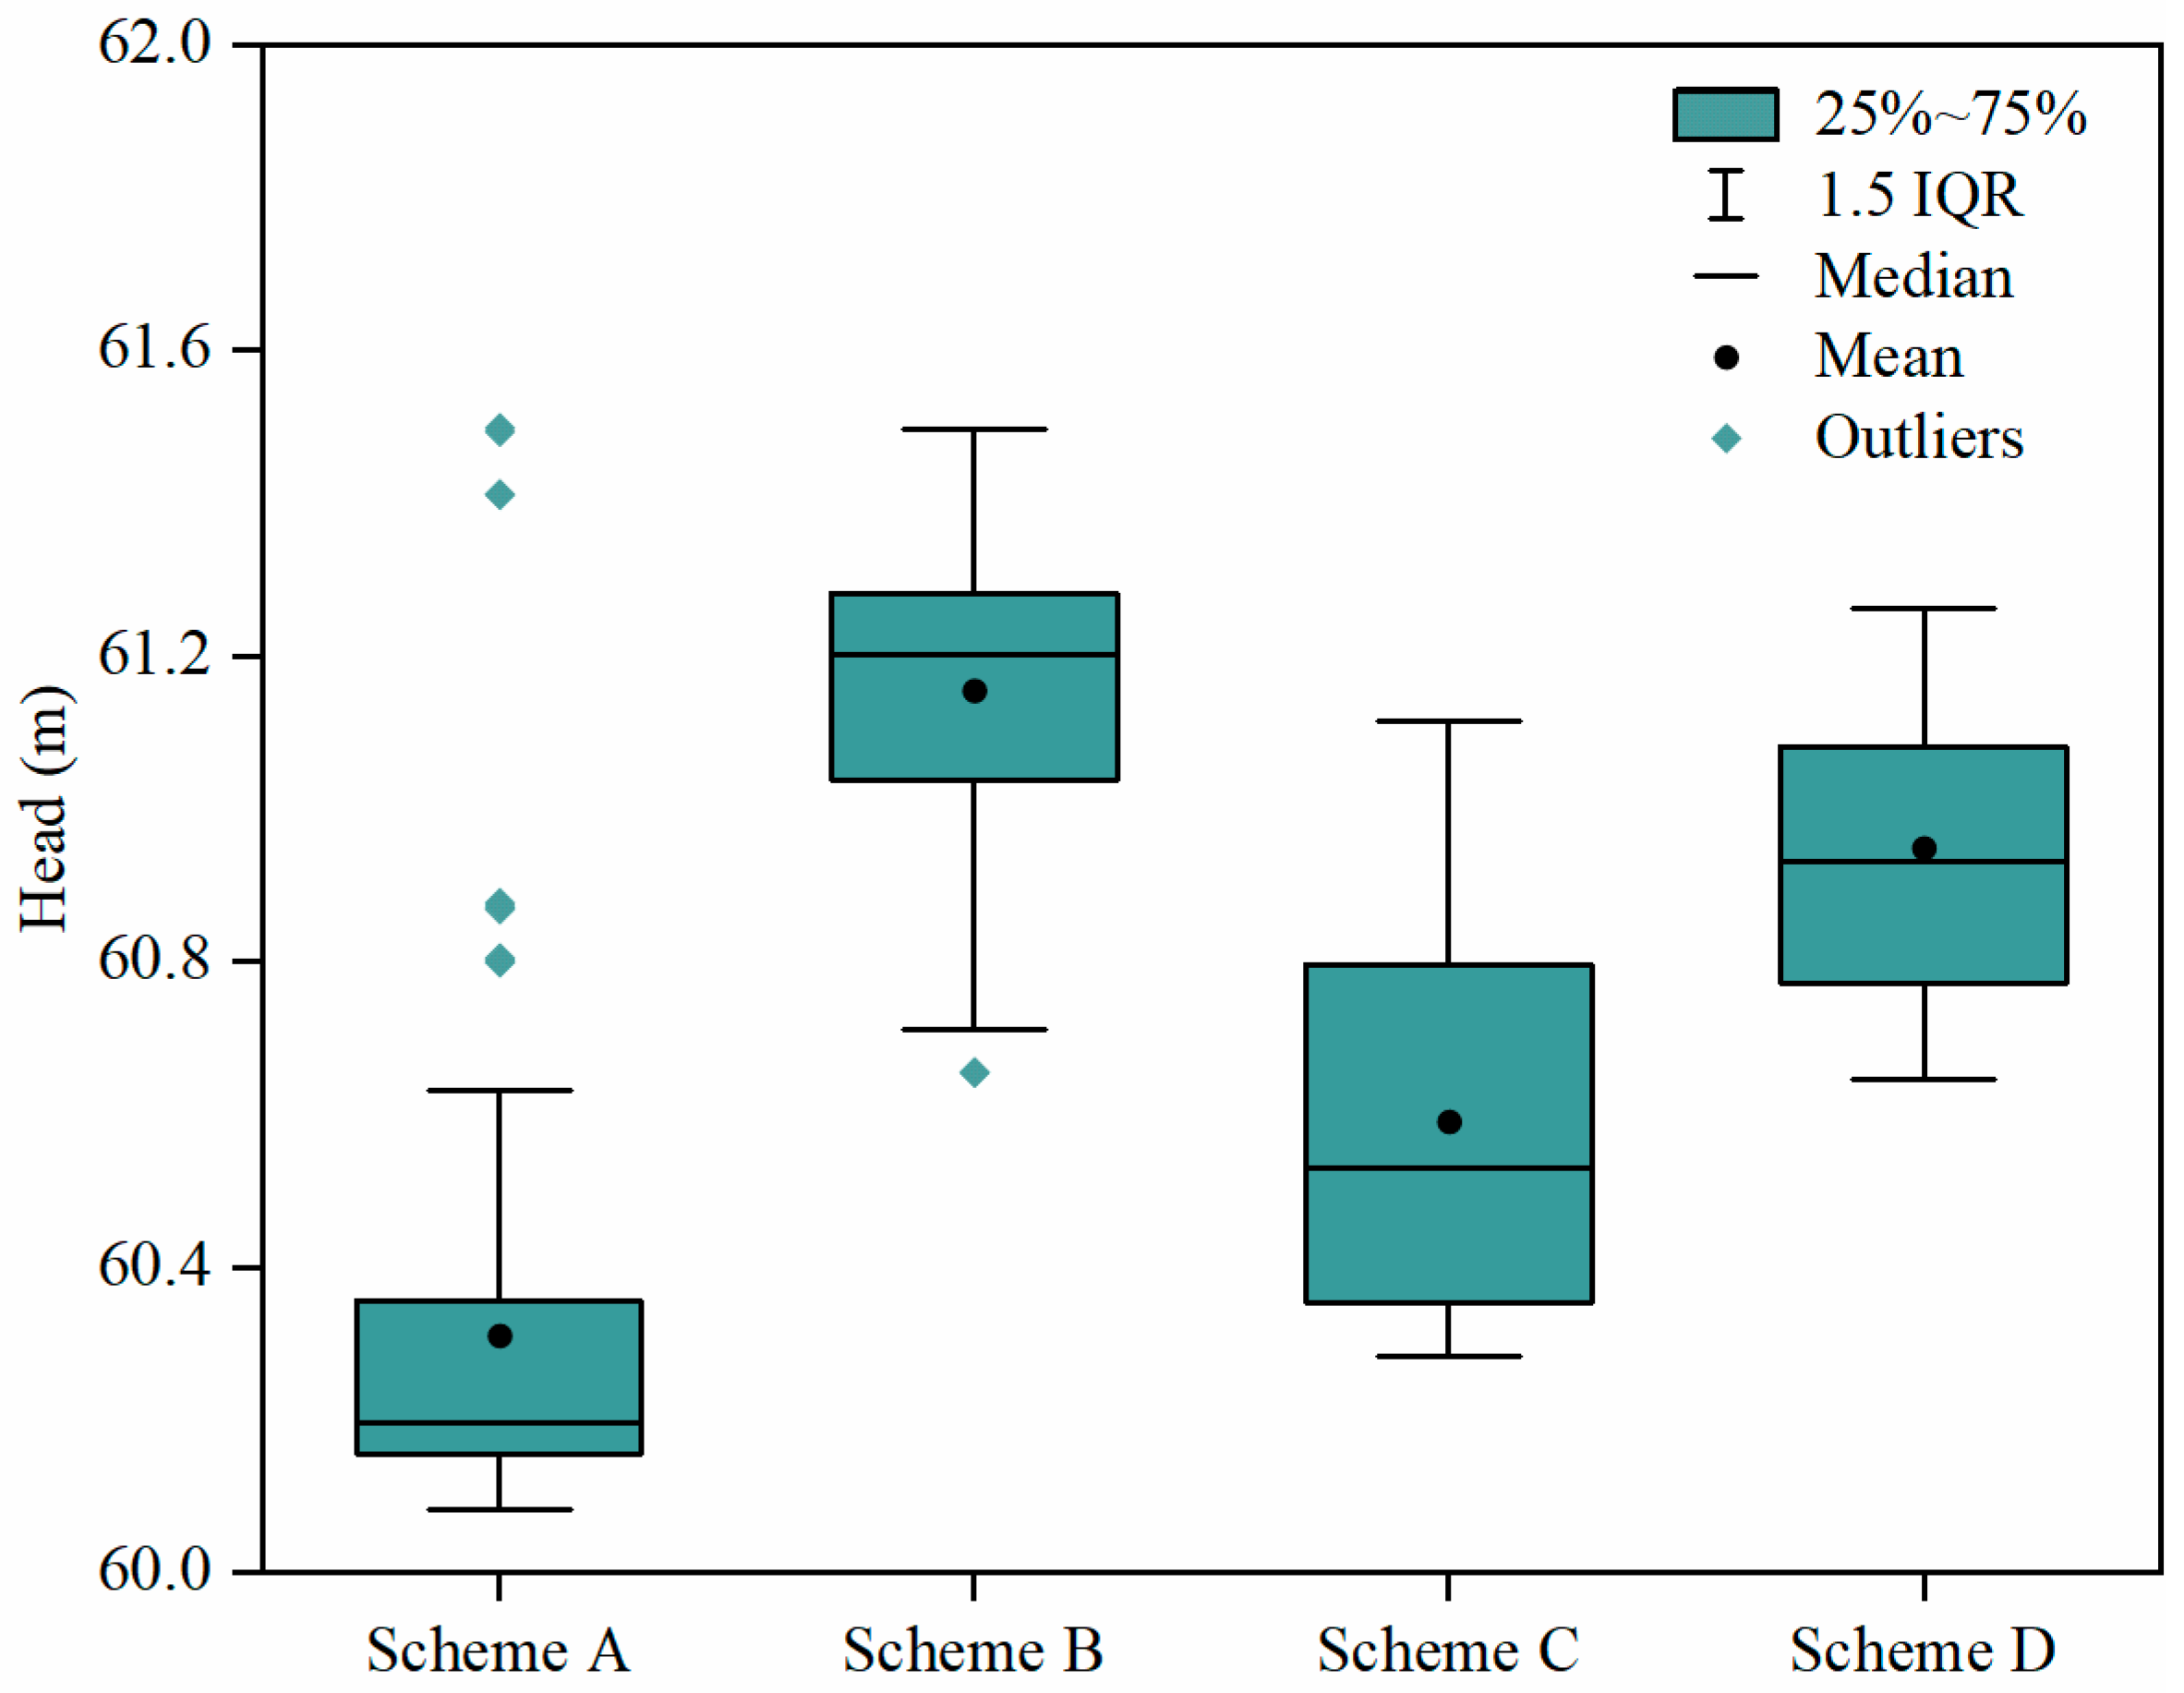
3.3. Optimal Dewatering Scheme

After analyzing the results of this study, the optimal pumping well dewatering solution (36 wells with a single well pumping rate of 1700 m3·d−1) and the optimal radial well dewatering solution (radial pipe conductance of 15 m·d−1, pipe diameter of 0.14 m, number of radial pipes of 12, and drawdown of shaft of 14 m) were selected for comparison.
Radial wells always require less time than pumping wells, with or without the curtain, to achieve the foundation pit dewatering goals (Figure 14). The amount of groundwater pumped from the radial wells and the area of the seepage field were considerably lower than those observed using the pumping wells.
In each of the four schemes, the head values of 121 calculation units were counted (Figure 15). These included 484 calculation units in total at the bottom of the pit after reaching the target. The pumping well scheme exhibited a greater difference in the level of water at the bottom of the pit compared with the radial well scheme. Moreover, the distribution of water levels in the pumping well was not concentrated, and the overall head needed to be decreased to a lower level to achieve the dewatering requirements. In the radial well scenario, there was less of a difference in the head at the bottom of the pit after reaching the target water level. In the absence of curtains, the head distribution at the bottom of the pit was uneven, and there were outliers. Thus, a very high discharge is required to reach the target level. In contrast, the water level observed at the bottom of the pit was more concentrated under the curtain effect, suggesting a high dewatering efficiency. Therefore, the radial well-curtain coupling method was likely to be more efficient.

3.4. Land Subsidence

Similarly to the overexploitation of groundwater, foundation pit dewatering often leads to varying degrees of land subsidence in the surrounding area. According to the effective theoretical stress principle of the Terzaghi foundation, the primary cause of land subsidence is an excess in pore water pressure dissipation. Indeed, foundation pit dewatering could promote the dissipation of pore water pressure, thus increasing the effective stress on the soil and enhancing soil consolidation and deformation, resulting in land subsidence in the surrounding ground [44]. The foundation pit could be recharged from groundwater or lateral runoff, causing a decrease in the level of groundwater outside the pit and consequent land subsidence. However, the subsidence is often non-uniform and could cause deformation or even cracking and collapse of the surrounding buildings, posing a significant threat to the safety of the surrounding constructed environment. In addition to being more efficient in the dewatering of the foundation pit, the radial well-curtain coupling method is also effective in preventing the decrease in groundwater level outside the pit. As shown in Figure 13b, the coupled radial well-curtain method resulted in a groundwater variation in the area outside the curtain of 3 m, which was lower than that obtained using the pumped well-curtain method. Indeed, less variation in the groundwater level implies less probability of land subsidence, which reduces the risk of land subsidence and ensures the safety of underground and surface buildings.

4. Conclusions

1. In dewatering schemes that used pumping wells where the total volume of water pumped per unit of time was less than the recharge amount of the aquifer, there were significant impacts on the efficiency of dewatering by varying the number of pumping wells and the volume of water pumped per well. The number of pumping wells and the amount of water pumped from a single well positively correlated with dewatering efficiency. However, this scheme significantly disturbed the seepage field, resulting in a drawdown of more than 4 m within 100 m beyond the foundation pit.
2. In the case of the radial well scheme, the structure and parameters of the radial wells (radial pipe diameter, conductance, number of radial pipes, and shaft drawdown) positively correlated with pumping efficiency and negatively correlated with disturbance of the seepage field. Moreover, no significant change in the dewatering efficiency was observed when the total amount of water discharged per unit of time was equal to the recharge rate from the aquifer. The disturbance to the seepage field from the radial well scheme was primarily observed at the bottom of the pit and near the radial pipe and was less likely to disturb the seepage field in more distant areas compared with the pumping well scheme.
3. The dewatering schemes with the curtain were significantly more efficient than those without the curtain. Indeed, the curtain reduced the amount of groundwater pumped and caused less disturbance to the groundwater seepage field. After dewatering, the decline in groundwater level primarily occurred within the curtain. Moreover, a large well head difference between the inside and outside of the curtain was observed, preventing a significant decrease in groundwater levels outside the curtain.
4. In this study, the radial well-curtain coupling (radial pipe conductance of 15 m·d−1, pipe diameter of 0.14 m, number of radial pipes of 12, and drawdown of shaft of 14 m) was the most suitable scheme. The coupled radial well-curtain method was found to be an efficient dewatering method that effectively prevented the lowering of the groundwater level in the area outside the pit, thus reducing the risk of land subsidence in the surrounding area.

Author Contributions

Conceptualization, S.D. and P.L.; methodology, W.W.; software, W.S. and J.L. (Jiaqi Li); formal analysis, Q.L.; investigation, W.S.; resources, S.D.; writing—original draft preparation, S.D.; writing—review and editing, P.L.; visualization, J.L. (Jianhua Li). All authors have read and agreed to the published version of the manuscript.

Funding

This research was funded by the Shaanxi Key Research and Development Program of China, grant number 2021SF2-02, and the Shaanxi Provincial Public Welfare Geological Survey Project, grant numbers 202109 and 20180303.

Data Availability Statement

The datasets generated and/or analyzed during the current study are available from the corresponding author on reasonable request.

Acknowledgments

This study was mainly supported by the Shaanxi Hydrogeology Engineering Geology and Environment Geology Survey Center. All authors sincerely thank the researchers and staff for their help of the manuscripts.

Conflicts of Interest

The authors declare no conflict of interest.

References

  1. You, Y.; Yan, C.; Xu, B.; Liu, S.; Che, C. Optimization of dewatering schemes for a deep foundation pit near the Yangtze River, China. J. Rock Mech. Geotech. Eng. 2018, 10, 555–566. [Google Scholar] [CrossRef]
  2. Huang, Y.; Bao, Y.; Wang, Y. Analysis of geoenvironmental hazards in urban underground space development in Shanghai. Nat. Hazards 2015, 75, 2067–2079. [Google Scholar] [CrossRef]
  3. Wang, X.-W.; Yang, T.-L.; Xu, Y.-S.; Shen, S.-L. Evaluation of optimized depth of waterproof curtain to mitigate negative impacts during dewatering. J. Hydrol. 2019, 577, 123969. [Google Scholar] [CrossRef]
  4. Cao, C.; Shi, C.; Liu, L.; Liu, J. Evaluation of the effectiveness of an alternative to control groundwater inflow during a deep excavation into confined aquifers. Environ. Earth Sci. 2020, 79, 502. [Google Scholar] [CrossRef]
  5. Liu, L.; Lei, M.; Cao, C.; Shi, C. Dewatering Characteristics and Inflow Prediction of Deep Foundation Pits with Partial Penetrating Curtains in Sand and Gravel Strata. Water 2019, 11, 2182. [Google Scholar] [CrossRef]
  6. Wang, J.; Liu, X.; Liu, S.; Zhu, Y.; Pan, W.; Zhou, J. Physical model test of transparent soil on coupling effect of cut-off wall and pumping wells during foundation pit dewatering. Acta Geotech. 2018, 14, 141–162. [Google Scholar] [CrossRef]
  7. Hsi, J.P.; Small, J.C. Ground settlements and drawdown of the water table around an excavation. Can. Geotech. J. 1992, 29, 740–756. [Google Scholar] [CrossRef]
  8. Wang, X.-w.; Xu, Y.-s. Impact of the Depth of Diaphragm Wall on the Groundwater Drawdown during Foundation Dewatering Considering Anisotropic Permeability of Aquifer. Water 2021, 13, 418. [Google Scholar] [CrossRef]
  9. Song, L. Some Groundwater Treatment Methods During the Construction of Beijing Subway. Geotech. Investig. Surv. 2006, 19–22. [Google Scholar]
  10. Zhang, L.; Zhou, X.; Pan, Y.; Zeng, B.; Zhu, D.; Jiang, H. Design of Groundwater Extraction in Open Cut Foundation Pit and Simplified Calculation of Ground Subsidence due to Dewatering in Sandy Pebble Soil Strata. Adv. Civ. Eng. 2020, 2020, 1046937. [Google Scholar] [CrossRef]
  11. Wang, J.; Wu, Y.; Liu, X.; Yang, T.; Wang, H.; Zhu, Y. Areal subsidence under pumping well–curtain interaction in subway foundation pit dewatering: Conceptual model and numerical simulations. Environ. Earth Sci. 2016, 75, 198. [Google Scholar] [CrossRef]
  12. Pujades, E.; Vàzquez-Suñé, E.; Carrera, J.; Jurado, A. Dewatering of a deep excavation undertaken in a layered soil. Eng. Geol. 2014, 178, 15–27. [Google Scholar] [CrossRef]
  13. Wu, Y.-X.; Shen, S.-L.; Wu, H.-N.; Xu, Y.-S.; Yin, Z.-Y.; Sun, W.-J. Environmental protection using dewatering technology in a deep confined aquifer beneath a shallow aquifer. Eng. Geol. 2015, 196, 59–70. [Google Scholar] [CrossRef]
  14. Pujades, E.; De Simone, S.; Carrera, J.; Vázquez-Suñé, E.; Jurado, A. Settlements around pumping wells: Analysis of influential factors and a simple calculation procedure. J. Hydrol. 2017, 548, 225–236. [Google Scholar] [CrossRef]
  15. Liu, J.W.; Shi, C.H.; Cao, C.Y.; Lei, M.F.; Wang, Z.X. Improved analytical method for pile response due to foundation pit excavation. Comput. Geotech. 2020, 123, 103609. [Google Scholar] [CrossRef]
  16. Zeng, C.F.; Xue, X.L.; Zheng, G.; Xue, T.Y.; Mei, G.X. Responses of retaining wall and surrounding ground to pre-excavation dewatering in an alternated multi-aquifer-aquitard system. J. Hydrol. 2018, 559, 609–626. [Google Scholar] [CrossRef]
  17. Sarychikhina, O.; Glowacka, E.; Mellors, R.; Vidal, F.S. Land subsidence in the Cerro Prieto Geothermal Field, Baja California, Mexico, from 1994 to 2005. J. Volcanol. Geotherm. Res. 2011, 204, 76–90. [Google Scholar] [CrossRef]
  18. Xie, Z.-F.; Shen, S.-L.; Arulrajah, A.; Horpibulsuk, S. Environmentally sustainable groundwater control during dewatering with barriers: A case study in Shanghai. Undergr. Space 2021, 6, 12–23. [Google Scholar] [CrossRef]
  19. Zhou, N.; Vermeer, P.A.; Lou, R.; Tang, Y.; Jiang, S. Numerical simulation of deep foundation pit dewatering and optimization of controlling land subsidence. Eng. Geol. 2010, 114, 251–260. [Google Scholar] [CrossRef]
  20. Luo, C.Y.; Shen, S.L.; Han, J.; Ye, G.L.; Horpibulsuk, S. Hydrogeochemical environment of aquifer groundwater in Shanghai and potential hazards to underground infrastructures. Nat. Hazards 2015, 78, 753–774. [Google Scholar] [CrossRef]
  21. Wu, Y.X.; Shen, S.L.; Xu, Y.S.; Yin, Z.Y. Characteristics of groundwater seepage with cut-off wall in gravel aquifer. I: Field observations. Can. Geotech. J. 2015, 52, 1526–1538. [Google Scholar] [CrossRef]
  22. Chen, J.-J.; Zhang, L.; Zhang, J.-F.; Zhu, Y.-F.; Wang, J.-H. Field Tests, Modification, and Application of Deep Soil Mixing Method in Soft Clay. J. Geotech. Geoenvironmental Eng. 2013, 139, 24–34. [Google Scholar] [CrossRef]
  23. Shen, S.-L.; Wang, Z.-F.; Horpibulsuk, S.; Kim, Y.-H. Jet grouting with a newly developed technology: The Twin-Jet method. Eng. Geol. 2013, 152, 87–95. [Google Scholar] [CrossRef]
  24. Zhi-Feng, W.; Shui-Long, S.; Chu-Eu, H.; Yong-Hyun, K. Investigation of field-installation effects of horizontal twin-jet grouting in Shanghai soft soil deposits. Can. Geotech. J. 2013, 50, 288–297. [Google Scholar] [CrossRef]
  25. Yuan, C.; Hu, Z.; Zhu, Z.; Yuan, Z.; Fan, Y.; Guan, H.; Li, L.; Xiong, F. Numerical Simulation of Seepage and Deformation in Excavation of a Deep Foundation Pit under Water-Rich Fractured Intrusive Rock. Geofluids 2021, 2021, 1–10. [Google Scholar] [CrossRef]
  26. Ni, J.C.; Cheng, W.C.; Ge, L. A simple data reduction method for pumping tests with tidal, partial penetration, and storage effects. Soils Found. 2013, 53, 894–902. [Google Scholar] [CrossRef]
  27. Tan, Y.; Lu, Y.; Wang, D. Deep Excavation of the Gate of the Orient in Suzhou Stiff Clay: Composite Earth-Retaining Systems and Dewatering Plans. J. Geotech. Geoenvironmental Eng. 2018, 144, 05017009. [Google Scholar] [CrossRef]
  28. Shen, S.-L.; Wu, Y.-X.; Misra, A. Calculation of head difference at two sides of a cut-off barrier during excavation dewatering. Comput. Geotech. 2017, 91, 192–202. [Google Scholar] [CrossRef]
  29. Xu, Y.S.; Wu, H.N.; Wang, B.Z.F.; Yang, T.L. Dewatering induced subsidence during excavation in a Shanghai soft deposit. Environ. Earth Sci. 2017, 76, 351. [Google Scholar] [CrossRef]
  30. Zhang, Y.-Q.; Wang, J.-H.; Chen, J.-J.; Li, M.-G. Numerical study on the responses of groundwater and strata to pumping and recharge in a deep confined aquifer. J. Hydrol. 2017, 548, 342–352. [Google Scholar] [CrossRef]
  31. Ahmad, I.; Tayyab, M.; Zaman, M.; Anjum, M.; Dong, X. Finite-Difference Numerical Simulation of Dewatering System in a Large Deep Foundation Pit at Taunsa Barrage, Pakistan. Sustainability 2019, 11, 694. [Google Scholar] [CrossRef]
  32. Xu, Y.-S.; Shen, S.-L.; Ren, D.-J.; Wu, H.-N. Analysis of Factors in Land Subsidence in Shanghai: A View Based on a Strategic Environmental Assessment. Sustainability 2016, 8, 573. [Google Scholar] [CrossRef]
  33. Wang, J.; Liu, X.; Wu, Y.; Liu, S.; Wu, L.; Lou, R.; Lu, J.; Yin, Y. Field experiment and numerical simulation of coupling non-Darcy flow caused by curtain and pumping well in foundation pit dewatering. J. Hydrol. 2017, 549, 277–293. [Google Scholar] [CrossRef]
  34. Xu, Y.-S.; Yan, X.-X.; Shen, S.-L.; Zhou, A.-N. Experimental investigation on the blocking of groundwater seepage from a waterproof curtain during pumped dewatering in an excavation. Hydrogeol. J. 2019, 27, 2659–2672. [Google Scholar] [CrossRef]
  35. Lee, E.; Hyun, Y.; Lee, K.-K. Numerical modeling of groundwater flow into a radial collector well with horizontal arms. Geosci. J. 2011, 14, 403–414. [Google Scholar] [CrossRef]
  36. Zengguang, X.; Yanqing, W.; Jun, W.; Xiaoqing, Z. A model of seepage field in the tailings dam considering the chemical clogging process. Adv. Eng. Softw. 2011, 42, 426–434. [Google Scholar] [CrossRef]
  37. Ke, X.M.; Wang, W.; Xu, X.D.; Li, J.L.; Hu, H.Y. A saturated-unsaturated coupling model for groundwater flowing into seepage wells: A modeling study for groundwater development in river basins. Environ. Earth Sci. 2021, 80, 711. [Google Scholar] [CrossRef]
  38. Wang, W.; Chen, P.; Zheng, Q.Q.; Zheng, X.Y.; Lu, K.M. A modified calculation model for groundwater flowing to horizontal seepage wells. J. Earth Syst. Sci. 2013, 122, 407–418. [Google Scholar] [CrossRef]
  39. Ke, X.M.; Wang, W.; Li, J.L.; Sun, Q.M.; Lian, L.L.; Xu, X.D.; Lyu, Q. In-situ pumping tests and numerical simulations of seepage wells in the Yellow River valley, China. Water Supply 2021, 22, 1459–1473. [Google Scholar] [CrossRef]
  40. Shoemaker, W.B.; Kuniansky, E.L.; Birk, S.; Bauer, S.; Swain, E.D. Documentation of a Conduit Flow Process (CFP) for MODFLOW-2005; US Department of the Interior; US Geological Survey Reston: Reston, VA, USA, 2008; Volume 6.
  41. Deng, L.; Xu, B.; Yang, X.; Hu, A. Water quality and health risk assessment based on hydrochemical characteristics of tap and large-size bottled water from the main cities and towns in Guanzhong Basin, China. Environ. Earth Sci. 2021, 80, 139. [Google Scholar] [CrossRef]
  42. Wang, Y.-Q.; Wang, Z.-F.; Cheng, W.-C. A review on land subsidence caused by groundwater withdrawal in Xi’an, China. Bull. Eng. Geol. Environ. 2018, 78, 2851–2863. [Google Scholar] [CrossRef]
  43. Gong, H.; Pan, Y.; Zheng, L.; Li, X.; Zhu, L.; Zhang, C.; Huang, Z.; Li, Z.; Wang, H.; Zhou, C. Long-term groundwater storage changes and land subsidence development in the North China Plain (1971–2015). Hydrogeol. J. 2018, 26, 1417–1427. [Google Scholar] [CrossRef]
  44. Terzaghi, K. Principles of soil mechanics: IV Settlement and consolidation of clay. Eng. News-Rec. 1925, 95, 874–878. [Google Scholar]
Figure 1. (a) Location of the study area and (b) contour map of water table. Made with Natural Earth. Free vector and raster map data @ naturalearthdata.com. (Data from Shaanxi Hydrogeology Engineering Geology and Environment Geology Survey Center).
Water 15 01839 g001
Figure 2. Hydrogeological conceptual model.
Water 15 01839 g002
Figure 3. Numerical model spatial discretization.
Water 15 01839 g003
Figure 4. Scheme layout plan for dewatering. (a) Scheme with only pumping wells; (b) Scheme with only radial wells; (c) Scheme of pumping wells and curtains; (d) Scheme of radial wells and curtains.
Water 15 01839 g004
Figure 5. Layouts of the different numbers of radial pipes. (a) Layout scheme of 8 radial pipes; (b) Layout scheme of 12 radial pipes; (c) Layout scheme of 16 radial pipes; (d) Layout scheme of 20 radial pipes.
Water 15 01839 g005
Figure 6. Single well pumping rate versus drainage time. The different curves in the diagram represent different numbers of pumping wells. (a) No curtain; (b) Curtain.
Water 15 01839 g006
Figure 7. Area of groundwater flow field disturbance by dewatering of the foundation pits (Area with a drawdown depth greater than 1 m).
Water 15 01839 g007
Figure 8. Local water level variation: (a) Plan view of pumping wells only; (b) Plan view of curtain and pumping wells; (c) Cross-sectional view of pumping wells only; (d) Cross-sectional view of curtain and pumping wells. (The line segments A-A′ and B-B′ represent the positions of the profiles of the two schemes respectively).
Water 15 01839 g008
Figure 9. Drainage effects of different pipe diameters: (a) Effect of pipe diameter on total pumping rate; (b) Effect of pipe diameter on the area of disturbance of the seepage field, selected as a reference for drawdown greater than 1 m.
Water 15 01839 g009
Figure 10. Drainage effects with different pipe conductance: (a) Effect of pipe conductance on total pumping rate; (b) Effect of pipe conductance on the area of disturbance of the seepage field, selected as a reference for drawdown greater than 1 m.
Water 15 01839 g010
Figure 11. Drainage effects with different numbers of pipes: (a) Effect of the number of pipes on total pumping rate; (b) Effect of the number of pipes on the area of disturbance of the seepage field, selected as a reference for drawdown greater than 1 m.
Water 15 01839 g011
Figure 12. Drainage effects with different drawdowns of the shaft: (a) Effect of drawdown of the shaft on total pumping rate; (b) Effect of drawdown of the shaft on the area of disturbance of the seepage field, selected as a reference for drawdown greater than 1 m.
Water 15 01839 g012
Figure 13. Local water level variation: (a) Plan view of radial wells only; (b) Plan view of curtain and radial wells; (c) Cross-sectional view of radial wells only; (d) Cross-sectional view of curtain and radial wells. (The line segments A-A′ and B-B′ represent the positions of the profiles of the two schemes respectively).
Water 15 01839 g013
Figure 14. Comparison of the results of different schemes.
Water 15 01839 g014
Figure 15. Head distribution at the bottom of the foundation pit for different schemes.
Water 15 01839 g015
Table 1. Hydrogeological parameters of the study area. (Data from Shaanxi Hydrogeology Engineering Geology and Environment Geology Survey Center).
Landform CharacteristicsHydraulic Conductivity (m·d−1)Hydraulic Gradient
Alluvial PlainRiver Floodplain40–700.1–0.2%
First Terrace17–60
Second Terrace13–47
Third Terrace4.7–16
Loess Tableland 0.1–2.80.5–0.15%
Disclaimer/Publisher’s Note: The statements, opinions and data contained in all publications are solely those of the individual author(s) and contributor(s) and not of MDPI and/or the editor(s). MDPI and/or the editor(s) disclaim responsibility for any injury to people or property resulting from any ideas, methods, instructions or products referred to in the content.

