Article

Enhanced Electrocatalytic Oxidation of Phenol by SnO2-Sb2O3/GAC Particle Electrodes in a Three-Dimensional Electrochemical Oxidation System

School of Civil Engineering and Architecture, Wuhan University of Technology, Wuhan 430070, China
*
Author to whom correspondence should be addressed.
Water 2023, 15(10), 1844; https://doi.org/10.3390/w15101844
Submission received: 2 April 2023 / Revised: 9 May 2023 / Accepted: 10 May 2023 / Published: 12 May 2023

Abstract

:
In this study, SnO2-Sb2O3/GAC particle electrodes were prepared using the dip-calcination method. The particle electrodes were characterized by scanning electron microscopy (SEM), X-ray diffraction (XRD), Brunauer Emmett Teller (BET), thermogravimetric test and linear sweep voltammetry (LSV), which proved that the metal oxide was successfully loaded on the granular activated carbon and exhibited high electrocatalytic activity and thermal stability. The effects of initial pH, electrolytic voltage, electrolyte concentration, initial phenol concentration and particle electrode dosage on the performance of the three-dimensional (3D) electrocatalytic oxidation in phenol degradation were investigated. The results showed that under the optimal conditions, the removal rates of phenol and chemical oxygen demand (COD) were 99.65% and 67.16%, respectively. Finally, it was found that the novel particle electrodes had the ability of stable operation, maintaining high-efficiency operation no less than 15 times, which further highlights their robustness and durability.

1. Introduction

Phenolic compounds are a category of aromatic compounds. As important industrial raw materials [1], they have an extensive application scope in various chemical industries, including coal gasification, oil refining, leather manufacturing, resin synthesis, coconut gum dipping, spice production, and pharmacy [2,3,4]. Phenols are highly toxic pollutants and are suspected to be carcinogenic [5]. Due to their high toxicity to humans and other organisms and poor degradability through biological reactions [6], wastewater-containing phenols cannot be discharged into open water without treatment. Governments and health organizations have imposed tight restrictions on acceptable phenol levels in the environment [7]. Chemical oxygen demand (COD) is a comprehensive indicator of water quality detection, referring to the amount of oxidant consumed by the reducing species in water that can easily be oxidized by strong oxidants, which is then converted to the amount of oxygen; the unit is noted as mg/L. As one of the indicators to characterize the content of organic matter in water, and as an important parameter of water quality in rivers, industrial wastewater and sewage treatment plants, COD is highly valued by various countries and is listed as an important indicator of water environment monitoring [8]. At present, as an advanced oxidation technology, electrochemical oxidation technology has attracted the attention of researchers owing to its advantages of convenient operation, wide adaptability, low cost, good removal effect, and environmental protection [9,10,11]. This technology has been widely explored in water treatment technology [12]. Among them, three-dimensional (3D) electrochemical oxidation technology is developed based on the traditional two-dimensional (2D) electrochemical oxidation reactor with some particle electrodes filled between the two electrodes, and generally enhanced contaminant removal performance [13,14,15]. Under the effect of electric fields, due to electrostatic induction, the particle electrode has positive and negative charges on the surface [16]. The charged particle electrode is equivalent to a tiny electrolysis cell, which is subject to electrocatalytic oxidation together with the cathode and anode of the reactor [17,18]. Under this effect, the area of electrode reaction can be expanded [19]. Meanwhile, the distance of mass transfer is greatly shortened [20], and the reaction rate is consequently accelerated [21]. Despite numerous previous investigations demonstrating the significant limitations of pure granular activated carbon (GAC) in the realm of electrochemical oxidation, loading the appropriate catalyst onto the GAC provides a feasible and highly efficient alternative to pure GAC [16,22].
The present study delved into the preparation and application of SnO2-Sb2O3/GAC particle electrodes based on GAC for the degradation of phenols. These unique electrodes were meticulously characterized and verified to exhibit exceptional electrocatalytic oxidation performance and impressive stability. Moreover, the optimal removal conditions and degradation mechanism of phenols were also investigated.

2. Materials and Methods

2.1. Materials

Concentrated sulfuric acid and concentrated hydrochloric acid were purchased from Xinyang Chemical Reagent Factory. Phenol, tin tetrachloride, antimony trichloride, n-butanol, o-phenanthroline, potassium ferricyanide, 4-aminoantipyrine, ammonium chloride, aqueous ammonia, sodium sulfate, sodium hydroxide, potassium dichromate, ferrous sulfate, mercuric sulfate, silver sulfate, and ferrous ammonium sulfate were purchased from Sinopharm Chemical Reagent Co., Ltd., Wuhan, China. The reagents were of analytical grade. GAC (average particle size: 2–4 mm; specific surface area: 1200 m2/g) was purchased from Lvzhiyuan Activated Carbon Co., Ltd., Pingdingshan, China. The experimental water was deionized water.

2.2. Preparation of SnO2-Sb2O3/GAC Particle Electrodes

These particle electrodes were prepared by the dip-calcination method. First of all, the coconut shell activated carbon (average particle size: 2–4 mm) was washed with deionized water to remove surface ash and other substances. Then, they were dried at 105 °C and immersed in 0.5 mol/L dilute sulfuric acid for 12 h. After that, these materials were washed with deionized water to a neutral state and ultrasonically cleaned for 30 min. Finally, they were treated by vacuum drying at 105 °C for 8 h. After taking 490 mL n-butanol in a beaker and adding 10 mL concentrated hydrochloric acid, 87.65 g SnCl4 · 5H2O (0.5 mol/L) and 5.70 g SbCl3 (0.05 mol/L) were dissolved to prepare the precursor with a total molar of 0.5 mol/L.
A certain amount of pre-treated activated carbon particles was added to the solution, and the activated carbon particles were completely immersed in the solution. After 4 h of immersion, the impregnation solution was filtered out, during which the solution was stirred properly by a glass rod. The impregnated activated carbon particles were dried at 105 °C for 4 h and then placed into a muffle furnace for roasting at 400 °C under an air atmosphere for 3 h. The above steps were repeated 3 times to produce the SnO2-Sb2O3/GAC particle electrodes required for the experiment.

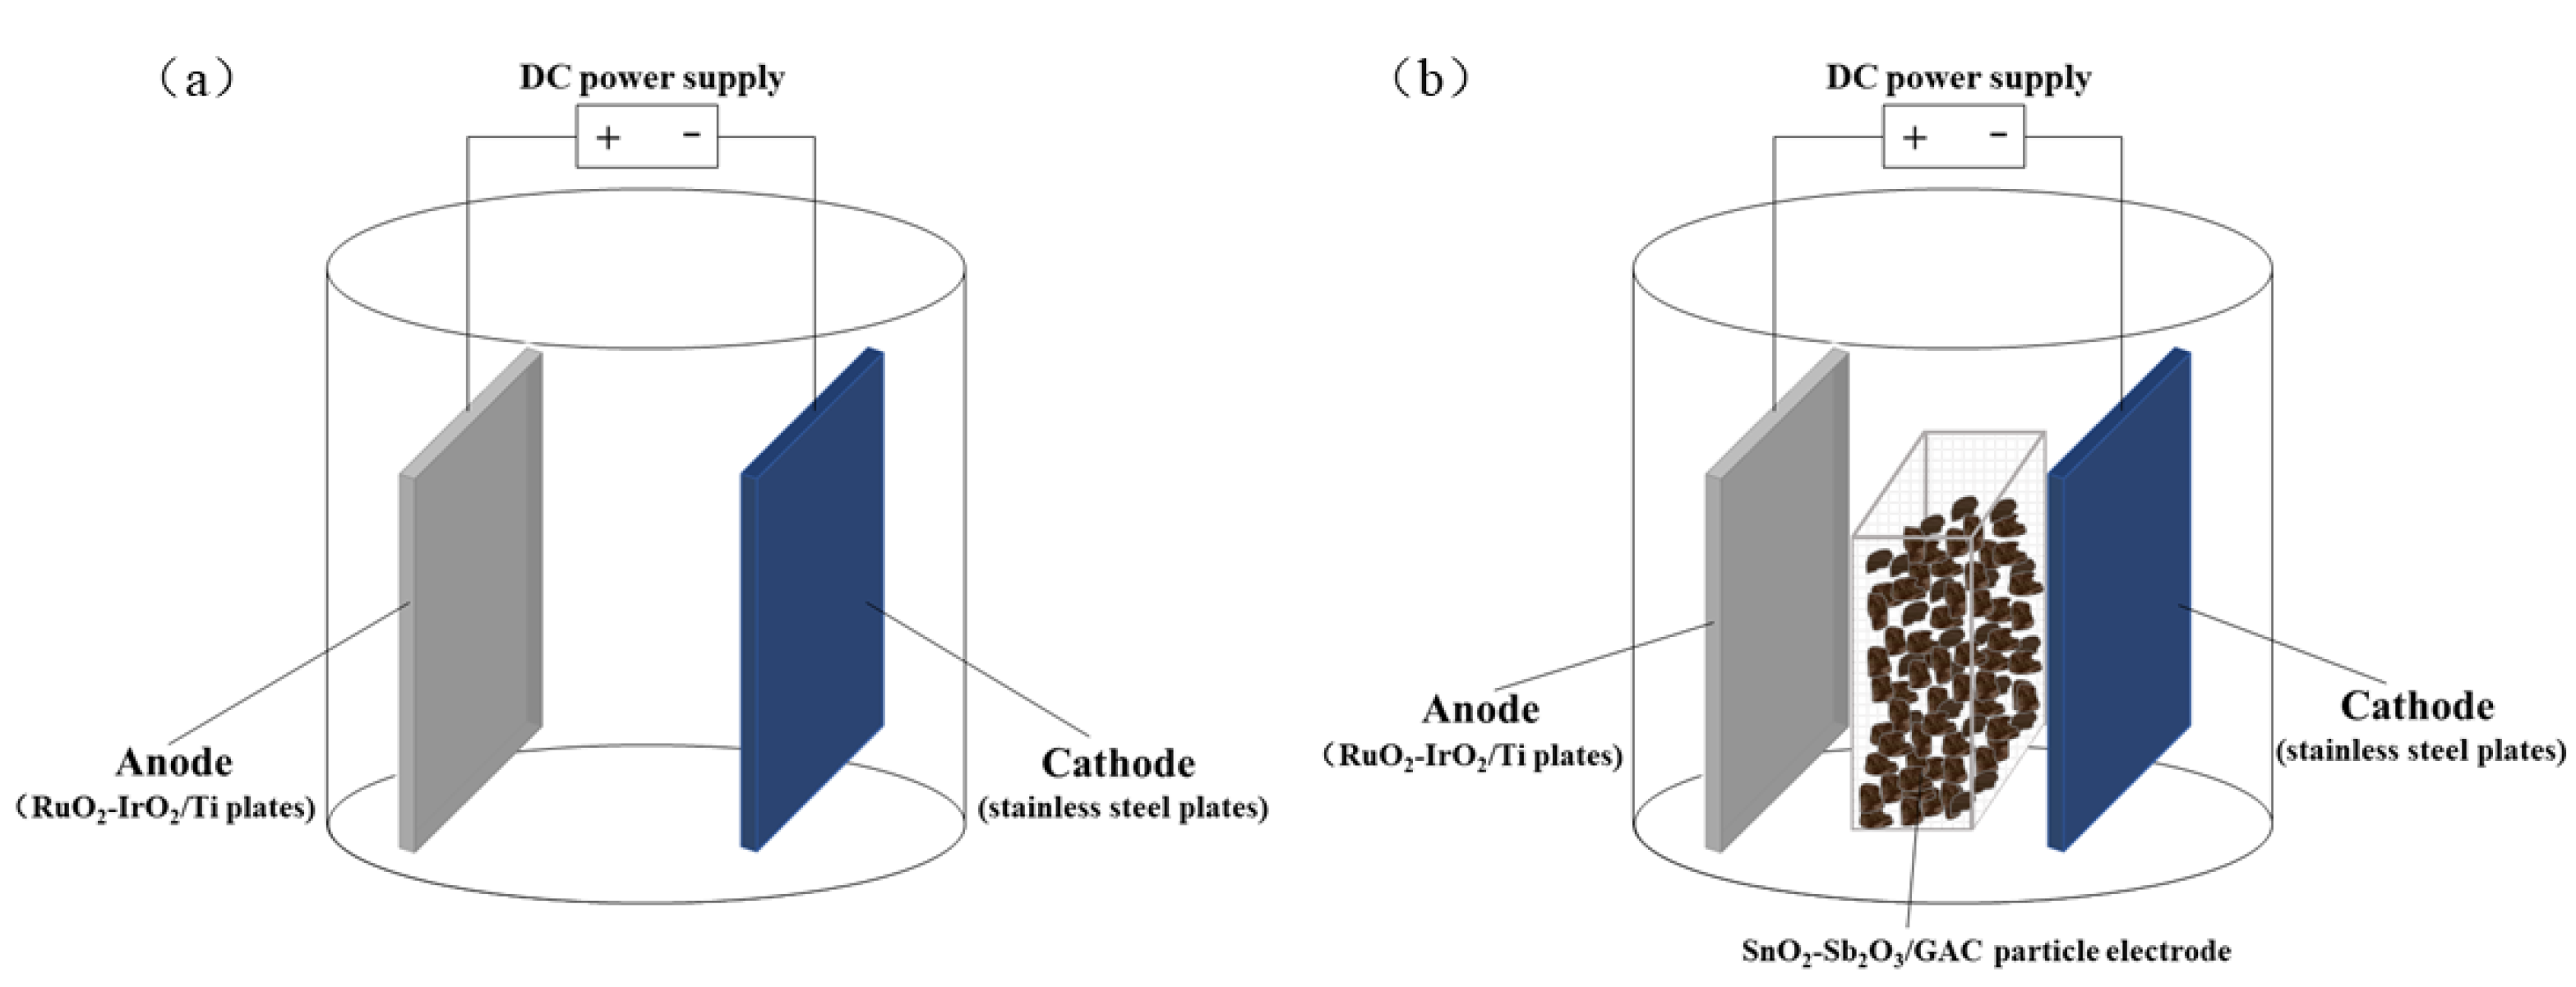
2.3. Reactor Configuration

The experiments were conducted in covered cylindrical glass cups (a diameter of 105 mm and a height of 110 mm) with an effective volume of 600 mL, and covered grooving facilitated the adjustment of the electrode plate spacing and the immobilization of the electrode plate. The anode was a Ti/RuO2-IrO2 plate (80 mm × 60 mm × 1 mm), while the cathode was a stainless-steel plate (80 mm × 60 mm × 1 mm). The anode and cathode were positioned vertically and parallel to each other, maintaining an inter-electrode gap of 35 mm. Figure 1a presents a schematic diagram of the 2D electrochemical reactor. The SnO2- Sb2O3/GAC particle electrodes, which were prepared beforehand, were packed between the anode and cathode as depicted in Figure 1b. This new reactor was a 3D electrochemical reactor. The direct current (DC) power supply was employed to provide a constant current, and the pH was regulated using H2SO4 and NaOH, with Na2SO4 serving as the electrolyte.

2.4. Reactor Operation

Five factors were selected: initial pH, electrolytic voltage, electrolyte concentration, initial phenol concentration and particle electrode dosage. The univariate variable method was used to investigate the removal of phenol under the designed experimental conditions and identify the optimal operating conditions. Before the actual experiment, the SnO2-Sb2O3/GAC particle electrode was saturated by immersing it in a 100 mg/L phenol solution to exclude the effect of adsorption.

2.5. Analytical Methods

A scanning electron microscope (SEM, JSM-IT300, JEOL, Tokyo, Japan) was employed to observe the surface morphology. X-ray diffraction (XRD, D8 Advance, Bruker, Frankfurt, Germany) was used to determine the crystalline phases of the SnO2-Sb2O3/GAC particle electrode. The concentration of phenol in the reactor was measured by ultraviolet spectrophotometer (UV–Vis, UV-1100, Mapada, Shanghai, China) according to the standard curve (Figure S1). The absorbance of phenol was measured at 510 nm. The chemical oxygen demand (COD) of liquid samples was measured by the potassium dichromate method. The possible intermediates during phenol degradation were analyzed using a gas chromatograph-mass spectrometer (GC-MS, Agilent, Santa Clara, CA, USA).

3. Results

3.1. Characterization of Particle Electrodes

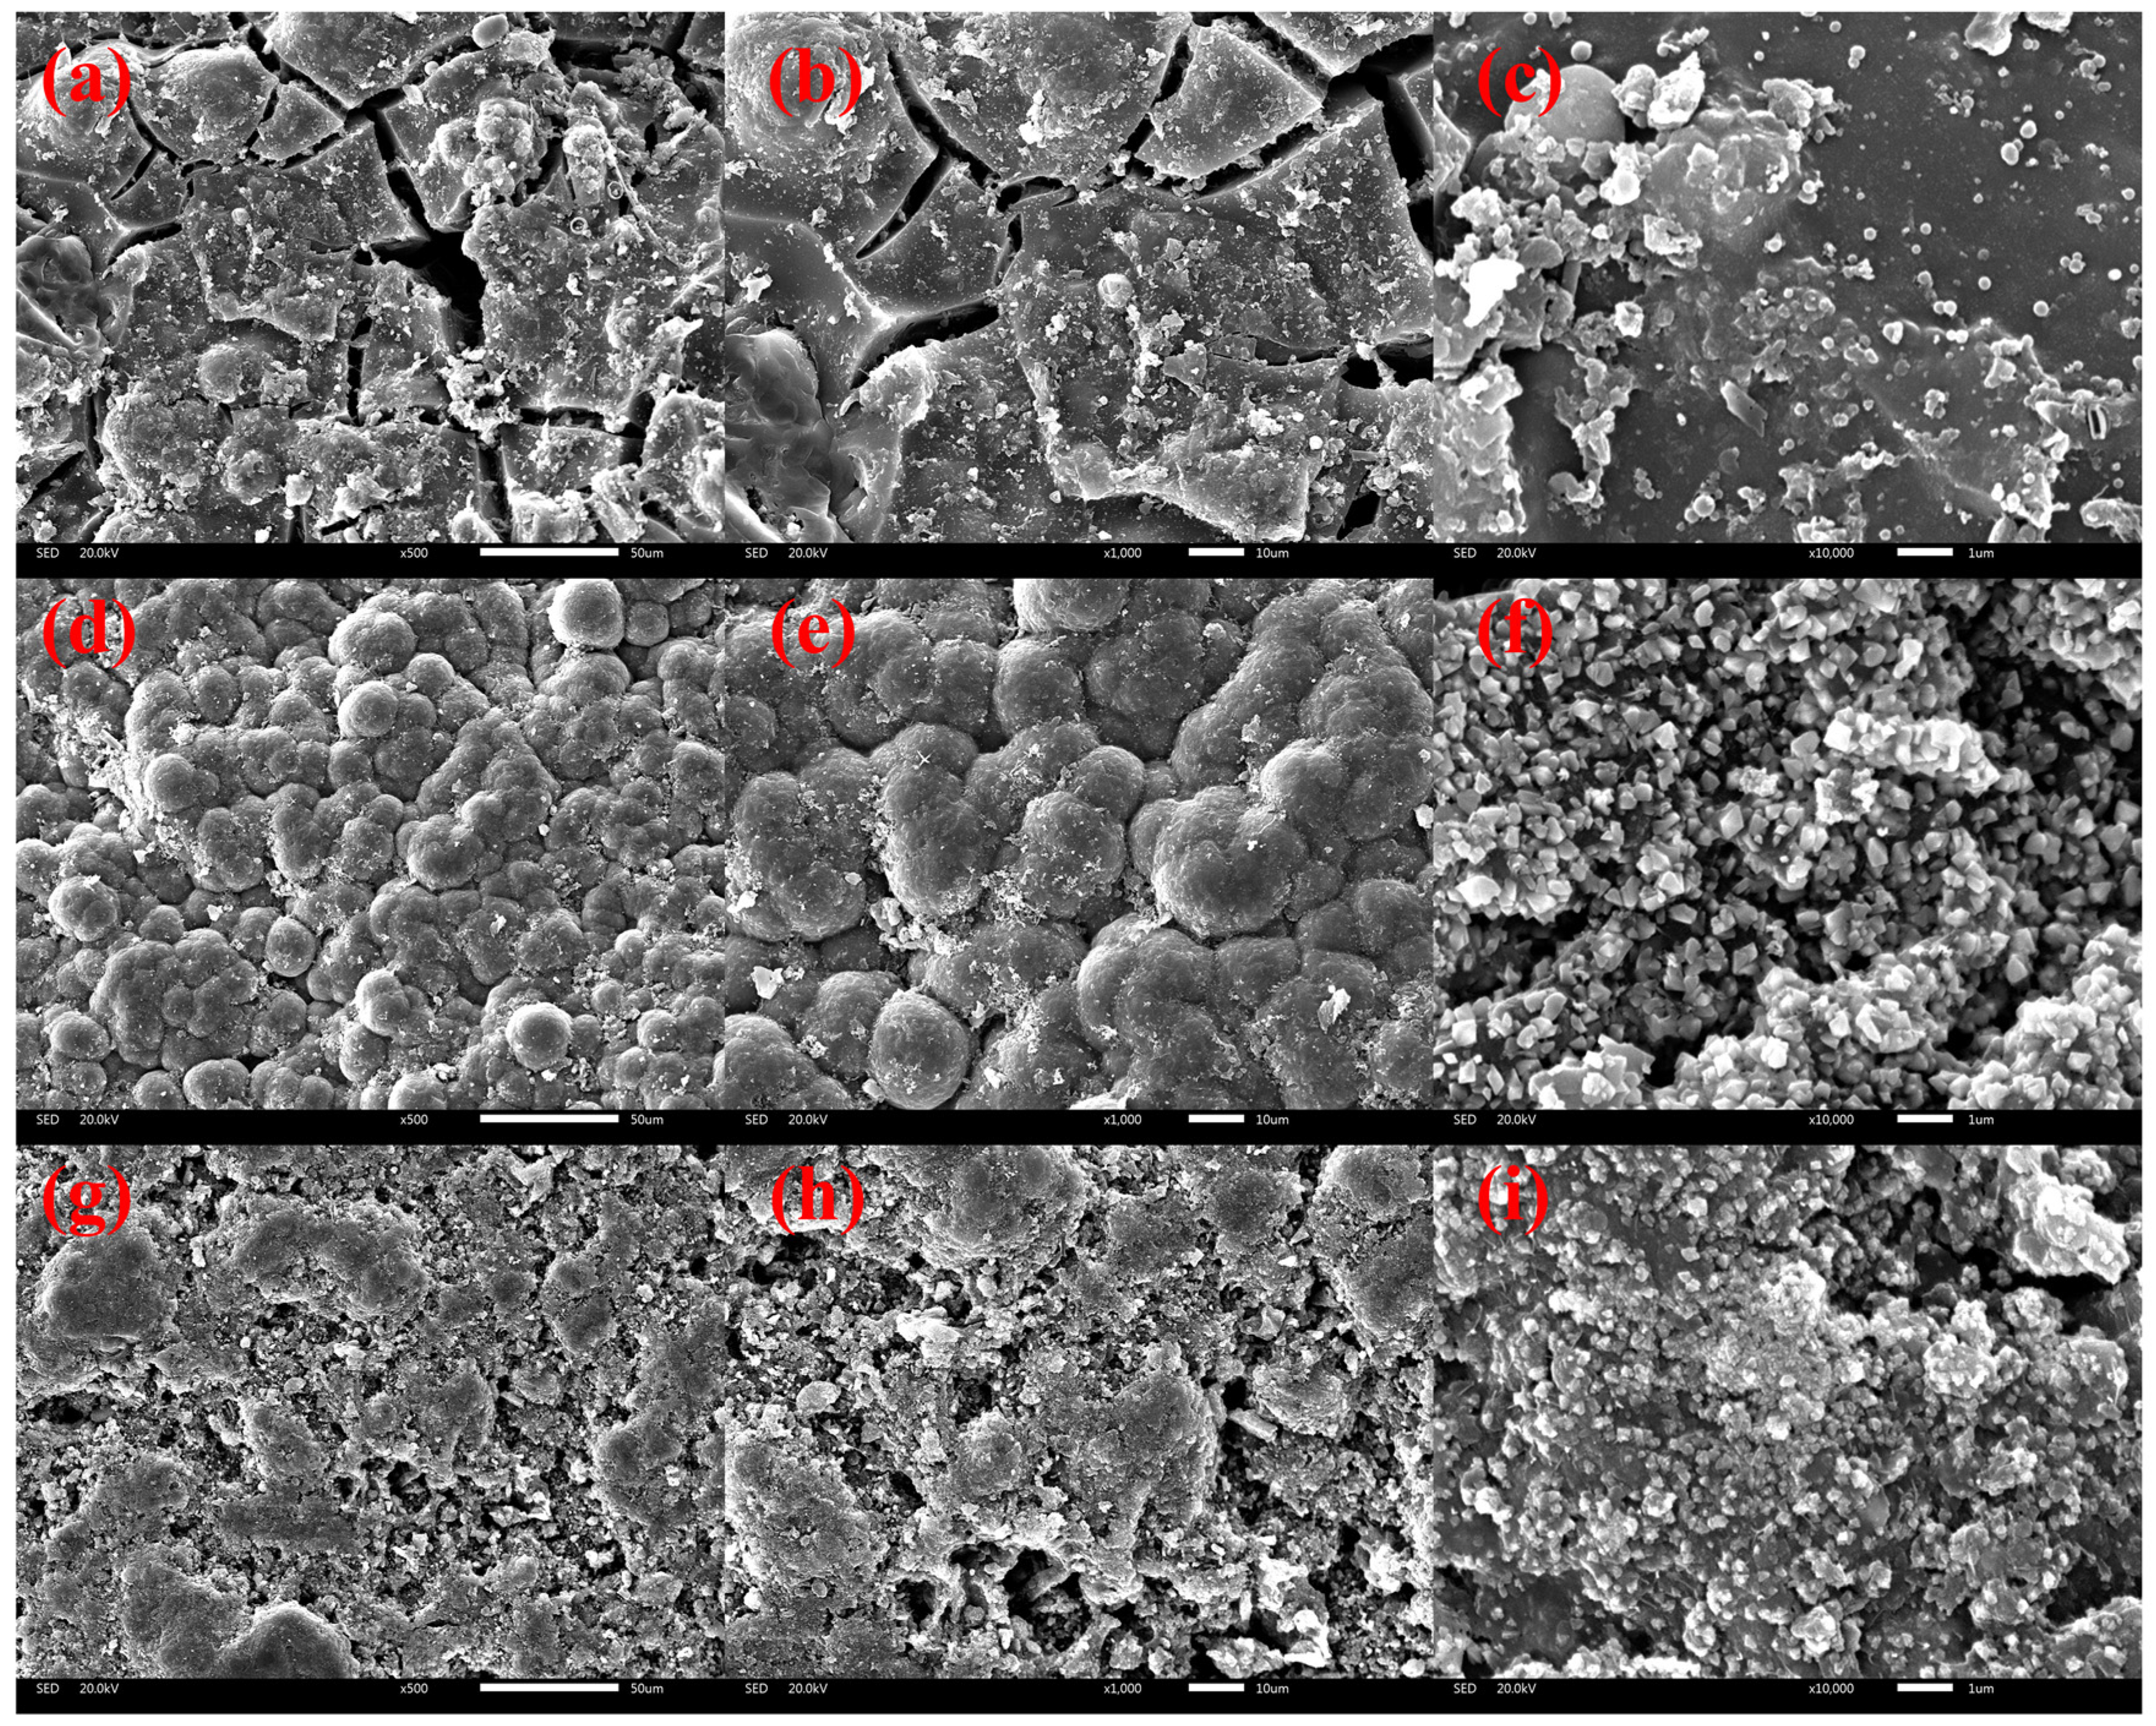
3.1.1. Morphological Analysis Using SEM

The characterization of unmodified coconut shell GAC and SnO2-Sb2O3/GAC under scanning electron microscopy (SEM) is shown in Figure 2. As shown in Figure 2a,b, there were abundant pore structures on the blank GAC surface. It can be seen from Figure 2d,e that the morphology of the GAC surface changed significantly, and most of the original abundant pores on the GAC surface were covered with several layers of dense laminar metal oxides. As shown in Figure 2c,f, GAC loaded with Sn-Sb oxides exhibited more irregular metal oxide crystals than blank GAC surface after repeated impregnation–calcination. As shown in Figure 2g–i, some metal oxide crystals exfoliated from the surface of SnO2-Sb2O3/GAC particle electrode after 15 runs, but they did not change significantly, which proved that the SnO2-Sb2O3/GAC particle electrode had good stability.

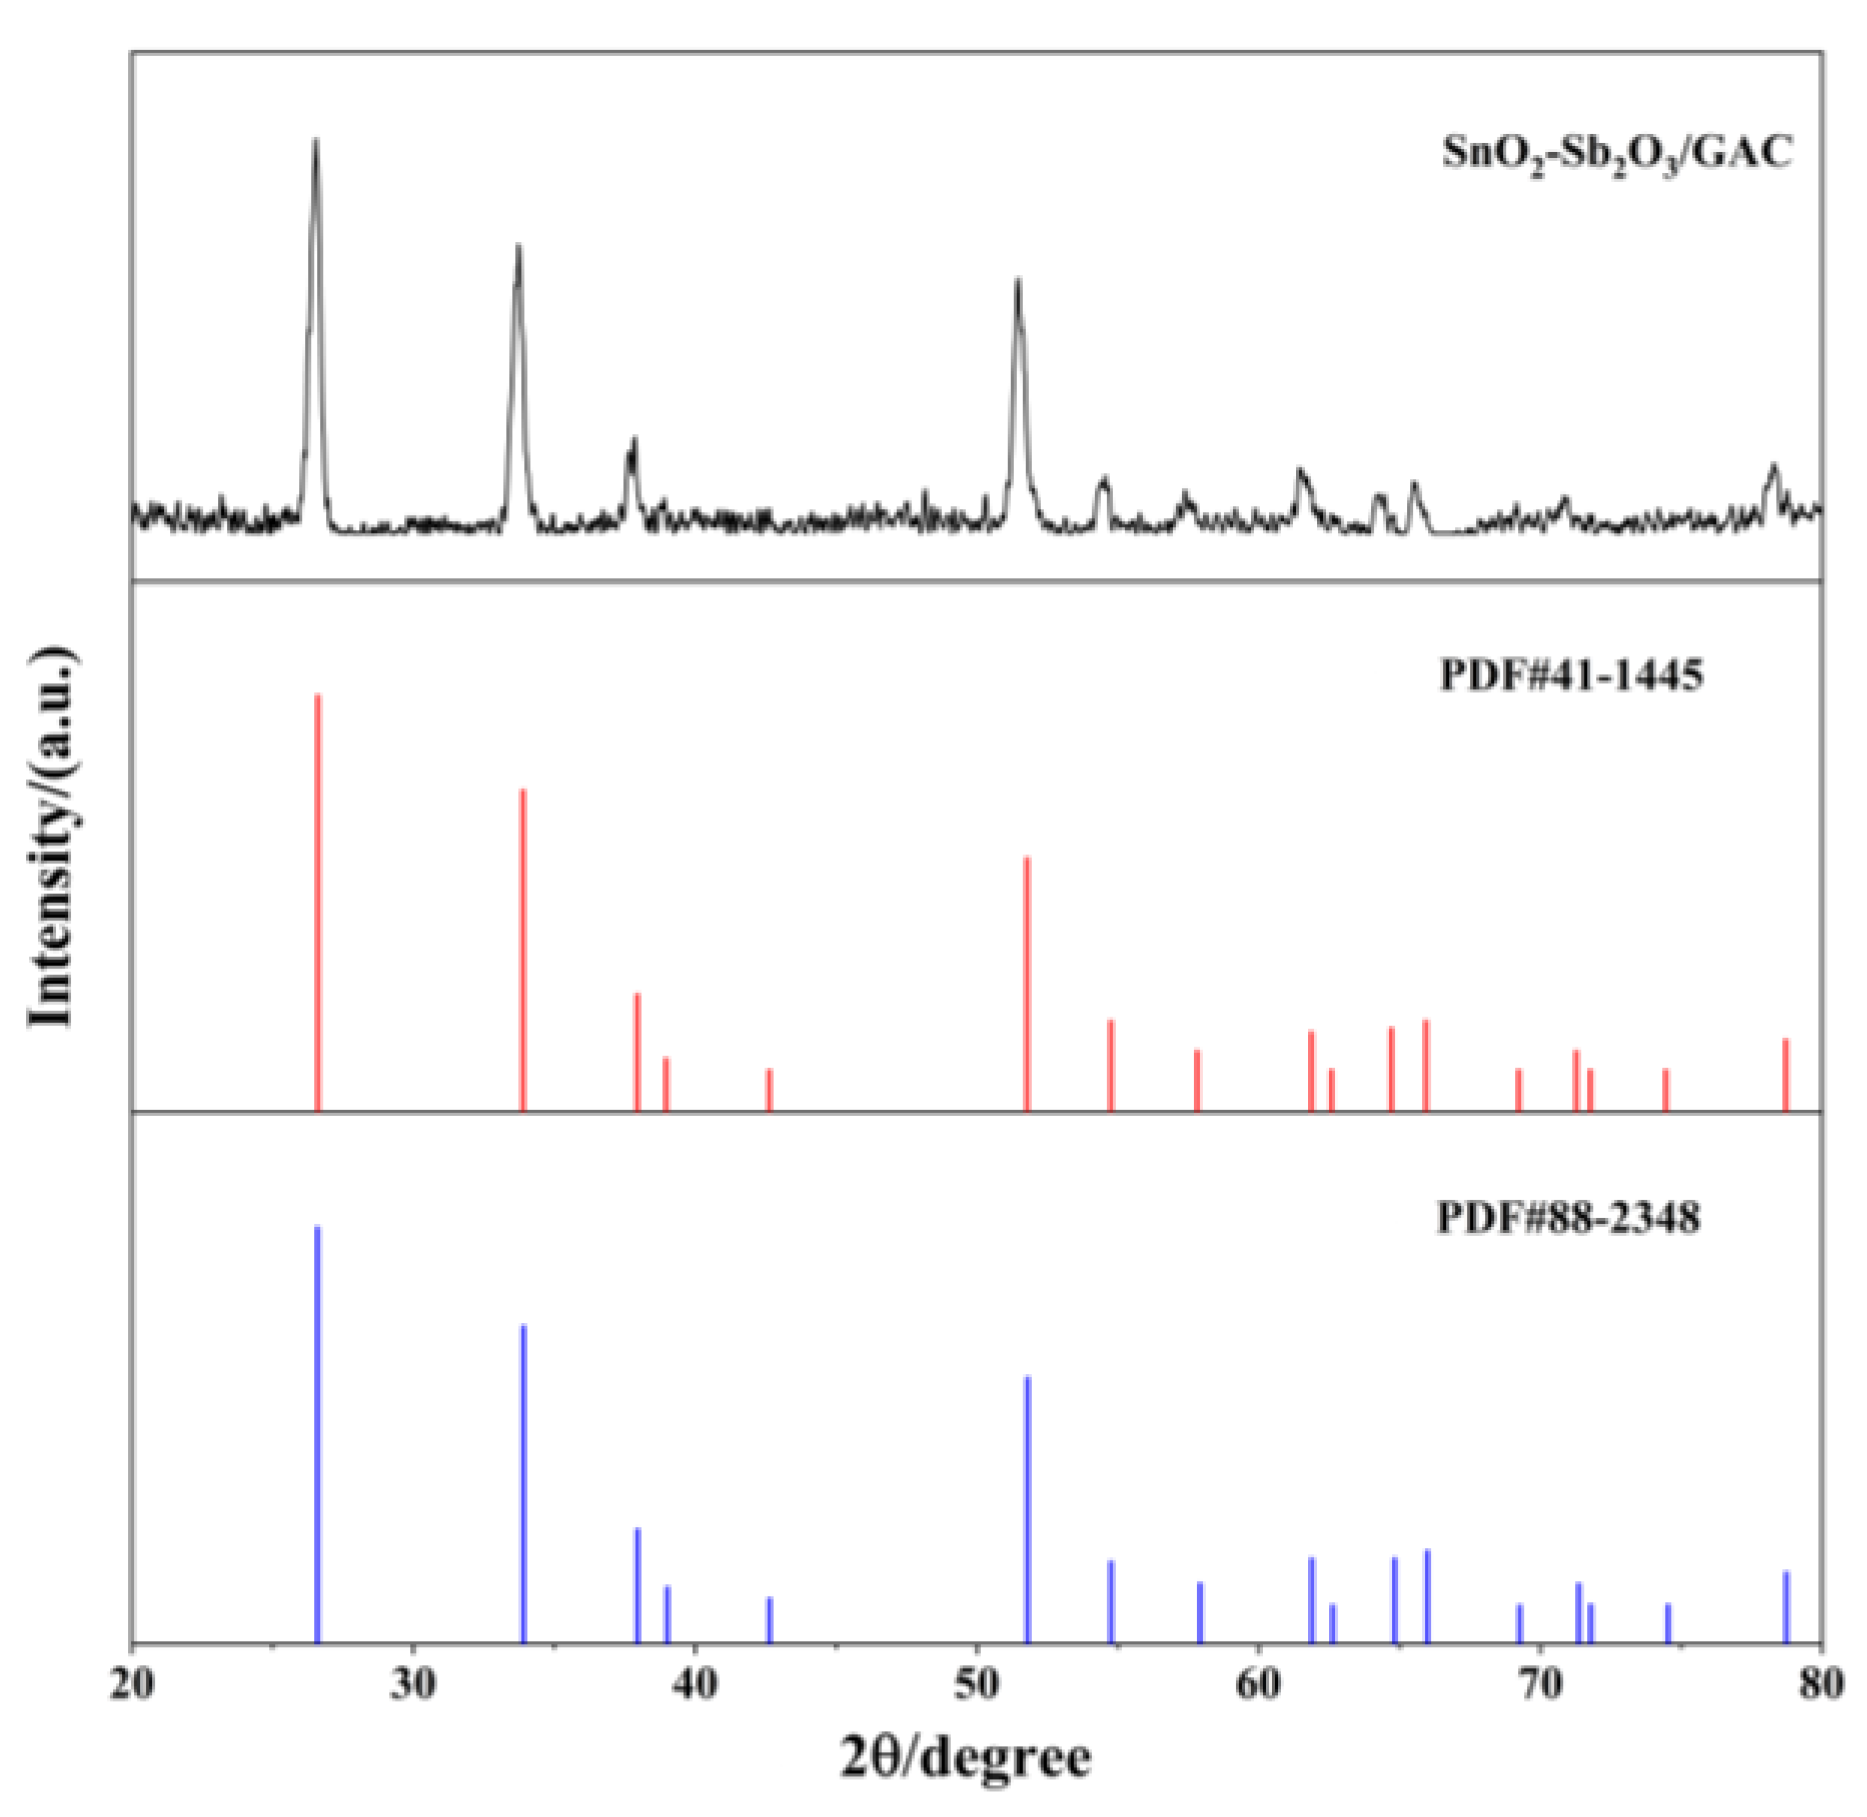
3.1.2. Structural Analysis Using XRD

The crystal structure of SnO2-Sb2O3/GAC particle electrodes was analyzed by X-ray diffraction (XRD), with the results shown in Figure 3.
After being compared with the standard cards of Joint Committee on Powder Diffraction Standards (JCPDS), the diffraction peaks of samples at 2 θ = 26.5°, 33.7°, 37.8°, and 51.4° basically coincided with the crystal planes of (110), (101), (200), and (211) in JCPDS Card No. 88-2348. In other words, they corresponded to the characteristic peaks of SnO2/Sb2O3 (26.6°, 33.9°, 38.0°, and 51.8°). This confirmed that the GAC surface was mainly loaded with Sn-Sb oxides. The activated carbon particle electrode of Sn-Sb metal oxides was called SnO2-Sb2O3/GAC. However, the diffraction peaks of SnO2-Sb2O3/GAC had a shift with a small amplitude, which may be caused by the distortion of SnO2 lattice under the action of doped Sb [23].

3.1.3. Surface Area Analysis Using BET

The pore structure parameters and specific surface area of blank GAC and SnO2-Sb2O3/GAC particle electrodes were analyzed by BET, and the results are shown in Table 1.
As showed in Table 1, compared with the blank GAC particle electrode, the pore size, pore volume and specific surface area of the SnO2-Sb2O3/GAC particle electrode decreased by 15.15%, 38.32% and 21.33%, which was due to the loading of Sn-Sb oxide on the outer surface and inside pore of the GAC.

3.1.4. Thermogravimetric Analysis

Thermogravimetric analysis is a conventional characterization method for materials, which can be used to characterize these materials’ thermal weight loss behavior and structural phase transition. In an air atmosphere, with a heating rate of 10 °C/min from room temperature (20 °C) to 400 °C, the sample exhibited approximately 0.52% weight loss, mainly due to the removal of bound water in the sample. Under 400 °C for 3 h, the sample showed a weight loss of only 0.83%, indicating that the SnO2-Sb2O3/GAC particle electrode had good thermal stability.

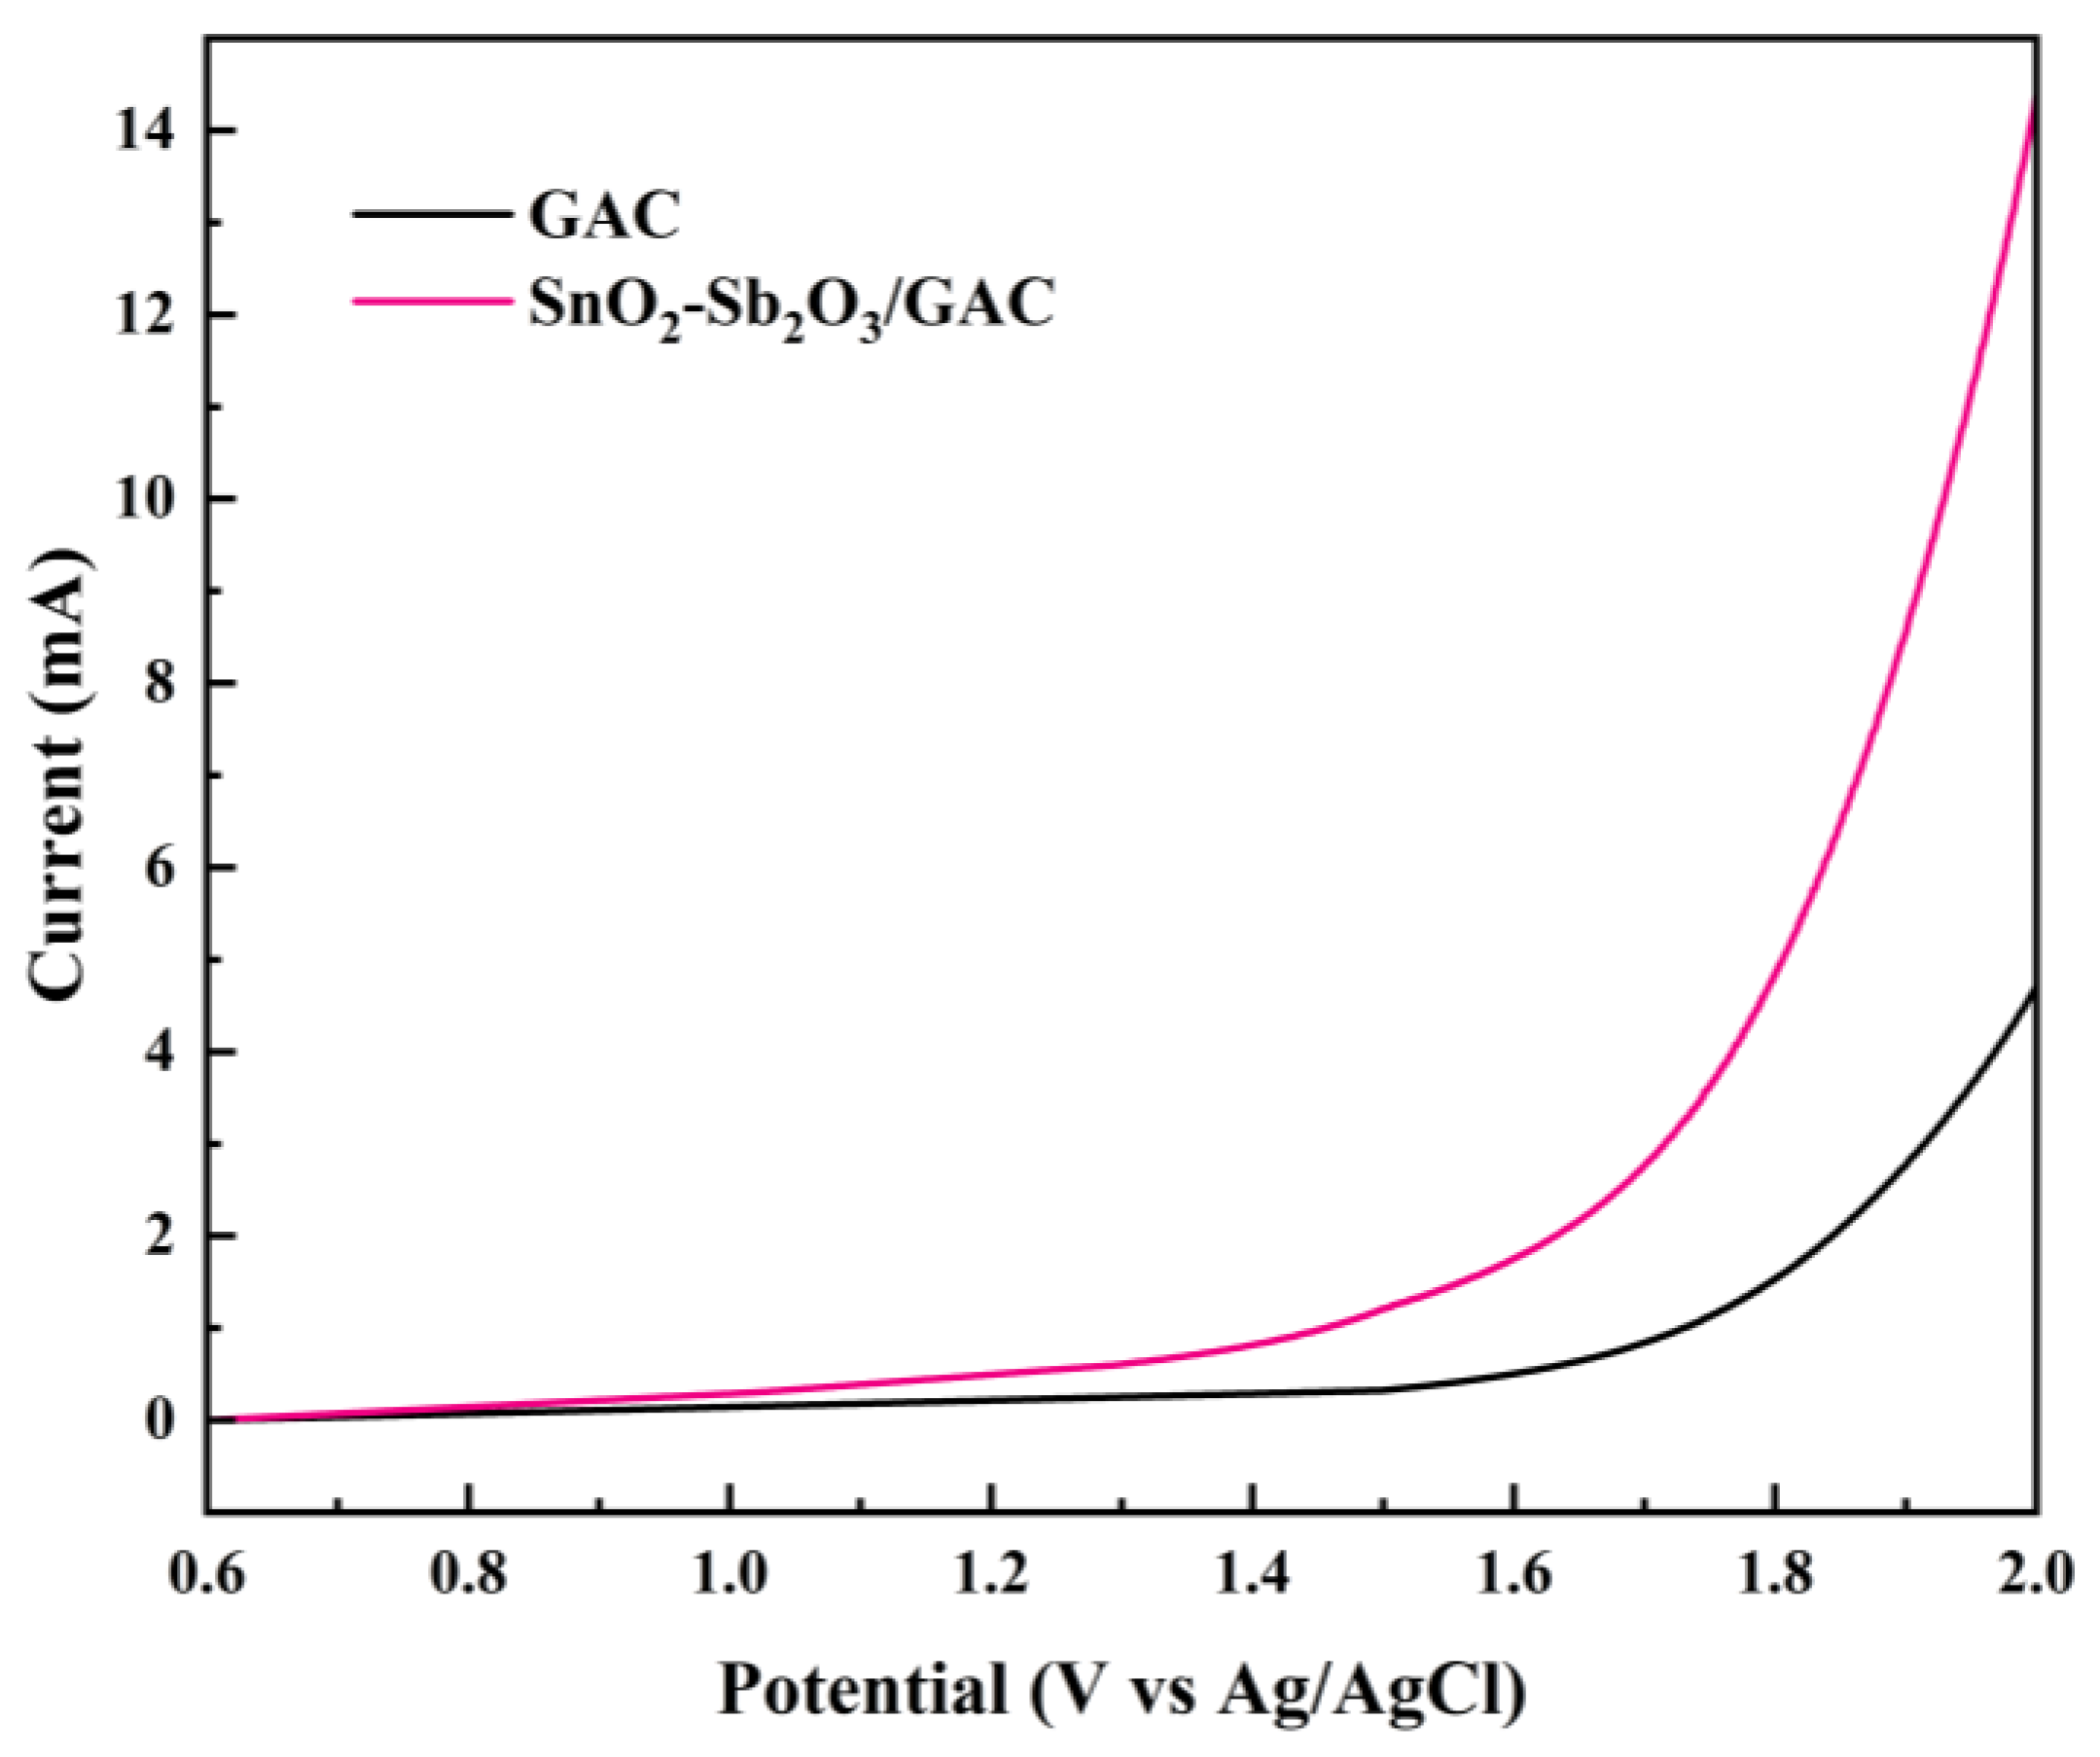
3.1.5. LSV Testing and Analysis

Linear sweep voltammetry (LSV) was conducted with a scan rate of 5 mV/s to study the oxygen evolution reaction of the two particle electrodes under pH 7. The working electrodes were GAC or SnO2-Sb2O3/GAC particle electrodes, the auxiliary electrode was a Pt electrode, and the reference electrode was Ag/AgCl. The results are shown in Figure 4.
The onset potential of oxygen evolution reaction for GAC was about 1.60 V; however, it was only approximately 1.0 V for SnO2-Sb2O3/GAC. In addition, the current of SnO2-Sb2O3/GAC was much higher than that of GAC. These results indicated that SnO2-Sb2O3/GAC exhibited higher catalytic activity towards oxygen evolution reaction.

3.2. Factors Influencing the Removal of Phenol by 3D Electrochemical Oxidation

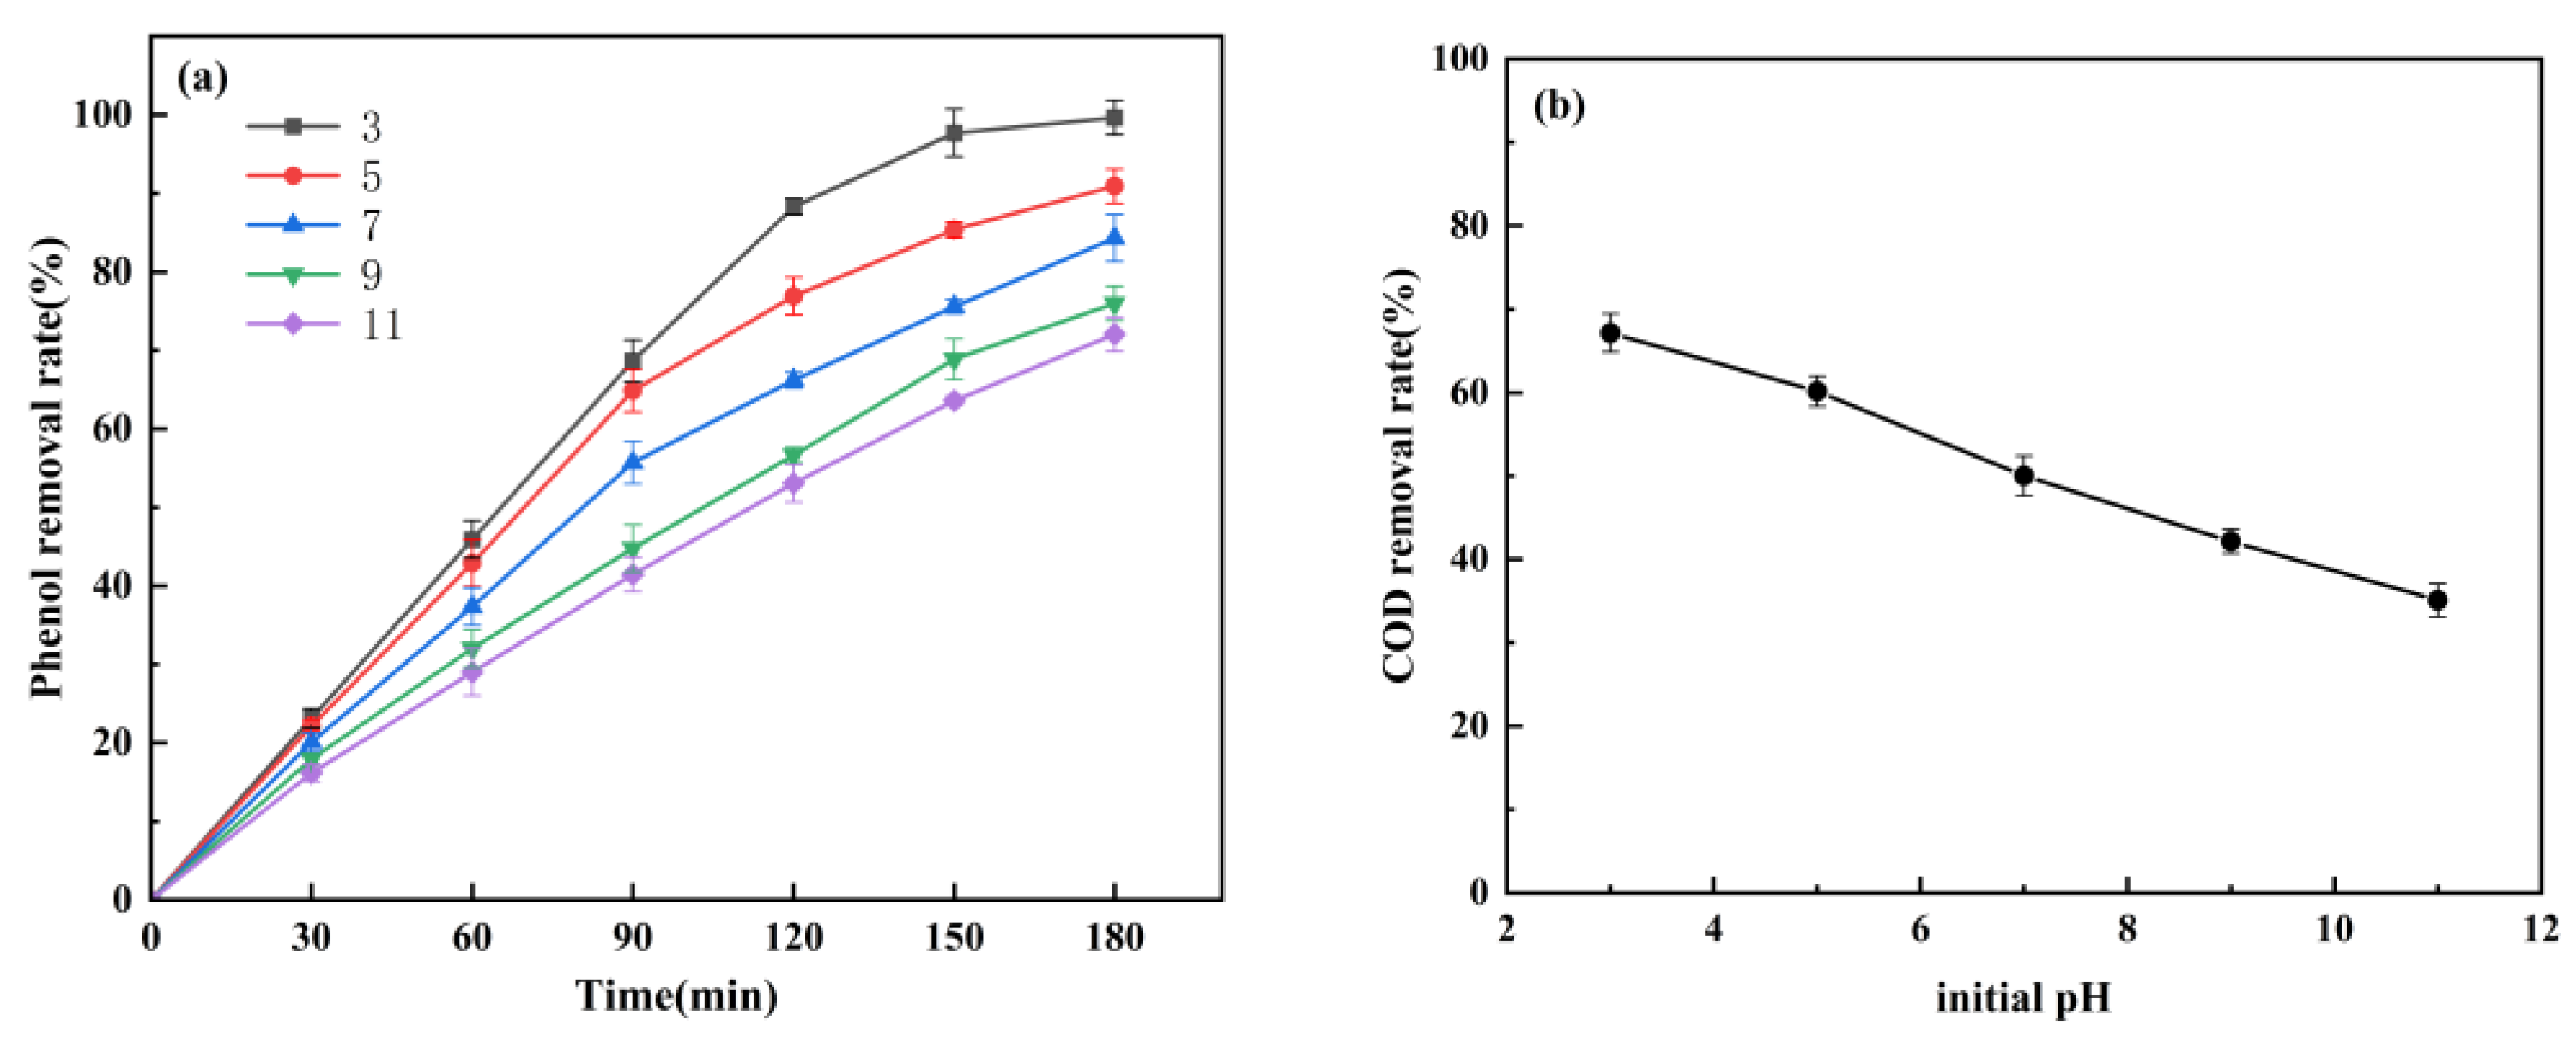
3.2.1. Effect of the Initial pH

The simulated phenol wastewater was treated at an initial pH of 3–11. In the experiment, the initial pH of the solution was adjusted by the dilute H2SO4 and NaOH solutions. The electrolytic voltage was 15 V, the concentration of Na2SO4 was 0.075 mol/L, the initial phenol concentration was 100 mg/L, the particle electrode dosage was 30 g/L, and the volume of simulated phenol wastewater was 600 mL. The experiment continued for 3 h, and samples were taken every 30 min. Through this experiment, the influence of the initial pH on the removal effectiveness of phenol was examined based on the removal rates of phenol and COD.
As shown in Figure 5a,b, the removal rate of phenol and COD decreased with the increase of the initial pH. When the pH was 3, the removal rate of phenol and COD was 99.65% and 67.16%, respectively. In contrast, when the pH was 11, the removal rates of phenol and COD were 72.04% and 35.08%, respectively. Therefore, acidic conditions were conducive to the degradation of phenol and the removal of COD. This can be attributed to the fact that the ring-opening reaction of phenol was accelerated under acidic conditions. Specifically, phenol was oxidized to benzoquinone at first. Acidic conditions contributed to the ring-opening of benzoquinone, which promoted the reaction leading to CO2 generation. In addition, H2O in the solution was prone to discharge to generate ·OH under acidic conditions, thus inhibiting the oxygen evolution reaction (OER) in the reaction system. Moreover, acidic conditions were also beneficial for inhibiting the formation of polymer films on the electrode surface. However, the effectiveness of phenol and COD removal was poor under alkaline conditions. This can be explained by the fact that SnO2 loaded on the particle electrode was extremely unstable and easily dissolved under alkaline conditions [24], resulting in the inability of the particle electrode to undergo electrocatalytic oxidation. Furthermore, alkaline conditions promoted the formation of polymer films, inducing the passivation of the electrodes [25].

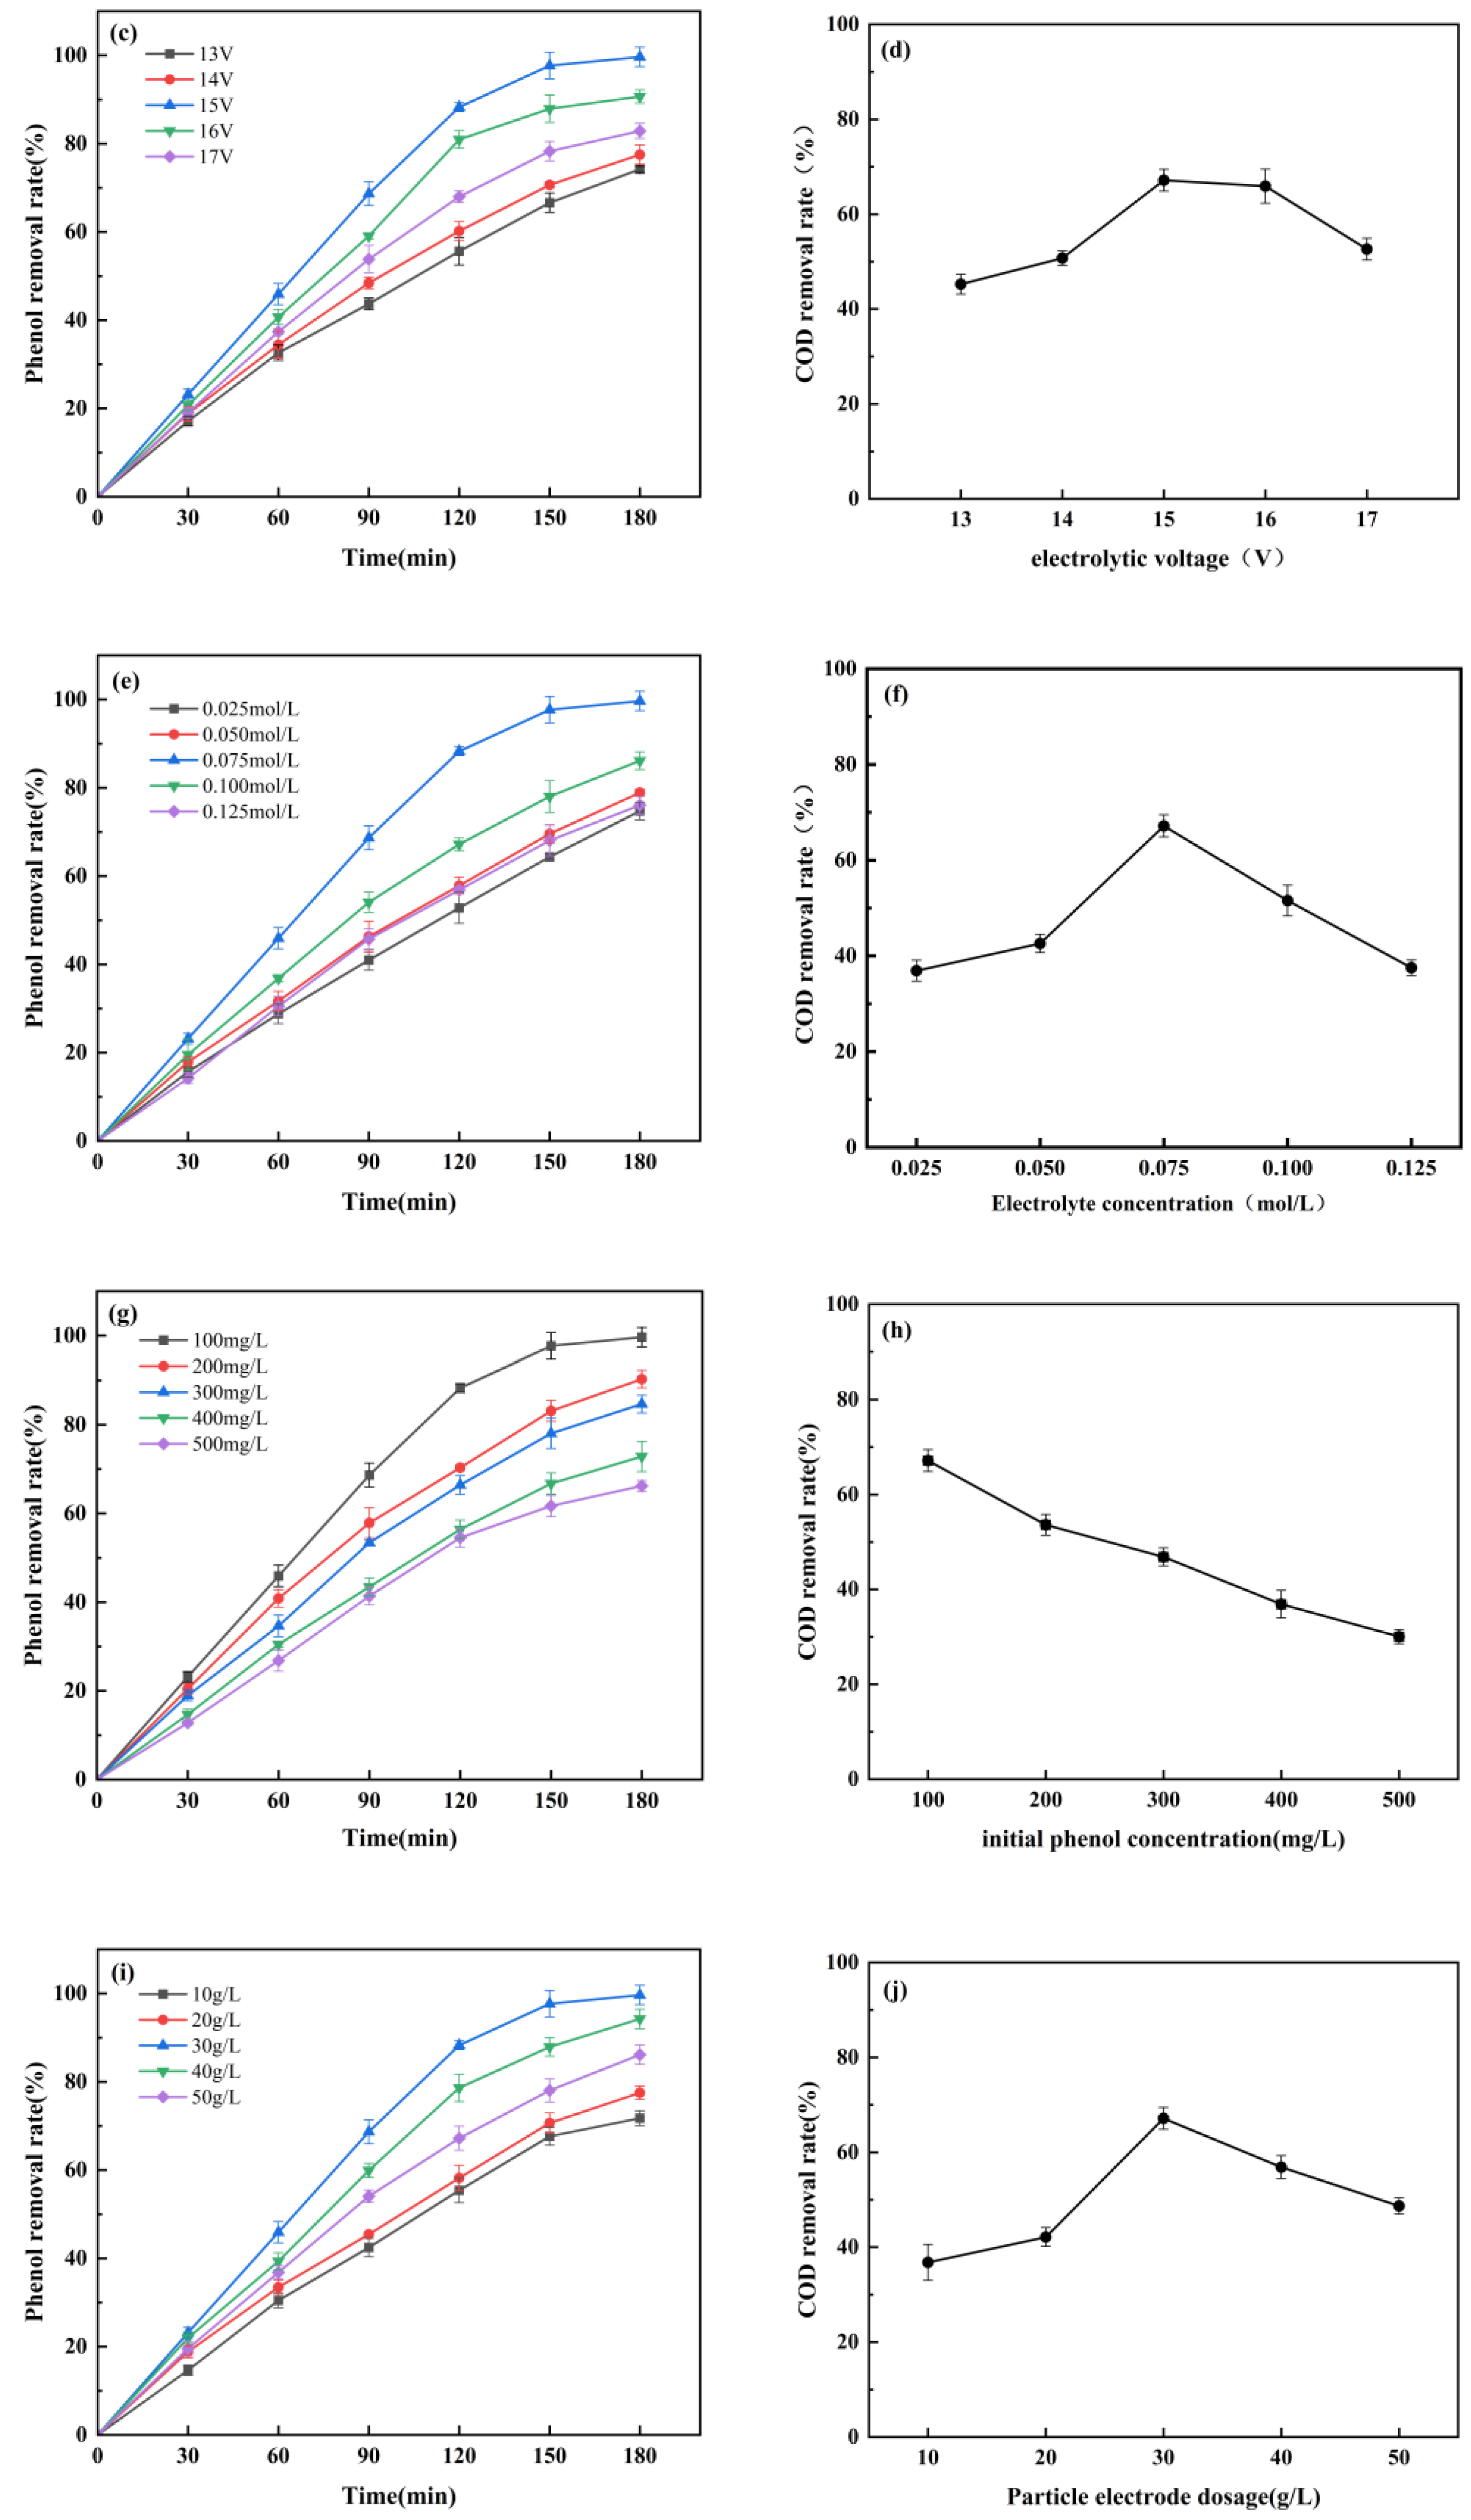
3.2.2. Effect of Electrolytic Voltage

The simulated phenol wastewater was treated under the electrolytic voltage of 13–17 V. The initial pH was 3, the concentration of Na2SO4 was 0.075 mol/L, the initial phenol concentration was 100 mg/L, the particle electrode dosage was 30 g/L, and the volume of simulated phenol wastewater was 600 mL. The experiment continued for 3 h, and samples were taken every 30 min. Through this experiment, the influence of the electrolytic voltage on the removal effectiveness of phenol was examined based on the removal rates of phenol and COD.
As shown in Figure 5c,d, when the electrolytic voltage ranged from 13 V to 15 V, the removal rate of phenol and COD increased with the increase in the electrolytic voltage. The removal rate of phenol increased from 74.20% to 99.65%, and that of COD increased from 45.25% to 67.16%. When the electrolytic voltage ranged from 15 V to 17 V, the removal rate of phenol and COD decreased with the increase in the electrolysis voltage. The removal rate of phenol decreased from 99.65% to 82.87%, and that of COD decreased from 67.16% to 52.63%. Specifically, the removal rate of phenol and COD reached its highest when the electrolytic voltage was 15 V. This can be interpreted as follows: with the increase in the electrolytic voltage from 13 V to 15 V, the potential difference increased, the driving force of reactions increased, and more particle electrodes were polarized [26]. Meanwhile, the rate of the electrode producing strong oxidizing substances was accelerated. Hence, the treatment capacity of the 3D electrode system was gradually enhanced with the increase in electrolytic voltage. However, when the electrolytic voltage exceeded 15 V, there would be more side reactions on the surface of the electrodes and particle electrodes. This hindered the formation of substances with strong oxidizing properties, thus leading to the declined treatment capacity of the 3D electrode system [27]. Meanwhile, when the electrolytic voltage was too high, the active components of the particle electrode were dissolved, which would shorten the service life of the particle electrode.

3.2.3. Effect of Electrolyte Concentration

The simulated phenol wastewater was treated under electrolyte concentrations of 0.025–1.125 mol/L. The initial pH was 3, the electrolytic voltage was 15 V, the initial phenol concentration was 100 mg/L, the particle electrode dosage was 30 g/L, and the volume of simulated phenol wastewater was 600 mL. The experiment continued for 3 h, and samples were taken every 30 min. Through this experiment, the influence of the electrolyte concentration on the removal effectiveness of phenol was examined based on the removal rate of phenol and COD.
As shown in Figure 5e,f, when the electrolyte concentration ranged from 0.025 mol/L to 0.075 mol/L, the removal rates of phenol and COD increased with the increase in the electrolyte concentration. The removal rate of phenol increased from 74.75% to 99.65%, and that of COD increased from 36.91% to 67.16%. When the electrolyte concentration ranged from 0.075 mol/L to 0.125 mol/L, the removal rate of phenol and COD decreased with the increase in the electrolyte concentration. The removal rate of phenol decreased from 99.65% to 76.07%, and that of COD decreased from 67.16% to 37.52%. Specifically, the removal rate of phenol and COD reached its highest when the electrolyte concentration was 0.075 mol/L. This phenomenon may be caused by the conductivity of the solution gradually increasing as the electrolyte concentration increased [28]. This was beneficial for the transfer of electrons in the solution and improved mass transfer. However, when the electrolyte concentration was excessively high, excessive electrolyte particles gathered on the electrode surface, which induced ineffective collisions, thus significantly reducing the reaction area [29]. Meanwhile, the side reactions in the system increased, and the bypass current and short-circuit current increased [30]. Consequently, the effective current decreased, which reduced the treatment capacity of the 3D electrode system.

3.2.4. Effect of Electrolyte Concentration

The simulated phenol wastewater was treated with an initial phenol concentration of 100–500 mg/L. The initial pH was 3, the electrolytic voltage was 15 V, the concentration of Na2SO4 was 0.075 mol/L, the particle electrode dosage was 30 g/L, and the volume of simulated phenol wastewater was 600 mL. The experiment continued for 3 h, and samples were taken every 30 min. Through this experiment, the influence of the initial phenol concentration on the removal effectiveness of phenol was examined based on the removal rate of COD.
As shown in Figure 5g,h, the removal rate of phenol and COD decreased with the increase of the initial phenol concentration. When the initial concentration of phenol was 100 mg/L, the maximum removal rate of phenol was 99.65%, and the removal rate of COD was 67.16%. When the influent concentration of phenol increased to 500 mg/L, the removal rates of phenol and COD decreased to 66.19% and 30.06%, respectively. Therefore, the higher the influent concentration, the lower the removal rate of phenol and COD. During phenol electrolysis, a polymer film was formed on the anode surface to cover the electrode surface, so that the electrode was passivated. When the concentration of phenol was low, the polymer film was not obvious or thin, and the inhibition of phenol degradation was not obvious. Moreover, with the increase in the initial phenol concentration, numerous phenol molecules adhered to the surface of the particle electrode. This affected the mass transfer efficiency of the solution, reduced the electrocatalytic oxidation activity of the particle electrode, and decreased the degradation effectiveness of phenol.

3.2.5. Effect of the Particle Electrode Dosage

The simulated phenol wastewater was treated with a particle electrode dosage of 10–50 g/L. The initial pH was 3, the electrolytic voltage was 15 V, the concentration of Na2SO4 was 0.075 mol/L, the initial phenol concentration was 100 mg/L, and the volume of simulated phenol wastewater was 600 mL. The experiment continued for 3 h, and samples were taken every 30 min. Through this experiment, the influence of the particle electrode dosage on the removal effectiveness of phenol was examined based on the removal rates of phenol and COD.
It can be seen from Figure 5i,j that the removal rate of phenol and COD presented an increase–decrease trend with the increase in the particle electrode dosage. When the particle electrode dosage increased from 10 g/L to 30 g/L, the removal rate of phenol increased from 71.73% to 99.65%, and that of COD increased from 36.79% to 67.16%. When the particle electrode dosage increased from 30 g/L to 50 g/L, the removal rate of phenol decreased from 99.65% to 86.13%, and that of COD decreased from 67.16% to 48.71%. This effect can be attributed to the particle electrodes being induced to charge under the action of the electric field to form miniature electrolytic cells. The number of these miniature electrolytic cells determined the reaction area and current efficiency [31]. When the particle electrode dosage increased, the number of micro-electrolytic cells increased, the reaction area increased, the mass transfer was accelerated, and the current efficiency was improved, which significantly enhanced the removal rate of phenol and COD. If the particle electrode dosage was excessively high, the number of repolarized particle electrodes would not increase. Meanwhile, some particle electrodes contacted each other, which increased the short-circuit current of the reaction system [32]. This reduced the current efficiency and affected the electrocatalytic performance of the 3D electrochemical reactor.

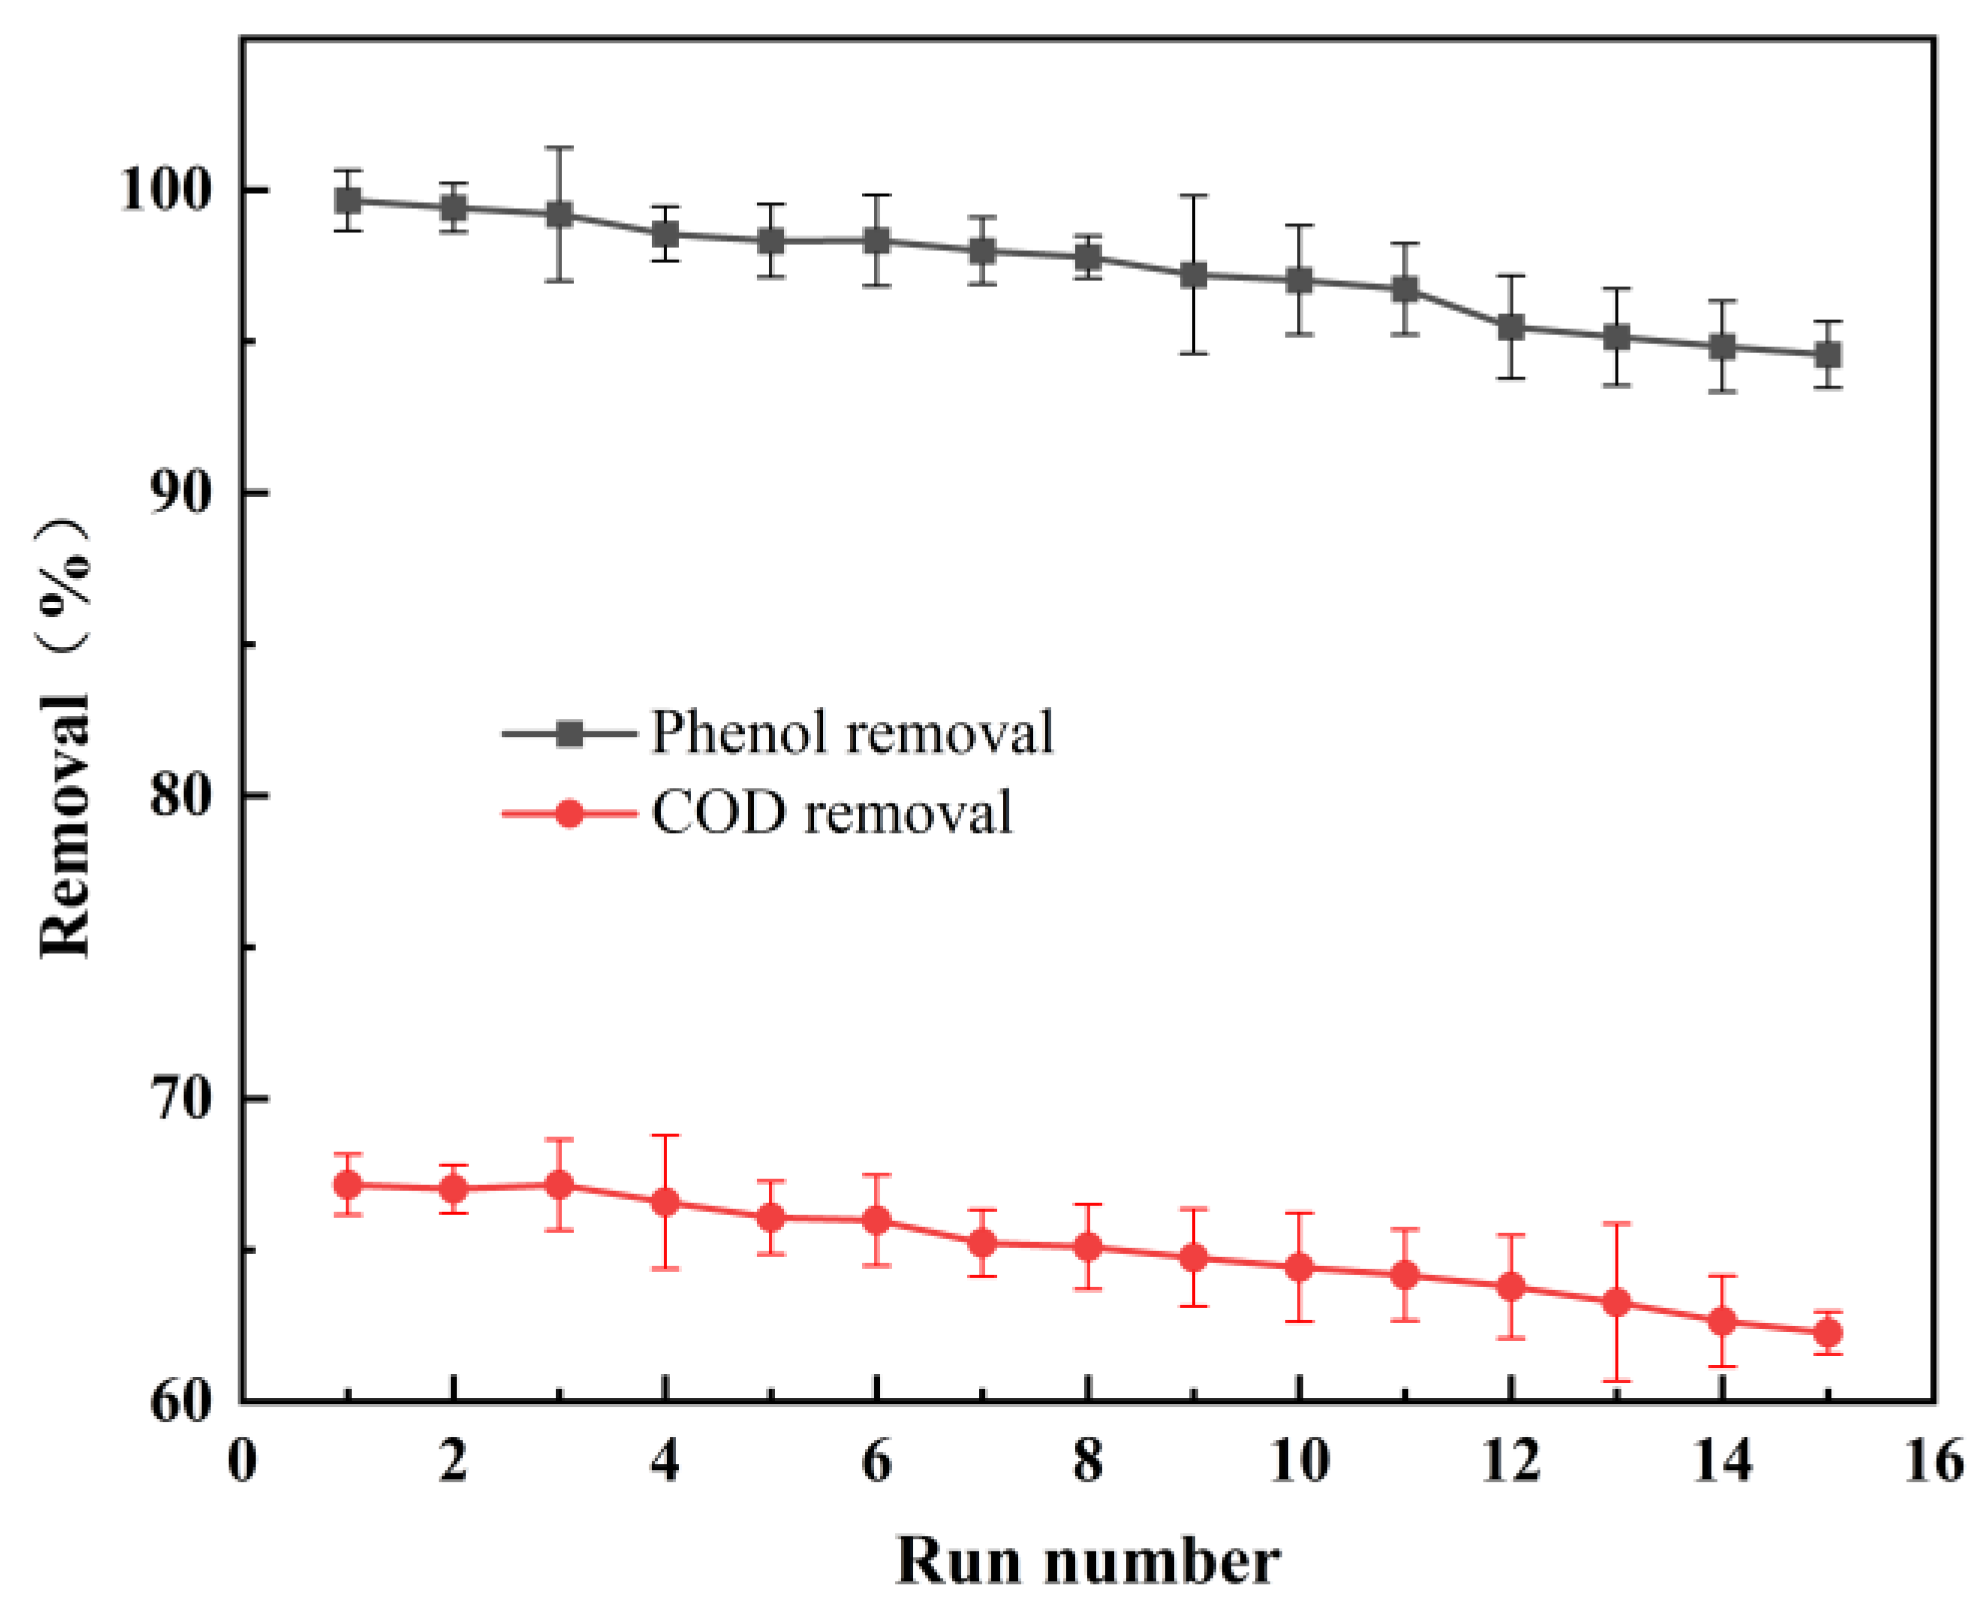
3.3. Stability Analysis of SnO2-Sb2O3/GAC Particle Electrodes

In order to investigate the stability and reproducibility of the particulate electrodes, we conducted a series of experiments to degrade simulated phenol wastewater using the 3D electrode system. The experiments were repeated multiple times, with each repetition involving continuous treatment of the wastewater without cleaning the particulate electrodes.
The simulated phenol wastewater with an initial concentration of 100 mg/L was electrolyzed under optimal conditions. Specifically, the initial pH was 3, the electrolytic voltage was 15 V, the concentration of the electrolyte (Na2SO4) was 0.075 mol/L, the particle electrode dosage was 30 g/L, and the reaction time was 3 h. The electrolyzation was repeated 15 times to measure the phenol concentration and COD in the effluent. The results are shown in Figure 6.
As shown in the figure, the removal rate of phenol and COD decreased with the increase of electrolyzation times. The removal rates of phenol and COD were 99.65% and 67.16%, respectively, in the first electrolyzation. Furthermore, the removal rate of phenol was 98.32%, 97.02%, and 94.56% in the 5th, 10th, and 15th electrolyzation, and that of COD was 66.07%, 64.43%, and 62.27%, respectively, in the corresponding electrolyzation trials. This was mainly caused by the active components dissolving after many instances of electrolyzation, which caused some particle electrodes to lose their activity. Meanwhile, particle electrodes were not washed during electrolyzation. As a result, the intermediate products coalesced into polymer films on the surface of these particle electrodes. This hindered the mass transfer between particle electrodes and pollutants, blocked the diffusion of strong oxidants, and reduced the active area of the reaction. Therefore, the degradation effectiveness of phenol decreased with the increase in electrolyzation times. However, the removal rate of phenol only decreased by 3.76% after 15 trials of repeated electrolysis. This proved that the SnO2-Sb2O3/GAC particle electrode prepared in this experiment had favorable long-term stability, and the catalytic performance of these particle electrodes did not decrease too much even after long-term electrolysis.

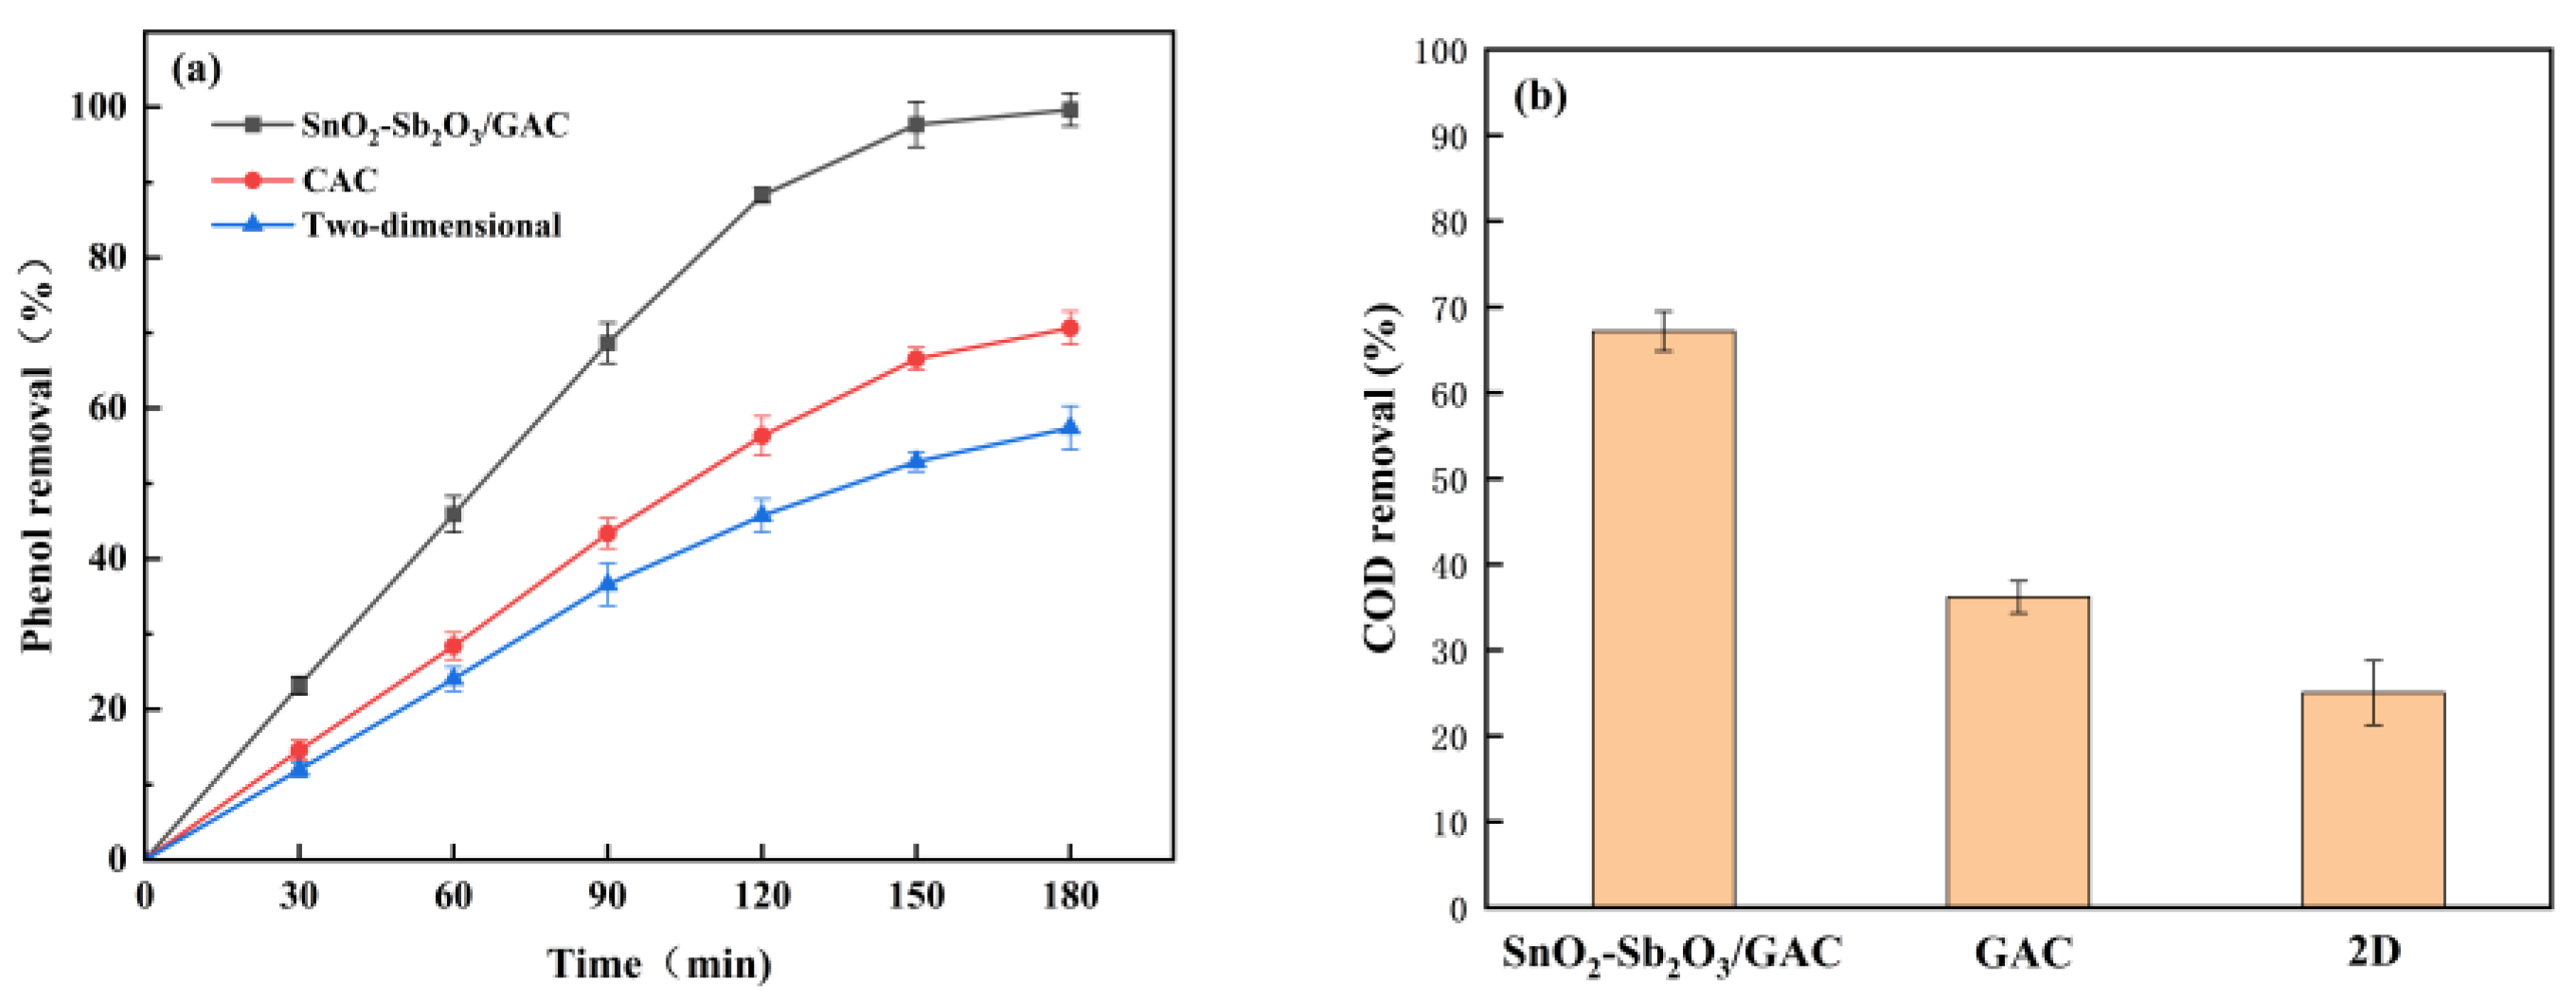
3.4. Comparison of Treatment Effects between the 2D and 3D Electrode Systems

To further verify the superiority of these particle electrodes prepared in this experiment, the 2D electrode system was compared with the 3D electrode system with untreated activated carbon and SnO2-Sb2O3/GAC as particle electrodes in the treatment of simulated phenol wastewater.
As shown in Figure 7, after three hours of degradation under the same conditions, the removal rates of phenol and COD in the 3D electrode system were higher than that in the 2D electrode system. The removal rates of phenol and COD in the 3D electrode reactor filled with SnO2-Sb2O3/GAC particle electrodes increased by 31.68% and 42.26%, respectively, compared with the blank GAC 3D electrode reactor. In addition, the removal rate of phenol and COD in the 3D electrode reactor filled with SnO2-Sb2O3/GAC particle electrodes increased by 30.98% and 42.14%, respectively, compared with the 2D electrode reactor. This can be mainly attributed to the filling particle electrodes increasing the surface area of the reaction, causing phenol to be rapidly adsorbed to the surface of the particle electrode in the initial duration, which led to electrocatalytic oxidation. In addition, numerous phenol components were removed in a short time. Meanwhile, adding particle electrodes greatly shortened the mass transfer distance between electrodes and organic pollutants, which contributed to faster mass transfer.

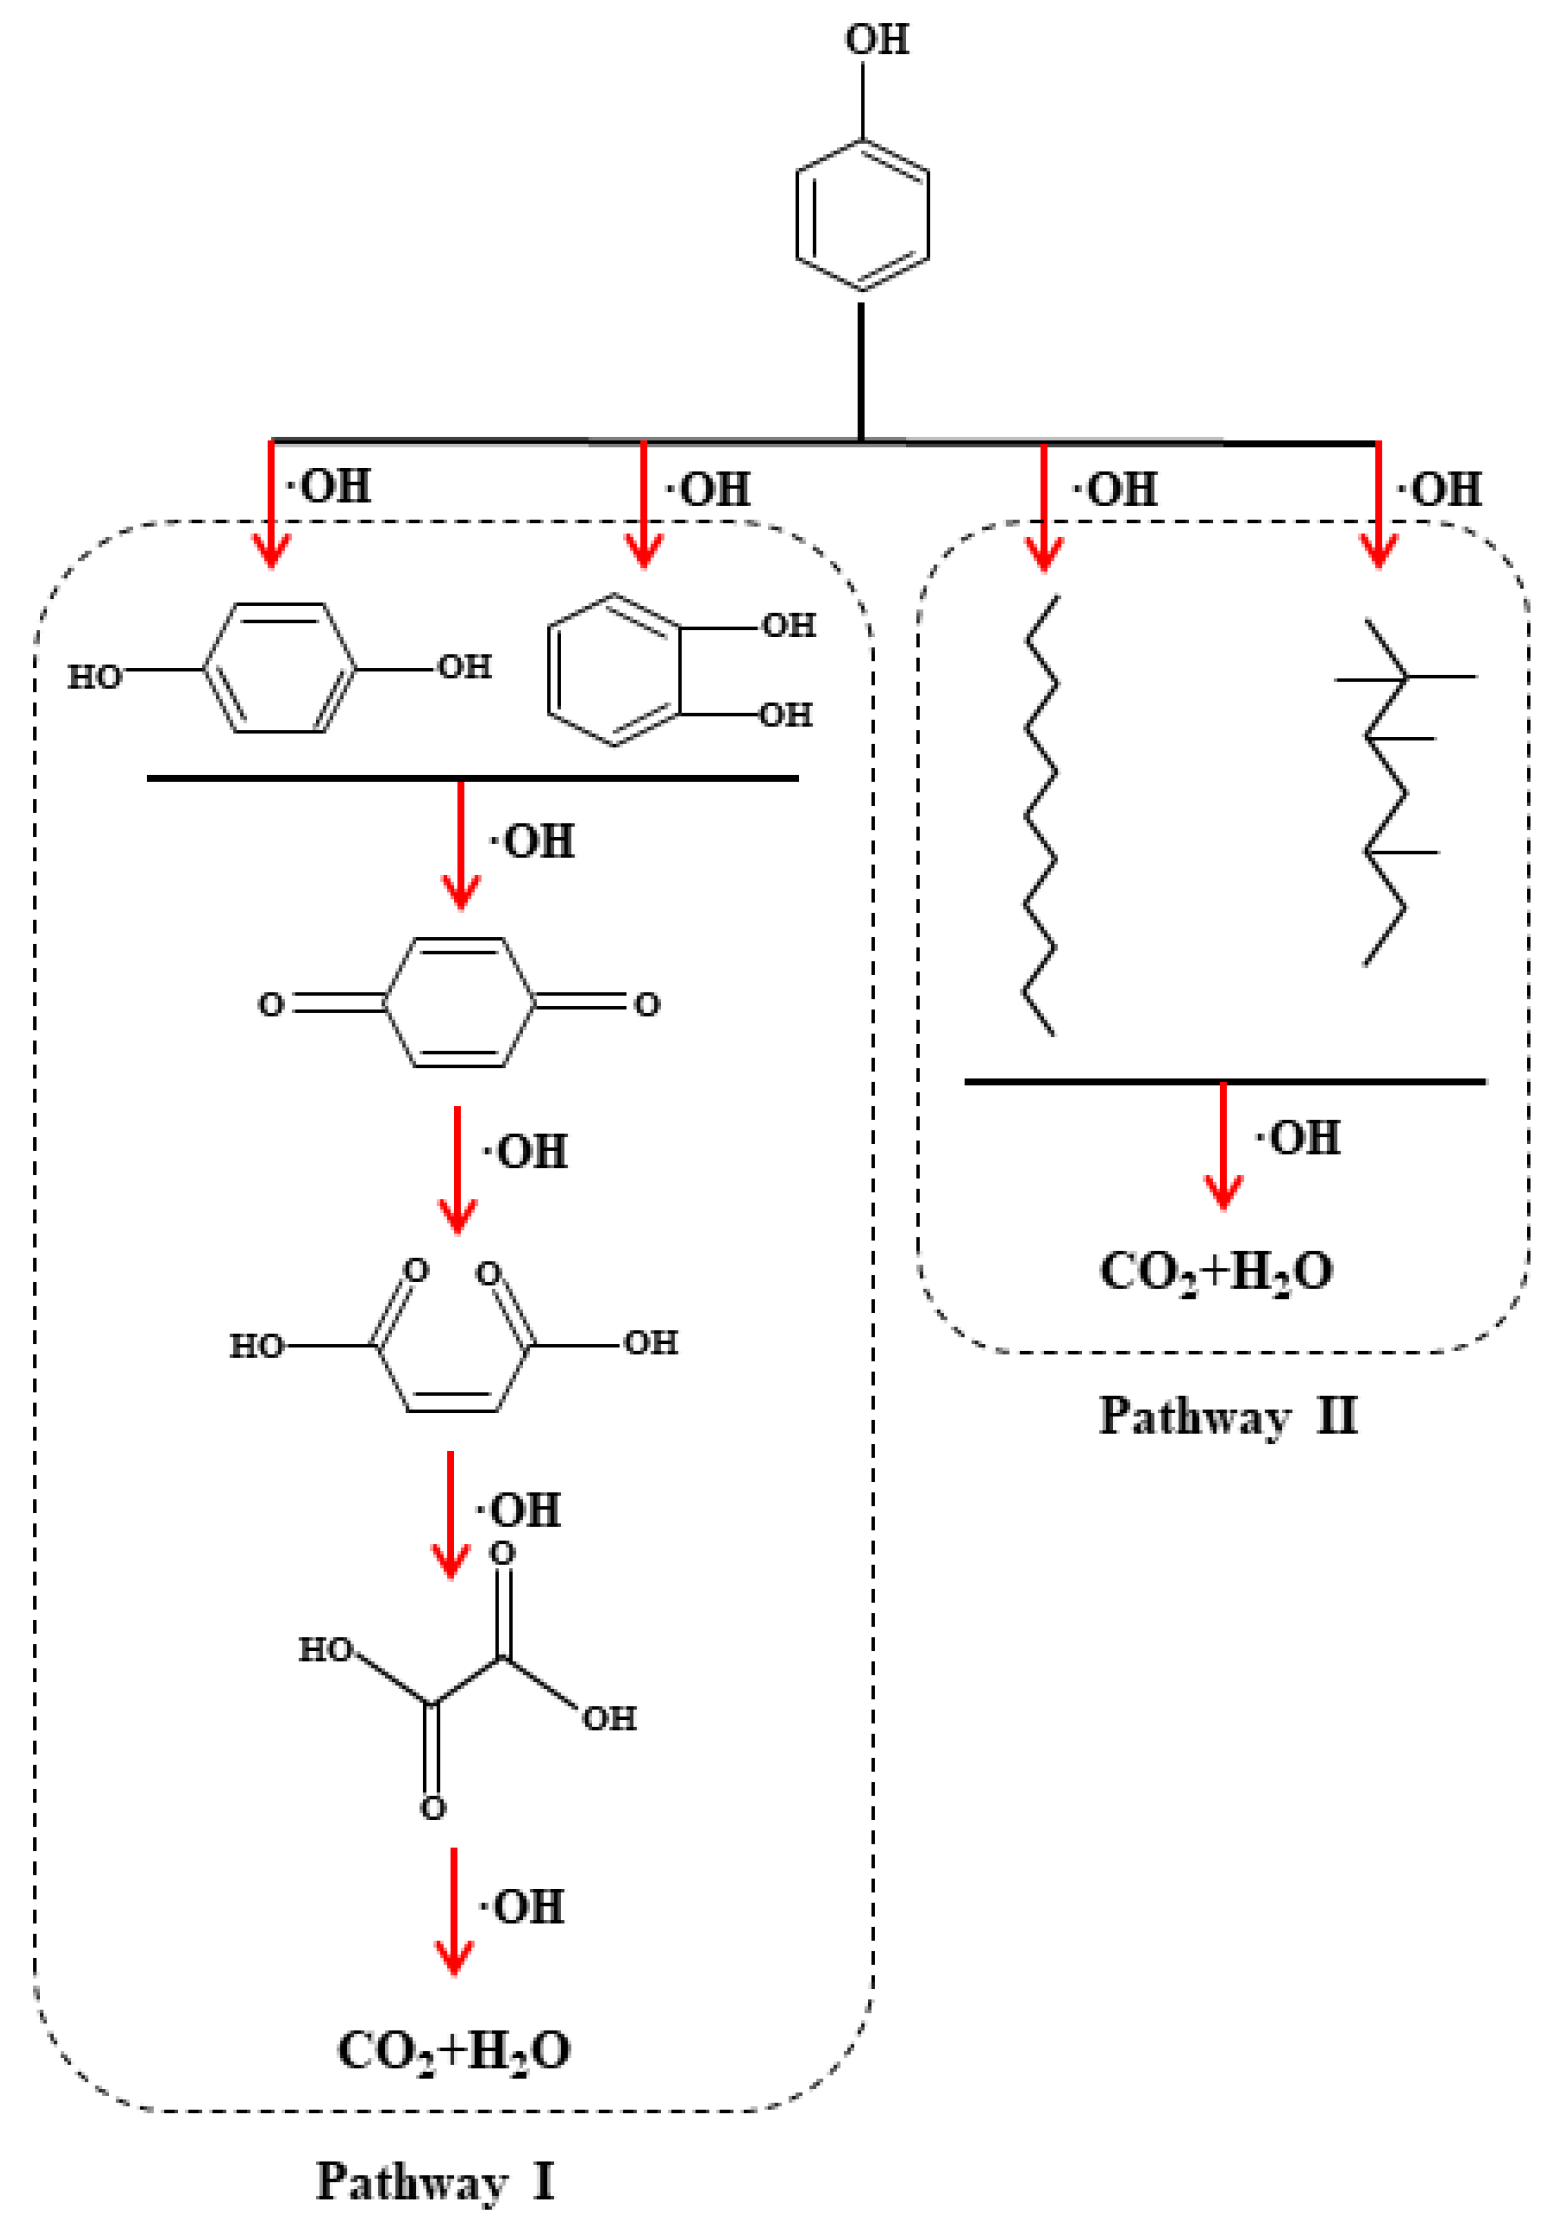
3.5. Mechanism of Phenol Degradation by the 3D Electrode System

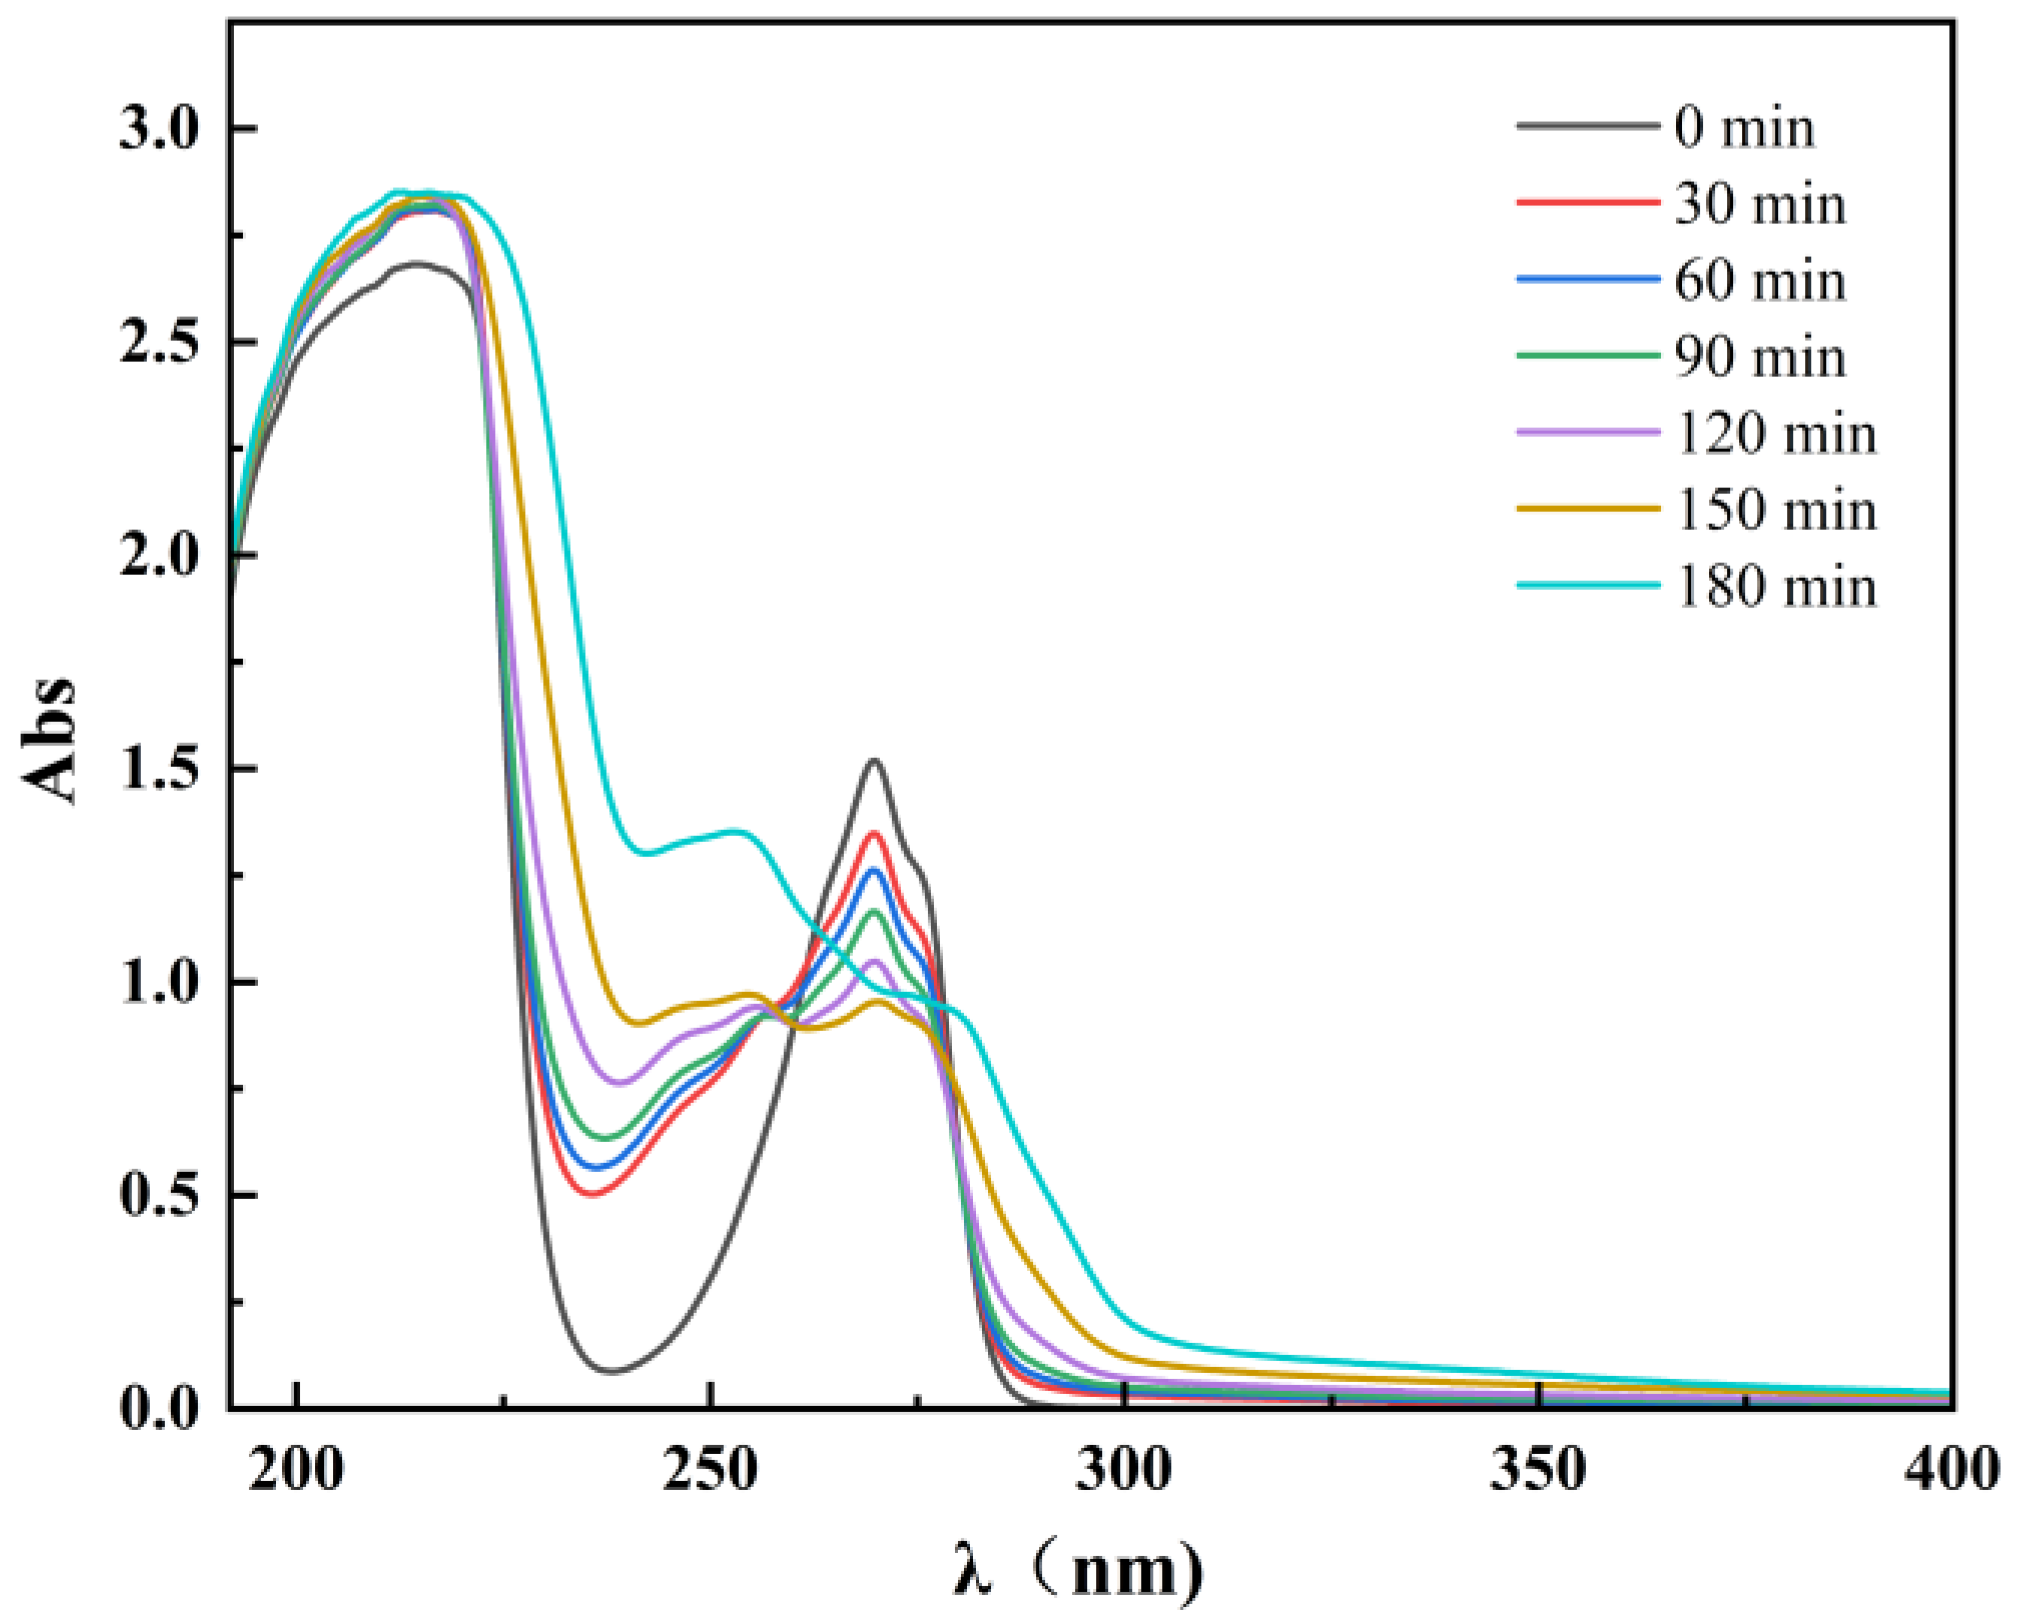
3.5.1. Ultraviolet–Visible Spectrum Analysis

To understand the degradation characteristics of phenol, phenol was treated under the optimal experimental conditions determined in the above experiment. The water sample was scanned by full-wavelength ultraviolet to plot the ultraviolet–visible absorption spectrum, as shown in Figure 8.
It can be seen from Figure 8 that the simulated phenol wastewater had two obvious absorption peaks at 215 nm and 269.5 nm, which corresponded to E band and B band of aromatic compounds, respectively [33]. At 0 min, the phenol solution had a minimum absorption peak at 215 nm in the E absorption band, which reflected the π → π* transition of the conjugated diene in the benzene ring. The absorption peak of the phenol solution at 215 nm increased with the increase of the degradation time. This was due to the formation of intermediate products during the electrochemical oxidation of phenol. With the increase in the degradation time, the intermediate products accumulated continuously, and hence the absorption peak increased gradually. At 0 min, the maximum absorption peak of the phenol solution at 269.5 nm was located in the B absorption band, which was caused by the π-π* electron transition from the conjugated system containing the benzene ring and the overlapping with the vibration effect. With the increase of the degradation time, the peak at 269.5 nm of the phenol solution decreased gradually, which indicated that the structure of the benzene ring was gradually destroyed. The conjugate system of the benzene ring broke bonds and resulted in ring opening, and the intermediate or final products of the ring opening presented no absorption in the ultraviolet region. Hence, the absorbance value decreased, which confirmed that phenol in the solution was gradually degraded.

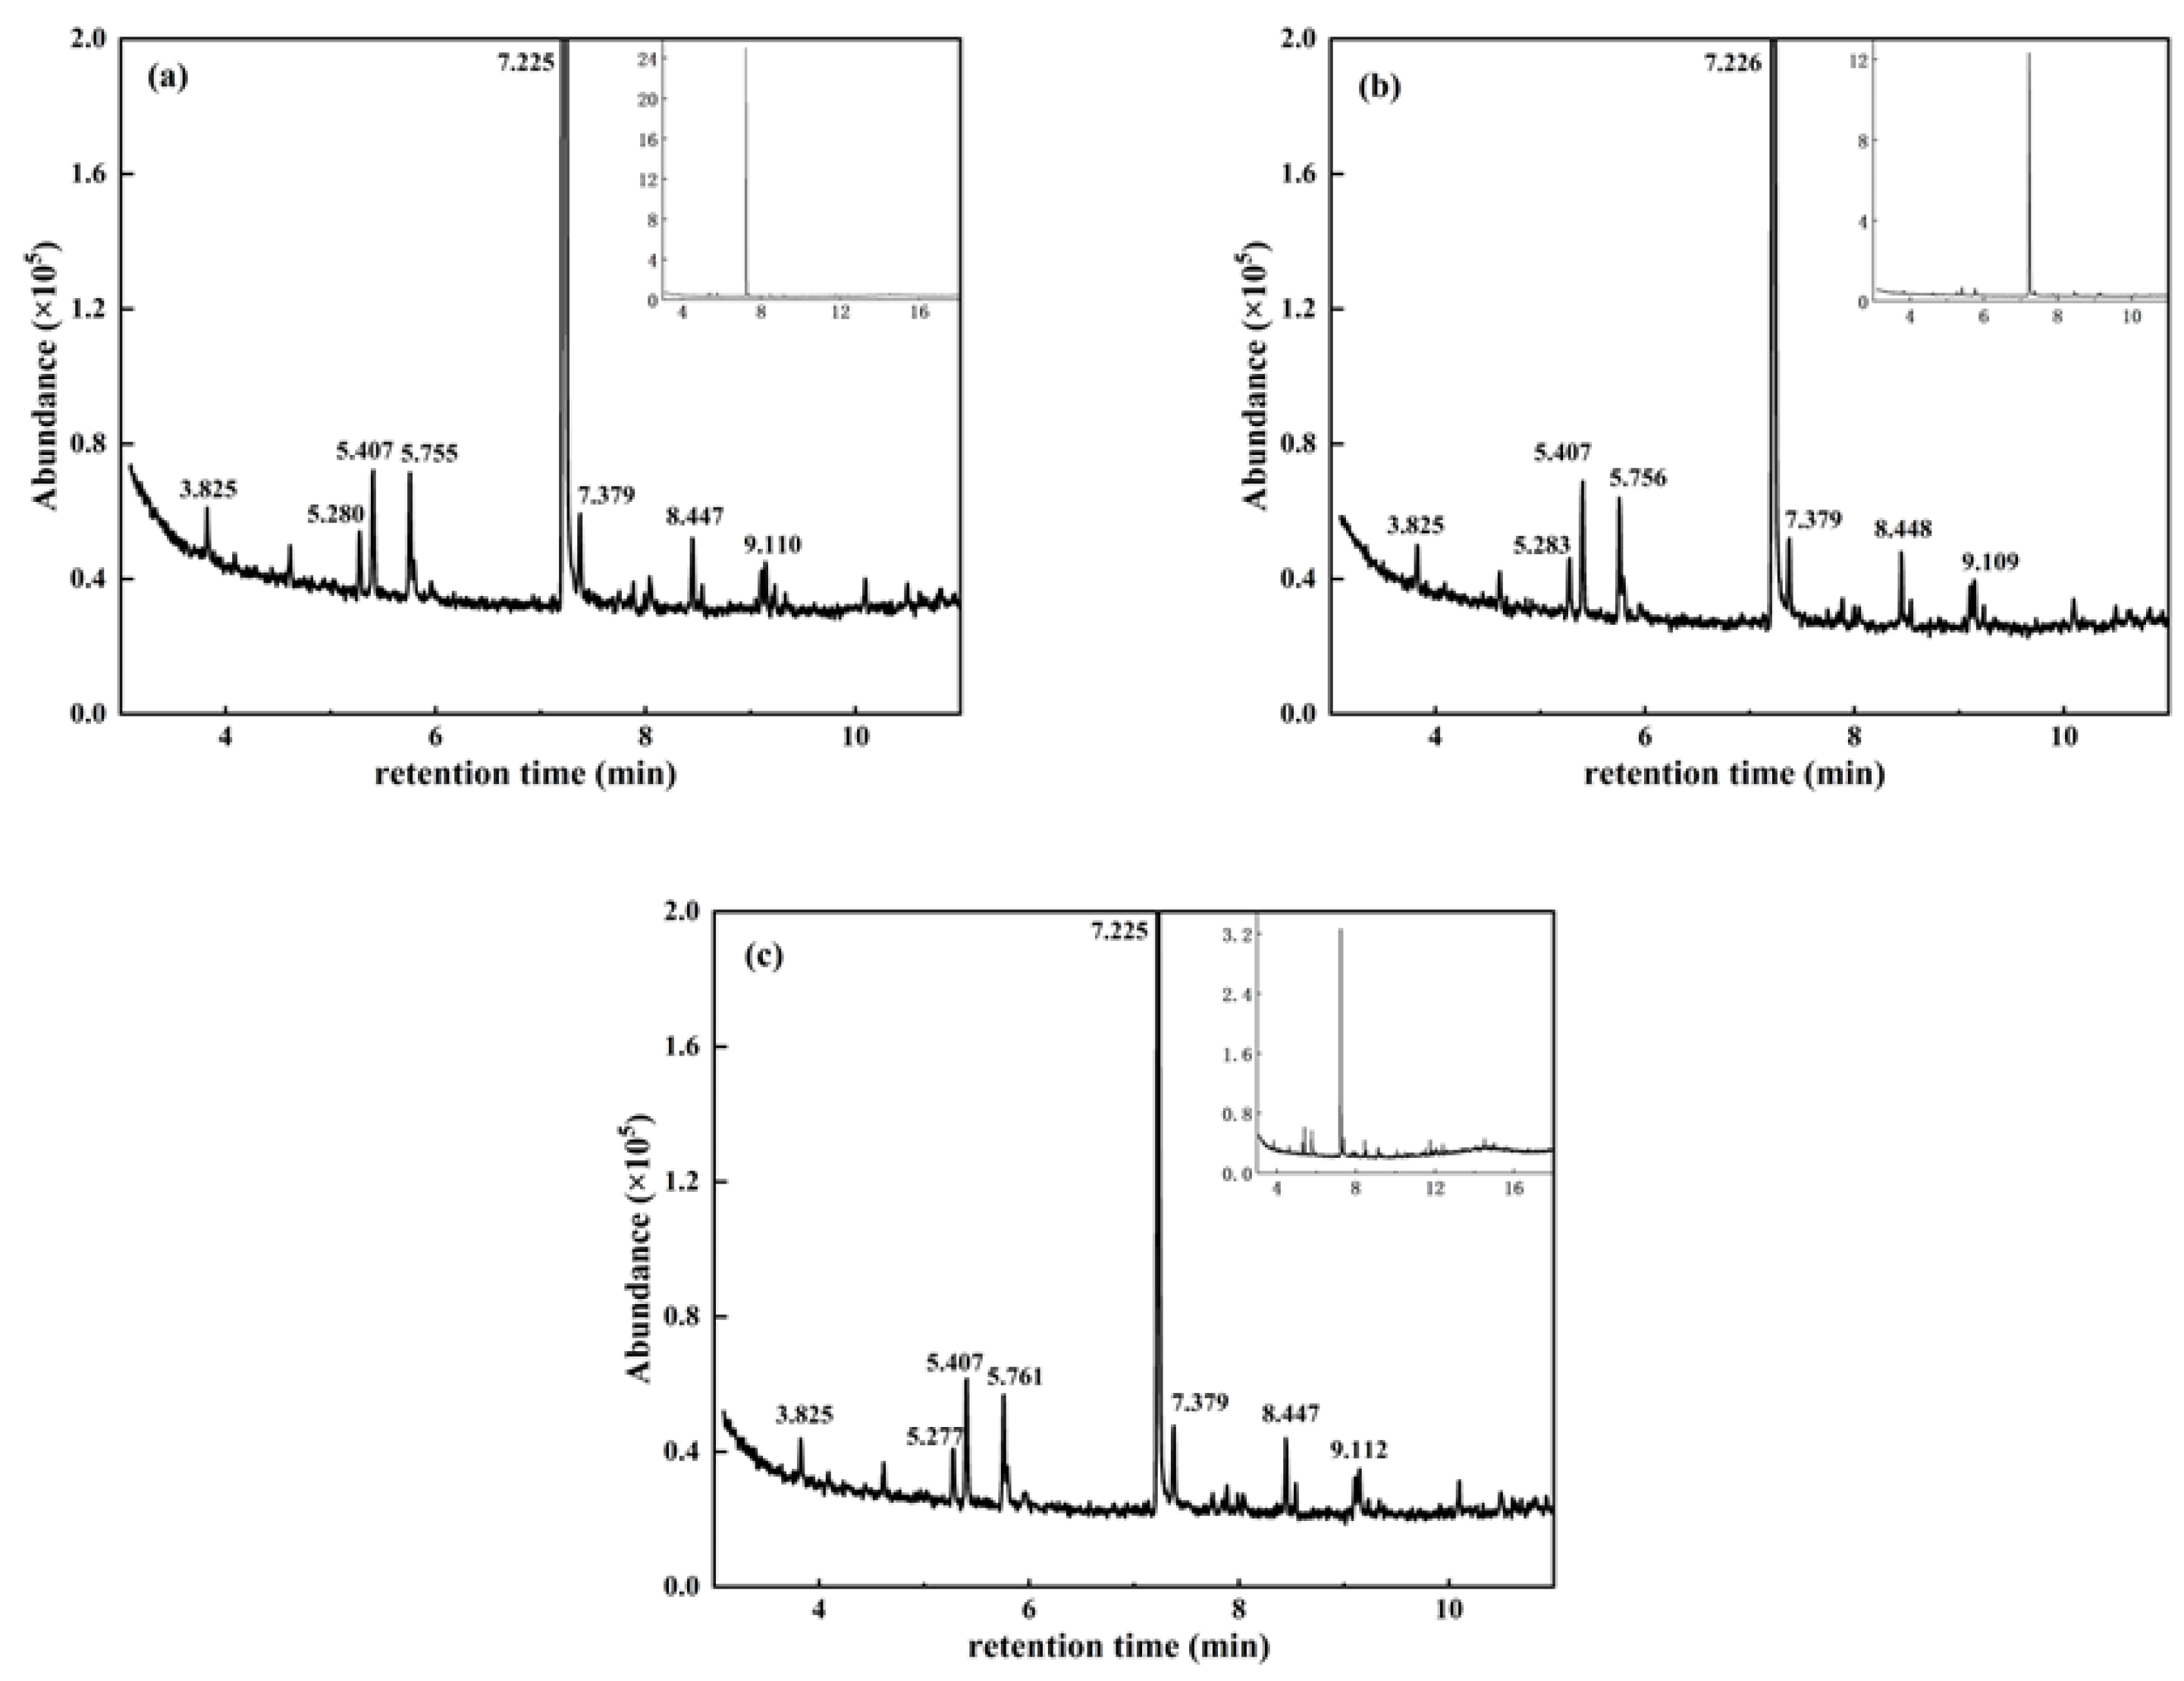
3.5.2. GC-MS Analysis of the Phenol Degradation Process

The intermediate products during phenol degradation were analyzed by gas chromatography–mass spectrometry (GC-MS). The water samples were collected at the degradation time points of 60 min, 120 min, and 180 min and then analyzed by GC-MS. In addition, the Agilent DB-5 capillary column (30 m, 0.25 mm, and 0.25 μm) was used in the GC-MS analysis. The analysis was performed at the column temperature of 30 °C (for 1 min), which was raised to 150 ℃ at 10 °C/min, and then raised to 300 °C at 12 °C/min (for 5 min). The capillary column was set as the carrier gas source, with the flow rate being 1 mL/min. The EI ionization source was used as the mass spectrometry detector, with the ionization voltage being 70 eV, the ionization source temperature being 230 °C, the quadrupole being 150 degrees, and the charge-to-mass ratio within 30–550 m/z. The analysis results are shown in Figure 9.
The intermediate products of phenol degradation were detected by GC-MS and compared with the mass spectrometry standard library NIST. The possible intermediate products during phenol degradation were listed in Table 2.
The possible degradation routes of phenol were analyzed and discussed according to the analysis results of intermediate products during phenol degradation. In the 3D electrode system, the possible degradation of phenol can be divided into two routes. The first route was that ·OH attacked phenol and oxidized it to benzoquinone and polyhydroxy phenols. Subsequently, ·OH continued to react with carbon–carbon double bonds to form an addition reaction. After that, the benzene ring was opened to form small molecular organic acids, which were mineralized to form CO2 and H2O. The second route was that phenol was directly ring-opened under the action of ·OH to form unstable chain products, such as heptane, and then degraded into CO2 and H2O. According to the analysis of this section and the results of other studies [34,35,36], the main degradation routes of phenol can be inferred, as shown in Figure 10.

4. Conclusions

In this study, SnO2-Sb2O3/GAC particle electrodes were prepared by the impregnation–calcination method. When the initial pH was 3, the electrolytic voltage was 15 V, the Na2SO4 electrolyte concentration was 0.075 mol/L, the initial phenol concentration was 100 mg/L, and the particle electrode dosage was 30 g/L, the optimal effects could be achieved. Under these conditions, the maximum removal rates of phenol and COD were 99.65% and 67.16%, respectively, which were much higher than those of the blank GAC and 2D electrode systems. Under the action of these novel SnO2-Sb2O3/GAC particle electrodes from 15 trials of repeated electrolysis, the removal rate of phenol decreased from 99.65% to 94.56%, and that of COD decreased from 67.16% to 62.27%. The removal rate of phenol and COD decreased by 3.76% and 4.89%, respectively, which verified the favorable long-term stability of these SnO2-Sb2O3/GAC particle electrodes. Therefore, the 3D electrode system was validated as an environmentally friendly and efficient wastewater treatment method. This method is expected to have extensive application in the field of refractory wastewater treatment in the future.

Supplementary Materials

The following supporting information can be downloaded at: https://www.mdpi.com/article/10.3390/w15101844/s1, Figure S1: Phenol standard curve.

Author Contributions

Y.P.: Methodology, Validation, Formal analysis, Investigation, Resources, Data curation, Visualization, Writing-Original draft. F.Z.: Investigation, Resources, Data curation. Y.C.: Investigation, Resources, Data curation. X.L.: Writing—review and editing, Supervision. H.Y.: Writing—review and editing, Supervision. X.T.: Conceptualization, Validation, Writing-review & editing, Supervision, Project administration, Funding acquisition. All authors have read and agreed to the published version of the manuscript.

Funding

This work was supported by the National Natural Science Foundation of China (No. 21806126) and the Fundamental Research Funds for the Central Universities (WUT.2019IVB031).

Data Availability Statement

Not applicable.

Conflicts of Interest

The authors declare no conflict of interest.

References

  1. Brillas, E.; Garcia-Segura, S. Benchmarking recent advances and innovative technology approaches of Fenton, photo-Fenton, electro-Fenton, and related processes: A review on the relevance of phenol as model molecule. Sep. Purif. Technol. 2020, 237, 116337. [Google Scholar] [CrossRef]
  2. Li, H.; Meng, F.; Duan, W.; Lin, Y.; Zheng, Y. Biodegradation of phenol in saline or hypersaline environments by bacteria: A review. Ecotoxicol. Environ. Saf. 2019, 184, 109658. [Google Scholar] [CrossRef] [PubMed]
  3. Scott, T.; Zhao, H.; Deng, W.; Feng, X.; Li, Y. Photocatalytic degradation of phenol in water under simulated sunlight by an ultrathin MgO coated Ag/TiO2 nanocomposite. Chemosphere 2019, 216, 1–8. [Google Scholar] [CrossRef] [PubMed]
  4. Ding, Y.; Li, Z.; Jiang, W.; Yuan, B.; Huang, T.; Wang, L.; Tang, J. Degradation of phenol using a peroxidase mimetic catalyst through conjugating deuterohemin-peptide onto metal-organic framework with enhanced catalytic activity. Catal. Commun. 2020, 134, 105859. [Google Scholar] [CrossRef]
  5. Ahmed, S.; Rasul, M.G.; Martens, W.N.; Brown, R.; Hashib, M.A. Heterogeneous photocatalytic degradation of phenols in wastewater: A review on current status and developments. Desalination 2010, 261, 3–18. [Google Scholar] [CrossRef]
  6. Xiong, Y.; He, C.; Karlsson, H.T.; Zhu, X. Performance of three-phase three-dimensional electrode reactor for the reduction of COD in simulated wastewater-containing phenol. Chemosphere 2003, 50, 131–136. [Google Scholar] [CrossRef]
  7. Duan, W.; Meng, F.; Cui, H.; Lin, Y.; Wang, G.; Wu, J. Ecotoxicity of phenol and cresols to aquatic organisms: A review. Ecotoxicol. Environ. Saf. 2018, 157, 441–456. [Google Scholar] [CrossRef]
  8. Mortada, W.I.; Mohamed, R.A.; Monem, A.A.A.; Awad, M.M.; Hassan, A.F. Effective and Low-Cost Adsorption Procedure for Removing Chemical Oxygen Demand from Wastewater Using Chemically Activated Carbon Derived from Rice Husk. Separations 2023, 10, 43. [Google Scholar] [CrossRef]
  9. Martínez-Huitle, C.A.; Ferro, S. Electrochemical oxidation of organic pollutants for the wastewater treatment: Direct and indirect processes. Chem. Soc. Rev. 2006, 35, 1324–1340. [Google Scholar] [CrossRef]
  10. Jung, K.-W.; Hwang, M.-J.; Park, D.-S.; Ahn, K.-H. Performance evaluation and optimization of a fluidized three-dimensional electrode reactor combining pre-exposed granular activated carbon as a moving particle electrode for greywater treatment. Sep. Purif. Technol. 2015, 156, 414–423. [Google Scholar] [CrossRef]
  11. He, Y.; Lin, H.; Guo, Z.; Zhang, W.; Li, H.; Huang, W. Recent developments and advances in boron-doped diamond electrodes for electrochemical oxidation of organic pollutants. Sep. Purif. Technol. 2019, 212, 802–821. [Google Scholar] [CrossRef]
  12. Martínez-Huitle, C.A.; Panizza, M. Electrochemical oxidation of organic pollutants for wastewater treatment. Curr. Opin. Electrochem. 2018, 11, 62–71. [Google Scholar] [CrossRef]
  13. Quang, H.H.P.; Nguyen, T.P.; Nguyen, D.D.D.; Bao, L.T.N.; Nguyen, V.-H. Advanced electro-Fenton degradation of a mixture of pharmaceutical and steel industrial wastewater by pallet-activated-carbon using three-dimensional electrode reactor. Chemosphere 2022, 297, 134074. [Google Scholar] [CrossRef] [PubMed]
  14. Bu, J.; Deng, Z.; Liu, H.; Li, T.; Yang, Y.; Zhong, S. Bimetallic modified halloysite particle electrode enhanced electrocatalytic oxidation for the degradation of sulfanilamide. J. Environ. Manag. 2022, 312, 114975. [Google Scholar] [CrossRef]
  15. Xiao, M.; Zhang, Y. Electro-catalytic oxidation of phenacetin with a three-dimensional reactor: Degradation pathway and removal mechanism. Chemosphere 2016, 152, 17–22. [Google Scholar] [CrossRef]
  16. Li, X.-Y.; Xu, J.; Cheng, J.-P.; Feng, L.; Shi, Y.-F.; Ji, J. TiO2-SiO2/GAC particles for enhanced electrocatalytic removal of acid orange 7 (AO7) dyeing wastewater in a three-dimensional electrochemical reactor. Sep. Purif. Technol. 2017, 187, 303–310. [Google Scholar] [CrossRef]
  17. Pedersen, N.L.; Fini, M.N.; Molnar, P.K.; Muff, J. Synergy of combined adsorption and electrochemical degradation of aqueous organics by granular activated carbon particulate electrodes. Sep. Purif. Technol. 2019, 208, 51–58. [Google Scholar] [CrossRef]
  18. Sun, W.; Sun, Y.; Shah, K.J.; Zheng, H.; Ma, B. Electrochemical degradation of oxytetracycline by Ti-Sn-Sb/γ-Al2O3 three-dimensional electrodes. J. Environ. Manag. 2019, 241, 22–31. [Google Scholar] [CrossRef]
  19. Zhang, C.; Jiang, Y.; Li, Y.; Hu, Z.; Zhou, L.; Zhou, M. Three-dimensional electrochemical process for wastewater treatment: A general review. Chem. Eng. J. 2013, 228, 455–467. [Google Scholar] [CrossRef]
  20. Zhan, J.; Li, Z.; Yu, G.; Pan, X.; Wang, J.; Zhu, W.; Han, X.; Wang, Y. Enhanced treatment of pharmaceutical wastewater by combining three-dimensional electrochemical process with ozonation to in situ regenerate granular activated carbon particle electrodes. Sep. Purif. Technol. 2019, 208, 12–18. [Google Scholar] [CrossRef]
  21. Ji, J.; Liu, Y.; Yang, X.-Y.; Xu, J.; Li, X.-Y. Multiple response optimization for high efficiency energy saving treatment of rhodamine B wastewater in a three-dimensional electrochemical reactor. J. Environ. Manag. 2018, 218, 300–308. [Google Scholar] [CrossRef] [PubMed]
  22. Mahardika, D.; Park, H.-S.; Choo, K.-H. Ferrihydrite-impregnated granular activated carbon (FH@GAC) for efficient phosphorus removal from wastewater secondary effluent. Chemosphere 2018, 207, 527–533. [Google Scholar] [CrossRef] [PubMed]
  23. Morales, F.L.; Zayas, T.; Contreras, O.E.; Salgado, L. Effect of Sn precursor on the synthesis of SnO2 and Sb-doped SnO2 particles via polymeric precursor method. Front. Mater. Sci. 2013, 7, 387–395. [Google Scholar] [CrossRef]
  24. Fockedey, E.; Van Lierde, A. Coupling of anodic and cathodic reactions for phenol electro-oxidation using three-dimensional electrodes. Water Res. 2002, 36, 4169–4175. [Google Scholar] [CrossRef] [PubMed]
  25. Sun, Y.; Li, P.; Zheng, H.; Zhao, C.; Xiao, X.; Xu, Y.; Sun, W.; Wu, H.; Ren, M. Electrochemical treatment of chloramphenicol using Ti-Sn/γ-Al2O3 particle electrodes with a three-dimensional reactor. Chem. Eng. J. 2017, 308, 1233–1242. [Google Scholar] [CrossRef]
  26. Oliveira, R.; Bento, F.; Geraldo, D. Aromatic hydroxylation reactions by electrogenerated HO radicals: A kinetic study. J. Electroanal. Chem. 2012, 682, 7–13. [Google Scholar] [CrossRef]
  27. An, T.-C.; Zhu, X.-H.; Xiong, Y. Feasibility study of photoelectrochemical degradation of methylene blue with three-dimensional electrode-photocatalytic reactor. Chemosphere 2002, 46, 897–903. [Google Scholar] [CrossRef]
  28. Wang, Z.; Song, B.; Li, J.; Teng, X. Degradation of norfloxacin wastewater using kaolin/steel slag particle electrodes: Performance, mechanism and pathway. Chemosphere 2021, 270, 128652. [Google Scholar] [CrossRef]
  29. Jia, Z.; Zhao, X.; Yu, C.; Wan, Q.; Liu, Y. Design and properties of Sn–Mn–Ce supported activated carbon composite as particle electrode for three-dimensionally electrochemical degradation of phenol. Environ. Technol. Innov. 2021, 23, 101554. [Google Scholar] [CrossRef]
  30. Liu, S.; Wang, Z.; Li, J.; Zhao, C.; He, X.; Yang, G. Fabrication of slag particle three-dimensional electrode system for methylene blue degradation: Characterization, performance and mechanism study. Chemosphere 2018, 213, 377–383. [Google Scholar] [CrossRef]
  31. Zheng, Y.; Qiu, S.; Deng, F.; Zhu, Y.; Li, G.; Ma, F. Three-dimensional electro-Fenton system with iron foam as particle electrode for folic acid wastewater pretreatment. Sep. Purif. Technol. 2019, 224, 463–474. [Google Scholar] [CrossRef]
  32. Wang, L.; Hu, Y.; Li, P.; Zhang, Y.; Yan, Q.; Zhao, Y. Electrochemical treatment of industrial wastewater using a novel layer-upon-layer bipolar electrode system (nLBPEs). Chem. Eng. J. 2013, 215–216, 157–161. [Google Scholar] [CrossRef]
  33. Lv, G.; Wu, D.; Fu, R. Performance of carbon aerogels particle electrodes for the aqueous phase electro-catalytic oxidation of simulated phenol wastewaters. J. Hazard. Mater. 2009, 165, 961–966. [Google Scholar] [CrossRef] [PubMed]
  34. Nady, H.; El-Rabiei, M.; El-Hafez, G.A. Electrochemical oxidation behavior of some hazardous phenolic compounds in acidic solution. Egypt. J. Pet. 2017, 26, 669–678. [Google Scholar] [CrossRef]
  35. Li, X.-Y.; Cui, Y.-H.; Feng, Y.-J.; Xie, Z.-M.; Gu, J.-D. Reaction pathways and mechanisms of the electrochemical degradation of phenol on different electrodes. Water Res. 2005, 39, 1972–1981. [Google Scholar] [CrossRef]
  36. Yoon, J.-H.; Shim, Y.-B.; Lee, B.-S.; Choi, S.-Y.; Won, M.-S. Electrochemical degradation of phenol and 2-chloro phenol using Pt/Ti and boron-doped diamond electrodes. Bull. Korean Chem. Soc. 2012, 33, 2274–2278. [Google Scholar] [CrossRef]
Figure 1. Reactor configuration of (a) 2D; (b) 3D.
Water 15 01844 g001
Figure 2. (ac) SEM images for blank GAC; (df) SEM images for SnO2-Sb2O3/GAC particle electrodes; (gi) SEM images of SnO2-Sb2O3/GAC particle electrodes after 15 repeated uses.
Water 15 01844 g002
Figure 3. XRD patterns of SnO2-Sb2O3/GAC particle electrodes.
Water 15 01844 g003
Figure 4. LSV curve for blank GAC and SnO2-Sb2O3/GAC particle electrodes (pH 7, scan rate 5 mV/s).
Water 15 01844 g004
Figure 5. (a,b) Effect of initial pH; (c,d) electrolytic voltage; (e,f) electrolyte concentration; (g,h) initial phenol concentration; (i,j) particle electrode dosage on the removal of phenol and COD.
Water 15 01844 g005aWater 15 01844 g005b
Figure 6. Effect of operation times on degradation of phenol.
Water 15 01844 g006
Figure 7. Effect of 2D and 3D electrode systems on (a) phenol and (b) COD removal.
Water 15 01844 g007
Figure 8. Ultraviolet–visible spectrum analysis at different electrolytic times.
Water 15 01844 g008
Figure 9. Chromatogram of intermediates at different degradation times (a) 60 min; (b) 120 min; (c) 180 min.
Water 15 01844 g009
Figure 10. Possible pathways for the degradation of phenol in the 3D electrode system.
Water 15 01844 g010
Table 1. Pore structure parameters and specific surface area of particle electrodes.
SamplePore Size (nm)Pore Volume (cm3/g)Specific Surface Area (m2/g)
blank GAC10.24570.1263978.3
SnO2-Sb2O3/GAC8.69330.0779769.5
Table 2. GC-MS data on possible intermediate products during phenol degradation by the 3D electrode system.
SNRetention TimeIntermediate ProductsChemical StructureFormula
13.825TolueneC7H8Water 15 01844 i001
24.091Oxalic acidC2H2O4Water 15 01844 i002
35.283HydroquinoneC6H6O2Water 15 01844 i003
45.407o-diphenolC6H6O2Water 15 01844 i004
55.755StyreneC8H8Water 15 01844 i005
65.968BenzoquinoneC6H4O2Water 15 01844 i006
77.225PhenolC6H6OWater 15 01844 i007
87.3792,2,3,5-tetramethylC11H24Water 15 01844 i008
98.0403-hydroxybenzyl alcoholC7H8O2Water 15 01844 i009
108.448Maleic acidC4H4O4Water 15 01844 i010
119.109UndecaneC11H24Water 15 01844 i011
Disclaimer/Publisher’s Note: The statements, opinions and data contained in all publications are solely those of the individual author(s) and contributor(s) and not of MDPI and/or the editor(s). MDPI and/or the editor(s) disclaim responsibility for any injury to people or property resulting from any ideas, methods, instructions or products referred to in the content.

