
Extensive Green Roofs: Different Time Approaches to Runoff Coefficient Determination

1
CBQF—Centro de Biotecnologia e Química Fina–Laboratório Associado, Escola Superior de Biotecnologia, Universidade Católica Portuguesa, Rua Diogo Botelho 1327, 4169-005 Porto, Portugal
2
Faculdade de Engenharia, Universidade do Porto, Rua Dr. Roberto Frias s/n, 4200-465 Porto, Portugal
3
CIIMAR—Centro Interdisciplinar de Investigação Marinha e Ambiental, Terminal de Cruzeiros de Leixões, Av. General Norton de Matos s/n, 4450-208 Matosinhos, Portugal
*
Author to whom correspondence should be addressed.
Water 2023, 15(10), 1852; https://doi.org/10.3390/w15101852
Submission received: 6 April 2023
/
Revised: 28 April 2023
/
Accepted: 10 May 2023
/
Published: 13 May 2023
(This article belongs to the Special Issue Rainwater Harvesting and Treatment)
Abstract
:Stormwater runoff in green roofs (GRs) is represented by the runoff coefficient, which is fundamental to assess their hydraulic performance and to design the drainage systems downstream. Runoff coefficient values in newly installed GR systems should be estimated by models that must be feasible and reproduce the retention behavior as realistically as possible, being thus adjusted to each season and climate region. In this study, the suitability of a previously developed model for runoff coefficient determination is assessed using experimental data, and registered over a 1 year period. Results showed that the previously developed model does not quite fit the experimental data obtained in the present study, which was developed in a distinct year with different climate conditions, revealing the need to develop a new model with a better adjustment, and taking into consideration other variables besides temperature and precipitation (e.g., early-stage moisture conditions of the GR matrix and climate of the study area). Runoff coefficient values were also determined with different time periods (monthly, weekly, and per rain event) to assess the most adequate approach, considering the practical uses of this coefficient. The monthly determination approach resulted in lower runoff coefficient values (0–0.46) than the weekly or per rain event (0.017–0.764) determination. When applied to a long-term performance analysis, this study showed no significant differences when using the monthly, weekly, or per rain event runoff, resulting on a variation of only 0.9 m3 of annual runoff. This indicates that the use of monthly values for runoff coefficient, although not suitable for sizing drainage systems, might be used to estimate their long-term performance. Overall, this pilot extensive GR of 0.4 m2 presented an annual retention volume of 469.3 L, corresponding to a retention rate of 89.6%, in a year with a total precipitation of 1089 mm. The assessment of different time scales for runoff coefficient determination is a major contribution for future GR performance assessments, and a fundamental decision support tool.
1. Introduction
Fast urbanization over the last decades brought negative impacts to the urban environment, such as the reduction in vegetation and the increase in impervious surfaces, as buildings seal the soil. These changes disrupt the urban hydrological cycle (reducing the ability to intercept, store, and naturally infiltrate stormwater runoff) leading to a higher risk of urban flooding exacerbated by climate change [1], with catastrophic consequences in terms of casualties and economic losses [2]. On building roofs, rainwater is concentrated in volume and time, and the majority is typically directed to drainage systems, where it infiltrates into the ground or flows into sewers [3]. Urban green infrastructure (GI) can be used to reduce the amount of stormwater runoff entering drainage systems through the natural retention and absorption capabilities of vegetation and soils [1] and by promoting the infiltration of water through traditional structures. For example, permeable pavement, as an urban GI, is described as a potential alternative for stormwater runoff management in the urban environment due to their sustainability and permeability as reported by [4]. GI provides additional benefits such as increased carbon sequestration, improved air quality, urban heat island mitigation, additional wildlife habitats, and recreational space. In addition, they are often a cheaper, more robust, and sustainable solution when compared to traditional gray solutions [5].
Green roofs (GRs) are a relevant example of urban GI and are implemented worldwide as one of the best solutions to manage urban stormwater (through rainwater retention, and the delay and decrease in peak volume) which can greatly alleviate the pressure over urban drainage systems [6], besides mitigating the impacts of climate change and improve life quality into the cities. GRs ability to reduce stormwater runoff is due to the water requirements and the evapotranspiration process from vegetation and exposed surfaces, as well as the capacity to storage rainwater in their constituent layers [7,8]. GRs can be designed with either intensive, semi-intensive, or extensive planting: an intensive GR is supplied with water and nutrients and its substrate is usually thicker than 0.25 m, while an extensive GR is not irrigated and has a much shallower substrate, usually 0.06–0.15 m [6,8]. GRs with substrate depth ranging from 0.15 to 0.25 m are usually called semi-intensive.
Due to the dynamic of water flowing through the GR, substrate depth and its initial moisture have a major influence on water retention. Lee et al. [9] showed that a GR with a substrate depth of 0.20 m (intensive GR) reduced runoff by 42.8–60.8% compared to 13.8–34.4% reduction in a GR with a substrate depth of 0.15 m (extensive GR). Viola et al. [10] also explored the retention performance of GR in different climate regimes, using both intensive and extensive types. The amount of retained water increased with increasing substrate depth, because more water was allowed to be stored in the active layer and consequently evaporate from the system.
The hydraulic efficiency of GRs has been studied in the last decades, regarding rainwater retention, peak flow delay, and runoff volume discharge reduction, being the configuration of the GR system one of the key factors of its performance efficiency. For example, Zhang et al. [11] have shown a retention capacity ranging from 35.5 to 100% in an extensive GR system, which is higher than the retention resulting from an asphalt roof (0.31–18.84%). Higher retention values have been achieved by Wang et al. [12] with a dual-substrate-layer GR, with a rainfall retention performance ranging from 55.4–65.9%. At a watershed scale, simulations revealed that the implementation of GRs, covering about 10% of the total area, can lead to approximately 10–15% and 20–25% mean annual runoff reductions for extensive and intensive GRs, respectively [13]. GRs location also plays an important role in their performance regarding rainwater retention capacity and stormwater runoff, as reported by Talebi et al. [14] when studying the same GR in different regions, revealing a variation of runoff reduction from 17 to 50%, using vegetation species with low water needs. However, few studies have focused on the hydrological performance of GRs in a Mediterranean climate, classified as a subtropical dry summer climate, according the Köppen–Geiger climate classification [15], which is characterized by dry summers and mild, wet winters, leading to a seasonal effect on its runoff coefficient (dimensionless parameter that represents the reduction in stormwater runoff), pointing out the major importance of the water runoff research studies using GRs in this climate. GRs are a nature-based solution, and so they are living dynamic systems that change throughout seasons, over the year, meaning that their runoff coefficient is not constant, and, therefore, must be adjusted to each season and climate region. A proper runoff coefficient determination, as realistic as possible, is thus fundamental to correctly assess GRs performance in such climate conditions, as well as to adequately size the drainage networks downstream.
Monteiro et al. [8] developed a model for runoff coefficient prediction for extensive GRs in a Mediterranean climate, and showed that there are in fact significant variations throughout the year that advise against the use of annual average coefficients in sizing the tanks and other components of rainwater drainage and harvesting systems, for example. Their study also highlighted that runoff coefficient determination is seasonally strongly dependent and, as such, long-term monitoring and registration periods should be performed.
In sum, the determination of a GR runoff coefficient is essential to assess its retention capacity, but the nonexistence of available data to estimate its values in newly installed GR systems makes it difficult to predict their performance, especially in locations with intense seasonal climate variations. In such cases, the use of theoretical models is the only way to proceed, but it is important to make sure that they are feasible and reproduce the retention behavior of the GR.
The research work presented in this paper has two main goals. The first one is to assess and improve, if necessary, the suitability of the previously developed climate model [8] to realistically estimate the monthly runoff coefficient of a pilot GR, monitored over a 1 year period in a Mediterranean region. The need to test the model in a distinct year with a different climate pattern was imperative to assess its versatility and robustness. The use of a monthly runoff coefficient for extensive GR systems, instead of a constant value, is, by itself, a more realistic approach to design and study these structures. Different climate conditions during the year leads to significant variations of the hydric balance in the system, which affects the water retention results of the GR. However, a monthly water balance and, consequently, a monthly runoff coefficient determination do not reflect the precipitation intensity variation that occurs in such a period, where several days without precipitation or, instead, intense precipitation events may occur. These two extreme occurrences can be attenuated if the analysis period of water runoff (and consequently the runoff coefficient determination) goes beyond the occurrence of a rainfall event. Different authors have been presenting runoff coefficients using distinct time periods and the implications of such different approaches must be assessed. So, in an attempt to clarify an important question that has been under discussion in last years: “how does the time period affects the calculation of GR runoff coefficient?”, the second main goal of this study is to determine, using the present experimental data, the runoff coefficient using different time sequences (a month, a week, and per rain event) to conclude which one is the most adequate to size GR systems outflows and their drainage networks, and to determine their long-term performance.
Additionally, the rainwater retention volume and retention rate of the studied GR was also determined and compared with similar GR presented in previous studies.
2. Materials and Methods
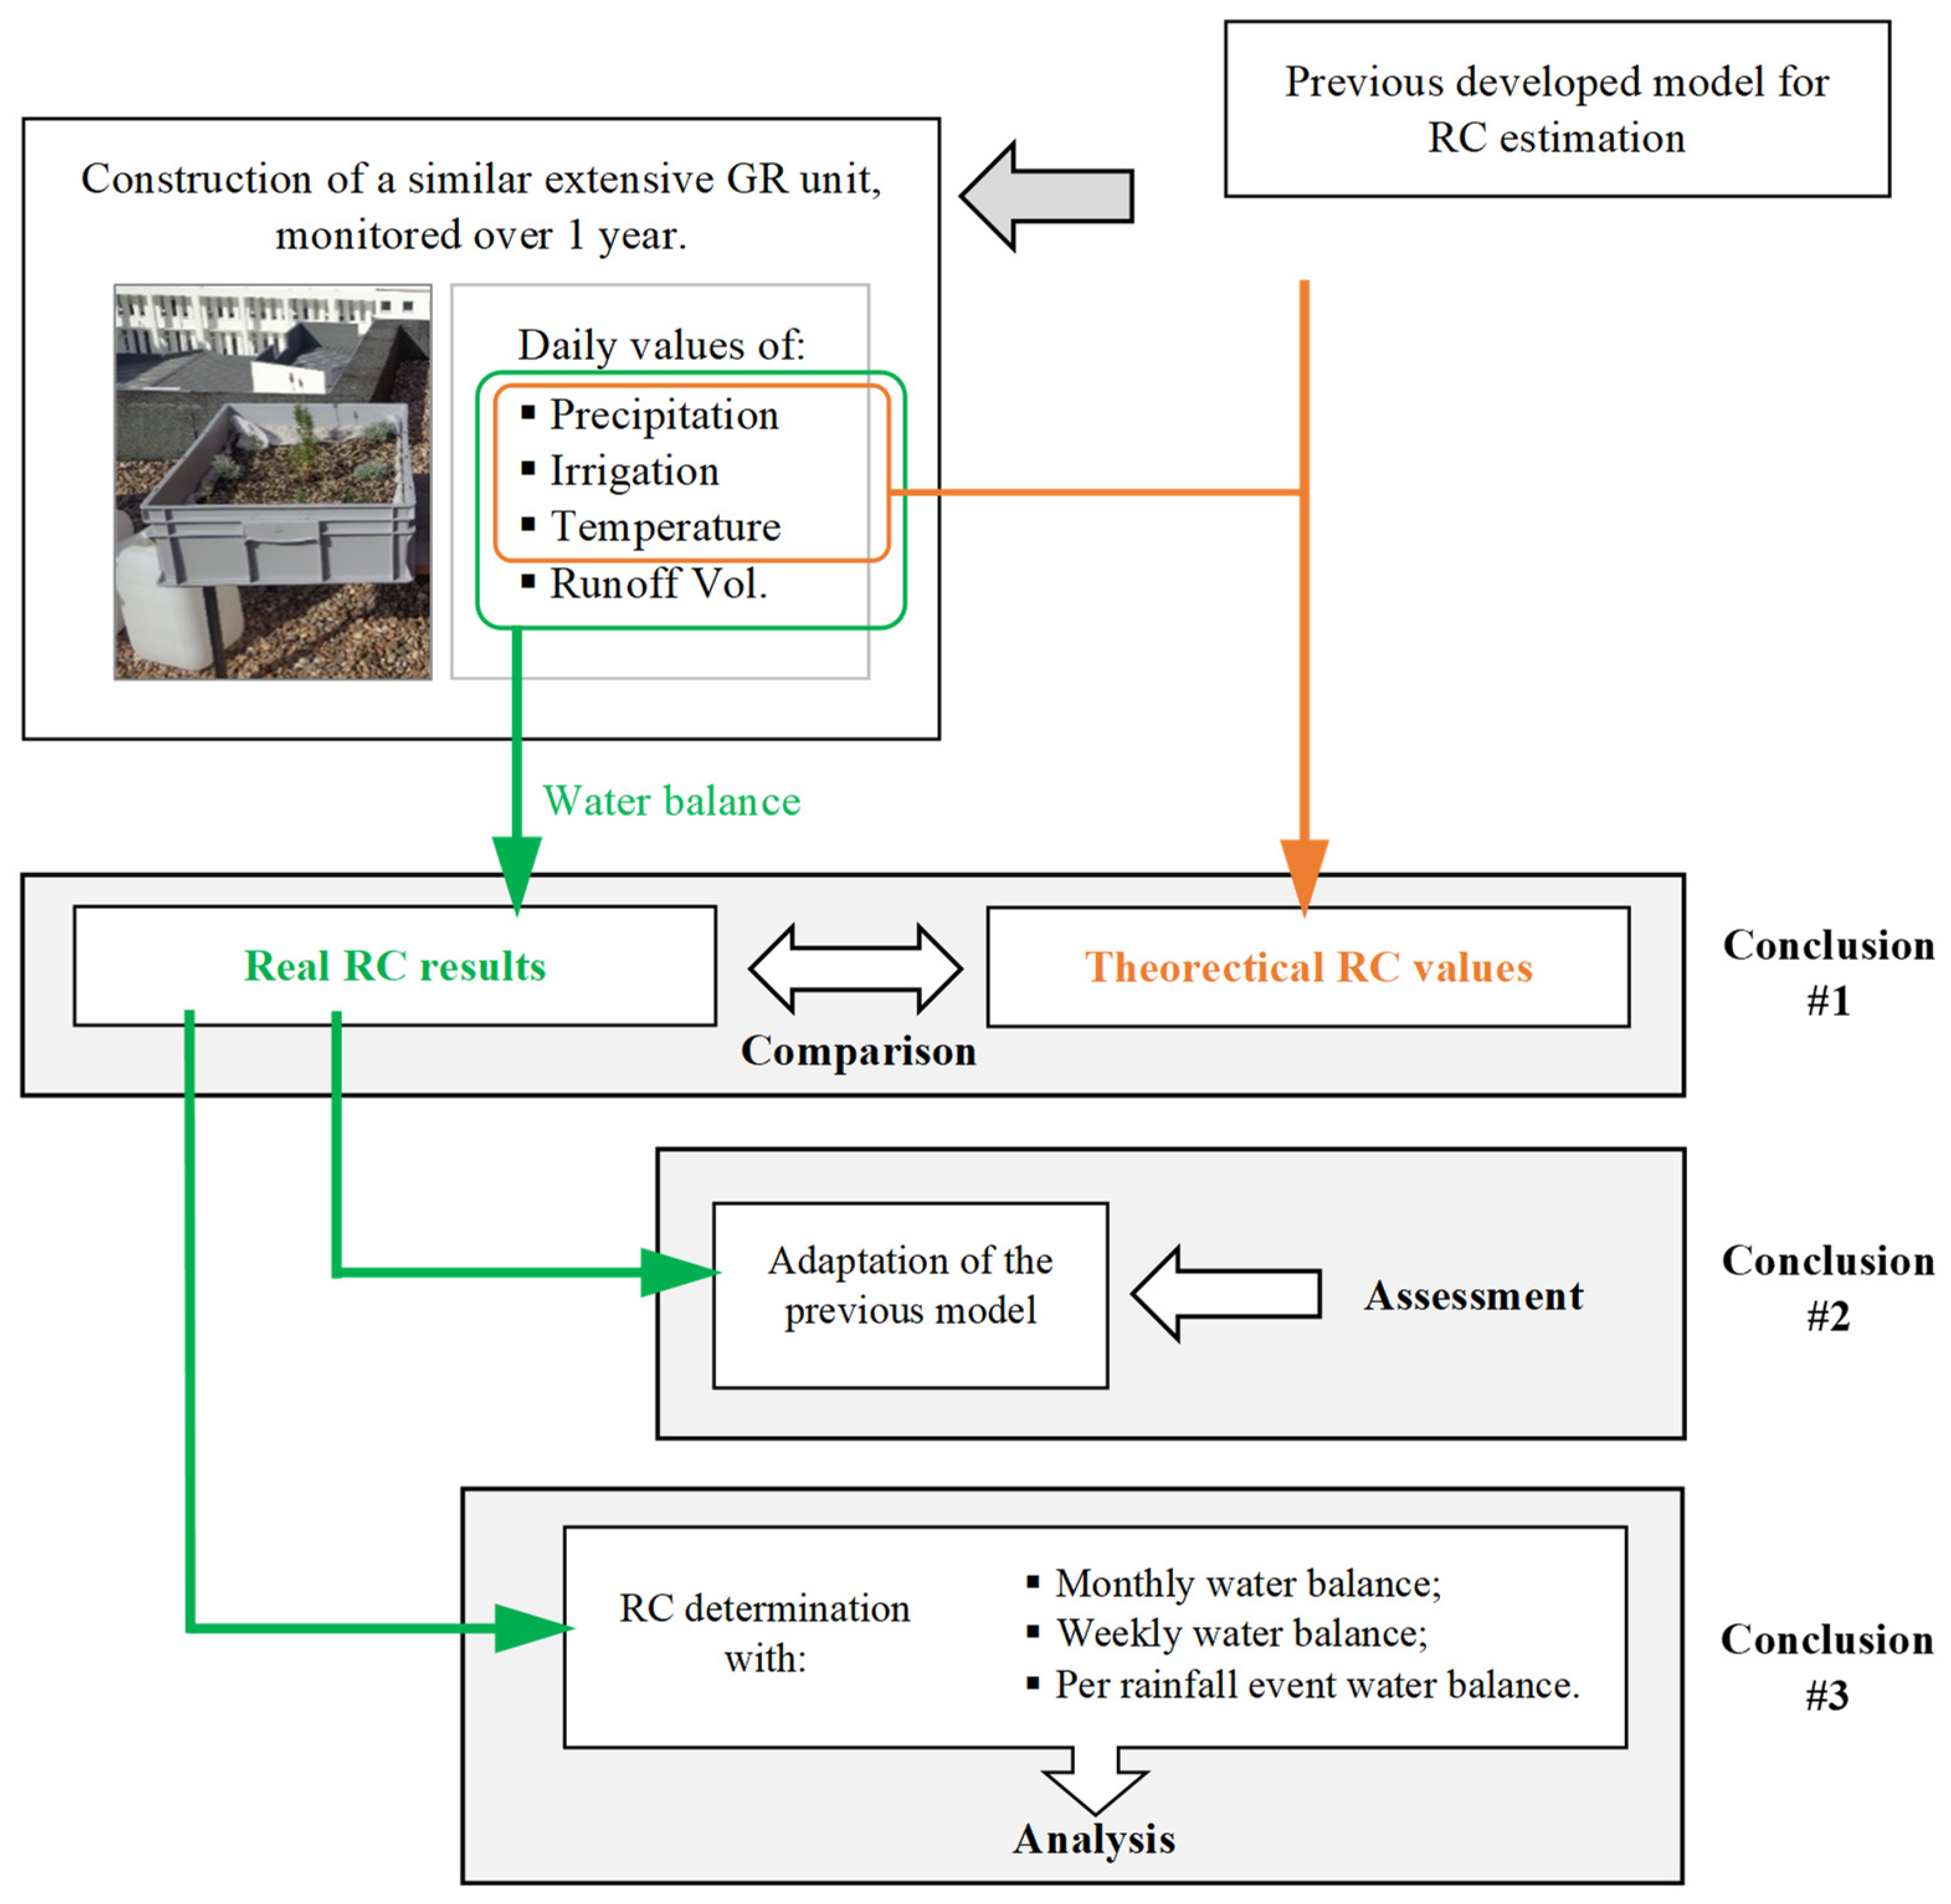
In order to accomplish the defined goals, the present research work followed the steps represented in Figure 1. Conclusions are numbered to make the correspondence with the ones presented in the last section of this article.
2.1. Green Roof Pilot System
An extensive GR pilot system of 0.4 m2 was implemented on a rooftop in an urban Mediterranean area, at Escola Superior de Biotecnologia—Universidade Católica Portuguesa, Porto, Portugal, (Latitude 41.18 N; Longitude 8.61 W), in real environmental conditions.
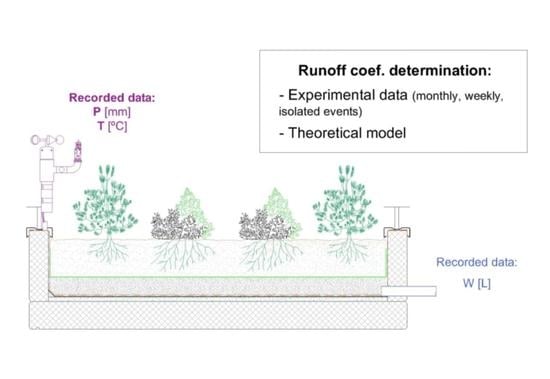
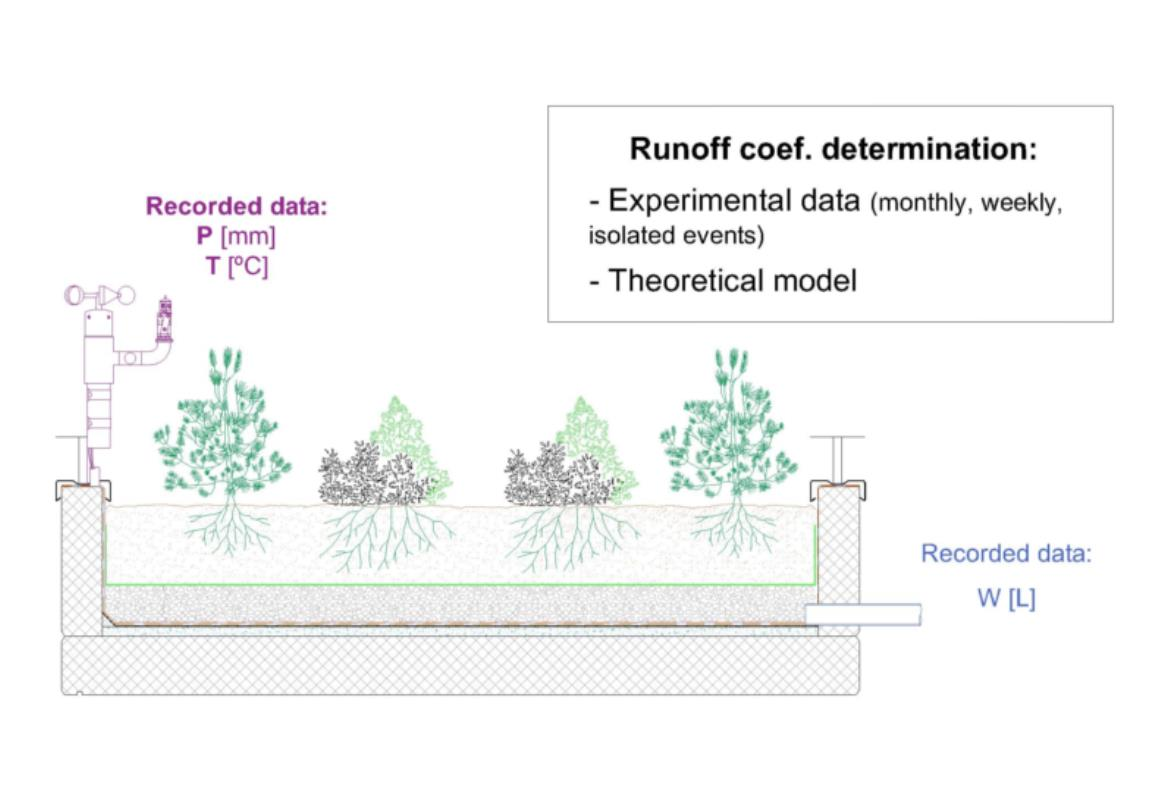
The experimental GR system (Figure 2) obeyed to a multilayer construction as recommended by the German Standards FLL guidelines [16], with the following layers (from bottom to top): (1) geotextile membrane of 200 g/m2; (2) expanded clay- Leca® L as a drainage layer (0.02 m height; 10–20 mm granulometry, provided by Weber Saint Gobain®—Aveiro, Portugal); (3) geotextile filter of 150 g/m2; (4) growing substrate (0.10 m depth) of a mixture composed by 70% Leca® Hydro (4–10 mm granulometry, provided by Weber Saint Gobain® —Aveiro, Portugal) and 30% organic matter (collected from a private garden soil); and (5) aromatic vegetation (Lavandula dentata; Helycrisium italicum, and Satureja montana).
All the plants (9 stem) were propagated by staking and then transplanted to our extensive GR system at a juvenile state, achieving 22 plants/m2 of vegetation density. The GR was inspected every month for adequate vegetation growth and weed removal. Monitoring occurred from January 2017 to January 2018, in order to include year variation with different rainfall conditions in the Mediterranean climate.
2.2. Site Characteristics—Precipitation and Temperature
Climate of the Porto region (Portugal) is classified as a warm temperate and dry summer (Csb) according to Köppen–Geiger climate classification [15]. It is a coastal area, very influenced by the maritime proximity with dry summers and mild wet winters. The daily rainfall and temperature records registered during the time period of this study (11 January 2017–31 January 2018), revealed an annual rainfall of 1017.4 mm and an average temperature of 16 °C. This was a relatively wet and warm year, once the Porto region presents an average annual precipitation of 967 mm and a mean air temperature of 14.8 °C (records from 1990–2020, registered by the national water resources monitoring system—weather stations of Leça da Palmeira and Castelo de Burgães [17]).
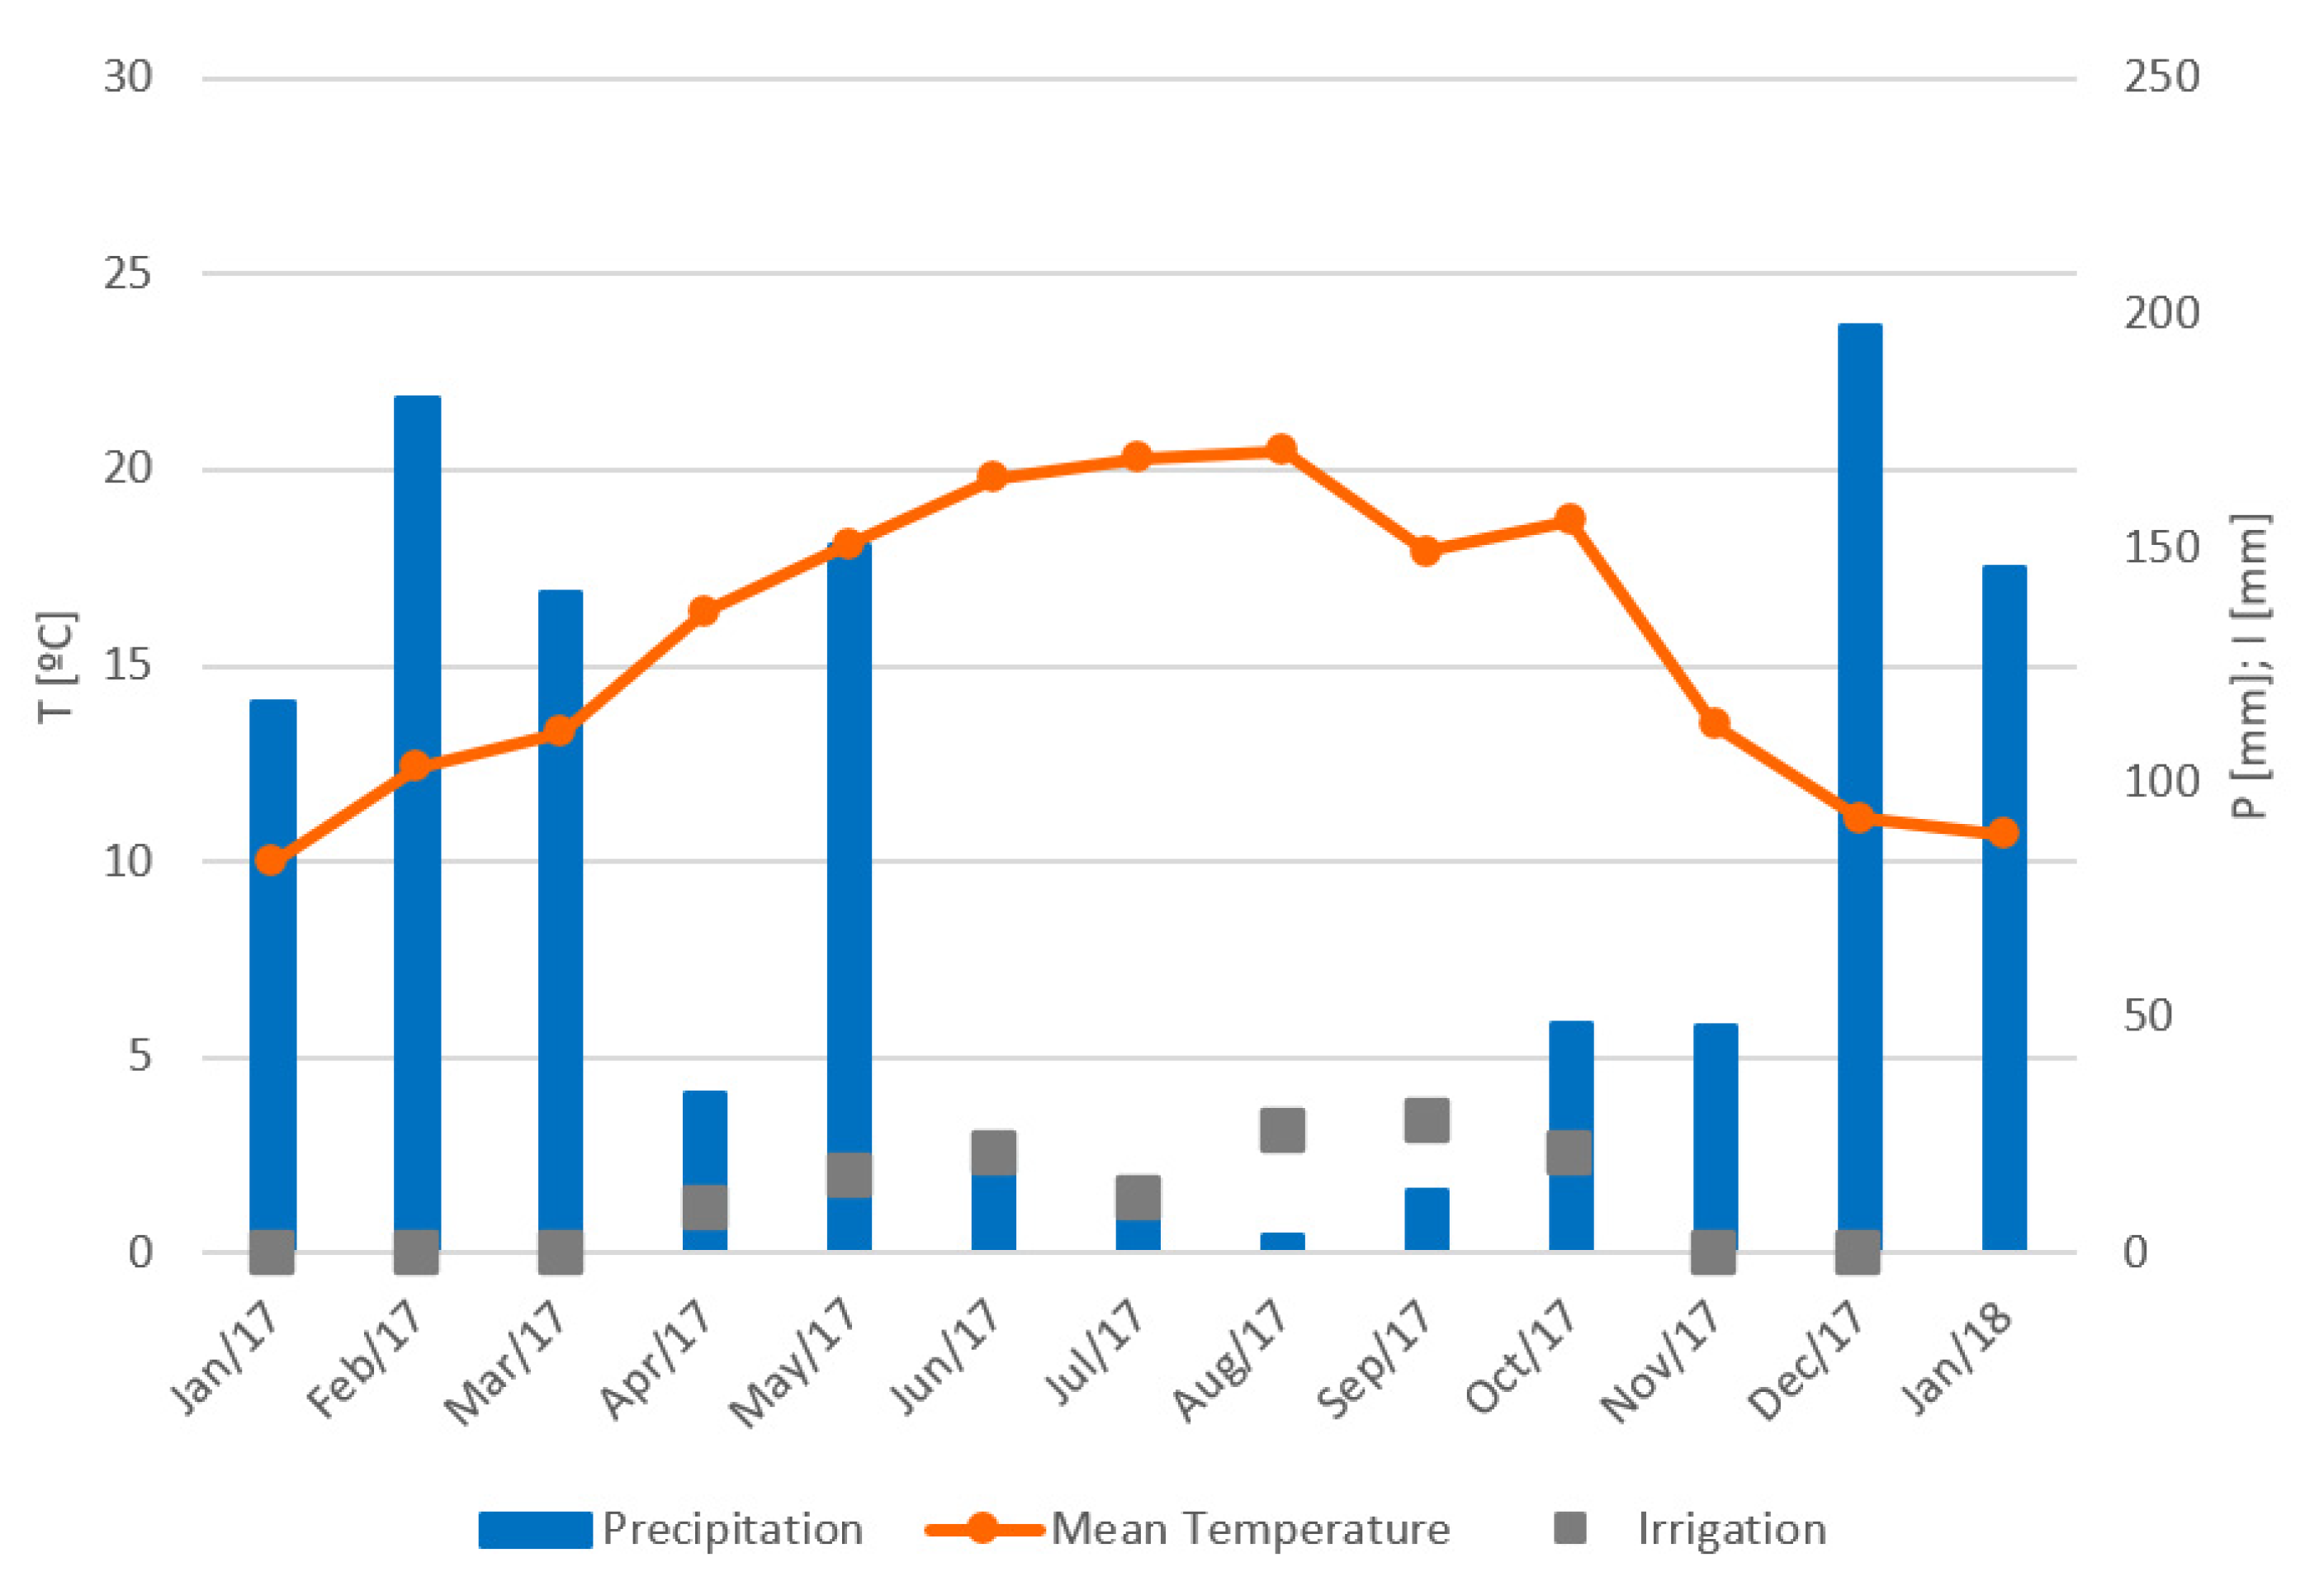
As usual in this region, summer and fall months (June–October) had higher temperature and low occurrence of precipitation events (Figure 3), being the winter and spring months the wettest period (November-May), recording in this study period a total precipitation of 922.24 mm.
Meteorological data (air temperature and precipitation) used in the present study to runoff coefficient determination were provided from a meteorological station from ISEP (Instituto Superior de Engenharia do Porto), 500 m away from the studied site.
2.3. Runoff Coefficient Determination
The amount of rainwater that drained from the GR system was assessed during the whole experimental period. It was collected in a tank, connected directly to the pilot system outflow through a funnel, and measured every day using a graduated flask. The irrigation volume was previously quantified and registered, and added to the GR system using a watering can. The GR pilot system were weighed every day, using an industrial balance (of up to 150 kg) to calculate the hydric balance by the weight difference.
To accomplish the first goal of this study, the runoff coefficient of the pilot GR was determined by applying the previously model developed by Monteiro et al. [8] (Equation (1)), that was based on a similar extensive GR system (tested using the same multilayer composition, vegetation density, and region), to the meteorological data of the experimental year.
where CM = runoff coefficient of the month M; PM = precipitation of the month (mm); RM = irrigation of the month M (mm); TM = mean air temperature of the month M (°C); and TM−1 = mean air temperature of the month M − 1 (°C) [8].
Then, the runoff coefficient of the pilot GR was also determined with the experimental values, by calculating a water balance considering the total runoff volume drained from the GR over a given time period, and the total amount of precipitation and irrigation that occurs in that area in the same time period. This water balance allows to quantify the amount of retained water through a balance between the one that enters the system (rainwater and irrigation) and the one that runoffs Equation (2).
where Vrunoff is the collected water volume downstream of the GR pilot system, P is the precipitation (mm), R is the irrigation volume (L), and A is the area of the GR system (m2).
2.4. Assessment of Different Approaches to Determine the Runoff Coefficient
To understand the differences between the monthly runoff coefficient calculation made previously and a shorter time period of the runoff coefficient determination, a weekly (7 d) water balance and a water balance for independent rainfall events were performed. It has been considered that an independent rainfall event comprises the time period from when it starts to rain, until the water runoff volume drained by the pilot GR system stops (usually one day after the end of the rainfall).
2.5. Simulation Performance of an Extensive GR
To better understand the performance of an extensive GR using different runoff coefficient calculations, a simulation study was performed. The simulation was made regarding runoff coefficients determined by monthly, weekly, and independent rainfall events. The runoff coefficients resulting from the previous theoretical model (presented in Section 2.3) and the real value obtained from the experimental data were also assessed. For this purpose, an extensive GR, similar to the one used in the present research study was simulated, considering a 200 m2 area, and the same environmental conditions (air temperature and precipitation). The amount of rainfall and the amount of water running off from the GR system were estimated on a daily base.
3. Results and Discussion
3.1. Runoff Coefficient Determination
3.1.1. Assessment of the Previous Model
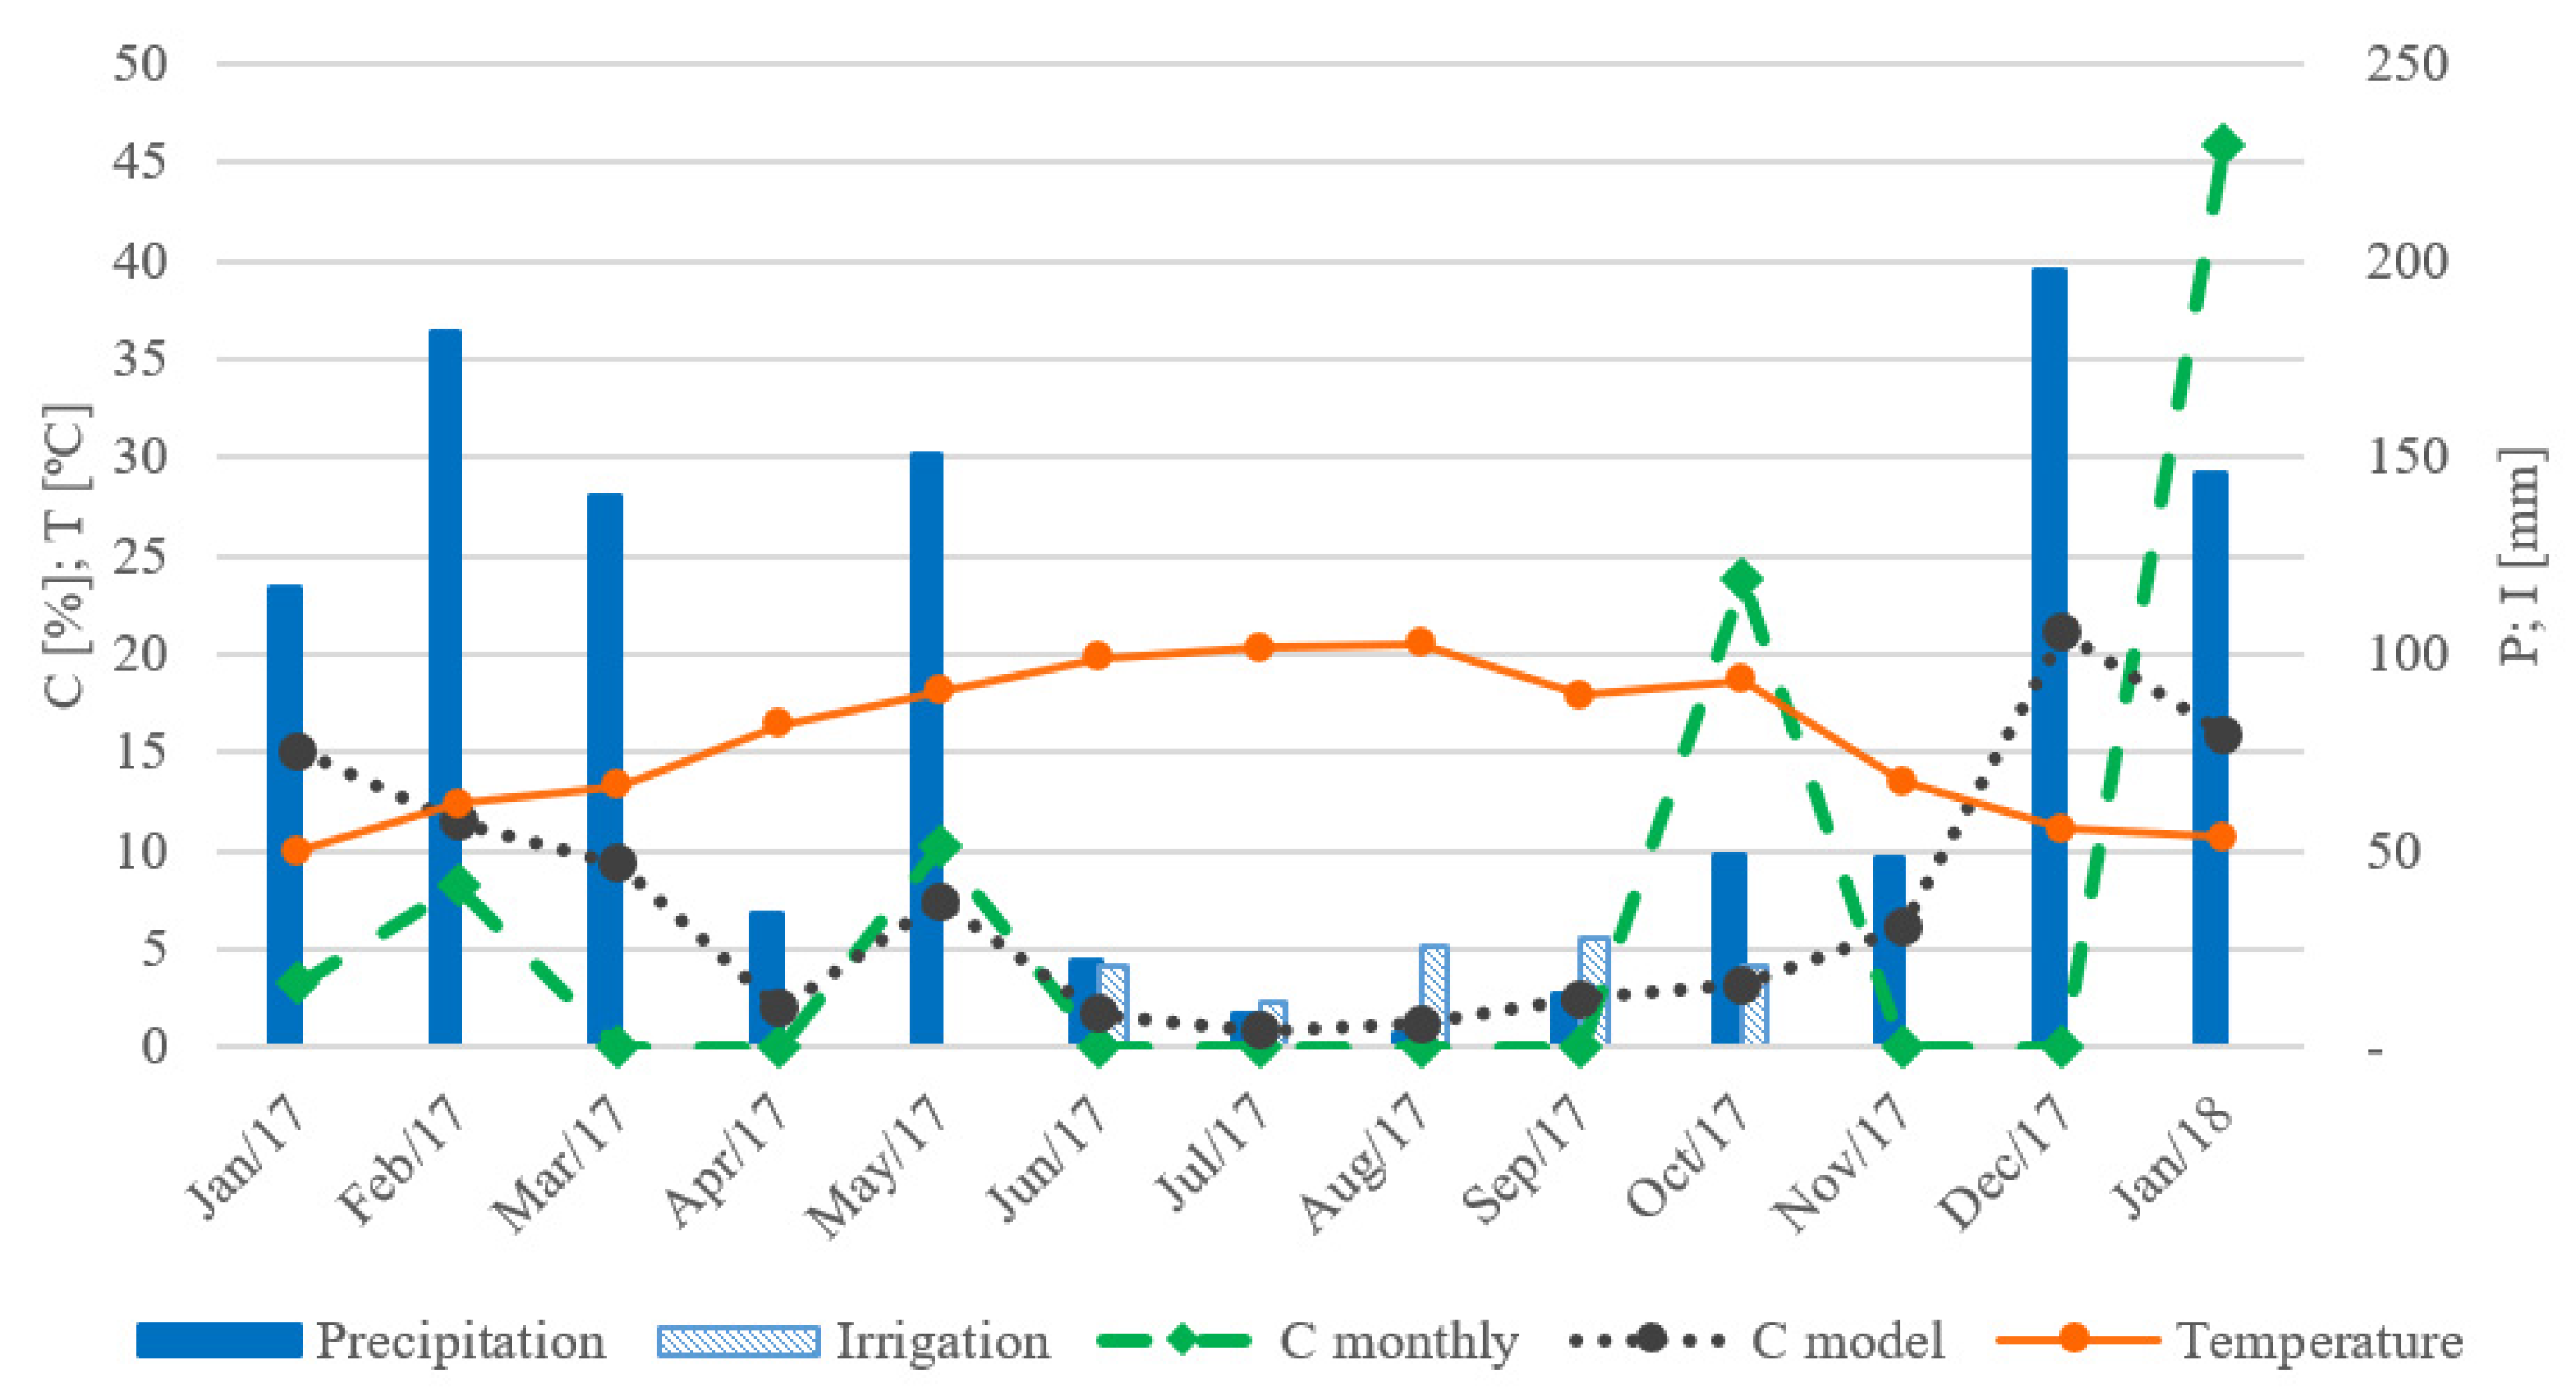
The data processing phase started by determining if the previous model developed by Monteiro et al. [8] fitted the experimental values obtained for the present pilot GR. A monthly runoff coefficient was determined with the proposed model Equation (1), and, for comparison, through a monthly water balance determination with the experimental data Equation (2). Results are presented in Figure 4.
Data from Figure 4 shows that the runoff coefficient obtained from the measured experimental data (C monthly) has a growing tendency with the increase in precipitation. The marked rise that it presents in October can be explained due to the irrigation made during the summer months, that kept some moisture in the substrate. Therefore, when the first rains of October started to fall, a significant runoff has been achieved, once the saturation of the GR was rapidly reached. In addition, the data also show that there are rain events with no runoff, meaning that there is a minimum rainfall amount (that most probably varies with the antecedent dry weather period and with the moisture conditions of the substrate) bellow which there is no runoff.
The proposed developed model follows the trend of the experimental data only in part of the studied period. The correlation coefficient (R2) is quite low (0.099), which denotes the lack of adjustment of the developed model expression and that it does not represent the experimental monthly runoff coefficient of the presently obtained data. The low correlation coefficient can be explained by the months of February, November, and December, where an opposite tendency occurs when comparing the experimental data and the model values (it raises for model values and decreases for experimental ones).
Changes on the coefficients of the model described by Monteiro et al. [8] were made by non-linear regression analysis with the package solver of MICROSOFT Excel 10 (Microsoft® corporation, Redmond, WA, USA), in order to try to achieve a better adjustment to the present experimental data (precipitation, temperature, and runoff recorded for the pilot GR from 11 January 2017 to 31 January 2018). The best result is presented in Equation (3), similar to the previous one Equation (1), but also resulting in a very low correlation coefficient (0.121), as presented in Table 1.
Another aspect that can be discussed is the fact that the power of the denominator is zero, leading to the unrealistic fact that the temperature does not interfere with the runoff. In addition, the resulting numerator is contradictory with the data observed: with a power less than 1 on the rainfall/irrigation, the runoff coefficient decreases with the increase in the rainfall/irrigation, which is not what is observed by most authors and by the data in this research (where very small rainfall events do not even produce runoff).
It has been reported that the moisture content significantly influences the retention capacity of the GR. In this particular case, the moisture levels of the GR might be influencing the runoff results, although its effect is not being considered on the previously developed model, once this parameter is not included in the expression.
From a hydrological point of view, vegetated roofs (GRs) function differently when compared to a non-vegetated one (hard roof). In a GR, precipitation is retained in the multilayer system before running off downstream, while the rainwater runs off directly from the hard roof. Therefore, as long as growing substrate moisture is below field capacity, there is hardly any runoff from a GR, which only starts to occur after substrate saturation is reached. As such, the type of GR and the substrate thickness are two key factors affecting their runoff retention capacity [18,19], which should be considered in the mathematical expressions for runoff coefficient determination.
Intensive GR, with deeper substrates and higher plant biomass, are able to retain higher quantities of water runoff, with a median retention of 65.7%, as reported by Speak et al. [20]. Köhler et al. [21] described a total retention of 40 mm in a 0.12 m substrate-thick GR when the precipitation over 3 days was 55 mm. Regarding the moisture of the GR, Barnhart et al. [13] showed that stormwater runoff reductions are proportionately smaller during higher flow regimes caused by increased precipitation, likely due to the limited storage capacity of saturated GRs. When comparing GRs water retention through different year season, highest retention rates were registered by Zhang et al. [11] in summer months, which can be explained by the lower soil moisture levels that make the roof capable of storing more water leading to, according to Schärer et al. [22], an increase in lag time and a decrease in runoff coefficient. The highest runoff reduction pattern during summer months and the lowest runoff reduction during winter has indeed been found in other runoff studies [21]. Furthermore, seasonal differences in GR performance regarding water retention may be expected due to differences in dominant rainfall regime [23].
From these results, we can conclude that, to achieve a more suitable and robust model that can be adapted to different years, future studies must be developed, considering new variables, including GR moisture, drainage layer type or substrate layer depth, air humidity, and the antecedent dry weather period.
3.1.2. Seasonality Assessment
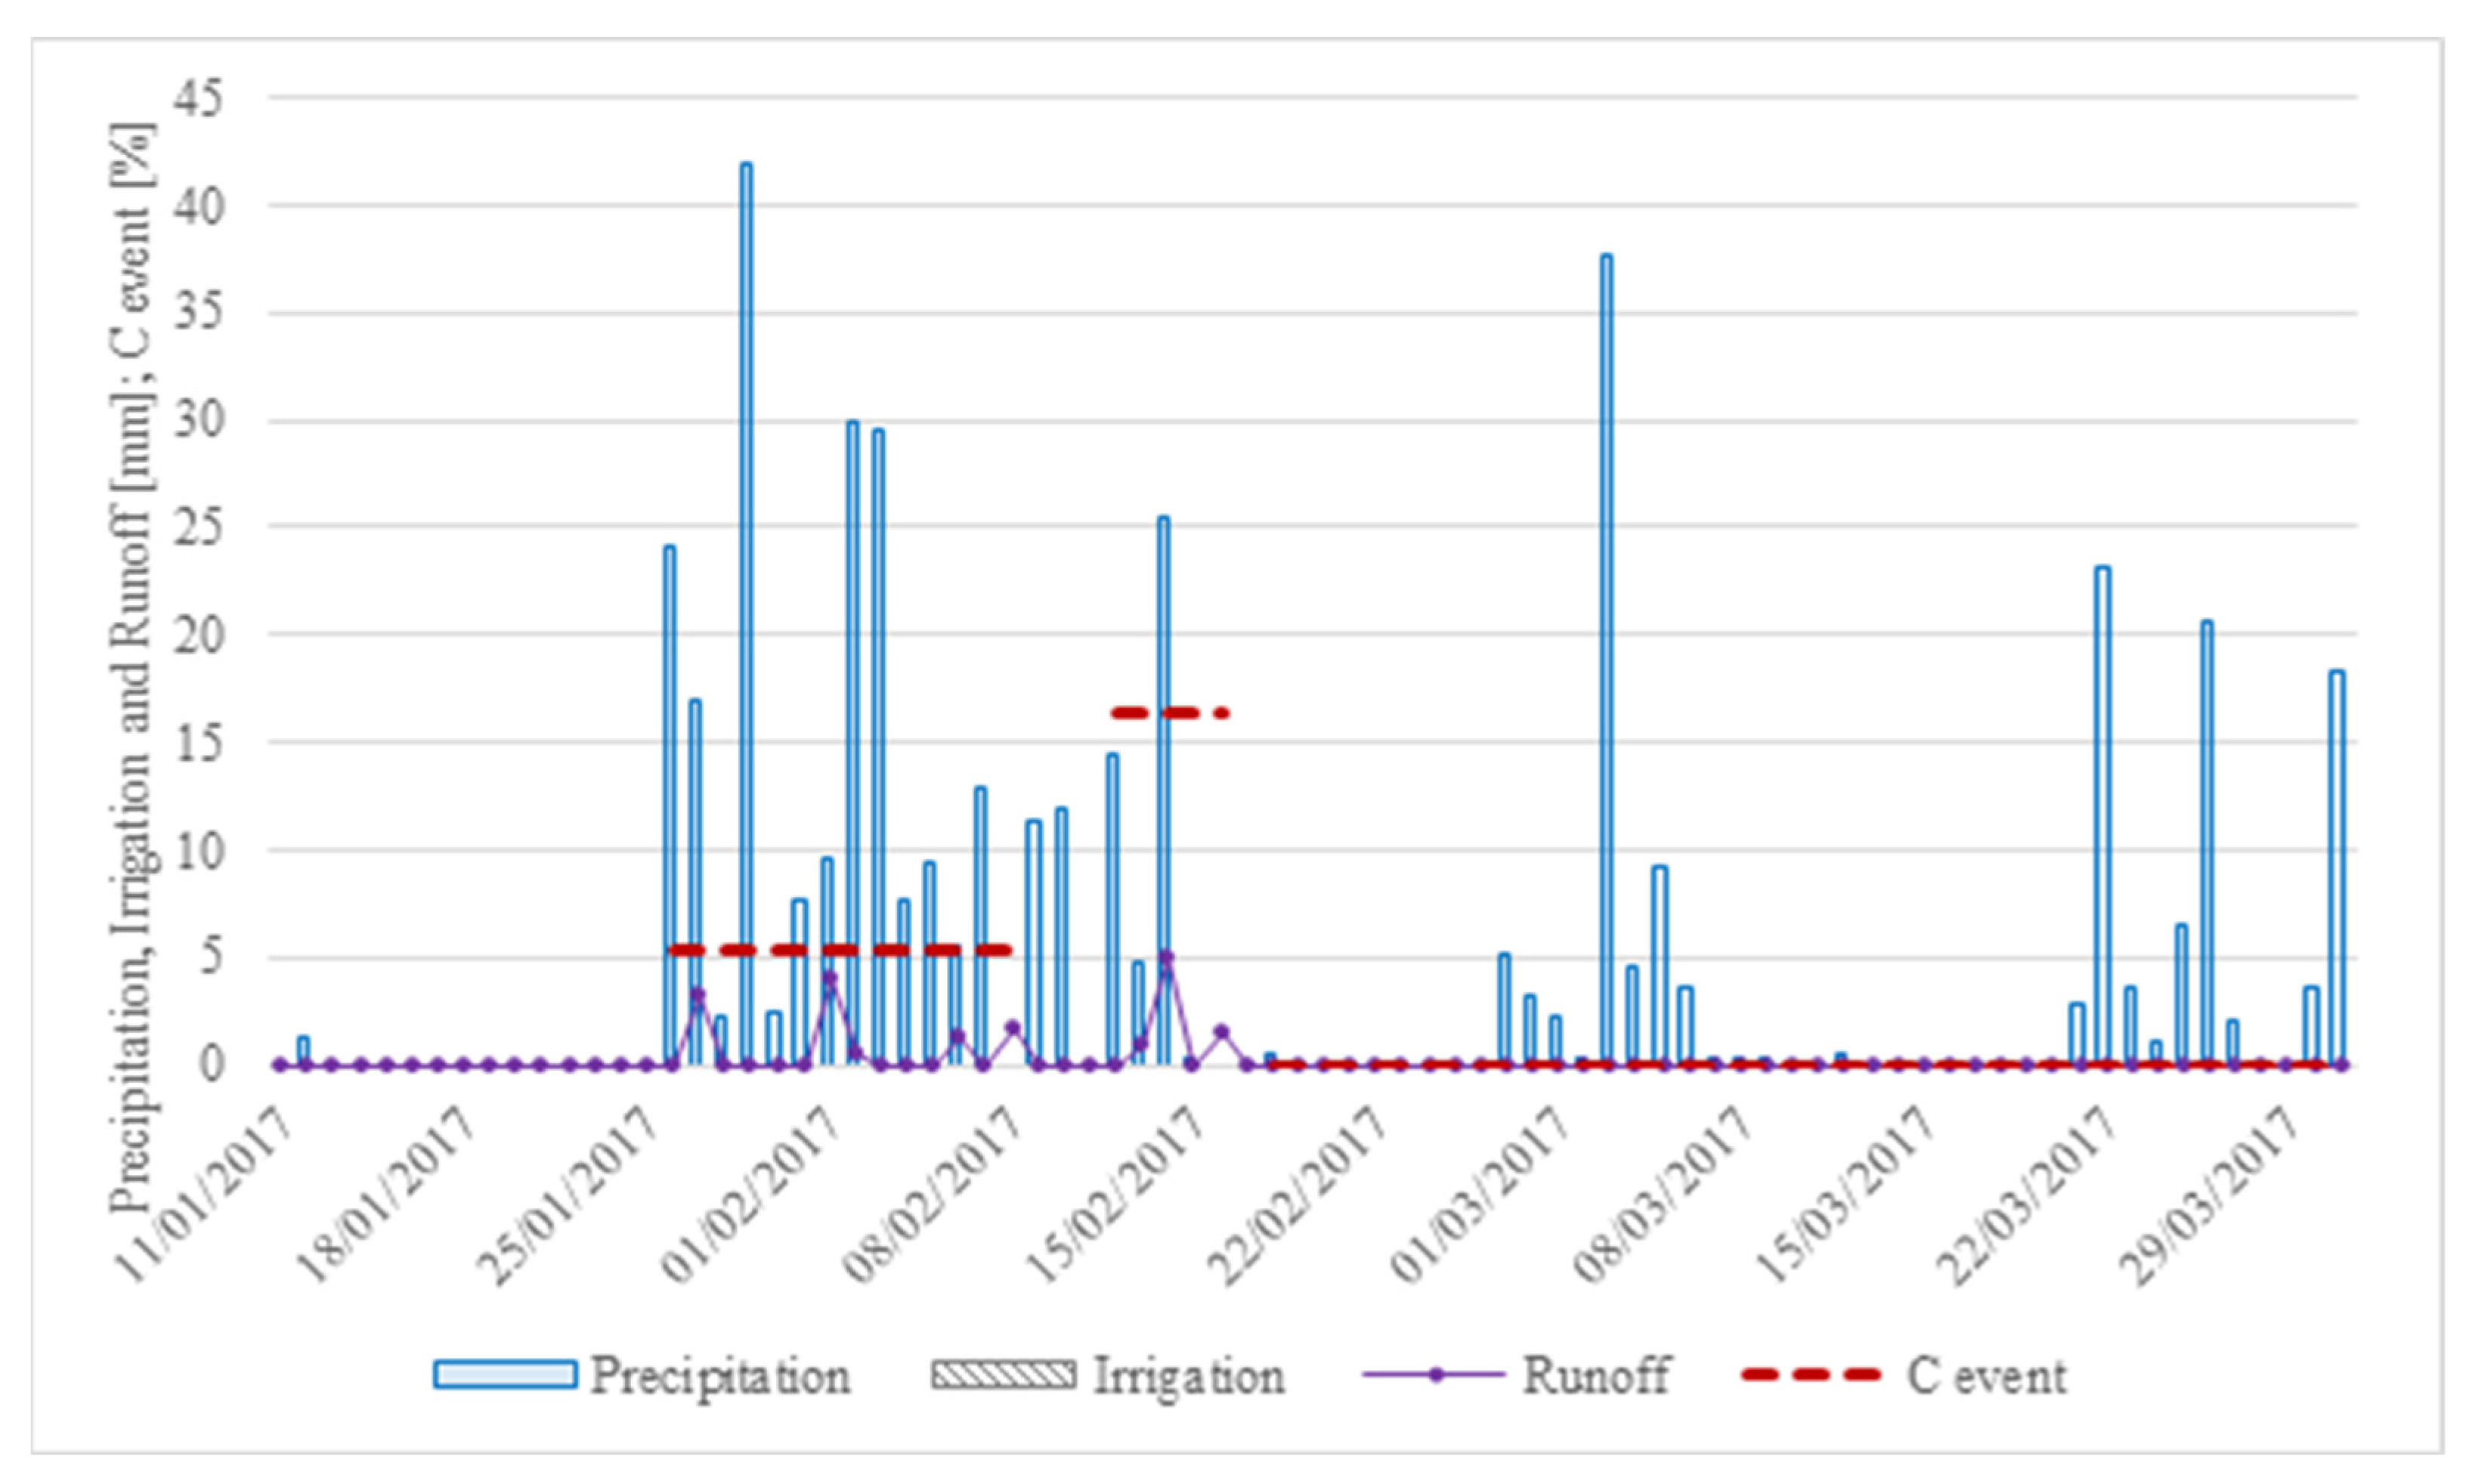
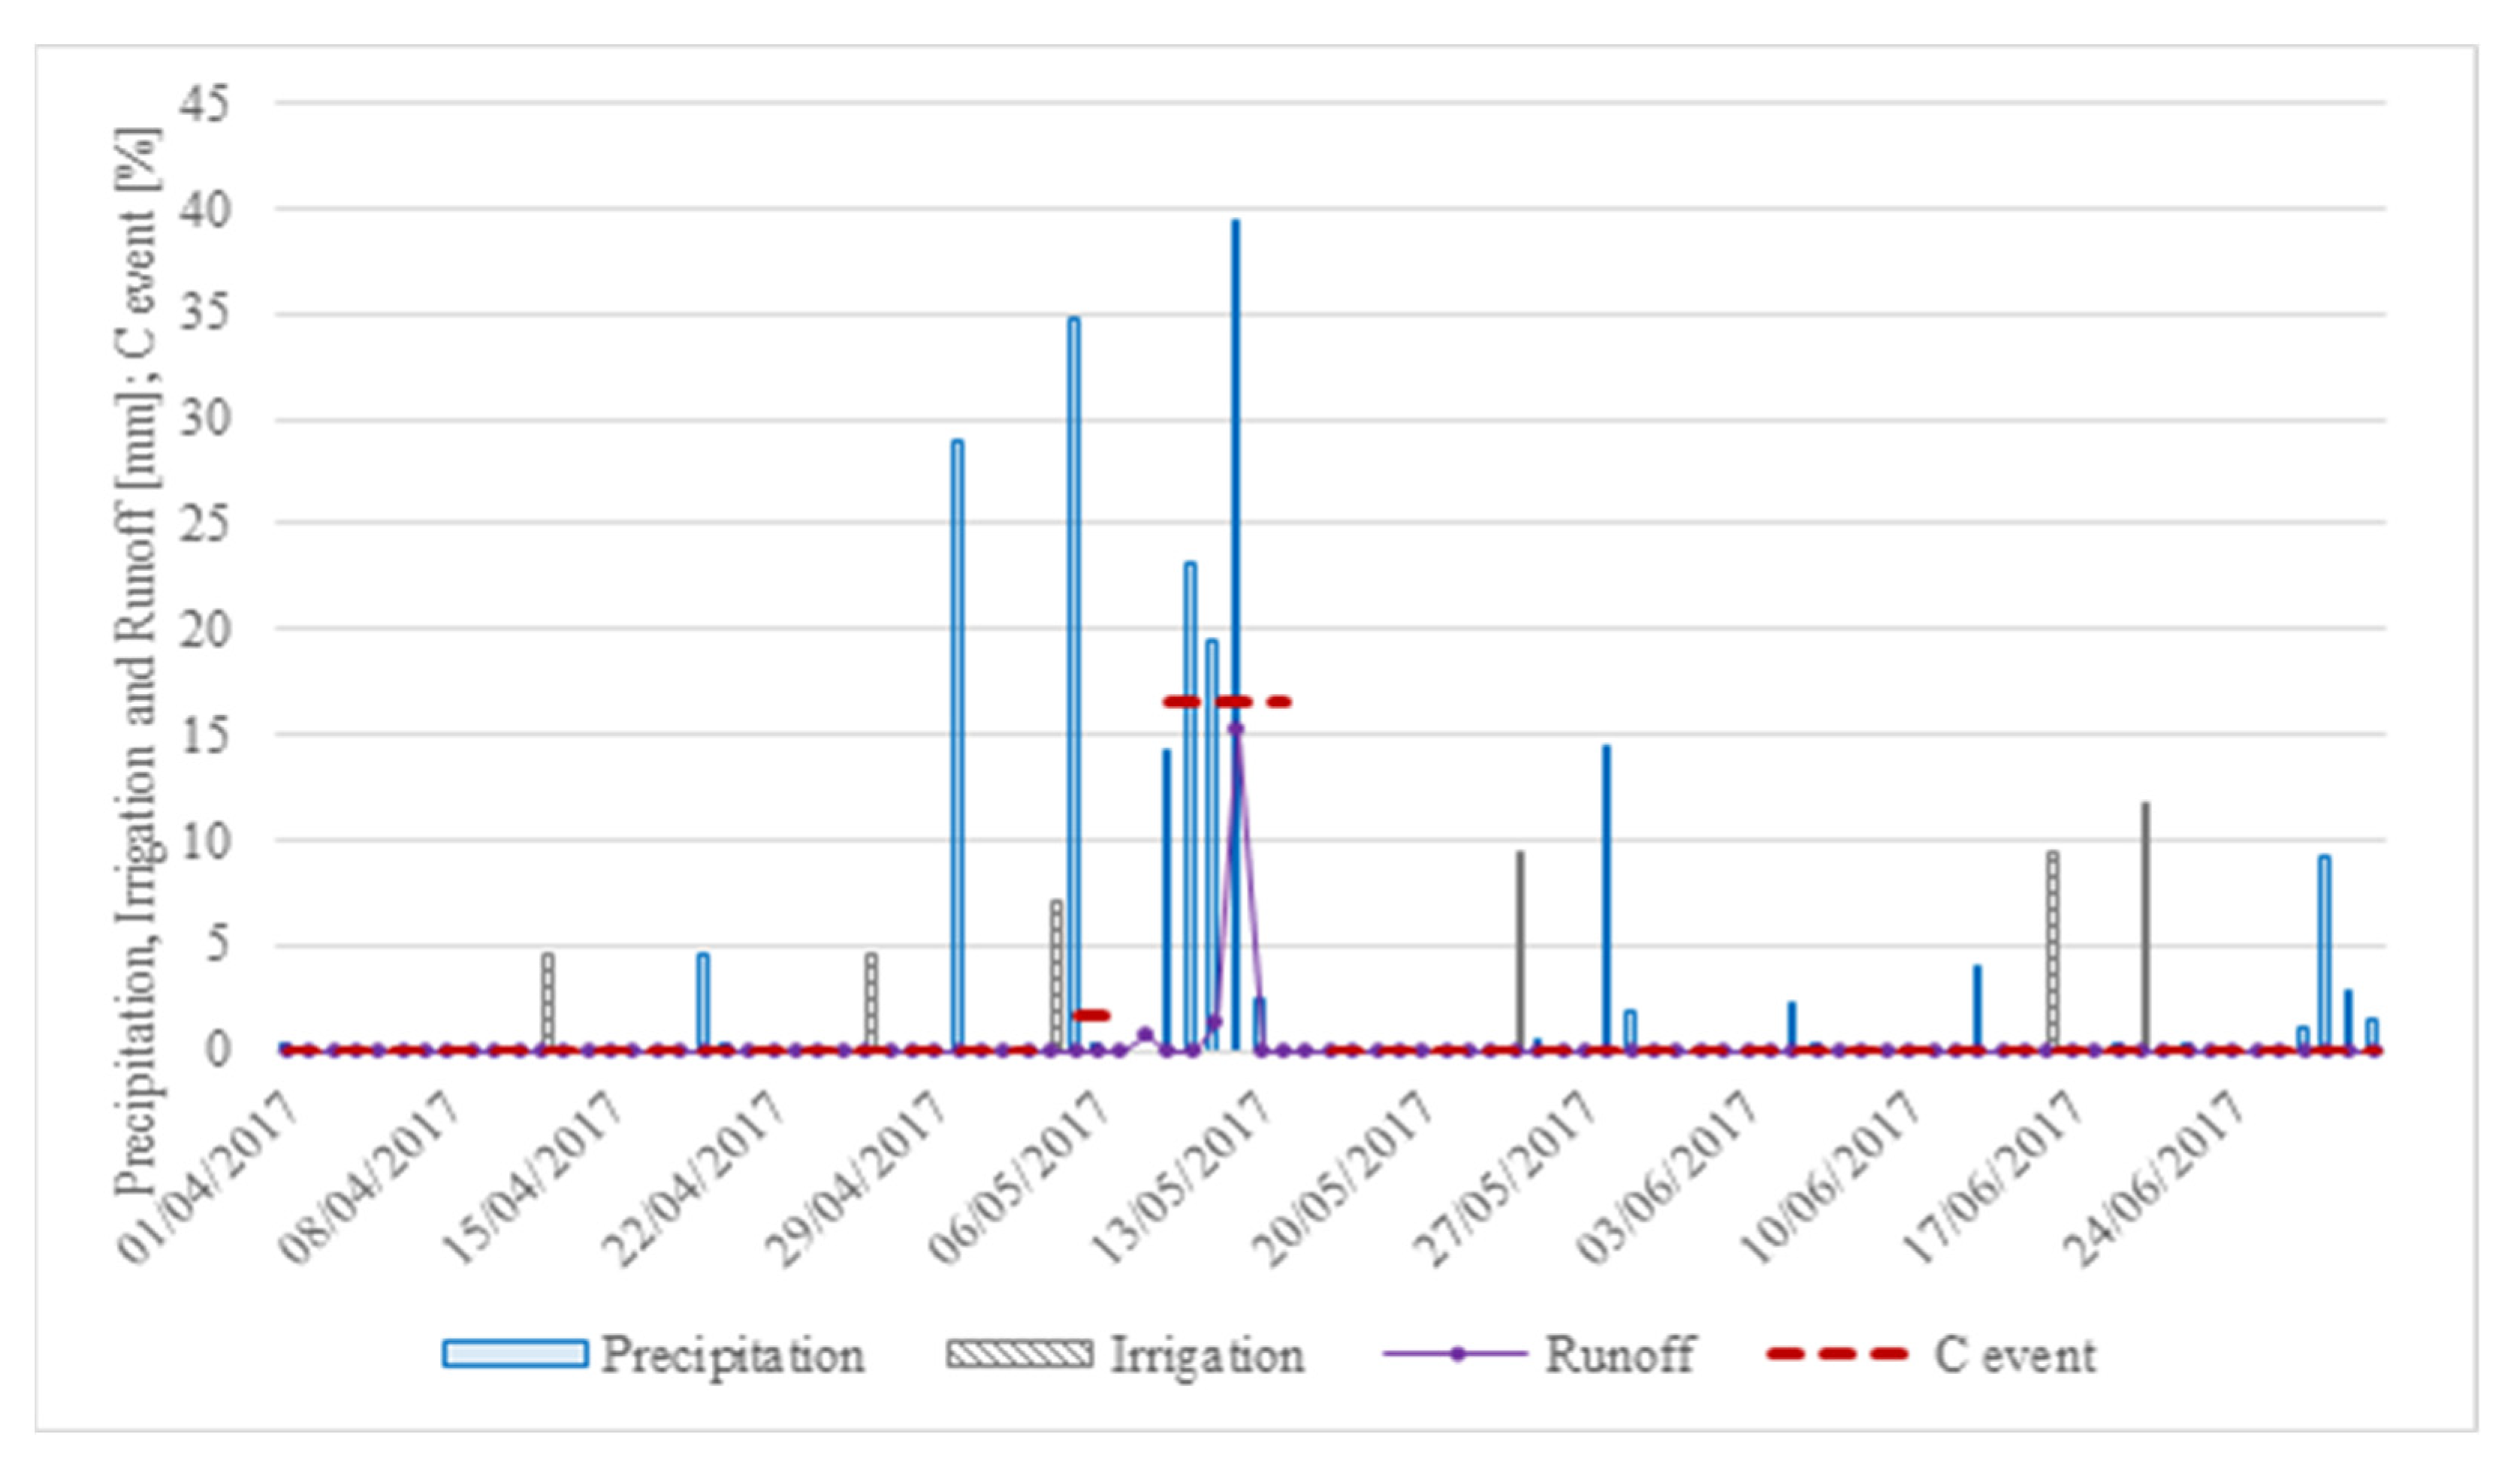
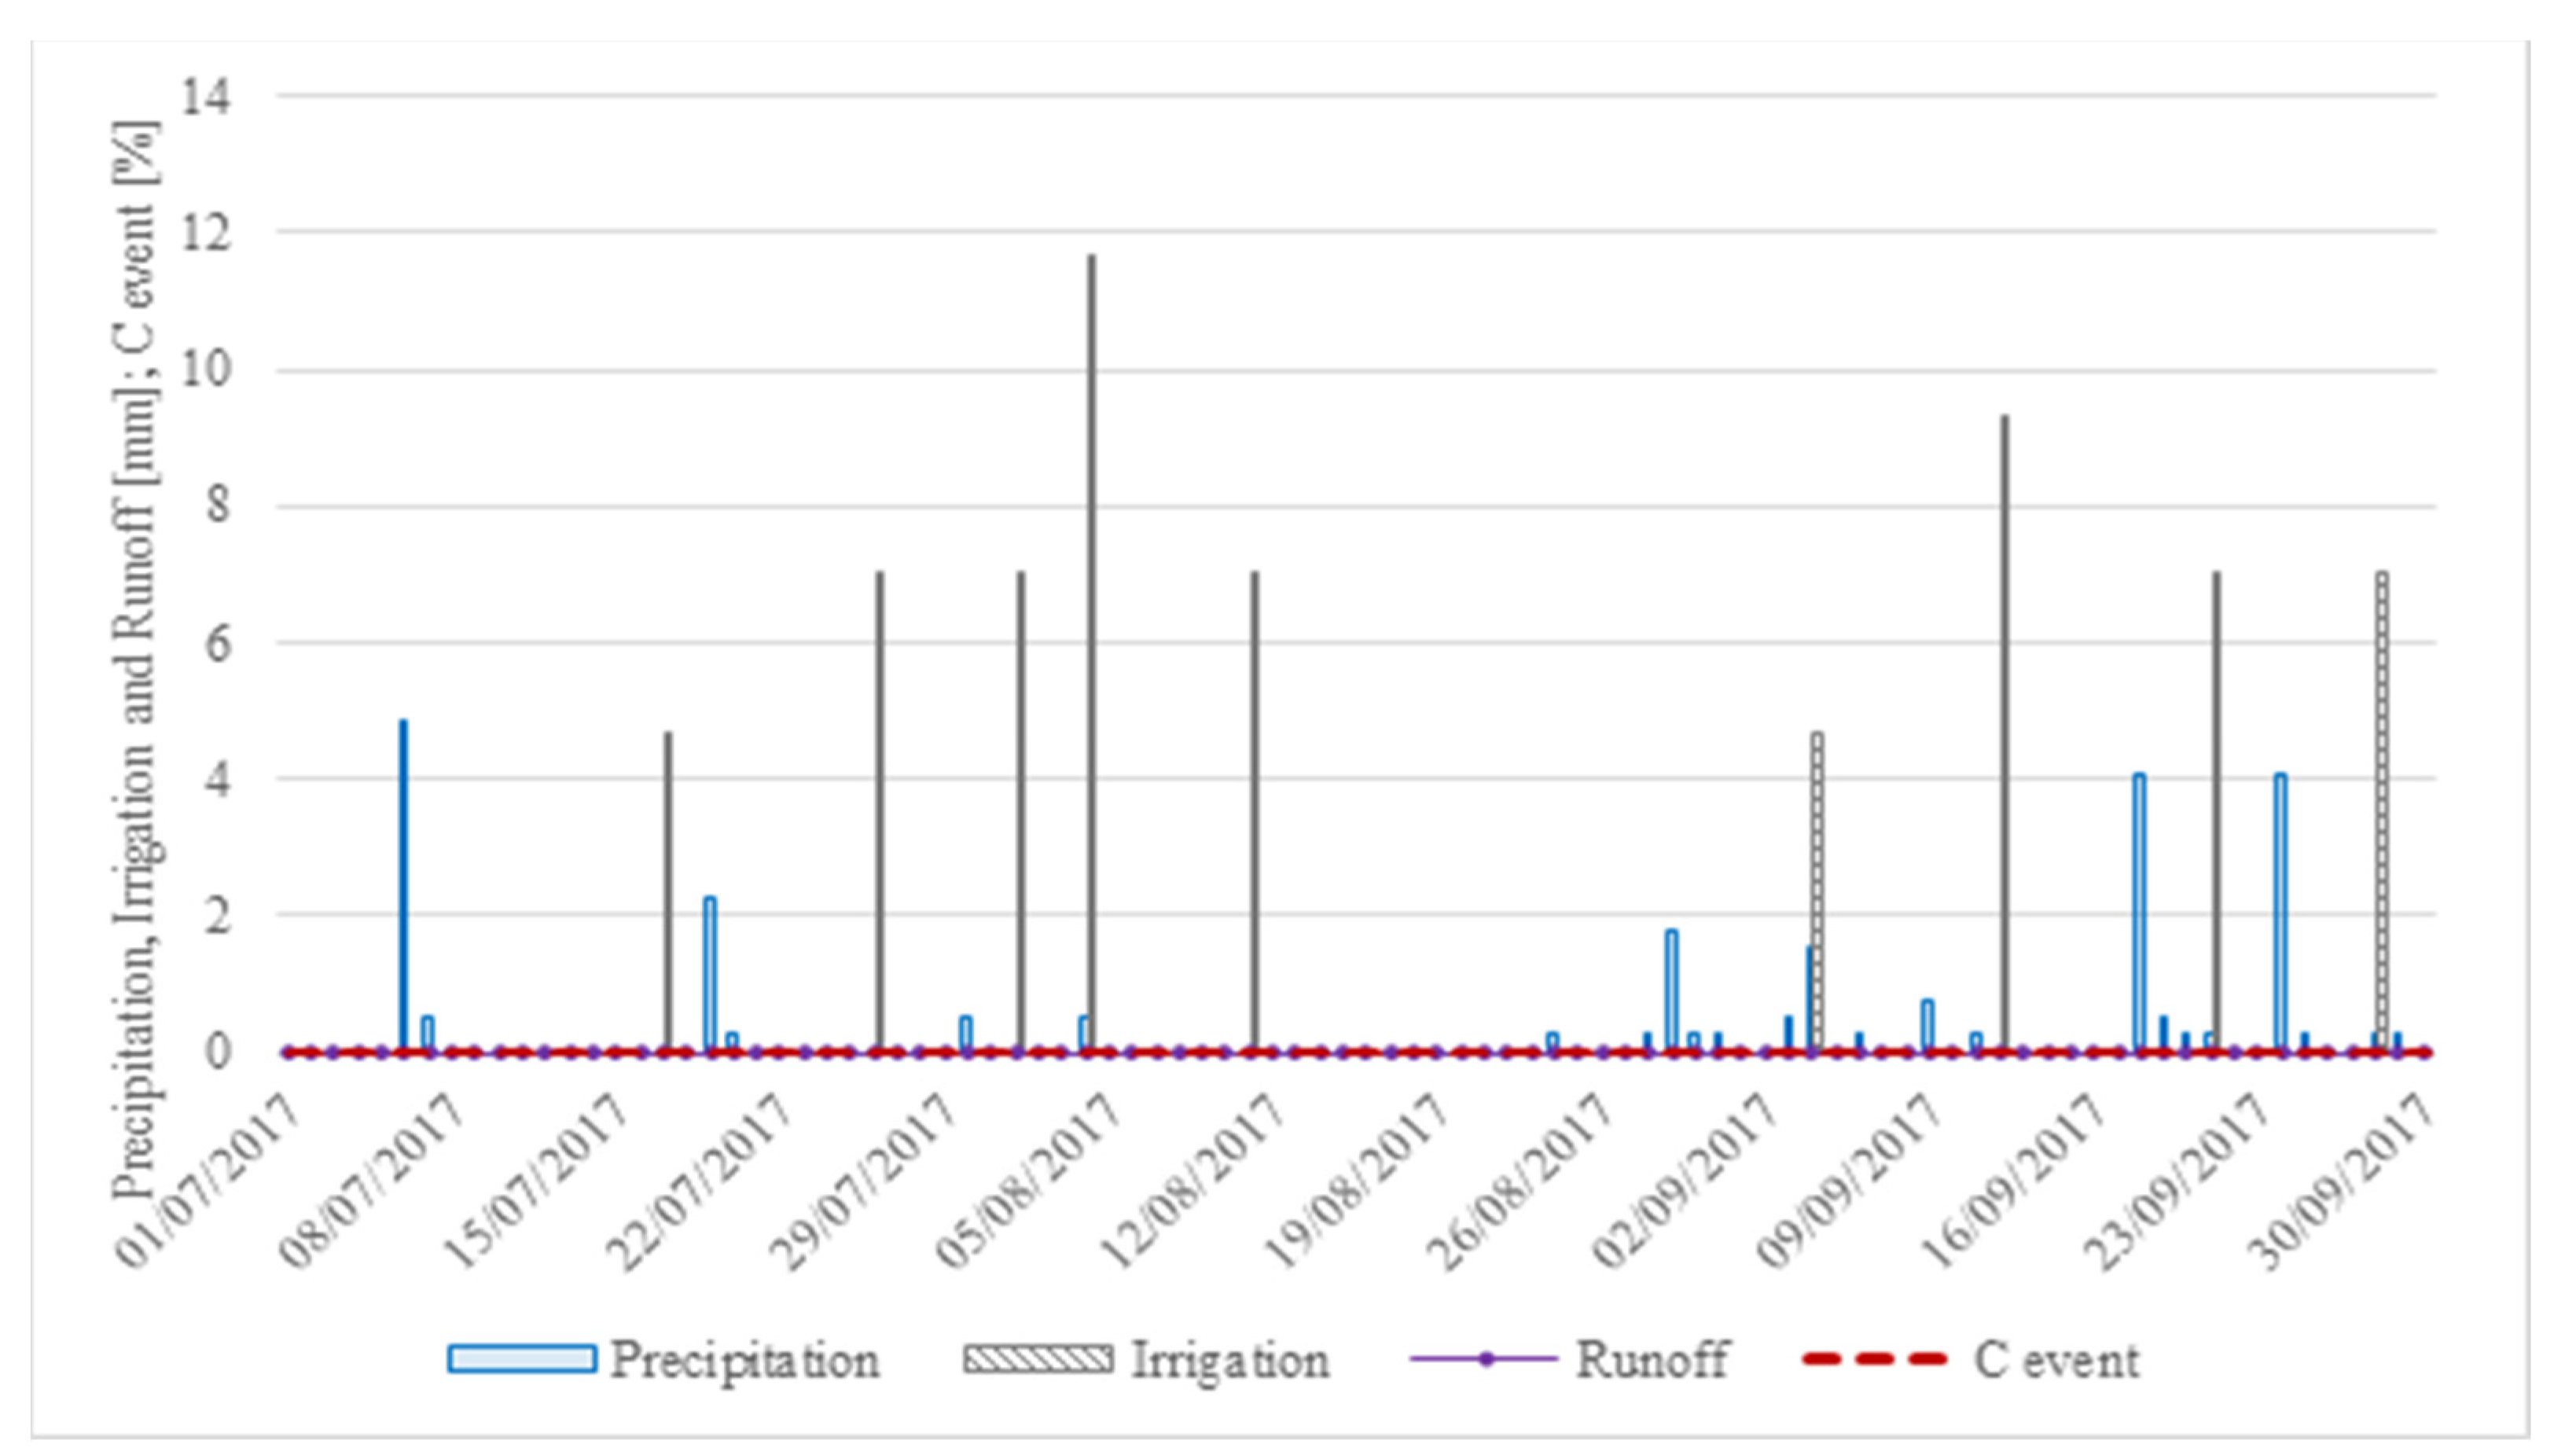
The seasonality is very clear in the present pilot GR performance. Figure 5, Figure 6, Figure 7 and Figure 8 show runoff variation, along with precipitation, performed irrigation, and temperature throughout the year. It can be seen that no water was discharged from the middle of April until October, despite some performed irrigation has been performed in order to keep aromatic plants in suitable conditions for their growth and development.
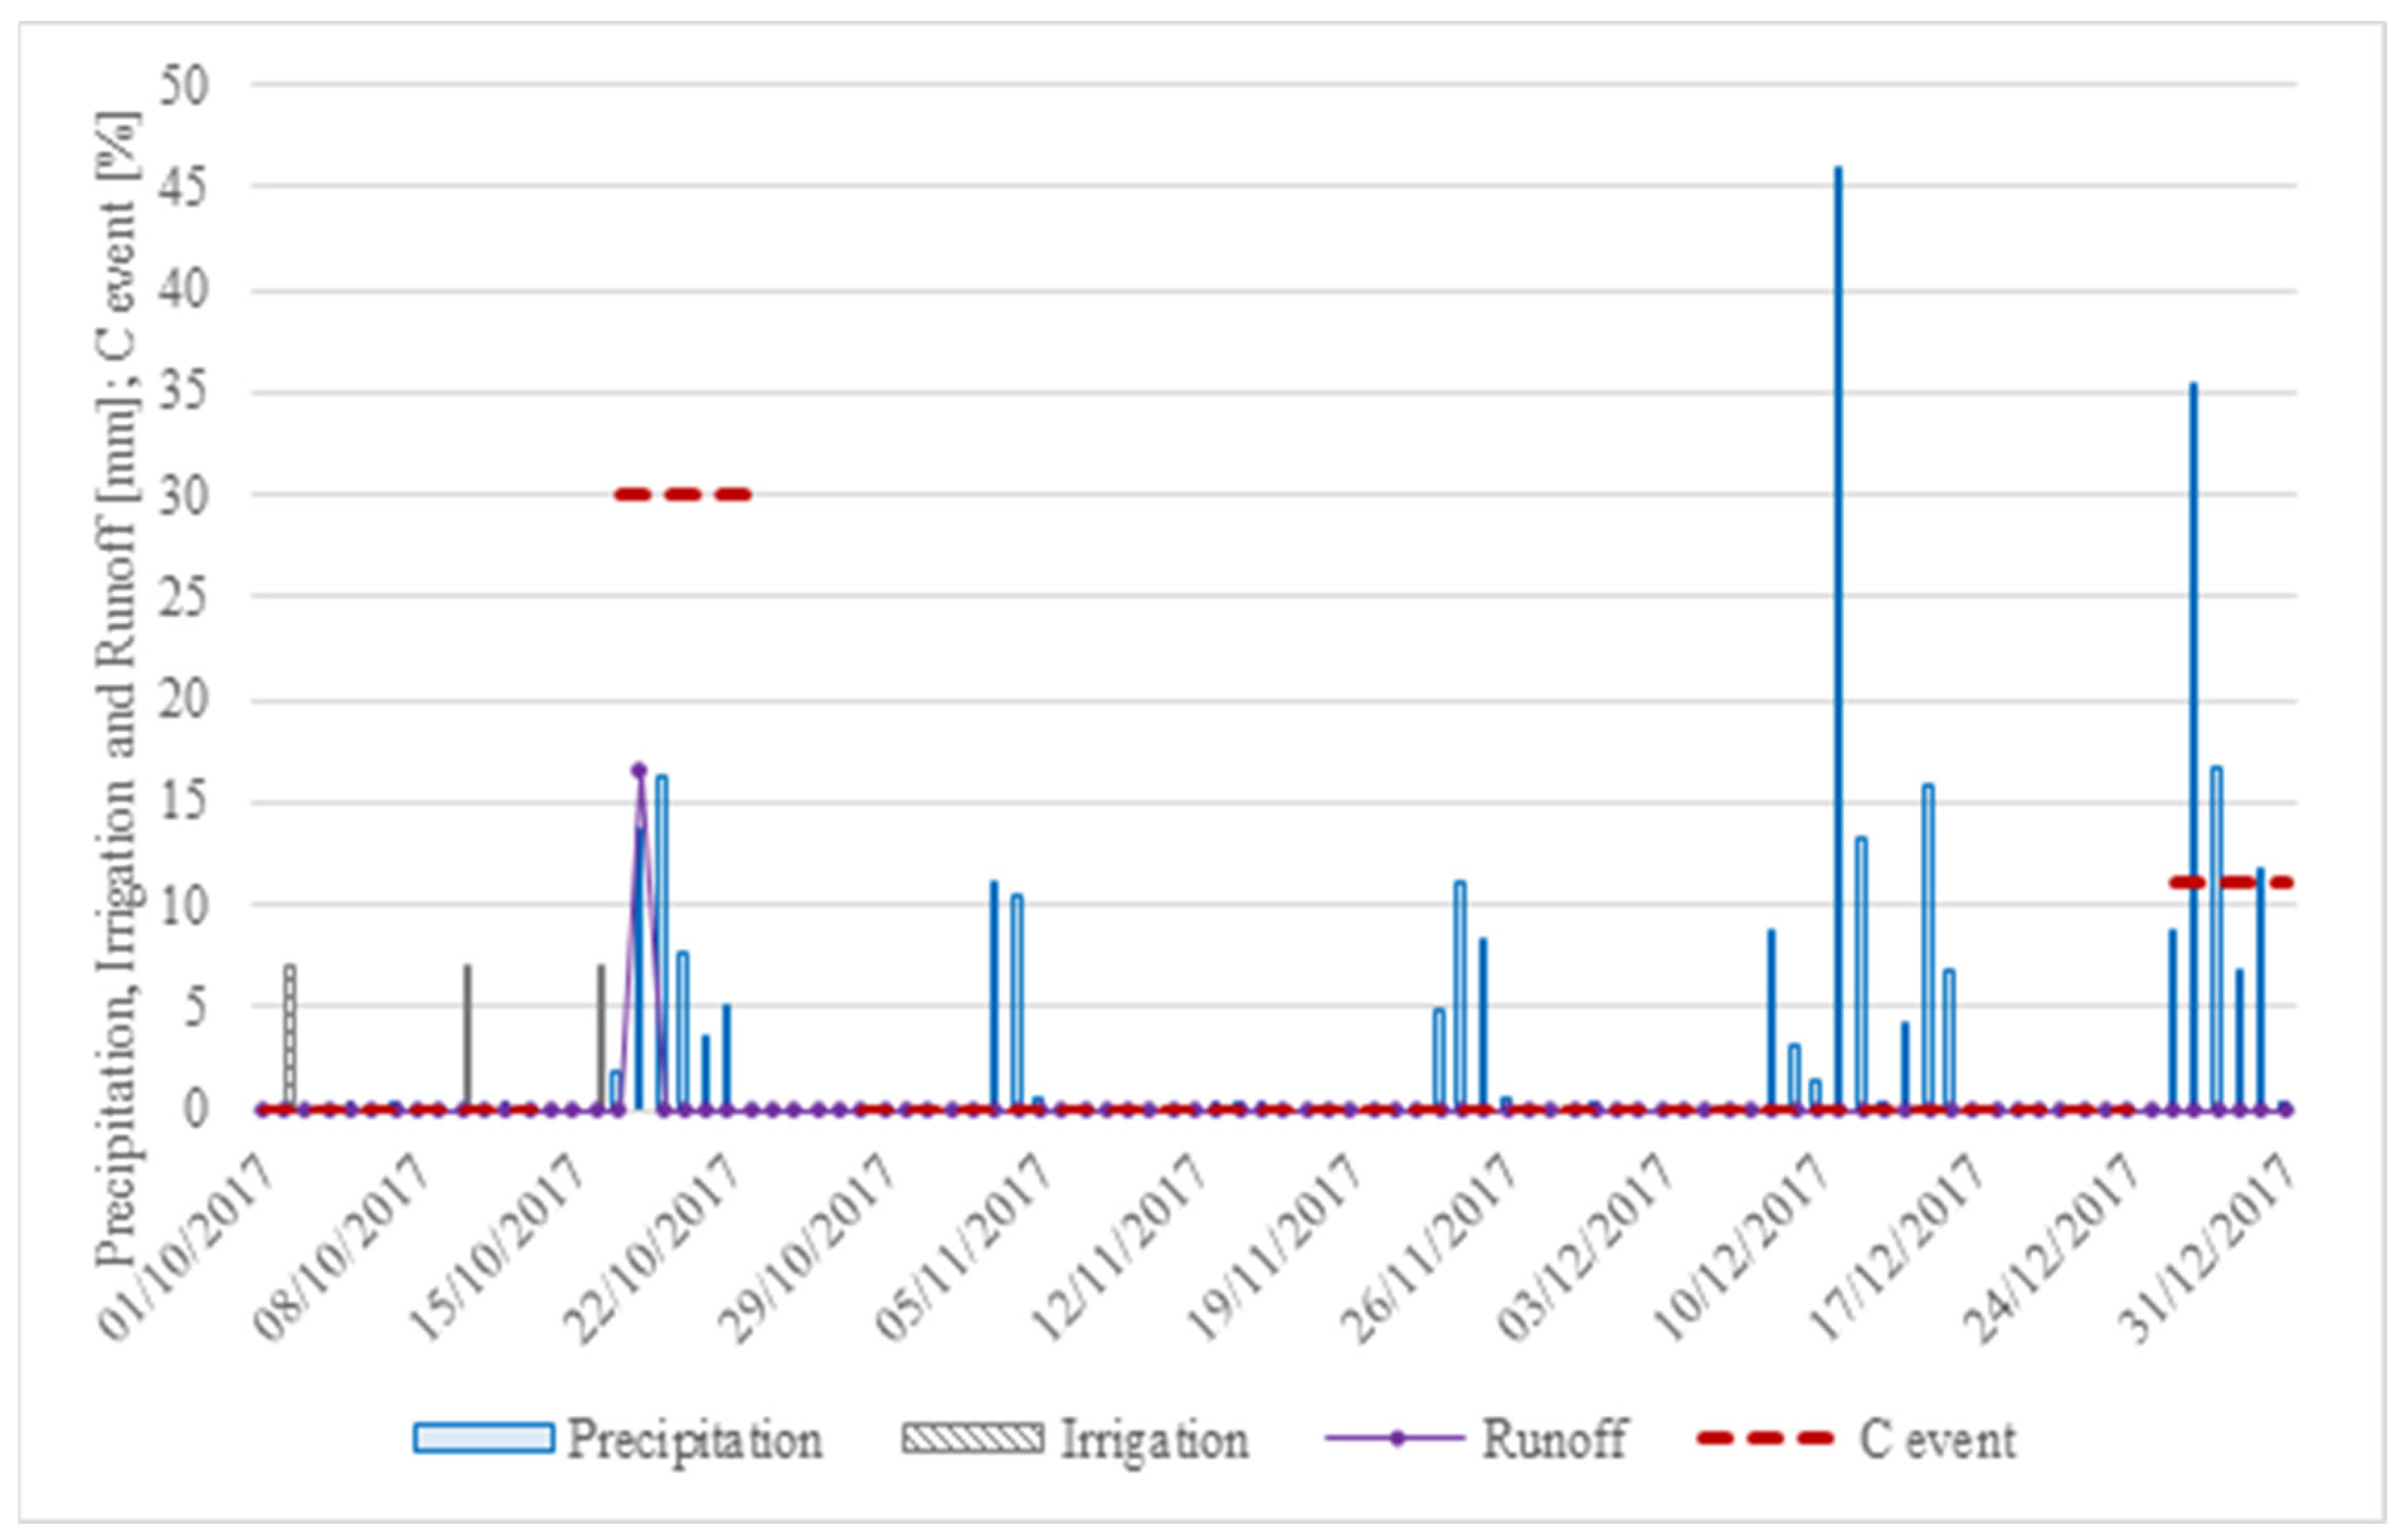
Time duration influence of each rainfall event is also clearly shown in Figure 5, Figure 6, Figure 7 and Figure 8: when analyzing the long precipitation event of February (Figure 5), a significant volume of runoff was recorded. The opposite trend has been observed in December (Figure 8), with more widely spaced events, where no discharged water from the pilot GR was registered. It is also noticeable that the runoff registered in May (Figure 6) and October (Figure 8) was affected by the irrigation performed in the previous days.
Two important factors influencing the runoff discharge are thus here presented: (1) the duration of the rainfall events, and (2) the antecedent dry weather period (interrupted by irrigation), confirming the observations and data obtained shown in Figure 5, Figure 6, Figure 7 and Figure 8. We can conclude that both parameters have a direct influence on the substrate moisture and the capacity to retain the inflow water, and, consequently, on the runoff coefficient. Their inclusion in a new, more versatile and fitted model to predict a GR runoff coefficient is thus fundamental.
3.1.3. Annual Runoff Retention Volume and Retention Rate
Monthly runoff coefficients resulting from this study (experimental data) range from 0 to 0.46, with an average value of 0.07. This low average value is due to the number of months that presented no runoff, namely the warm and hot ones. These values are comparable with previous reported studies, such as Zhang et al. [11] that presented a stormwater retention rate for an extensive GR in Chongqing, China (a humid subtropical climate—Cfa climate) ranging from 35.5 to 100%, with an average of 77.2%. Furthermore, the annual retention volume and the annual retention rate of the present study (extensive GR with 0.4 m2) resulted in 1095.5 mm and 89.6%, respectively, which is also comparable with the results achieved by Zhang et al. [11], that reached annual retention volume and retention rates of 758.7 mm and 68.0%, respectively. Our slightly higher retention volumes could be explained due to the warmer and dry climate of the Mediterranean region, which influences and allows higher rates of rainwater retention by the GR system. Brandão et al. [24] reported that retention values varied with storm events, ranging between 12 and 100%, with median values of 100–47% for the low intensity/short duration events and high intensity/long duration events, respectively. Tests were performed in extensive GR test beds in Lisbon (characterized to be a Mediterranean climate) during the autumn/winter period. Retention capacity of a GR should decrease with the total rainfall depth, due to the saturation process. On the other hand, the higher GRs retention capacity, the longer delay of stormwater from the GR system should be expected [14].
3.1.4. Assessment of Different Approaches to Determine the Runoff Coefficient
Results for this assessment are presented in Figure 9A–D, where the broken lines are representing runoff coefficients calculated through a month, a week, or through an independent rain event. The bars correspond to the monthly precipitation. Y-axes are different for the two parts of the figure, for a better understanding of the differences between the results. For comparison purposes, only the rainfall events that caused flow downstream of the GR system are represented (precipitation events that happened outside these periods corresponded to null runoff coefficients, which reflects a total absorption of the rainwater by the GR system).
Results show that runoff coefficient changes when calculated using different time approaches. Generally, higher runoff coefficient values are achieved for weekly coefficients, and lower values are obtained for monthly runoff coefficient calculation. When considering practical and real environmental conditions application, it will probably be more appropriate to use a weekly or per independent rain event runoff coefficient. Nevertheless, it is necessary to consider the two main applications of this coefficient: GR drainage systems design and GR runoff performance study.
Values obtained for runoff coefficient from the independent rainfall events, ranging from 0.017 to 0.764, are presented in Table 2. The runoff coefficient achieved values are in accordance with the ones presented in previous studies determined for single rainfall events in extensive GRs. Schärer et al. [22] presented runoff coefficients ranging from 0.023–0.41 in extensive GRs located in four Norway cities, colder than Porto region, which explains higher runoff values. Palla et al. [7] registered, in Italy, an average retained volume of 51.5%, with a high standard deviation (40.7%). Gong et al. [19] registered in Beijing a runoff retention rate between 12.1 and 100% for five types of extensive GRs. In addition, in China, Liu et al. [6] studied different models of extensive GRs and observed a runoff retention for these GRs ranging between 17.6 and 42.1%, with an average value of 33.2% under low rainfall intensities, and an average runoff retention of 23.0% (ranged from 6.7–37.1%) under high rainfall intensities. Locatelli et al. [25] reported an average runoff coefficient between 0.43 and 0.68 after monitoring three extensive GRs over 22 years. Furthermore, Garofalo et al. [18] observed that for rainfall events with durations less than 5 h, the runoff coefficient is significantly variable, while for rainfall durations greater than 5 h, the runoff coefficient is consistently above 0.80. The author explained that higher runoff coefficient is generated by longer precipitation since under those circumstances, the substrate reaches the field capacity and will not retain the rainfall volume, and will completely drain out. However, for high rainfall events with lower durations, the substrate behavior is mainly influenced by the initial moisture condition, suggesting that the antecedent dry weather period is an important influencing factor. All these differences in runoff coefficients published in several research studies might be explained not only due to difference in precipitation amounts and rainfall intensities, but also due to differences in GR structures, regarding vegetation used, growing substrate composition, and substrate layer depth.
The maximum storage capacity for our pilot GR is 189.4 mm for the first rain event (Table 2), as defined by Bengtsson et al. [23], as the difference between precipitation depth and runoff depth for a rainfall event. This value represents the limit from which all the precipitation will be discharged as runoff from the GR system.
When designing and dimensioning drainage systems downstream of a GR structure, it is necessary to consider the rain event with the highest intensity (associated with a known return period). In this scope, it is more correct to use the worst runoff coefficient obtained from rain events that took place on the location where the GR will be implemented because that is the runoff coefficient related to the highest amount of water discharged on the drainage system downstream. In this case study, it would be the value of 0.764, attained for the rain event that took place on 26th January 2018 (Figure 8, Table 2). It also could be seen that long events lead to a saturation of the growing substrate and afterwards to the direct discharge of the precipitation to runoff (without further retention), and that shorter events, if not too intense, would result in lower runoff coefficients.
In GR runoff performance studies, it is important to perform a broader analysis that takes into account the performance of the covering structure for a time period of at least one year. This extended time period will allow to comprise all seasons, which affect rainwater retention, due to different levels of growing substrate water retention capacity and different vegetation evapotranspiration rate. Based on this, it is crucial to perform this analysis using runoff coefficients relative to each rainfall event. Furthermore, future pilot experiments performed in real environmental conditions should also measure and monitor the evapotranspiration rate of the vegetation used, since it varies between different species regarding the leaf surface area, and influences the runoff coefficient calculation in modeling equations, as it affects substrate humidity and consequently water retention (water balance) of the pilot GR system. However, the use of monthly or weekly runoff coefficients might be more practicable and result in similar outcomes when long-term performance is evaluated.
3.2. Simulation Performance of an Extensive GR
Given the importance of runoff coefficient for GR design, we believe it is important to perform a simulation study using the different estimated runoff coefficients. The goal is to assess how a GR with similar characteristics to the pilot one, but with an area of 200 m2, would perform considering each runoff coefficient (monthly, weekly, and per independent rain event). According to the recorded values for the study period, its real performance must also be simulated for comparison purposes. Results might determine what would be the most suitable approach.
The obtained values of runoff for the simulated GR and the respective retention performance are presented in Table 3. The difference between the annual water inflow into the GR (precipitation and irrigation) and the annual water outflow (water that runoffs downstream the system), divided by the annual inflow, corresponds to the rainwater retention rate. The real value was determined by making a balance at the end of the experience with the pilot GR, considering the total amount of water that entered the pilot GR and the total amount that left through the drainage, and extrapolating to the 200 m2 area of the simulated one.
Results show a similar outcome for the runoff coefficient when using monthly, weekly, or per independent rain event because the large study period embraces the variations of the results. In other words, the sum of the shorter water balances meets the result of the monthly average ones. This indicates that the use of monthly values for runoff coefficient, although not suitable for sizing drainage systems, might be used to estimate their long-term performance. The use of the runoff coefficient value determined by the previously developed model results in a slightly lower value than the others (weekly and per independent rain event). It could be concluded that the obtained values with the estimated runoff coefficient are similar to the “real” value.
Artificial experimentation studies can also overestimate the benefits because the test rigs have 100% green coverage, whereas in real scenarios, GRs often have quite high proportions of conventional roof surface at the periphery to provide access for maintenance. Investigating a well-established, real GR which is subject to local weather patterns, will reveal GR characteristics that can be sensibly applied to the real world [20].
4. Conclusions
Runoff coefficient determinations in newly installed GR systems are fundamental to assess their hydrological performance and to size the drainage networks downstream. Runoff coefficient determinations must be made by feasible models that reproduce their retention behavior as realistically as possible. This research study focused on the runoff coefficient determination for an extensive GR, using experimental data and comparing it to a previously proposed developed model for monthly runoff coefficient determination in the Mediterranean region. It also assessed the use of different time periods to determine this coefficient. Results showed the following:
- Adaptation of the previous developed model to the present experimental data, which have been obtained in a different year with a different climate pattern, resulted in a very low correlation coefficient. This conclusion denotes the need to develop a new model that is more robust and takes into consideration other variables from local climate characteristics (e.g. air humidity, solar radiation, and antecedent dry weather period) and GR system composition (e.g. substrate mixture, vegetation type, and retention capacity).
- The monthly determination approach resulted in lower runoff coefficient values (0–0.46), than the weekly or per independent rain event (0.017.0.764) determination. When applied to a long-term performance analysis, this study showed no significant differences when using the monthly, weekly, or per independent rain event runoff, resulting in a variation of only 0.9 m3 of annual runoff. This indicates that the use of monthly values for runoff coefficient, although not suitable for sizing drainage systems, might be used to estimate their long-term performance. Overall, the pilot GR presented an annual retention volume and an annual retention rate of 1095.5 mm and 89.6%, respectively, in a year with a total precipitation of 1089 mm.
Future developments of this study should consider the development of a more versatile and suitable model to estimate the runoff coefficient of extensive GRs placed in the Mediterranean region, and then assess its implementation on a real large-scale environment. A performance study of the GR should also be made, using monthly and weekly runoff coefficients in different climate conditions to validate the preliminary results of this study, using in situ data collection.
The main limitation of this study was the size of the pilot GR, which can limit the absorption capacity of the substrate and result in lower retention capacities. In addition, the plants were new and needed irrigation to consolidate, which raised the moisture of the substrate, leading to the reduction in its absorption capacity.
Recently, there is an increasing interest in developing more cost-effective GR designs that use alternative building materials for liners and substrates, combine vegetated roofs with solar energy production, and create multi-purpose recreational spaces. Given the sustainability of GRs over their full life cycle, policies are needed that encourage their use through regulation or financial incentives (such as water or property fee reduction), conditional to a pre-defined sustainable development goal attainment.
Author Contributions
Conceptualization, C.M.M. and P.M.L.C.; methodology, C.M.M. and C.S.; validation, C.M.M.; formal analysis, C.M.M. and C.S.; investigation, C.M.M.; resources, C.M.M. and P.M.L.C.; data curation, C.M.M. and C.S.; writing—original draft preparation, C.M.M. and C.S.; writing—review and editing, C.M.M., C.S. and P.M.L.C.; supervision, P.M.L.C. All authors have read and agreed to the published version of the manuscript.
Funding
This research was funded by Fundação para a Ciência e Tecnologia (FCT) and Fundo Social Europeu through the program POPH—QREN-research grant SFRH/BPD/80885/2011. This work was also supported by National Funds from FCT—Fundação para a Ciência e Tecnologia through project UIDB/50016/2020.
Data Availability Statement
Data will be made available on request.
Acknowledgments
Authors are grateful to ISEP (Instituto Superior de Engenharia do Porto) for the access to the meteorological station data and to SaintGobain®—Portugal, for the supplied expanded clay.
Conflicts of Interest
The authors declare no conflict of interest.
References
- Liu, W.; Feng, Q.; Deo, C.R.; Yao, L.; Wei, W. Experimental Study on the Rainfall-Runoff Responses of Typical Urban Surfaces and Two Green Infrastructures Using Scale-Based Models. Environ. Manag. 2020, 66, 683–693. [Google Scholar] [CrossRef] [PubMed]
- Cristiano, E.; Farris, S.; Deidda, R.; Viola, F. Comparison of blue-green solutions for urban flood mitigation: A multi-city large-scale analysis. PLoS ONE 2021, 16, e0246429. [Google Scholar] [CrossRef] [PubMed]
- Kolasa-Więcek, A.; Suszanowicz, D. The green roofs for reduction in the load on rainwater drainage in highly urbanised areas. Environ. Sci. Pollut. Res. Int. 2021, 28, 34269–34277. [Google Scholar] [CrossRef] [PubMed]
- Kayhanian, M.; Li, H.; Harvey, J.T.; Liang, X. Application of permebale pavements in highways for stormwater runoff management and pollution prevention: California research experiences. Int. J. Transp. Sci. Technol. 2019, 8, 358–372. [Google Scholar] [CrossRef]
- EEA. What Is Green Infrastructure and Why Is It Important? European Environment Agency: Copenhagen, Denmark, 2020. [Google Scholar]
- Liu, W.; Fen, Q.; Chen, W.; Wei, W.; Deo, R.C. The influence of structural factors on stormwater runoff retention of extensive green roofs: New evidence from scale-based models and real experiments. J. Hydrol. 2019, 569, 230–238. [Google Scholar] [CrossRef]
- Palla, A.; Gnecco, I.; Lanza, L.G. Green, Hydrologic Restoration in the Urban Environment Using. Water 2010, 2, 140–154. [Google Scholar] [CrossRef]
- Monteiro, C.M.; Calheiros, C.S.C.; Pimentel-Rodrigues, C.; Silva-Afonso, A.; Castro, P.M.L. Contributions to the design of rainwater harvesting systems in buildings with green roofs in a Mediterranean climate. Water Sci. Technol. 2016, 73, 1842–1847. [Google Scholar] [CrossRef]
- Lee, J.; Lee, M.; Han, M. A pilot study to evaluate runoff quantity from green roofs. J. Environ. Manag. 2015, 152, 171–176. [Google Scholar] [CrossRef]
- Viola, F.; Hellies, M.; Deidda, R. Retention performance of green roofs in representative climates worlwide. J. Hydrol. 2017, 553, 763–772. [Google Scholar] [CrossRef]
- Zhang, Q.; Miao, L.; Wang, X.; Liu, D.; Zhu, L.; Zhou, B.; Sun, J.; Liu, J. The capacity of greening roof to reduce stormwater runoff and pollution. Landsc. Urb. Plan. 2015, 144, 142–150. [Google Scholar] [CrossRef]
- Wang, X.; Tian, Y.; Zhao, X. The influence of dual-substrate-layer extensive green roofs on rainwater runoff quantity and quality. Sci. Total Environ. 2017, 592, 465–476. [Google Scholar] [CrossRef]
- Barnhart, B.; Pettus, P.; Halam, J.; McKane, R.; Mayer, P.; Djang, K.; Brookes, A.; Moskal, L.M. Modeling the hydrologic effects of watershed-scale green roof implementation in the Pacific Northwest, United States. J. Environ. Manag. 2021, 277, 111418. [Google Scholar] [CrossRef]
- Talebi, A.; Bagg, S.; Sleep, B.E.; O’Carroll, D.M. Water retention performance of green roof technology: A comparison of canadian climates. Ecol. Eng. 2019, 126, 1–15. [Google Scholar] [CrossRef]
- Beck, H.E.; Zimmermann, N.E.; McVicar, T.R.; Vergopolan, N.; Berg, A.; Wood, E.F. Present and future Köppen-Geiger climate classification maps at 1-km resolution. Sci. Data 2018, 5, 180214. [Google Scholar] [CrossRef]
- FLL (Forschungsgesellschaft Landschaftsentwicklung Landschaftshaue). Guidelines for the Planning, Construction and Maintenance of Green Roofing—Green Roofing Guideline; Landscape Development and Landscape Research Society: Bonn, Germany, 2008. [Google Scholar]
- APA, National System for Water Resources Information. Available online: https://snirh.apambiente.pt/ (accessed on 30 July 2019).
- Garofalo, G.; Palermo, S.; Principato, F.; Theodosiou, T.; Piro, P. The influence of hydrologic parameters on the hydraulic efficiency of an extensive green roof in mediterranean area. Water 2016, 8, 44. [Google Scholar] [CrossRef]
- Gong, Y.; Yin, D.; Li, J.; Zhang, X.; Wang, W.; Fang, X.; Shi, H.; Wang, Q. Performance assessment of extensive green roof runoff flow and quality control capacity based on pilot experiments. Sci. Total Environ. 2019, 687, 505–515. [Google Scholar] [CrossRef]
- Speak, A.F.; Rothwell, J.J.; Lindley, S.; Smith, C. Rainwater runoff retention on an aged intensive green roof. Sci. Total Environ. 2013, 461, 28–38. [Google Scholar] [CrossRef]
- Köhler, M.; Schmidt, M.; Grimme, F.W.; Laar, M.; Gusmão, F. Urban water retention by greened roofs in temperate and tropical climate. Technol. Resour. Manag. Dev. 2001, 2, 151–162. [Google Scholar]
- Schärer, L.A.; Busklein, J.O.; Sivertsen, E.; Muthanna, T.M. Limitations in using runoff coefficients for green and gray roof design. Hydrol. Res. 2020, 51, 339–350. [Google Scholar] [CrossRef]
- Bengtsson, L.; Grahn, L.; Olsson, J. Hydrological function of a thin extensive green roof in southern Sweden. Hydrol. Res. 2005, 36, 259–268. [Google Scholar] [CrossRef]
- Brandão, C.; Cameira, M.R.; Valente, F.; Cruz de Carvalho, R.; Paço, T.A. Wet season hydrological performance of green roofs using native species under Mediterranean climate. Ecol. Eng. 2017, 102, 596–611. [Google Scholar] [CrossRef]
- Locatelli, L.; Mark, O.; Mikkelsen, P.S.; Arnbjer-Nielsen, K.; Jensen, M.B.; Binning, P.J. Modelling of green roof hydrologic performance for urban drainage applications. J. Hydrol. 2014, 519, 3237–3248. [Google Scholar] [CrossRef]
Figure 1.
Flowchart of the research work developed in this investigation.

Figure 2.
Green roof experimental set up (A) and layers scheme (B).

Figure 3.
Rainfall, temperature, and irrigation records for the study period (11 January 2017–31 January 2018).
Figure 3.
Rainfall, temperature, and irrigation records for the study period (11 January 2017–31 January 2018).

Figure 4.
Precipitation, temperature, and monthly runoff coefficient obtained from: (1) experimental data (C monthly), and (2) model proposed by Monteiro et al. [8] (C model).
Figure 4.
Precipitation, temperature, and monthly runoff coefficient obtained from: (1) experimental data (C monthly), and (2) model proposed by Monteiro et al. [8] (C model).

Figure 5.
Variation of the registered runoff from January to March.

Figure 6.
Variation of the registered runoff from April to June.

Figure 7.
Variation of the registered runoff from July to September.

Figure 8.
Variation of the registered runoff from October to December.

Figure 9.
Runoff coefficients determined with different approaches: (A) January 2017–February 2017; (B) May 2017; (C) October 2017; (D) December 2017–January 2018.
Figure 9.
Runoff coefficients determined with different approaches: (A) January 2017–February 2017; (B) May 2017; (C) October 2017; (D) December 2017–January 2018.


Table 1.
Runoff coefficient determined by experimental data and by Equation (3).
| Month | Precipitation (mm) | Temperature (°C) | Irrigation (mm) | C Monthly | C Equation (3) |
|---|---|---|---|---|---|
| January 2017 | 96.78 | 10.0 | 0 | 0.027 | 0.094 |
| February 2017 | 181.86 | 12.4 | 0 | 0.082 | 0.130 |
| March 2017 | 140.19 | 13.3 | 0 | 0.000 | 0.108 |
| April 2017 | 34.03 | 16.4 | 9.3 | 0.000 | 0.046 |
| May 2017 | 150.62 | 18.1 | 16.3 | 0.102 | 0.122 |
| June 2017 | 21.57 | 19.8 | 21.0 | 0.000 | 0.046 |
| July 2017 | 8.39 | 20.3 | 11.7 | 0.000 | 0.027 |
| August 2017 | 3.29 | 20.5 | 25.7 | 0.000 | 0.035 |
| September 2017 | 13.17 | 17.9 | 28.0 | 0.000 | 0.045 |
| October 2017 | 48.77 | 18.7 | 21.0 | 0.238 | 0.065 |
| November 2017 | 48.00 | 13.5 | 0 | 0.000 | 0.050 |
| December 2017 | 179.07 | 11.1 | 0 | 0.000 | 0.137 |
| Janaury 2018 | 163.57 | 10.7 | 0 | 0.460 | 0.115 |
| Total | 1089.3 | 133.05 | R2 = 0.121 | ||
Table 2.
Runoff coefficient determined for independent rainfall events.
| Start | End | Precipitation (mm) | Runoff (mm) | Mean T (°C) | C |
|---|---|---|---|---|---|
| 26 January | 8 February | 200.15 | 10.74 | 12.24 | 0.054 |
| 12 February | 16 February | 44.96 | 7.33 | 12.72 | 0.163 |
| 5 May | 7 May | 35.05 | 0.61 | 16.8 | 0.017 |
| 9 May | 14 May | 98.8 | 16.41 | 16.2 | 0.166 |
| 17 October | 23 October | 48.08 | 16.57 | 15.8 | 0.301 |
| 26 December | 7 January | 160.01 | 17.69 | 12.28 | 0.111 |
| 10 January | 20 January | 56.39 | 39.03 | 9.74 | 0.692 |
| 26 January | 28 January | 24.13 | 18.44 | 10.27 | 0.764 |
Note: Summer months have not been included since all precipitation volume has been retained by GR, thus not presenting any runoff.
Table 3.
Runoff performance results of the simulated GR (1 year monitoring).
| Precipitation (m3) | Irrigation * (m3) | Runoff (m3) | Retention (%) | |
|---|---|---|---|---|
| C model | 217.9 | 26.6 | 25.9 | 89.4 |
| C monthly | 24.0 | 90.2 | ||
| C weekly | 24.9 | 89.8 | ||
| C rain event | 24.8 | 89.9 | ||
| Real obtained value | 25.4 | 89.6 |
* The irrigation volume has been estimated based on the irrigation of the present experimental studies, extrapolating for a 200 m2 area.
Disclaimer/Publisher’s Note: The statements, opinions and data contained in all publications are solely those of the individual author(s) and contributor(s) and not of MDPI and/or the editor(s). MDPI and/or the editor(s) disclaim responsibility for any injury to people or property resulting from any ideas, methods, instructions or products referred to in the content. |
© 2023 by the authors. Licensee MDPI, Basel, Switzerland. This article is an open access article distributed under the terms and conditions of the Creative Commons Attribution (CC BY) license (https://creativecommons.org/licenses/by/4.0/).
Share and Cite
MDPI and ACS Style
Monteiro, C.M.; Santos, C.; Castro, P.M.L. Extensive Green Roofs: Different Time Approaches to Runoff Coefficient Determination. Water 2023, 15, 1852. https://doi.org/10.3390/w15101852
AMA Style
Monteiro CM, Santos C, Castro PML. Extensive Green Roofs: Different Time Approaches to Runoff Coefficient Determination. Water. 2023; 15(10):1852. https://doi.org/10.3390/w15101852
Chicago/Turabian StyleMonteiro, Cristina M., Cristina Santos, and Paula M. L. Castro. 2023. "Extensive Green Roofs: Different Time Approaches to Runoff Coefficient Determination" Water 15, no. 10: 1852. https://doi.org/10.3390/w15101852
Note that from the first issue of 2016, this journal uses article numbers instead of page numbers. See further details here.