
Isotope Composition of Natural Water in Lake Onega Basin

1
Northern Water Problems Institute of the Karelian Research Centre of the Russian Academy of Sciences, Alexander Nevsky Ave. 50, Petrozavodsk 185003, Russia
2
Research Park, St. Petersburg State University, V.O., Dekabristov Lane 16, St. Petersburg 199155, Russia
3
N. Laverov Federal Center for Integrated Arctic Research, Ural Branch of the Russian Academy of Sciences, Northern Dvina Emb. 23, Arkhangelsk 163000, Russia
*
Author to whom correspondence should be addressed.
Water 2023, 15(10), 1855; https://doi.org/10.3390/w15101855
Submission received: 6 April 2023
/
Revised: 7 May 2023
/
Accepted: 11 May 2023
/
Published: 13 May 2023
(This article belongs to the Section Hydrology)
Abstract
:In 2009–2018, the isotopic composition of oxygen and hydrogen in the atmospheric precipitation, groundwater and river and lake water of Lake Onega basin was studied. The weighted annual isotope composition of precipitation at Petrozavodsk was δ18O = −11.7‰ and δ2H = −84‰ and varied from −30.9 to −4.1‰ for δ18O and from −23 to −22‰ for δ2H. The isotopic composition of the water in Lake Onega was relatively uniform from −11.5 to −9.3‰ for δ18O and from −85 to −71‰ for δ2H. In the bays, the isotopic composition of the water varied more substantially than in the central part of the lake due to the river runoff during springtime flooding. In late summer, the concentrations of deuterium and oxygen-18 increased in the lake water, and figurative points on the δ2H vs. δ18O diagram shifted above the meteoric line. The absorption of the isotopically heavy summer precipitation and disequilibrium isotope fractionation during evaporation led to the enrichment of the lake water by heavy isotopes. Experiments were conducted to estimate the evaporation influence on the isotope enrichment of the residual water, and a comparison of the obtained isotope data with the experimental function showed that commonly, about 4% and up to 12% of water was lost during the spring and summer, respectively. In the water of the tributaries, the abundance of the deuterium and oxygen-18 varied in a wider scale than in the lakes, from −14.4 to −9.1‰ for δ18O and from −102 to −73‰ for δ2H. An evaporation loss of up to 35% was found for the rivers in late summer, and this value was proportional to the area of lakes and wetlands in the elementary watershed. The initial isotope composition of the water in the tributaries prior to evaporation was estimated to be δ18O ≈ −14.1‰ and δ2H ≈ −103‰ on average and crossed the approximation and meteoric lines. This estimation was close to the average composition of the groundwater, i.e., δ18O ≈ −13.4‰ and δ2H ≈ −94‰ on the Lake Onega catchment. The slightly increased isotope depletion of the calculated composition in the initial river water in comparison with the groundwater was the result of the contribution of the spring snowmelt water, which had a significant influence on the lake water balance.
1. Introduction
The Ladoga and Onega lakes are Europe’s largest freshwater bodies and are unique reserves of fresh water. The management of these resources through catchments and continued efforts to maintain a high water quality is essential [1]. Lake Onega, which is located in Karelia and is connected to Ladoga Lake by the Svir’ River, is a domestic potable and industrial water supply source, a main waterway, a commercial fishing zone, a recreation area and a reservoir of the Upper Svir’ Hydroelectric Station. Forest management, mineral mining and other agricultural activities are conducted in the Lake Onega basin. These operations, which are dependent on the lake and its watershed (especially pulp and paper mill activities), can be adversely affected due to variations in hydrological and chemical regimes that are aggravated by climatic warming [1,2].
The hydrological monitoring of Lake Onega and its watershed has been carried out for several decades. Various techniques, including meteorological observations, temperature measurements, measurements of the tributary runoff, monitoring the water level of Lake Onega and the mathematical simulation of the hydrological processes have been employed since the early 1960s [3,4,5,6,7]. Clearly, the basin is experiencing significant hydrological changes, predominantly through natural processes, but the mechanisms and consequences of these changes are not yet clear [8]. There is a lack of information about the essential water balance parameters, such as the atmospheric precipitation on the lake surface and watershed, the surface runoff (only the largest tributaries are observed), the groundwater discharge into rivers and directly into Lake Onega and evaporation. Therefore, it is difficult to develop an adequate quantitative description of the water balance through a mathematical simulation of the hydrological processes. Accordingly, modern requirements for the description of the object, which are necessary for making informed management decisions, cannot be satisfied.
This is mainly due to the deterioration of the network observation quality in the 1990s and 2000s that occurred during the period with the most significant climate changes [8,9,10,11,12].
Moreover, the exchange time for Lake Onega was estimated by considering the water level fluctuation, Lake Bathymetry and the inflow volume [13]. Yet, in order to acquire more reliable data, we need to take into account the direct evaporation of the water from the lake surface. If this factor is ignored, the value of the exchange time is underestimated. Meanwhile, the water balance stations that could estimate the evaporation and transpiration in the watershed and evaporation from the lake surface have not existed for 30 years. Another problem is that groundwater might seep into Lake Onega, but this hypothesis is subject to serious debate as observation data are absent. Data on stable isotopes can provide information both for quantifying the loss of water by evaporation and to diagnose the flow of groundwater into the lake.
Environmental isotopes, such as oxygen-18 (18O) and deuterium (2H), which are included in water molecules, are widely used as global indicators, are employed to solve water management problems and are used to carry out fundamental research [14,15,16,17,18]. These isotopes (represented by δ18O and δ2H, hereinafter referred to as the isotope composition of water) are used to understand the genetic relation of surface water bodies to atmospheric precipitation and groundwater, to separate the hydrographs and to assess evaporation. Some reviews present a process-based summary of the important parameters that control δ18O or δ2H behavior in natural systems for use in mathematical models [19,20]. These studies discuss the assumptions made regarding fractionation factors and present calibration approaches, such as describing the influence of headwater conditions, the seasonality of atmospheric characteristics and specific settings such as a chain of lakes. Several studies have developed coupled hydrology and isotope mass balance models for specific lake systems [21,22,23,24,25,26].
Since 2009, the Northern Water Problems Institute (NWPI) at the Karelian Research Centre of RAS and Saint Petersburg State University (SPbSU) has been studying the water dynamics in the lake and the conditions of water-balance formation on the watershed by using stable isotope tracers (deuterium and oxygen-18) to better understand the processes responsible for Lake Onega’s conditions. Measurements in 2012–2017 in the Petrozavodsk Bay and its three tributaries and in the central part of Lake Onega showed that the snowmelt floods had the greatest effect on the water dynamics in the bay while evaporation had the greatest effect in the open lake [27,28]. Precipitation, tributaries and groundwater were sampled, and the impact of evaporation on the deuterium and oxygen-18 concentrations in the residual water was experimentally tested. A hydrograph of a small river was studied in detail, and a correlation between the precipitation events, spring flood and isotope composition of the water was obtained.
2. Site Description
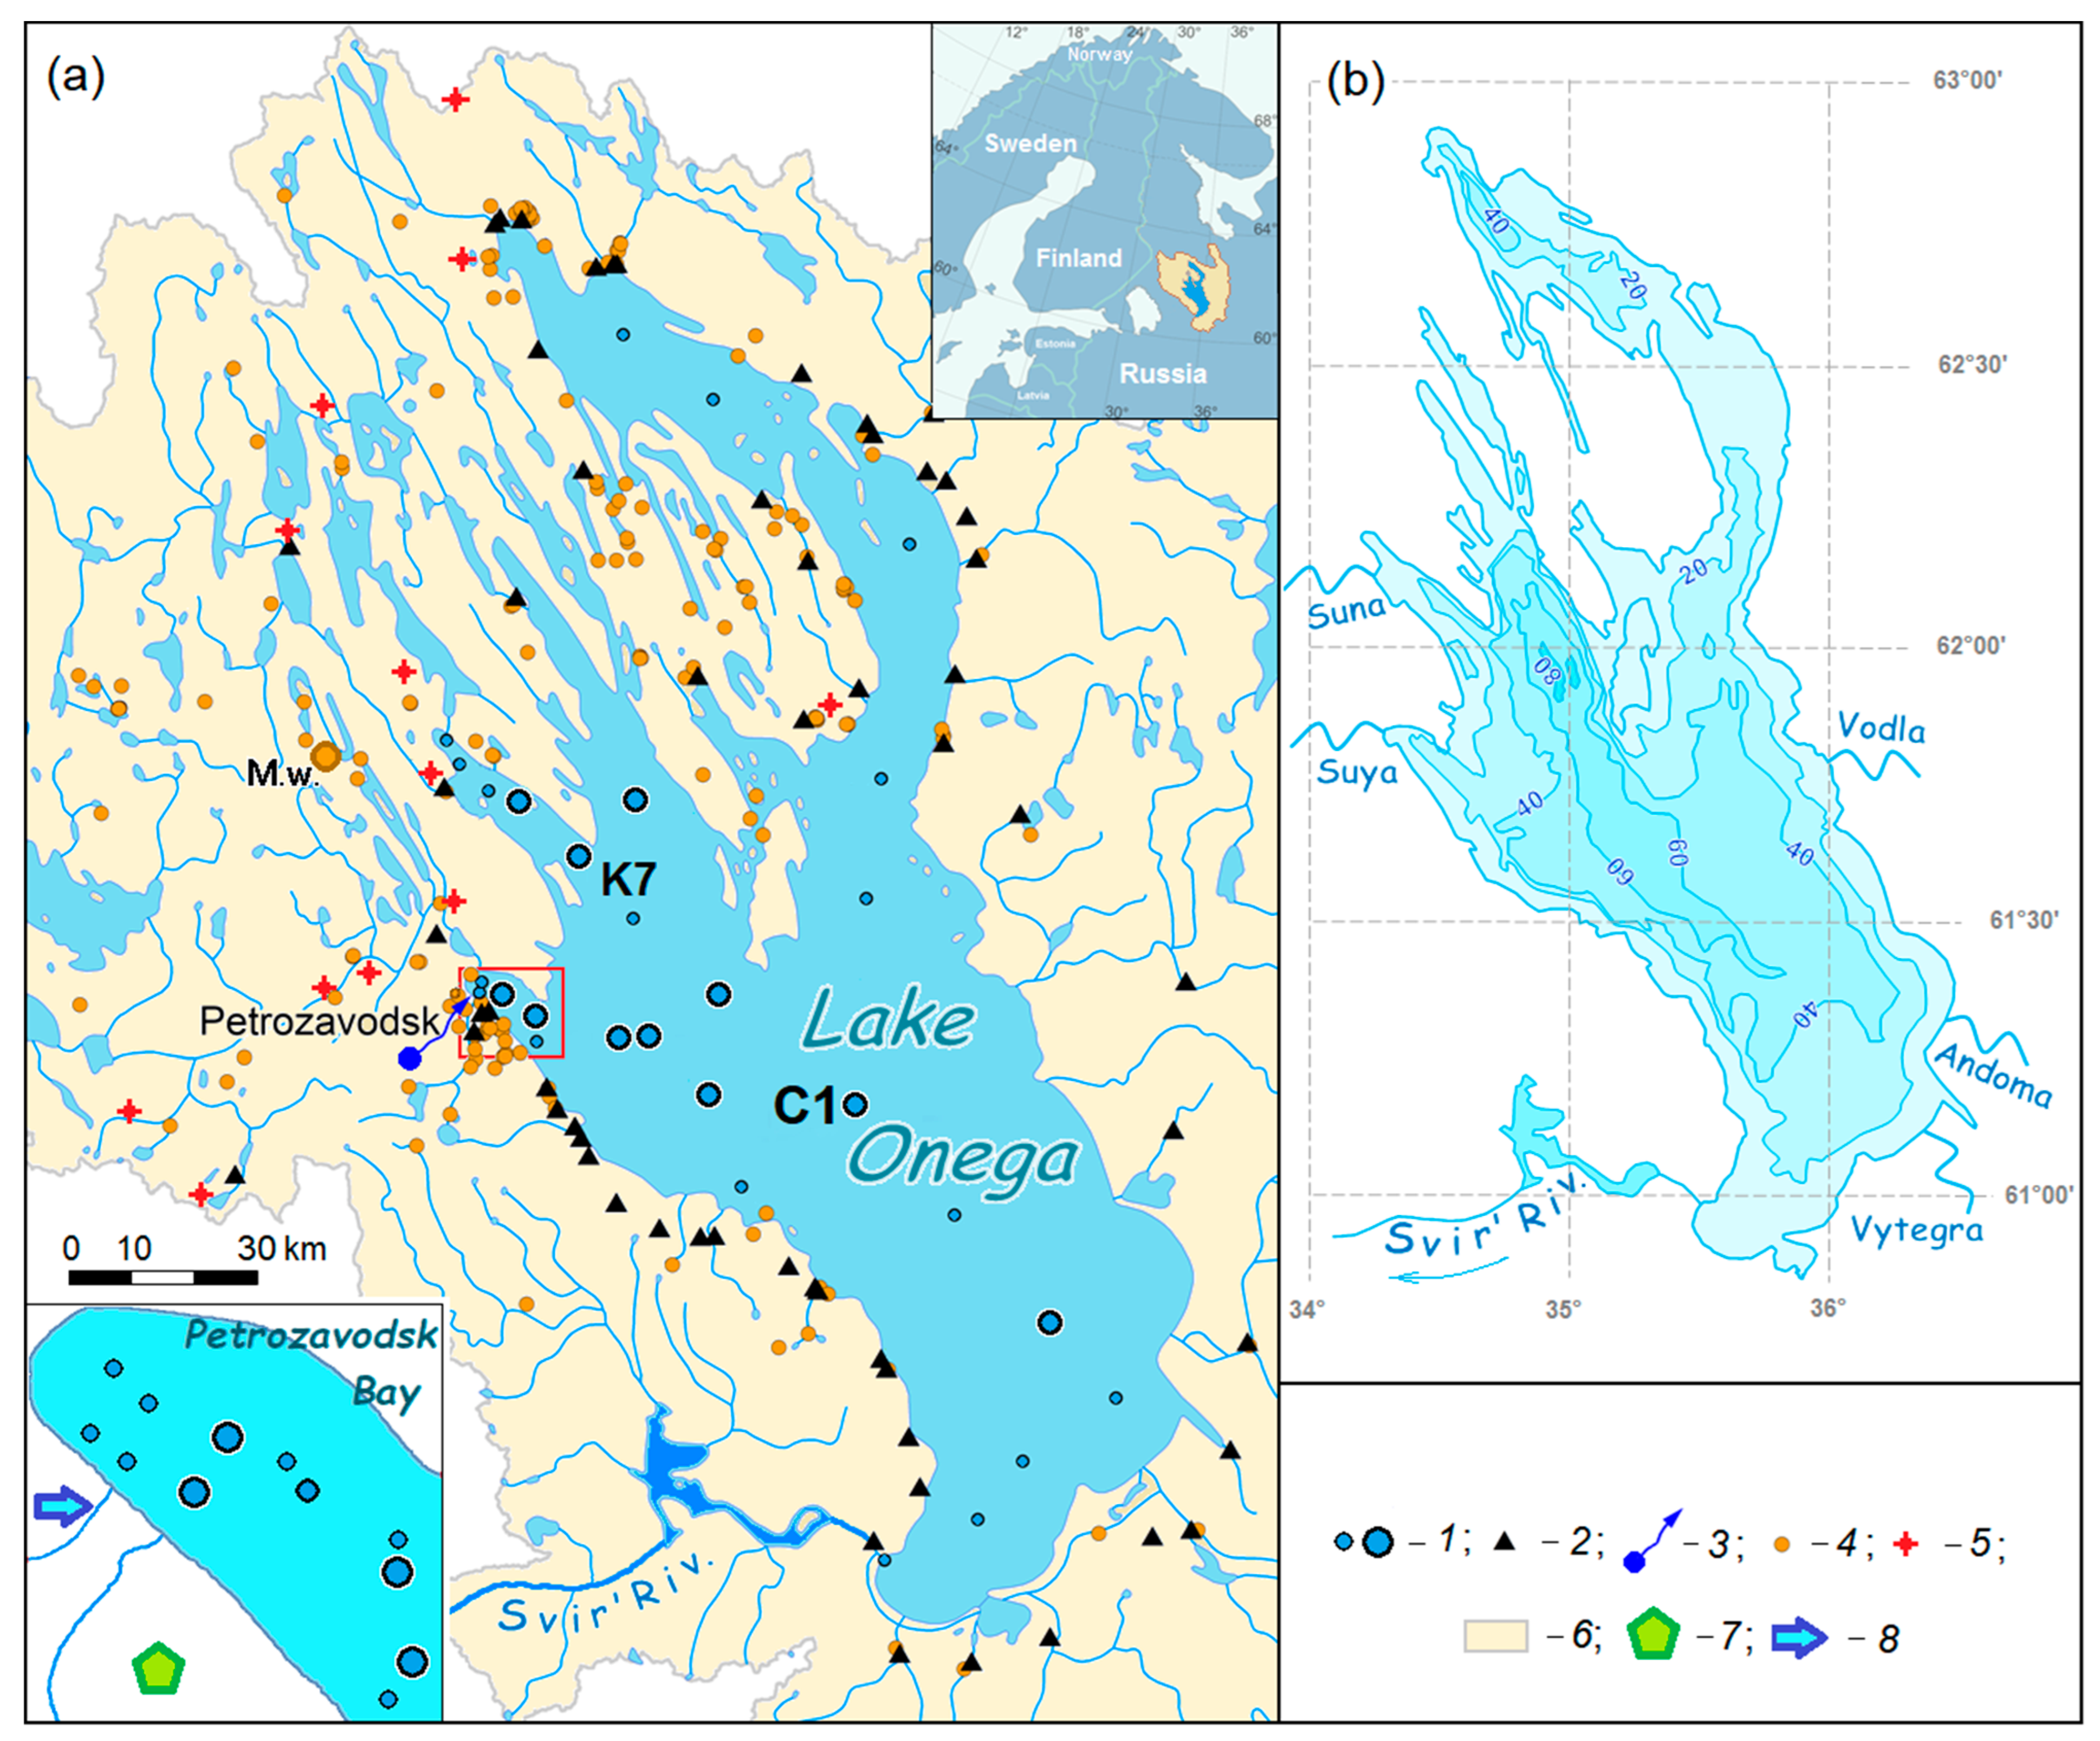
The water area of Lake Onega is 9.72 × 10³ km2, the area of islands is 225 km2 and the total surface of the catchment is 53.1 × 10³ km2 [6]. The average depth of the lake is 30 m, and the greatest depth is 132.5 m in its central part (Figure 1). The northern part of the lake has several large bays, which extend up to 70 km inland, with a width of up to 32 km and depths of up to 111–124 m. These depressions are elongated from northwest to southeast, and continuations of the lakes are also elongated in the northwest direction. The lowest annual water level of the lake is usually observed in April before the ice begins to float in the spring, while the highest level is observed from June to July. During the past 20 years, the largest difference between the spring and summer levels was 1.8 m. The transparency of the water reaches 8 m, and the average is about 3–4 m [1,29].
In sum, Lake Onega contains 1152 river tributaries, but only 52 are over 10 km long [6]. Rivers make up 76% of the water balance of Lake Onega (17.1 km3/year), and 24% of atmospheric precipitation occurs directly over the lake water area. The groundwater inflow is affected by the rivers and is quantitatively taken into account when measuring the hydrograph separation of the annual runoff. The direct groundwater discharge in the lake (bypassing the river network) is less than 1% [30,31]. The Svir’ River connects the Onega and Ladoga lakes and carries about 84% (18.8 km3/year) of the runoff from Lake Onega, while 16% is consumed by evaporation. The water regime of the Svir’ River is completely regulated by the dam in the upper part of the river.
Lake Onega has a dimictic water circulation scheme, which is affected by the wind trajectories and the water inflow from the tributaries. In the winter, the lake is covered with a continuous ice cover. Currents in the lake remain constant only at the mouths of the rivers flowing into the lake and against the mouth of the Svir’ River. A thermobar (frontal zone) is formed in the spring–summer season and divides the lake into two areas: (a) stratified coastal and (b) homothermal deep water. A thermobar begins to form after the ice thaws when the near-shore shallow-water regions are heated to a temperature of maximal density (4 °C) more rapidly than the volume of the deep water. Long-term data show that the thermobar disappears in late June. Direct thermal stratification is then established and a summer heating period begins [1,6].
By the time of the June sampling, the water in the bays had already been warmed. The temperature of the surface layer at some stations was up to 10 °C, and the bottom temperature was 3.6–6.0 °C. In the open lake water, the temperature in June did not exceed 4 °C (minimum 2.5 °C). The sampling in late summer and early autumn overlapped with the onset of homeothermy in the lake at a mean water temperature of 6–8 °C. In this period, the water temperature started to decrease. The upper part of the water column, which reaches up to 20 m, was still warm (with temperatures up to +9.5 °C), while the lower part was colder (maximum +6.6 °C).
3. Materials and Methods
Lake water area. Water samples were collected from the “Ecologist” Research Vessel using equipment from the Core Facility of the Karelian Research Centre of the Russian Academy of Sciences (Petrozavodsk city, Russia) at monitoring stations located in the bays and in the open part of the lake (Figure 1). Fieldwork mainly took place in the summer and autumn from 2012–2017. In March 2015, 2016 and 2017, water samples were taken from the ice at Petrozavodsk Bay (stations with index “P”, Figure 1) and in the central part of the lake (stations “C”). Seven ice samples were also taken in Petrozavodsk Bay. At most stations, the water samples were collected with a bathometer from the surface layer (1 m) and the near-bottom layer. At some stations, the water body was sampled in more detail (by 4–8 different intervals at depth). The samples were filtered, poured into 20–40 mL plastic vials, hermetically sealed and stored in a refrigerator at 4 degrees, usually in an intermediate container, to avoid the influence of evaporation. About 415 water samples were analyzed in total.
Tributaries. From 2014–2018, the largest tributaries in the lower reach of the rivers were sampled in different seasons (Figure 1). In 2008–2018 and in 2012–2017, runoff monitoring (flow volume, temperature, electrical conductivity, δ2H and δ18O analyses) was carried out in a small river called the Neglinka River (with a watershed area of 17 km2). Samples from the Neglinka River were collected weekly during low water periods and daily during spring flooding. A total of 150 samples from 53 of the largest tributaries and about 420 samples from the Neglinka River were analyzed.
Groundwater. The basin of Lake Onega is located at the junction of the Baltic shield and the Russian platform. Water from the sedimentary complexes and crystalline rocks was analyzed. Samples were taken only from flowing wells or operating wells with an electrical pump and from ascending springs. This method allows for the exclusion of the influence of human, seasonal and other random factors. About 280 water samples were collected.
Atmospheric precipitation. The collection of the atmospheric precipitation was carried out in Petrozavodsk city on the roof of the IWPN building (61°47′ N, 34°21′ E, altitude 94 m) in 2009–2018. Samples were taken based on a weekly average and after periods of massive precipitation. Depending on the weather conditions, the number of samples per month varied from 2 to 12. Rainfall was collected by a sampler consisting of a receiving funnel and a 1-liter storage tank, to which synthetic oil was added to prevent evaporation. Snow was collected in a plastic bag and placed in a rain gauge. The snow was then melted at room temperature, and the volume of the water was measured. A total of 413 samples were analyzed. The isotope composition of the snow cover was studied using a submeridional and two sublatitudinal profiles in March 2016. Forty-five sites were sampled, and the results are described in Borodulina et al. [32].
Evaporation experiments. In 2014–2016, a total of 28 experiments were carried out to estimate the influence of the disequilibrium isotopic fractionation during evaporation on the deuterium and oxygen-18 concentrations in the residual water. Atmospheric precipitation with an initial volume of 3 L, which was poured into the glass chemical crystallizer, was used for the experiment, and every one-to-two days, a 2 mL sample was taken from the evaporator. At the same time, the temperature and volume of the residual water were measured (the air temperature was taken from the weather station). During the experiment, the isotopic composition of the residual water became less depleted, which was clearly seen during the analysis. The approximation lines on the deuterium vs. oxygen-18 diagram for the evaporation process in April–May and the first half of June were δ2H = 4.69 × δ18O − 33.0 and Δ(δ18O) = 25.9 × ξ, and those for July–September were δ2H = 5.59 × δ18O − 18.5 and Δ(δ18O) = 17.4 × ξ, where ξ is the amount of evaporated water and Δ(δ18O) is the shift in the isotope composition of oxygen.
Analytical method. The deuterium and oxygen-18 concentrations in the water were measured using the Picarro L-2120-i laser infrared analyzer from the Center of X-ray Diffraction Studies at the Research Park of St. Petersburg State University (St. Petersburg, Russia). All the results are presented as parts per thousand relative to the composition of the average oceanic water (SMOW). The International Atomic Energy Agency standards V-SMOW-2, GISP and SLAP and the United States Geological Survey standards USGS-45 and USGS-46 were used. The uncertainty of the measurements was ±0.1‰ for oxygen-18 and ±1‰ for deuterium.
4. Results
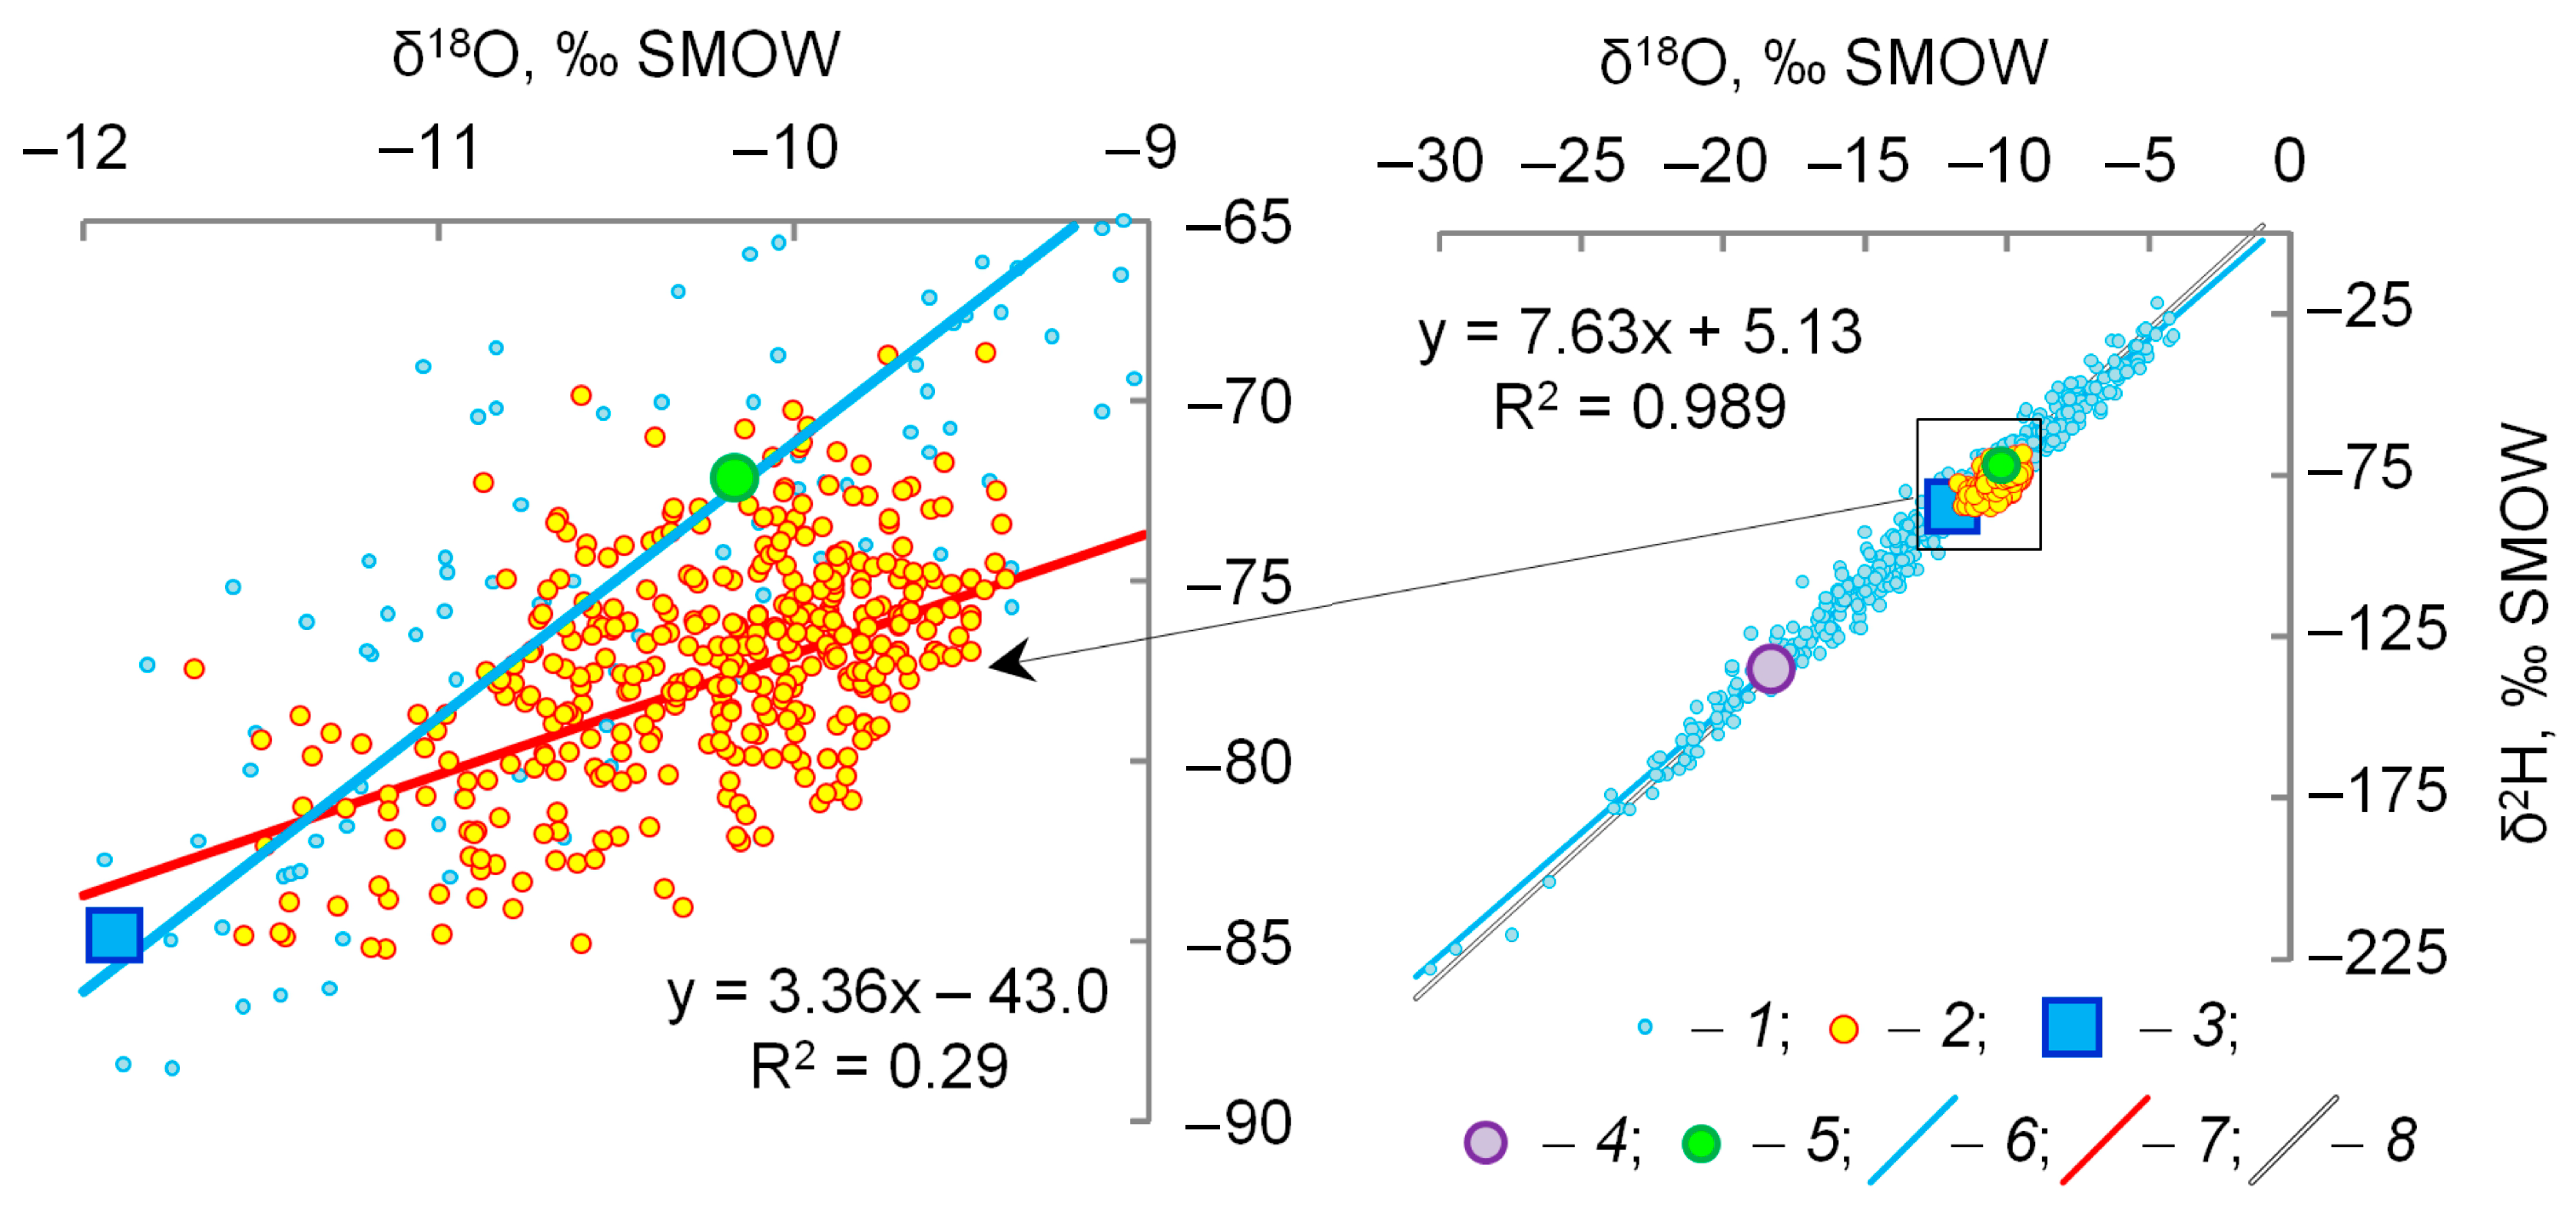
Atmospheric precipitation. In 2009–2018, the natural time course of the isotope composition of the atmospheric precipitation was studied. The most depleted isotope composition of snow was δ18O = −30.9‰ and δ2H = −239‰, and the heaviest isotope composition of rain was δ18O = −4.1‰ and δ2H = −26‰. The weighted mean annual composition of the atmospheric precipitation δ18O = −11.7‰ and δ2H = −83‰ was calculated with regard to the volume and composition of the precipitation by equation δ’ = Ʃ(δi × wi)/Ʃwi, where δi is the isotope composition and wi is the volume of the i-th atmospheric precipitation. The local meteoric water line (LMWL) is described by the equation δ2H = 7.63 × δ18O + 5.13 (Figure 2). The statistical characteristics of the isotope composition of the atmospheric precipitation for each season are shown in Table 1.
Lake Onega. The isotope composition of the water in Lake Onega was generally uniform and it varied from −11.6 to −9.3‰ for δ18O and from −85 to −69‰ for δ2H. Practically, it was always slightly heavier than the weighted mean annual composition of the precipitation (Figure 2).
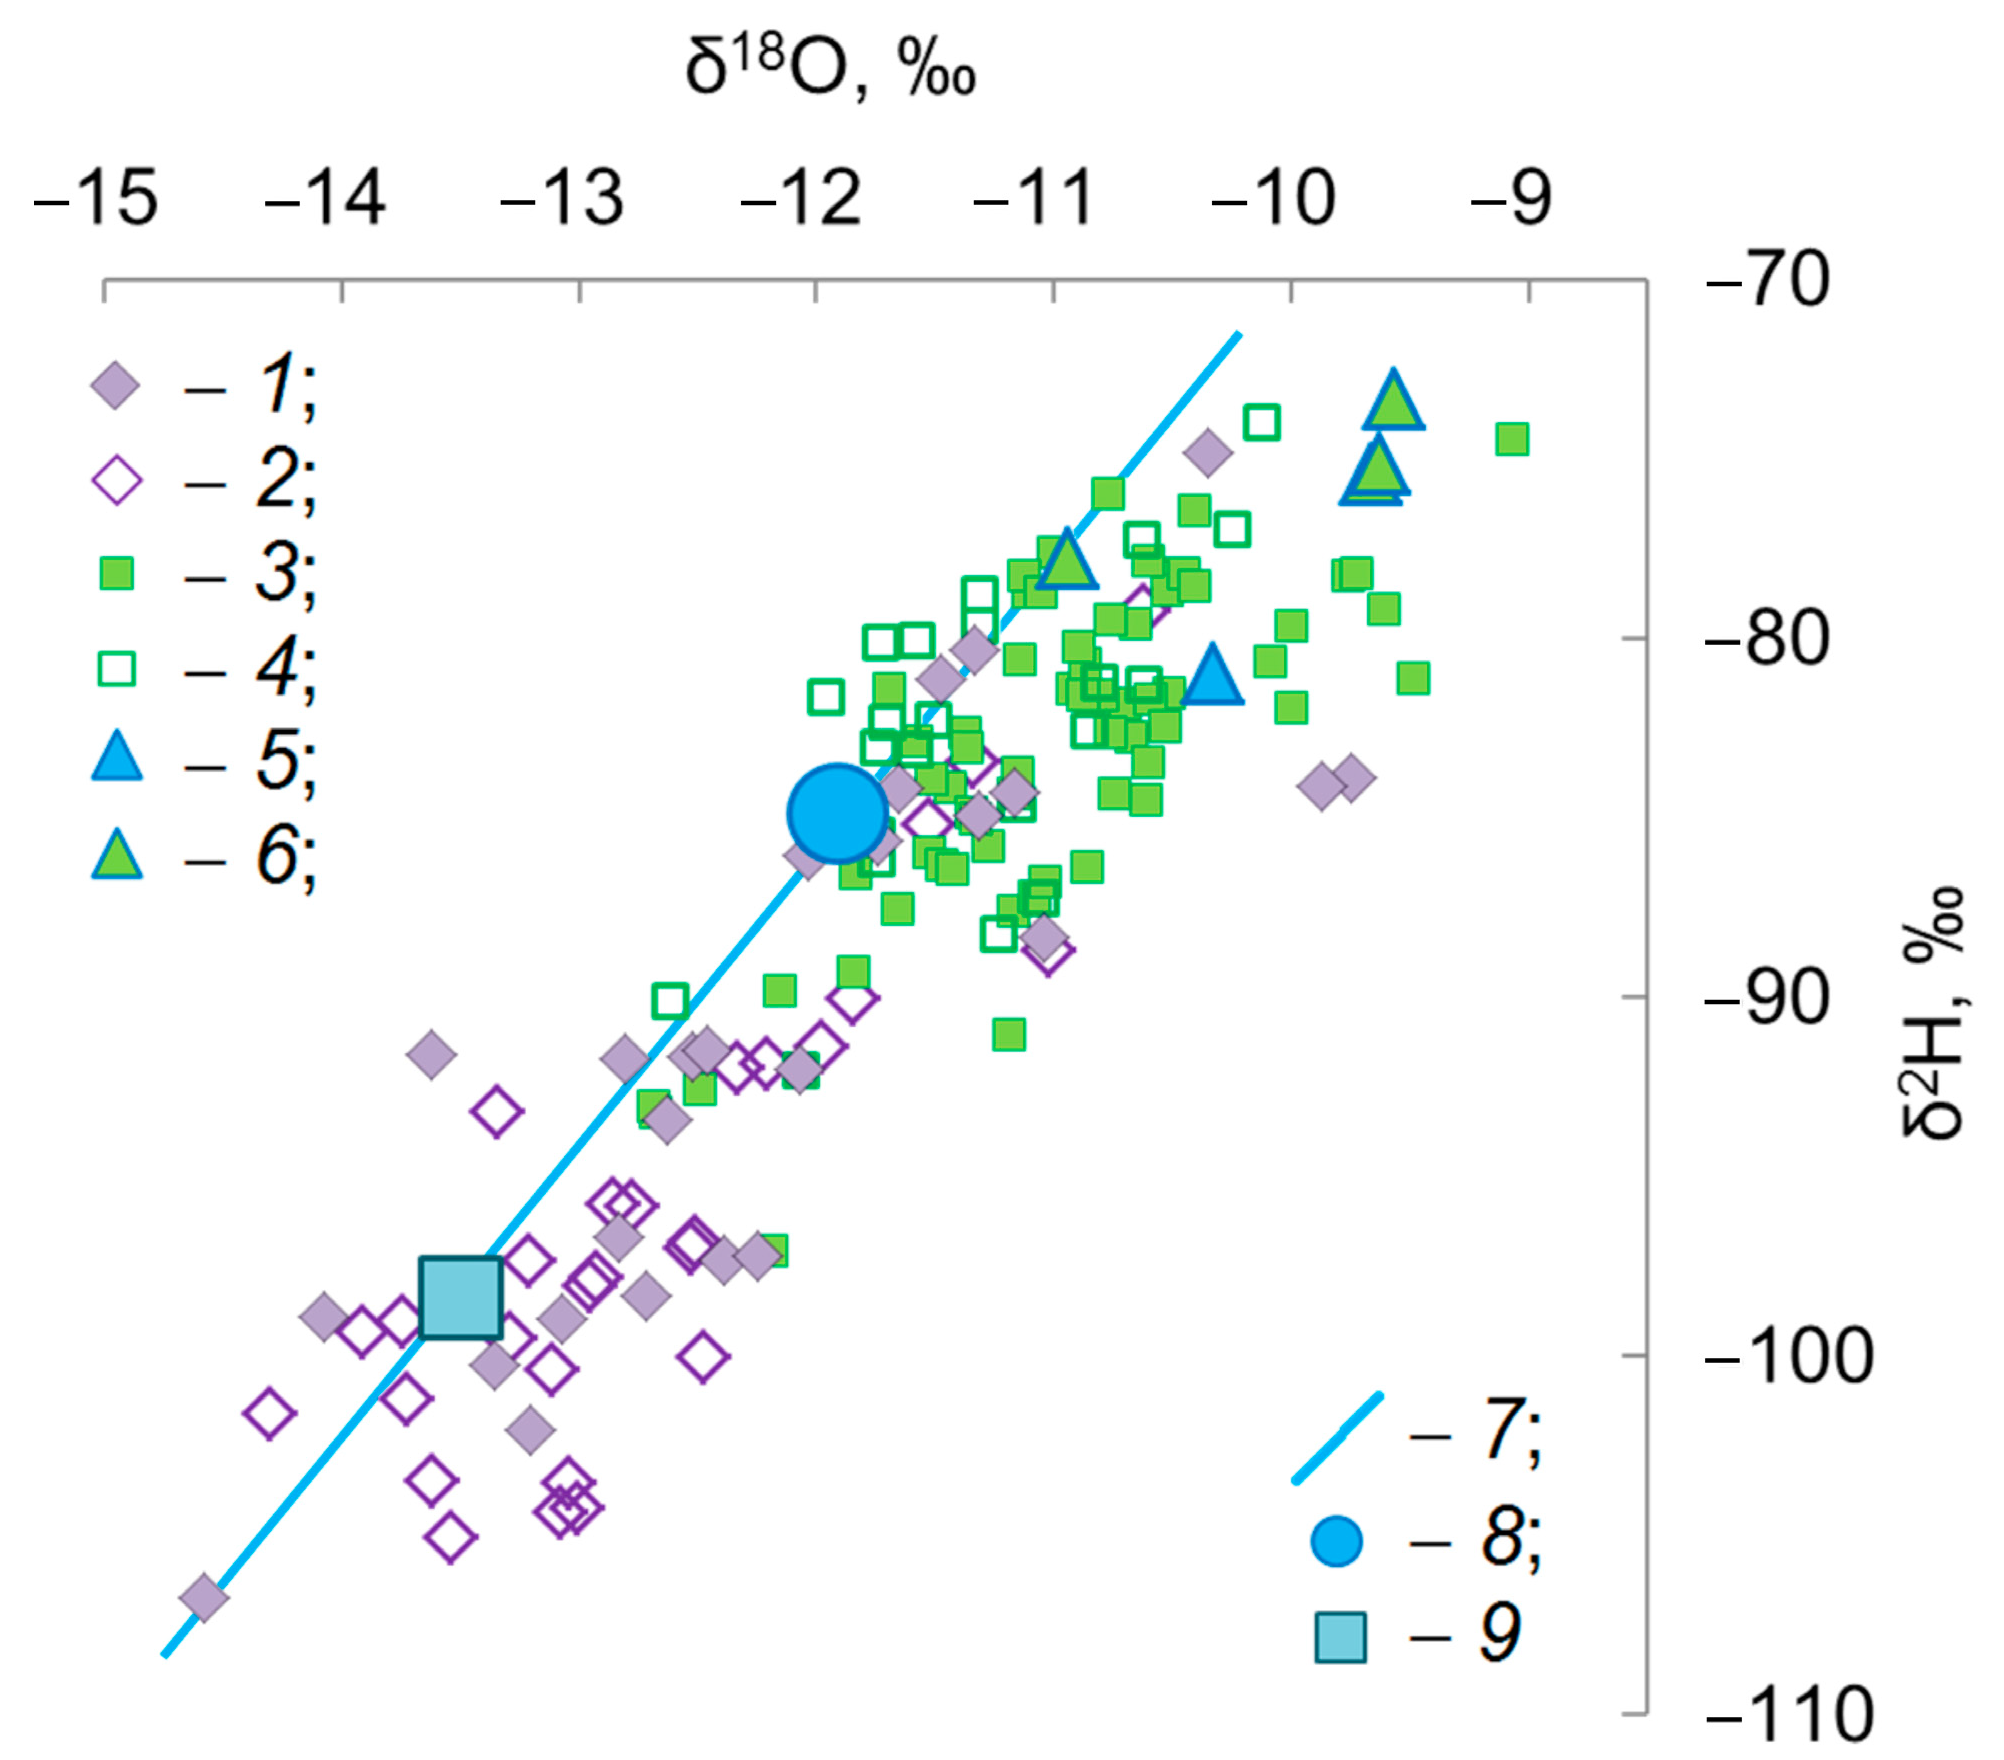
The tributaries. In general, the variations in the isotope composition of the water of the major tributaries of Lake Onega were much greater than those of the river water (Figure 3). In the summer and autumn, the concentration of the heavy isotopes in the river water was much higher than in the winter, and in the spring, the river water was the most depleted. This was mainly due to the large latitude fluctuations in the isotope composition of the atmospheric precipitation, and it also reflected (1) the seasonal variability in the isotopic composition of precipitation, (2) the effect of snowmelt floods, (3) the changes in the contribution of groundwater and (4) the effect of evaporation.
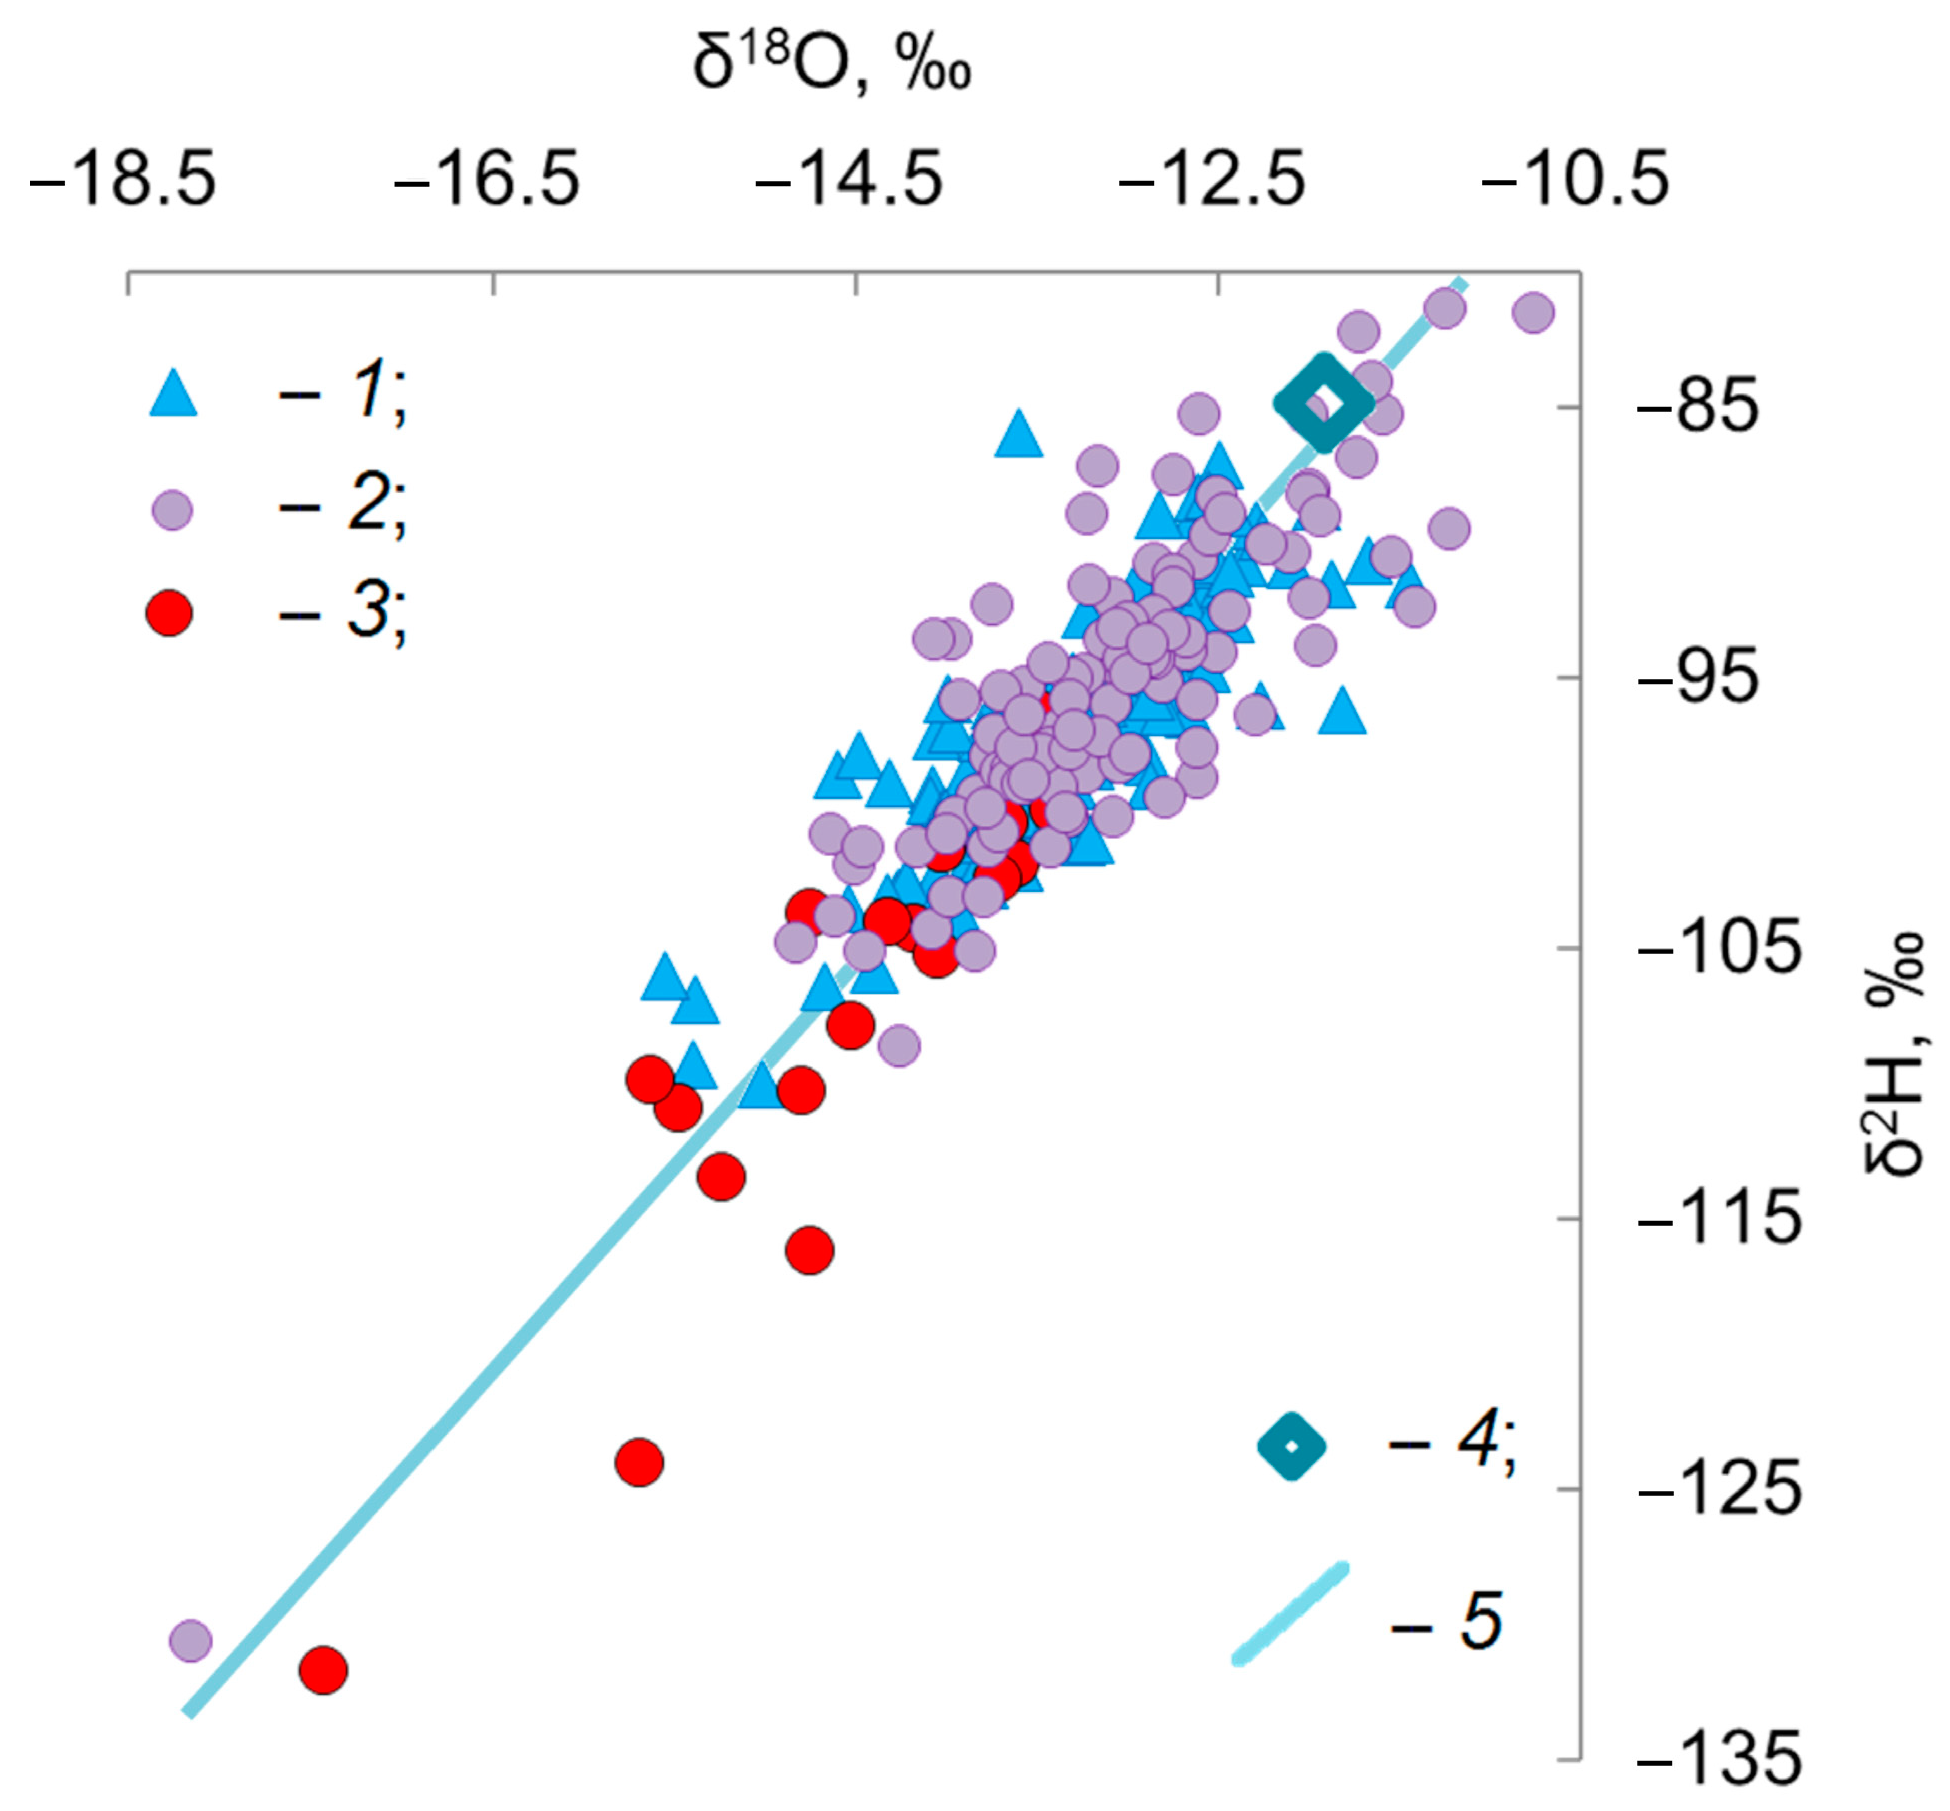
Groundwater. The isotopic composition of the groundwater is shown in Figure 4 and had an average composition of δ18O ≈ −13.6‰ and δ2H ≈ −98‰. The modern groundwater had a more isotopically depleted composition than the weighted mean precipitations for a long-term period. This indicated that the groundwater was mainly recharged by cold period atmospheric precipitation.
5. Discussion
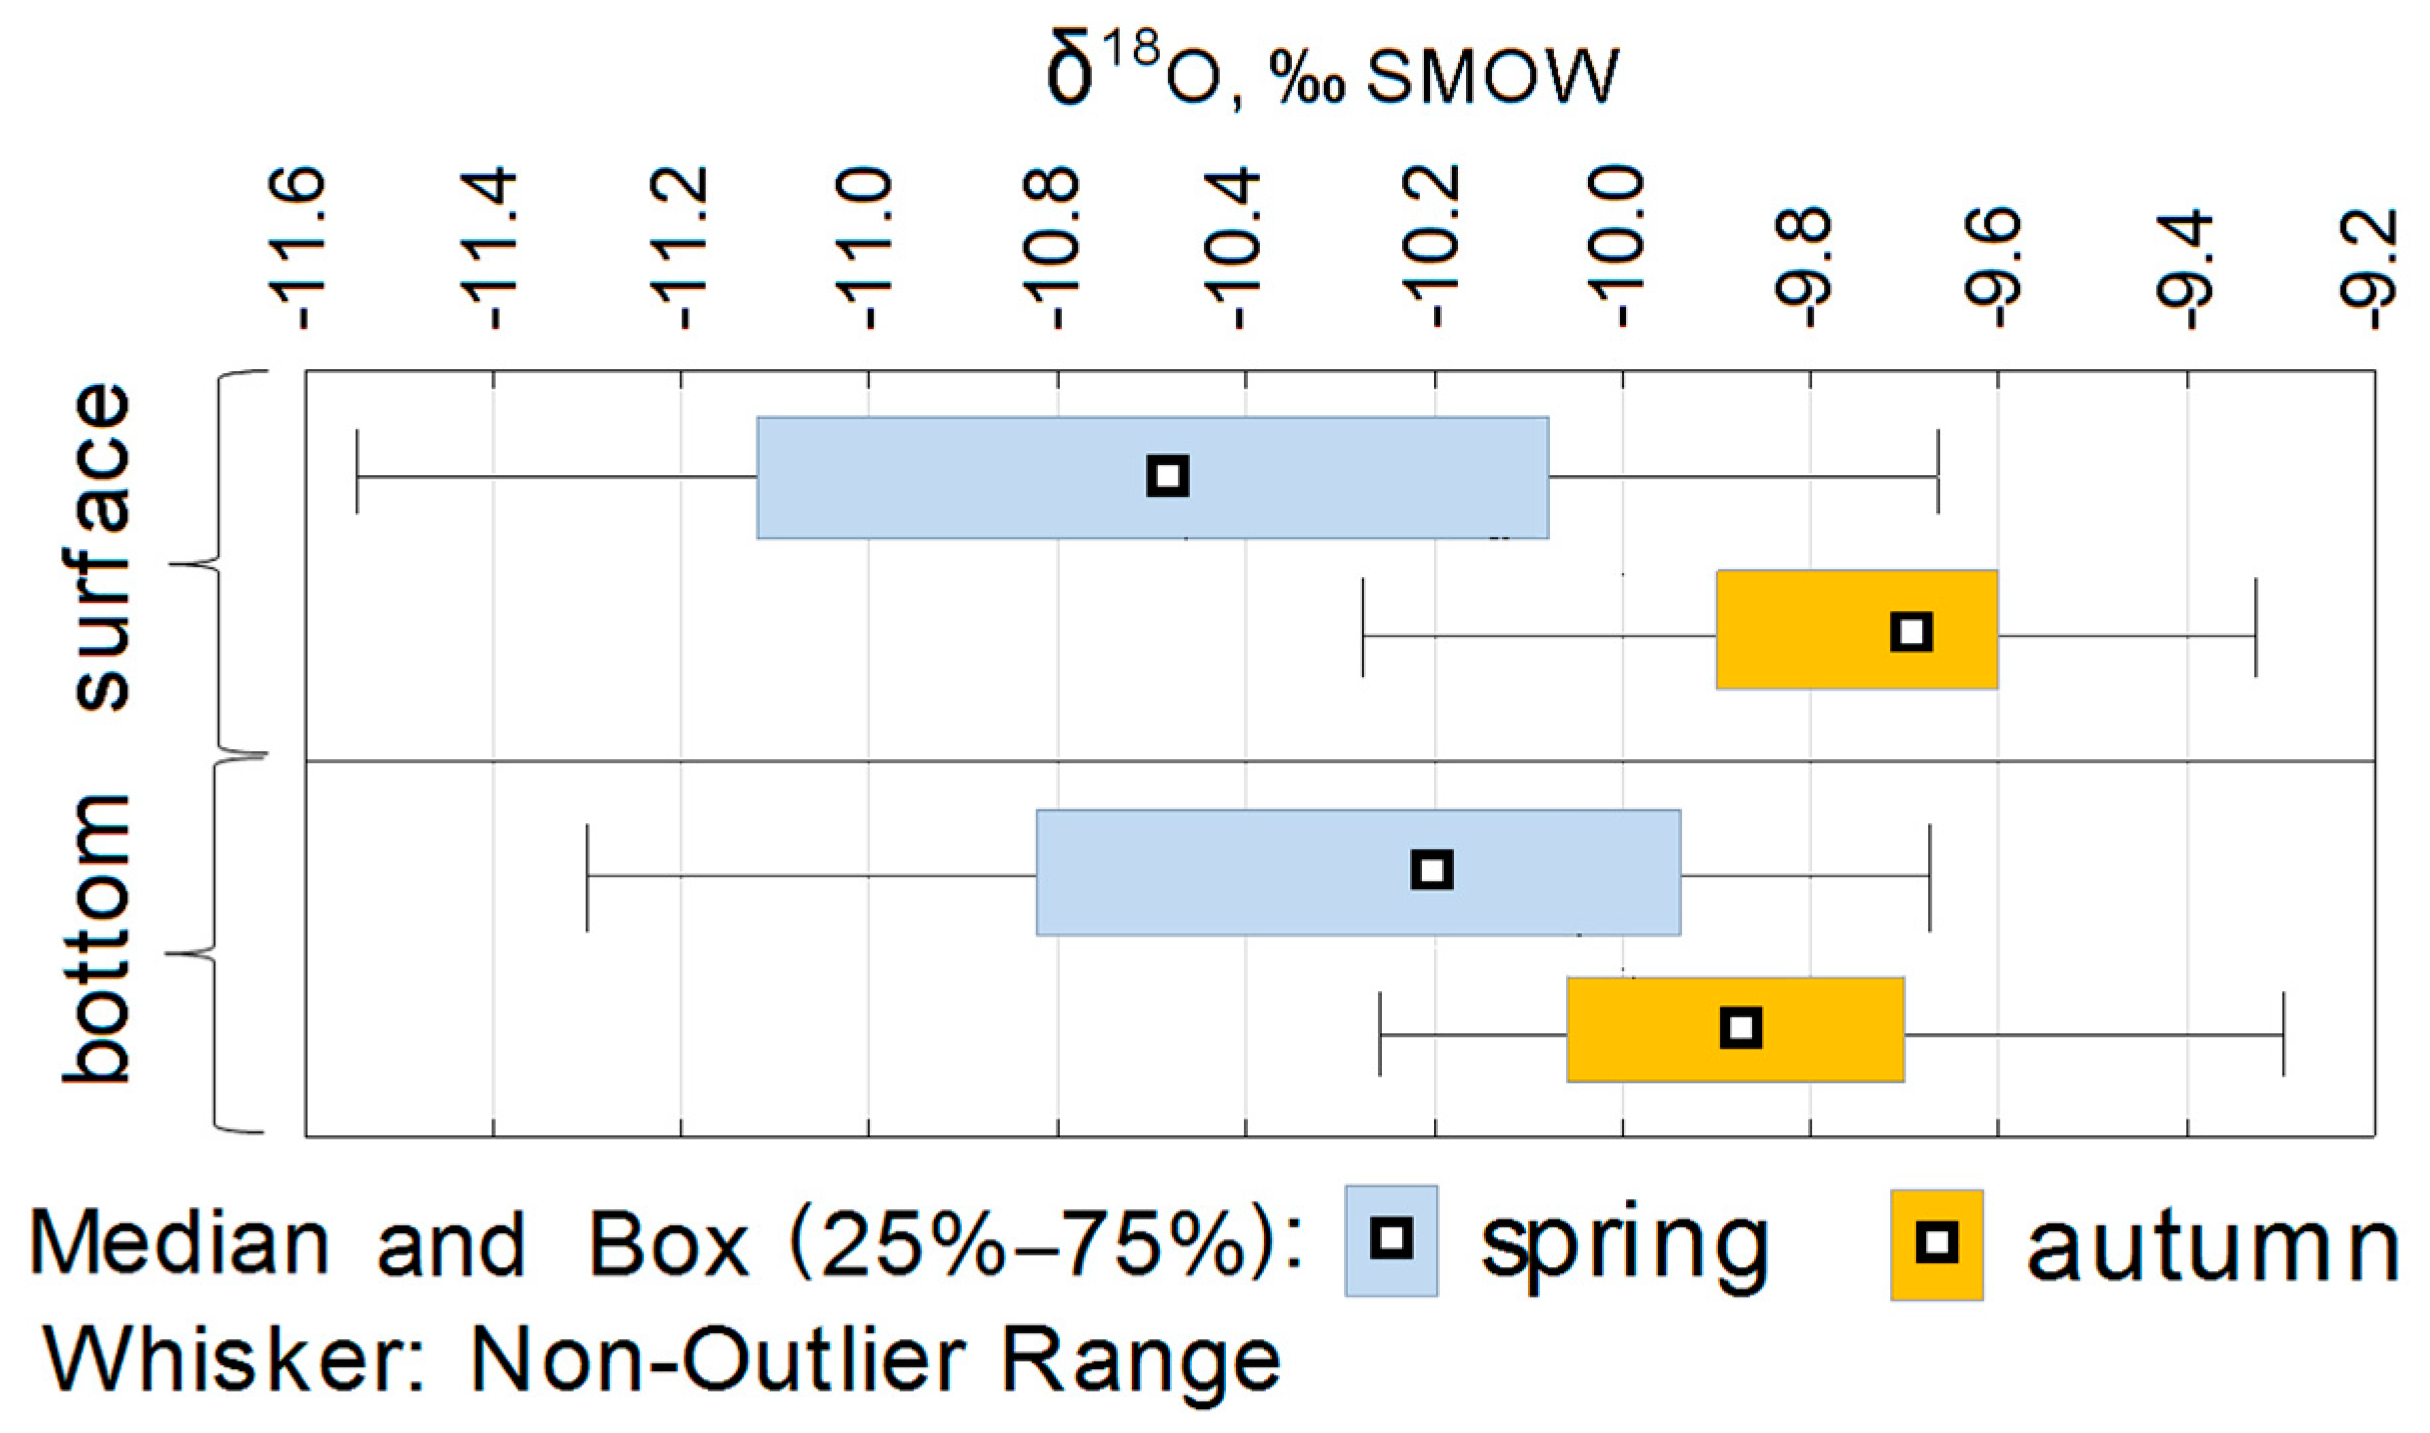
Generally, the seasonal variations in the isotope composition of the lake water at the deep stations were less than those at the surface layer (Figure 5) due to the mixing and the longer residence time of the water in the deep parts of the lake [29,33]. In most cases, in the spring, the isotope composition of the surface layer of the lake water was more depleted of deuterium and oxygen-18, and it ranged from −11.6 to −9.3‰ for δ18O and from −85 to −77‰ for δ2H.
In autumn, the isotope composition of the surface layer of the lake water varied from −10.3 to −9.3‰ for δ18O and from −80 to −71‰ for δ2H (Figure 5). In the bottom layer, similar changes in the isotopic composition of the water were observed, but the scatter of the average values between spring and autumn was somewhat smaller relative to the surface layer.
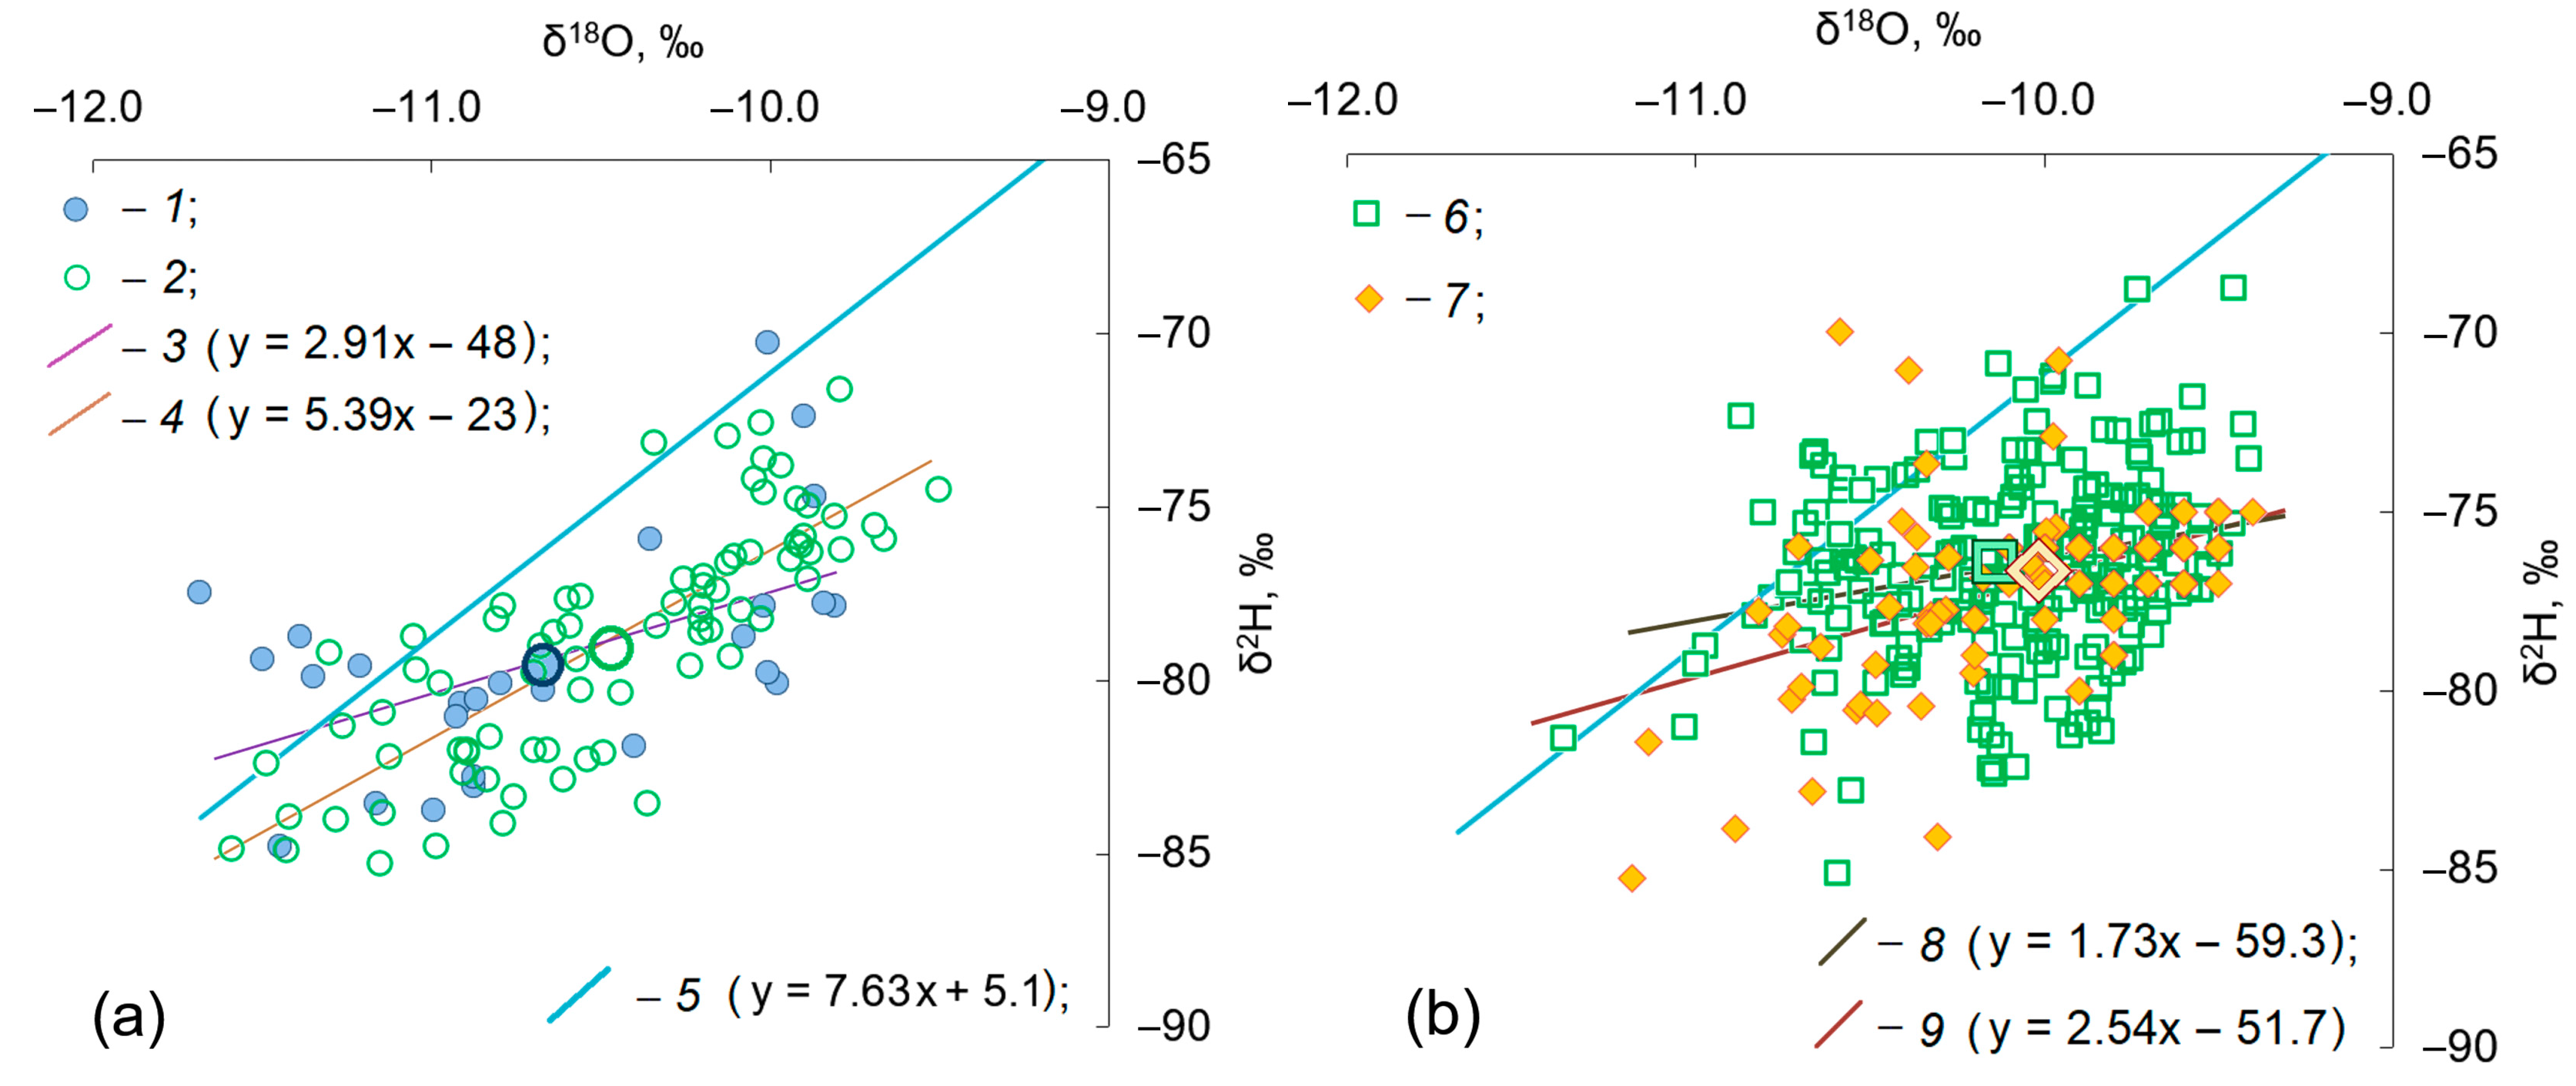
On the δ2H vs. δ18O diagram, the isotope composition of the lake water in March was approximated by the equation δ2H = 2.91 × δ18O − 48 with R2 = 0.27 (Figure 6a). This angle coefficient is not similar to the typical coefficient for the evaporation line. This was probably due to the combined effect of the ice cover and the spring flood, which was provoked by the snow melt on the watershed. Firstly, ice greatly decreases the wind-induced mixing of the water in the lake. Secondly, the snowmelt water inflow, which begins somewhat earlier than the complete disappearance of the lake ice, is responsible for the local isotope depletion of the lake water near the tributary mouths [34].
In addition to the inflow process, other factors also influenced the variation in the stable isotopes. In March, part of the samples from the surface layer of the water demonstrated isotope fractionation, which shifted the figurative points on the δ2H vs. δ18O diagram to the left from the LMWL (Figure 6a). This could have been a result of the new ice formation when the residual water became isotopically depleted in comparison to the initial composition. The isotopic fractionation that occurred during the water freezing could be indirectly demonstrated by the ice composition of Lake Onega. Seven ice samples were taken simultaneously during the testing campaign at the end of winter. The ice cores were divided into upper and bottom layers, where the lower layer was composed of a mass of transparent ice without the bubbly air-saturated and milky interlayers. This massive ice had a composition of δ18O = −8.4‰ and δ2H = −62‰ on average as a result of the disequilibrium isotope fractionation when the water froze, and its figurative points were shifted to the right from the LMWL in the δ2H vs. δ18O diagram. The upper layer had an ice isotope composition of δ18O = −9.5‰ and δ2H = −71‰ on average, which is more isotopically depleted than the ice mass due to snow accumulation. The isotope effects are in good agreement with the databank in terms of the chemical composition of the ice, the snow on the ice and the under-ice water of Lake Onega [35,36] and also with the general tendencies of the ice-cover formations on lakes [37].
In June, evaporation is predominantly active. For the June samples (Figure 6a), the approximation line on the δ2H vs. δ18O diagram had an equation of δ2H = 5.39 × δ18O − 23 and the slope coefficient approached to the standard for the evaporation line. At this time, the strength of the winds and water mixing caused them to drop significantly; additionally, the amount of precipitation was still small and the temperature of the air was not high.
By the end of the summer, the range of the δ18O and δ2H variation decreased, and the isotope composition of the water became heavier than in the spring (Figure 6b). This was attributed to the wind mixing of the isotopically heavy summer precipitations and the impact of evaporation. The approximation equation had an angle coefficient of 1.73 for July–August and of 2.54 for the September–October data (Figure 6b). This was most likely because the isotope composition of the lake water in late summer was the homogenized value due to wind mixing [3]; therefore, it led to a very large error in the angle parameter assessment by the linear approximation. In particular, the approximation accuracy (R2) was 0.65 for the June data and only 0.06 for the July–August data. The trend of the isotope composition of the lake water in September–October for this parameter was 0.21.
During July and August, small lakes and swamps on the Onega Lake catchments are warm. The water vapor is transported by the air mass from the catchment on the Onega Lake water area. Here, it condensates from the air due to the lower temperature of the water in Onega Lake [13] and affects the isotope composition of the surface water of the lake. In this case, the figurative points should also move to the left from the LMWL on the δ2H vs. δ18O diagram (Figure 4b). It is currently impossible to estimate the quantitative contribution of condensation to the water balance of the lake.
Evaporation of the lake water is clearly indicated by the shift of the figurative points to the right from the LMWL in the δ2H vs. δ18O diagram (inset in Figure 2 and Figure 6), which is the result of the disequilibrium isotope fractionation. Calculations using the experimental relationship between the shift in the oxygen isotopes (Δ(δ18O)) and the amount of evaporated water (ξ) showed that 4–8% of the water loss due to evaporation occurred in the spring and 4–10% occurred in early autumn, averaging about 9%. These values were somewhat smaller than those obtained by the hydrological calculations. This could be the consequence of the nonuniform sampling network on the lake water area during the isotope study. An additional factor may be that the transpiration account was absent in the standard hydrological calculations, as it was implicitly included in the evaporation [38].
For the different parts of Lake Onega, a fine structure of the water dynamics was noted in varying depths (see stations C1 and K7 in Figure 7 and the location of stations in Figure 1). The Kondopoga Bay (station K7) is one of the large deep-water bays of Lake Onega. The Suna River, which flows in this bay, is the third largest tributary of Lake Onega, and therefore the calculated exchange time of the water in the bay is small and is not more than a year. As result, the seasonal variation in the isotope composition of the water in the bay depends entirely on the composition of the water in the Suna River. Actually, the range of the δ2H and δ18O variation in the bay (station K7 in Figure 7) was lower than that in the open lake (station C1 in Figure 7) because the evaporation and direct rainfall strongly affected the lake water at end of the summer.
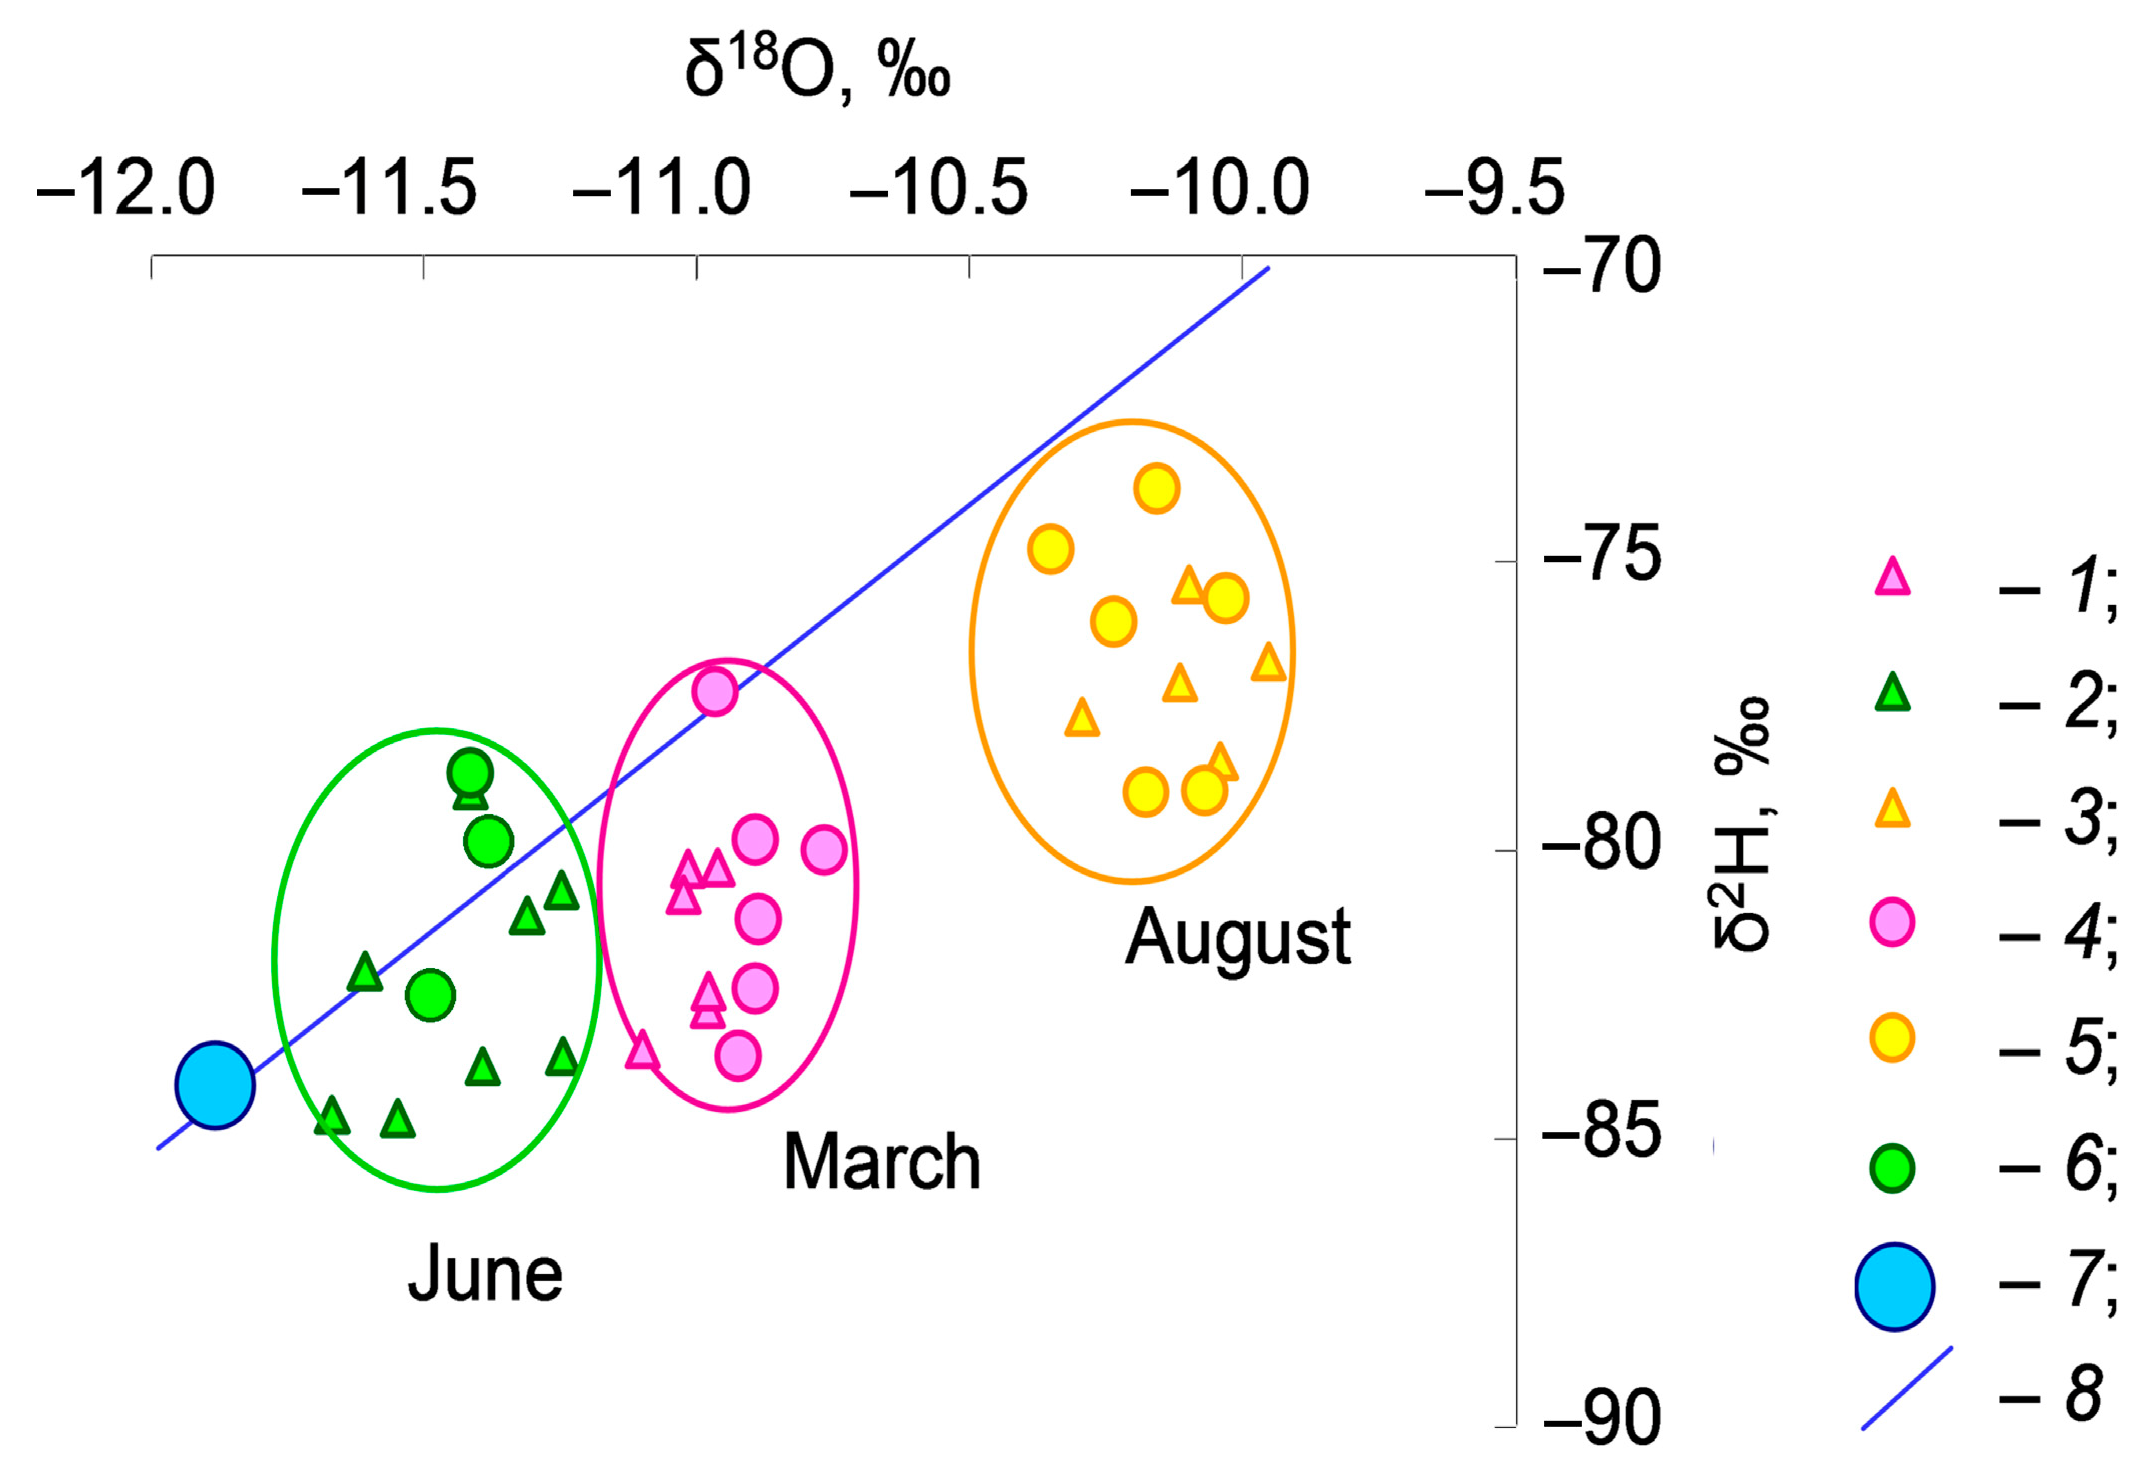
Variations in the isotope composition of the water in Petrozavodsk Bay are shown in Figure 8 (see the location at the inset in Figure 1). In June, after the meltwater flood, the lake water displayed the highest degree of depletion in the isotope composition, which was closest to the weighted mean annual composition of the precipitation. In the previous hydrological period (March in Figure 8), the ice cover was not completely thawed, and the isotope composition of the water was slightly heavier than in June (the points on the δ2H vs. δ18O diagram shifted more to the right of the LMWL). This was the result of mixing the water with the heavy isotope composition from the previous year (see August in Figure 8) and the winter river runoff with the depleted isotope composition (Figure 4). At the end of the summer (August in Figure 8), the isotope composition of the water was the heaviest of the year.
The river water with an average composition of δ18O ≈ −13.6‰ and δ2H ≈ −98‰ was much more isotopically depleted than the mean annual composition of the precipitation and lake water due to the discharge of the groundwater (Figure 4). In the northwestern regions of Russia, the isotope depletion of the groundwater was the result of the groundwater recharge mainly during the spring snowmelt flood. Additionally, in the last two decades, the highly depleted isotopic composition of the river water in the winter could also be associated with the more frequent winter thaws when the isotopically light snowmelt water is added to the groundwater discharge in the river.
For the major Karelian rivers, the seasonal dependence of the isotope composition of the water is not as strong as that for minor streams (see the above example for the Suna River). This is probably because with the large watershed, the seasonal precipitations are mixed, and the river runoff redistributes this water on an interannual scale, as it does for the other great watersheds [39,40]. In the western part of Lake Onega’s catchment, the large lakes and wetlands are absent. Consequently, here the minor rivers display a supply dominated by groundwater throughout the year, as indicated by the more depleted isotope composition of the water even in the summer, whereby δ18O < −12‰ and δ2H < −95‰ (Figure 4). In some cases, e.g., the small rivers in the east part of the lake catchment, the recharge of the saline chloride sodium groundwater, which has an exotic depleted isotopic composition (Figure 4), is felt. Naturally, such a small addition to the river runoff is not reflected in the isotope composition of the lake water.
Brackish and saline water with a chloride sodium composition has a significantly depleted isotope composition that is close to the average isotope composition of modern snow (Table 1). The latter seems to indicate that the groundwater is old and could have formed during the last climatic cooling event [41]. A similar situation with the presence of old water occurred in the Karelian Isthmus in the Leningrad Region, which is similar to South Karelia in terms of the hydrological conditions. While sampling the Riphean sandstone in the Ladoga graben at a depth of about 250 m, high-pressure water with a mineralization of about 0.65 g/L, δ18O = −16.6‰ and δ2H = −119‰ was revealed [42,43]. This suggests that the water, which was formed from precipitation during a cold climatic period, could make up a large area in the stagnant hydrodynamic zone of this region. At present, these small-volume waters are apparently discharged into Lake Ladoga [43]. Whether there is a discharge of brackish water into Lake Onega is not yet clear.
The runoff of Neglinka River, with a catchment square of about 17 km2 and whose mouth is located in the upper part of Petrozavodsk Bay (Figure 1), was monitored in 2011–2016 (Figure 9). The chronological graph shows not only the regular seasonal variations but also well-defined anomalies in the isotope composition of the river water, which were provoked by the spring flood and the heavy atmospheric depositions [44]. These features of stable isotope variations can be used to subdivide the hydrograph and construct a small watershed model [45,46].
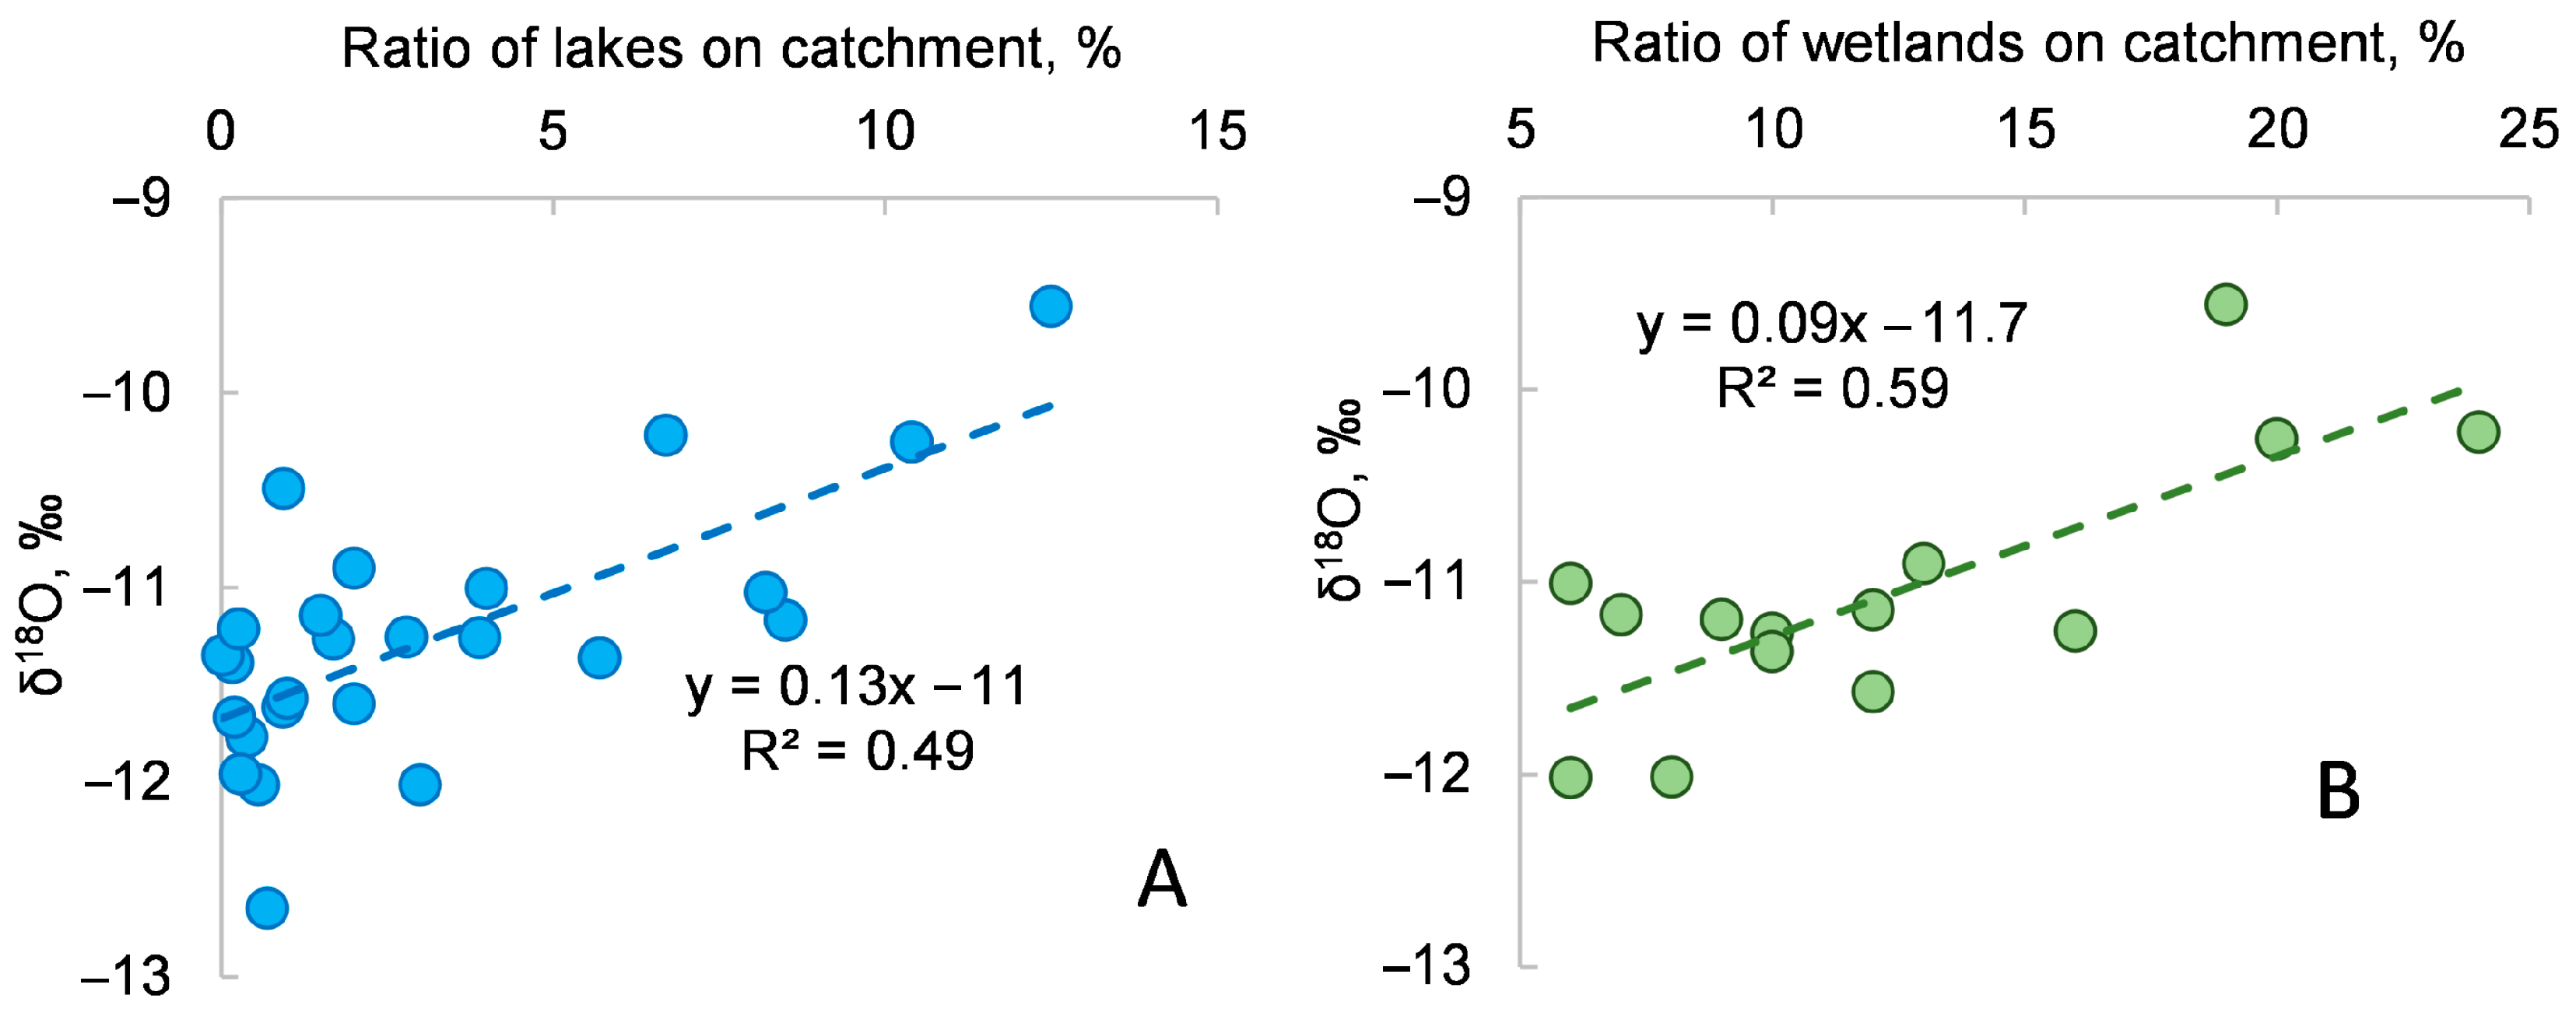
During the summer, evaporation has a strong effect on the isotope composition of the tributaries in the Lake Onega watershed (on the δ2H vs. δ18O diagram, part of the figurative points were shifted to the right of the LMWL). For the major rivers, the isotope shift was evident not only in the summer but also in the winter. The water loss due to evaporation from the major rivers was calculated following the experimental findings of the dependence of the isotope shift Δ(δ18O) in the residual water on the amount of evaporated water ξ. The estimated loss of water in the tributaries in the summer was 11–22%. The enrichment of the tributary water by the heavy isotopes was directly proportional to the area of the lakes and wetlands on the drainage surface, but the influence of the lakes was greater than that of the wetlands (Figure 10). Losses of water by evaporation can be reflected in the chemical composition of the river runoff [47].
6. Conclusions
During 2009–2018, a pioneer study on the water dynamics and conditions of the formation of Lake Onega basin’s water balance was carried out based on data related to the isotope composition of the water (oxygen-18—δ18O and deuterium—δ2H concentrations were measured). The water area and watershed of Lake Onega (tributaries and groundwater) were sampled, and the atmospheric precipitations at Petrozavodsk city were monitored. The weighted annual composition of the atmospheric precipitation was δ18O = −11.7‰ and δ2H = −84‰; the minimum for snow was δ18O = −30.9‰ and δ2H = −239‰, the maximum for rain was δ18O = −4.1‰ and δ2H = −22‰ and the local meteoric water line was described by the equation δ2H = 7.7 × δ18O + 4.5.
In total, 28 series of experiments were conducted to estimate the effect of disequilibrium isotope fractionation during evaporation on deuterium and oxygen-18 concentrations in residual water. The functional dependence of the deuterium and oxygen-18 concentrations in the residual water on the amount of evaporated water was calculated: Δ(δ18O) = 25.9 × ξ for April–May and Δ(δ18O) = 17.4 × ξ for July–September, where ξ is the amount of evaporated water and Δ(δ18O) is the shift in the isotope composition of oxygen.
The isotope composition of the water in Onega Lake varied from −11.5 to −9.3‰ for δ18O and from −85 to −71‰ for δ2H. A seasonal-scale differentiation of the isotope composition of the lake water was observed. The maximum isotope depletion in the deuterium and oxygen-18 occurred in the early summer after the snowmelt flood. The lake water became isotopically heavier by the beginning of autumn due to the absorption of the summer precipitation and evaporation. Our experiments showed that the average evaporation loss during the warm season was about 11%.
The variation in the isotope composition of the river water in the tributaries ranged from −14.3 to −9.1‰ for δ18O and from −107 to −73‰ for δ2H. Seasonal differentiations in the tributary water composition were observed. For the major rivers, the isotope composition of the water was less dependent on the season compared to the small and medium streams. Some small nonlacustrine rivers displayed a domination of groundwater recharge all year round. For the warm season, the evaporation was estimated at a value of 11–22%. The amount of evaporated water increased when the lake and wetlands area occupied a larger part of the drainage surface. The average initial isotope composition of the water in the tributaries prior to evaporation was δ18O ≈ −14.1‰ and δ2H ≈ −103‰, which was close to the average composition of the groundwater in Karelia, which was δ18O ≈ −13.4‰ and δ2H ≈ −94‰.
Author Contributions
Conceptualization, G.B. and I.T.; methodology, G.B.; software, I.T.; validation, G.B., I.T. and E.Y.; formal analysis, G.B. and I.T.; investigation, G.B., I.T. and E.Y.; resources, G.B. and I.T.; writing—original draft preparation, G.B., I.T. and E.Y.; writing—review and editing, G.B., I.T. and E.Y.; visualization, I.T.; supervision, I.T.; project administration, I.T. and E.Y.; funding acquisition, I.T. and E.Y. All authors have read and agreed to the published version of the manuscript.
Funding
Data analysis and interpretation were carried out under the grant of the Russian Science Foundation (project No 20-77-10057 «Diagnosis of permafrost degradation based on isotope tracers (234U/238U, 18O+2H, 13C+14C»)).
Data Availability Statement
The datasets presented in this study can be obtained upon request to the corresponding author.
Conflicts of Interest
The authors declare no conflict of interest.
References
- Filatov, N.N.; Kalinkina, N.M.; Kulikova, T.P.; Litvinenko, A.V.; Lozovik, P.A. The Current State and Changes of Ecosystems of Large Lakes- Reservoirs of the North-West European Territory of Russia under Climate Change and Human Impact; Karelian Research Centre of the RAS: Petrozavodsk, Russia, 2015. [Google Scholar]
- Bogachev, M.A.; Borodulina, G.S.; Igonin, A.; Karpechko, V.A.; Katra, K.; Kotkasaari, T.; Litvinenko, A.V.; Litvinova, I.A.; Lozovik, P.A.; Morozov, A.K.; et al. Water Resources of the Republic of Karelia and Their Use for Drinking Water Supply. Experience in Karelian-Finnish Cooperation; Petrozavodsk-Kuopio; Karelian Research Center of RAS: Petrozavodsk, Russia, 2006. [Google Scholar]
- Lozovik, P.A. The Largest Lakes-Reservoirs of the North-West of the European Territory of Russia: The Current State and Changes in Ecosystems under Climatic and Man-Induced Impact; KarRC RAS: Petrozavodsk, Russia, 2015; pp. 88–95. [Google Scholar]
- Efremova, T.A.; Sabylina, A.V.; Lozovik, P.A.; Slaveykova, V.I.; Zobkova, M.V.; Pasche, N. Seasonal and spatial variation in hydrochemical parameters of Lake Onego (Russia): Insights from 2016 field monitoring. Inland Waters 2019, 9, 227–238. [Google Scholar] [CrossRef]
- Vodogretsky, V.E. Karelia and Northwest Russia; Surface Water Resources of the USSR: Hydrometeoizdat, Leningrad, 1972. [Google Scholar]
- Filatov, N.N. Lake Onega. In Atlas; Karelian Research Centre of the RAS: Petrozavodsk, Russia, 2010. [Google Scholar]
- Podsechin, V.; Kaipainen, H.; Filatov, N.; Bilaletdin, Ä.; Frisk, T.; Paananen, A.; Terzhevik, A.; Vuoristo, H. Development of Water Protection of Lake Onega; Final Report; Pirkanmaa Regional Environment Centre: Tampere, Finland, 2009.
- Moiseenko, T.; Sharov, A. Large Russian Lakes Ladoga, Onega, and Imandra under Strong Pollution and in the Period of Revitalization: A Review. Geosciences 2019, 9, 492. [Google Scholar] [CrossRef]
- Filatov, N.; Baklagin, V.; Efremova, T.; Nazarova, L.; Palshin, N. Climate change impacts on the watersheds of Lakes Onego and Ladoga from remote sensing and in situ data. Inland Waters 2019, 9, 130–141. [Google Scholar] [CrossRef]
- Livingstone, D.M.; Adrian, R.; Arvola, L.; Blenckner, T.; Dokulil, M.T.; Hari, R.E.; George, G.; Jankowski, T.; Järvinen, M.; Jennings, E.; et al. Regional and supra-regional coherence in limnological variables. In The Impact of Climate Change on European Lakes; Springer: Berlin/Heidelberg, Germany, 2010. [Google Scholar] [CrossRef]
- Sabylina, A.V.; Lozovik, P.A.; Zobkov, M.B. Water chemistry in Lake Onega and its tributaries. Water Resour. 2010, 37, 842–853. [Google Scholar] [CrossRef]
- Sabylina, A.V.; Ryzhakov, A.V. Hydrochemical Characteristic of the Littoral Zone of Lake Onega. Water Resour. 2018, 45, 213–221. [Google Scholar] [CrossRef]
- Filatov, N.N.; Vyruchalkina, T.Y. Many-year level variations in the Great Lakes of Eurasia and North America. Water Resour. 2017, 44, 685–696. [Google Scholar] [CrossRef]
- Mook, W.G. Environmental isotopes in the hydrological cycle. In Principles and Applications; UNESCO: Paris, France, 2001. [Google Scholar]
- Ferronsky, V.; Polyakov, V. Isotopes of the Earth’s Hydrosphere; Springer Science & Business Media: Berlin, Germany, 2012. [Google Scholar] [CrossRef]
- Ferronsky, V.I.; Dubinchuk, V.T.; Polyakov, V.A.; Seletsky, Y.B.; Kuptsov, V.M.; Yakubovsky, A.V. Natural Isotopes of the Hydrosphere; Nedra: Moscow, Russia, 1975. [Google Scholar]
- Gibson, J.; Birks, S.; Jeffries, D.; Yi, Y. Regional trends in evaporation loss and water yield based on stable isotope mass balance of lakes: The Ontario Precambrian Shield surveys. J. Hydrol. 2017, 544, 500–510. [Google Scholar] [CrossRef]
- Kendall, C.; McDonnell, J.J. Isotope Tracers in Catchment Hydrology; Elsevier: Amsterdam, The Netherlands, 1998. [Google Scholar]
- Gibson, J.; Prepas, E.; McEachern, P. Quantitative comparison of lake throughflow, residency, and catchment runoff using stable isotopes: Modelling and results from a regional survey of Boreal lakes. J. Hydrol. 2002, 262, 128–144. [Google Scholar] [CrossRef]
- Horita, J.; Rozanski, K.; Cohen, S. Isotope effects in the evaporation of water: A status report of the Craig–Gordon model. Isot. Environ. Health Stud. 2008, 44, 23–49. [Google Scholar] [CrossRef]
- Chen, K.; Meng, Y.; Liu, G.; Xia, C.; Zhou, J.; Li, H. Identifying hydrological conditions of the Pihe River catchment in the Chengdu Plain based on spatio-temporal distribution of 2H and 18O. J. Radioanal. Nucl. Chem. 2020, 324, 1125–1140. [Google Scholar] [CrossRef]
- McGuire, K.J.; McDonnell, J.J. A review and evaluation of catchment transit time modeling. J. Hydrol. 2006, 330, 543–563. [Google Scholar] [CrossRef]
- Niinikoski, P.I.A.; Hendriksson, N.M.; Karhu, J.A. Using stable isotopes to resolve transit times and travel routes of river water: A case study from southern Finland. Isot. Environ. Health Stud. 2016, 52, 380–392. [Google Scholar] [CrossRef]
- Rodgers, P.; Soulsby, C.; Waldron, S.; Tetzlaff, D. Using stable isotope tracers to assess hydrological flow paths, residence times and landscape influences in a nested mesoscale catchment. Hydrol. Earth Syst. Sci. 2005, 9, 139–155. [Google Scholar] [CrossRef]
- Timsic, S.; William, P. Spatial variability in stable isotope values of surface waters of Eastern Canada and New England. J. Hydrol. 2014, 511, 594–604. [Google Scholar] [CrossRef]
- Zhou, J.; Liu, G.; Meng, Y.; Xia, C.; Chen, K.; Chen, Y. Using stable isotopes as tracer to investigate hydrological condition and estimate water residence time in a plain region, Chengdu, China. Sci. Rep. 2021, 11, 2812. [Google Scholar] [CrossRef]
- Kulik, N.; Efremenko, N.; Strakhovenko, V.; Belkina, N.; Borodulina, G.; Gatalskaya, E.; Malov, V.; Tokarev, I. Geochemical Features of River Runoff and Their Effect on the State of the Aquatic Environment of Lake Onego. Water 2023, 15, 964. [Google Scholar] [CrossRef]
- Lozovik, P.A.; Zobkov, M.B.; Borodulina, G.S.; Tokarev, I.V. Assessing External Water Exchange of Lake Bays by Water Chemistry Characteristics. Water Resour. 2019, 46, 94–102. [Google Scholar] [CrossRef]
- Rukhovets, L.; Filatov, N. (Eds.) Ladoga and Onego—Great European lakes. In Observations and Modeling; Springer: Berlin/Heidelberg, Germany, 2010; 302p. [Google Scholar]
- Borodulina, G.S. Role of groundwater flow to lakes of the Onega watershed in formation of the chemical composition of lake water. Proc. Karelian Res. Cent. RAS Limnol. Ser. 2011, 4, 108–116. [Google Scholar]
- Borodulina, G.S.; Tokarev, I.V. Geochemical and isotopic characteristics of groundwater and surface water in the Paleoproterozoic Onega structure. In Integrated Problems in Hydrogeology; St. Petersburg State University: St. Petersburg, FL, USA, 2013. [Google Scholar]
- Borodulina, G.S.; Tokarev, I.V.; Levichev, M.A. Isotopic Composition (δ18O, δ2H) of Karelian Snow Cover. Water Resour. 2022, 49 (Suppl. 1), S90–S98. [Google Scholar] [CrossRef]
- Filatov, N.N.; Kukharev, V.I. (Eds.) Lakes of Karelia; A reference book; KarRC RAS: Petrozavodsk, Russia, 2013; 461p. [Google Scholar]
- Lozovik, P.A.; Kulikova, T.P.; Martynova, N.N. Condition of Water Bodies in the Republic of Karelia: The Results of 1998–2006 Monitoring; Karelian Research Center of the RAS: Petrozavodsk, Russia, 2007. [Google Scholar]
- Efremova, T.; Palshin, N.; Zdorovennov, R. Long-term characteristics of ice phenology in Karelian lakes. Est. J. Earth Sci. 2013, 62, 33. [Google Scholar] [CrossRef]
- Sabylina, A.V.; Efremova, T.A. The chemical composition of ice and water under ice of Lake Onega (the case of Petrozavodsk Bay). Ice Snow 2018, 58, 417–428. [Google Scholar] [CrossRef]
- Leppäranta, M. Freezing of Lakes and the Evolution of Their Ice Cover; Springer: Berlin/Heidelberg, Germany, 2015; pp. 84–265. [Google Scholar]
- Salo, Y.A.; Nazarova, L.E.; Balagansky, A.F. Computations of evaporation from watersheds of North-Western Russia. Proc. Karelian Res. Cent. RAS Limnol. 2016, 9, 95–101. [Google Scholar] [CrossRef]
- Martínez, D.E.; Londoño, O.M.Q.; Solomon, D.K.; Dapeña, C.; Massone, H.E.; Benavente, M.A.; Panarello, H.O. Hydrogeochemistry, Isotopic Composition and Water Age in the Hydrologic System of a Large Catchment within a Plain Humid Environment (Argentine Pampas): Quequén Grande River, Argentina. River Res. Appl. 2017, 33, 438–449. [Google Scholar] [CrossRef]
- Ogrinc, N.; Kocman, D.; Miljević, N.; Vreča, P.; Vrzel, J.; Povinec, P. Distribution of H and O stable isotopes in the surface waters of the Sava River, the major tributary of the Danube River. J. Hydrol. 2018, 565, 365–373. [Google Scholar] [CrossRef]
- Malov, A.; Tokarev, I. Using stable isotopes to characterize the conditions of groundwater formation on the eastern slope of the Baltic Shield (NW Russia). J. Hydrol. 2019, 578, 124130. [Google Scholar] [CrossRef]
- Voronyuk, G.Y.; Borodulina, G.S.; Krainyukova, I.A.; Tokarev, I.V. Water exchange on the Baltic Shield margin and in adjacent artesian basins: Isotope and chemical data (scientific and applied aspects). Karelian Isthmus. Proc. Karelian Res. Cent. RAS Limnol. Ser. 2016, 9, 46–56. [Google Scholar] [CrossRef]
- Tokarev, I.; Rumyantsev, V.; Rybakin, V.; Yakovlev, E. Inflow of surface and groundwater to Lake Ladoga based on stable isotope (2H, 18O) composition. J. Great Lakes Res. 2022, 48, 890–902. [Google Scholar] [CrossRef]
- Borodulina, G.; Tokarev, I.; Avramenko, I. Investigation of small river watershed hydrology in Karelia (North- West Russia) by high-resolution record of δ2H and δ18O in precipitation and river discharge, including experimental estimates of evaporation. In Book of Extended Synopses. International Symposium on Isotope Hydrology: Revisiting Foundations and Exploring Frontiers; IAEA: Vienna, Austria, 2015; Volume 3, pp. 174–176. [Google Scholar]
- Uhlenbrook, S.; Frey, M.; Leibundgut, C.; Maloszewski, P. Hydrograph separations in a mesoscale mountainous basin at event and seasonal timescales. Water Resour. Res. 2002, 38, 1096. [Google Scholar] [CrossRef]
- Vasil’chuk, Y.K.; Rets, E.; Chizhova, J.N.; Tokarev, I.; Frolova, N.L.; Budantseva, N.A.; Kireeva, M.; Loshakova, N.A. Hydrograph separation of the Dzhankuat River, North Caucasus, with the use of isotope methods. Water Resour. 2016, 43, 847–861. [Google Scholar] [CrossRef]
- Sarkkola, S.; Nieminen, M.; Koivusalo, H.; Laurén, A.; Kortelainen, P.; Mattsson, T.; Palviainen, M.; Piirainen, S.; Starr, M.; Finér, L. Iron concentrations are increasing in surface waters from forested headwater catchments in eastern Finland. Sci. Total. Environ. 2013, 463–464, 683–689. [Google Scholar] [CrossRef]
Figure 1.
Stations on Lake Onega and points on its catchment where the samples were collected for analysis of the water/snow isotope composition; (a) Bathymetry and main tributaries of Lake Onega, (b) 1—location of the sampling points on Lake Onega water areas; the big sign is the station where samples were collected from four or more different depths); 2—tributaries of Lake Onega (only rivers with a length of more than 10 km are shown); 3—the Neglinka River is a small stream in Petrozavodsk city; 4—groundwater (spring, boreholes and wells, the large circle northwest from Petrozavodsk city with characters “M.w.” is four boreholes on the “Martial water spa” resort, where monitoring has been performed since 2005); 5—the snow cover samples (March 2016); 6—the catchment area of Lake Onega; 7—the precipitation sample collector (2009–2018); 8—the sample point near the Neglinka River mouth (2012–2018).

Figure 2.
Comparison of the isotope composition of atmospheric precipitations (2009–2018) and water in Lake Onega (2012–2017): 1—individual sample of the atmospheric precipitation; 2—individual sample of water from Lake Onega; 3—weighted long-term average isotope composition of atmospheric precipitation; 4—weighted winter precipitation; 5—weighted summer precipitation; 6—local meteoric water line (LMWL, equation in the diagram); 7—approximation line for the lake water (equation on the inset); 8—Global Meteoric Water Line (GMWL).

Figure 3.
Seasonal variations in the isotope composition of water in the tributaries of Lake Onega. 1—winter; 2—spring; 3—summer; 4—autumn. The Svir’ River (runoff from Lake Onega): 5—winter; 6—summer; 7—LMWL; 8—weighted mean composition of the atmospheric precipitation; 9—average composition of groundwater in Lake Onega catchment.

Figure 4.
Isotope composition of groundwater in Karelia: 1—fresh groundwater; 2—brackish groundwater; 3—saline chloride sodium water; 4—the weighted mean isotope composition of the atmospheric precipitation; 5—LMWL.
Figure 4.
Isotope composition of groundwater in Karelia: 1—fresh groundwater; 2—brackish groundwater; 3—saline chloride sodium water; 4—the weighted mean isotope composition of the atmospheric precipitation; 5—LMWL.

Figure 5.
The statistical distribution of oxygen-18 concentrations in the water samples of the surface and bottom layers of Lake Onega for spring and autumn.
Figure 5.
The statistical distribution of oxygen-18 concentrations in the water samples of the surface and bottom layers of Lake Onega for spring and autumn.

Figure 6.
Isotopic composition of the water in Lake Onega in the spring and early summer (a) and in the late summer and autumn (b) (big signs are average for each period): 1—March, 2—June, 3—trend for March, 4—trend for June, 5—LMWL, 6—July and August, 7—September and October, 8—trend for July and August, 9—trend for September and October.

Figure 7.
Chronological variations in oxygen-18 concentrations for a vertical section at station C1 (a) and K7 (b) in the open part of Lake Onega and in Kondopoga bay, respectively (see location in Figure 1).
Figure 7.
Chronological variations in oxygen-18 concentrations for a vertical section at station C1 (a) and K7 (b) in the open part of Lake Onega and in Kondopoga bay, respectively (see location in Figure 1).

Figure 8.
Comparison of the isotope composition of water in Petrozavodsk Bay (triangles) and in the open part of Lake Onega (circles are the location of station C3 as see in Figure 1) in 2015: 1—March, 2—June, 3—August, 4—March, 5—August, 6—June, 7—weighted average composition of atmospheric precipitation, 8—LMWL.

Figure 9.
Chronological graph of the air temperature and variations in the oxygen isotope composition and amount of the River Neglinka runoff from 2012–2018: 1—the oxygen isotope composition of the river water (left axe); 2—intensity of the river runoff (right axe); 3—air temperature (left axe); 4—the spring flood period (2011–2012 and 2014–2015 winters were abnormally snowy; the rain floods were provoked by precipitations of at least 30 mm per 10 days).

Figure 10.
Dependence of the oxygen-18 concentrations in the river water of Lake Onega tributaries in summer on the ratio of (A) lake and (B) wetlands area of the tributary’s catchment (equations are shown in the diagram).
Figure 10.
Dependence of the oxygen-18 concentrations in the river water of Lake Onega tributaries in summer on the ratio of (A) lake and (B) wetlands area of the tributary’s catchment (equations are shown in the diagram).


Table 1.
Statistics of the isotope composition of atmospheric precipitation (‰ SMOW) in Petrozavodsk city from 2009–2018.
Table 1.
Statistics of the isotope composition of atmospheric precipitation (‰ SMOW) in Petrozavodsk city from 2009–2018.
| Winter (114) * | Spring (75) | Summer (126) | Autumn (98) | For 2009–2018 | ||||||
|---|---|---|---|---|---|---|---|---|---|---|
| δ18O | δ2H | δ18O | δ2H | δ18O | δ2H | δ18O | δ2H | δ18O | δ2H | |
| Weighted average | −18.3 | −135 | −10.6 | −76 | −10.1 | −72 | −12.9 | −91 | −11.9 | −85 |
| Average | −17.2 | −126 | −11.1 | −80 | −9.6 | −68 | −13.4 | −96 | −12.9 | −93 |
| Minimum | −30.9 | −239 | −22.5 | −174 | −16.4 | −123 | −27.4 | −217 | −30.9 | −239 |
| Maximum | −9.1 | −67 | −4.7 | −22 | −4.1 | −26 | −6.2 | −40 | −4.7 | −22 |
Notes: *—the number of measurements in a season shown in parentheses. The following seasonal division is used: winter—the second half of December, January, February and the first half of March; spring—the second half of March, April and May; summer—June, July and August; autumn—September, October, November and the first half of December.
Disclaimer/Publisher’s Note: The statements, opinions and data contained in all publications are solely those of the individual author(s) and contributor(s) and not of MDPI and/or the editor(s). MDPI and/or the editor(s) disclaim responsibility for any injury to people or property resulting from any ideas, methods, instructions or products referred to in the content. |
© 2023 by the authors. Licensee MDPI, Basel, Switzerland. This article is an open access article distributed under the terms and conditions of the Creative Commons Attribution (CC BY) license (https://creativecommons.org/licenses/by/4.0/).
Share and Cite
MDPI and ACS Style
Borodulina, G.; Tokarev, I.; Yakovlev, E. Isotope Composition of Natural Water in Lake Onega Basin. Water 2023, 15, 1855. https://doi.org/10.3390/w15101855
AMA Style
Borodulina G, Tokarev I, Yakovlev E. Isotope Composition of Natural Water in Lake Onega Basin. Water. 2023; 15(10):1855. https://doi.org/10.3390/w15101855
Chicago/Turabian StyleBorodulina, Galina, Igor Tokarev, and Evgeny Yakovlev. 2023. "Isotope Composition of Natural Water in Lake Onega Basin" Water 15, no. 10: 1855. https://doi.org/10.3390/w15101855
Note that from the first issue of 2016, this journal uses article numbers instead of page numbers. See further details here.