
Removal of Pb(II) by Adsorption of HCO–(Fe3O4)x Composite Adsorbent: Efficacy and Mechanism

School of Civil Engineering, Hunan University of Science and Technology, Xiangtan 411201, China
*
Author to whom correspondence should be addressed.
Water 2023, 15(10), 1857; https://doi.org/10.3390/w15101857
Submission received: 20 March 2023
/
Revised: 4 May 2023
/
Accepted: 10 May 2023
/
Published: 13 May 2023
(This article belongs to the Section Wastewater Treatment and Reuse)
Abstract
:With the development of industry, the concentration of lead (Pb) in water bodies is gradually increasing, the forms of Pb pollution in water are becoming increasingly diversified, and the environmental and human health hazards caused by Pb pollution are receiving increasing attention. A HCO–(Fe3O4)x composite adsorbent prepared by the coprecipitation method of Fe3O4 mixed in cerium-rich grinding and polishing sludge was used to remove Pb from water. The effects of Ce/Fe molar ratio, pH, dosing amount, and time on the adsorption of HCO–(Fe3O4)x for Pb removal were investigated and the adsorption isotherm model, adsorption kinetics, and adsorption mechanism were studied. The results showed that the maximum adsorption capacity of HCO–(Fe3O4)x on Pb(II) was 35.93 mg·g−1 at a Ce/Fe molar ratio of 1.5:1, pH 4–5, and temperature of 25 °C, and the removal rate could reach 96.05%; the process of Pb(II) adsorption by HCO–(Fe3O4)x was in accordance with the Langmuir isothermal adsorption model and the pseudo-second-order reaction kinetic model; chemisorption was dominant. Characterization results, such as EDS, XRD, and XPS, showed that the composite preparation of HCO with Fe3O4 increased the specific surface area of HCO–(Fe3O4)x and generated amorphous iron oxides, such as FeCe2O4, FeOOH, Fe3O4, and Fe2O3, which provided conditions for the formation of Fe-O-Pb and Ce-O-Pb complexes during the adsorption process, thus facilitating the adsorption removal of Pb(II).
1. Introduction
In recent years, the adverse health effects of the heavy metal lead (Pb) have attracted widespread attention from scholars at home and abroad [1,2]. Acute Pb poisoning or long-term chronic Pb exposure can harm all systems of the body [3,4,5]. As a result, Pb poisoning has become a recognized and important health problem [2,3,6,7]. Pb is widely used in the production of lead–acid batteries, electroplating, construction, paper making, textiles, guns, and other materials, and is also emitted in the nonferrous metal smelting, extractive, and chemical industry [8,9,10,11,12]. This led the Pb(II) concentration in nearby bodies of water to rise gradually, and the situation of Pb pollution in the water environment is now very serious. Therefore, Pb emission control should be taken seriously and removing Pb from aqueous solutions should be considered as an important part of wastewater treatment in heavy industries [4,8,13,14,15,16].
The current methods for the removal of Pb(II) from solution mainly include chemical precipitation [17,18,19], electrolysis [20], biotechnology [21,22], electrodialysis [23,24], and adsorption [21]. Among these, the adsorption method is the most widely used, owing to the advantages of low cost, simple operation, and a vast source of raw materials [25,26]. Moreover, Fe3O4 is a commonly used adsorbent for removing Pb(II) [27,28], due to its advantages such as short adsorption time, low cost, wide pH adaptation range, and high renewable utilization efficiency [18,29,30,31,32]. However, the capacity of conventional Fe3O4 to adsorb Pb(II) is low. Therefore, the preparation of iron-loaded composite adsorbent with high adsorption capacity has become the key for current adsorption technology innovation and breakthroughs [26,33]. In this study, based on the ideas of resource recycling and treating waste with waste, Fe3O4 and cerium oxide-rich grinding and polishing sludge (hydrous ceric oxide: CeO2–nH2O, abbreviated as HCO) were used as raw materials and the Fe3O4/HCO composite adsorbent was prepared according to the literature [30,32]. HCO–Fe3O4 composite adsorbents with different Ce/Fe molar ratios (abbreviated as: HCO–(Fe3O4)x) were prepared by a modified coprecipitation method and the influencing factors (Ce/Fe molar ratio, pH, reaction time and coexisting anions), attachment properties, isothermal adsorption model, and adsorption kinetic processes of HCO–(Fe3O4)x adsorption for the removal of Pb(II) from water were investigated. Meanwhile, the surface morphology, crystal structure, and Pb(II) valence of HCO–(Fe3O4)x, both before and after Pb(II) adsorption, were characterized by modern testing techniques to elucidate the adsorption mechanism of Pb(II) by HCO–(Fe3O4)x with different Ce/Fe molar ratios, providing a technical reference for the adsorption and removal of Pb(II) from bodies of water.
2. Materials and Methods
2.1. Preparation and Characterization of HCO–(Fe3O4)x Composite Adsorbent
The raw material for the production of HCO–(Fe3O4)x is grinding and polishing sludge (HCO) which was collected from the wastewater treatment plant of LSKJ Co. The sludge contained some waste impurities; the main components were water (78.10%), cerium oxide (7.80%), silica (4.50%), alumina (3.80%), and calcium oxide (2.80%), etc. HCO–(Fe3O4)x was prepared using the coprecipitation method using HCO and Fe3O4 [1,34]; the Ce/Fe molar ratios were 1:0 (raw sludge), 0:1 (Fe3O4), 1:2 (HCO–(Fe3O4)0.5), 1:1 (HCO–(Fe3O4)1), and 1.5:1 (HCO–(Fe3O4)1.5) by controlling the dosing amount. The details of the preparation procedure are described in the literature [30,32,35].
2.2. Adsorption and Desorption Experiments
2.2.1. Batch Adsorption Experiments
- (1)
- The effect of Ce/Fe molar ratio: batch adsorption experiments were conducted in 250 mL glass bottles under different conditions. HCO–(Fe3O4)x (2000 mg·L−1) and Pb(II) (20 mg·L−1) [17,36] were combined in the bottles; the mixture was then shaken at 150 rpm at a constant temperature ((25 ± 1) °C) for up to 300 min. Aqueous solutions of 0.1 mol·L−1 hydrochloric acid or sodium hydroxide were used to adjust the pH of the solution. During the reaction, the solution was sampled at different times; a clear solution was obtained by filtration through a 0.45 μm membrane for testing. The removal performance and adsorption capacity were calculated (Equations (1) and (2)) [18,29,31]. All tests were performed in three parallel trials. Based on the removal rate and adsorption capacity of Pb(II), the best Ce/Fe molar ratio HCO–(Fe3O4)x adsorbent was selected for the following studies.
In the equation, η is the removal rate at adsorption equilibrium, expressed in %; C0, Ct, and Ce are initial, moment t, and equilibrium concentration of Pb(II), respectively, expressed in mg·L−1; qe is the adsorption capacity of the adsorbent for Pb(II) at equilibrium, expressed in mg·g−1; V is the volume of the solution after fixing, expressed in L; and m is the mass of HCO–(Fe3O4)x, expressed in g.
- (2)
- pH effect experiment: under the conditions of 2000 mg·L−1 of HCO–(Fe3O4)x, 2.0 h of reaction time, and (25 ± 1) °C, the effects of initial solution pH (2.0, 3.0, 4.0, 5.0, 6.0, 7.0, 8.0, and 9.0) on the adsorption of Pb(II) by HCO–(Fe3O4)x were investigated to determine the optimal pH for adsorption.
- (3)
- Adsorption time effect experiment: under the conditions of 2000 mg·L−1 of HCO–(Fe3O4)x, the initial pH of 4.0, and temperature of (25 ± 1) °C, the effects of adsorption time on the adsorption of Pb(II) by HCO–(Fe3O4)x were investigated to determine the optimal adsorption time for adsorption.
- (4)
- Experiment on the effect of coexisting anions: the wastewater of lead-zinc ore dressing often contains a large amount of anions [36,37] such as chloride ions (Cl−), sulphate ions (SO42−), phosphate ions (PO43−), and silicate ions (SiO32−). Therefore, the effect of these coexisting anions on the adsorption of Pb(II) by HCO–(Fe3O4)x was investigated under the conditions of HCO–(Fe3O4)x dosage of 2000 mg·L−1, initial pH of the solution of 4, and temperature of (25 ± 1) °C. The concentration of all coexisting anions was 1.0 mol·L−1.
- (5)
- Desorption experiments: according to the conclusion reached in the literature [30,32], the Pb(II) adsorbed by HCO–(Fe3O4)x was desorbed and regenerated using ultrapure water (H2O) and 0.1 mol·L−1 hydrochloric acid (HCl), sodium hydroxide (NaOH), and ethylenediaminetetraacetic acid (EDTA); the desorbed and regenerated HCO–(Fe3O4)x was filtered and dried, and then Pb(II) adsorption experiments were performed to determine its optimal desorbent and evaluate its regeneration capacity [32].
2.2.2. Adsorption Isotherm Experiment
After preparing 100 mL of Pb(II) solution with concentrations ranging from 0 to 100 mg·L−1 and adding 0.2 g of HCO–(Fe3O4)x at 25 °C with constant temperature shaking for 6 h, the supernatant was passed over a 0.45 μm membrane to determine the residual concentration of Pb(II) and calculate its equilibrium adsorption amount. The data were fitted using Langmuir (Equation (3)), Freundlich (Equation (4)), and Dubinin–Radushkevich (D–R) (Equations (5)–(7)) adsorption isotherm models [26,31,38].
In the equation: Ce is the concentration of Pb(II) in solution at adsorption equilibrium, expressed in mg·L−1; qe and qmax are the equilibrium adsorption capacity and maximum adsorption capacity, expressed in mg·g−1, respectively; b is the Langmuir adsorption constant, expressed in L·mg−1; Kf and 1/n are the Freundlich adsorption constants; β is constant of D–R isotherm, expressed in mol2·kJ−2; qs is the theoretical isothermal saturation ability, expressed in mg·g−1; ε is polanyi adsorption potential; R is the universal gas constant of 8.314J.molK−1; T is the absolute temperature, expressed in K; and E is adsorption energy, expressed in KJ·mol−1.
2.2.3. Adsorption Kinetics Experiments
A 100 mL solution of Pb(II) at a concentration of 100 mg·L−1 was prepared [17,36], 0.2 g of adsorbent was added and shaken in a constant temperature shaker at 25 °C, and the residual concentration of Pb(II) was measured after taking the supernatant of different reaction times over a 0.45 μm membrane; the removal rate and adsorption amount of Pb(II) were calculated. Then, the data were fitted using a pseudo-first-order model (Equation (8)), pseudo-second-order model (Equation (9)), Elovich model (Equation (10)), and intraparticle diffusion model (Equation (11)) [26,31,38]:
In the equation, t is the adsorption time, expressed in min; qt is the adsorption capacity at time t (min), expressed in mg·g−1; k1 is the pseudo-first-order model rate, expressed in min−1; k2 is the pseudo-second-order model rate, expressed in g·(mg·min)−1, qe is the adsorption equilibrium amount at moment t, expressed in mg·g−1; qt is the adsorption capacity at time t (min), expressed in mg·g−1; α is the adsorption constant of Elovich model, expressed in mg·mg−1·min−1; β is related to the surface area and chemical activation energy of the adsorbent, expressed in g·mg−1; k4i is the adsorption rate constant at a particular stage of adsorption, expressed in mg·g−1·min−0.5; and αi is the intraparticle diffusion model constant for a particular stage of adsorption.
2.3. Analysis Method
The experimental reagents were all superior purity, and the experimental water was all deionized water. In the test, 1.5986 g of Pb(NO3)2 was weighed, dissolved in ultrapure water, transferred to a 1L volumetric flask, fixed, and shaken well to obtain 1.0 g·L−1 of Pb(II) standard reserve solution; the desired concentration of Pb(II) solution was obtained by diluting the appropriate amount of Pb standard reserve solution [30]. The concentration of Pb(II) was measured using a flame atomic absorption spectrometer (AA-7002A, Beijing East-West Analytical Instruments Co., Ltd., Peking, China) [12,32].
2.4. Characterization Analysis Method
The residues of HCO–(Fe3O4)x before and after the adsorption of Pb(II) were characterized using a scanning electron microscopy (SEM, JSM-6380LV, JEOL Ltd., Tokyo, Japan) with an operating voltage of 5.0 KV; the elemental species and content of HCO–(Fe3O4)x before and after Pb adsorption were determined using energy-dispersive spectroscopy (EDS, Bruker XFlash 5010, Karlsruhe, Germany). Analysis of the compounds involved in the adsorption process and the remaining compounds after the adsorption of Pb(II) was conducted using X-ray diffraction (XRD, D8 Advance, Brook AXS Ltd., Karlsruhe, Germany) with a scanning range of 10–90° and a scanning speed of 6·min−1. Analysis of the functional groups and bond composition before and after adsorption was conducted using FTIR (Nicolet 6700, Thermo Fisher, Waltham, MA, USA) with a scan range of 4000–500 cm−1. The valence states of Fe, Ce, and Pb before and after adsorption were analyzed using X-ray photoelectron spectroscopy (XPS, Thermo Scientific: Esala 250Xi, Waltham, MA, USA) with all binding energies (B.E) using the carbon peak C1s at 285.1 eV as a reference value and the analysis software XPS Peak.
3. Results and Discussion
3.1. The Influence of Ce/Fe Molar Ratio
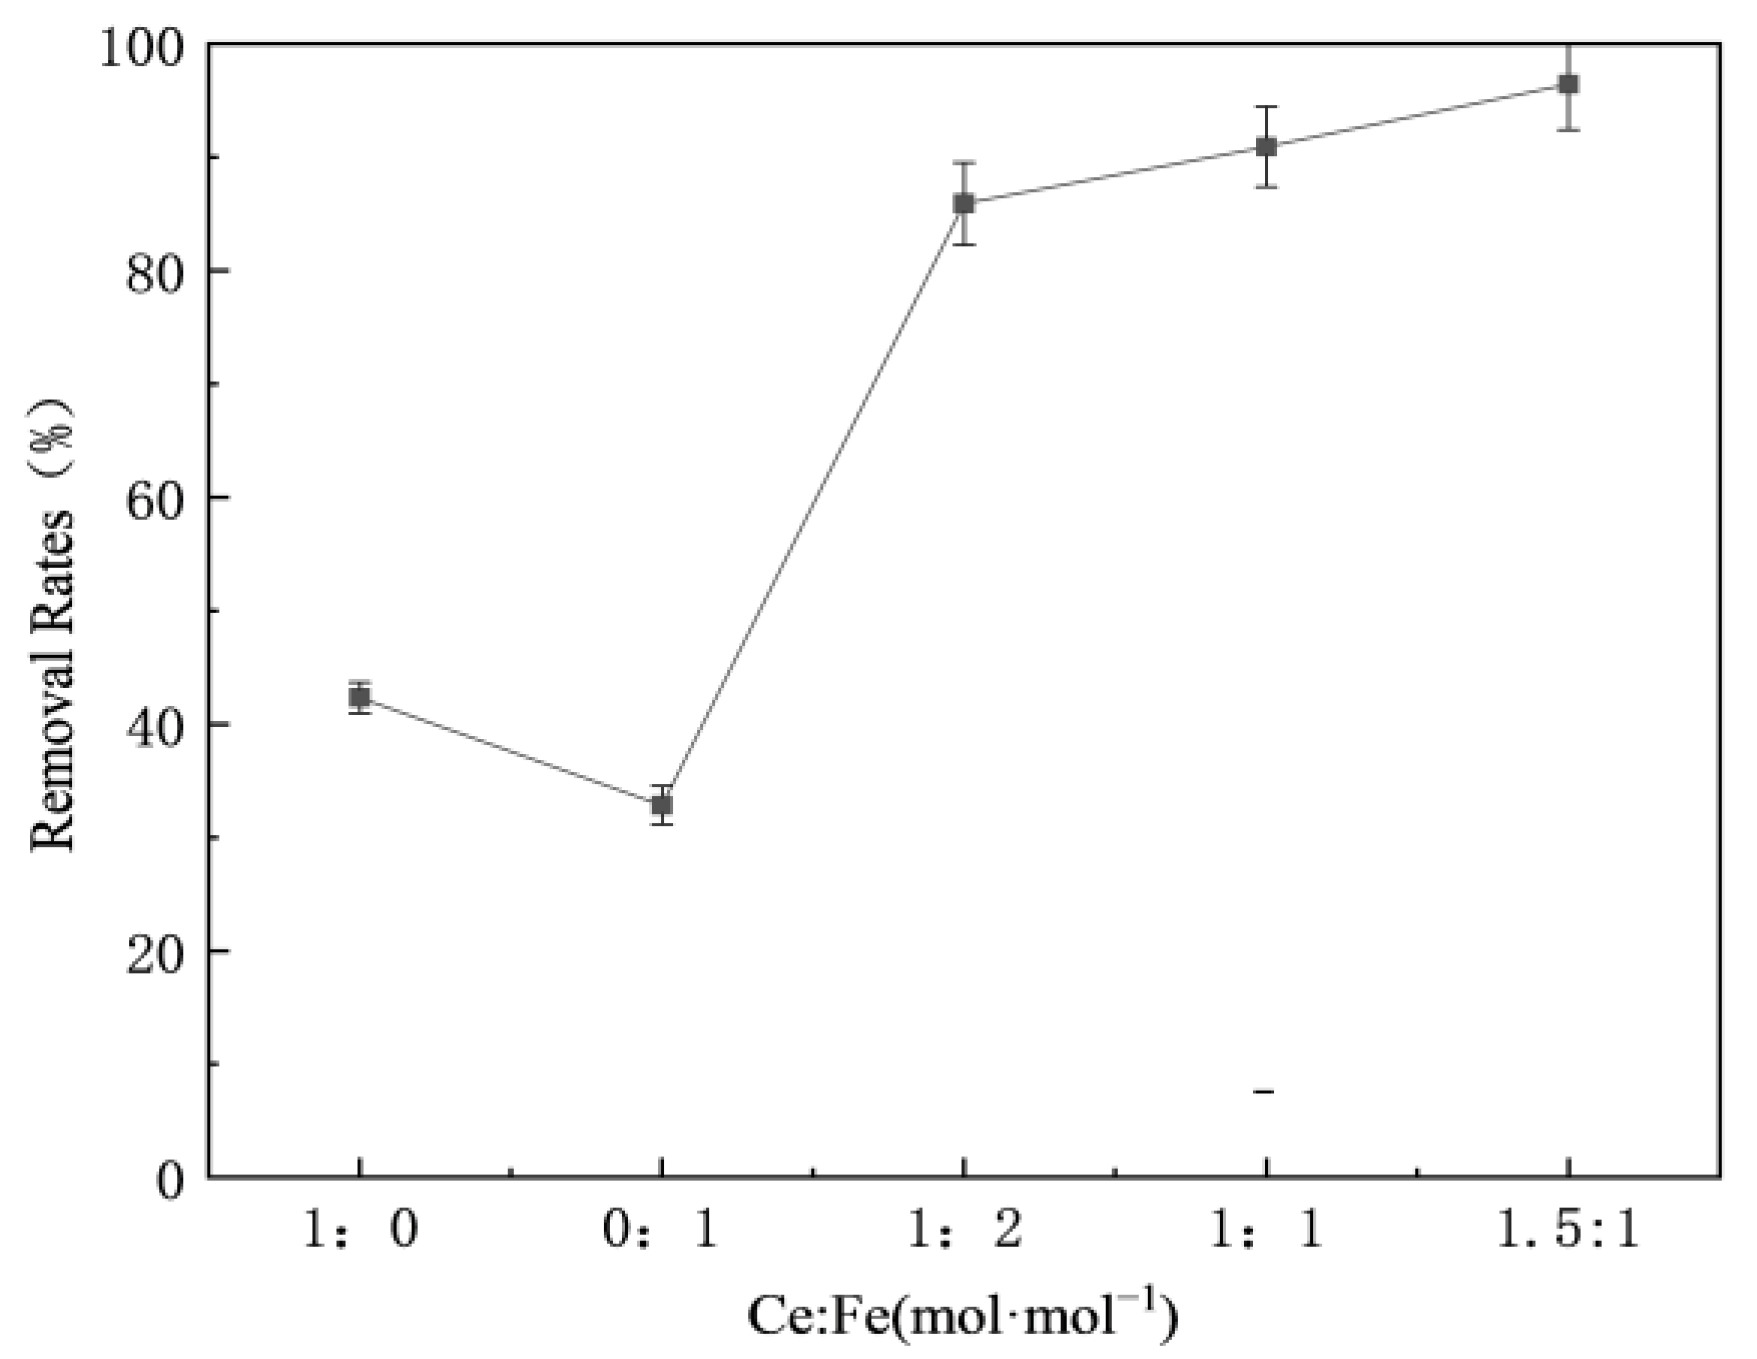
The Ce/Fe molar ratio affects the structure and properties of HCO–(Fe3O4)x [26,30,32], which, in turn, affect its effect on Pb(II) adsorption. The removal of Pb(II) by adsorption of HCO–(Fe3O4)x with Ce/Fe molar ratios of 1:0 (HCO), 0:1 (Fe3O4), 1:2, 1:1, and 1.5:1, respectively, is provided in Figure 1. The adsorption of HCO–(Fe3O4)x for the removal of Pb(II) was better than that of pure HCO or Fe3O4, indicating that the composite preparation of HCO–(Fe3O4)x can improve the removal of Pb(II) ions from aqueous solutions. As shown in Figure 1, the removal rate of Pb(II) increased from 32.84% to 96.45% when the Ce/Fe molar ratio increased from 0:1 to 1.5:1, and its removal rate increased with the increase in the Ce/Fe molar ratio. This occurred because Fe3O4 loaded onto HCO formed HCO–(Fe3O4)x adsorbent with porous and multiple active sites, which was also supported by the specific surface area (SBET) parameters determined by the nitrogen adsorption–desorption method (Table A1). For example, the SBET at the Ce/Fe molar ratio of 1:2 is 104.64 m2·g−1, which is 3.5 times higher than that of the Ce/Fe molar ratio 1:0 sample (29.63 m2·g−1)—which is close to 132.2 m2·g−1 of the maximum specific surface area (SBET) obtained by Qi et al. [39] using cerium-doped Fe3O4—. The specific surface area (SBET) increased from 104.64 m2·g−1 to 108.57 m2·g−1 when the Ce/Fe molar ratio increased from 1:2 to 1.5:1, implying that the specific surface area of HCO–(Fe3O4)x increased with the increase in the x value. This is in agreement with the conclusion of Qi et al. [39] that when increasing the molar ratio of Ce, the increase in the specific surface area of HCO–(Fe3O4)x provides more active sites [39], which provides a good basis for the adsorption of Pb(II). Overall, HCO–(Fe3O4)x with a Ce/Fe molar ratio of 1.5:1 had the best adsorption and removal effect on Pb(II). Therefore, follow–up studies were conducted with HCO–(Fe3O4)x adsorbent with the Ce/Fe molar ratio of 1.5:1.
3.2. The Influence of pH
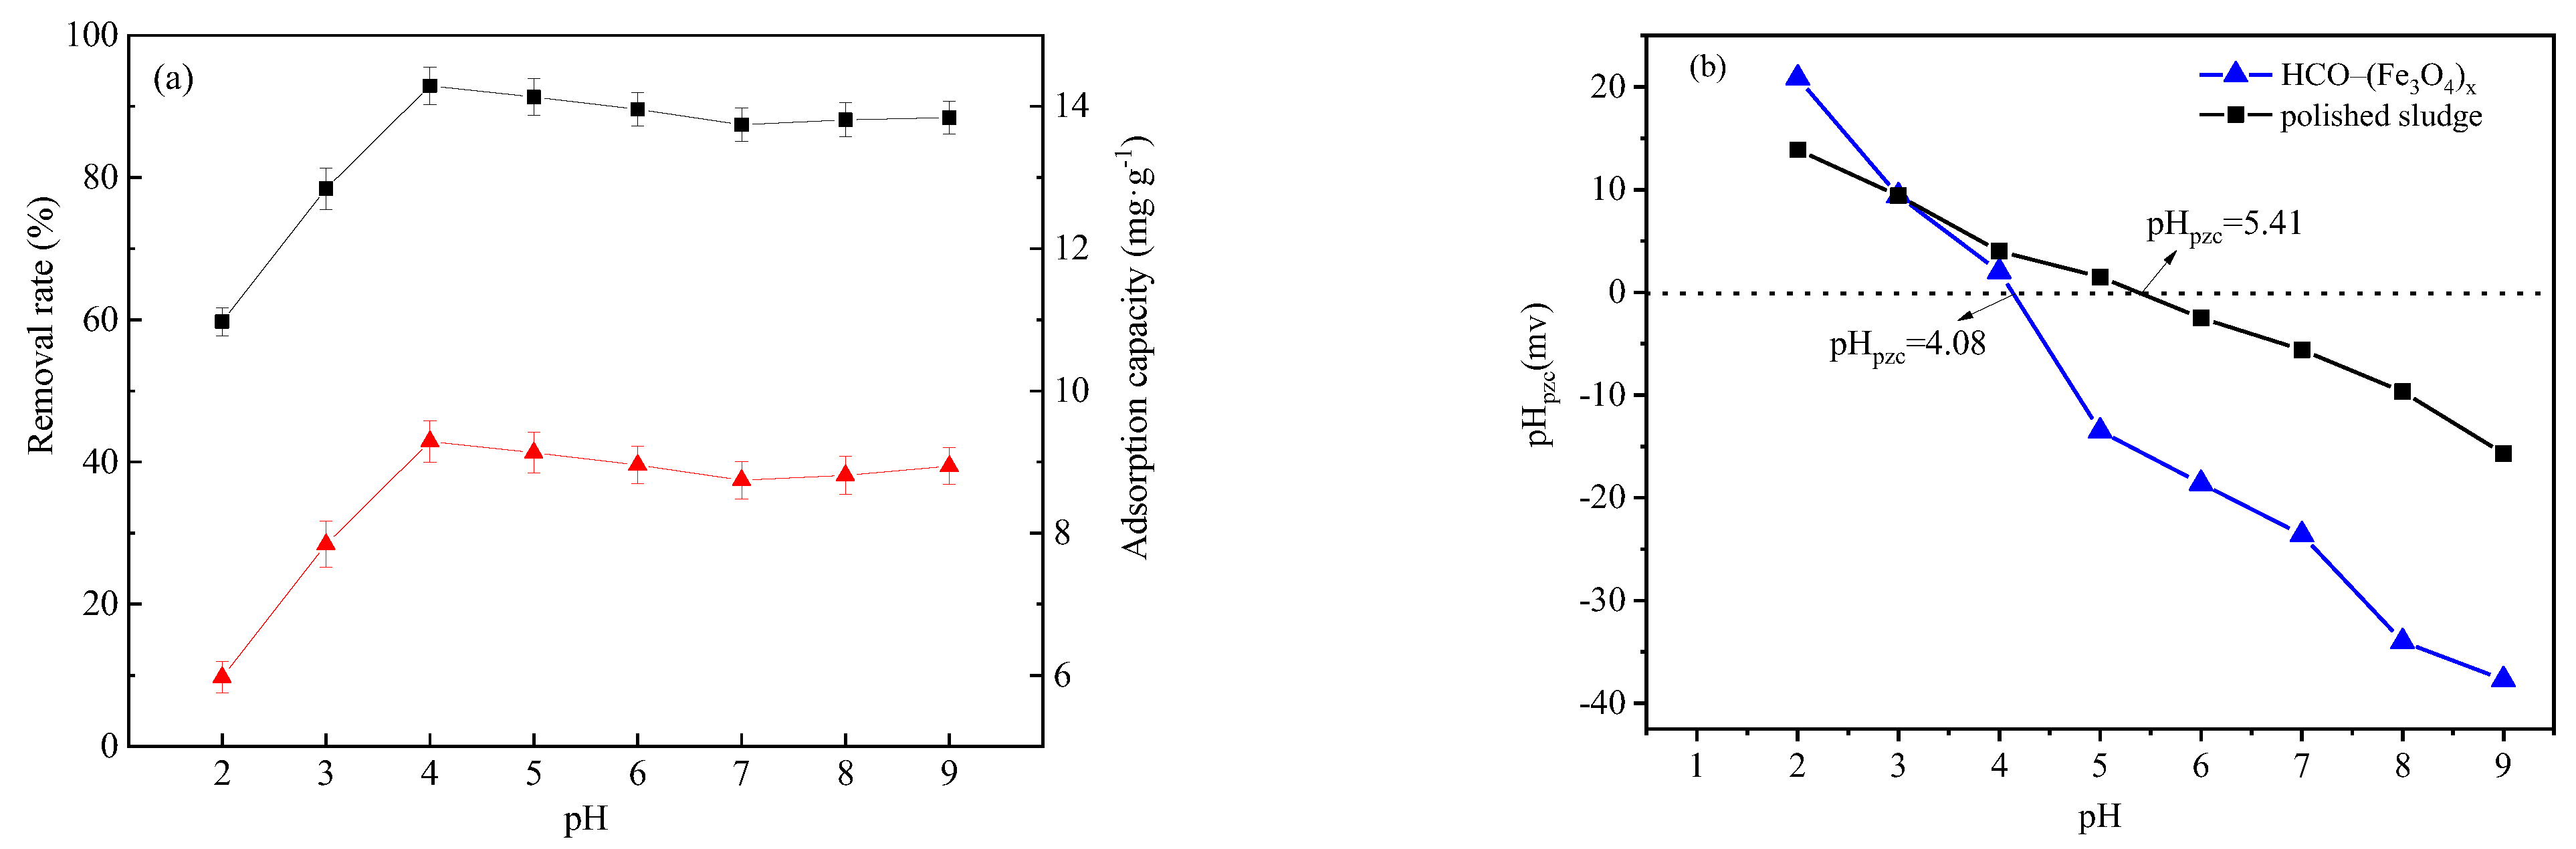
The effects of initial pH on the adsorption of Pb(II) onto HCO–(Fe3O4)x are shown in Figure 2a. As shown in Figure 2a, when the pH increased from 2 to 4, the Pb(II) removal rate increased rapidly from 59.74% to 96.05% and reached the maximum; when the pH continued to increase to 9, the rate decreased slowly to 86.41%. Therefore, the adsorption efficiency increased first and then slightly decreased with the increase in pH. When pH < 4, Pb(II) in the solution are mainly present as Pb2+ and Pb(OH)2+ [40], and the large amount of H+ present in the solution at this time adheres to the surface of HCO–(Fe3O4)x and protonates it, resulting in few available heavy active sites for Pb(II). However, the adsorption efficiency increased significantly with the initial pH of 4–5 and became stable at pH = 4.0~5.0. This implies that the increased pH greatly weakened the competition of H+ and increased the adsorption efficiency. To further explain this result, the point of zero charge (pHpzc) was tested (Figure 2b). When pH > pHpzc, the HCO–(Fe3O4)x was negatively charged; otherwise, it was positively charged. The pHpzc of HCO–(Fe3O4)x was 4.08, which is consistent with previous studies [39,41]. At pH < 4.08, the positively charged surface of HCO–(Fe3O4)x will electrostatically repulse with cations. This result is not conducive to the adsorption of Pb(II). At pH > 4.08, the surface of HCO–(Fe3O4)x is dominated by negative charge, which provides more active sites and promotes the adsorption of Pb(II). Therefore, a large amount of Pb(II) was adsorbed onto the surface of HCO–(Fe3O4)x at high pH, which is consistent with previous studies [17]. When the pH increases to 6–9, Pb ions in solution mainly exist in various forms, such as Pb2+, Pb(OH)+, and Pb(OH)2 [42], and some Pb(II) is removed by Pb(OH)2 precipitation. Overall, the suitable pH values for Pb(II) adsorption by HCO–(Fe3O4)x are 4–5.
3.3. The Influence of Adsorption Time
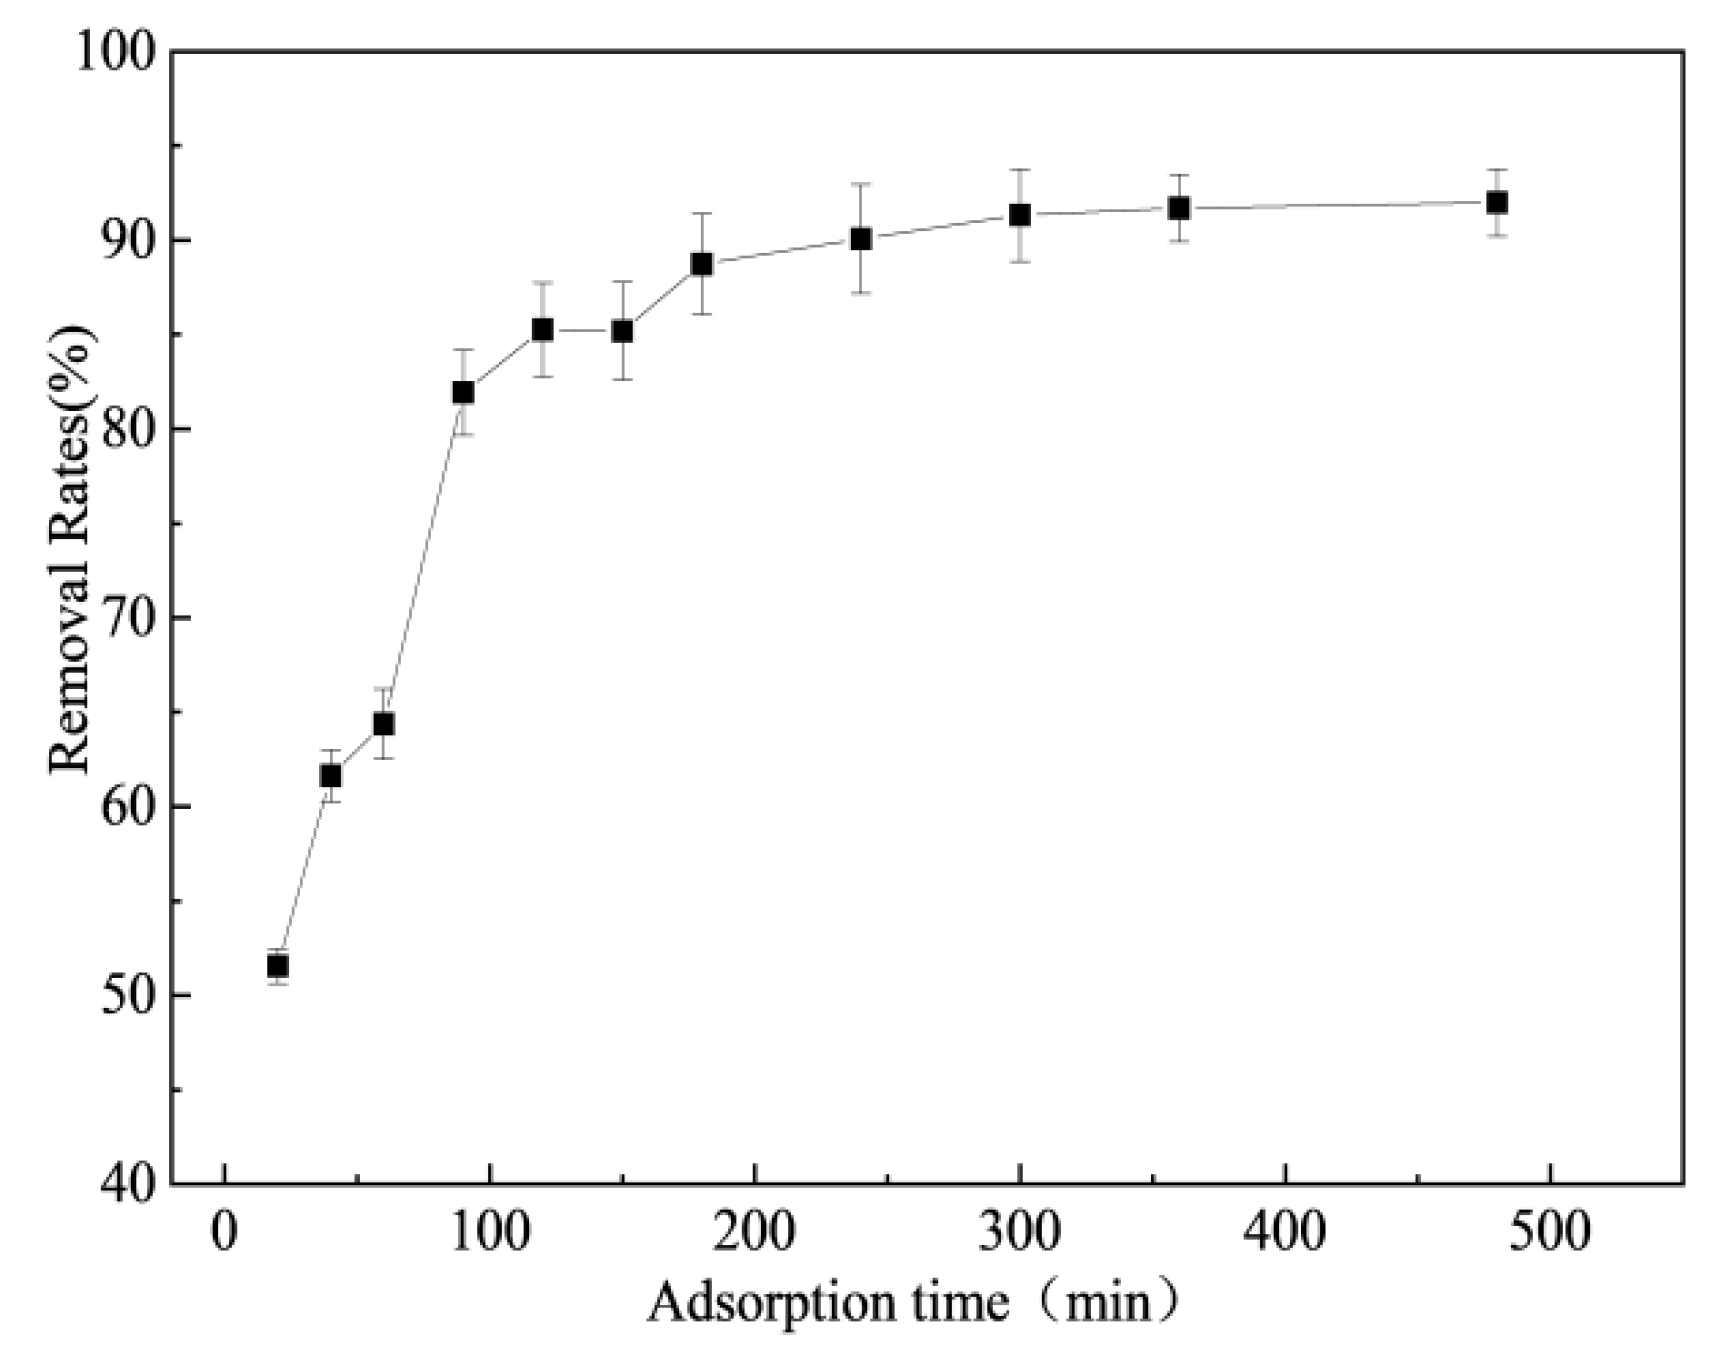
Different adsorption times will directly affect the adsorption effect, and the adsorption equilibrium time can reflect the performance of the adsorbent to a certain extent [18,29,31]. As can be seen from the black line in Figure 3, the reaction of HCO–(Fe3O4)x on the removal of Pb(II) reached 90.07% removal of Pb(II) by 240 min, and the reaction continued until 480 min, when the removal rate only increased to 92.00%. Therefore, the reaction equilibrium time for the adsorption of Pb(II) was 4 h. In addition, the red line in Figure 3 shows that in the initial stage of adsorption, there are a large number of active sites on the adsorbent surface and the reaction can proceed rapidly; after 20 min, as time passes, the active sites are gradually occupied by Pb(II) ions until the adsorption is saturated and the reaction gradually declines and stops.
3.4. The Influence of Coexisting Anions
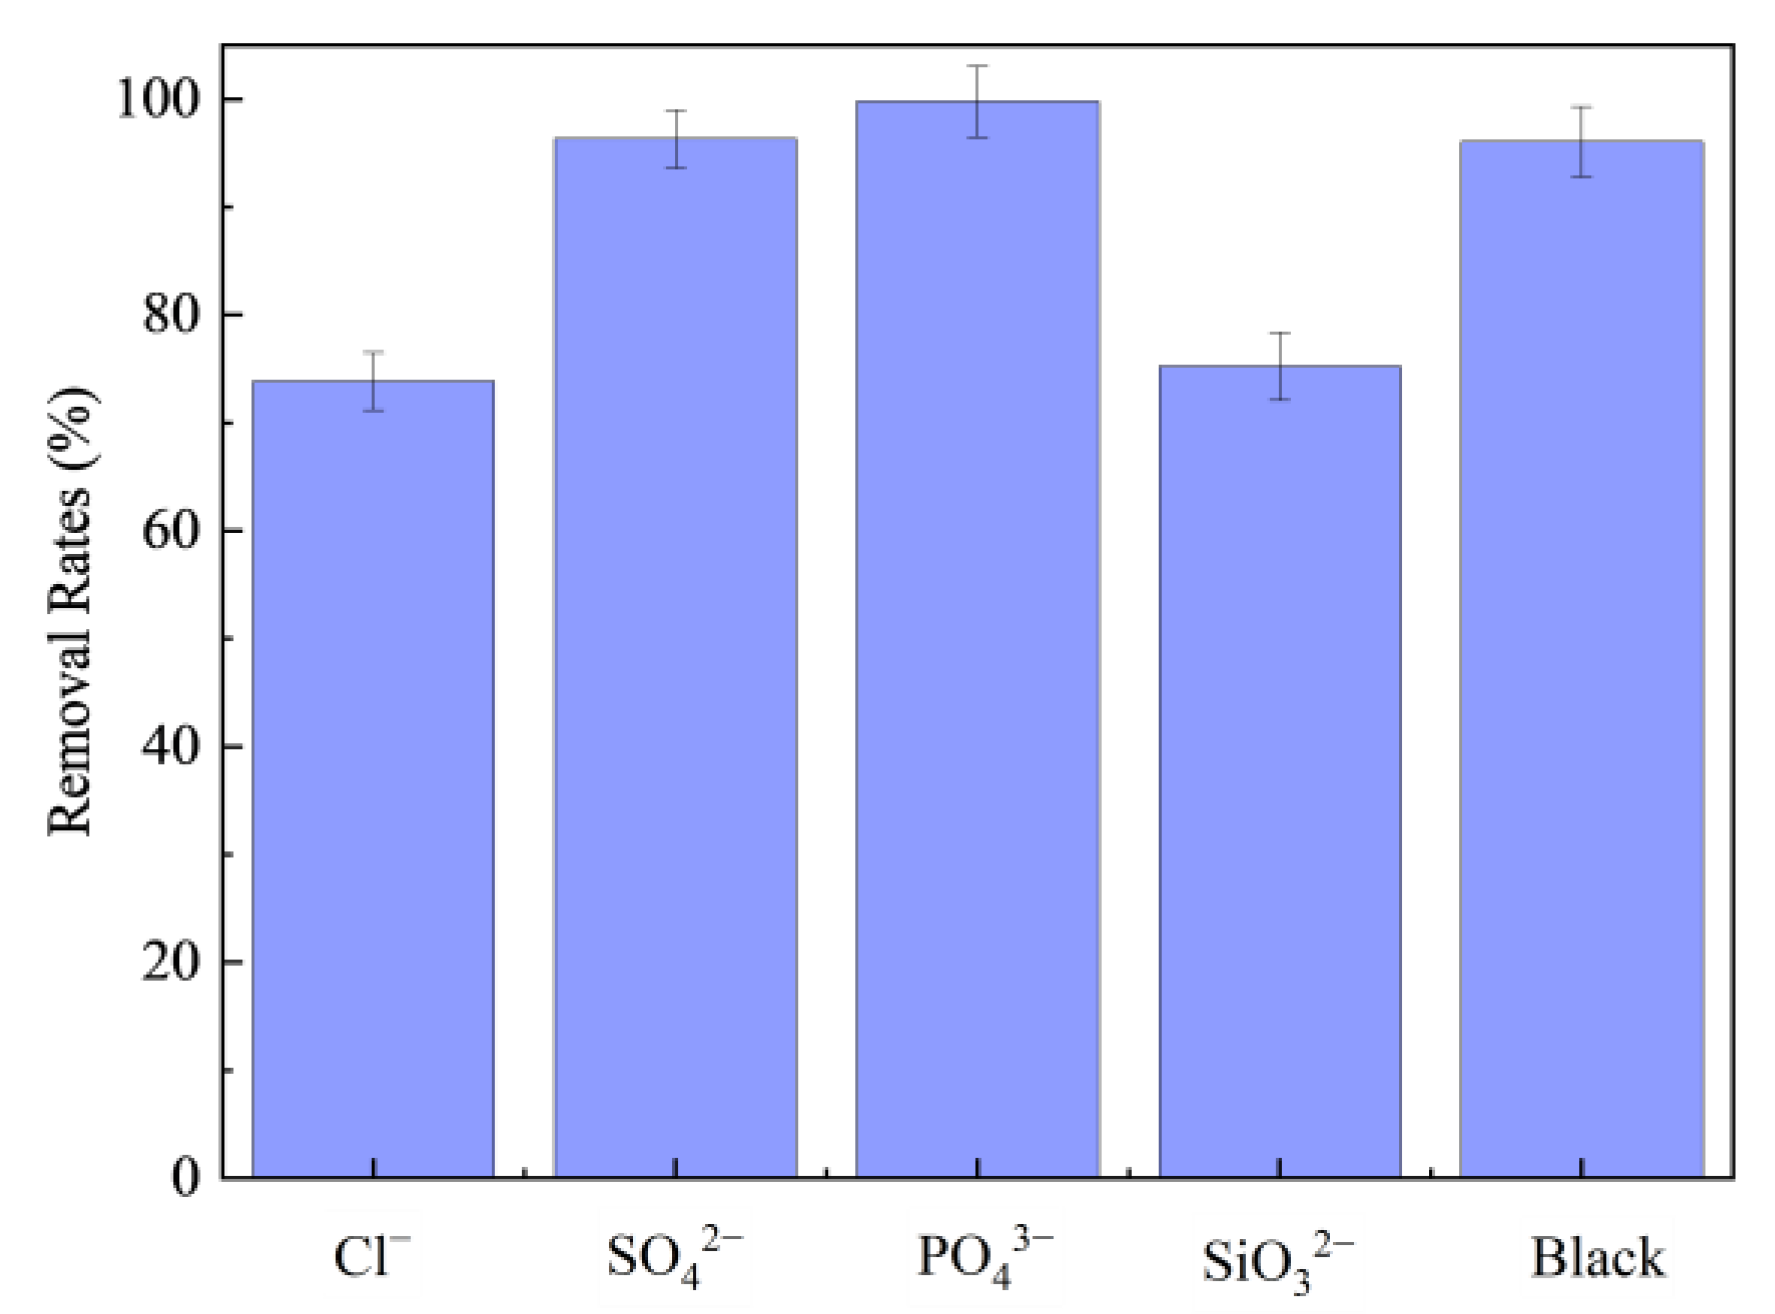
In natural waters, a wide variety of anions are usually present, which affect the removal of heavy metals by adsorption through physicochemical reactions such as competition, promotion, and complexation [11,18,19,43]. The effects of four anions, Cl−, SO42−, PO43−, and SiO32−, on the removal of Pb(II) by adsorption of HCO–(Fe3O4)x are provided in Figure 4. As can be seen from Figure 4, the removal rates of Pb(II) were 73.85% and 75.23% when the concentrations of Cl− and SiO32− were 1 mol·L−1, respectively, which were lower than those of the blank experimental group (96.05%). It can be seen that Cl− and SiO32− had a negative effect on the adsorption and removal of Pb(II); the reason for this needs to be studied further. When the concentration of PO43− was 1 mol·L−1, the removal rate of Pb(II) was 99.77%, which was higher than that of the blank experimental group (96.05%), indicating that PO43− could promote the adsorption of Pb(II) by HCO–(Fe3O4)x. It may be that PO43− and Pb(II) generate precipitates with very low solubility, leading to the increase in the removal rate of Pb(II) [44]. In addition, SO42− had no effect on the adsorption of HCO–(Fe3O4)x onto the Pb(II) group.
3.5. Regeneration of Adsorbent
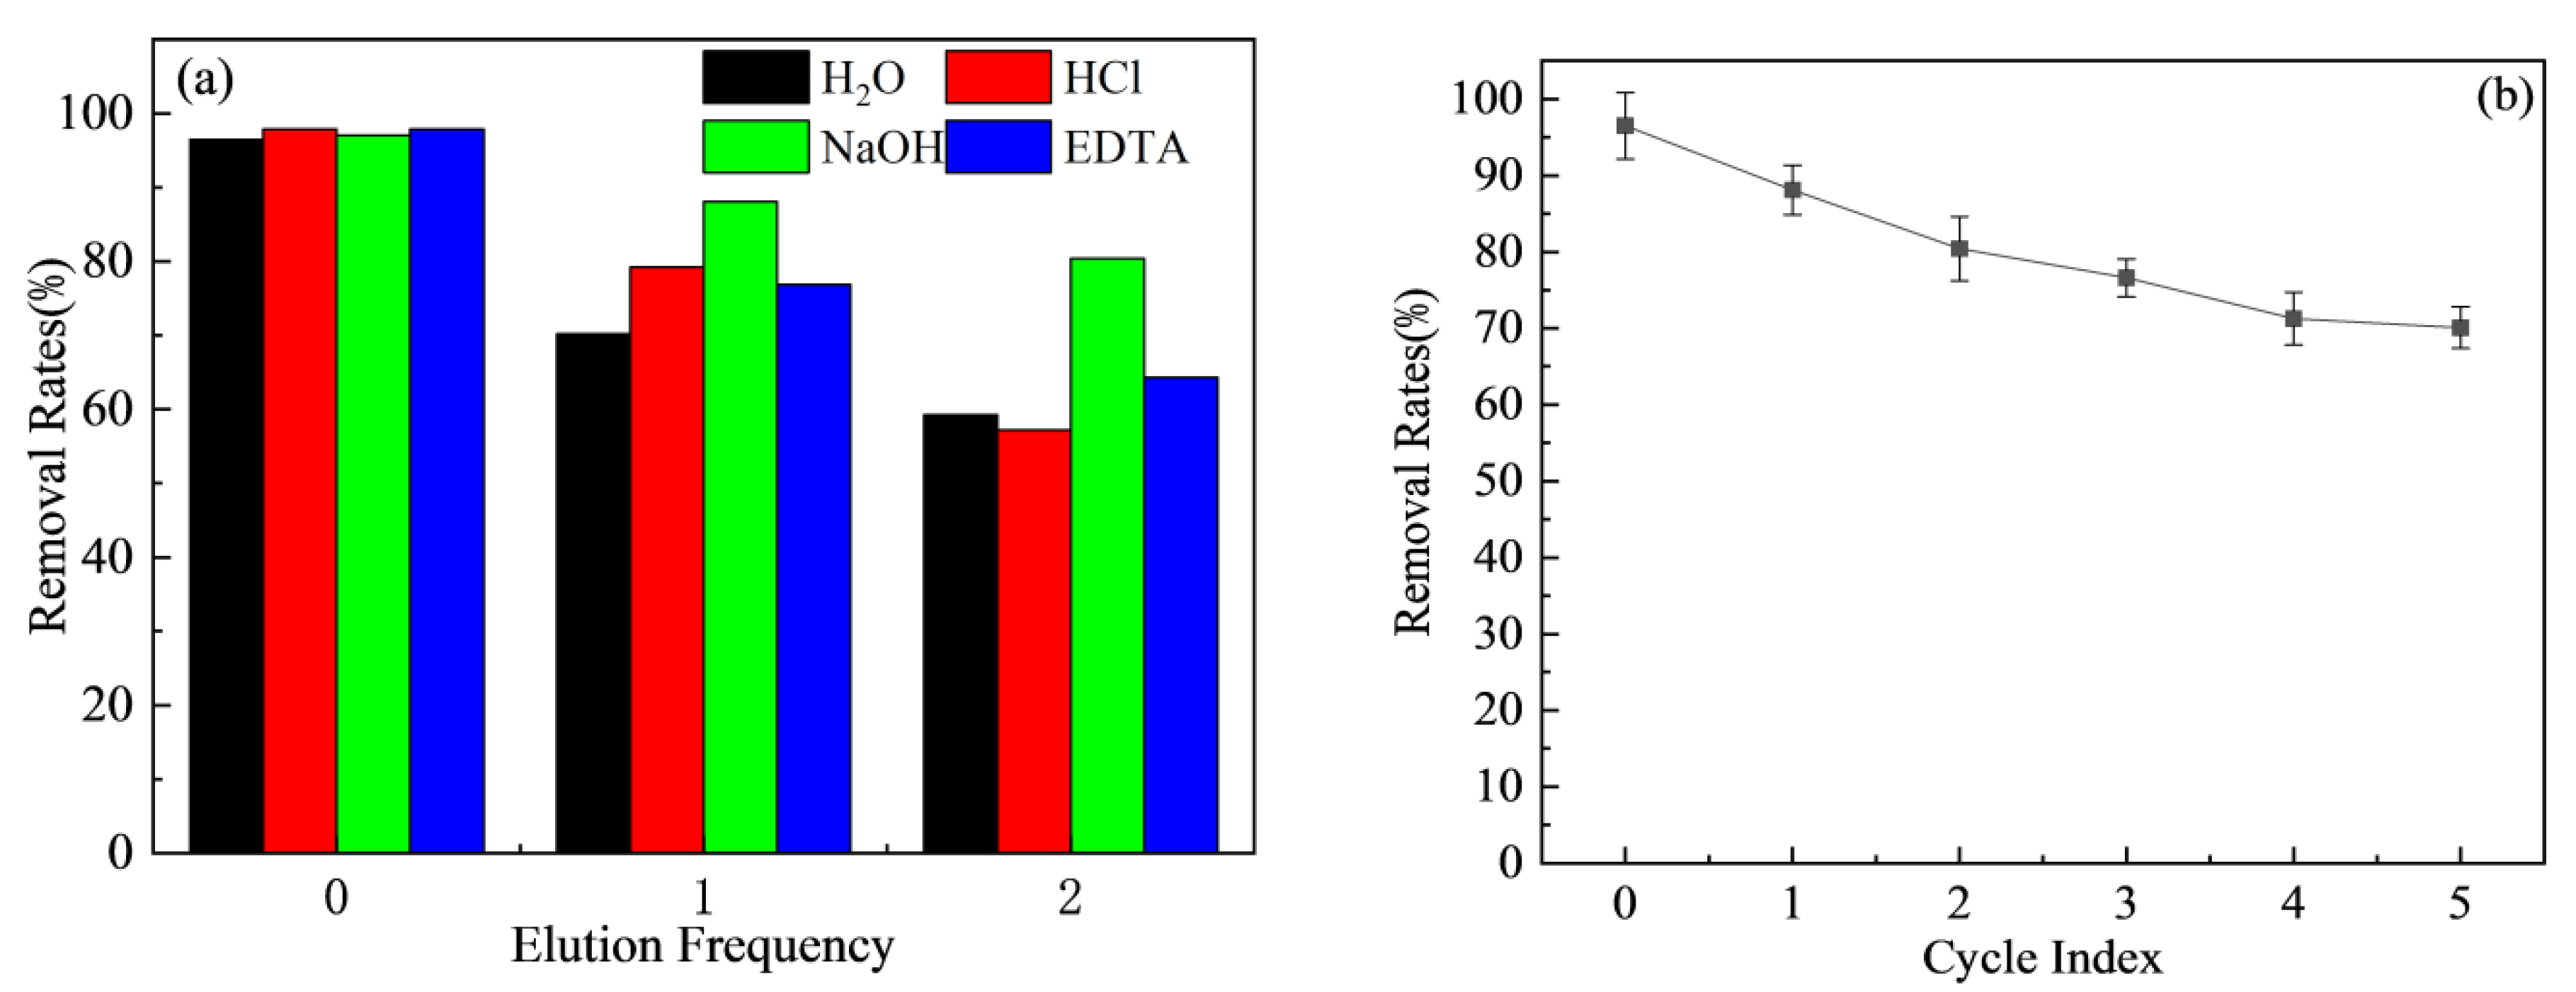
The effects of four eluents, pure water (H2O), and 0.1 mol·L−1 HCl, NaOH, and EDTA on the desorption and readsorption of Pb(II) from HCO–(Fe3O4)x are provided in Figure 5. As shown in Figure 5a, the highest efficiency (80.41%) of Pb(II) adsorption by HCO–(Fe3O4)x was obtained after 2 desorptions of NaOH solution, which shows that NaOH solution is the best eluent; this is consistent with the findings of Deng et al. [32,35]. As shown in Figure 4b, the adsorption and removal of Pb(II) by HCO–(Fe3O4)x can still reach 70.08% after 5 adsorption/desorptions by NaOH solution, which is close to the regenerative use performance of Ce–Fe3O4, reflecting the good regeneration performance and laying a good foundation for the reuse of HCO–(Fe3O4)x and the recovery of Pb, with potential economic use value.
3.6. Adsorption Isotherm
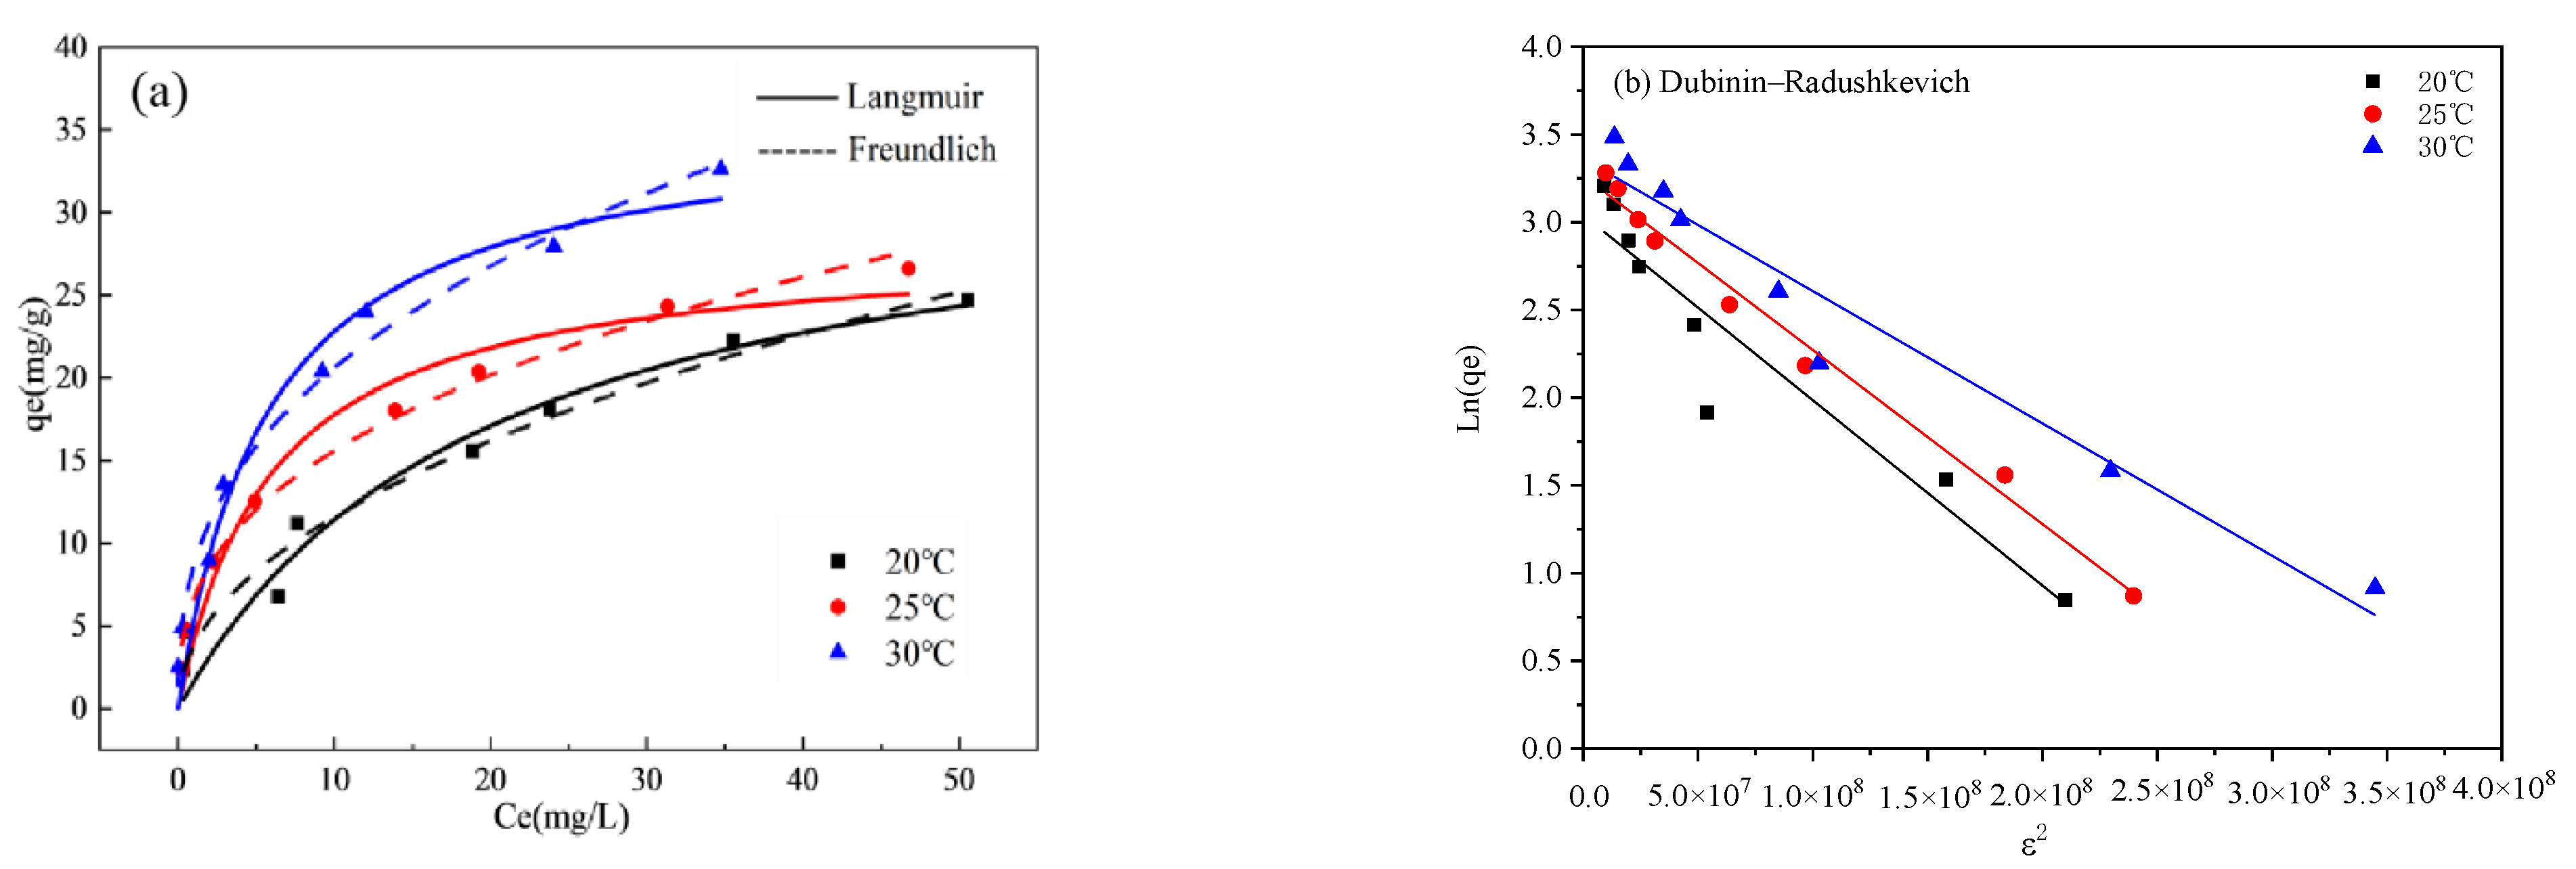
The adsorption isothermal model was used to fit the process of Pb(II) adsorption on HCO–(Fe3O4)x. The results are shown in Figure 6 and Table 1. As shown in Table 1 and Table 2, the correlation coefficient R2 of Pb(II) adsorption by the Freundlich model at each temperature is higher than that of the Langmuir model and the D–R model, which indicates that the Freundlich model can better describe the process of Pb(II) adsorption on HCO–(Fe3O4)x. Considering the empirical adsorption model, in which the Freundlich model assumes whether its ion-binding sites are occupied or not, the adsorption of Pb(II) by HCO–(Fe3O4)x is introduced as mainly multilayer adsorption [45]. The Kf constant of the Freundlich model gradually increases and 1/n gradually decreases as the temperature increases (Table 1), which indicates that the adsorption process of HCO–(Fe3O4)x for Pb(II) is a heat absorption reaction [46], and 1/n is between 0.1 and 0.5 (Table 1), implying that Pb(II) is easily adsorbed by HCO–(Fe3O4)x [9]. Furthermore, the correlation coefficient R2 for Pb(II) adsorption by the Langmuir model at temperature is only slightly lower than that of the Freundlich model, implying that the process of Pb(II) adsorption by HCO–(Fe3O4)1.5 contains both monolayer (chemical) and multilayer (physical) adsorption [46]. Moreover, whether the adsorption of Pb(II) on HCO–(Fe3O4)x belongs to a physical adsorption process or a chemical adsorption process can be determined based on the E value of the D–R model. When the E value is between 1–8 KJ·mo−1, it belongs to physical adsorption; when the E value is between 9–16 KJ·mo−1 it belongs to ion exchange; when the E value is greater than 16 KJ·mo−1, it belongs to chemical adsorption [30,47]. As shown in Table 1, the E value is between 20.926 and 28.845 KJ·mo−1; therefore, HCO–(Fe3O4)x adsorption Pb(II) belongs to chemical adsorption.
3.7. Adsorption Dynamical Model
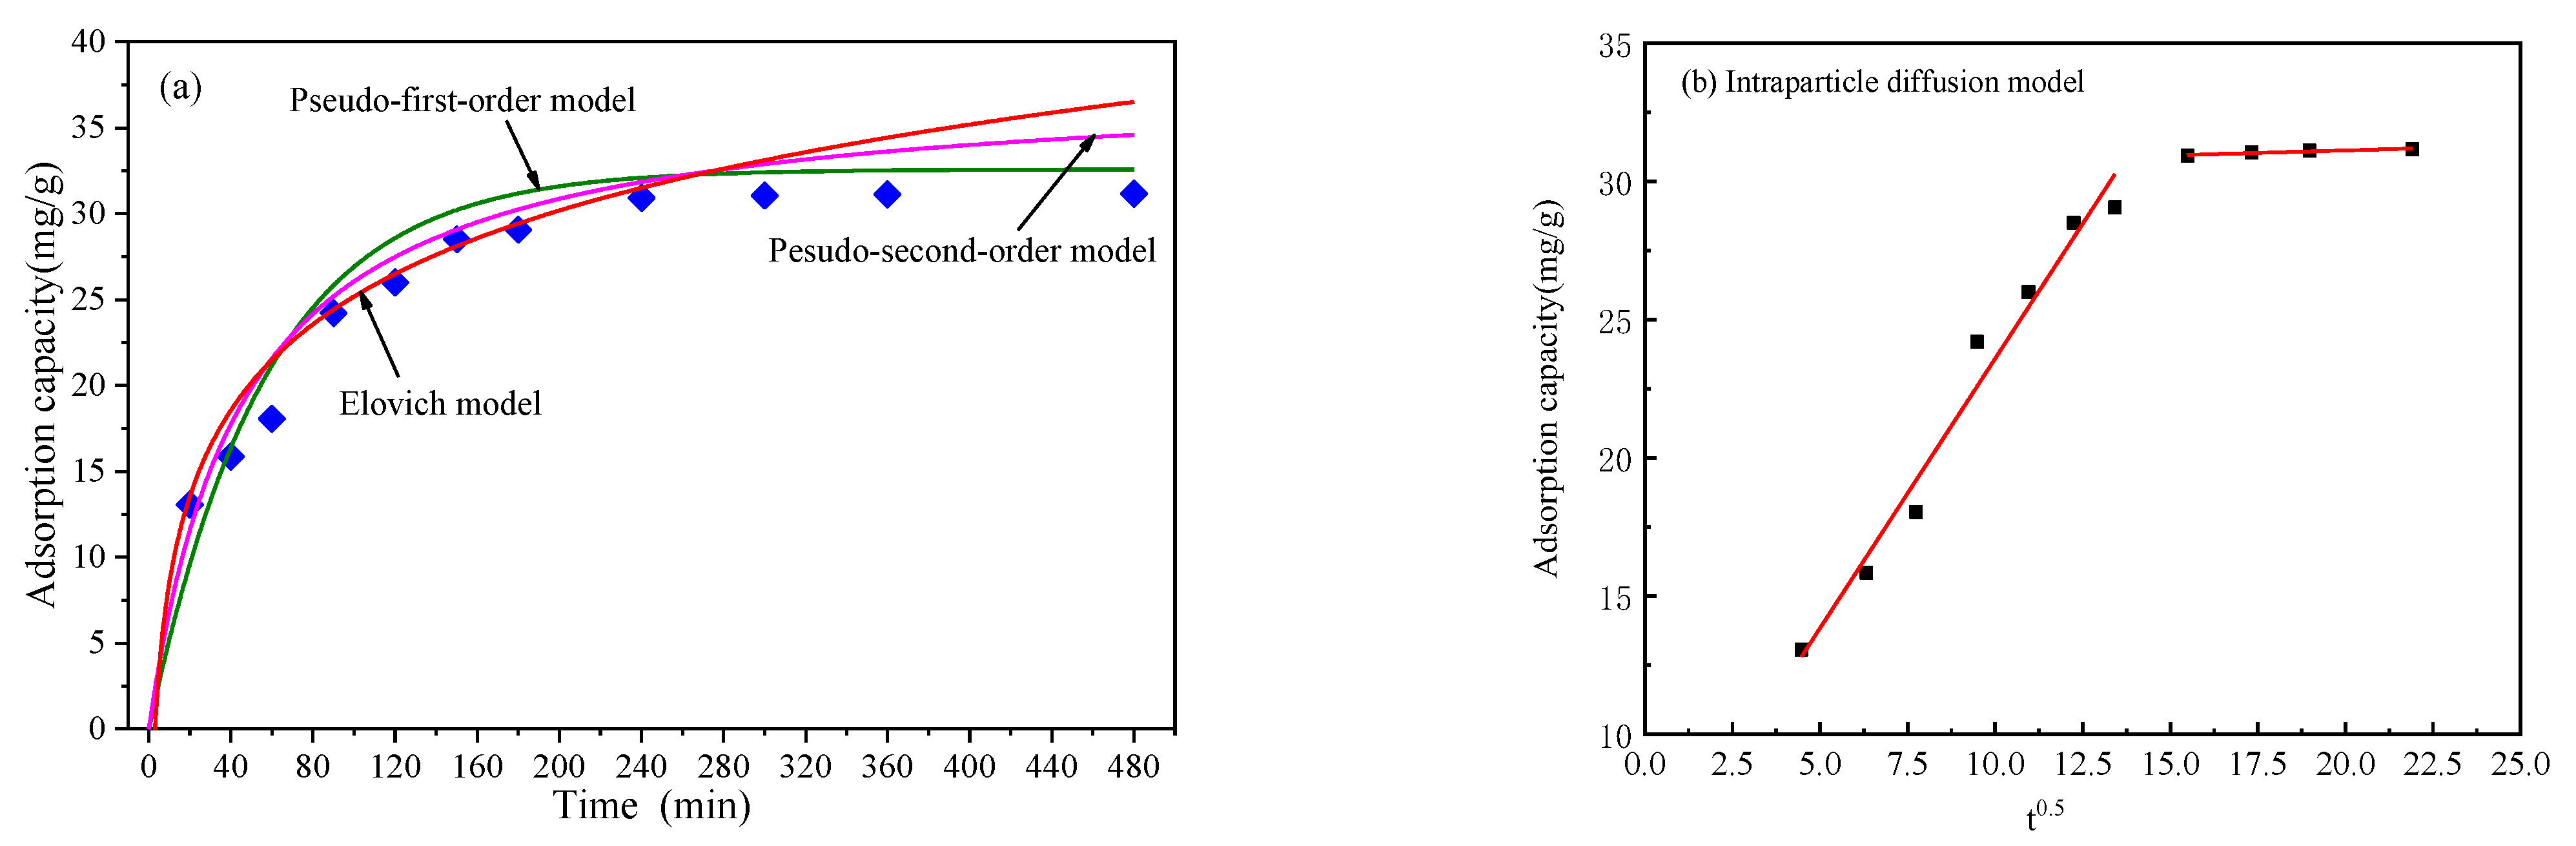
The pseudo-first-order, pseudo-second-order, Elovich, and intraparticle diffusion dynamics models were used to fit the experimental data (Figure 7) and the relevant data parameters were listed in Table 2 and Table 3. The fitting coefficient of the pseudo-second-order model (R2 = 0.962) is larger than that of the other three models. Moreover, the qe value (35.34 mg·g−1) calculated by the pseudo-second-order model is close to the experimental value (35.93 mg·g−1), further supporting that the kinetic process of Pb(II) adsorption by HCO–(Fe3O4)x follows the pseudo-second-order kinetic model [21]. The result also implied that the whole process of Pb(II) adsorption by HCO–(Fe3O4)x is controlled by the chemical reaction at the solid–liquid interface [48]. In a word, the kinetic process of HCO–(Fe3O4)x adsorption of Pb(II) is appropriate for fitting by the pseudo-second-order model, which suggests that electron sharing or electron transfer is the main source of adsorption kinetics [48,49] and chemisorption is dominant, which is also consistent with the results of Deng [35] and Zhu [9,50] et al. The limiting factor in the adsorption process was further studied by using the intraparticle diffusion model and the results are shown in Figure 7b and Table 3. As shown in Figure 7b, the adsorption process is divided into two parts: the first stage is the fast diffusion process on the surface and the second stage is the slow diffusion process inside the particle [17]. The two stages have the following relationship: k41 > k42, which is because the adsorption sites on HCO–(Fe3O4)x decrease with the increase in reaction time [17,30]. Meanwhile, the value of k42 becomes lower, which also reflects the decrease of the diffusion rate and the equilibrium of chemical adsorption. Moreover, the larger the liquid film thickness constant ai, the greater the boundary layer effect of the diffusion process [17,30].
3.8. Adsorption Mechanism
3.8.1. Apparent Morphological Analysis of the Sample
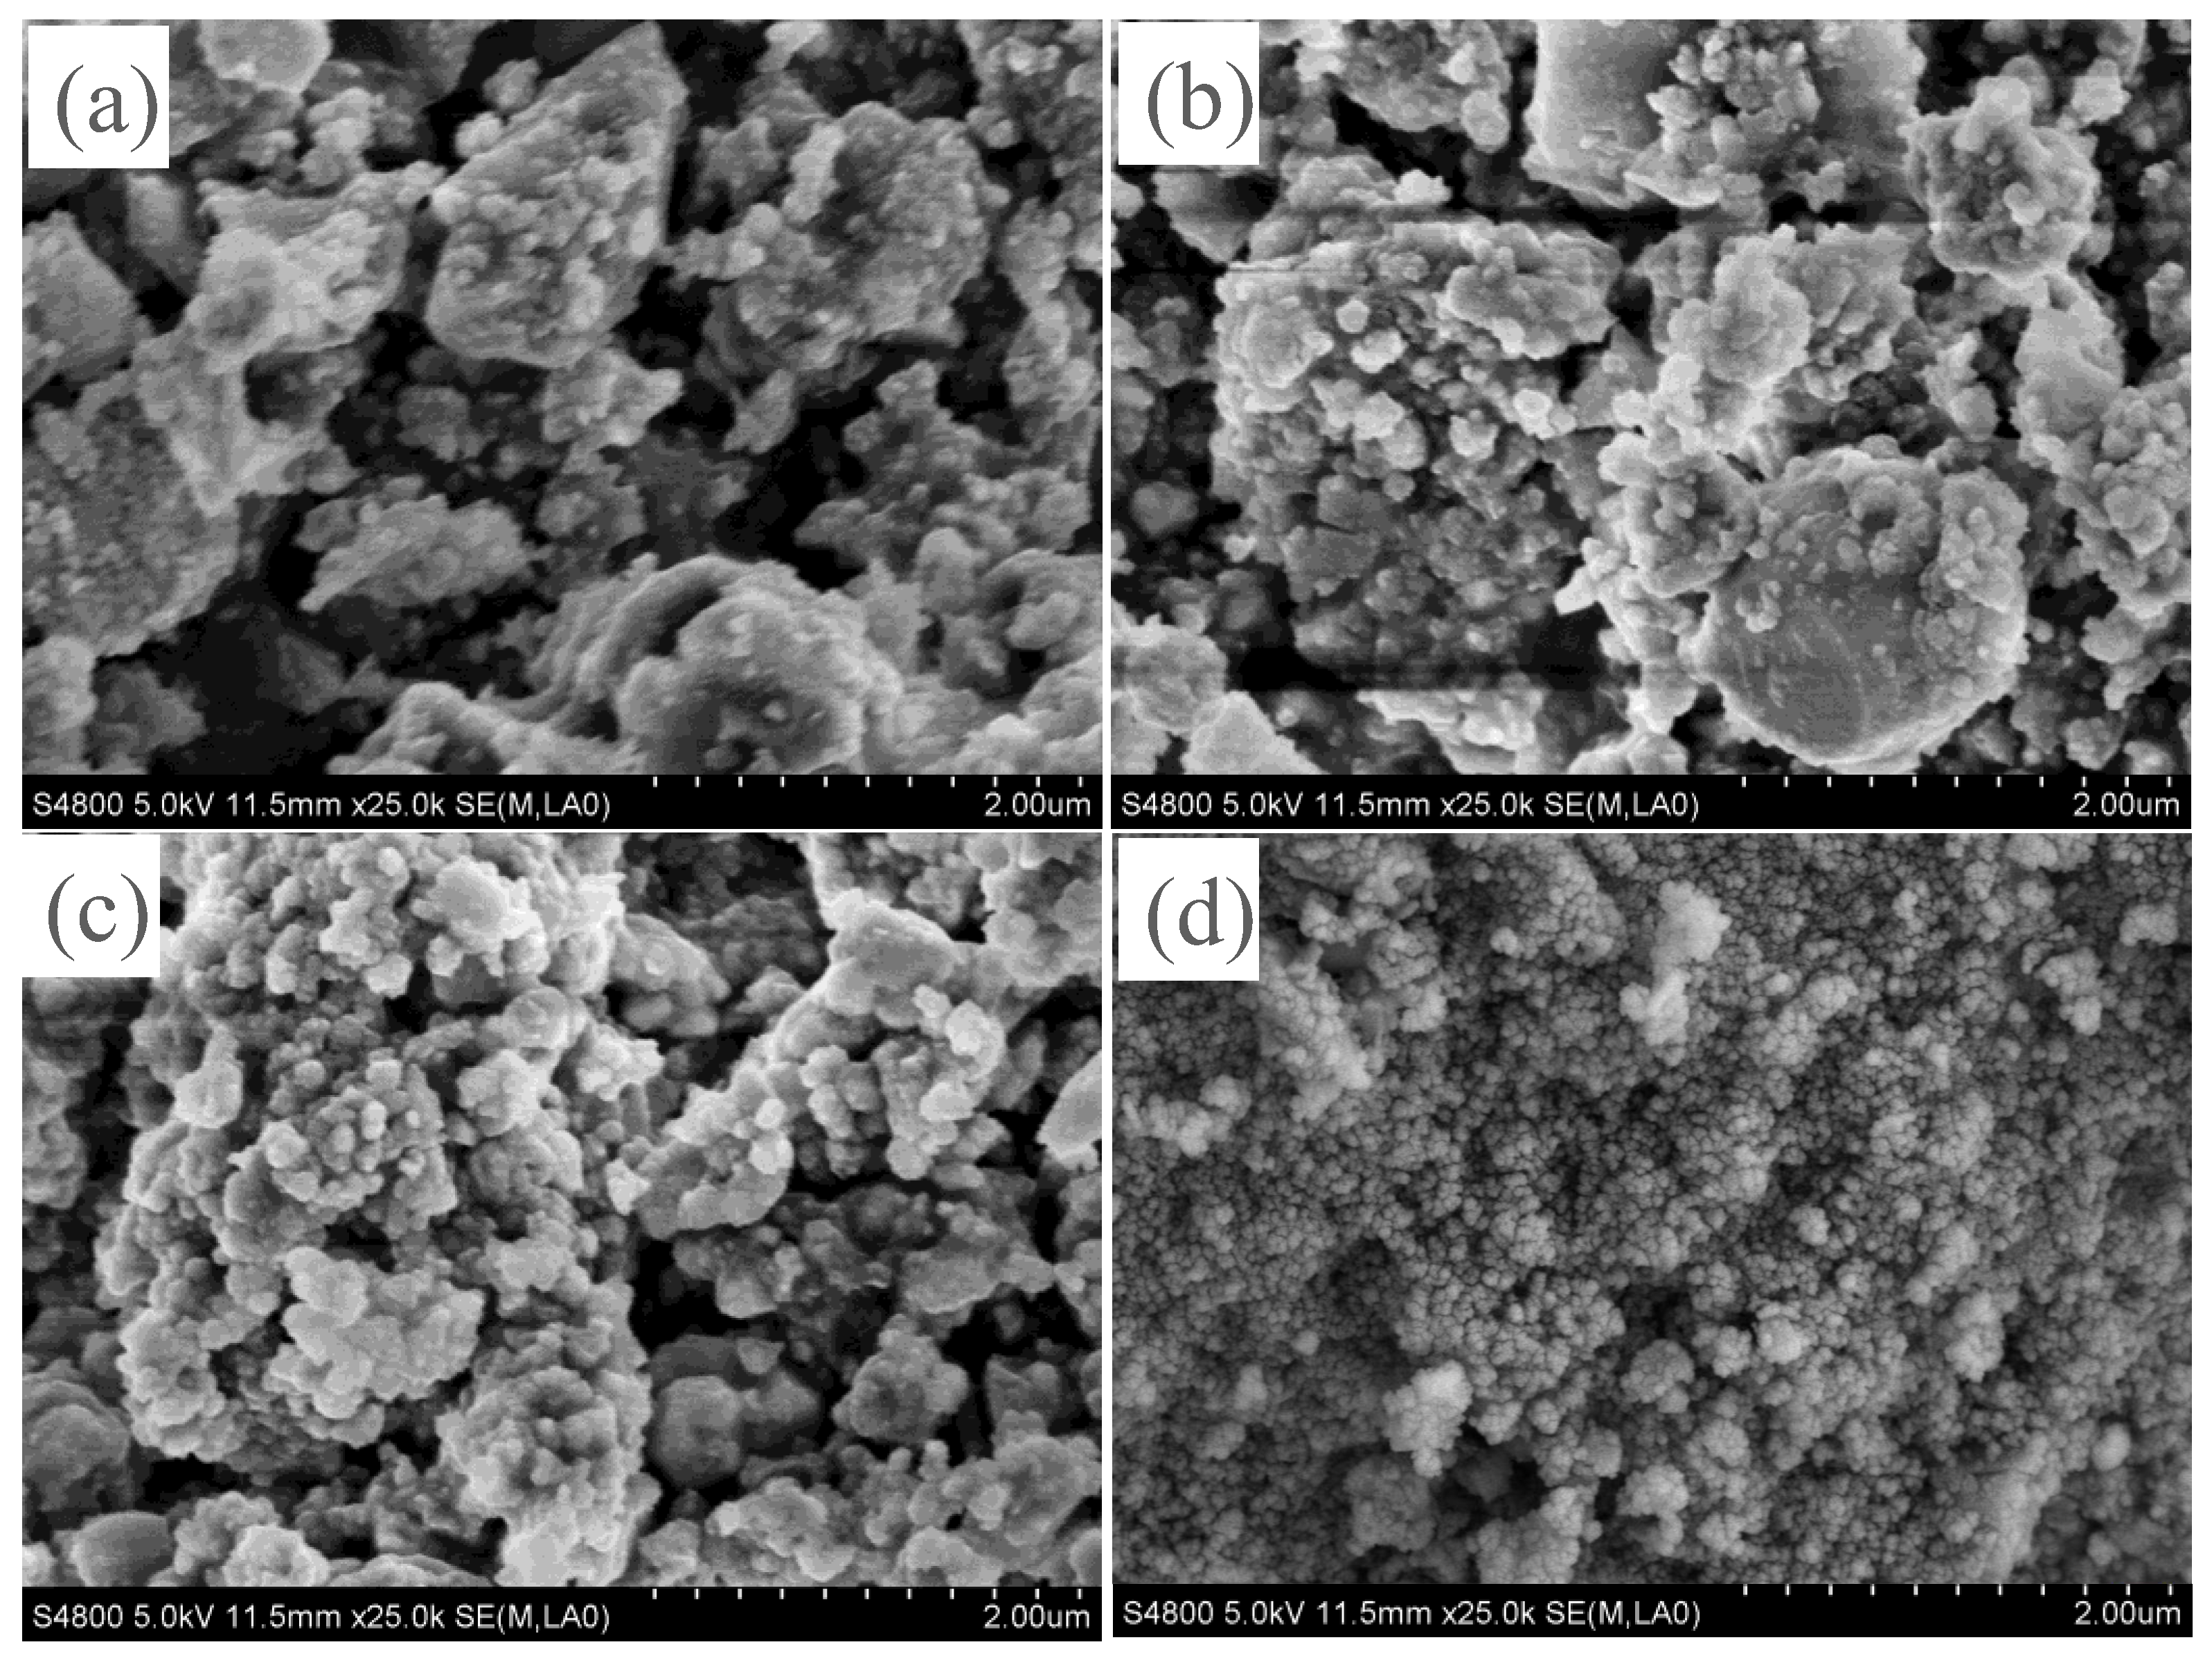
The SEM was used to characterize the morphological structure of HCO–(Fe3O4)x before and after the adsorption of Pb(II) (Figure 8).The surface of the unmodified treated polished sludge was relatively smooth and demonstrated large porosity [28,36,51] (Figure 8a), whereas the HCO–(Fe3O4)x prepared with different Ce/Fe moles had a rough surface and showed many very small pores (Figure 8b,c) with a significantly higher specific surface area (Appendix A, Table A1). At the same time, irregular spherical particles appeared on the surface of the adsorbent and, possibly, amorphous iron oxide crystals such as FeCe2O4, FeOOH, Fe3O4, and Fe2O3 [30,39,52]. This provides a large number of active sites for the adsorptive removal of Pb(II). Figure 8c shows an increase in surface spherical particles and roughness compared to Figure 8b, indicating that the prepared HCO–(Fe3O4)x composite adsorbent increases in specific surface area with the increase in Ce/Fe molar ratio, which facilitates the adsorption and removal of Pb(II) [53]. After the adsorption of Pb(II) by HCO–(Fe3O4)x (Figure 8d), a large number of smaller particles were added around HCO–(Fe3O4)x and the porosity was obviously reduced, which indicates that Pb(II) occupied the active sites on the adsorbent surface.
3.8.2. EDS Energy Spectra of HCO–(Fe3O4)x before and after Adsorption
The chemical elements in the polished sludge and HCO–(Fe3O4)x were analyzed by EDS, resulting in Table 4. The elements and their contents, before and after the adsorption of HCO–(Fe3O4)x, can be seen in Table 3. The main components in the polished sludge were Ce ((31.92 ± 1.65) %) and O ((27.26 ± 1.34)%). HCO–(Fe3O4)x is mainly composed of Ce ((38.47 ± 1.87)%), O ((29.95 ± 2.34)%), and Fe ((26.14 ± 2.41)%), in that order. Before adsorption, the content of elemental Pb in HCO–(Fe3O4)x was (0.21 ± 0.02)%, which was found to be due to the small amount of elemental Pb in the HCO polished sludge. After adsorption, the content of Pb increased to (3.74 ± 0.94)%, further confirming the feasibility of Pb adsorption by HCO–(Fe3O4)x. In addition, the content of Fe changed from (26.14 ± 2.41)% to (22.8 ± 1.67)% and Ce from (38.47 ± 1.87)% to (36.32 ± 1.79)% after adsorption, probably due to the hydrolysis of Fe and Ce, resulting in a decrease in their content, while other elements also showed slight changes of varying degrees.
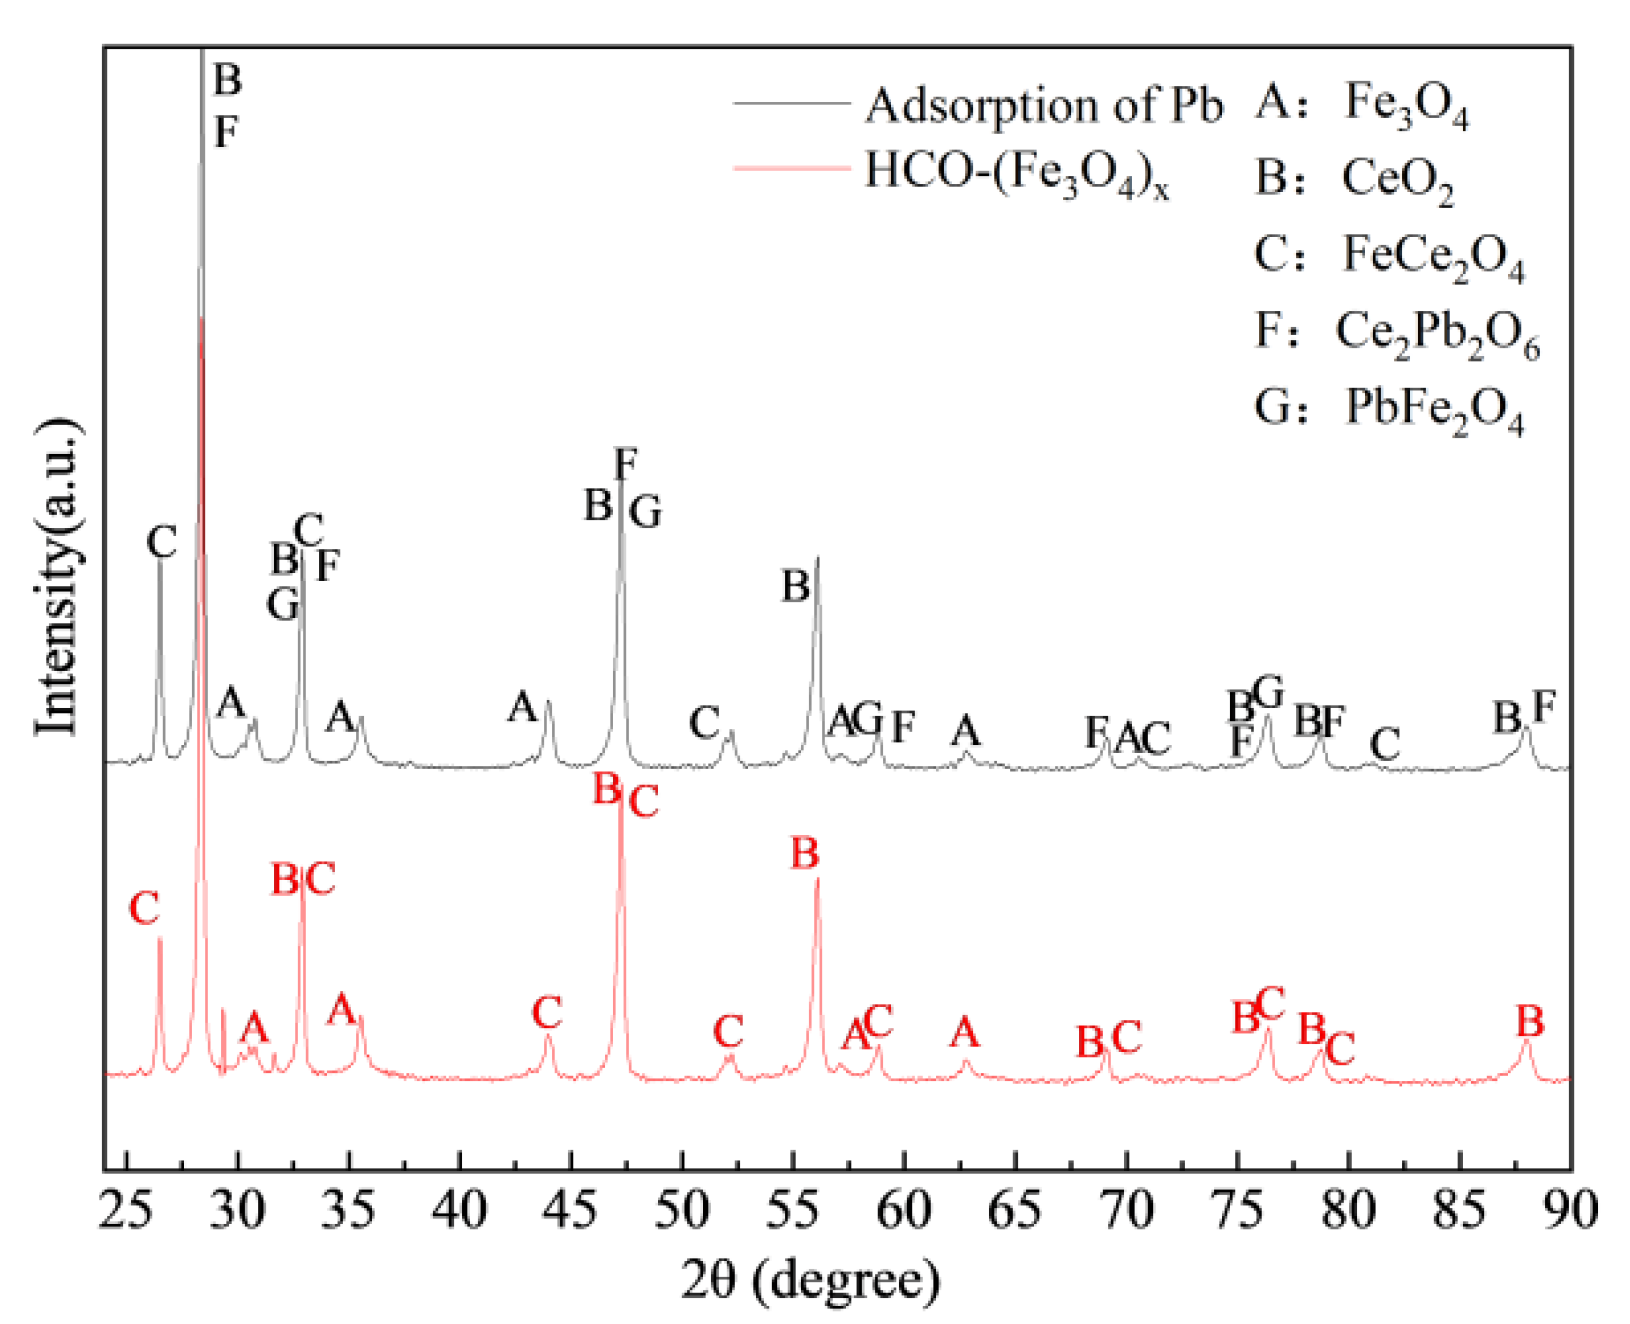
3.8.3. X-ray Diffraction Analysis
The XRD technique was used to characterize the physical phases of the HCO sludge and the HCO–(Fe3O4)x composite adsorbent (Figure 9). From the diffraction pattern, it can be observed that the HCO polished sludge has 9 major peaks, at 28.50°, 33.03°, 47.46°, 56.32°, 59.07°, 69.42°, 76.71°, 79.11°, and 88.8° [30]. However, in the HCO–(Fe3O4)x composite adsorbent, the diffraction intensity peaks are all diminished and shifted in position, indicating that the doping of Fe3O4 alters the crystal structure of cerium squared in favor of the adsorption of heavy metals [40,54]. It can be assumed from the JADE software analysis that HCO–(Fe3O4)x underwent a complex reaction between Fe3O4 and CeO2 in HCO during the preparation process (Equation (12)) which, in turn, produced FeCe2O4 compounds that contributed to the adsorption of Pb(II) [55].
Fe3O4 + CeO2.nH2O + OH− → FeCe2O4 + H2O
3.8.4. HCO–(Fe3O4)x before and after Adsorption of XPS Analysis
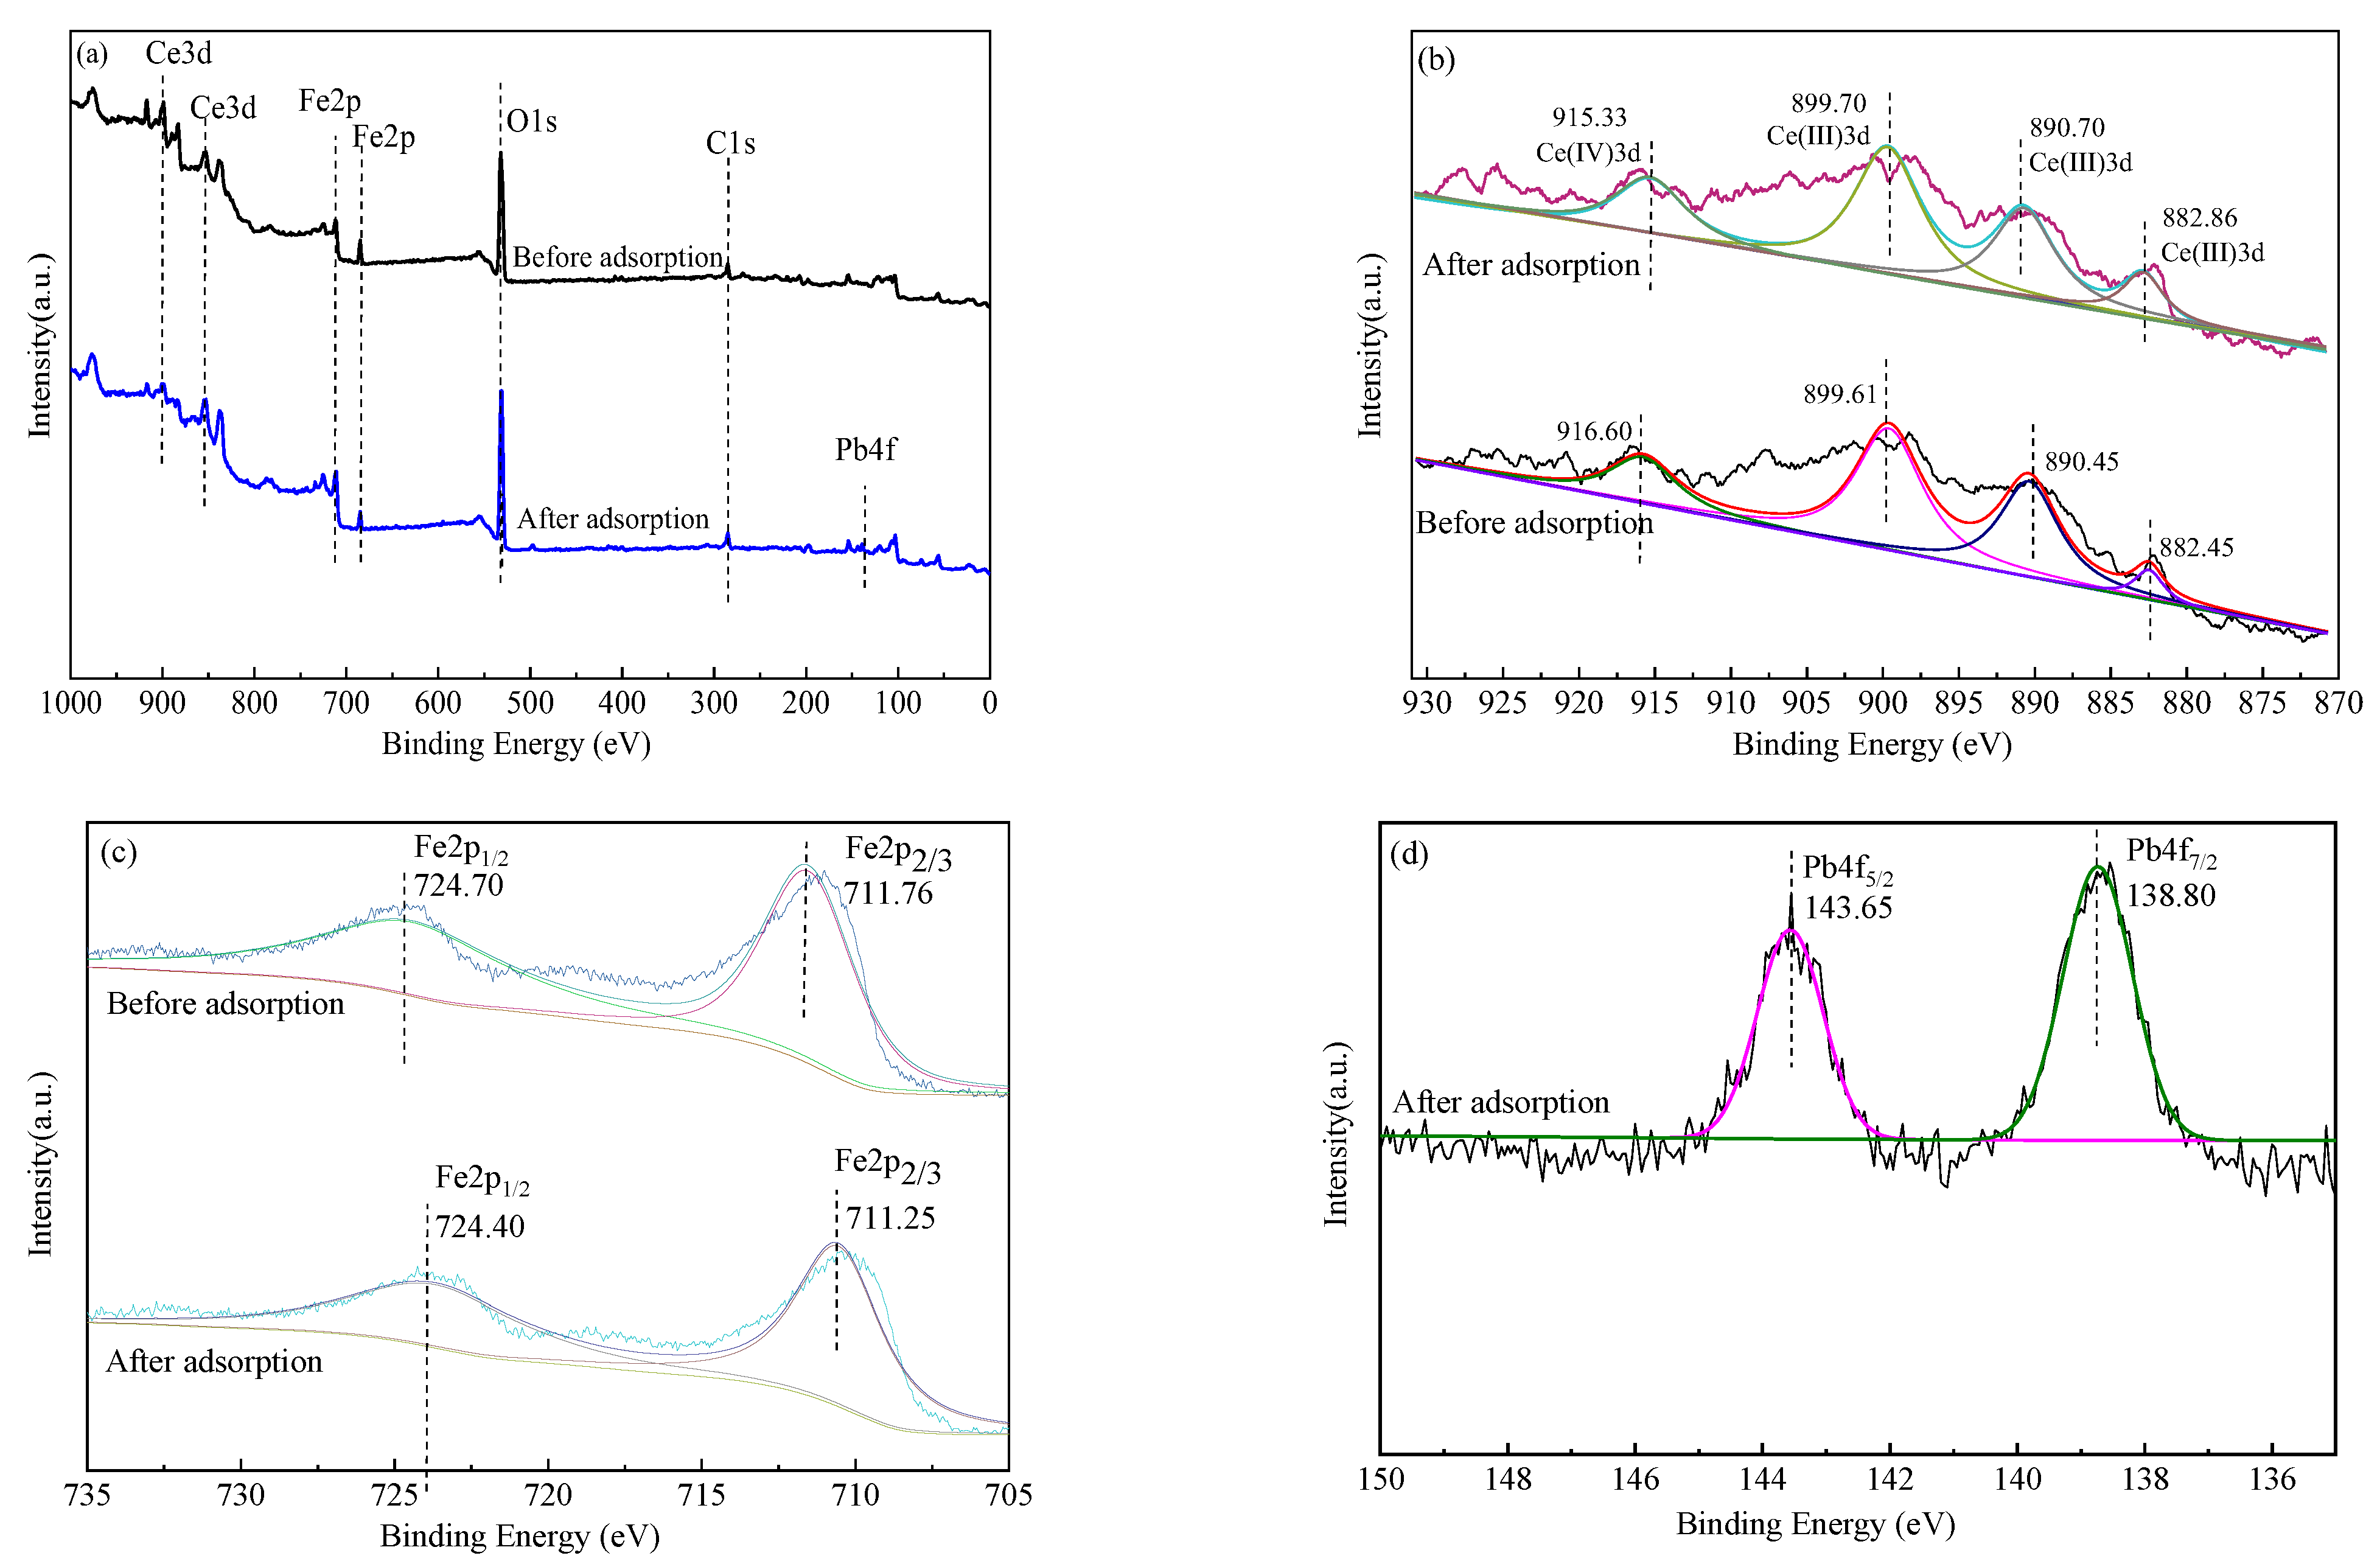
To further clarify the underlying mechanism of the removal process, XPS analysis was also used to detect the change of the functional groups involved in heavy metal binding (Figure 10). As shown in the full scan (Figure 10a), the main components of the HCO–(Fe3O4)x composite adsorbent were O, Ce and Fe, which were consistent with the EDS analysis (Table 3). A new Pb(4f) peak clearly exists after adsorption, which indicates that Pb(II) is adsorbed on the HCO–(Fe3O4)x [56]. As shown in Figure 10b, four characteristic peaks of the Ce 3d spectrum appeared at 882.45, 890.45, 899.61, and 916.60 eV. Related studies concluded that 882.40, 890.40, and 900.00 eV are Ce3+ diffraction peaks [39] and 916.60 eV are Ce4+ diffraction peaks [54], indicating the coexistence of two valence states of Ce3+ and Ce4+ in HCO–(Fe3O4)x [30,32,35]. Moreover, Ce3+ and Ce4+ ions can be hydrolyzed to carry hydroxyl groups, which is beneficial for the adsorption of Pb(II). Before reaction, characteristic peaks of Fe 2p3/2 appeared at 711.25 (Figure 10c), corresponding to the –OOH functional group (FeOOH and Fe3O4) [39], and characteristic peaks of Fe 2p1/2 appeared at 724.40 (Figure 10c), corresponding to Fe2O3 [39].Therefore, it is inferred that Fe in HCO–(Fe3O4)x mainly exists in three forms: FeOOH, Fe3O4, and Fe2O3 [30,32,35,39], all of which are beneficial for the adsorption of Pb(II). After reaction, the peak area percentage of Fe2+ and Fe3+ were nearly unchanged providing strong support for a removal mechanism involving complexation without oxidation of Pb(II) [17]. Furthermore, as shown in Figure 10d, two characteristic peaks of the Pb 4 f spectrum appeared at 138.76 and 143.60 eV, both of these are diffraction peaks of Pb(II) [17,48]. Therefore, there was no redox reaction of Pb(II) during the adsorption process.
3.8.5. Infrared Spectroscopy of HCO–(Fe3O4)x before and after Adsorption
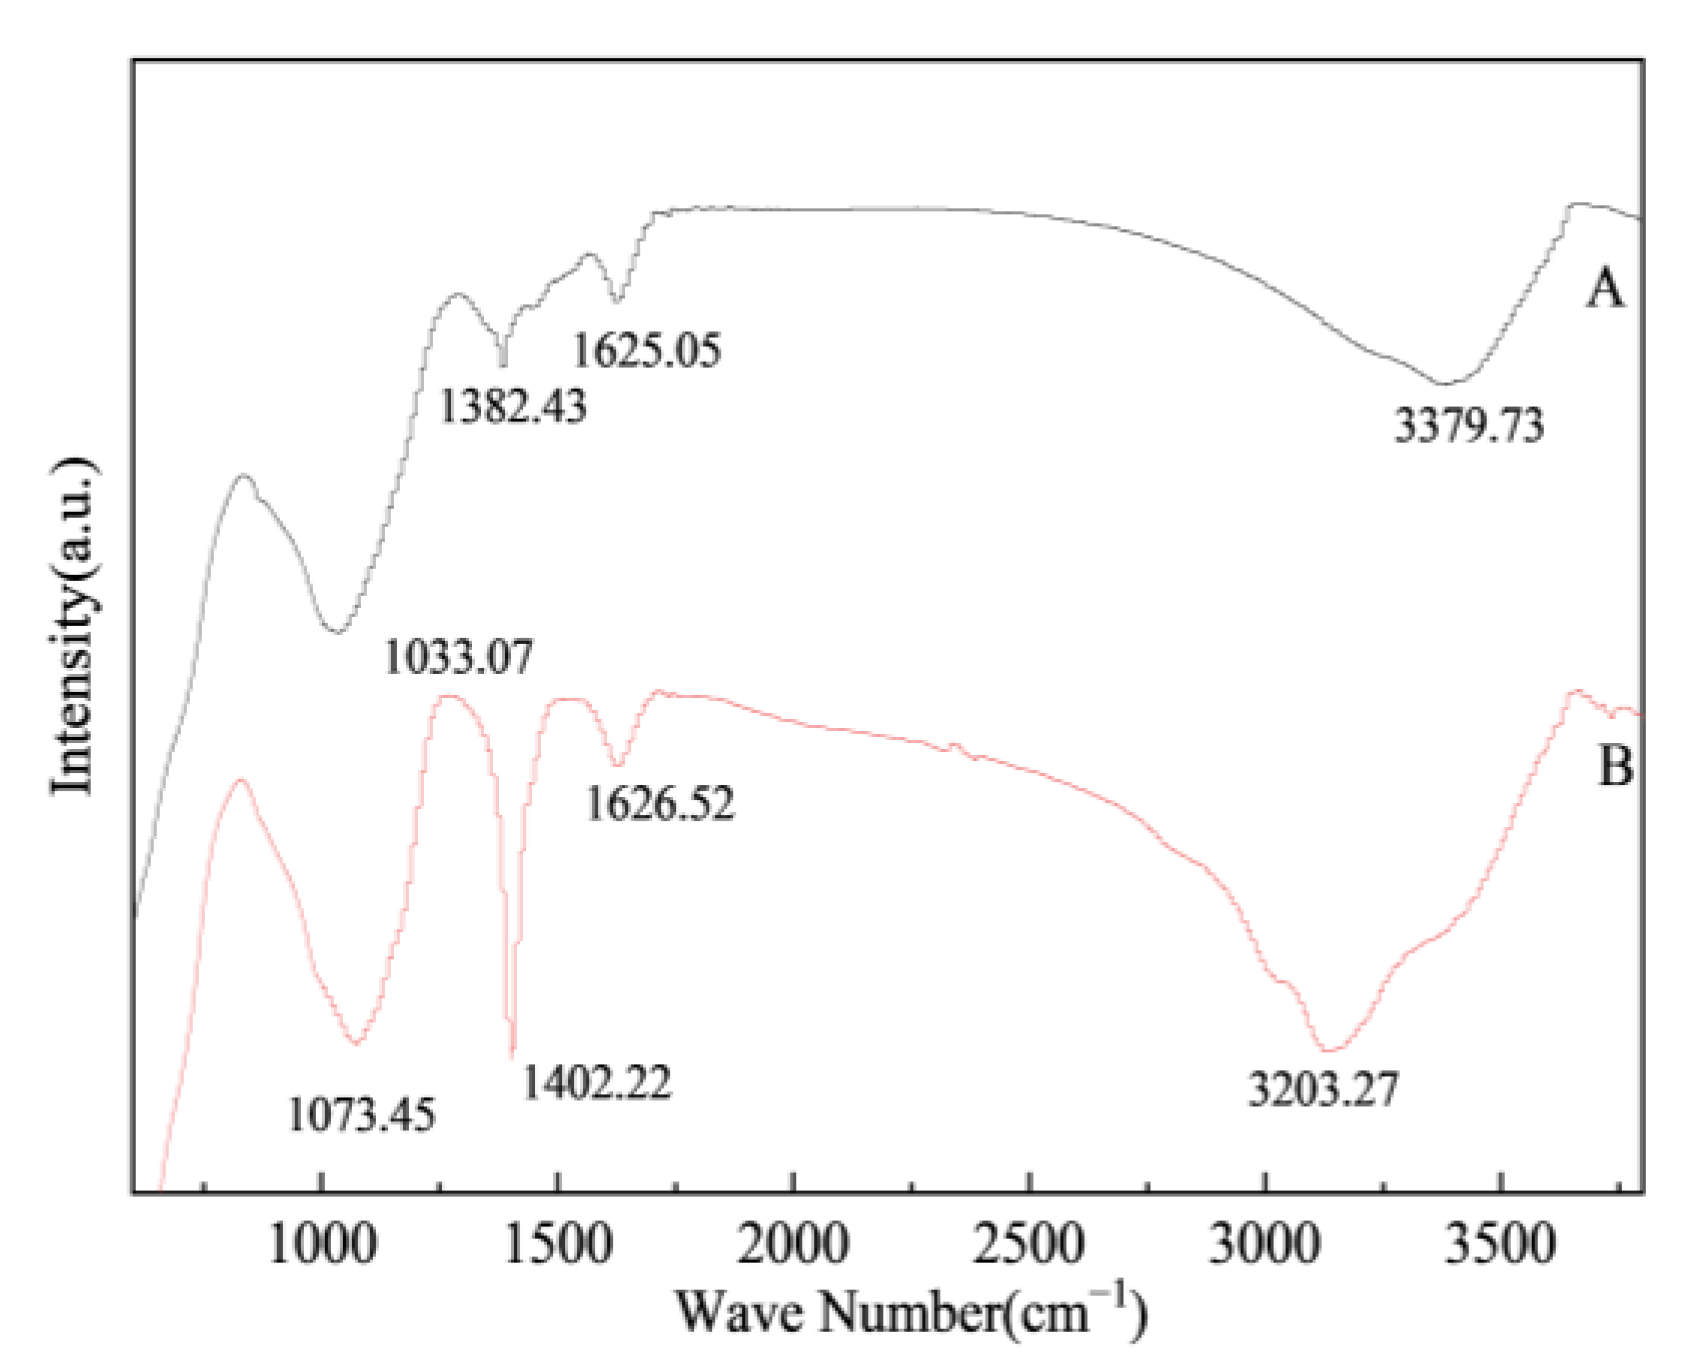
The results of the infrared spectra (FTIR) analysis before and after the adsorption of Pb(II) by HCO–(Fe3O4)x are presented in Figure 11. As shown in Figure 11, multiple characteristic peaks of HCO–(Fe3O4)x changed and shifted before and after the adsorption of Pb(II). The bending vibration absorption peak of 3400~3200 cm−1 represents the overlapping region of the telescopic vibration absorption peaks of N-H and O-H [41], which moved from 3203 cm−1 to 3379 cm−1 after the adsorption of Pb(II), indicating that N-H and O-H in HCO–(Fe3O4)x played a key role in the adsorption of Pb(II) [42]. The absorption peak at 1680–1620 cm−1 is a C=C double bond stretching vibration peak [57], which did not change significantly after the adsorption of Pb(II), implying that the C=C bond is less likely to play a role in the adsorption process. After the adsorption of Pb(II) by HCO–(Fe3O4)x, the C=O stretching vibration peak as well as the skeletal vibration peak of the C-C bond [58] shifted from 1402 cm−1 to 1382 cm−1, implying that the C=O bond and the C-C single bond played an important role in the adsorption of Pb(II), as other studies have shown [58]. The C-O bond vibration peak at 1200–1000 cm−1 shifted sharply from 1073 cm−1 to 1033 cm−1 after the adsorption of Pb(II), indicating that the peak plays a larger role in the adsorption of Pb(II). In summary, the presence of functional groups such as -COOH, -OH, C-C and N-H on the surface of HCO–(Fe3O4)x forms the main active site for the adsorption of Pb(II), and these active sites are involved in the Pb(II) adsorption process through ligand exchange and complexation [52], which is consistent with the findings by Yan et al. [57].
The above analysis points to the conclusion that the main mechanism for the adsorption of Pb(II) by HCO–(Fe3O4)x is the following:
- (1)
- Adsorption kinetics and isotherm model analysis indicated that monolayer homogeneous adsorption and intraparticle diffusion played dominant roles in the removal of Pb(II) by HCO–(Fe3O4)x [17]. In addition, some studies in the literature reported that the kinetic process of antimony adsorption by iron matrix adsorbents can be fitted with a variety of models, and it is hypothesized that there are different adsorption pathways for Pb(II) adsorption by HCO–(Fe3O4)x [26,30,32]. The Freundlich model can better describe the adsorption of Pb(II) by HCO–(Fe3O4)x, in comparison to the Langmuir model, implying that the adsorption process is mainly multilayer adsorption in a nonhomogeneous system [45]. In addition, the coefficient Kf increases gradually with increasing temperature, indicating that the process is heat absorption. Furthermore, HCO–(Fe3O4)x has a large specific surface area, which provides more adsorption sites and facilitates the removal of Pb(II) by adsorption.
- (2)
- Based on research findings from the literature [17,30,59], ligand exchange and complexation reactions may play a key role in the adsorption process; this possibility requires further investigation. HCO–(Fe3O4)x synthesis was prepared with the doping of Fe3O4 to produce the FeCe2O4 compound [35], which carries a more negative charge than polished sludge (Figure 2b). When HCO–(Fe3O4)x adsorbs Pb(II), FeCe2O4 first undergoes electron transfer with water molecules during hydrolysis to form a two-electron layer structure and generates, in situ, an amorphous hydrated iron oxide, X≡Fe-OH, with a high specific surface area. Then, the iron oxide film generates a PbFe2O4 precipitate through a ligand exchange reaction (Equation (13)), which results in the removal of Pb(II). At the same time, Pb is mainly present in the valence state of Pb(II) under experimental conditions, and it can be complexed with Ce2O3 to form Ce2Pb2O6 (Equation (14)), thus enhancing the adsorption removal of Pb(II). In addition, when pH values are over 7, Pb(II) is removed by precipitation with OH- in solution (Equation (15)):
H+ + FeOOH + Pb2+ → PbFe2O4 + H2O
Ce2O3 + Pb2+ → Ce2Pb2O6
Pb2+ + OH− → Pb(OH)2
In conclusion, the mechanism of Pb(II) adsorption by HCO–(Fe3O4)x mainly includes chemical reactions such as ligand exchange reaction, complexation reaction, and precipitation reaction on the surface of the adsorbent.
4. Conclusions
In this study, HCO–(Fe3O4)x composite adsorbent prepared from cerium-rich grinding and polishing sludge was effective for the treatment of water containing Pb, and the following conclusions were obtained: ① the HCO–(Fe3O4)x was prepared by a coprecipitation method using HCO and Fe3O4. The adsorption effect of Pb (II) onto HCO–(Fe3O4)x is influenced by the Ce/Fe molar ratio, and the optimal adsorption occurs with a Ce/Fe molar ratio of 1.5:1. ② The initial pH of the solution has a significant impact on the adsorption of Pb(II) by HCO–(Fe3O4)x, and the most suitable pH is 4–5. ③ The maximum adsorption amount of Pb(II) by HCO–(Fe3O4)x at optimal adsorption conditions was 35.93 mg·g−1. ④ Coexisting anions affect the sorptive removal of Pb(II) through competitive interactions, promotion, and complexation. PO32− and SO42− promote the adsorption of Pb(II), while Cl− and SiO32− have an inhibitory effect. ⑤ The adsorption of Pb(II) by HCO–(Fe3O4)x is controlled by chemical reactions, and its adsorption mechanism mainly involves ligand exchange reactions with amorphous hydrated iron oxides X≡Fe–OH and complexation reactions with CeO2 or Ce2O3, thus removing the Pb. To conclude, HCO–(Fe3O4)x has a large adsorption capacity and a fast adsorption rate for Pb(II), reflecting better prospects for future application.
Author Contributions
J.L., Z.H. and R.D. further analyzed the data and wrote the manuscript. J.L. and Z.H. assessed the data, study implications and manuscript preparation. Y.C. performed the laboratory experiments. R.D. conceived the idea for the study and provided funding. Y.C. recorded experimental data and performed preliminary analyses. All authors have read and agreed to the published version of the manuscript.
Funding
This study was financially supported by the National Natural Science Foundation of China Hunan Province (2022JJ30248, 2021JJ30243), the National Natural Science Foundation of China (41672350, 41973078), the Environmental Protection Research Project of China Hunan Province (HBKT-2022012), and the Key R&D Plan of Hunan Province (2022SK2073).
Data Availability Statement
All data generated or analyzed during this study are included in the manuscript.
Conflicts of Interest
The authors declare no conflict of interest.
Appendix A

Table A1.
Characterization parameters of the different HCO-(Fe3O4)x adsorbents.
| Parameters | Ce/Fe/(mol·mol−1) | |||
|---|---|---|---|---|
| 1:0 (Polishing Sludge) | 1:2 | 1:1 | 1.5:1 | |
| O (wt%) | 27.26 | 17.28 | 26.51 | 26.15 |
| Ce (wt%) | 31.92 | 13.85 | 23.09 | 27.64 |
| Fe (wt%) | - | 45.49 | 20.22 | 16.07 |
| SBET (m2/g) | 29.63 | 104.64 | 105.12 | 108.57 |
| Vtot (cm3/g) | 0.109 | 0.115 | 0.123 | 0.214 |
References
- Zhang, Y.; Gu, A.H. Advances on damage and mechanisms of Cd, Pb, and Hg to blood vessels. J. Occup. Environ. Med. 2020, 37, 727–733. [Google Scholar]
- Tang, Z.E.; Deng, R.J.; Zhang, J.; Ren, B.Z. Regional distribution characteristics and ecological risk assessment of heavy metal pollution of different land use in an antimony mining area—Xikuangshan, China. Hum. Ecol. Risk Assess. 2020, 26, 1779–1794. [Google Scholar] [CrossRef]
- Teng, D.Q.; Cui, Z.A.; Yuan, X.J.; Zhang, L. Distribution patterns and potential ecological risk evaluation of heavy metals in the surface sediments of Beibu Gulf. Geo. Sur. China 2020, 7, 79–85. [Google Scholar]
- Xie, Q.; Ren, B.Z.; Shi, X.Y.; Hursthouse, A. Factors on the distribution, migration, and leaching of potential toxic metals in the soil and risk assessment around the zinc smelter. Eco. Indic. 2022, 144, 109502. [Google Scholar] [CrossRef]
- Yu, H.; Xiang, Y.; Zou, D. The effect of Eulaliopsis binata on the physi-chemical properties, microbial biomass, and enzymatic activities in Cd-Pb polluted soil. Environ. Sci. Pollut. Res. 2016, 23, 19212–19218. [Google Scholar] [CrossRef]
- Xie, Q.; Ren, B.Z. Pollution and risk assessment of heavy metals in rivers in the antimony capital of Xikuangshan. Sci. Rep. 2022, 12, 14393. [Google Scholar] [CrossRef] [PubMed]
- Jiang, F.; Ren, B.Z.; Hursthouse, A.; Deng, R.J. Evaluating health risk indicators for PTE exposure in the food chain: Evidence from a thallium mine area. Environ. Sci. Pollut. Res. 2020, 27, 23686–23694. [Google Scholar] [CrossRef]
- Li, M.L.; Wen, L.L.; Wang, Z.H.; Han, L.; Sun, W.L. Variation of metal production, regional and industrial distributions of heavy metals discharge from industrial wastewaters of China and European Union. Acta Sci. Nat. Univ. Pekin. 2017, 53, 1053–1067. [Google Scholar]
- Zhu, J.B.; Zhao, J.B.; Zhou, S.P.; Wu, C.H.; Zhao, D. Study on adsorption performance and mechanism of peanut ShellBiochar for Pb2+ and Cd2+ in water. J. Sw. Forest. Univ. 2022, 42, 78–86. [Google Scholar]
- Zhang, Y.; Xiang, Y.B.; Chen, W.Y. Heavy metal content in the bark of camphora tree in Xiangtan and its environmental. Appl. Ecol. Environ. Res. 2019, 17, 9827–9835. [Google Scholar] [CrossRef]
- Zhang, Y.; Huang, F. Indicative significance of the magnetic susceptibility of substrate sludge to heavy metal pollution of urban lakes. Sci. Asia J. Sci. Soc. Thail. 2021, 47, 374. [Google Scholar] [CrossRef]
- Luo, X.; Ren, B.J.; Hursthouse, A.S.; Jiang, F.; Deng, R.J. Potentially toxic elements (PTEs) in crops, soil, and water near Xiangtan manganese mine, China: Potential risk to health in the foodchain. Environ. Geochem. Health 2020, 42, 1965–1976. [Google Scholar] [CrossRef]
- Shi, X.; Ren, B.J.; Hursthouse, A. Source identification and groundwater health risk assessment of PTEs in the stormwater runoff in an abandoned mining area. Environ. Geochem. Health 2022, 44, 3555–3570. [Google Scholar] [CrossRef]
- Luo, X.; Ren, B.J.; Hursthouse, A.S.; Thacker, J.R.M.; Wang, Z.H. Soil from an abandoned manganese mining area (Hunan, China): Significance of health risk from potentially toxic element pollution and its spatial context. Int. J. Environ. Res. Public Health 2020, 17, 6554. [Google Scholar] [CrossRef] [PubMed]
- Wang, Z.H.; Liao, L.N.; Hursthouse, A.; Song, N.; Ren, B.Z. Sepiolite-based adsorbents for the removal of potentially toxic elements from water a strategic review for the case of environmental contamination in Hunan, China. Int. J. Environ. Res. Public Health 2018, 8, 1653. [Google Scholar] [CrossRef]
- Xie, Q.; Ren, B.J.; Hursthouse, A.; Shi, X.Y. Effects of mining activities on the distribution, controlling factors, and sources of metals in soils from the Xikuangshan South Mine, Hunan Province. Integr. Environ. Assess. 2022, 18, 748–756. [Google Scholar] [CrossRef]
- Wang, H.; Wang, S.; Wang, S.; Fu, L.K.; Zhang, L.B. Efficient metal-organic framework adsorbents for removal of harmful heavy metal Pb(II) from solution: Activation energy and interaction mechanism. J. Environ. Chem. Eng. 2023, 11, 109335. [Google Scholar] [CrossRef]
- He, Z.; Ren, B.; Hursthouse, A.; Wang, Z.H. Efficient removal of Cd(II) using SiO2-Mg(OH)2 nanocomposites derived from sepiolite. Int. J. Env. Res. Public Health 2020, 17, 2223. [Google Scholar] [CrossRef]
- Li, Y.; Zeng, X.; Lin, Z.; Su, J.; Gao, T. Experimental study on phosphate rock modified soil-bentonite as a cut-off wall material. Water Sci. Technol.-Water Supply 2022, 22, 1676–1690. [Google Scholar] [CrossRef]
- Gui, Y.X.; He, X.D.; Qiu, H.J.; Wu, C.H.; Gao, L. Removal of lead from zinc electrodeposition solution with ammonia and morphology of zinc cathode. Hydrometall. China 2022, 41, 471–475. [Google Scholar]
- Li, X.; Yang, Y.C.; Li, X.Z.; Wang, J. Application of CO2 and biological synergistic treatment oflead-zinc mineral processing wastewater. Ind. Water Treat. 2022, 42, 174–177. [Google Scholar]
- Li, M.; Xing, W.M. Progress of biological treatment of heavy metal pollution in water bodies. Agric. Henan 2017, 12, 59–61. [Google Scholar]
- Nemati, M.; Hosseini, S.M.; Shabanian, M. Novel electrodialysis cation exchange membrane prepared by 2-acrylamido-2-methylpropane sulfonic acid; heavy metal ions removal. J. Hazard. Mater. 2017, 337, 90–104. [Google Scholar] [CrossRef] [PubMed]
- Hou, B.L.; Deng, R.J.; Zhuang, H.F.; Yang, Y.B. Advanced treatment of coal chemical industry wastewater by electro-catalysis with Gd-Doped Ti/SnO2 anode. Pol. J. Environ. Stud. 2017, 26, 1097–1104. [Google Scholar] [CrossRef]
- Liang, H.; Chai, K.; Shen, F.; He, H.B.; He, G. Methylthiazole Schiff base functionalized SBA-15 for high-performance Pb(Ⅱ) capture and separation. Micropor. Mesopor. Mater. 2023, 351, 112476. [Google Scholar] [CrossRef]
- Deng, R.J.; Jin, C.S.; Ren, B.Z.; Hou, B.L.; Hursthouse, A.S. The potential for the treatment of antimony-containing wastewater by iron-based adsorbents. Water 2017, 9, 794. [Google Scholar] [CrossRef]
- Gu, B.; Du, Y.; Fang, S.; Chen, X.; Li, X.B.; Xu, Q.Y.; Lu, H. Fabrication of UV-stable perovskite solar cells with compact Fe2O3 electron transport layer by FeCl3 solution and Fe3O4 nanoparticles. Nanomaterials 2022, 12, 4415. [Google Scholar] [CrossRef]
- Serga, V.; Burve, R.; Maiorov, M.; Krumina, A.; Skaudžius, R.; Zarkov, A.; Kareiva, A.; Popov, A. Impact of gadolinium on the structure and magnetic properties of nanocrystalline powders of iron oxides produced by the extraction-pyrolytic method. Materials 2020, 13, 4147. [Google Scholar] [CrossRef] [PubMed]
- Su, G.; Liu, L.; Zhang, L.; L, X.; Xue, J. Fabrication of magnetic Fe3O4@SiO2@Bi2O2CO2/rGO composite for enhancing its photocatalytic performance for organic dyes and recyclability. Environ. Sci. Pollut. Res. Int. 2021, 28, 50286–50301. [Google Scholar] [CrossRef]
- Zhang, J.; Deng, R.J.; Ren, B.Z.; Hou, B.; Hursthouse, A. Preparation of a novel Fe3O4/HCO composite adsorbent and the mechanism for the removal of antimony (III) from aqueous solution. Sci. Rep. 2019, 9, 13021. [Google Scholar] [CrossRef]
- Liu, L.; Liu, J.; Zhao, L.; Yang, Z.; Lv, C. Synthesis and characterization of magnetic Fe3O4@CaSiO3 composites and evaluation of their adsorption characteristics for heavy metal ions. Environ. Sci. Pollut. Res. 2019, 26, 8721–8736. [Google Scholar] [CrossRef] [PubMed]
- Zhang, J.; Deng, R.J.; Ren, B.Z.; Yaseen, M.; Hursthouse, A. Enhancing the removal of Sb (III) from water Fe3O4@HCO composite adsorbent caged in sodium. Prog. Chem. Org. Nat. Prod. 2020, 44, r8010044. [Google Scholar] [CrossRef]
- Deng, R.J.; Shao, R.; Ren, B.Z.; Hou, B.L.; Tang, Z.E.; Hursthouse, A.S. Adsorption of Antimony(III) onto Fe(III)-Treated Humus Sludge Adsorbent: Behavior and Mechanism Insights. Pol. J. Environ. Stud. 2018, 28, 577–586. [Google Scholar] [CrossRef] [PubMed]
- Qiao, Z.Y.; Li, C.Z.; Zhou, Z.; Yan, P.L.; Wei, T.; Hua, Y.J.; Li, Y.L.; Sui, H.S. Advances in the study of lead toxicity hazards and its therapeutic drug applications. J. Toxicol. 2020, 34, 416–420. [Google Scholar]
- Deng, R.J.; Chen, Y.L.; Zhang, J.; Ren, B.Z.; Zhou, S.J. Difference and mechanism of Sb(III) and Sb(V) adsorption and removal by HCO-(Fe3O4)x. Chin. J. Nonferrous Met. 2022, 32, 1430–1443. [Google Scholar]
- Yu, J.F.; Zhang, X.Z.; Jin, B.S.; Chen, J.X.; Huang, Y.J. Silica aluminum xerogel-based sorbent for removal of volatilized PbCl2 during the incineration: Improvement on mass-transfer limitations via high porosity. Sci. Total Environ. 2021, 782, 146925. [Google Scholar] [CrossRef]
- Li, Y.C.; Xu, Z.; Ma, H.Q.; Hursthouse, A.S. Removal of manganese(II) from acid mine wastewater: A review of the challenges and opportunities with special emphasis on mn-oxidizing bacteria and microalgae. Water 2019, 11, 2493. [Google Scholar] [CrossRef]
- Liu, T.; Chen, Z.S.; Li, Z.X.; Fu, H.; Chen, G.L. Preparation of magnetic hydrochar derived from iron-rich Phytolacca acinosa Roxb. for Cd removal. Sci. Total Environ. 2021, 769, 145159. [Google Scholar] [CrossRef] [PubMed]
- Qi, Z.L.; Joshi, T.P.; Liu, R.P.; Liu, H.J.; Qu, Z.H. Synthesis of Ce(III)-doped Fe3O4 magnetic particles for efficient removal of antimony from aqueous solution. J. Hazard. Mater. 2017, 329, 193–204. [Google Scholar] [CrossRef] [PubMed]
- Shukla, A.; Zhang, Y.H.; Dubey, P.; Margrave, J.L.; Shukla, S.S. The role of sawdust in the removal of unwanted materials from water. J. Hazard. Mater. 2002, 95, 137–152. [Google Scholar] [CrossRef]
- Li, W. Study on Adsorption of Heavy Metals onto Fe-Modified Aerobic Granular Sludge in Antimony-Containing Wastewater. Ph.D. Thesis, Fudan University, Shanghai, China, 2014. [Google Scholar]
- Xu, H.; Liu, Y. Mechanisms of Cd2+, Cu2+ and Ni2+ biosorption by aerobic granules. Sep. Purif. Technol. 2008, 58, 400–411. [Google Scholar] [CrossRef]
- Wang, Z.W.; Wang, H.C.; Yang, J.B.; Liu, X.P.; Yue, R.R. Research status of adsorption method for removing heavy metal composite pollutants in water. Chin. J. Rare Met. 2020, 44, 87–99. [Google Scholar]
- Zeng, S.Y.; Li, K.Q. Preparation of narrow pore diameter phosphorus containing cotton stalk carbon and its adsorption mechanism for tetracycline. Environ. Sci. 2023, 44, 1519–1527. [Google Scholar]
- Zhao, X.; Zhang, L.H.; Wang, Y.; Zhou, M.Y.; Cheng, X.R.; Yang, H.R. Preparation of Fe-Mn-Ce-SA adsorbent and Pb2+ removal from aqueous solutions. J. Xi’an Poly. Univ. 2021, 35, 17–23. [Google Scholar]
- Zuo, G.Q.; Su, X.L.; Liu, G.Y.; Song, X.Y.; Zhang, L.L. Absorption removal of Pb2+ from wastewater by nanoscaled zero-valent iron particles. Chem. Reag. 2022, 44, 828–834. [Google Scholar]
- He, F.; Ma, B.Z.; Wang, C.Y.; Chen, Y.Q.; Hu, X.J. Adsorption of Pb(II) and Cd(II) hydrates via inexpensive limonitic laterite: Adsorption characteristics and mechanisms. Sep. Purif. Technol. 2023, 310, 123234. [Google Scholar] [CrossRef]
- Yang, L.; Jin, X.Y.; Lin, Q.; Gary, O.; Chen, Z.L. Enhanced adsorption and reduction of Pb(II) and Zn(II) from mining wastewater by carbon@nano-zero-valent iron (C@nZVI) derived from biosynthesis. Sep. Purif. Technol. 2023, 311, 123249. [Google Scholar] [CrossRef]
- Yang, Z.; Liu, L.; Zhao, L.; Su, G.; Wei, Z.; Tang, A.; Xue, J. Preparation and evaluation of bis(diallyl alkyl tertiary ammonium salt) polymer as a promising adsorbent for phosphorus removal. J. Environ Sci. 2019, 86, 24–37. [Google Scholar] [CrossRef]
- Zhu, G.; Wang, C.; Liu, X.; Dong, X.; Zhang, P.; Yin, J.; Ren, B.; Wang, Z. Preparation and characterization of polymeric phosphate-aluminum sulphate for source water treatment. Water Suppl. 2016, 16, 1138–1148. [Google Scholar] [CrossRef]
- Li, M.L.; Zhao, Y.N.; Long, R.; Liu, Z.C.; Liu, W. Gradient porosity distribution of adsorbent bed for efficient adsorption cooling. Int. J. Refrig. 2021, 128, 153–162. [Google Scholar] [CrossRef]
- Deng, R.J.; Tang, Z.E.; Ren, B.Z.; Andrew, H. Optimization and mechanism of Sb(V) removal from aqueous solution by Fe(Ⅲ) modified proteus cibarius with response surface methodology. Res. Environ. Sci. 2020, 33, 2888–2897. [Google Scholar]
- He, M.C.; Wang, X.Q.; Wu, F.C.; Fu, Z.Y. Antimony pollution in China. Sci. Tot. Environ. 2012, 421–422, 41–50. [Google Scholar] [CrossRef]
- Wang, L.; Wang, J.Y.; Wang, Z.X.; Feng, J.T.; Li, S.S.; Yan, W. Synthesis of Ce-doped magnetic biochar for effective Sb(V) removal: Performance and mechanism. Powder Technol. 2019, 345, 501–508. [Google Scholar] [CrossRef]
- Zhang, D.; Hou, R.; Wang, W.; Zhao, H. Recovery and reuse of floc sludge for high-performance capacitors. J. Front. Environ. Sci. Eng. 2021, 16, 78. [Google Scholar] [CrossRef]
- Zhang, X.; Chen, J.; Han, J.; Zhang, G. Preparation, characterization and lead adsorption and removal of Fe3O4/MnO2 magnetic adsorbent with shell-core structure. Acta Sci. Circumstantiae 2013, 33, 2730–2736. [Google Scholar]
- Yan, S.Q.; Ruan, Z.Y.; Tian, Y.X.; Ruan, J.F.; Cui, C.J.; Iqbal, K.; Iqbal, A.; Ye, H.R.; Yang, Z.Z. Synthesis of hydroxyapatite/multi-walled carbon nanotubes for the removal of fluoride ions from solution. J. Appl. Surf. Sci. 2017, 412, 578–590. [Google Scholar]
- Zuo, G.Q.; Li, X.L.; Zhang, X.J.; Su, X.L.; Zhang, W.S. Adsorption of Pb2+ in Wastewater by Nanoscale Zero-valent lron Supported by Rabdosia Rubescens. Nonfer. Met. (Extr. Met.) 2022, 12, 115–123. [Google Scholar]
- Zhao, P.; Wang, A.; Wang, P.; Huang, Z.; Fu, Z.Y.; Huang, Z.B. Two recyclable and complementary adsorbents of coal-based and bio-based humic acids: High efficient adsorption and immobilization remediation for Pb(II) contaminated water and soil. Chemosphere 2023, 318, 137963. [Google Scholar] [CrossRef]
Figure 1.
Removal rates of HCO–(Fe3O4)x with different Ce/Fe molar ratios on Pb(II): initial concentration Pb(II) = 20 mg·L−1, adsorbent dosage = 2.0 g·L−1, pH = 5 ± 0.1, reaction time = 4.0 h.
Figure 1.
Removal rates of HCO–(Fe3O4)x with different Ce/Fe molar ratios on Pb(II): initial concentration Pb(II) = 20 mg·L−1, adsorbent dosage = 2.0 g·L−1, pH = 5 ± 0.1, reaction time = 4.0 h.

Figure 2.
The influence of pH on adsorption efficiency (a) and pHpzc (b): initial concentration Pb(II) = 20 mg·L−1, Ce:Fe molar ratio = 1.5:1, adsorbent dosage = 2.0 g·L−1, reaction time = 4.0 h.
Figure 2.
The influence of pH on adsorption efficiency (a) and pHpzc (b): initial concentration Pb(II) = 20 mg·L−1, Ce:Fe molar ratio = 1.5:1, adsorbent dosage = 2.0 g·L−1, reaction time = 4.0 h.

Figure 3.
Influence of adsorption time on adsorption of Pb(II): the initial concentration Pb(II) = 20 mg·L−1, Ce:Fe molar ratio = 1.5:1, adsorbent dosage = 2.0 g·L−1, reaction time = 4.0 h, pH = 5 ± 0.1.
Figure 3.
Influence of adsorption time on adsorption of Pb(II): the initial concentration Pb(II) = 20 mg·L−1, Ce:Fe molar ratio = 1.5:1, adsorbent dosage = 2.0 g·L−1, reaction time = 4.0 h, pH = 5 ± 0.1.

Figure 4.
Influence of coexisting anions on HCO–(Fe3O4)x adsorption of Pb(II): the initial concentration Pb(II) = 20 mg·L−1, Ce:Fe molar ratio = 1.5:1, adsorbent dosage = 2.0 g·L−1, reaction time = 4.0 h, pH = 5 ± 0.1.
Figure 4.
Influence of coexisting anions on HCO–(Fe3O4)x adsorption of Pb(II): the initial concentration Pb(II) = 20 mg·L−1, Ce:Fe molar ratio = 1.5:1, adsorbent dosage = 2.0 g·L−1, reaction time = 4.0 h, pH = 5 ± 0.1.

Figure 5.
Influence of number of adsorption/desorption cycles on HCO–(Fe3O4)x adsorption of Pb(II): (a) different eluents; (b) adsorption/desorptions by NaOH solution.
Figure 5.
Influence of number of adsorption/desorption cycles on HCO–(Fe3O4)x adsorption of Pb(II): (a) different eluents; (b) adsorption/desorptions by NaOH solution.

Figure 6.
Adsorption isothermal model of Pb(II) on HCO–(Fe3O4)x:(a) Langmuir and Freundlich model, (b) D–R model.
Figure 6.
Adsorption isothermal model of Pb(II) on HCO–(Fe3O4)x:(a) Langmuir and Freundlich model, (b) D–R model.

Figure 7.
Kinetic model of Pb(II) adsorption on HCO–(Fe3O4)x: (a) pseudo-first-order, pseudo-second-order, Elovich model, (b) intraparticle diffusion model.
Figure 7.
Kinetic model of Pb(II) adsorption on HCO–(Fe3O4)x: (a) pseudo-first-order, pseudo-second-order, Elovich model, (b) intraparticle diffusion model.

Figure 8.
SEM characterization of HCO–(Fe3O4)x: (a) polished sludge; (b) Ce/Fe = 1:1; (c) Ce/Fe = 1.5:1; (d) after adsorption of Pb(II).
Figure 8.
SEM characterization of HCO–(Fe3O4)x: (a) polished sludge; (b) Ce/Fe = 1:1; (c) Ce/Fe = 1.5:1; (d) after adsorption of Pb(II).

Figure 9.
XRD analysis of Pb(II) before and after adsorption by HCO–(Fe3O4)x adsorbent.

Figure 10.
XPS analysis of HCO–(Fe3O4)x before and after Pb(II) adsorption: full (a); Ce 3d (b); Fe 2p (c); Pb 4f (d).
Figure 10.
XPS analysis of HCO–(Fe3O4)x before and after Pb(II) adsorption: full (a); Ce 3d (b); Fe 2p (c); Pb 4f (d).

Figure 11.
FTIR analysis of Pb(II) before and after adsorption by HCO–(Fe3O4)x adsorbent (HCO-(Fe3O4)x after adsorption of Pb(Ⅱ) (A) and HCO-(Fe3O4)x (B)).
Figure 11.
FTIR analysis of Pb(II) before and after adsorption by HCO–(Fe3O4)x adsorbent (HCO-(Fe3O4)x after adsorption of Pb(Ⅱ) (A) and HCO-(Fe3O4)x (B)).

Table 1.
Parameters of adsorption isothermal model of Pb(II).
| Model | Langmuir | Freundlich | D–R | |||||||
|---|---|---|---|---|---|---|---|---|---|---|
| Temperature °C | qm | b | R2 | Kf | 1/n | R2 | β | qs | E | R2 |
| 20 | 33.93 | 0.051 | 0.947 | 3.824 | 0.482 | 0.973 | −1.1 × 10⁻⁸ | 20.926 | 68.810 | 0.889 |
| 25 | 28.27 | 0.169 | 0.965 | 6.632 | 0.371 | 0.991 | −9.9 × 10⁻⁹ | 26.154 | 70.992 | 0.966 |
| 30 | 35.93 | 0.174 | 0.963 | 8.667 | 0.376 | 0.985 | −7.54 × 10⁻⁹ | 28.845 | 81.417 | 0.947 |
Table 2.
Dynamics model parameter of HCO–(Fe3O4)x adsorption of Pb(II).
| Parameters | qe/(mg·g−1) | k1/(min−1) | R2 |
|---|---|---|---|
| Pseudo-first-order | 30.85 | 0.018 | 0.946 |
| Pseudo-second-order | 35.34 | 0.001 | 0.962 |
| Parameters | a/( mg·mg−1·min−1) | β/(g·mg−1) | R2 |
| Elovich | 2.103 | 0.159 | 0.928 |
Table 3.
Intraparticle diffusion dynamics model parameter.
| Parameters | Intraparticle Diffusion | |||||
|---|---|---|---|---|---|---|
| a1/(mg·g−1) | k1/(mg g−1.h−0.5) | R2 | a2/(mg/g) | k2/(mg g−1.h−0.5) | R2 | |
| Pb(II) | 4.086 | 1.950 | 0.959 | 30.398 | 0.0361 | 0.858 |
Table 4.
Element content of HCO–(Fe3O4)x before and after adsorption Pb(II) (%).
| Element | O | Na | Mg | Al | Si | Cl | Ca | Fe | Ce | Pb |
|---|---|---|---|---|---|---|---|---|---|---|
| Before adsorption | 29.95 ± 2.34 | 0.25 ± 0.10 | 0.1 ± 0.02 | 0.62 ± 0.23 | 1.87 ± 0.47 | 1.54 ± 0.26 | 0.85 ± 0.31 | 26.14 ± 2.41 | 38.47 ± 1.87 | 0.21 ± 0.02 |
| After adsorption | 30.95 ± 1.58 | 0.39 ± 0.15 | 0.06 ± 0.03 | 1.26 ± 0.18 | 2.51 ± 0.46 | 0.82 ± 0.07 | 0.34 ± 0.16 | 22.8 ± 1.67 | 36.32 ± 1.79 | 3.74 ± 0.94 |
Disclaimer/Publisher’s Note: The statements, opinions and data contained in all publications are solely those of the individual author(s) and contributor(s) and not of MDPI and/or the editor(s). MDPI and/or the editor(s) disclaim responsibility for any injury to people or property resulting from any ideas, methods, instructions or products referred to in the content. |
© 2023 by the authors. Licensee MDPI, Basel, Switzerland. This article is an open access article distributed under the terms and conditions of the Creative Commons Attribution (CC BY) license (https://creativecommons.org/licenses/by/4.0/).
Share and Cite
MDPI and ACS Style
Li, J.; Hu, Z.; Chen, Y.; Deng, R. Removal of Pb(II) by Adsorption of HCO–(Fe3O4)x Composite Adsorbent: Efficacy and Mechanism. Water 2023, 15, 1857. https://doi.org/10.3390/w15101857
AMA Style
Li J, Hu Z, Chen Y, Deng R. Removal of Pb(II) by Adsorption of HCO–(Fe3O4)x Composite Adsorbent: Efficacy and Mechanism. Water. 2023; 15(10):1857. https://doi.org/10.3390/w15101857
Chicago/Turabian StyleLi, Jing, Zehua Hu, Yilin Chen, and Renjian Deng. 2023. "Removal of Pb(II) by Adsorption of HCO–(Fe3O4)x Composite Adsorbent: Efficacy and Mechanism" Water 15, no. 10: 1857. https://doi.org/10.3390/w15101857
Note that from the first issue of 2016, this journal uses article numbers instead of page numbers. See further details here.