
A Fundamental Study on the Extraction of Particulate Organic Carbon from Municipal Wastewater Treatment Plants

University of Stuttgart, Faculty 2: Civil and Environmental Engineering, Institute for Sanitary Engineering, Water Quality and Solid Waste Management (ISWA), Bandtäle 2, 70569 Stuttgart, Germany
*
Author to whom correspondence should be addressed.
Water 2023, 15(10), 1861; https://doi.org/10.3390/w15101861
Submission received: 13 April 2023
/
Revised: 6 May 2023
/
Accepted: 9 May 2023
/
Published: 14 May 2023
(This article belongs to the Topic Technologies for Wastewater and Sludge Treatment)
Abstract
:In line with the strategy of transforming existing municipal wastewater treatment plants (WWTP) from disposal facilities into systems for using domestic wastewater (WW) as a source of energy and raw materials, a concept consisting of chemical, physical, and biological steps has been set up as a pilot project in WWTP Büsnau, Stuttgart, Germany. The key part of the entire process is based on the use of advanced microsieving (MS) to eliminate remaining particulate organic carbon (POC) (mg/L) from the effluent of the primary sedimentation tank (PST). Therefore, in the primary stages of this project, it was necessary to have a broad vision and a true understanding of the particle size distribution (PSD) of municipal WW. As a novel approach, in the present study, the conventional PSD method was optimized by implementing certain modifications, and the tests were conducted in situ. The modified PSD analyses facilitated in-depth investigations of solid–liquid separation at WWTPs and showed that drying samples in the oven can result in a 20% to 30% deviation in the POC (mg/L) removal results. In addition, the idea of the substitution of PSTs with an MS was supported by the results of this study. It was determined that an MS with a pore size of 45 µm to 63 µm can provide the same elimination efficiency as a PST. Another significant outcome of this study was the introduction of suitable mesh sizes for the MS which were coupled with PST in order to extract the maximum amount of POC (mg/L) from the municipal WWTPs without the addition of any chemicals. The results revealed that up to 90% of the TSS (mg/L) and 70% of the COD (mg/L) can be removed if an MS with a mesh size between 4 µm and 20 µm is coupled with a PST.
1. Introduction
Natural water pollution has seen a significant rise since the exponential increase in population growth and urbanization, and this can mainly be attributed to the establishment of sewer systems and the discharge of untreated domestic sewage [1,2,3,4]. The objective of using WWTPs is to properly dispose of domestic sewage in order to protect natural waters and achieve good hygienic conditions. In fact, the main aim of implementing WWTPs is to reduce both settable solids and organic load to maintain hygienic conditions and sufficient levels dissolved oxygen in natural waters. More recently, nutrient removal (nitrogen and phosphorus) has been implemented to inhibit eutrophication and save the environment [5,6]. Finally, since the beginning of this century, micropollutant removal has been introduced in some countries due to the nature of its impact [7]. Thus, end-of-pipe treatment has been improved step by step. As the energy consumption for treatment increased, measures to minimize it were introduced. The anaerobic digestion of primary and excess sludge combined with electricity generation from biogas represents the first utilization of wastewater as an energy source [8]. Today, wastewater is understood as a source of energy and chemical raw materials [9]. A rising number of studies have also focused on using novel technologies, such as mesoporous materials, hollow fiber composite membranes, and polyethersulfone ultrafiltration membranes, to remove a variety of organic and inorganic pollutants [10,11,12]. Against the background of the conventional approach, the tendency to change WWTPs into energy sources rather than purification streams is steadily increasing across the globe. WWTP Büsnau, Stuttgart, Germany, is not an exception in this regard. The intention at this WWTP is to remove much greater quantities of suspended solids (SS) in the primary steps of treatment with the help of a PST and an MS, and finally to use these materials for the recovery of energy and chemicals. The residual load for biological treatment is thereby lowered and thus the energy consumption required for aeration is significantly reduced. Prior to biological treatment, ammonium, an energy-rich substance, will be recovered. As a consequence, simpler biological treatments can be designed in the form of cost-effective methods such as trickling filters. As indicated, the primary and fundamental step of the project is to significantly increase the separation of POC in the primary treatment steps. For this purpose, PSD analyses can be used to select the appropriate design processes, e.g., the type and size of the mesh used for the MS in order to extract the maximum amount of POC for energy and chemical recovery. Increasing attention has been given to the size distribution of wastewater solids by researchers over the past several years [13,14]. This is likely because a true understanding of PSD can have a decisive impact on the pollutant removal efficiency of WWTPs. A succession of techniques has been developed to determine PSD, such as sieving, light scattering, microscopic investigation, and a few others. It should be understood that employing a variety of approaches to specify particle size distribution can result in entirely distinct outcomes [15,16]. Certain classification methods are known for identifying the distribution of particle size in wastewater. Typically, four size classes [17] are employed to illustrate wastewater components, namely, settleable solids, supracolloidal solids, colloidal solids, and dissolved solids. However, since wastewater substances include a broad range of particle sizes [18,19], a unanimous agreement has not been reached among researchers concerning the exact distribution of particles in wastewater. Therefore, results tend to differ according to the type of wastewater used [20,21]. Since multiple researchers [22,23,24,25,26,27] have used different classifications for the same fractionations, defining the best analytical method or the most reasonable particle ranges for the PSD of municipal wastewater is not easy [28]. The processes that may occur within the sedimentation processes in WWTPs are characterized by their high sophistication [29]. Therefore, comprehensive techniques or measurement methods are still not capable of precisely analyzing wastewater particles, either qualitatively or quantitatively [17]. As a result, the present study, by introducing a modified PSD analysis, aims to thoroughly explore PSD in municipal WWTPs and produce unambiguous results which incorporate almost all particle ranges and can be reliably applied to future investigations. The conventional PSD approach was optimized using three distinct methods of analysis: wet (T1), dry analysis at room temperature (T2), and dry analysis at 105 °C (T3). The current study makes significant contributions to the field of wastewater treatment for the following reasons. Firstly, conducting the PSD analyses in situ allowed us to obtain accurate information about the size distribution of the particles without affecting their original size. Secondly, it proposes the coupling of PST and MS, which has never been practiced before. This method is cost-effective and enables the practicing of load-independent methods in which the conventional activated sludge tank can be removed. By applying this concept, high amounts of POC can be extracted from municipal WWTPs, leading to significant energy savings and increased gas and electricity production via anaerobic digesters.
2. Materials and Methods
2.1. Materials
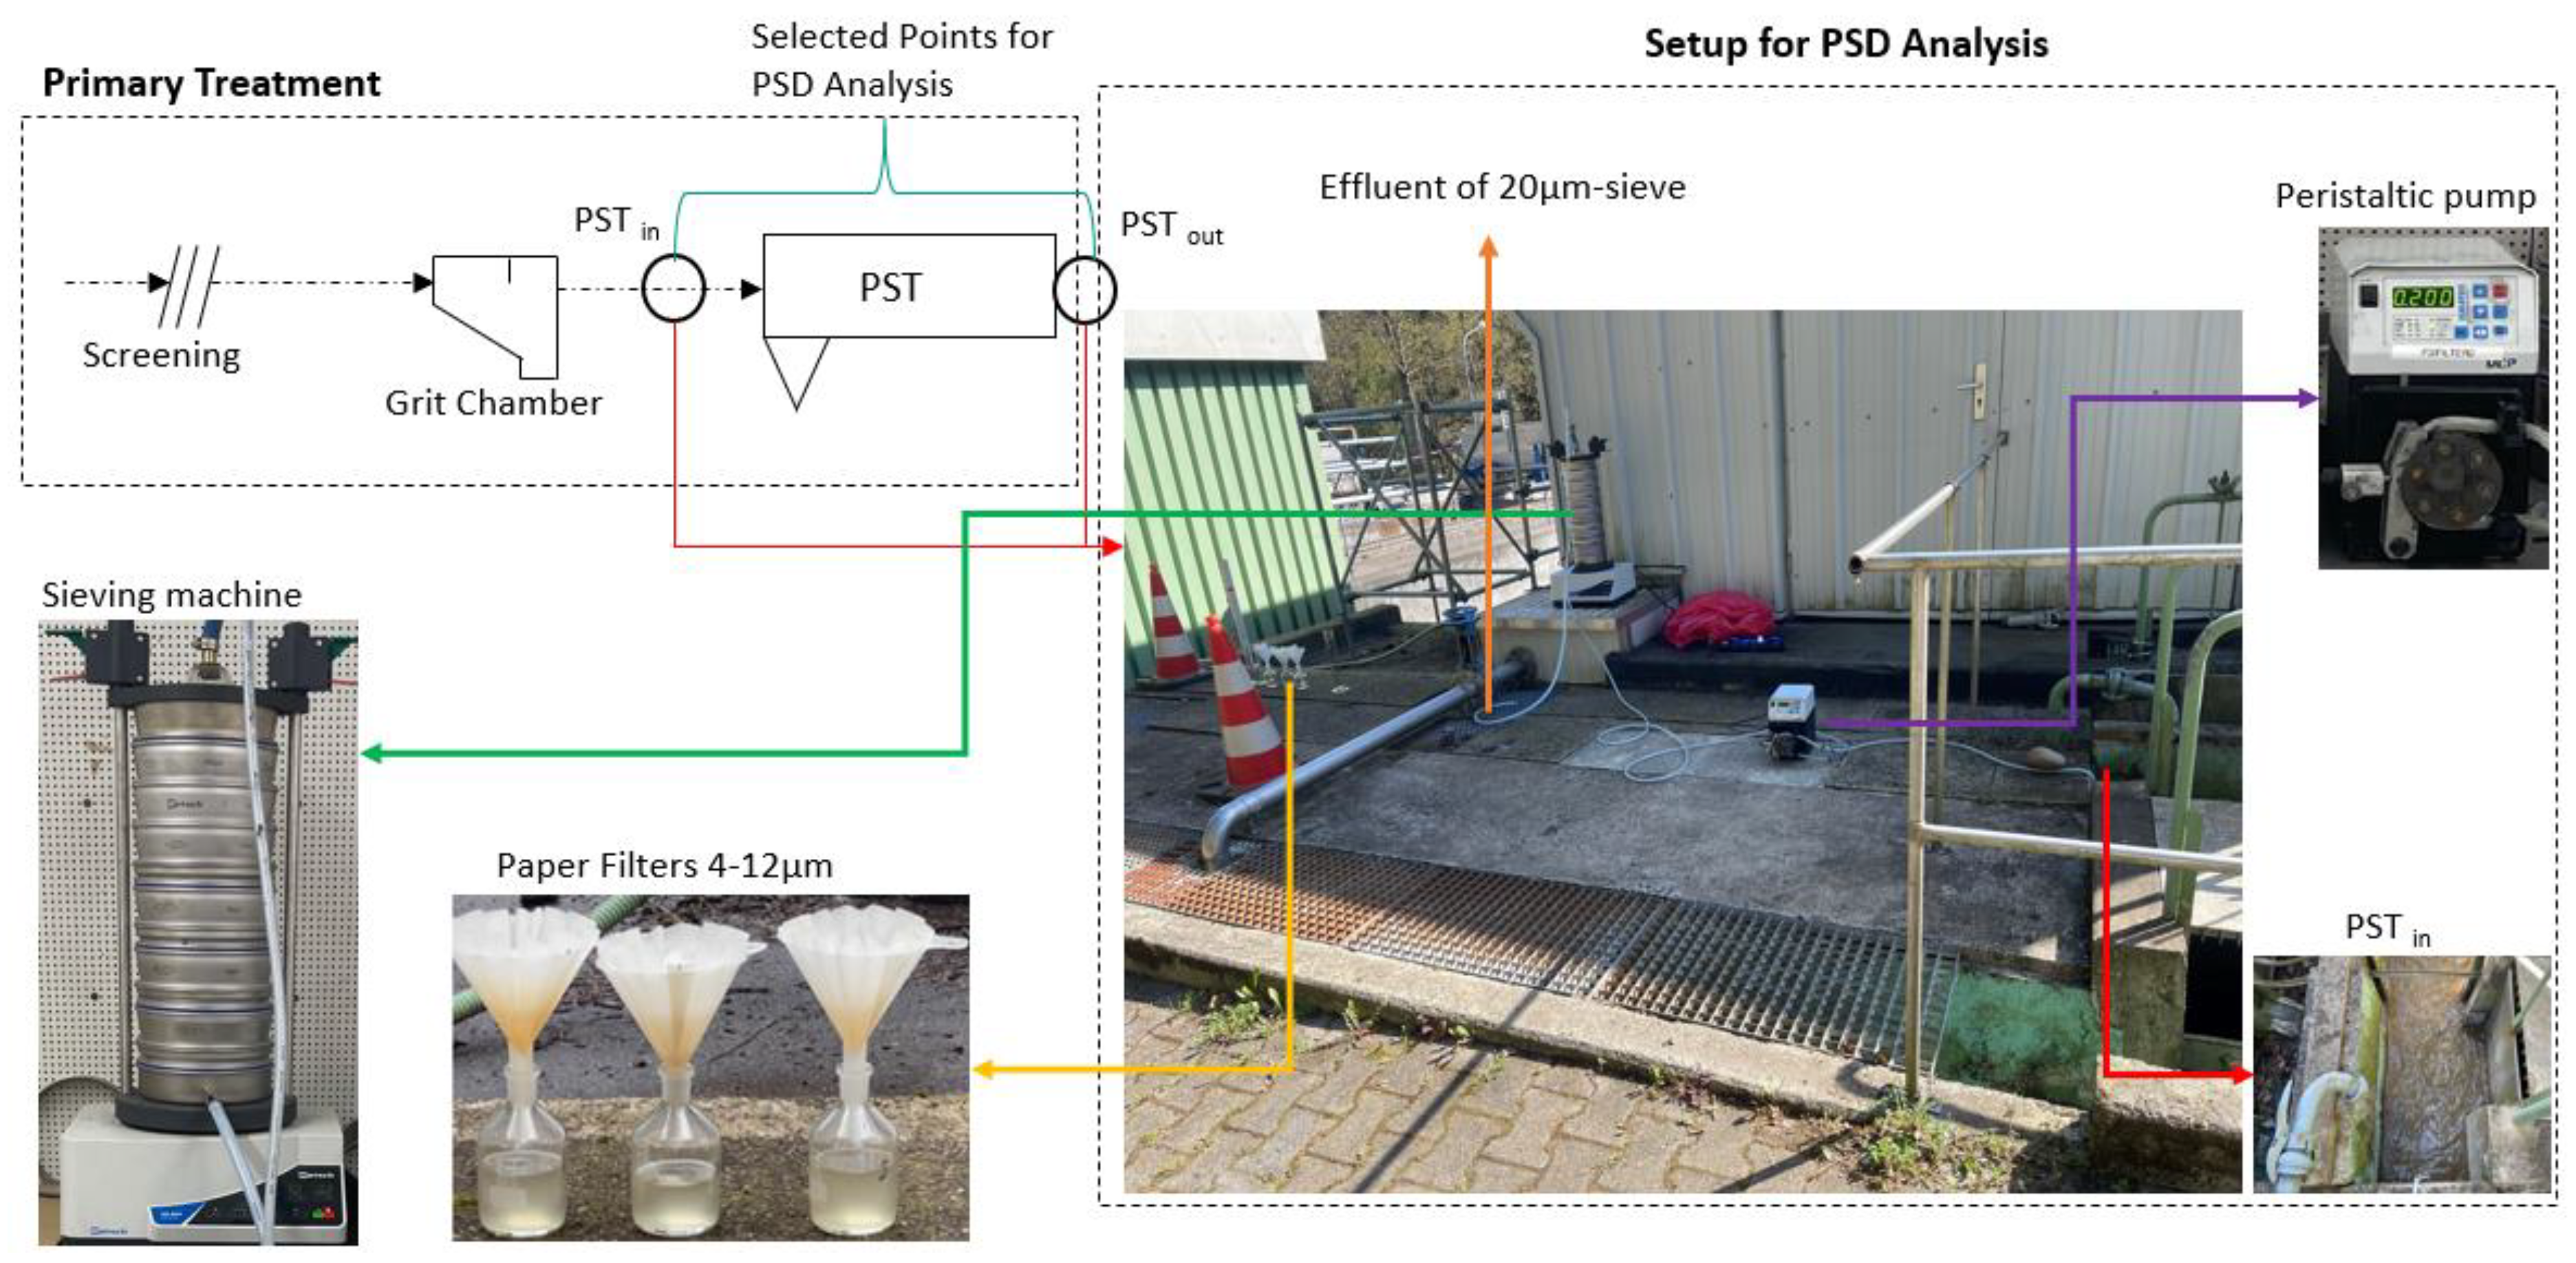
A small-scale sieving machine from Retsch (Haaan, Germany) was employed at Büsnau municipal WWTP (10,000 population equivalents) for analyzing PSD in the PSTin and PSTout. The mesh size of the stainless steel sieves varied from 2 mm to 20 µm. Municipal wastewater was used in the sieving machine after preliminary separation (5 mm bar rack followed by a sand trap). From the effluent of the sand trap into the inlet of the sieving machine, wastewater was pumped using a peristaltic pump at a flow rate of approximately 30 L/h. Afterwards, the effluent of the last sieve was filtered off with consecutive paper filters of pore sizes ranging from 2 µm to 15 µm. The detailed material used and the actions taken for conducting this test are summarized in subsequent subsections.
2.1.1. Stainless Steel Sieves
The selected sieves from Retch (Haaan, Germany) are as follows: 2 mm, 500 µm, 250 µm, 125 µm, 63 µm, 45 µm, and 20 µm, respectively.
2.1.2. Ash-Free Colour-Coded Quantitative Filter Papers
Since there is no stainless steel sieve smaller than 20 µm available on the market; the effluent from the sieve 20 µm should have been analyzed by different paper filters. So, the ash-free colour-coded quantitative filter papers from Sartorius (Göttingen, Germany), with pore sizes varying from 15 to 2 µm, were used.
2.1.3. Membrane Filter
For determination of the rest residue of filterable matters below 4 µm and above 0.45 µm, the effluent from the filter 2–15µm was again filtered off by a 0.45 µm filter made by the Sartorius (Göttingen, Germany). It should be noted that this approach was not conducted gravimetrically but rather by compressed air (4 to 6 bars).
2.1.4. Scales
The scales that were applied in this study in order to weigh the mass of retained material by the stainless steel sieve or the paper filters were distinct. Sartorius scales (Göttingen, Germany) with an accuracy of 0.01 g were applied for the stainless steel sieves, and the scale from Precisa (Dietikon, Switzerland) with an accuracy of 0.0001 g was used for measuring the ash-free color-coded filter papers as well as membrane filters.
2.1.5. Sieving Machine
The sieving machine used was from Retch (Haaan, Germany).
2.1.6. Peristaltic Pump
A peristaltic pump, MCP (type: p3/filter3), was used for discharging the wastewater from the flow channel to the top of the sieves.
2.1.7. Measuring Cylinder, Funnels and Beakers
Glass or plastic measuring lab cylinders were used for taking the samples (100 mL and 1 L). Moreover, nine funnels and nine beakers were prepared in order to keep the paper filters and also collect the filtered material.
2.1.8. Ultrasonic Machine
Since the finer particles trapped by the pores of the stainless steel sieves cannot be detached by hand or simple washing methods, the ultrasonic machine from BANDELIN Electronic GmbH and Co. KG (Berlin, Germany) was applied for this purpose.
Remark: For more information about conducting each specific part, please refer to the Supplementary Information.
2.2. Methods
First, all the needed material was prepared one day before the test. The filters and sieves were dried in the oven one day before the test. All the sieves and filters were weighed right before the test, and then the test was conducted for exactly one hour. During the test, checks for any leakages from the ventilation aids and the hoses were conducted. Sufficient samples were taken for determining TSS (approximately 1 L) and filterable substances (200 mL for each measurement) every 20 min. When the test was completed, all the sieves were detached, transported to the lab, and immediately weighed and put in the lab to be dried. So, at this time, the first values for the sieving test were recorded. Meanwhile, the very fine fraction of SS was determined by means of membrane filtration (applying the standard method: DIN 38409-2). Measurements for the weight of the sieves and filters were accomplished after 24 h, 48 h, and 72 h, which correspond to T1, T2, and T3 samples, respectively. TSS (mg/L) was measured at least three times using a 0.45 µm membrane filter (applying standard DIN 38409-2). During the filtration process using paper filters, samples were taken for COD (mg/L) and TOC (mg/L) and analyzed according to DIN 38409-41 and DIN EN 1484, respectively. The individual specimen contained at least 50 mL of filtered material. Moreover, two more samples were prepared. The first one was for the sample filtered with a 0.45 µm-membrane filter, and the second one was for either PSTin or PSTout according to the selected type of analysis. After completion of the test, the stainless steel sieves were cleaned gently by hand in order to remove coarse particles. Afterwards, the ultrasonic machine was used to remove finer particles. Eventually, dry matter content and the loss on ignition were determined by applying standards DIN EN 12880 2000 and DIN EN 12879 2001, respectively. For more details, Figure 1 illustrates the piping and instruction design (PID) for the primary treatment step of WWTP in Büsnau, Stuttgart, along with the points chosen for in situ PSD analyses. It is worth noting that the PST’s hydraulic retention time (HRT) ranged from 1 to 5 hours depending on the inflow rate. As a result, all studies were attempted at 11:00 a.m., when the availability of SS in WWTP Büsnau was very high.
2.3. Interpretation of Data
For determining the concentration [mg/L] of TSS over a specific sieve (TSSx) and the cumulative removal efficiency (RDx) of different fractions, Equations (1) and (2) were applied, respectively.
where is the weight [g] of detained particles equal to or bigger than mesh size x, and [L] is the total volume of the filtered sample.
where is the weight [g] of detained particles equal to or bigger than mesh size x, and [L] is the total volume of the filtered sample.
Moreover, in order to determine the removal efficiency for COD (mg/L) of a specific sieve, Equation (3) was applied.
where and are the concentrations of COD (mg/L) in the inflow and outflow of the sieve X, in the given order.
3. Results and Discussion
The literature review revealed that the deviations obtained in PSD analyses could stem from the following points:
- No attention was paid to the particle breakage issue caused by sample transport to the lab for dry sieving or by pump propellers for wet sieving;
- There was no consideration of the hourly or daily variation of wastewater flows;
- Different analytical methods and categories, and even sometimes irrelevant ones, were chosen for the distribution of particles in municipal WWTPs;
- Grab samples were taken for the distribution test analyze instead of using mixed samples or conducting the test in situ;
- There was a lack of data or knowledge about the exact performance of PSTs on the removal of specific fractions of suspended solids present in wastewater.
In this study, we attempted to minimize all the factors mentioned above in order to make it easy so that the values and ranges can be applied with confidence to further studies. The parameters of total suspended solids (TSS), chemical oxygen demand (COD), and organic/inorganic portion were analyzed not only for the inflow of the primary sedimentation tank (PSTin) but also for the outflow of the primary sedimentation tank (PSTout) in order to gain a profound understanding of fractionation in municipal WWTPs. The results obtained are discussed in the subsequent sections in detail.
3.1. Solids Distribution in the Influent of PST
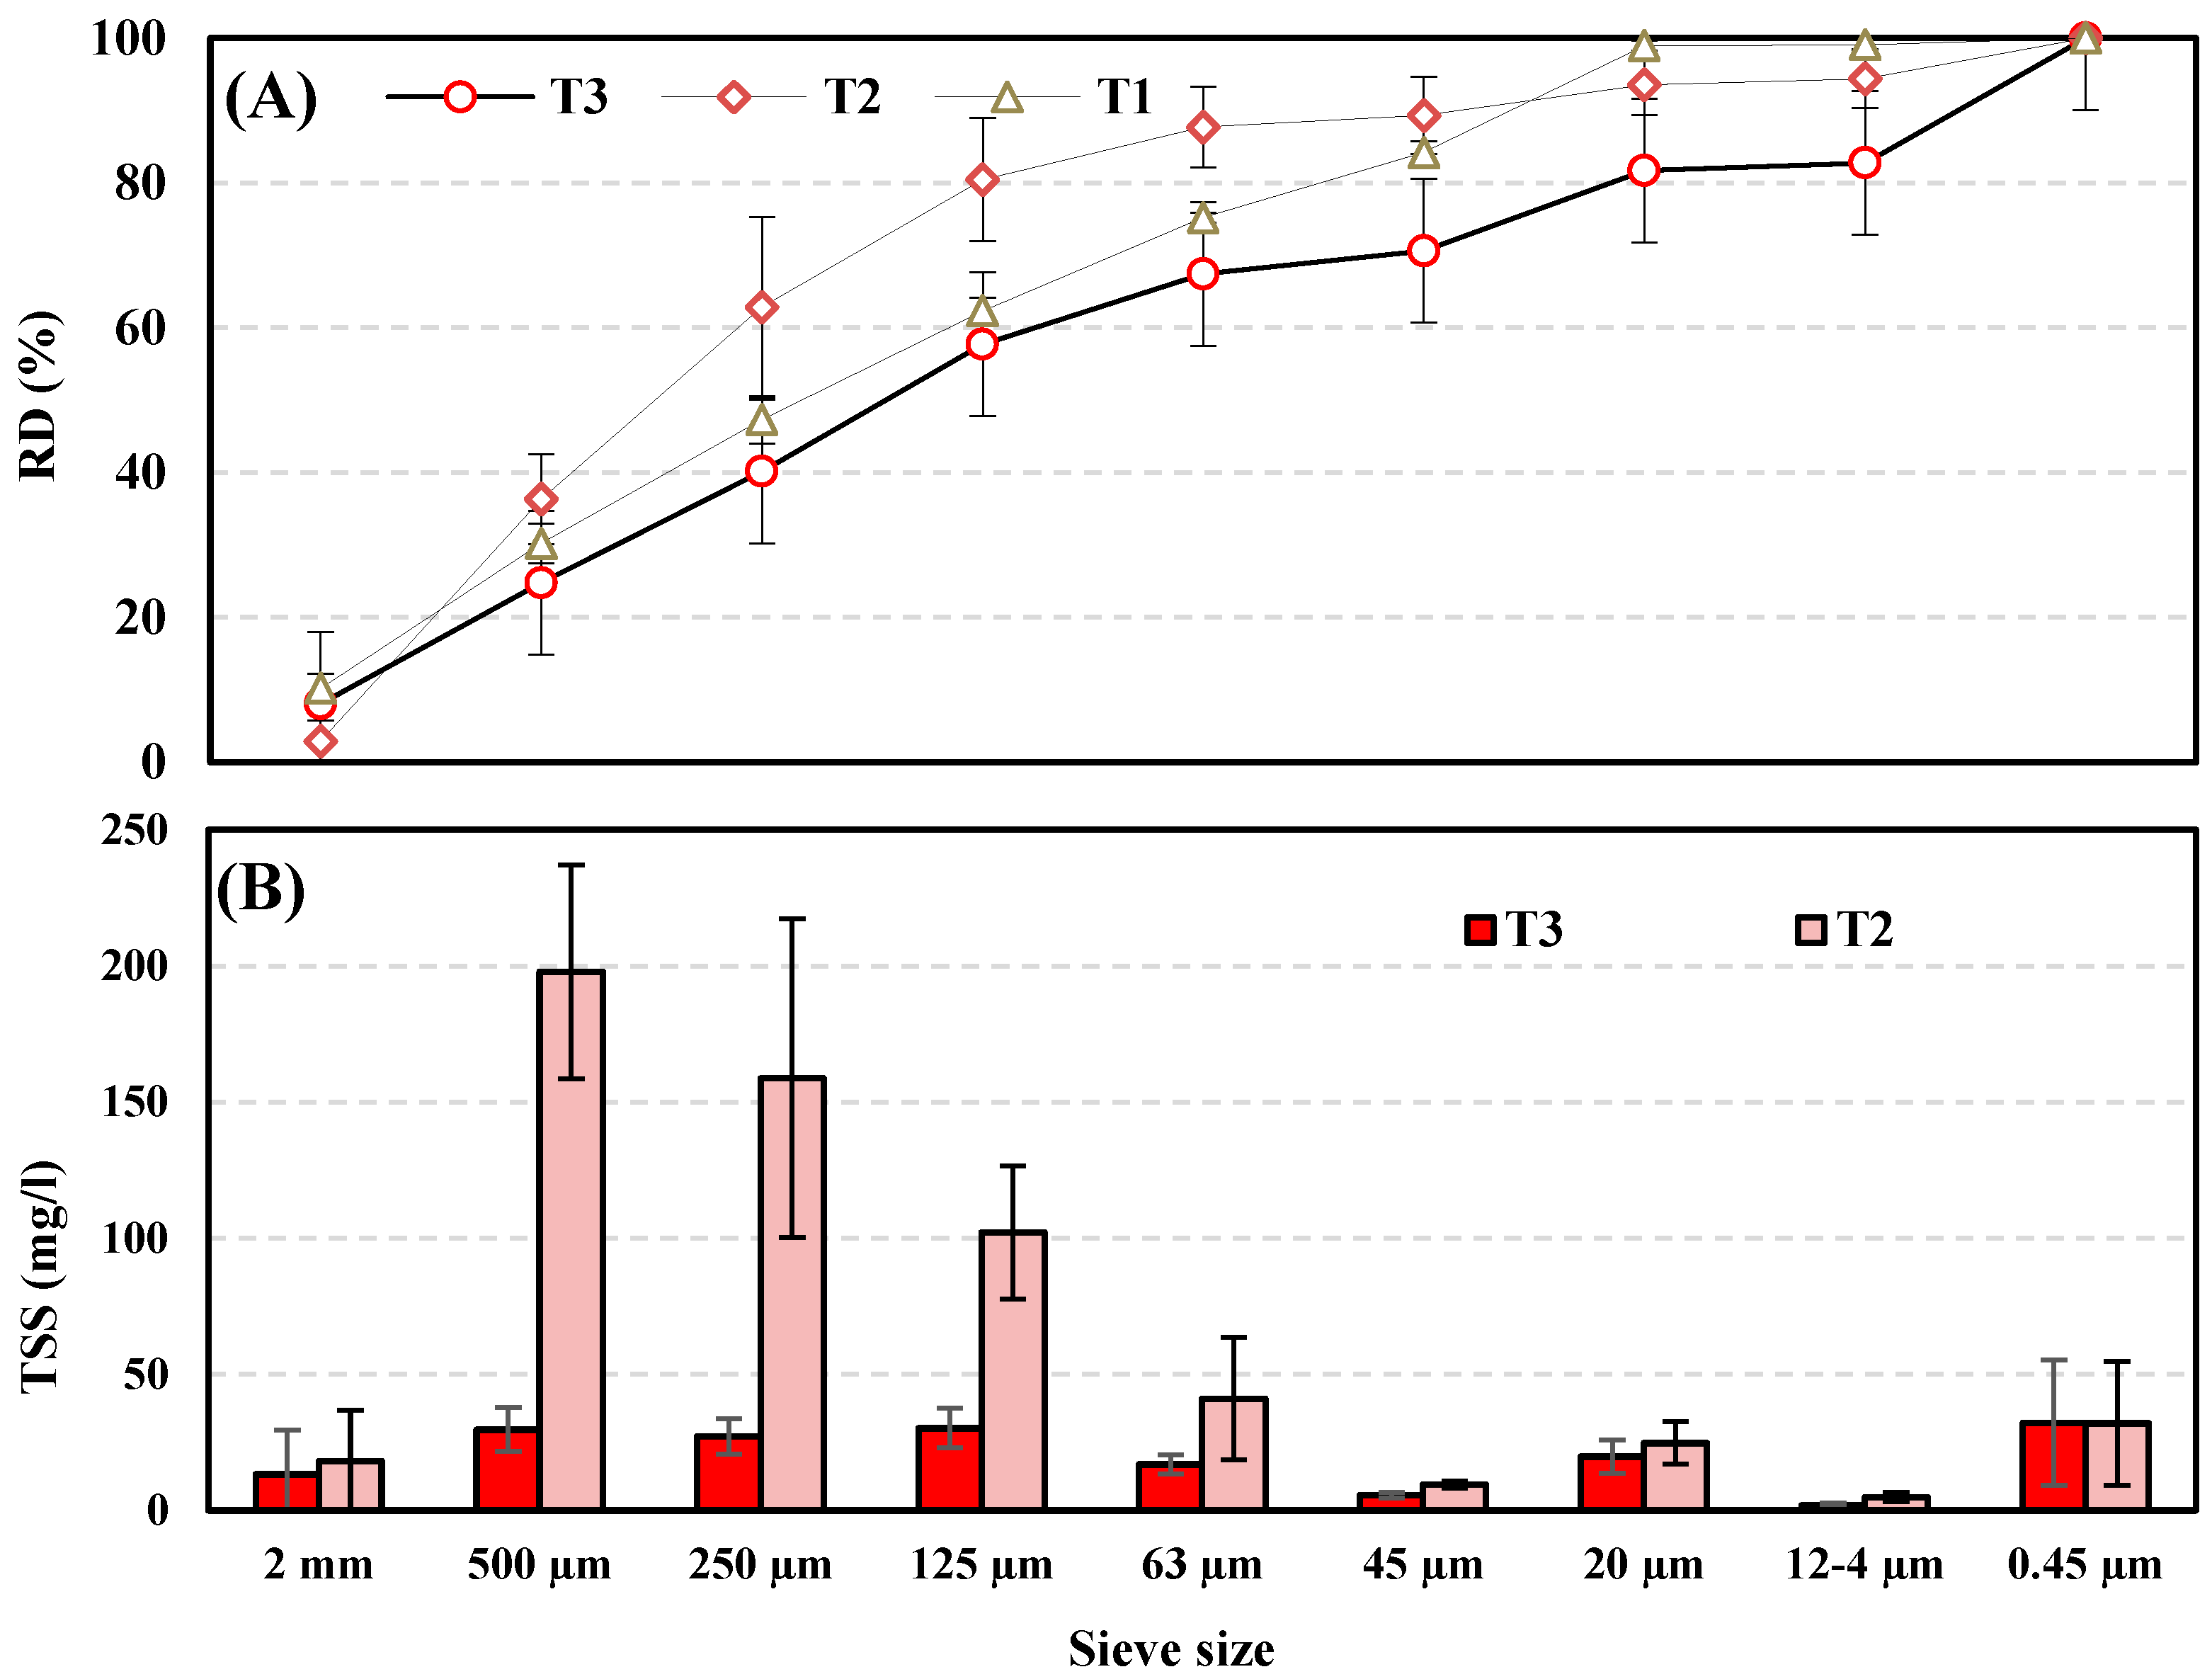
Solids in wastewater are described as particles, flocs, and aggregates. They differ according to shape and size. Even though bigger SSs are detectable in wastewater, the vast majority of them are of very small sizes [30]. Solids in wastewaters are typically classified by non-specific parameters such as SS, total solids (TS), volatile solids (VS), etc. [31]. The SS parameter has been applied to be a satisfactory index for cutting-edge processes such as trickling filters [32], membrane filtration [33,34], and the activated sludge process [35] in water and wastewater treatment. By introducing PSD for the inflow and outflow of PST in Figure 2 and Figure 3, respectively, the mechanism of solid sedimentation by PST can be better understood. Experimental outcomes showed that around 70 to 90% of receiving solids and particles after the grit and grease chamber are equal to or bigger than 20 µm, of which 70% belong to T3 and 90% to T2. These findings are in agreement with work conducted by Izdori et al. [25]. Since fine particles can be removed by simultaneous settling [36] with large particles, both percentiles can be realized depending on the hourly or daily variation of receiving SS concentration, weather conditions, and retention time. Simultaneous settling occurs when faster-sinking particles meet slower-sinking particles due to factors such as a decrease in velocity in the wastewater. Particles from a region with a higher flow velocity reach an area with a slower flow velocity, but their movement is not immediately slowed down, so they encounter other particles whose movement is already slower and settle together because of inertial forces. In places with high levels of turbulence, this procedure is particularly crucial. The capillary merging of individual particles also contributes significantly to the simultaneous settling process [37].
The substitution of PSTs with an MS with the same removal efficiency could also be seen in Figure 2. According to the European norm, PSTs can remove about 50% of TSS (mg/L). So, according to these results, an MS with a pore size of 45 to 63 µm can provide the same removal efficiency, even with low maintenance costs and the capability of being adjusted to population increases. The PSD analyses applying three distinct measuring methods could also provide advantageous information on the type and nature of sewage solids. For instance, analyzing the material obtained by sieving showed that most of the particles retained by sieves 125 µm and bigger, and even partially by sieve of 63 µm, stem from toilet paper (approved by visual observation and loss of ignition). A comparison of the results of this study with works conducted in this area reveals that the settling process by PSTs can be reasonably projected by assessing the fraction of particles.
3.2. Solids Distribution in the Effluent of PST
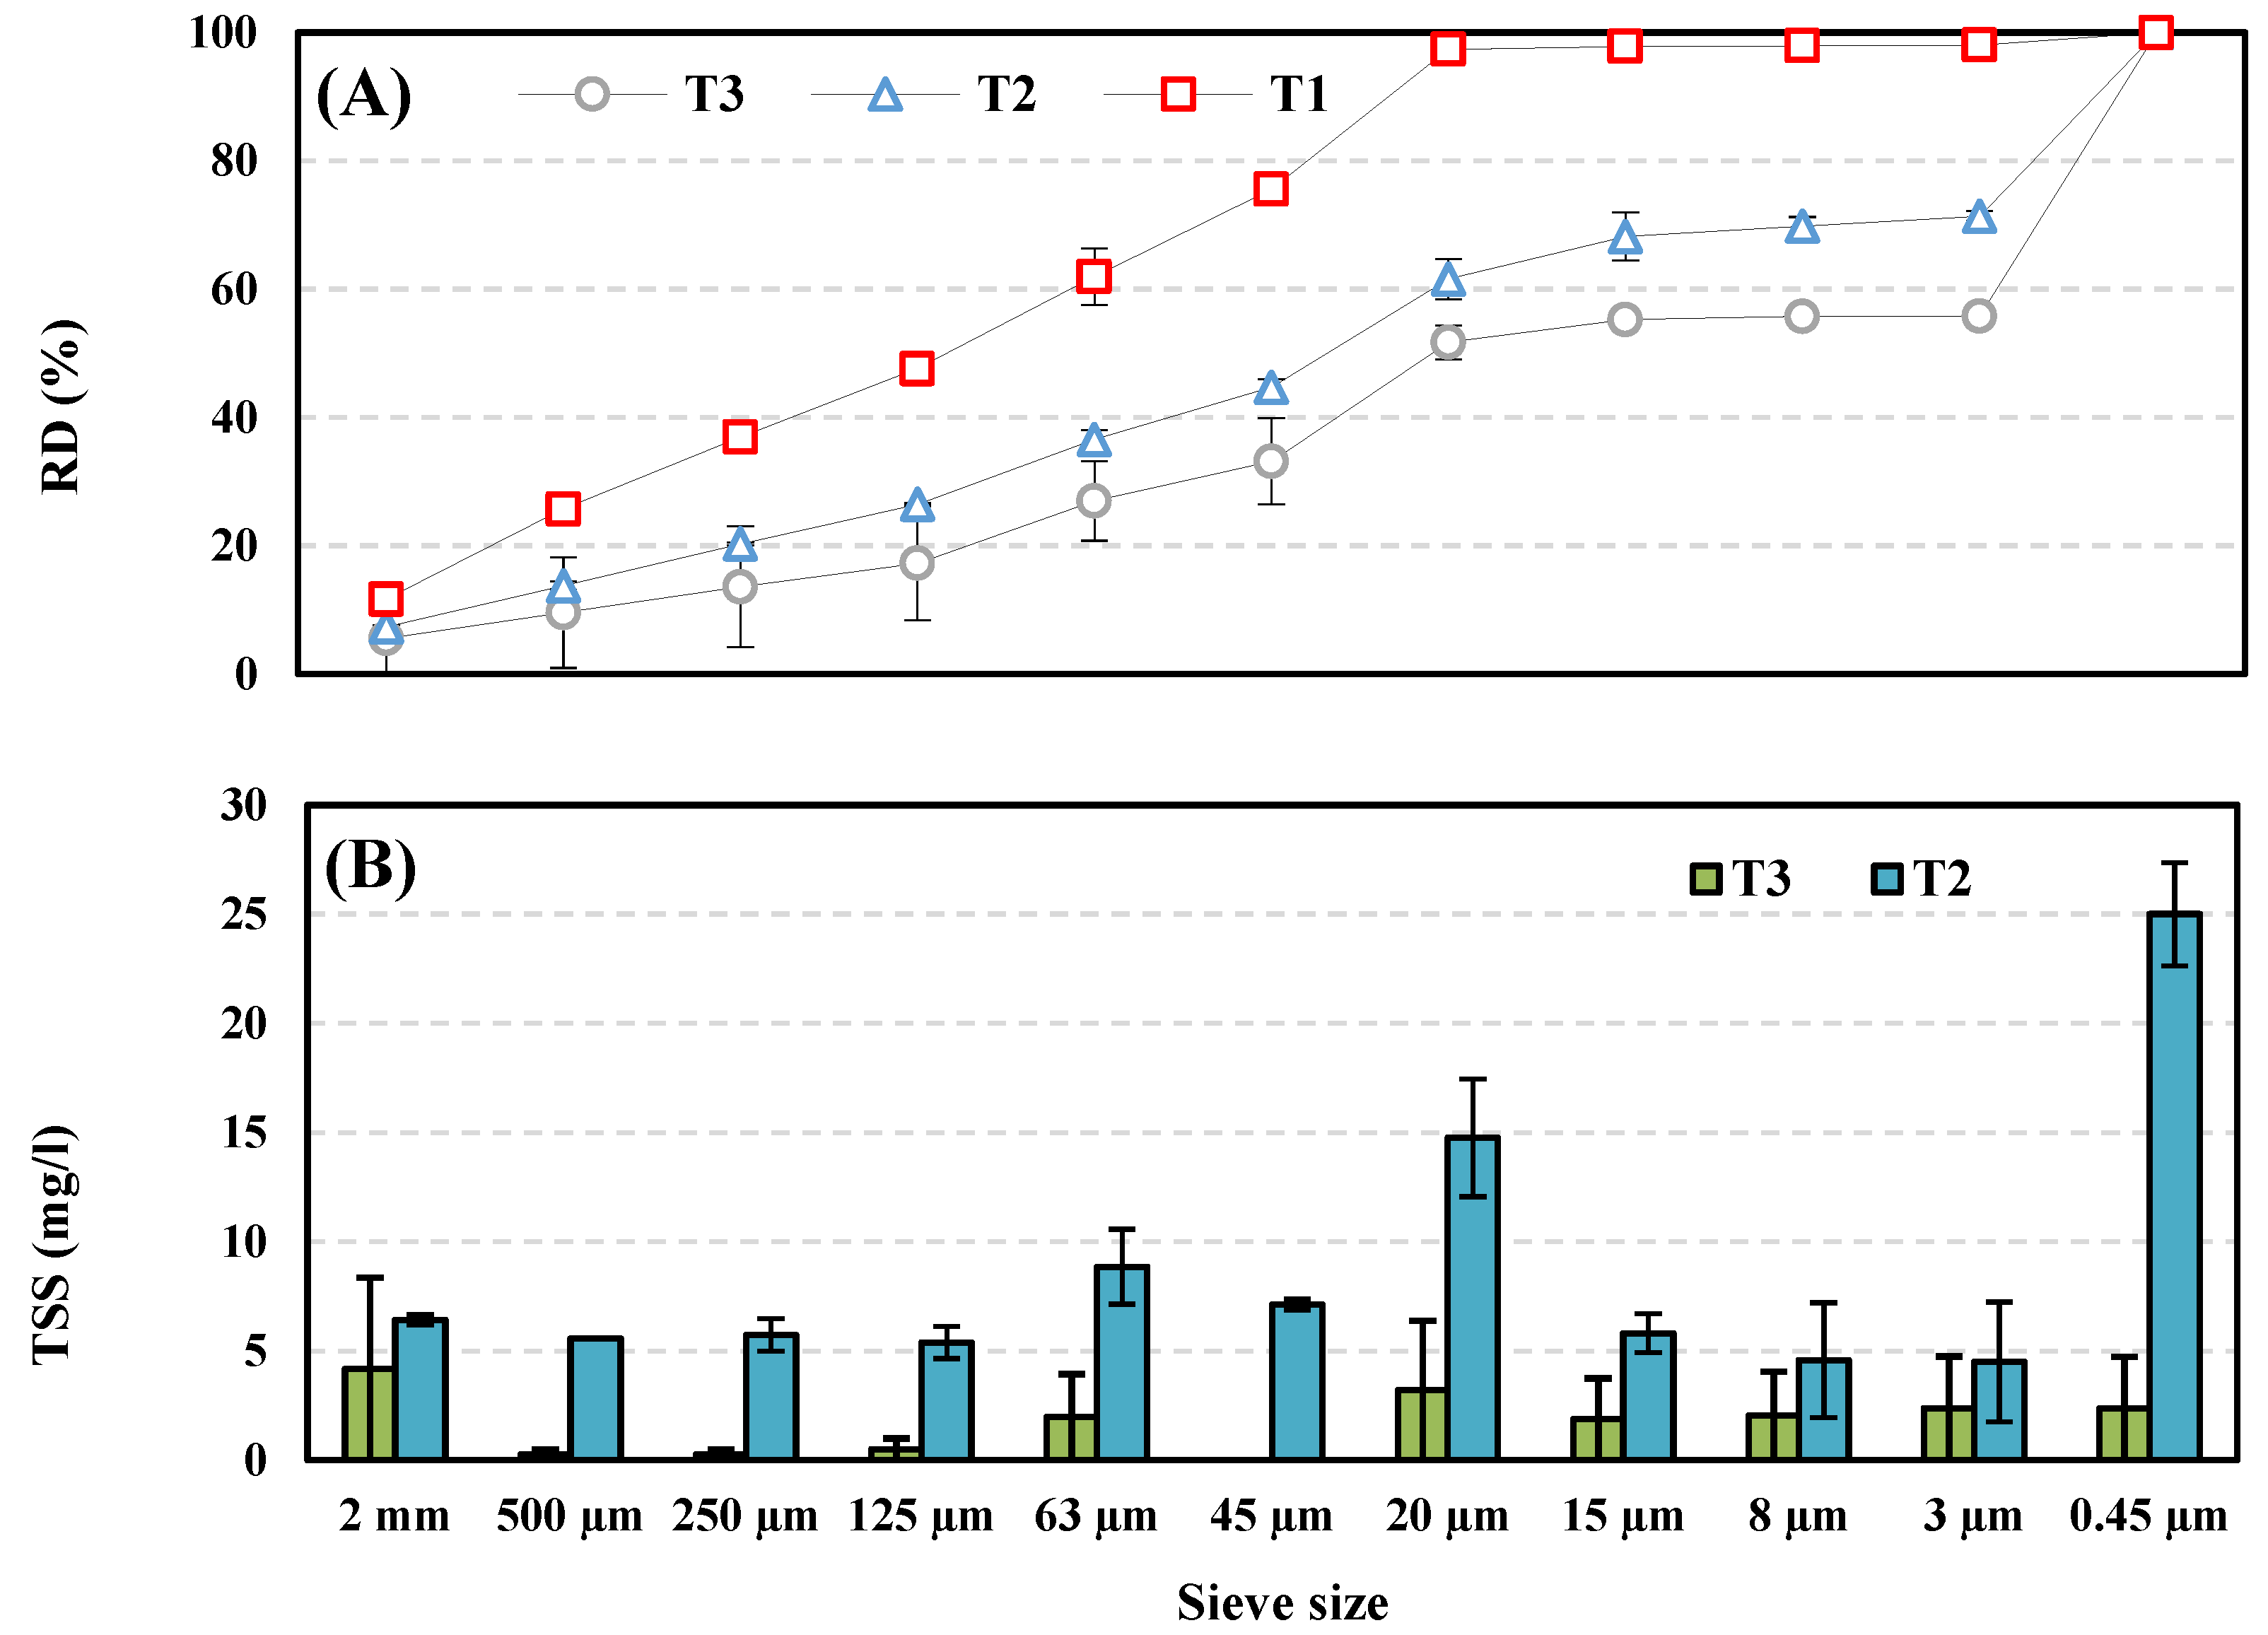
The same approach was applied for determining the SS concentration in the effluent of PST. Figure 3 shows the measurement of TSS (mg/L) for the effluent of PST for different days. Considerable differences can be noted between the concentration of TSS (mg/L) in the influent and the effluents of PST. The findings are in line with the outcomes of the study conducted by Vicuinik [38]. Based on the measurements carried out, particles sizing from 2 mm to 125 µm can be rarely found after PST. This means that these particles are easily removed by PST during the sedimentation process. In addition, the above results proved that toilet paper is a dominant organic component of TSS (mg/L) received from wastewater. However, our optical observation showed no traces of toilet paper after PST. This could be due to the particle’s geometry; irregularly shaped particles (mainly coarser) settle faster than regularly shaped ones (mainly finer) because rotation during the settling process shifts their area perpendicular to the direction of travel. Therefore, gravitational forces cause particles to settle more rapidly, facilitating their removal through primary sedimentation tanks. By introducing an MS as an alternative for PSTs, toilet paper, which is mainly cellulose, can be readily extracted from raw wastewater. This information is highly valuable for supporting ideas such as using cellulose fibers as flocculant material to enhance the removal of organic SS (mg/L) in PSTs by their cationic or anionic charging by chemical or catalytic reaction [39], and the production of activated carbon from fibers taken from wastewater screenings [40]. By doing so, an increase in biogas yield and a decrease in the energy consumption of biological treatment steps are expected due to the availability of more primary sludge. Realizing this concept will bring us one step closer to the dream of looking at municipal wastewater as a resource rather than a waste stream.
Figure 3 illustrates that ca. 50 to 70% of TSS (mg/L) remaining after PST can be removed if the MS mesh size is selected between 15 and 4 µm. In contrast, studies conducted by Remy et al., Köngsepp et al., and Vaananen et al. [41,42,43] mainly observed the removal of solids from raw wastewater using drum or disc filters, with mesh sizes predominantly ranging from 100 to 400 µm but with the help of chemicals such as ferric chloride and aluminum chloride or sulfate. However, the idea of coupling a PST with an MS in order to extract a higher amount of POC (mg/L) out of municipal WWTPs without any chemical addition is being introduced for the first time in this study. The results indicate that around 80 to 90% of TSS (mg/L) can be removed if an MS with a mesh size between 4 and 20 µm is coupled with a PST.
3.3. COD (mg/L) and TOC (mg/L) Removal for the Influent and Effluent of PST
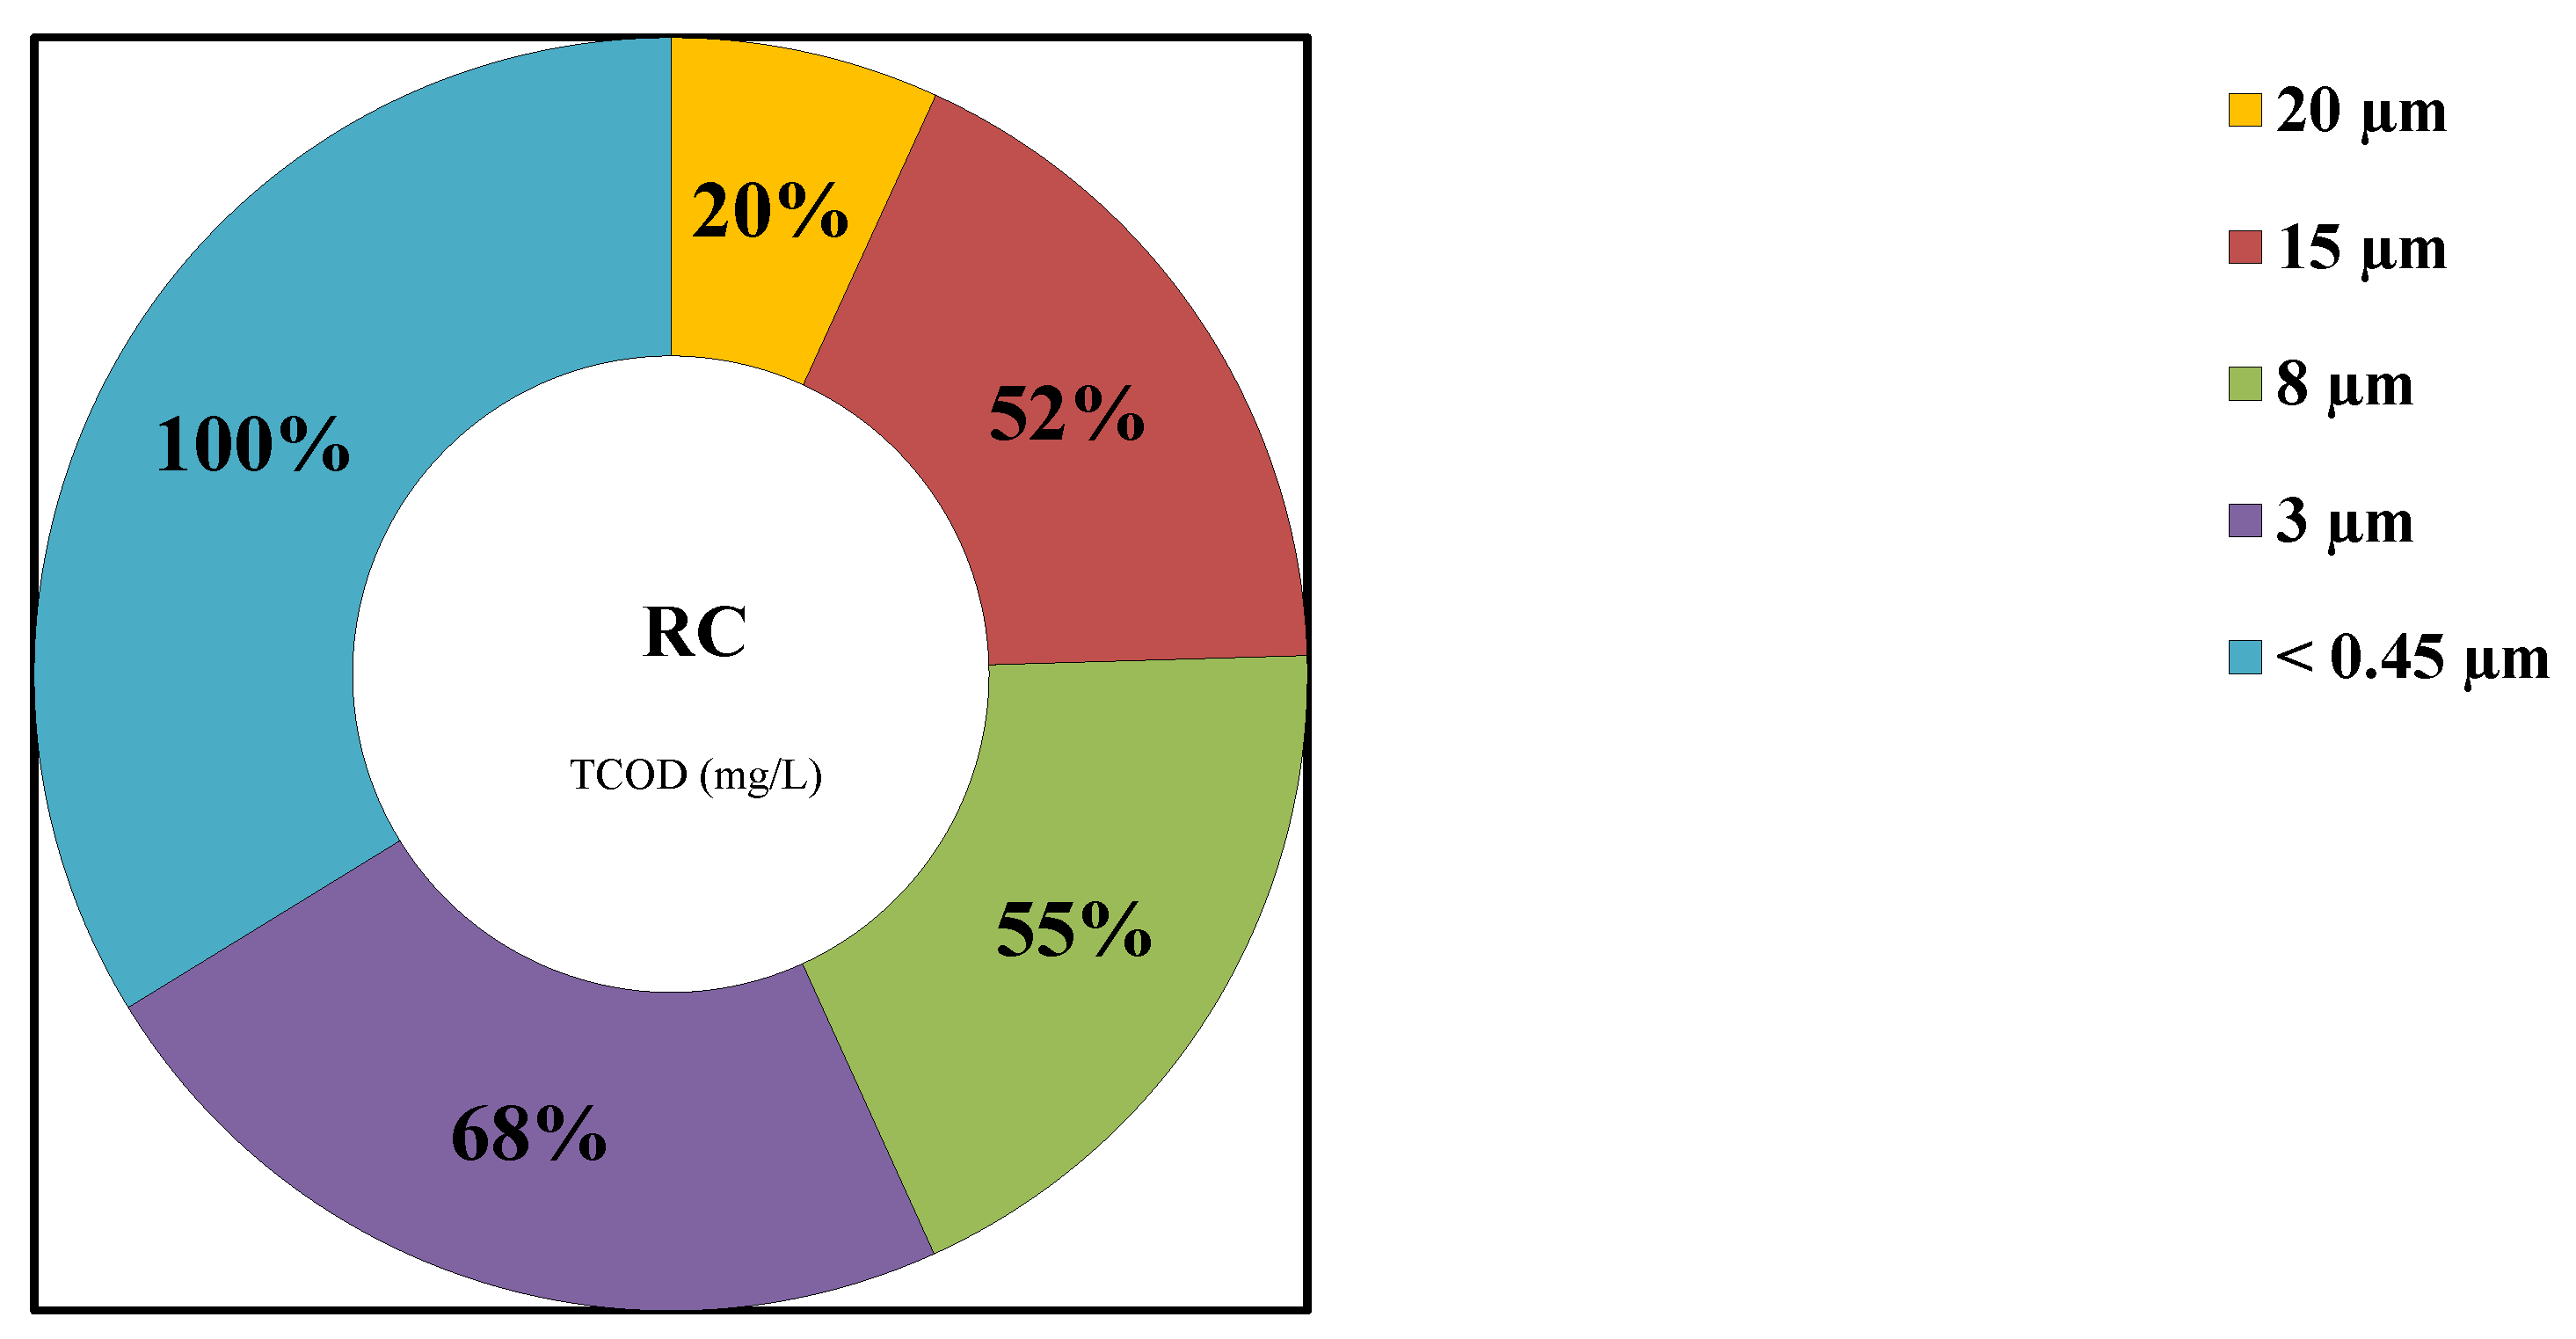
The PSD-COD fractions serve as the fingerprint for the biodegradability of wastewater [32]. It is essential to comprehend how each treatment step changes the distribution of COD (mg/L) fractions in that unit and how this influences the downstream treatment stages for an integrated treatment process [44]. Figure 4 demonstrates the correlation between PSD and TCOD (mg/L) fractionation as an index for biological treatability by drawing a correlation between particulate organic matter and total COD (mg/L) or TOC (mg/L) amounts. Results acquired through PSD-TCOD (mg/L) analyses depict distinct illustrations for municipal sewage. PSD-TCOD (mg/L) fractionation analyses specify the size interval consisting of both the soluble COD (mg/L) and the particulate range above 0.45 µm. Primarily, one of the basic understandings of designing and modeling PST has been the introduction of several COD (mg/L) fractions following PSD [45]. If TCOD (mg/L) is picked up for the PSD analyses, the major part of COD (mg/L) appears at the size ranges above 0.45 µm, and only a relatively small quantity is in the soluble range (<0.45 µm). However, this ratio changes marginally for the influent and effluent of PST. The TCOD (mg/L) ratio is divided into about 65% particulate and 35% soluble COD (mg/L). Results of this part revealed that treatment of raw WW only by using a PST can effectively eliminate a major part of particulate COD (mg/L). Moreover, the COD (mg/L) profile demonstrated in this study is in line with some of the values outlined by Levine et al. [17], who reviewed multiple studies on PSD for different types of domestic sewage. In this study, significant fractions (about 50%) of TCOD (mg/L) were shown to be in size intervals of >1 5µm, presumably due to the high availability of organic material in this range. Part 3.4 of this study will be dedicated specifically to this context.
Remark: Multiple experiments were performed to determine TOC (mg/L) variation for PSTin and PSTout; however, due to a blockage of the sampling needle, TOC measurement could not be completed successfully, and so its results were not reported in this study.
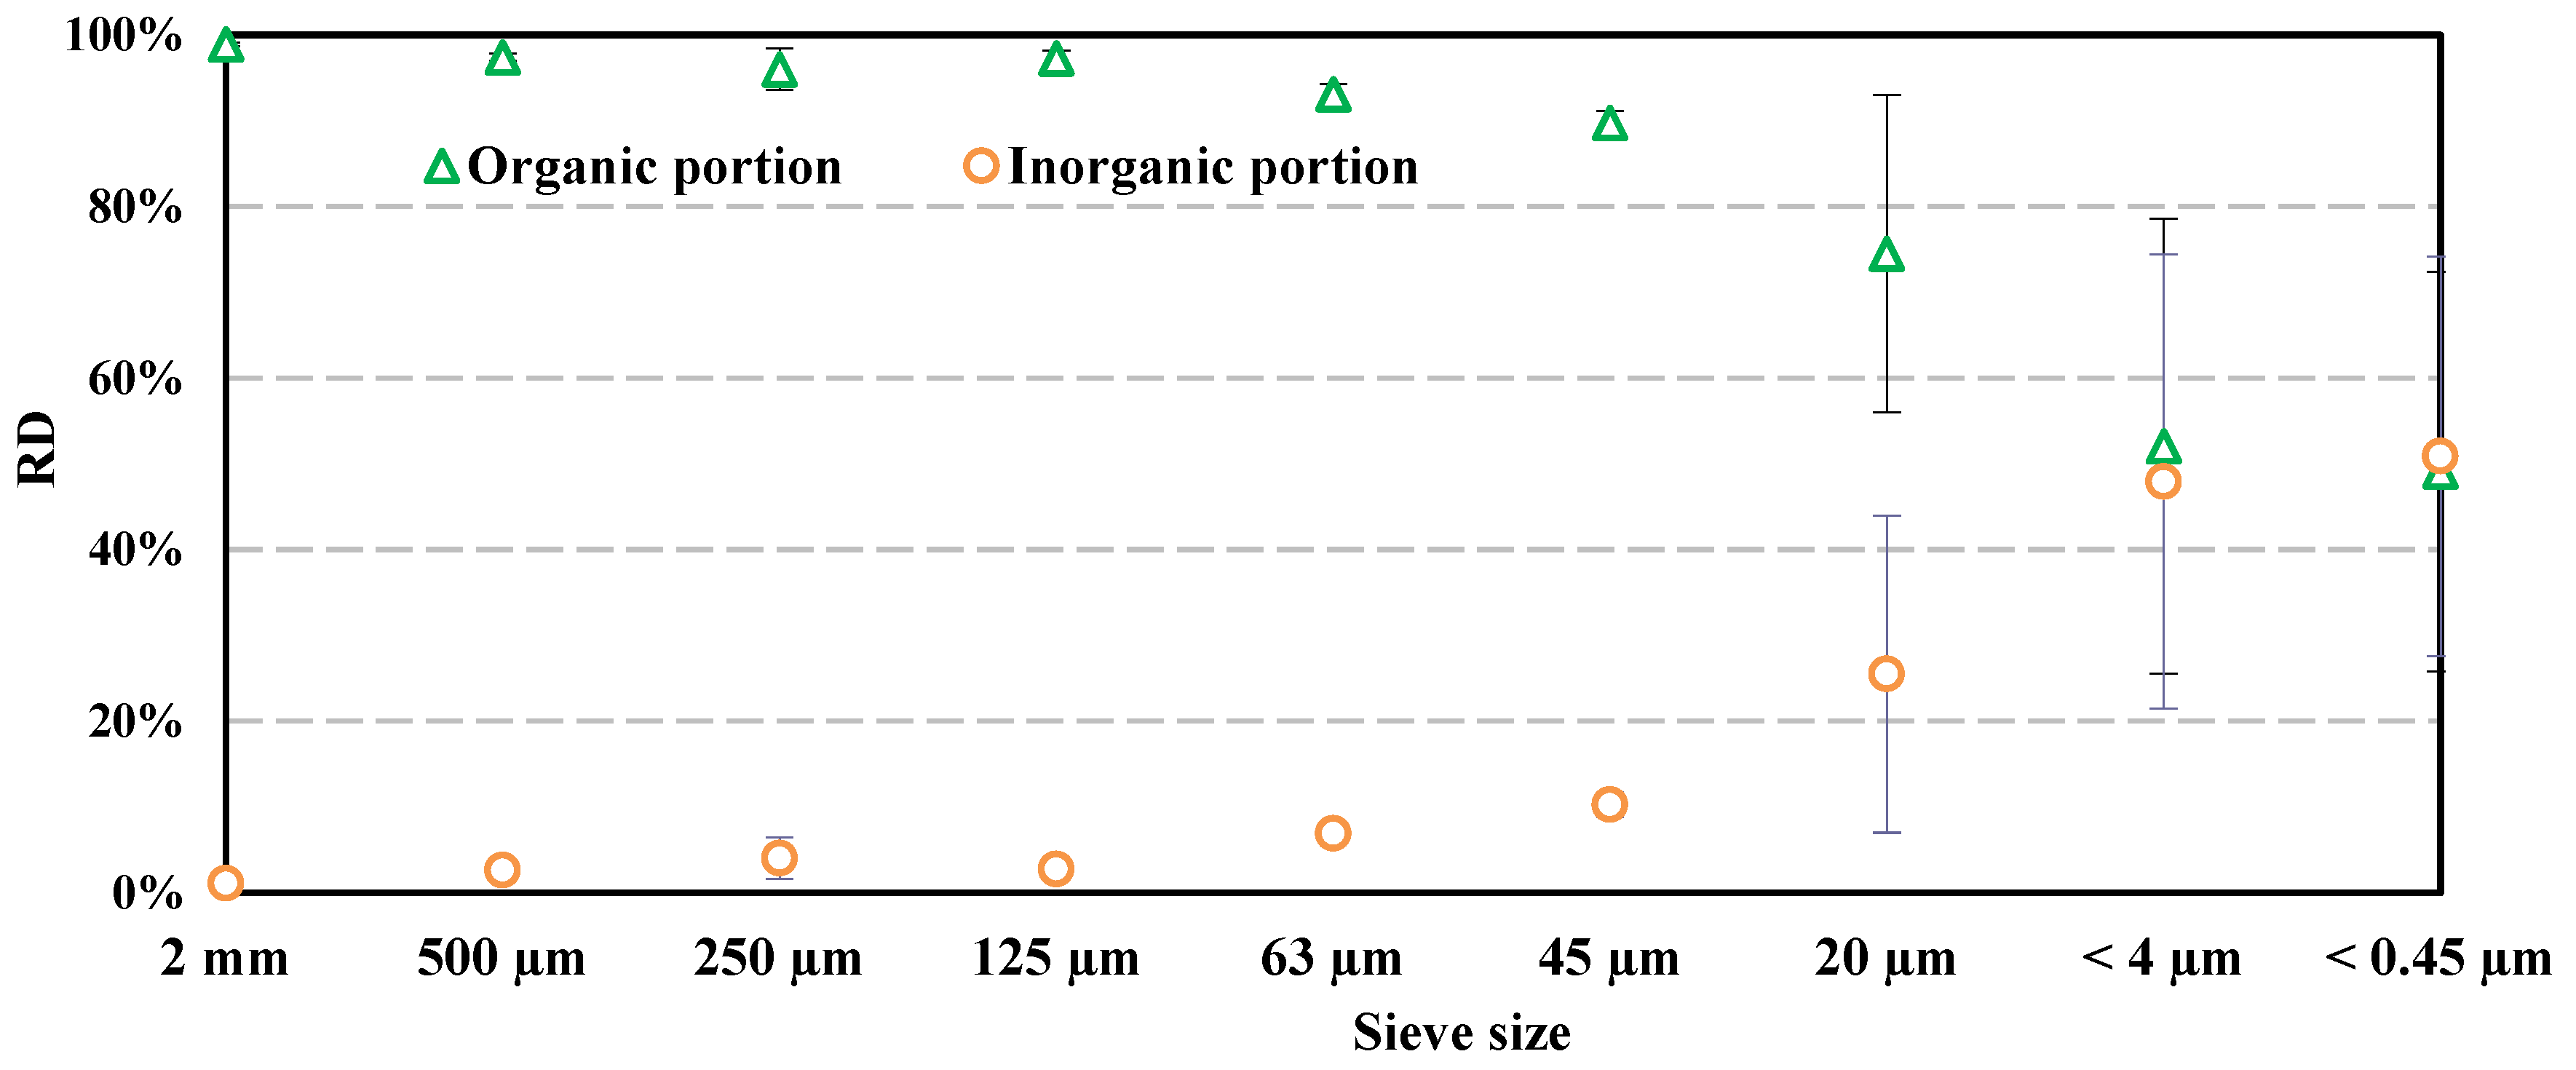
3.4. Organic and Inorganic Portion of the Influent and Effluent of PST
The organic and inorganic compositions of solids in municipal wastewater and domestic primary effluent are understood only to some extent. Defining the total amount of organic or inorganic matter in wastewater is essential for developing a clear understanding of treatment processes. Some researchers, such as Raunkjer et al. and Kunwar et al., [46,47] have documented that organic matter in wastewater is represented by COD, TOC, and BOD fractions. However, a more explicit classification based on soluble/particulate fractionation and PSD analyses is labor intensive; therefore, it has received limited attention. It is clearly seen in Figure 5 that the particulate solids were dominantly organic, but the dissolved solids were greatly inorganic (for instance, neutral salts such as sodium chloride (NaCl) or sodium sulfate (Na2SO4)). The largest group of organic matter found in the studied municipal wastewater was toilet paper, which consists of cellulose fibers. Our observations agree with the findings of work conducted by Hong-huang et al. [19]. Results of this study also indicated that treatment by PST was extensively more efficient in decreasing the concentration of particulate organics than in reducing the concentration of soluble organics. Nevertheless, the organic material share of the particulate matter is reduced by decreasing particle size. For instance, this ratio drops from 100% to 70% if the particle size reduces from 2 mm to 10 µm, presumably due to the lack of availability of cellulose fibers in smaller fractions. It is clear from the results that most of the organic matter is in particulate form and is suitable to be extracellularly hydrolyzed prior to any metabolism by bacteria. The primary and microsieved sludge could be used for hydrolysis; therefore, a meticulous specification of particulate organic or inorganic matter in wastewater could help us enhance solid–liquid separation and further planned biological processes. According to this study’s observations, the organic contents (Figure 5) differed based on PSD brought into comparison with measured COD (mg/L) (Figure 4) in the corresponding fractions. In favor of solid–liquid separation, PSD analyses guide us towards the better design and operation of biological treatment steps such as the biological hydrogen production process or activated sludge [26]. For instance, the batch reactor for POC hydrolysis could be designed with a higher retention time and volume if wastewater were mainly composed of large particles with slow hydrolysis rates.
Remark: The deviation observed in the results of <20 µm samples can be due to scale errors resulting from the low amount of sample available after being ignited in the oven.
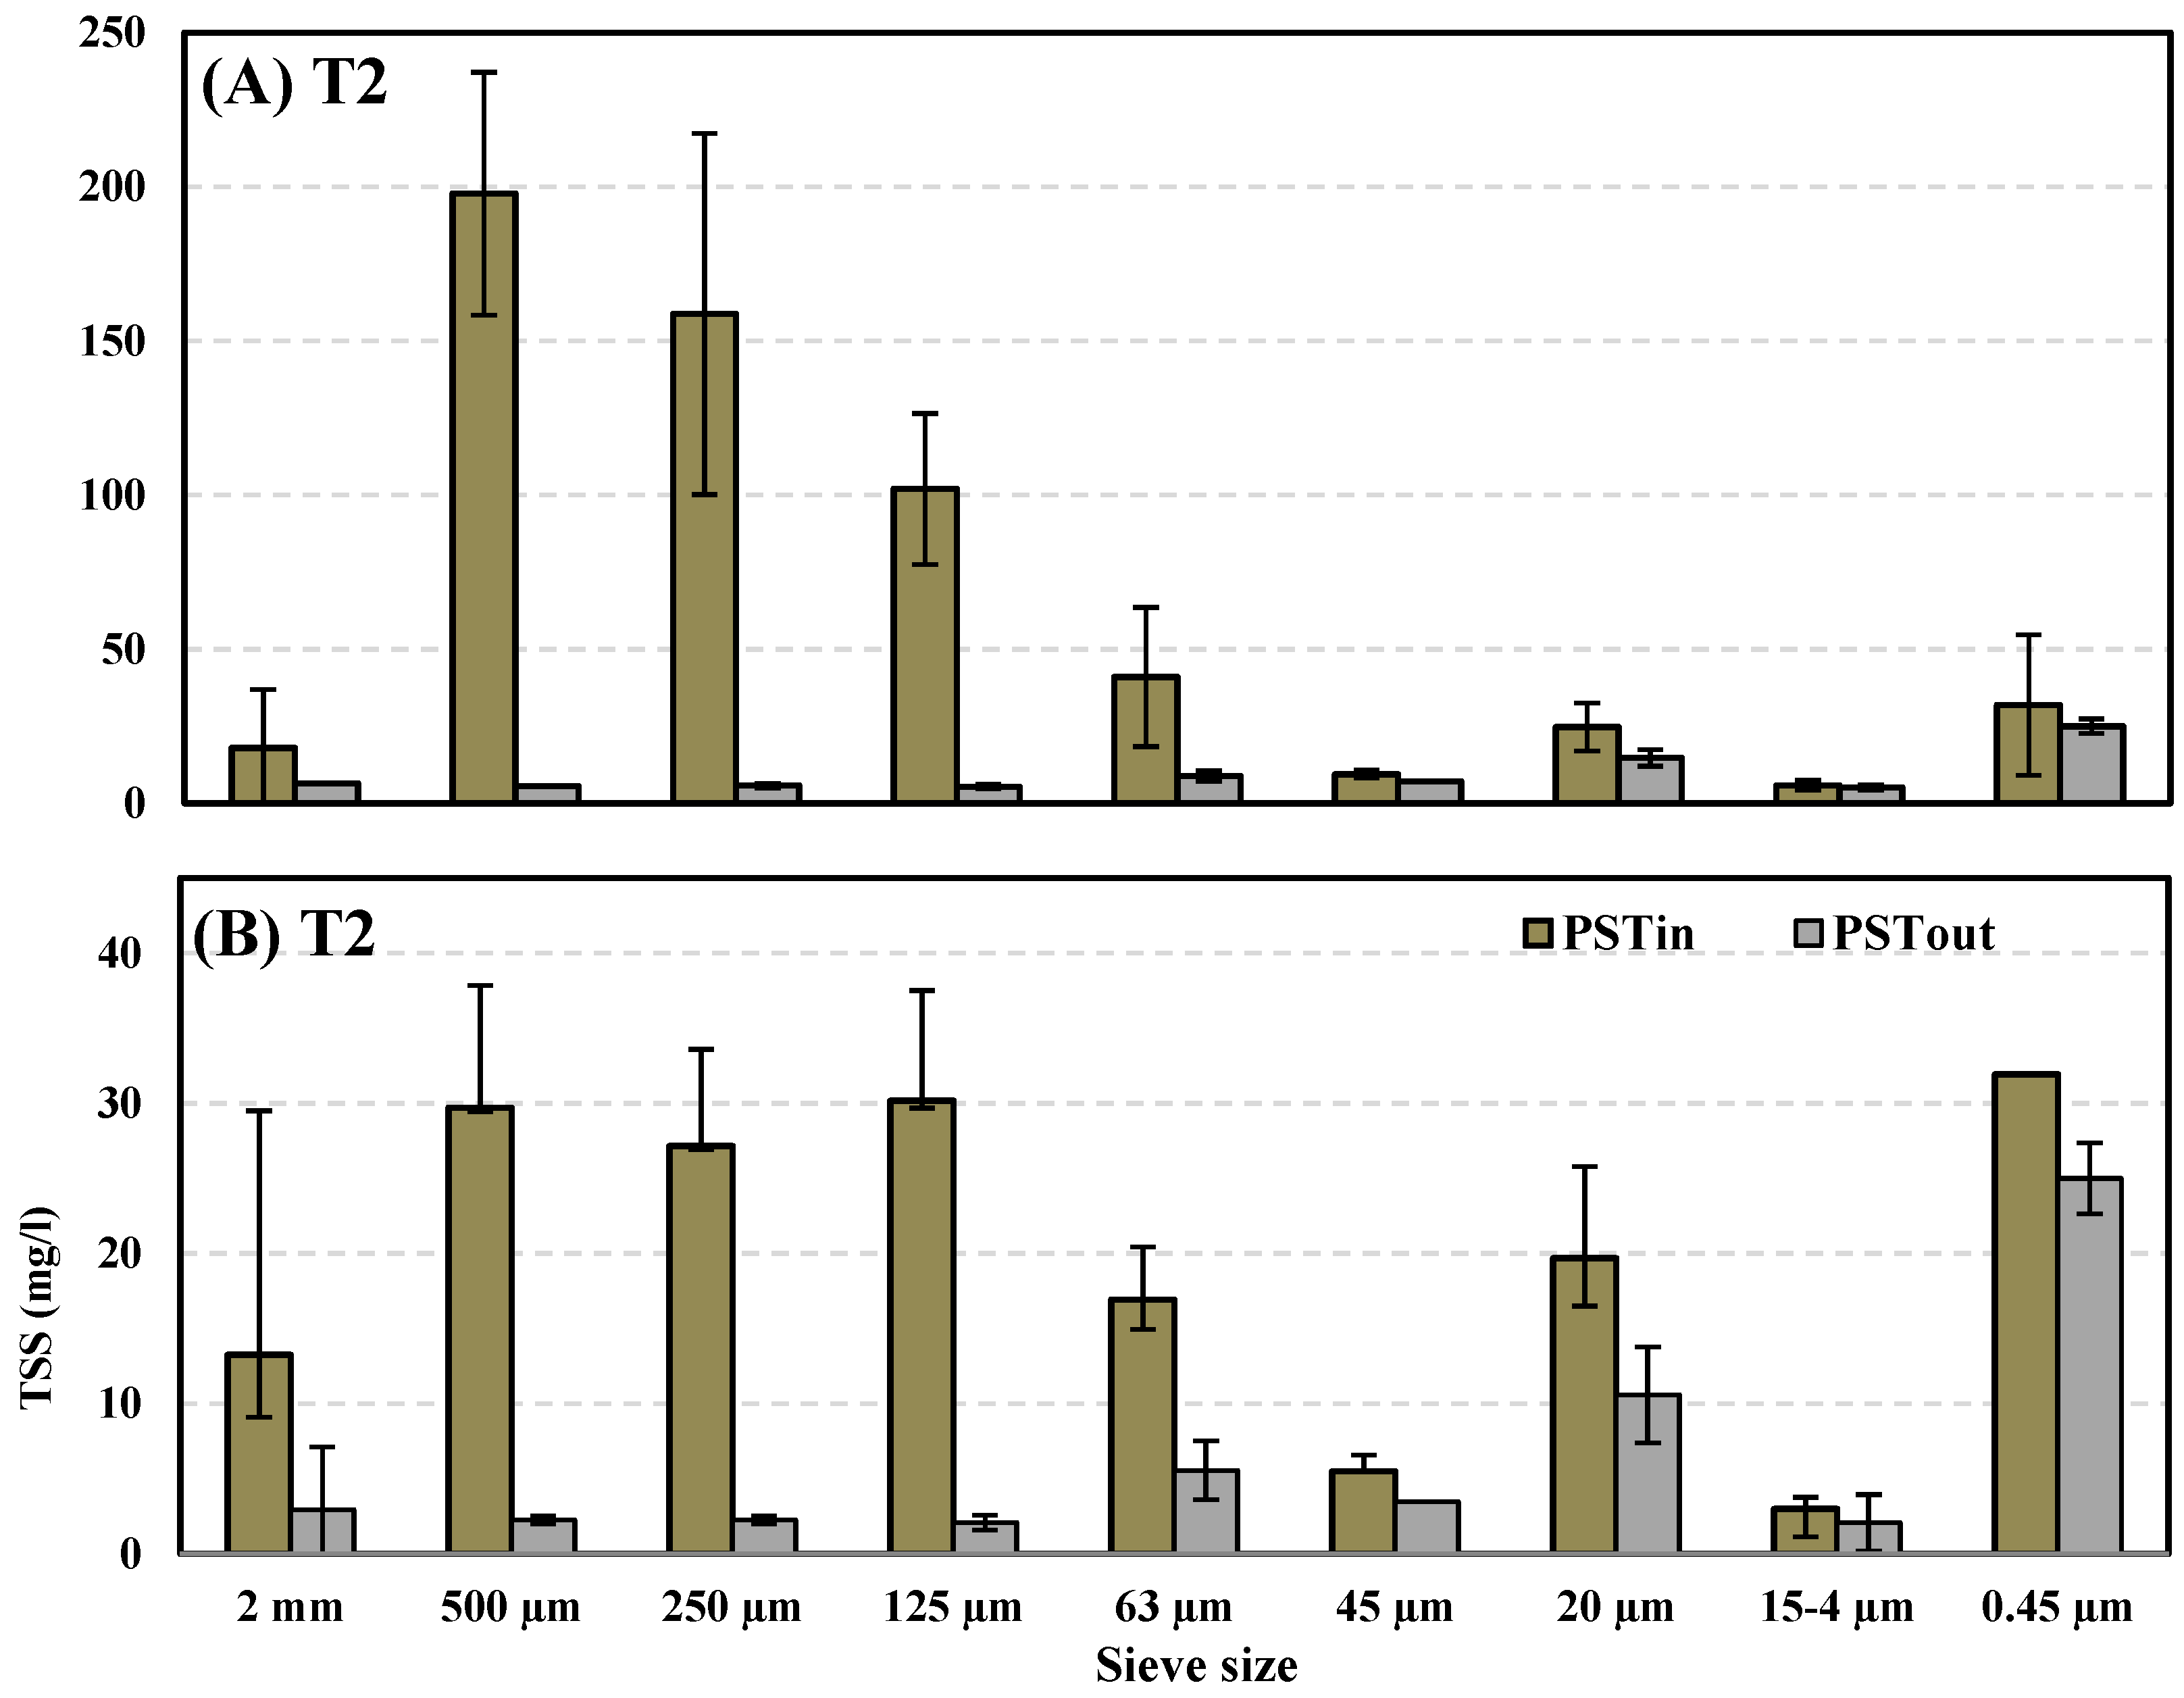
3.5. Optimal Measuring Method and Classification
As far as the applied method is concerned, three different methods were applied in this study, including two dry methods (T1 and T2) and one direct measurement (wet method/T3). A comparison between T1 and T2 applied based on the TSS (mg/L) removal efficiency of PST is presented in Figure 6. T1 was excluded from the analyses due to the high discrepancy of its results with the other two methods. Indeed, the samples contain a high amount of water; so, by taking them into consideration, the wrong conclusion can be drawn. As shown in Figure 6, both dry methods followed the same pattern for TSS (mg/L) removal efficiency. However, the results showed a 20–30% discrepancy for TSS (mg/L) removal depending on the method applied. So, it is important to note that when choosing the best mesh size for MS, TSS (mg/L) removal can be underestimated or overestimated depending on method applied. The bigger the mesh size, the higher the deviation. This 20–30% discrepancy in the results presumably stems from the evaporation of volatile organic matter due to the samples drying in the oven compared to drying conditions at room temperature. The literature survey showed that no study conducted on PSD considered this an important factor. So, the question is whether dry analyses at room temperature can be substituted for, or considered an alternative to, the oven drying method for purposes such as TSS (mg/L) measurements. In addition, based on the results of this study, the rational classification for PSD in municipal wastewaters is suggested as follows: settleable solids ≥ 100 µm, 100 µm > supracolloidal solids, colloidal solids ≥ 0.45µm, and dissolved solids < 0.45 µm, in given order.
4. Conclusions
In this study, the conventional PSD method was creatively modified for analyzing POC (mg/L), TCOD (mg/L), and the organic and inorganic portions of PSTin and PSTout. Based on the obtained results, the following conclusions can be drawn:
- In-depth investigations on solid–liquid separation at WWTPs can be realized by applying the modified PSD analyses introduced in this study to select the prevailing compositions of the organic matter entering biological treatment steps;
- By conducting PSD analyses, it was observed that drying the samples in the oven can result in a 20–30% deviation from the POC (mg/L) removal results. The bigger the sieve size, the higher the deviation. Therefore, for PSD analyses, it is recommended to dry the samples at room temperature rather than in the oven;
- The idea of substituting PSTs with an MS can be supported by the results of this study. According to the results obtained, an MS with a pore size of 45 to 63 µm can provide the same elimination efficiency as a PST, even with a low maintenance cost and the capability of being adjusted by population growth;
- By introducing suitable MS as an alternative for PSTs, toilet paper (cellulose fibers) can be readily extracted from raw wastewater and used for flocculants and activated carbon production;
- When retrofitting the existing WWTP was being considered, the idea of coupling PST and MS showed itself to be a potential option. The results showed that approx. 50 to 70% of POC (mg/L) in the effluent of PST can be removed if it is coupled with an MS with a mesh size selected between 4 and 20 µm. TCOD (mg/L) of wastewater before PST showed it to be about 65% particulate and 35% soluble. Since there is a direct correlation between particulate COD (mg/L) and POC (mg/L), by removing the dominant part of POC, which was found to be organic and made of toilet paper, a significant fraction of COD (about 50%) could be removed by the suggested arrangement;
- The recommendations for the classification of PSD in municipal wastewaters are as follows: settleable solids ≥ 100 µm, 100 µm > supracolloidal solids, colloidal solids ≥ 0.45 µm, and dissolved solids < 0.45 µm, in the given order.
Supplementary Materials
The following supporting information can be downloaded at: https://www.mdpi.com/article/10.3390/w15101861/s1.
Author Contributions
Conceptualization, B.A.L. and P.M.; methodology, B.A.L. and P.M.; software, B.A.L.; validation, B.A.L., P.M. and H.S.; formal analysis, B.A.L.; investigation, B.A.L.; writing—original draft preparation, B.A.L.; writing—review and editing, B.A.L. and H.S.; visualization, B.A.L.; supervision, P.M. and H.S. All authors have read and agreed to the published version of the manuscript.
Funding
This publication was funded by the German Research Foundation (DFG) grant “Open Access Publication Funding/2023–2024/University of Stuttgart” (512689491).
Data Availability Statement
The datasets used and/or analyzed during the current study are available from the corresponding author on reasonable request.
Acknowledgments
First of all, the authors would like to express their sincerest thanks to the Baden-Württemberg Ministry for the Environment, Climate and Energy Management and the European Union (EU) for funding the project KoalAplan (1 April 2022, https://www.iswa.uni-stuttgart.de/aktuelles/news/Start-fuer-Bioraffinerie-Projekt-zur-Gewinnung-von-Rohstoffen-aus-Abwasser/). In addition, special thanks go to the workers, the colleagues of LFL lab, and WWTP Büsnau operated by the University of Stuttgart, and also the partners of the project for their constant support.
Conflicts of Interest
The authors state that they have no known competing financial interest or personal tie that would appear to have influenced the work disclosed in this study.
Abbreviations
| Symbol | Definition | Symbol | Definition |
| BOD | Biochemical Oxygen Demand | Na2SO4 | Sodium sulfate |
| °C | Degree Celsius | Out. | Outflow |
| COD | Chemical Oxygen Demand | P | Phosphorus |
| DOC | Dissolved Organic Carbon | PID | Piping and instruction design |
| EU | European Union | PSTin | Inflow of primary sedimentation tank |
| Fig. | Figure | PSTout | Outflow of primary sedimentation tank |
| h | Hour | PSD | Particle size distribution |
| H | Hydrogen | POC | Particulate organic carbon |
| HRT | Hydraulic retention time | PST | Primary sedimentation tank |
| In. | Inflow | SS | Suspended solids |
| L | Liter | TSS | Total suspended solids |
| m3 | Cubic metre | TS | Total solids |
| mg/L | Milligrams per liter | VS | Volatile solids |
| mL | Milliliter | WW | Wastewater |
| Min | Minutes | WWTP | Wastewater treatment plant |
| N | Nitrogen | µm | Micrometer/Micron |
References
- Vörösmarty, C.J.; McIntyre, P.B.; Gessner, M.O.; Dudgeon, D.; Prusevich, A.; Green, P.; Glidden, S.; Bunn, S.E.; Sullivan, C.A.; Liermann, C.R.; et al. Global threats to human water security and river biodiversity. Nature 2010, 467, 555–561. [Google Scholar] [CrossRef] [PubMed] [Green Version]
- Peñuelas, J.; Poulter, B.; Sardans, J.; Ciais, P.; Van Der Velde, M.; Bopp, L.; Boucher, O.; Godderis, Y.; Hinsinger, P.; Llusia, J.; et al. Human-induced nitrogen–phosphorus imbalances alter natural and managed ecosystems across the globe. Nat. Commun. 2013, 4, 2934. [Google Scholar] [CrossRef] [Green Version]
- Tong, Y.; Bu, X.; Chen, J.; Zhou, F.; Chen, L.; Liu, M.; Tan, X.; Yu, T.; Zhang, W.; Mi, Z.; et al. Estimation of nutrient discharge from the Yangtze River to the East China Sea and the identification of nutrient sources. J. Hazard. Mater. 2017, 321, 728–736. [Google Scholar] [CrossRef] [PubMed]
- Wen, Y.; Schoups, G.; van de Giesen, N. Organic pollution of rivers: Combined threats of urbanization, livestock farming and global climate change. Sci. Rep. 2017, 7, 43289. [Google Scholar] [CrossRef] [PubMed] [Green Version]
- Bao, W.; Zhu, S.; Guo, S.; Wang, L.; Huang, S.; Fu, J.; Ye, Z. Particle size distribution mathematical models and properties of suspended solids in a typical freshwater pond. Environ. Pollut. 2018, 241, 164–171. [Google Scholar] [CrossRef]
- Wang, M.; Xu, X.; Wu, Z.; Zhang, X.; Sun, P.; Wen, Y.; Wang, Z.; Lu, X.; Zhang, W.; Wang, X.; et al. Seasonal Pattern of Nutrient Limitation in a Eutrophic Lake and Quantitative Analysis of the Impacts from Internal Nutrient Cycling. Environ. Sci. Technol. 2019, 53, 13675–13686. [Google Scholar] [CrossRef]
- Sonune, A.; Ghate, R. Developments in wastewater treatment methods. Desalination 2004, 167, 55–63. [Google Scholar] [CrossRef]
- Yan, B.; Liu, C.; Xu, S.; Zhou, J.; Wong, J.; Zhang, J. Bioconversion Technologies: Anaerobic Digestion of Food Waste. In Current Developments in Biotechnology and Bioengineering; Elsevier: Amsterdam, The Netherlands, 2021; pp. 163–204 . [Google Scholar] [CrossRef]
- Gikas, P. Towards energy positive wastewater treatment plants. J. Environ. Manag. 2017, 203, 621–629. [Google Scholar] [CrossRef]
- Awual, M.R.; Huq, A.; Islam, A.; Rahman, M.A.; El-Shafey, E.I.; Uddin, M.T.; Rahman, M.M.; Hasan, Z. Polycyclic aromatic hydrocarbons removal using mesoporous materials: A review. J. Environ. Manag. 2021, 278, 111544. [Google Scholar]
- Awual, M.R.; Huq, A.; Islam, A.; Rahman, M.A.; El-Shafey, E.I.; Uddin, M.T.; Rahman, M.M.; Hasan, Z. Fabrication and characterization of novel hierarchical TiO2/PAN hollow fiber composite membranes for the efficient removal of heavy metals from contaminated water. J. Chem. Eng. 2021, 404, 127033. [Google Scholar]
- Awual, M.R.; Rahman, M.A.; Hasan, Z.; Islam, A.; El-Shafey, E.I.; Khaleque, M.A. Facile synthesis of high-performance α-Fe2O3 nanoparticle-doped polyethersulfone ultrafiltration membranes for efficient removal of organic and inorganic pollutants. J. Chem. Eng. 2020, 397, 125421. [Google Scholar]
- Kuśnierz, M.; Wiercik, P. Analysis of particle size and fractal dimensions of suspensions contained in raw sewage, treated sewage and activated sludge. Arch. Environ. Prot. 2016, 42, 67–76. [Google Scholar] [CrossRef] [Green Version]
- Wang, Z.; Zheng, P. Predicting settling performance of ANAMMOX granular sludge based on fractal dimensions. Water Res. 2017, 120, 222–228. [Google Scholar] [CrossRef] [Green Version]
- Bushell, G.; Yan, Y.; Woodfield, D.; Raper, J.; Amal, R. On techniques for the measurement of the mass fractal dimension of aggregates. Adv. Colloid Interface Sci. 2001, 95, 1–50. [Google Scholar] [CrossRef]
- Ibaseta, N.; Biscans, B. Fractal dimension of fumed silica: Comparison of light scattering and electron micro-scope methods. Powder Technol. 2010, 203, 206–210. [Google Scholar] [CrossRef]
- Levine, A.D.; Tchobanoglous, G.; Asano, T. Size distributions of particulate contaminants in wastewater and their impact on treatability. Water Res. 1991, 25, 911–922. [Google Scholar] [CrossRef]
- Levine, A.D.; Tchobanoglous, G.; Asano, T. Characterization of the size distribution of contaminants in wastewater: Treatment and reuse implications. J. Water Pollut. Control Fed. 1985, 57, 805–816. [Google Scholar]
- Marani, D.; Renzi, V.; Ramadori, R.; Braguglia, C. Size fractionation of COD in urban wastewater from a combined sewer system. Water Sci. Technol. 2004, 50, 79–86. [Google Scholar] [CrossRef]
- Martínez-González, G.; Loría-Molina, H.; Taboada-López, D.; Ramírez-Rodríguez, F.; Navarrete-Bolaños, J.L.; Jiménez-Islas, H. Approximate Method for Designing a Primary Settling Tank for Wastewater Treatment. Ind. Eng. Chem. Res. 2009, 48, 7842–7846. [Google Scholar] [CrossRef]
- Jover-Smet, M.; Martín-Pascual, J.; Trapote, A. Model of Suspended Solids Removal in the Primary Sedimentation Tanks for the Treatment of Urban Wastewater. Water 2017, 9, 448. [Google Scholar] [CrossRef]
- Huang, M.-H.; Li, Y.-M.; Gu, G.-W. Chemical composition of organic matters in domestic wastewater. Desalination 2010, 262, 36–42. [Google Scholar] [CrossRef]
- O’kelly, B.C. Geotechnics of municipal sludges and residues for landfilling. Geotech. Res. 2016, 3, 148–179. [Google Scholar] [CrossRef] [Green Version]
- Khanam, T.; Ata, W.N.S.W.; Rashedi, A. Particle Size Measurement in Waste Water Influent and Effluent Using Particle Size Analyzer and Quantitative Image Analysis Technique. Adv. Mater. Res. 2016, 1133, 571–575. [Google Scholar] [CrossRef]
- Izdori, F.; Semiao, A.J.; Perona, P. Emperical charachterization of particle size distribution spatial dynamics for helminth egg detection in waste stabilization ponds (WSP). Water 2018, 10, 138. [Google Scholar] [CrossRef] [Green Version]
- Sophonsiri, C.; Morgenroth, E. Chemical composition associated with different particle size fractions in municipal, industrial, and agricultural wastewaters. Chemosphere 2004, 55, 691–703. [Google Scholar] [CrossRef]
- Tiehm, A.; Herwig, V.; Neis, U. Particle size analysis for improved sedimentation and filtration in waste water treatment. Water Sci. Technol. 1999, 39, 99–106. [Google Scholar] [CrossRef]
- Dierickx, D.; Basu, B.; Vleugels, J.; Van der Biest, O. Statistical extreme value modeling of particle size distributions: Experimental grain size distribution type estimation and parameterization of sintered zirconia. Mater. Charact. 2000, 45, 61–70. [Google Scholar] [CrossRef]
- Patziger, M.; Kiss, K. Towards a hydrodynamically enhanced design and operation of primary settling tanks—Results of a long termin situmeasurement investigation program. Water Environ. J. 2015, 29, 338–345. [Google Scholar] [CrossRef]
- Schubert, W.; Günthert, F.W. Particle size distribution in effluent of trickling filters and in humus tanks. Water Res. 2001, 35, 3993–3997. [Google Scholar] [CrossRef]
- He, J.; Wu, C. Experimental and modeling investigation of sewage solids sedimentation based on particle Size distribution and fractal dimension. Int. J. Environ. Sci. Technol. 2010, 7, 37–46, ISSN: 1735-1472. [Google Scholar]
- Dulekgurgen, E.; Doğruel, S.; Karahan, Ö.; Orhon, D. Size distribution of wastewater COD fractions as an index for biodegradability. Water Res. 2006, 40, 273–282. [Google Scholar] [CrossRef]
- Stoller, M. On the effect of flocculation as pretreatment process and particle size distribution for membrane fouling reduction. Desalination 2009, 240, 209–217. [Google Scholar] [CrossRef]
- Cornacchia, M.; Moser, G.; Saturno, E.; Trucco, A.; Costamagna, P. Analysis of particle size distribution in municipal wastewaters. Environ. Technol. Innov. 2022, 27, 102638. [Google Scholar] [CrossRef]
- Harikumar, P.S.; Nasir, U.P.; Rahman, M.P.M. Distribution of heavy metals in the core sediments of a tropical wetland system. Int. J. Environ. Sci. Technol. 2009, 6, 225–232. [Google Scholar] [CrossRef] [Green Version]
- Aslam, M.T. Settling of Solids in Raw Wastewater—Primary Settling Tanks and Storm Water Tanks. Ph.D. Thesis, Technical University of Graz, Graz, Austria, 2013. [Google Scholar]
- Schmidt-Bregas, F. Über die Ausbildung von rechteckigen Absetzbecken für häusliche Abwässer. Ph.D. Thesis, Technische Hochschule Hannover, Hannover, Germany, 1957. [Google Scholar]
- Vicuinik, R. Investigations on the Dynamic of Sedimentation Processes in Settling Tanks. Ph.D. Thesis, Technical University of Graz, Graz, Austria, 2013. [Google Scholar]
- Griek, H.; Hankinson, P. Wastewater Treatment, Nutrient Factory. A Research Project. Delft Blue Innovations and HZ University of Applied Sciences. Available online: https://www.delftblueinnovations.nl/nl/research/research-view/?rs=18 (accessed on 1 April 2023).
- Benstoem, F.; Becker, G.; Firk, J.; Kaless, M.; Wuest, D.; Pinnekamp, J.; Kruse, A. Elimination of micropollutants by activated carbon produced from fibers taken from wastewater screenings using hydrothermal carbonization. J. Environ. Manag. 2018, 211, 278–286. [Google Scholar] [CrossRef]
- Remy, C.; Boulestreau, M.; Lesjean, B. Proof of concept for a new energy-positive wastewater treatment scheme. Water Sci. Technol. 2014, 70, 1709–1716. [Google Scholar] [CrossRef]
- Kängsepp, P.; Väänänen, J.; Örning, K.; Sjölin, M.; Olsson, P.; Rönnberg, J.; Wallebäck, F.; Cimbritz, M.; Pellicer-Nàcher, C. Performance and operating experiences of the first Scandinavian full-scale disc filter installation for tertiary phosphorus polishing with preceding coagulation and flocculation. Water Pract. Technol. 2016, 11, 459–468. [Google Scholar] [CrossRef]
- Vaananen, J.; Cimbritz, M.; La cour-Jansen, J. Microsieving in primary treatment: Effect of chemical dosing. J. Water Sci. Technol. 2016, 74, 438–447. [Google Scholar] [CrossRef]
- Arimi, M.M. Particle size distribution as an emerging tool for the analysis of wastewater. Environ. Technol. Rev. 2018, 7, 274–290. [Google Scholar] [CrossRef]
- Henze, M.; Gujer, W.; Mino, T.; van Loosdrecht, M.C.M. Activated Sludge Models ASM1, ASM2, ASM2d, and ASM3; Scientific and Technical Report No. 9. Available online: https://doi.org/10.2166/9781780402369 (accessed on 1 April 2023). [CrossRef]
- Raunkjer, K.; Thorkild, H.J.; Nielsen, P.H. Measurement of pools of protein, carbohydrate and lipids in domestic wastewater. J. Water Res. 1994, 28, 251–262. [Google Scholar] [CrossRef]
- Kunwar, P.S.; Amrita, M.; Dinesh, M.; Sarita, S.; Singh Vinod, K. Chemometric data analysis of pollutants in wastewater-a case study. J. Anal. Chim. Acta 2005, 532, 15–25. [Google Scholar]
Figure 1.
PID of primary treatment step of WWTP Büsnau, Stuttgart, Germany, along with detailed setup for PSD analyze (1 h < HRT in PST < 5 h).
Figure 1.
PID of primary treatment step of WWTP Büsnau, Stuttgart, Germany, along with detailed setup for PSD analyze (1 h < HRT in PST < 5 h).

Figure 2.
TSS (mg/L) removal (A) and concentration (B) versus different mesh sizes of sieve—PSTin.

Figure 3.
TSS (mg/L) removal (A) and concentration (B) versus different mesh sizes of sieve—PSTout.

Figure 4.
TCOD (mg/L) removal efficiency versus different mesh sizes of sieve—PSTin and PSTout.

Figure 5.
Removal rates for organic-inorganic contents versus different mesh sizes—PSTin and PSTout.
Figure 5.
Removal rates for organic-inorganic contents versus different mesh sizes—PSTin and PSTout.

Figure 6.
TSS (mg/L) removal rates of PST—T2 (A) and T3 (B).

Disclaimer/Publisher’s Note: The statements, opinions and data contained in all publications are solely those of the individual author(s) and contributor(s) and not of MDPI and/or the editor(s). MDPI and/or the editor(s) disclaim responsibility for any injury to people or property resulting from any ideas, methods, instructions or products referred to in the content. |
© 2023 by the authors. Licensee MDPI, Basel, Switzerland. This article is an open access article distributed under the terms and conditions of the Creative Commons Attribution (CC BY) license (https://creativecommons.org/licenses/by/4.0/).
Share and Cite
MDPI and ACS Style
Askari Lasaki, B.; Maurer, P.; Schönberger, H. A Fundamental Study on the Extraction of Particulate Organic Carbon from Municipal Wastewater Treatment Plants. Water 2023, 15, 1861. https://doi.org/10.3390/w15101861
AMA Style
Askari Lasaki B, Maurer P, Schönberger H. A Fundamental Study on the Extraction of Particulate Organic Carbon from Municipal Wastewater Treatment Plants. Water. 2023; 15(10):1861. https://doi.org/10.3390/w15101861
Chicago/Turabian StyleAskari Lasaki, Behnam, Peter Maurer, and Harald Schönberger. 2023. "A Fundamental Study on the Extraction of Particulate Organic Carbon from Municipal Wastewater Treatment Plants" Water 15, no. 10: 1861. https://doi.org/10.3390/w15101861
Note that from the first issue of 2016, this journal uses article numbers instead of page numbers. See further details here.