
Moisture Sources and Rainfall δ18O Variability over the Central Andes of Peru—A Case Study from the Mantaro River Basin


1
Instituto Geofísico del Perú, Lima 15012, Peru
2
Programa de Maestria en Recursos Hídricos, Universidad Nacional Agraria La Molina, Lima 15024, Peru
3
Department of Atmospheric and Environmental Sciences, University at Albany, Albany, NY 12226, USA
4
Institute of Geosciences, University of São Paulo, São Paulo 05508-080, Brazil
*
Author to whom correspondence should be addressed.
Water 2023, 15(10), 1867; https://doi.org/10.3390/w15101867
Submission received: 13 April 2023
/
Revised: 2 May 2023
/
Accepted: 4 May 2023
/
Published: 15 May 2023
(This article belongs to the Section Hydrology)
Abstract
:The Mantaro River Basin is one of the most important regions in the central Peruvian Andes in terms of hydropower generation and agricultural production. Contributions to better understanding of the climate and hydrological dynamics are vital for this region and constitute key information to support regional water security and socioeconomic resilience. This study presents eight years of monthly isotopic precipitation information (δ18O, Dxs) collected in the Mantaro River Basin. The isotopic signals were evaluated in terms of moisture sources, including local and regional climatic parameters, to interpret their variability at monthly and interannual timescales. It is proposed that the degree of rainout upstream and the transport history of air masses, also related to regional atmospheric features, are the main factors influencing the δ18O variability. Moreover, significant correlations with precipitation amount and relative humidity imply that local processes in this region of the Andes also exert important control over isotopic variability. Two extreme regional climate events (the 2010 drought and the 2017 coastal El Niño) were evaluated to determine how regional atmospheric circulation affects the rainfall isotope variability. Based on these results, recommendations for hydroclimate studies and paleoclimate reconstructions are proposed in the context of the Mantaro River Basin. This study intends to encourage new applications considering geochemical evidence for hydrological studies over the central Andean region.
1. Introduction
The central Andean region of Peru has been the focus of several studies documenting important changes in climate variability that have occurred in recent decades. In this context, the Mantaro River Basin (MRB) has received special attention since it is an important region of Peru in terms of energy and agricultural production. Hydroelectric plants in the MRB produce nearly 35% of the electrical energy of the country and the region’s agricultural production also sustains the large consumption of the capital, Lima, which houses around 10 million people [1], or more than a third of the country’s population [2].
With that assessment, rainfall plays a decisive role in many economic activities over the MRB, but special attention must be paid to agriculture, in which 71% of the arable land (339.065 hectares) depends on the rainfall regime [3]. Therefore, the greatest climatic hazards to agriculture in this region stem from extreme climate events, such as droughts and floods, which in turn have motivated several studies to document these events, including frosts and landslides and their impacts [4,5,6,7,8].
In fact, the entire region has experienced a reduction in precipitation (−5.6 mm/decade) over the past decade. This reduction has also been accompanied by changes in the rainy season’s duration. Over the past four decades, a reduction of 3 days/decade in the duration of the wet season over the MRB has been observed, resulting from a delay in the onset days [9]. Furthermore, internal modes of variability, such as El Niño/Southern Oscillation (ENSO), influence its onset and duration. It has been argued that El Niño favors a late onset and an early end of the rainy season, while La Niña favors an early onset and late end of the rainy season in the MRB [9]. The relationship between the MRB and ENSO at interannual timescales has also been explored [10,11,12], showing below-normal rainfall episodes during the warm phase (El Niño) and above-normal precipitation during the cold phase (La Niña). In fact, the impact of ENSO on precipitation is highly significant in the MRB during the austral spring and early summer, and to a lesser extent also during winter [13]. At decadal timescales, a recent study evidenced the existence of a decadal signal of 10–13 years in the central Andes (above 1500 m a.s.l.) associated with decadal SST variability in the central and eastern Pacific [14]. At longer timescales, there are pieces of evidence from the surrounding regions that indicate significant multidecadal variability related to the Atlantic Multidecadal Oscillation [15]. In addition, warm SST anomalies in the western Pacific inhibit rainfall in the Central Peruvian Andes on interdecadal timescales above 20 years (e.g., [16,17]). There is a strong consensus that any contributions to understanding the dynamics of precipitation in the valley will constitute key information to support regional water security and socioeconomic resilience [1].
Given the importance of rainfall variability over the MRB, it is necessary to understand the physical mechanisms associated with the prevailing climatic conditions. There are many studies related to extreme events in the region based on in situ station data and regional numerical models [3,8,18,19]. However, additional evidence can be gleaned from studying the stable oxygen isotopic composition of rainfall, such as oxygen (δ18O), in meteoric waters. This geochemical tracer is a useful instrument with which to determine moisture sources (e.g., [20,21]) and paleoclimate conditions (e.g., [22,23]) as demonstrated in previous investigations conducted in the Andean region (e.g., [24]).
Recent studies that have revisited the stable isotopic composition of precipitation (δ18O and δD) along the central Andes have considered that the atmospheric monsoon convection controls the isotopic composition of water vapor in austral summer (e.g., [25]), while large-scale advective mixing provides an additional control, especially in austral winter [26,27]. Furthermore, some studies have considered elevation to be a relevant control of δ18O since it determines the degree of orographic lifting, condensation, and rainout across the Andean region (e.g., [21,27,28,29]. However, it is also important to mention the role of local-scale effects on δ18O variability on short timescales in many regions of the Andes (e.g., [29]). In general, multiple pieces of evidence suggest that δ18O and δ2H reflect a combination of local precipitation microphysics (e.g., [30]), moisture source (e.g., [31]), upstream water vapor isotopic composition [26,32], and cloud type (e.g., [33]). Studies focusing on the isotopic signals in meteoric waters will be helpful for understanding current atmospheric and hydrological dynamics and will constitute a benchmark for isotope-enabled modeling studies. Indeed, the creation of a baseline for interpreting isotopes in precipitation is essential for calibrating geochemical signals in paleoclimatic records (biological or geological). Such information is required for better understanding of past climate variability and to document the magnitude and recurrence of extreme climate events in the central Andes.
The present study was based on an eight-year-long period of monitoring stable isotopes (δ18O and δD) in rainfall at two locations within the MRB. The data were used to analyze the influences of local- to regional-scale environmental factors, with the goal of contributing new information required for paleohydrological reconstructions, water balance analyses, and the management of future environmental hazards over the MRB.
2. Materials and Methods
2.1. Study Area and Climate Features
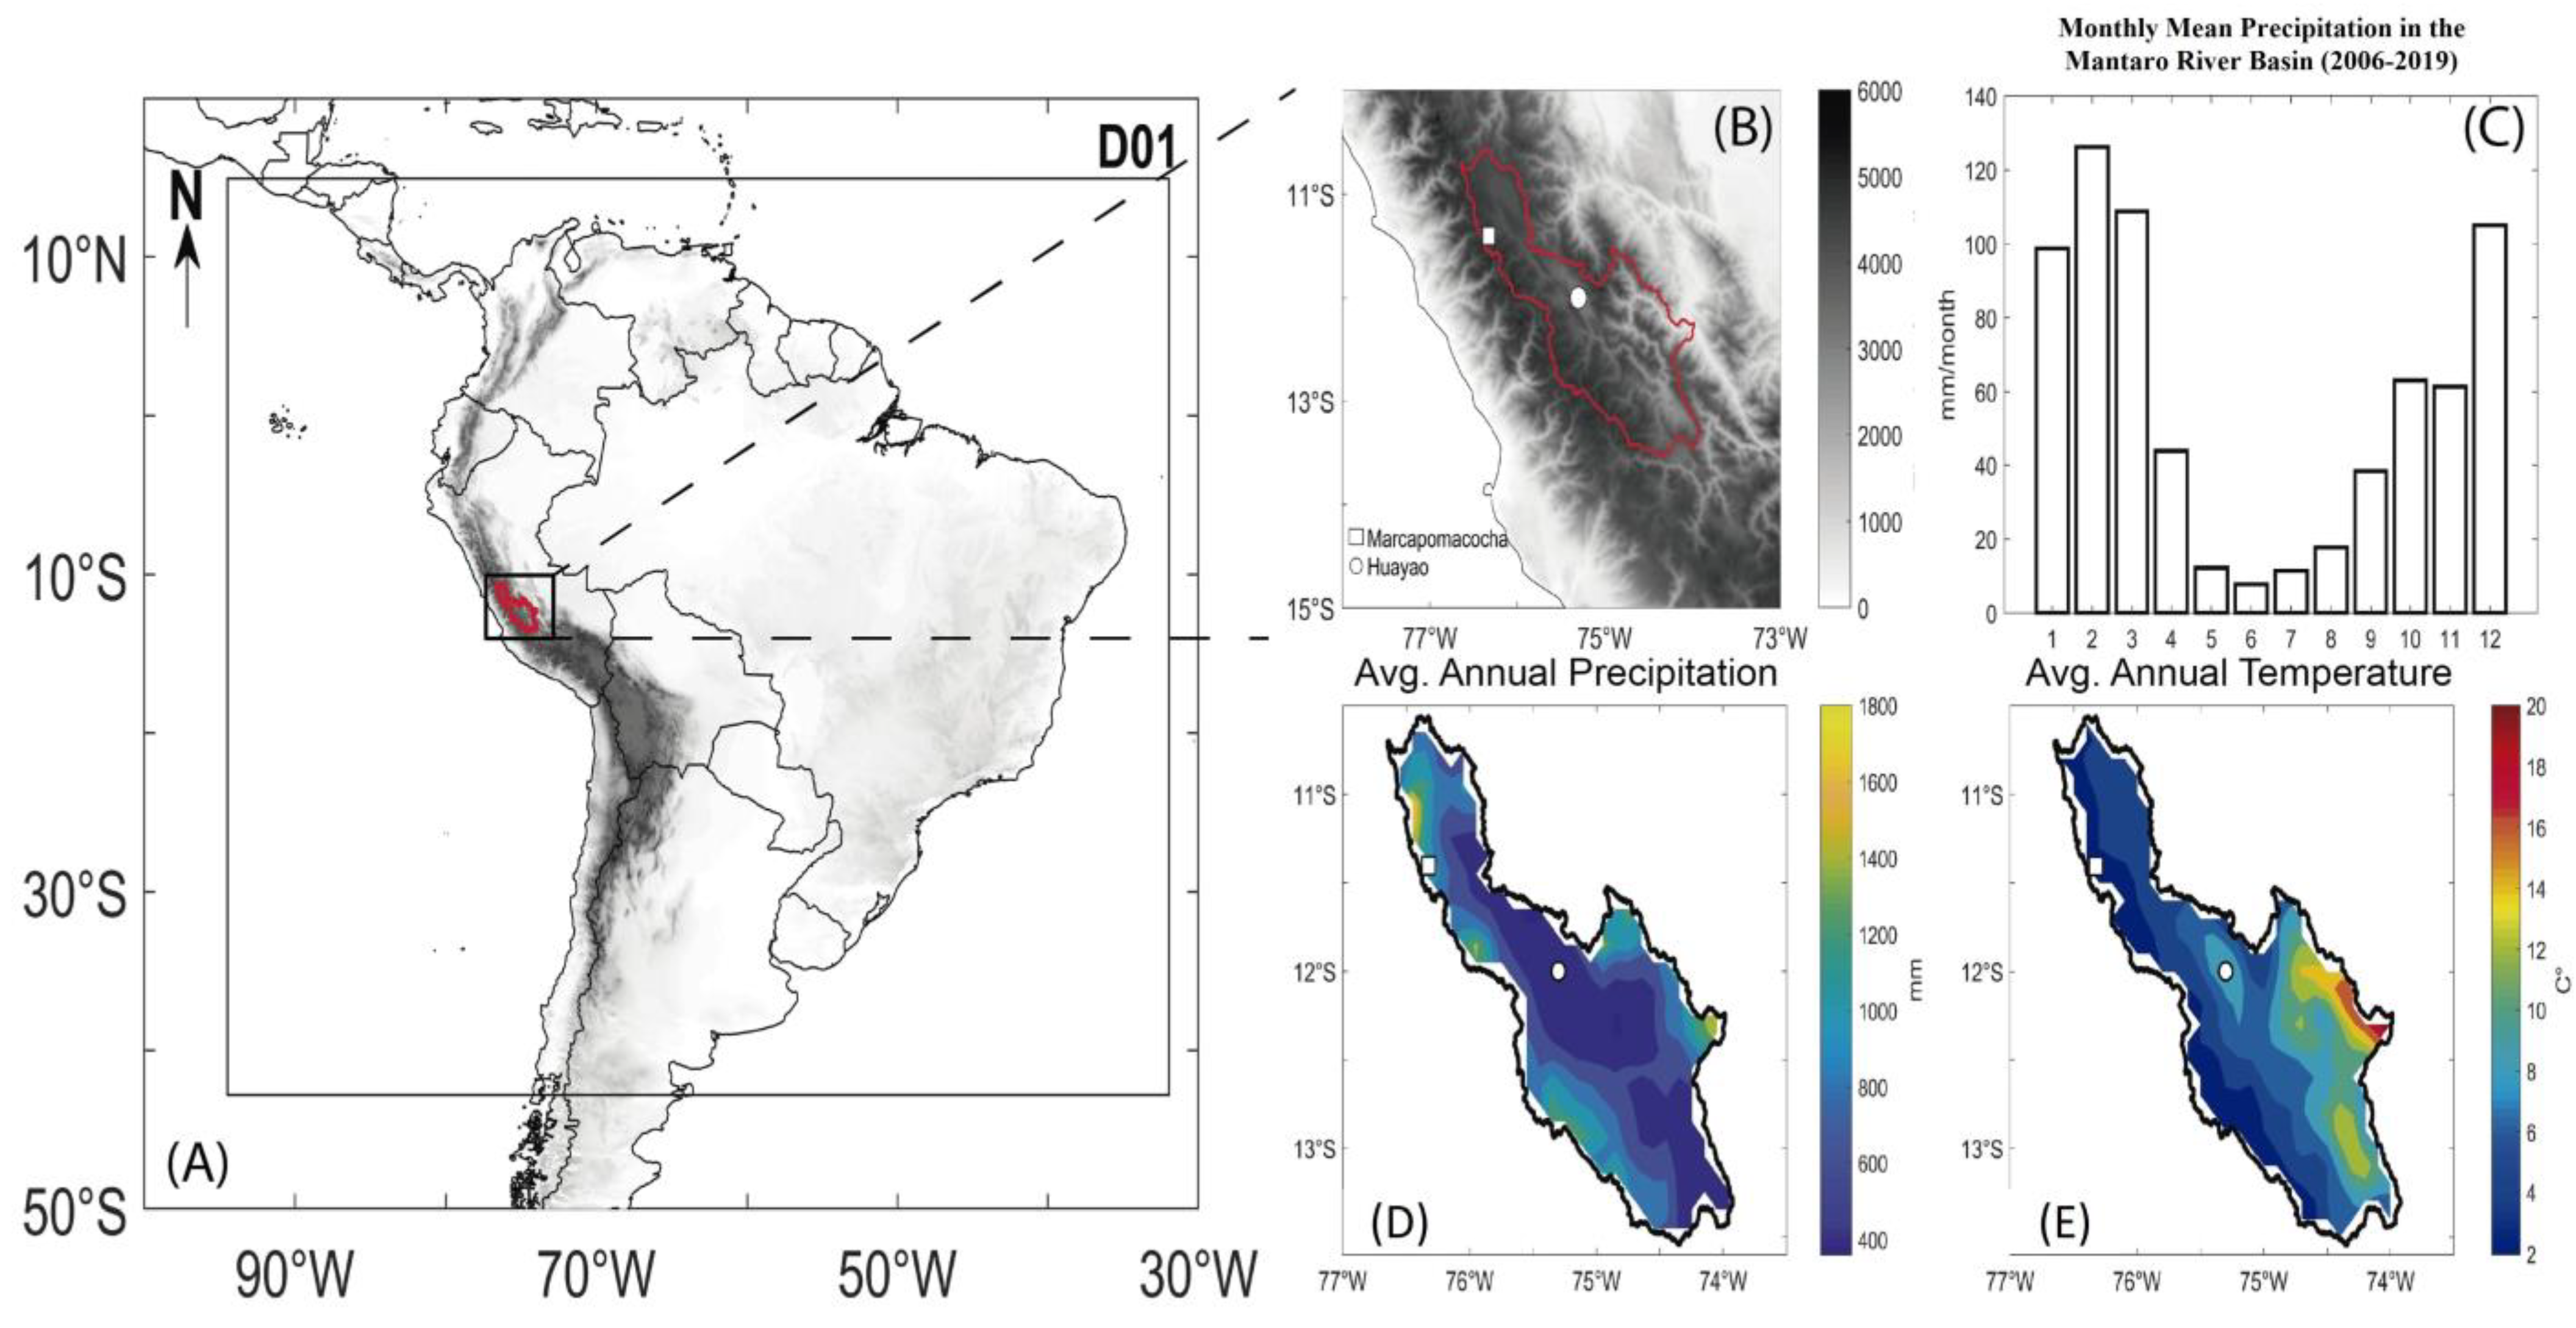
The MRB is located in the central Peruvian Andes (10°34′–13°35′ S, 73°55′–76°40′ W), covering a drainage area of 34,550 km2 at a mean altitude of approximately 3870 m a.s.l. The annual mean precipitation over the basin during the 2006–2019 period showed values of approximately 1100 mm (Figure 1B). The seasonal precipitation cycle shows a marked response to the South American Summer Monsoon (SASM), where 83% of the annual rainfall takes place between October and April and precipitation is almost absent during austral winter (Figure 1C). The spatial variability of mean temperature throughout the year varies between 2 and 20 °C, following the insolation forcing over the southern hemisphere. Minimum temperatures show a larger seasonality, varying from 0.5 °C in the winter season to 7 °C during the summer season. Mean maximum temperatures, on the other hand, show a less pronounced seasonality, ranging from 20.8 °C in November to 18.4 °C in the winter season [34].
From a regional atmospheric circulation perspective, intense rainfall events during the summer season, called wet spells, are associated with a strengthened Bolivian High (BH)–Nordeste Low (NL) system and upper-level easterly anomalies [35], while intense rainfall events in other seasons (mainly in spring) are associated with the intrusion of high-level westerly flow when the BH is absent or displaced to the east [36]. These results suggest that the combination of large-scale geopotential/flow anomalies and moist air masses over and upstream of the central Andes of Peru is linked to an increase in precipitation in the MRB [3]. Furthermore, the authors of [37] have documented reduced atmospheric stability with intensification in convection and upward motion over the western Amazon in the past two decades, which has contributed to and enhanced meridional moisture transport toward the Peruvian Altiplano region.
2.2. Isotope Data Collection
Stable oxygen and hydrogen isotopes were obtained from precipitation collected at the Marcapomacocha (11°24′15.8″ S, 76°19′30.2″ W, 4477 m a.s.l.) and Huayao stations (12°02′18″ S, 75°19′22″ W, 3313 m a.s.l.). The isotopic information from the Marcapomacocha station was obtained from the Global Network of Isotopes in Precipitation (GNIP) database), generated by the International Atomic Energy Agency (IAEA), in collaboration with the Servicio Nacional de Meteorología e Hidrología del Perú (SENAMHI). The rainfall isotope sampling was performed at monthly intervals from January 2006–March 2012, resulting in a dataset of 61 pairs of δ18O and δD values. For more specific details, readers are referred to the IAEA/WMO Global Network of Isotopes in Precipitation database, accessible at https://nucleus.iaea.org/wiser, accessed on 17 November 2021.
Stable isotopes in precipitation at the Huayao station were obtained using a tube-dip-in-rainwater collector with pressure equilibration located at the Huayao Observatory of the Instituto Geofísico del Peru (IGP), following the technical specifications of the International Atomic Energy Agency [38]. The monitoring took place from December 2016 to April 2018 with a sampling interval of 15 days. Water samples were collected using 10 mL HDPE bottles. The isotopic analyses (δ18O, δD) were performed at the Centro de Pesquisas de Águas Subterrâneas at the University of São Paulo (IGc-USP) using an isotopic water analyzer (Picarro L2130i). Data were processed using LIMS for Lasers software [39,40]. Values are reported with an analytical precision of 0.09‰ for δ18O and 0.9‰ for δD relative to Vienna Standard Mean Ocean Water (VSMOW). The Huayao dataset, sampled at a frequency of 15 days, was composed of 28 pairs of δ18O and δD values. Moreover, to compare the isotopic values from the Huayao station with climate data and samples from the Marcapomacocha monitoring station, isotope values were weighted by the local precipitation amount at a monthly time step.
2.3. Climate Data
Local climate parameters at the Huayao station (daily precipitation, air temperature, and relative humidity) were obtained from an in situ station at the Laboratory of Physics, Microphysics and Radiation (LAMAR) of the Instituto Geofísico del Perú for the period of December 2016–June 2018. Daily precipitation data for the Marcapomacocha station were obtained from the meteorological observation network of SENAMHI. For both stations, daily precipitation data were then accumulated into monthly totals.
For the Marcapomacocha station, air temperature and relative humidity were extracted from the single grid cell that encompasses its location in the products ERA5–Land monthly averaged (2 m temperature) and ERA5–hourly data on pressure level, respectively. Comparisons between reanalysis and in situ information of both variables are shown in Figure S1 to represent the reliability of the information chosen for the present study. Both datasets were produced by the ECMWF (European Center for Medium-Range Weather Forecasts) with a spatial resolution of 0.1° and 0.25°, respectively. Specifically for the case of relative humidity, data were averaged to daily timescales and then to a monthly resolution.
The product IMERG Late Run (Integrated Multi-SatellitE Retrievals) for Global Precipitation Mission (GPM) was used to represent regional precipitation. This dataset covers the period from June 2000 to the present, with a spatial resolution of 0.1°. For the calculation of the vertically integrated moisture convergence (VIMC), three variables at an hourly resolution from the 1000 hPa to 300 hPa pressure levels were obtained from ERA5 reanalysis: zonal wind (u), meridional wind (v), and specific humidity (q). For this study, climatology and anomalies were calculated considering the 2001–2019 period.
2.4. Back-Trajectory Modeling
To determine the potential moisture sources of the water vapor that reaches the Huayao and Marcapomacocha stations, we used the HYSPLIT 5.2.1 model (Hybrid Single-Particle Lagrangian Integrated Trajectory Model) developed by the National Oceanic and Atmospheric Administration (NOAA) at the Air Resources Laboratory (ARL) (https://www.ready.noaa.gov/HYSPLIT.php, accessed on 27 November 2021). One of the main characteristics of this model is the calculation of back-trajectories using a Lagrangian approach that assumes a particle to be passively following the wind, so each trajectory represents the integration of the particle’s position in space and time [41,42,43,44].
For this study, we used a dataset generated by the Weather Research and Forecasting (WRF) model as the input to the HYSPLIT model. To run the WRF model, boundary and initial conditions were derived from the Final Operational Global Analysis data (FNL) provided by the National Centers for Environmental Prediction (NCEP), which has a 1° × 1° spatial resolution and 33 vertical levels at a six-hour resolution.
Since the residence time of water in the atmosphere ranges from approximately 4 to 10 days [45], 7-day back-trajectories that reached the Huayao station on precipitation days between December 2016 and June 2018 were tracked every six hours. The same procedure was applied to calculate back-trajectories that reached the Marcapomacocha station between January 2006 and March 2012.
Cluster analysis offered by HYSPLIT was used to select the trajectories that were near each other and group them by their mean trajectory. Details about the number of clusters chosen are described in Supplementary Material. Considering that precipitation occurs most frequently in the afternoon and at night over the MRB [18], we present only the clusters of back-trajectories that integrated vertical motion arriving at 500 h Pa at 00 UTC, as this level was important for moisture transport at our study stations.
2.5. Moisture Flux and Moisture Flux Convergence
The zonal moisture flux (MF) along cross-sections at the latitudes at which the stations are located was calculated using the product of the specific humidity (q) and the zonal winds (u) at different pressure levels (1000 hPa–200 hPa). Meanwhile, the moisture flux convergence (MFC) was obtained using the following equation:
where and ∇. is the gradient of the wind vector.
On the other hand, the vertically integrated moisture convergence (VIMC) over South America was calculated using the following equation:
where = gravitational acceleration and = pressure.
This calculation was based on ERA5 variables at an hourly timescale.
It is worth noting that MF, MFC and VIMC anomalies were calculated using rainy days only and were then averaged for the rainy season (JFM).
3. Results and Discussion
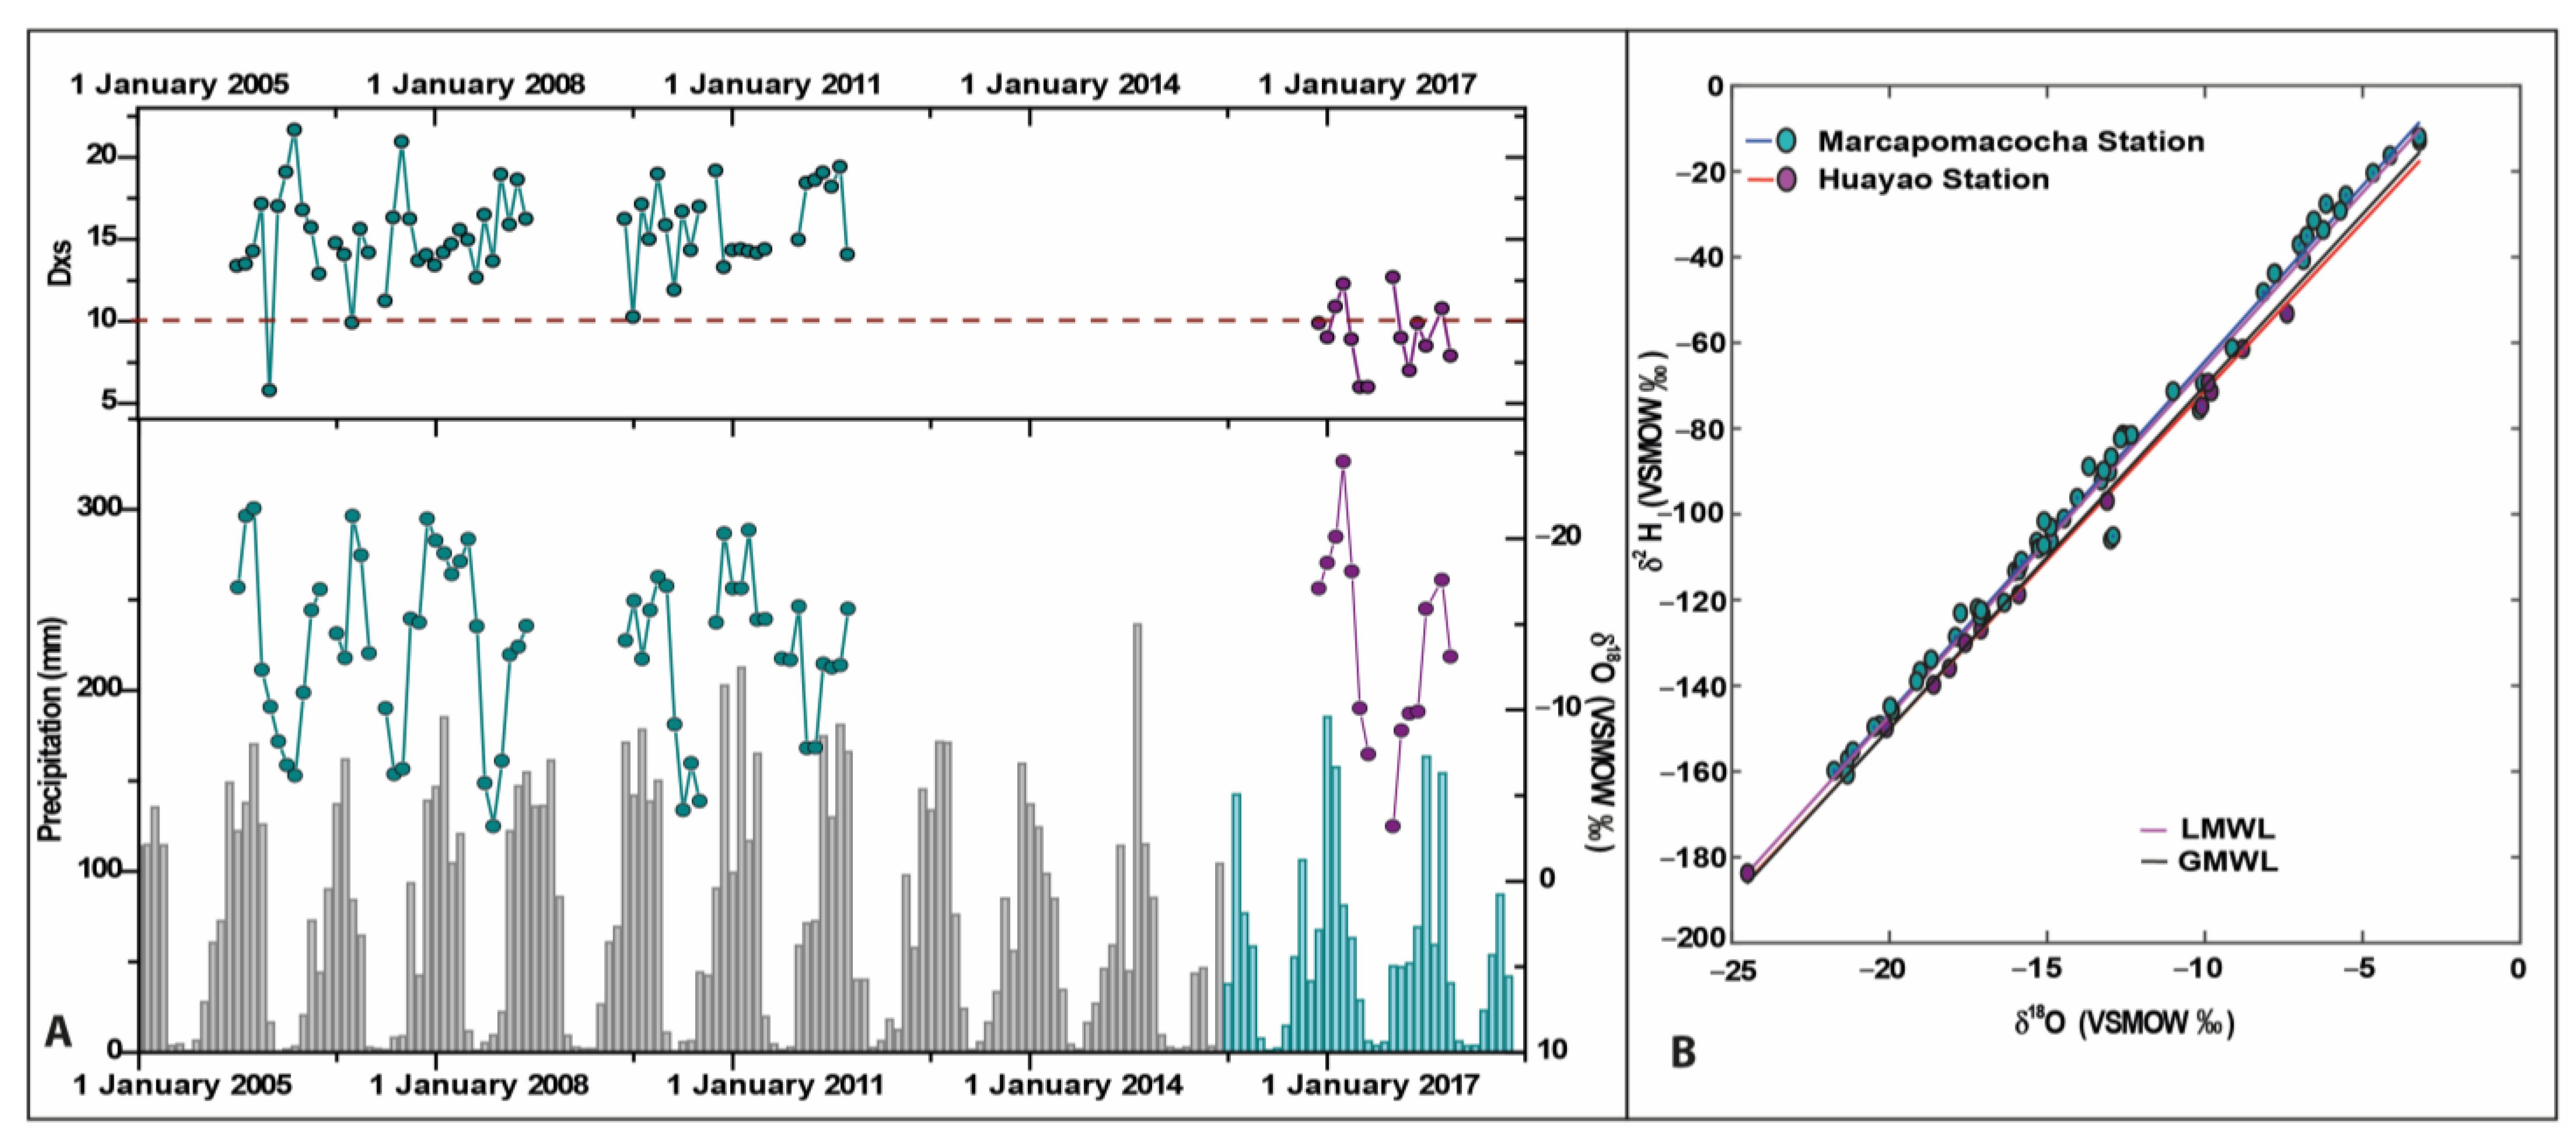
The entire dataset (75 pairs of δ18O and δD values obtained from the Marcapomacocha and Huayao stations) shows that average precipitation δ18O values were of the order of −13.6‰, ranging from −3.2‰ to −24.5‰. δD values ranged from −12.01‰ to −160.71‰, with an average value of −95.2‰. Since the dataset included information from both highlands (Marcapomacocha) and valleys (Huayao), it was representative of the mean isotopic signature of the MRB.
Single analysis at the Marcapomacocha station showed variations between −3.21‰ and −21.76‰, with an average value of −13.6‰ for δ18O. For δD, it varied from −12.01‰ to −160.71‰, with a mean value of −93.63‰. The δ18O values at the Huayao station ranged from −3.2 to −24.5‰, with mean values of the order of −13.87‰; the δD values varied from −12.9 to −183.7‰, with an average of −101.77‰ (Figure 2 and Figure S3). Statistical tests performed between both datasets revealed that the mean differences between two samples were negligible (independent T-tests were performed) and variances were homogeneous (F-tests were performed).
A Local Meteoric Water Line (LMWL) for the MRB was derived using the entire isotopic dataset (75 pairs of δ18O and δD). Figure 2B shows the comparison between the LMWL and the Global Meteoric Water Line (GMWL; δD = 8 δ18O + 10), which is used here as a reference since it is useful to describe the coevolution of water isotopologues as rainout from an air parcel [46]. It was noticeable that the LMWL (δD = (8.14 ± 0.1) δ18O + (15.74 ± 1.47)) differed from the GMWL, indicating a slightly different slope and intercept of the regression line.
Comparison between the LMWLs for each station showed that the LMWL constructed for the Marcapomacocha station (δD = (8.2 ± 0.11) δ18O + (17.7 ± 1.53) differed from the Huayao LMWL (δD = (7.9 ± 0.09) δ18O + (7.6 ± 1.44)). The large positive intercept of the LMWL at the Marcapomacocha station (>10‰) can be interpreted as moisture recycling having affected the air parcel [47], which is not surprising considering that the monitoring station is located next to a closed lake that likely favors moisture recycling. However, the range of values observed is typical for this region and consistent with data from other stations located over the western Amazon (e.g., [20,48]). The LMWL for the Huayao station, on the other hand, showed a reduced intercept (<10‰), which in turn may reflect some evaporative processes, especially during the winter season.
An additional isotopic parameter evaluated was the deuterium excess, defined as Dxs = δD – 8 × δ18O [49], which was also calculated for the entire dataset, showing values of the order of 13.86‰. However, differences arose when the mean Dxs was calculated individually at each station (Marcapomacocha Dxs = 14.9‰ and Huayao Dxs = 9.2‰, Figure 2). It has been proposed that the seasonal Dxs pattern records atmospheric relative humidity over the Atlantic moisture source regions, relative humidity in the atmosphere above the recording stations, and land–atmosphere moisture fluxes over the Amazon [50]. For the Marcapomacocha station, higher relative humidity and sub-cloud evaporation could play a role in Dxs values (e.g., [51]). Moreover, the presence of the lake next to the monitoring station would promote the influences of local processes such as condensation conditions and surface water recycling, also affecting the Dxs values at this station [52].
3.1. Local and Remote Controls of δ18O Variability
To assess the linear dependence between local environmental parameters and the isotopic composition of precipitation, Pearson’s correlations were calculated. A strong linear correlation existed between δ18O and δD (Pearson’s r > 0.99). Therefore, the evaluation of the relationships between local environmental parameters and moisture sources focused exclusively on δ18O data. The entire dataset showed good correlations between δ18O values and monthly mean precipitation (r = −0.59, p-value < 0.01) and relative humidity (r = −0.64, p-value < 0.01). The correlation was even higher between δ18O and the basin-averaged mean monthly precipitation (r = −0.63, p-value < 0.01), which confirmed that the isotopic signal integrated information at the basin scale (Figure S4). On the other hand, there was no correlation between δ18O and monthly mean temperature (r = −0.09, p-value = 0.5).
At the interannual timescale, basin rainfall calculated for the hydrological year (July to June) showed a significant negative correlation with amount-weighted annual isotopic composition (r = −0.79, p-value = 0.06, n = 6, Figure 3). On this same timescale, a negative correlation with the average annual relative humidity (r = −0.46, p-value = 0.36) was also observed, while there was no significant correlation with annual average temperature in the study region (r = 0.48, p-value = 0.34).
There were no significant differences when correlations were calculated for precipitation rates at a single station (r = −0.62 for the Huayao station and r = −0.59 for the Marcapomacocha station, p-value < 0.01, Figure S5). For relative humidity, correlations became more significant (r = −0.79 for the Huayao station and r = −0.65 for the Marcapomacocha station, p-value < 0.01). For temperature, there were no significant results for the Huayao station; however, at the Marcapomacocha station, the correlation with δ18O was slightly more significant (r = 0.32, p < 0.01).
Although this result reveals a good agreement between precipitation amount, relative humidity, and δ18O variability at monthly and annual timescales, it has been noted for many locations in the eastern Andean region that local precipitation rates are often poor predictors of precipitation isotope ratios (e.g., [20,21,30]). The results obtained from the linear approach developed in this study indicate that the isotopic composition of rainfall in the MRB might have a stronger sensitivity to local conditions than other Andean regions, given the significant correlations obtained with rainfall amount. However, our results indicate that other regional- and large-scale influences also matter, as local environmental parameters only explained a limited fraction of the total variance observed in the dataset. Indeed, several studies have documented that upstream monsoon convection provides the main control of the isotopic composition of water vapor in austral summer, while large-scale advective mixing is also relevant for the Andean water vapor in austral winter (e.g., [26,32]).
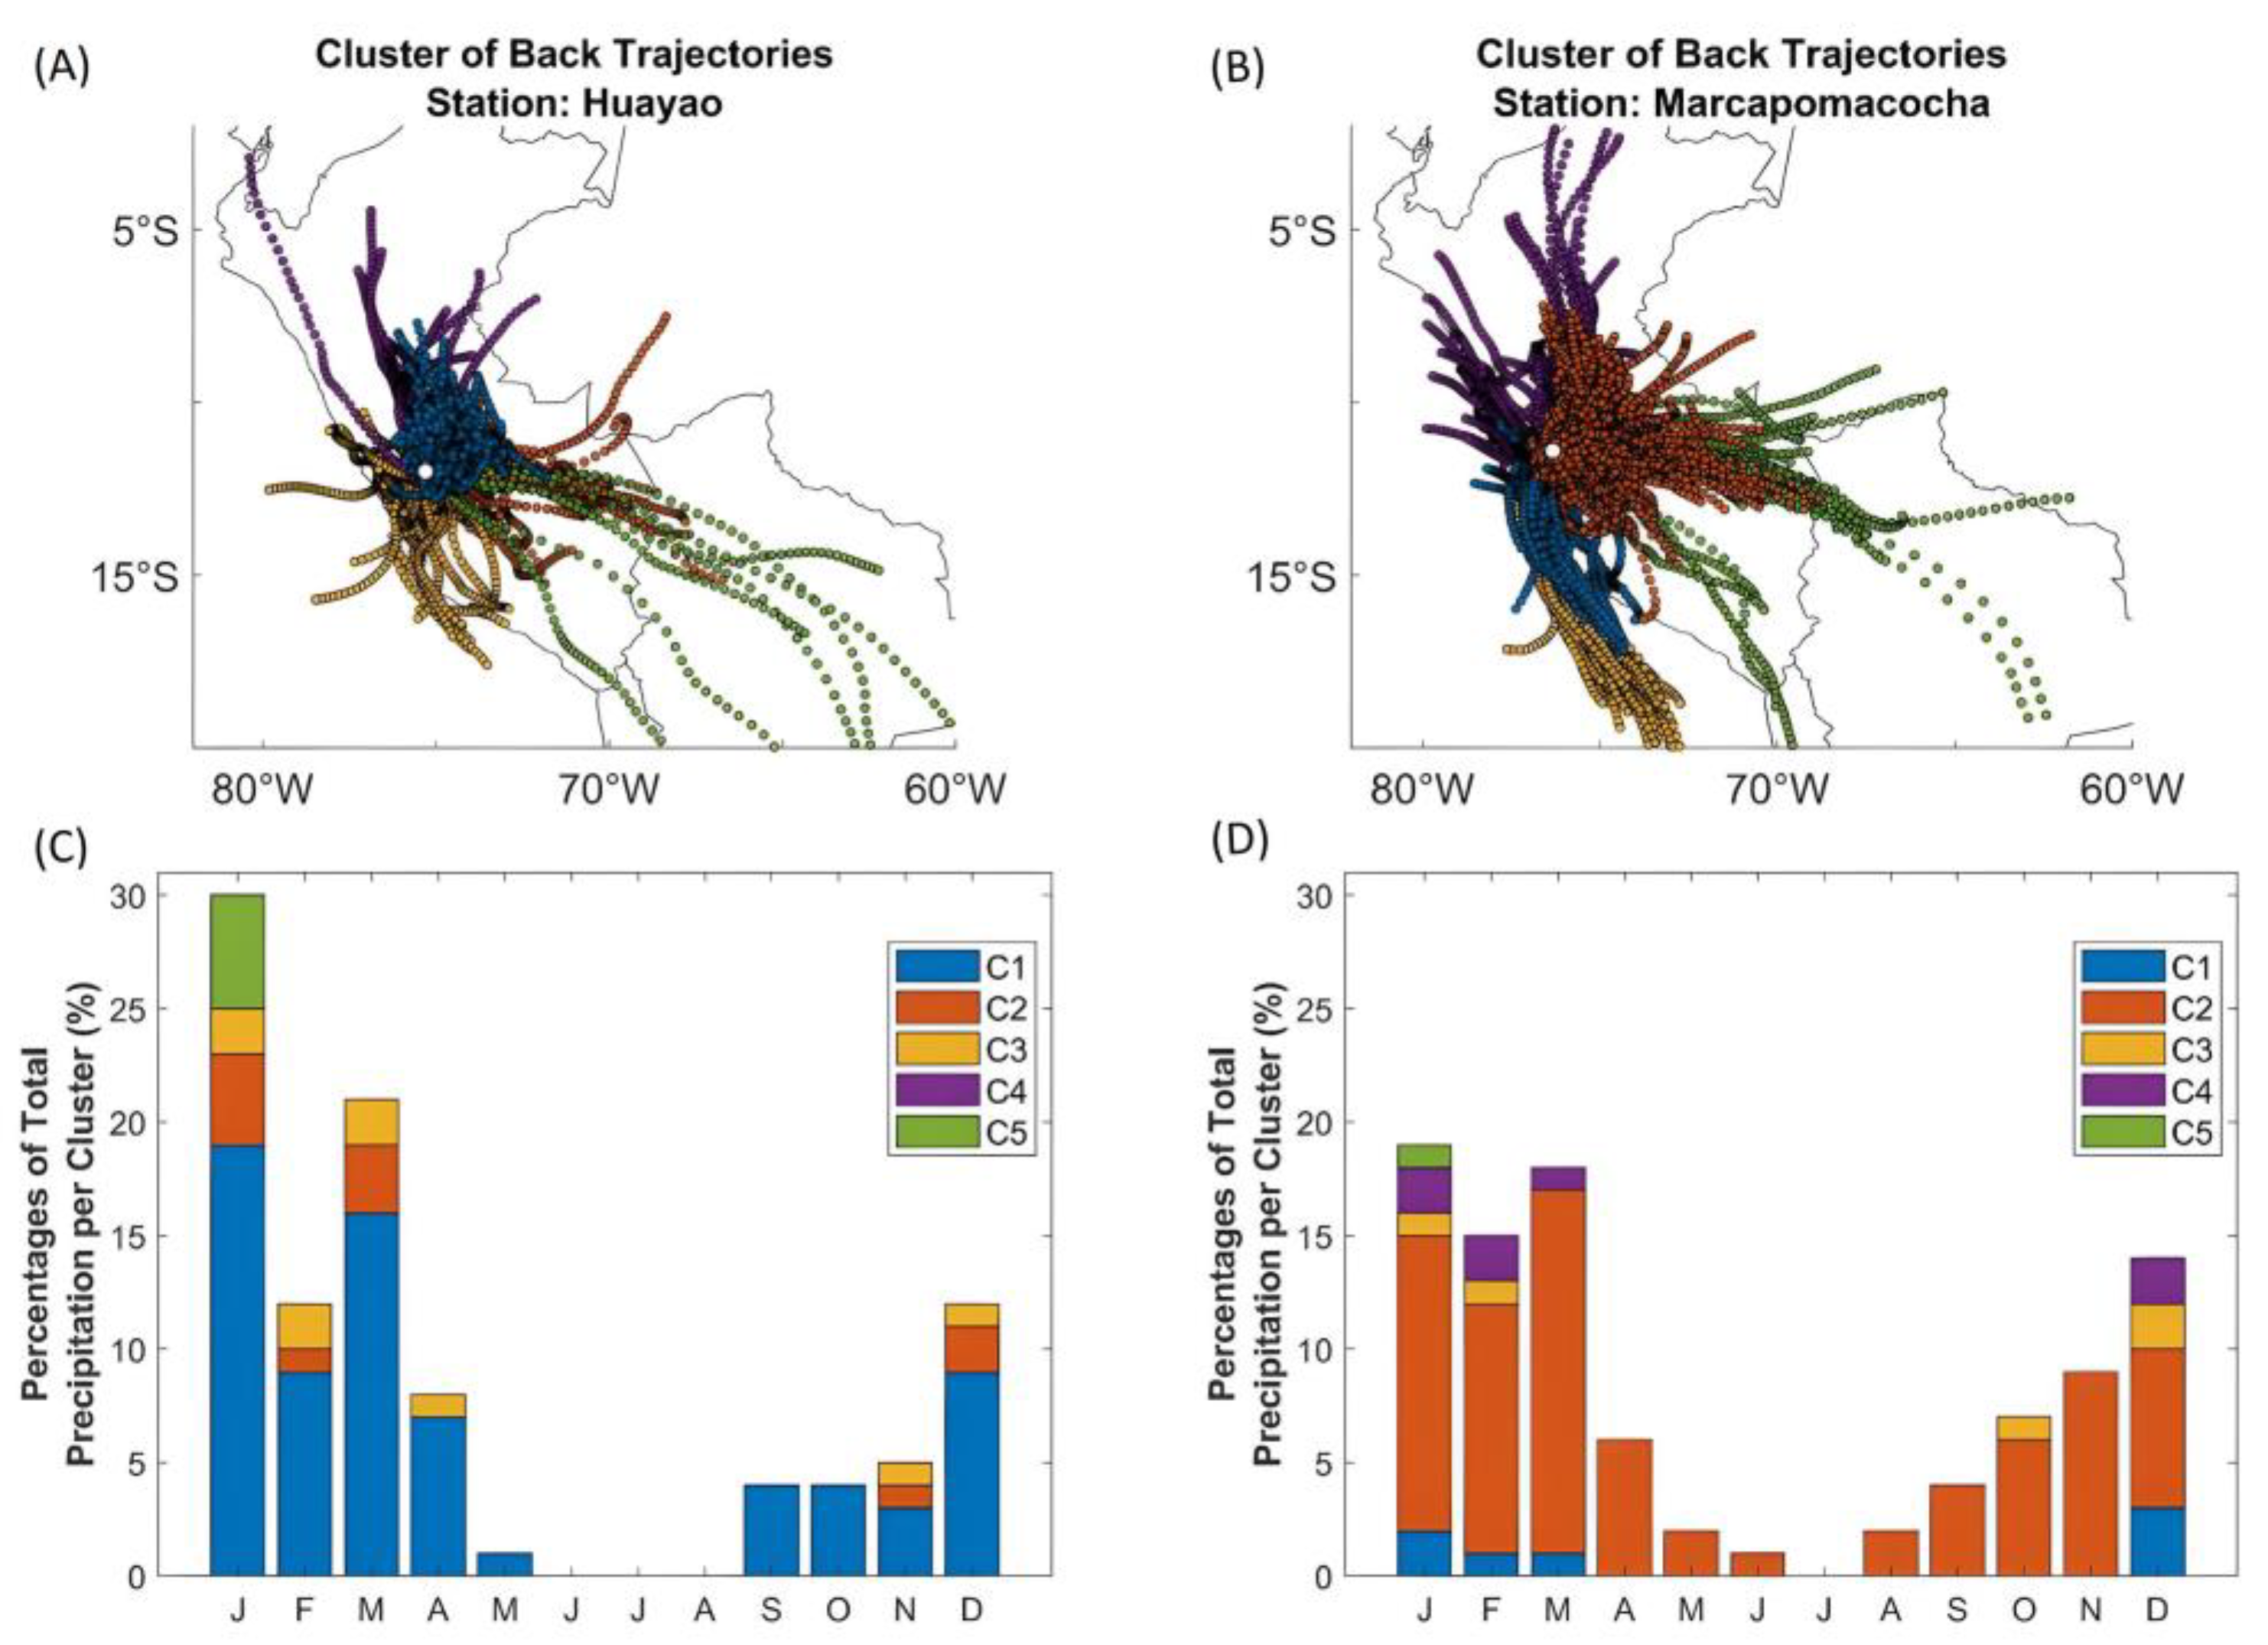
To explore a more comprehensive interpretation of δ18O, it was necessary to consider the influence of regional climate parameters such as moisture sources and rainfall upstream (e.g., [20,24,53,54]). Cluster analysis was applied to the back-trajectory data in order to obtain a more detailed picture of the potential moisture sources associated with rainfall at the Huayao and Marcapomacocha stations during both summer and winter seasons. A summary of the cluster analysis is shown in Figure 4 and Figure S6. The results are based on an analysis that only included rainy days at the Huayao and Marcapomacocha stations. The analysis for the winter season was based solely on the Marcapomacocha dataset, as no isotope data were available for the Huayao station.
Northeastern-/eastern-sourced air masses provided the dominant moisture contribution to the MRB. Clusters 1 and 2 accounted for 83% of the total precipitation amounts at the Huayao station (Figure 4A,C). Meanwhile, air masses sourced from a similar origin, collected into Clusters 2, 3, and 5, accounted for 82% of the total precipitation at the Marcapomacocha station (Figure 4B,D). Western-sourced air masses were represented in cluster C3 for the Huayao station and explained around 6% of total precipitation at the station (Figure 4A,C). For the Marcapomacocha station, western- and southwestern-sourced air masses were represented in clusters C4 and C1, which were related to 18% of the total precipitation (Figure 4B,D). Additionally, southeastern air masses, characterized as cluster C5 at the Huayao station, were related to 3% of the total precipitation at the station (Figure 4A,C).
From the cluster analysis, it was apparent that the Marcapomacocha station receives more western-sourced air masses than the Huayao station, which is expected given the geographical location of the station, at a higher altitude on the western side of the basin. Overall, the results suggest that the main moisture sources sustaining rainfall events in the Mantaro Basin originate to the east/northeast, outside the basin. These results are consistent with previous studies of the MRB showing that the moisture source regions are located to the east of the cordillera and associated with low-level moisture convergence over the western Amazon Basin during the austral summer [1,3,34]. During the winter season, on the other hand, occasional precipitation events seem to be more closely related to the occurrences of cold surges and cut-off lows [55,56,57,58].
It is important to emphasize that researchers making interpretations of wind back-trajectories as indicators of moisture sources must proceed with caution in tropical settings. Water vapor undergoes condensation, rainout, and evaporation along its transport history, which are processes that back-trajectories do not take into account. Therefore, simply assuming that trajectories provide a realistic portrayal of moisture transport is misleading. An example is the occurrence of extratropical cold surges, which are characterized by southerly flow east of the Andes. These air masses are cold and dry, triggering local moisture to lift and condense once the southerly cold front reaches the study area. Back-trajectories cannot realistically portray such a scenario and interpreting them would lead to the incorrect assumption of a southerly moisture source. Therefore, the prevailing atmospheric circulation features over the central Andes have to be considered in any interpretation of moisture trajectories, and our interpretation takes these aspects into consideration when interpreting trajectories arriving from southern and western air mass clusters.
3.2. Regional Climate Features Linked to Major Isotope Variation
To further investigate the associations between regional atmospheric circulation changes and the stable isotopic composition of rainfall over the MRB, two extreme events that led to major impacts on the South American climate during the monitoring period were further analyzed. The first event was the major Amazon drought recorded in 2010 [59,60], and the second event was the coastal El Niño in 2017 [61,62]. Both events were characterized by highly anomalous atmospheric circulation that is expected to have left a significant imprint in the stable isotopic composition of precipitation over the MRB. Such an analysis can provide important information on how geochemical signals associated with extreme events are embedded in natural archives in the Peruvian Andes.
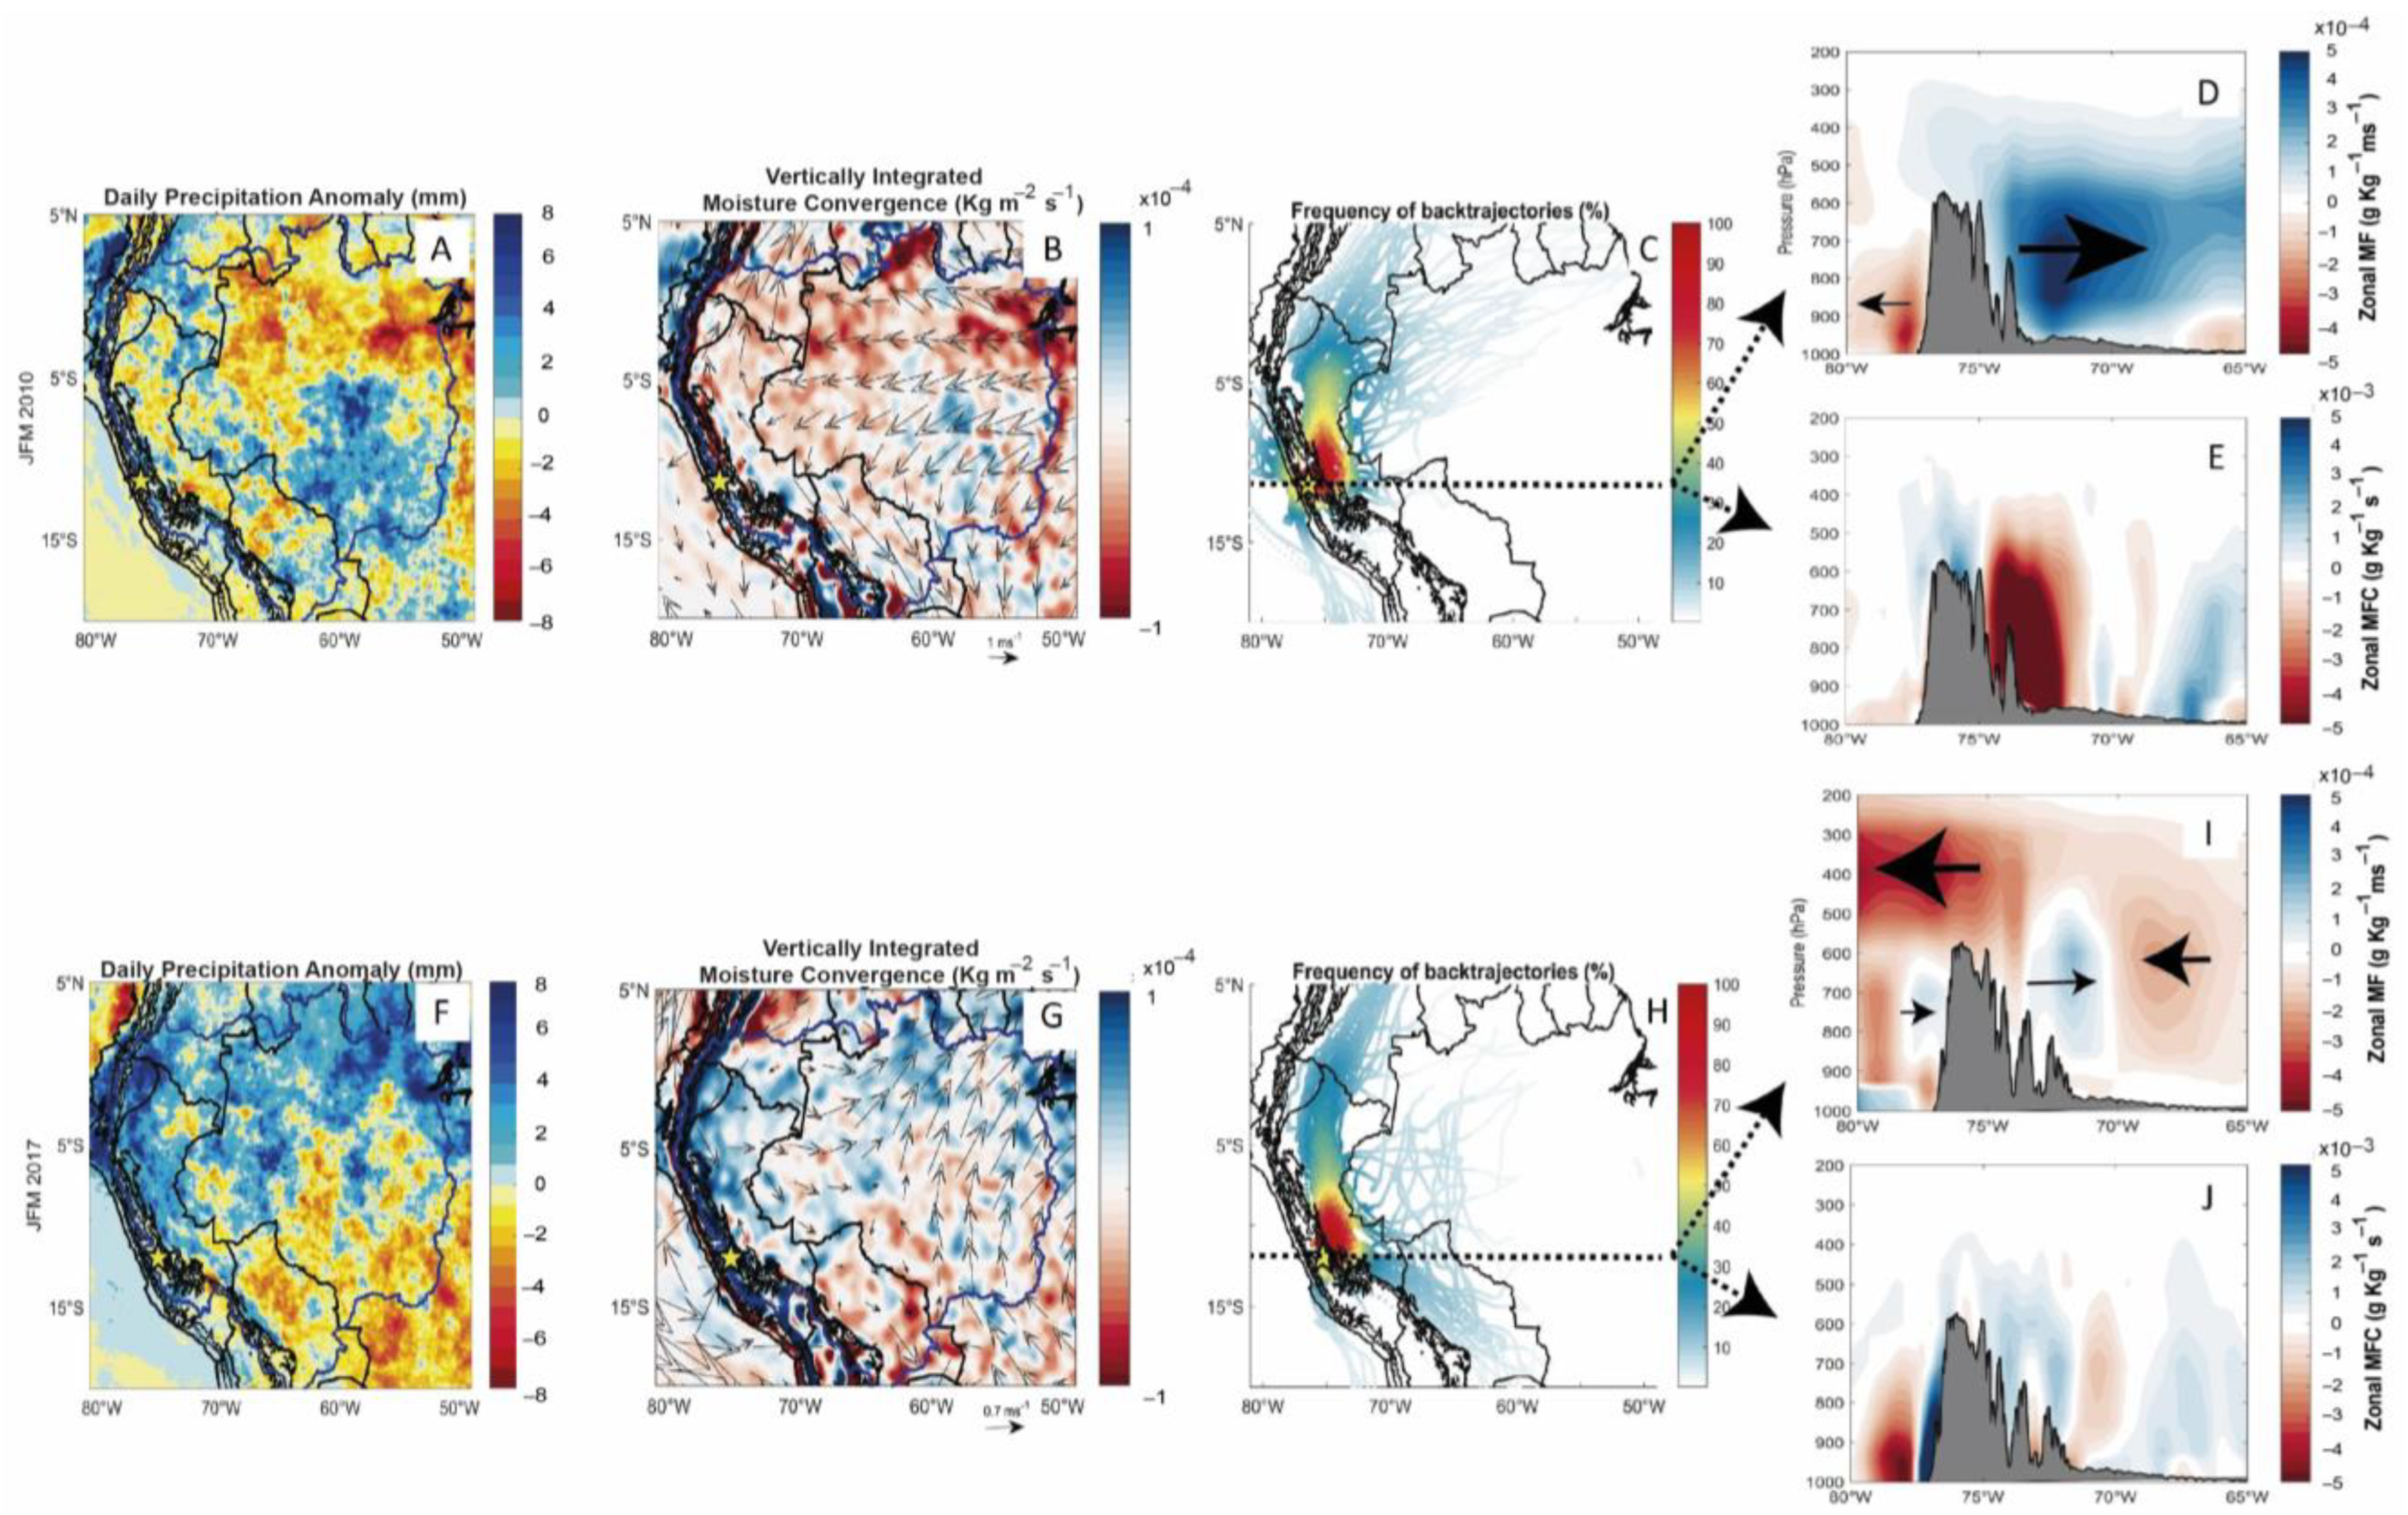
During the summer of 2010 (January, February, and March; JFM) the sea surface temperature (SST) of the central equatorial Pacific region (Niño 3.4 region) increased by 1.2 °C, consistent with the manifestation of a canonical El Niño event (e.g., [63]). During the El Niño event, a severe reduction in rainfall over the Andean and Amazon regions was documented (e.g., [12,64,65]). At the same time, the SST over the tropical North Atlantic also featured persistent positive anomalies, which in turn diminished the moisture influx over the South American Monsoon region. These oceanic conditions (anomalously warm Pacific and tropical North Atlantic) mutually reinforced the drought conditions over the Amazon basin [60]. Figure 5A shows the daily precipitation anomalies averaged over the summer months (JFM) in 2010 and Figure 5B represents the vertically integrated moisture convergence (VIMC) observed during the same study period for tropical South America. Negative precipitation anomalies abounded over many regions of South America, which is consistent with the negative moisture convergence (~−1× 10⁻⁴ kg m−2s−1) observed at the regional scale.
For the same period, the back-trajectories confirmed the influence of northeastern air masses over the MRB, which is evident in Figure 5C. In addition, Figure 5D represents the moisture flux convergence (MFC) along the latitude of the Marcapomacocha station. The negative MFC (~−5 × 10⁻³ g kg−1 s−1) indicates enhanced moisture divergence over the study region for this specific event (Figure 5E).
The mean isotopic composition during the summer of 2010 at the Marcapomacocha station was −15.05‰, which is approximately 2.7‰ less negative than average summer values (−17.7‰). However, the local rainfall amount did not show a significant decrease related to the isotopic anomaly seen during this specific event (Figure 2). Hence, the isotopic signal of the rainfall in the MRB is likely a result of large-scale changes in convection and atmospheric circulation along the moisture pathway upstream.
The reduced moisture convergence along the pathway over northern tropical South America during the 2010 event reflects the diminished South American Monsoon intensity that resulted in a decrease in the Rayleigh distillation and ultimately in less negative isotopic values over the MRB during this drought period.
During the coastal El Niño event in 2017, a local increase in SST (~1.4 °C) was observed along the coastal region of northern Peru [61]. It is argued that these warm SST anomalies led to an anomalous southern displacement of the eastern Pacific Intertropical Convergence Zone [62], favoring evaporation, deep convection, and moisture convergence across northern Peru, including over the central Peruvian Andes. In fact, a highly anomalous rainfall pattern over Peru was documented during this event [66,67].
The recorded summer precipitation at the Huayao station showed slightly above average values (Figure 2), but the mean isotopic composition of precipitation was −21.06‰, which is around 1.7‰ more negative than the mean summer values (−19.34‰). Figure 5F represents the daily precipitation anomalies averaged during the summer 2017 event, indicating highly heterogeneous behavior of precipitation in South America. In fact, the eastern Andes–western Amazon region experienced the most positive precipitation anomalies over the domain analyzed. Figure 5G supports this representation as it shows positive vertically integrated moisture convergence over the same region. The back-trajectories shown in Figure 5H indicate that moisture arrived preferentially from the east/northeast, consistent with previous reports. For this latitude, the zonal cross-section of moisture flux and moisture flux convergence represented in Figure 5I,J reveals heterogeneous patterns of MFC over the eastern part of the Andes, which in turn represents complex interactions between low- and high-level circulation.
Following these results, it is possible to infer that more depleted values in rainfall isotopes over the MRB are associated with the regional histories of the air masses that encompass precipitation. It has been demonstrated that centers of deep convection in the western Amazon enhance the meridional humidity transport that strengthens upward motion over the central Peruvian Andes [37]. In this sense, it is plausible to argue that increased rainout over the eastern Andes led to intensified Rayleigh distillation processes and ultimately to more depleted isotopic values over the MRB during this specific event.
3.3. Implications for Hydroclimate Reconstructions
The isotopic composition of precipitation over the different regions of the MRB can in large part be interpreted as reflecting the histories of the air masses along the flow path associated with the SASM. In addition, some of this variability can be explained by local moisture that is recycled and precipitates over the MRB. The significant correlation with local precipitation amounts at the interannual timescale confirms the potential of this proxy to serve as an indicator of hydroclimate variability in the MRB. As such, it could also provide a benchmark to better determine future water availability and the occurrence of hydroclimate extremes. Perhaps most importantly, oxygen and hydrogen isotopes could provide a long-term hydroclimatic perspective through analysis of the isotopic composition embedded in high-resolution proxy records from this region, such as calcite in lake records [22] and speleothems [68]. Therefore, the MRB is a key region that requires further development of these tools for managing future hazards due to climate change in a long-term context.
The MRB features several glaciated catchments that are relevant for maintaining key environmental services during the dry season, such as the meltwater contribution to human consumption and agriculture. A very limited number of studies have quantified the glacial contribution to the main river system and contributed to an improved understanding of the basin’s hydrology using stable isotopes in the Andean region (e.g., [69]). Additional efforts to characterize the isotopic signals of rivers and groundwater could be complemented by the results presented in this study. It is intended that the dataset presented here will also encourage new applications for hydrological studies that allow the development of a water balance by integrating new geochemical evidence. The presented data furthermore constitute an important benchmark for isotope-enabled climate models, which are increasingly being employed in paleoclimate research.
4. Conclusions
Local and regional climatic conditions were analyzed to characterize the stable isotopic composition of rainfall (δ18O, δ2H) in the MRB. Interannual to seasonal variability was considered and it was demonstrated that while local factors such as in situ precipitation and relative humidity exert some control over δ18O in precipitation, there is also an important contribution from large-scale upstream conditions that affect the local δ18O variability. This result is in agreement with previous observational and modeling studies that equally considered the degree of rainfall upstream and the transport history of air masses as the main factor influencing the δ18O variability in the Peruvian Andes.
This study presents the longest time series of recorded stable isotope variability in precipitation over the Peruvian region. This evaluation was aimed at better determining the isotopic signature over the basin to allow for improved future hydrological studies and paleoclimate reconstructions over the MRB, one of the most important regions in the country in terms of agricultural and hydroelectricity production.
Our results suggest that the isotopic composition of rainfall over the MRB is influenced by different factors such as precipitation amount, moisture sources, moisture transport history, and the degree of rainout upstream which operate across a range of spatial scales. Two case studies related to extreme events that led to major atmospheric circulation changes over tropical South America were analyzed in order to better define the isotopic signal. The first case study focused on the major drought over the Amazon basin recorded in 2010, while the second one was related to the occurrence of a coastal El Niño event in 2017. Significant differences occurred between the two events in terms of circulation anomalies and rainfall amounts, which were analyzed to document how the joint interactions between large-scale and local factors combine to affect the isotopic composition of precipitation in the MRB.
In light of these results, it would seem advantageous to develop more studies in which such isotopic analyses form part of investigations of the hydrological cycle. Isotope-enabled climate models and isotope-based multiproxy reconstructions are especially relevant in this regard to increase the availability of datasets and improve the interpretation of long-term records of isotopes in precipitation.
Supplementary Materials
The following supporting information can be downloaded at: https://www.mdpi.com/article/10.3390/w15101867/s1, Figure S1: Pearson correlations between in situ data at Marcapomacocha Station and ERA5 reanalysis information during the 2016–2020 period [70]. Panel A represents the linear regression for temperature and Panel B for relative humidity; Figure S2: Wind anomalies at 500 hPa for South America featuring the two case studies: 2010 (Left panel) and 2017 (Right panel); Figure S3: Temporal variability of monthly oxygen and hydrogen isotopes of precipitation (δ18O, δ2H and Dxs) for both stations (Marcapomacha and Huayao) for the study period January 2006–April 2018; Figure S4: Correlation between monthly precipitation averaged over the Mantaro Basin and isotopic data collected at Huayao and Marcapomacocha stations; Figure S5: Linear Pearson’s correlation between monthly local environmental parameters (precipitation, temperature and relative humidity) and the oxygen isotopic composition of rainfall (δ18O) for Huayao (top panel) and Marcapomacocha (bottom panel) stations; Figure S6: (A) and (B) represent the Total Spatial Variance (TSV) for Huayao and Marcapomacocha stations, respectively. (C) The cluster means considering five groups and (D) for four groups. Table S1: Monthly average of the isotopic signals (δ18O, δ2H and Dxs) with their respective standard deviations; Table S2: Monthly rainfall amount-weighted isotopic composition at the Huayao station; Table S3: Monthly rainfall amount-weighted isotopic composition at the Marcapomacocha station and available at https://nucleus.iaea.org/wiser.
Author Contributions
Conceptualization, J.A. and C.R.; methodology, J.A, C.R. and M.V.; writing—original draft preparation, J.A. and C.R.; writing—review and editing, J.A., C.R., M.V., J.S. and A.A. All authors have read and agreed to the published version of the manuscript.
Funding
This research was partially supported by the CHARISMA Project (JE0ECCHARI, JEAI-IRD), US-NSF (Project EAR-2103041) and PROCIENCIA in reference to contract No. 124-2020 FONDECYT, Perú.
Data Availability Statement
Isotopic data reported in the results can be found in the Supplementary Material and the Global Network of Isotopes in Precipitation https://nucleus.iaea.org/wiser, accessed on 17 November 2021.
Acknowledgments
We want to thank Lucy Giraldez and Yamina Silva for their assistance in sampling rainfall at the Huancayo observatory of the Instituto Geofísico del Perú and Miguel Saavedra for his support with the WRF model runs. We are also grateful to Eli Cristina Caçador for her support during water analysis at the University of Sao Paulo. This work was performed using computational resources, HPC-Linux-Cluster, from the Instituto Geofísico del Perú (grants 101-2014-FONDECYT, SPIRALES2012 IRD-IGP, Manglares IGP-IDRC, PP068 program).
Conflicts of Interest
The authors declare no conflict of interest.
References
- Chavez, S.P.; Silva, Y.; Barros, A.P. High-Elevation Monsoon Precipitation Processes in the Central Andes of Peru. J. Geophys. Res. Atmos. 2020, 125, e2020JD03294. [Google Scholar] [CrossRef]
- Martínez, A.; Núñez, E.; Silva, Y.; Takahashi, K.; Trasmonte, G.; Mosquera, K.; Lagos, P. Vulnerability and Adaptation to Climate Change in the Peruvian Central Andes. In Proceedings of the 8 ICSHMO, Foz do Iguaçu, Brazil, 24–28 April 2006; pp. 297–305. [Google Scholar]
- Moya-Alvarez, A.S.; Gálvez, J.; Holguín, A.; Estevan, R.; Kumar, S.; Villalobos, E.; Martínez-Castro, D.; Silva, Y. Extreme rainfall forecast with the WRF-ARW model in the Central Andes of Peru. Atmosphere 2018, 9, 362. [Google Scholar] [CrossRef]
- Lavado-Casimiro, W.; Silvestre, E.; Pulache, W. Tendencias en los extremos de lluvias cerca a la ciudad del Cusco y su relación con las inundaciones de enero del 2010. Rev. Peru. Geo-Atmos. RPGA 2010, 2, 89–98. [Google Scholar]
- Espinoza, J.C.; Ronchail, J.; Lengaigne, M.; Quispe, N.; Silva, Y.; Bettolli, M.L.; Avalos, G.; Llacza, A. Revisiting wintertime cold air intrusions at the east of the Andes: Propagating features from subtropical Argentina to Peruvian Amazon and relationship with large-scale circulation patterns. Clim. Dyn. 2013, 41, 1983–2002. [Google Scholar] [CrossRef]
- Saavedra, M.; Takahashi, K. Physical controls on frost events in the central Andes of Peru using in situ observations and energy flux models. Agric. For. Meteorol. 2017, 239, 58–70. [Google Scholar] [CrossRef]
- Zubieta, R.; Saavedra, M.; Silva, Y.; Giráldez, L. Spatial analysis and temporal trends of daily precipitation concentration in the Mantaro river basin: Central Andes of Peru. Stoch. Environ. Res. Risk Assess. 2017, 31, 1305–1318. [Google Scholar] [CrossRef]
- Sulca, J.; Vuille, M.; Roundy, P.; Takahashi, K.; Espinoza, J.C.; Silva, Y.; Trasmonte, G.; Zubieta, R. Climatology of extreme cold events in the central Peruvian Andes during austral summer: Origin, types and teleconnections. Q. J. R. Meteorol. Soc. 2018, 144, 2693–2714. [Google Scholar] [CrossRef]
- Giráldez, L.; Silva, Y.; Zubieta, R.; Sulca, J. Change of the rainfall seasonality over central Peruvian Andes: Onset, end, duration and its relationship with large-scale atmospheric circulation. Climate 2020, 8, 23. [Google Scholar] [CrossRef]
- Silva, Y.; Takahashi, K.; Chávez, R. Dry and wet rainy seasons in the Mantaro river basin (Central Peruvian Andes). Adv. Geosci. 2008, 14, 261–264. [Google Scholar] [CrossRef]
- Lavado-Casimiro, W.S.; Labat, D.; Ronchail, J.; Espinoza, J.C.; Guyot, J.L. Trends in rainfall and temperature in the Peruvian Amazon-Andes basin over the last 40 years (1965–2007). Hydrol. Process. 2013, 27, 2944–2957. [Google Scholar] [CrossRef]
- Sulca, J.; Takahashi, K.; Espinoza, J.C.; Vuille, M.; Lavado, W. Impacts of different ENSO flavors and tropical Pacific convection variability (ITCZ, SPCZ) on austral summer rainfall in South America, with a focus on Peru. Int. J. Climatol. 2018, 38, 420–435. [Google Scholar] [CrossRef]
- Lagos, P.; Silva, Y.; Nickl, E.; Mosquera, K. El Nino—Related precipitation variability in Peru. Adv. Geosci. 2008, 14, 231–237. [Google Scholar] [CrossRef]
- Sulca, J.; Vuille, M.; Dong, B. Interdecadal variability of the austral summer precipitation over the Central Andes. Front. Earth Sci. 2022, 10, 954954. [Google Scholar] [CrossRef]
- Humanes-Fuente, V.; Ferrero, M.E.; Muñoz, A.A.; González-Reyes Requena-Rojas, E.J.; Barichivich, J.; Inga, J.G.; Layme-Huaman, E.T. Two Centuries of Hydroclimatic Variability Reconstructed from Tree-Ring Records Over the Amazonian Andes of Peru. J. Geophys. Res. Atmos. 2020, 125, e2020JD032565. [Google Scholar] [CrossRef]
- Segura, H.; Espinoza, J.C.; Junquas, C.; Takahashi, K. Evidencing decadal and interdecadal hydroclimatic variability over the Central Andes. Environ. Res. Lett. 2016, 11, 094016. [Google Scholar] [CrossRef]
- Sulca, J.; Takahashi, K.; Tacza, J.; Espinoza, J.-C.; Dong, B. Decadal variability in the austral summer precipitation over the Central Andes: Observations and the empirical-statistical downscaling model. Int. J. Climatol. 2022, 42, 9836–9864. [Google Scholar] [CrossRef]
- Kumar, S.; del Castillo-Velarde, C.; Prado, J.M.V.; Rojas, J.L.F.; Gutierrez, S.M.C.; Alvarez, A.S.M.; Martine-Castro, D.; Silva, Y. Rainfall characteristics in the Mantaro basin over tropical Andes from a vertically pointed profile rain radar and in-situ field campaign. Atmosphere 2020, 11, 248. [Google Scholar] [CrossRef]
- Saavedra, M.; Junquas, C.; Espinoza, J.C.; Silva, Y. Impacts of topography and land use changes on the air surface temperature and precipitation over the central Peruvian Andes. Atmos. Res. 2020, 234, 104711. [Google Scholar] [CrossRef]
- Ampuero, A.; Stríkis, N.M.; Apaéstegui, J.; Vuille, M.; Novello, V.F.; Espinoza, J.C.; Cruz, F.W.; Vonhof, H.; Mayta, V.C.; Martins VT, S.; et al. The Forest Effects on the Isotopic Composition of Rainfall in the Northwestern Amazon Basin. J. Geophys. Res. Atmos. 2020, 125, e2019JD031445. [Google Scholar] [CrossRef]
- Aron, P.G.; Poulsen, C.J.; Fiorella, R.P.; Levin, N.E.; Acosta, R.P.; Yanites, B.J.; Cassel, E.J. Variability and Controls on δ18O, d-excess, and ∆′17O in Southern Peruvian Precipitation. J. Geophys. Res. Atmos. 2021, 126, e2020JD034009. [Google Scholar] [CrossRef]
- Bird, B.W.; Abbott, M.B.; Vuille, M.; Rodbell, D.T.; Stansell, N.D.; Rosenmeier, M.F. A 2300-year-long annually resolved record of the South American summer monsoon from the Peruvian Andes. Proc. Natl. Acad. Sci. USA 2011, 108, 8583–8588. [Google Scholar] [CrossRef] [PubMed]
- Apaéstegui, J.; Cruz, F.W.; Vuille, M.; Fohlmeister, J.; Espinoza, J.C.; Sifeddine, A.; Strikis, N.; Guyot, J.L.; Ventura, R.; Cheng, H.; et al. Precipitation changes over the eastern Bolivian Andes inferred from speleothem (δ18O) records for the last 1400 years. Earth Planet. Sci. Lett. 2018, 494, 124–134. [Google Scholar] [CrossRef]
- Vuille, M.; Burns, S.J.; Taylor, B.L.; Cruz, F.W.; Bird, B.W.; Abbott, M.B.; Kanner, L.C.; Cheng, H.; Novello, V.F. A review of the South American monsoon history as recorded in stable isotopic proxies over the past two millennia. Clim. Past 2012, 8, 1309–1321. [Google Scholar] [CrossRef]
- Valdivielso, S.; Vázquez-Suñé, E.; Custodio, E. Origin and variability of oxygen and hydrogen isotopic composition of precipitation in the Central Andes: A review. J. Hydrol. 2020, 587, 124899. [Google Scholar] [CrossRef]
- Samuels-Crow, K.E.; Galewsky, J.; Hardy, D.R.; Sharp, Z.; Worden, J.; Braun, C. Upwind convective influences on the isotopic composition of atmospheric water vapor over the tropical Andes. J. Geophys. Res. 2014, 119, 7051–7063. [Google Scholar] [CrossRef]
- Hurley, J.V.; Vuille, M.; Hardy, D.R.; Burns, S.; Thompson, L.G. Cold air incursions, δ18O variability and monsoon dynamics associated with snow days at Quelccaya Ice Cap, Peru. J. Geophys. Res. 2015, 120, 7467–7487. [Google Scholar] [CrossRef]
- Gonfiantini, R.; Roche, M.-A.; Olivry, J.-C.; Fontes, J.-C.; Zuppi, G.M. The altitude effect on the isotopic composition of tropical rains. Chem. Geol. 2001, 181, 147–167. [Google Scholar] [CrossRef]
- Fiorella, R.P.; Poulsen, C.J.; Pillco Zolá, R.S.; Barnes, J.B.; Tabor, C.R.; Ehlers, T.A. Spatiotemporal variability of modern precipitation δ18O in the central Andes and implications for paleoclimate and paleoaltimetry estimates. J. Geophys. Res. Atmos. 2015, 120, 4630–4656. [Google Scholar] [CrossRef]
- Vimeux, F.; Gallaire, R.; Bony, S.; Hoffmann, G.; Chiang, J.C.H. What are the climate controls on δD in precipitation in the Zongo Valley (Bolivia)? Implications for the Illimani ice core interpretation. Earth Planet. Sci. Lett. 2005, 240, 205–220. [Google Scholar] [CrossRef]
- Insel, N.; Poulsen, C.J.; Sturm, C.; Ehlers, T.A. Climate controls on Andean precipitation δ18O interannual variability. J. Geophys. Res. Atmos. 2013, 118, 9721–9742. [Google Scholar] [CrossRef]
- Hurley, J.V.; Vuille, M.; Hardy, D.R. On the interpretation of the ENSO signal embedded in the stable isotopic composition of Quelccaya Ice Cap, Peru. J. Geophys. Res. 2019, 124, 131–145. [Google Scholar] [CrossRef]
- Aggarwal, P.K.; Romatschke, U.; Araguas-Araguas, L.; Belachew, D.; Longstaffe, F.J.; Berg, P.; Schumacher, C.; Funk, A. Proportions of convective and stratiform precipitation revealed in water isotope ratios. Nat. Geosci. 2016, 9, 624–629. [Google Scholar] [CrossRef]
- Flores-Rojas, J.L.; Moya-Álvarez, A.S.; Valdivia-Prado, J.M.; Piñas-Laura, M.; Kumar, S.; Karam, H.A.; Villalobos-Puma, E.; Martínez-Castro, D.; Silva, Y. On the dynamic mechanisms of intense rainfall events in the central Andes of Peru, Mantaro valley. Atmos. Res. 2021, 248, 105188. [Google Scholar] [CrossRef]
- Sulca, J.; Vuille, M.; Silva, Y.; Takahashi, K. Teleconnections between the Peruvian Central Andes and Northeast Brazil during Extreme Rainfall Events in Austral Summer. J. Hydrometeorol. 2016, 17, 499–515. [Google Scholar] [CrossRef]
- Flores-Rojas, J.L.; Moya-Alvarez, A.S.; Kumar, S.; Martinez-Castro, D.; Villalobos-Puma, E.; Silva-Vidal, Y. Analysis of possible triggering mechanisms of severe thunderstorms in the tropical central Andes of Peru, Mantaro Valley. Atmosphere 2019, 10, 301. [Google Scholar] [CrossRef]
- Segura, H.; Espinoza, J.C.; Junquas, C.; Lebel, T.; Vuille, M.; Garreaud, R. Recent changes in the precipitation-driving processes over the southern tropical Andes/western Amazon. Clim. Dyn. 2020, 54, 2613–2631. [Google Scholar] [CrossRef]
- IAEA. IAEA/GNIP precipitation sampling guide. In Global Network of Isotopes in Precipitation (GNIP); IAEA: Vienna, Austria, 2014. [Google Scholar]
- Coplen, T.B. Laboratory Information Management System (LIMS) for Light Stable Isotopes; U.S. Geological Survey Open–File Report, 00–345. 2000; p. 121. Available online: http://water.usgs.gov/software/code/geochemical/lims/doc/ofr00345.pdf (accessed on 17 November 2021).
- Coplen, T.B.; Wassenaar, L.I. LIMS for Lasers 2015 for achieving long-term accuracy and precision of δ2H, δ17O, and δ18O of waters using laser absorption spectrometry. Rapid Commun. Mass Spectrom. 2015, 29, 2122–2130. [Google Scholar] [CrossRef]
- Siu Ki, L.; Leung, Y.; Wu, M. Backward Trajectory Analysis Using NOAA HYSPLIT Model; National Oceanic and Atmospheric Administration: Washington, DC, USA, 2006. [Google Scholar]
- Draxler, R.R.; Hess, G.D. An Overview of the HYSPLIT_4 Modelling System for Trajectories, Dispersion, and Deposition. Aust. Meteorol. Mag. 1998, 47, 295–308. [Google Scholar]
- Draxler, R. HYSPLIT4 User’ s Guide HYSPLIT4 USER’ s GUIDE, October; National Oceanic and Atmospheric Administration: Washington, DC, USA, 2009. [Google Scholar]
- Stein, A.F.; Draxler, R.R.; Rolph, G.D.; Stunder, B.J.B.; Cohen, M.D.; Ngan, F. NOAA’s hysplit atmospheric transport and dispersion modeling system. Bull. Am. Meteorol. Soc. 2015, 96, 2059–2077. [Google Scholar] [CrossRef]
- Van der Ent, R.J.; Tuinenburg, O.A. The residence time of water in the atmosphere revisited. Hydrol. Earth Syst. Sci. 2017, 21, 779–790. [Google Scholar] [CrossRef]
- Craig, H. Isotopic variations in meteoric waters. Science 1961, 133, 1702–1703. [Google Scholar] [CrossRef]
- Froehlich, K.; Gibson, J.; Aggarwal, P. Deuterium Excess in Precipitation and Its Climatological Significance; International Atomic Energy Agency (IAEA): Vienna, Austria, 2002. [Google Scholar]
- Jiménez-Iñiguez, A.; Ampuero, A.; Valencia, B.G.; Mayta, V.C.; Cruz, F.W.; Vuille, M.; Novello, V.F.; Misailidis Stríkis, N.; Aranda, N.; Conicelli, B. Stable isotope variability of precipitation and cave drip-water at Jumandy cave, western Amazon River basin (Ecuador). J. Hydrol. 2022, 610, 127848. [Google Scholar] [CrossRef]
- Dansgaard, W. Stable isotopes in precipitation. Tellus 1964, 16, 436–468. [Google Scholar] [CrossRef]
- Salati, E.; Dall’Olio, A.; Matsui, E.; Gat, J.R. Recycling of water in the Amazon Basin: An isotopic study. Water Resour. Res. 1979, 15, 1250–1258. [Google Scholar] [CrossRef]
- Risi, C.; Bony, S.; Vimeux, F. Influence of convective processes on the isotopic composition (δ18O and δD) of precipitation and water vapor in the tropics: 2. Physical interpretation of the amount effect. J. Geophys. Res. Atmos. 2008, 113, 1–12. [Google Scholar] [CrossRef]
- Vimeux, F.; Risi, C. Isotopic equilibrium between raindrops and water vapor during the onset and the termination of the 2005–2006 wet season in the Bolivian Andes. J. Hydrol. 2021, 598, 126472. [Google Scholar] [CrossRef]
- Lachniet, M.S. Sea surface temperature control on the stable isotopic composition of rainfall in Panama. Geophys. Res. Lett. 2009, 36, 1–5. [Google Scholar] [CrossRef]
- Risi, C.; Bony, S.; Vimeux, F.; Chong, M.; Descroix, L. Evolution of the stable water isotopic composition of the rain sampled along Sahelian squall lines. Q. J. R. Meteorol. Soc. 2010, 136 (Suppl. S1), 227–242. [Google Scholar] [CrossRef]
- Garreaud, R.; Vuille, M.; Clement, A.C. The climate of the Altiplano: Observed current conditions and mechanisms of past changes. Palaeogeogr. Palaeoclimatol. Palaeoecol. 2003, 194, 5–22. [Google Scholar] [CrossRef]
- Garreaud, R.D.; Vuille, M.; Compagnucci, R.; Marengo, J. Present-day South American climate. Palaeogeogr. Palaeoclimatol. Palaeoecol. 2009, 281, 180–195. [Google Scholar] [CrossRef]
- Marengo, J.A.; Liebmann, B.; Grimm, A.M.; Misra, V.; Silva Dias, P.L.; Cavalcanti, I.F.A.; Carvalho, L.M.V.; Berbery, E.H.; Ambrizzi, T.; Vera, C.S.; et al. Recent developments on the South American monsoon system. Int. J. Climatol. 2012, 32, 1–21. [Google Scholar] [CrossRef]
- Segura, H.; Espinoza, J.C.; Junquas, C.; Lebel, T.; Vuille, M.; Condom, T. Extreme austral winter precipitation events over the South-American Altiplano: Regional atmospheric features. Clim. Dyn. 2022, 59, 3069–3086. [Google Scholar] [CrossRef]
- Espinoza, J.C.; Ronchail, J.; Guyot, J.L.; Junquas, C.; Drapeau, G.; Martinez, J.M.; Santini, W.; Vauchel, P.; Lavado, W.; Ordoñez, J.; et al. From drought to flooding: Understanding the abrupt 2010–11 hydrological annual cycle in the Amazonas River and tributaries. Environ. Res. Lett. 2012, 7, 024008. [Google Scholar] [CrossRef]
- Marengo, J.A.; Espinoza, J.C. Extreme seasonal droughts and floods in Amazonia: Causes, trends and impacts. Int. J. Climatol. 2016, 36, 1033–1050. [Google Scholar] [CrossRef]
- Garreaud, R.D. A plausible atmospheric trigger for the 2017 coastal El Niño. Int. J. Climatol. 2018, 38, e1296–e1302. [Google Scholar] [CrossRef]
- Takahashi, K.; Martínez, A.G. The very strong coastal El Niño in 1925 in the far-eastern Pacific. Clim. Dyn. 2019, 52, 7389–7415. [Google Scholar] [CrossRef]
- Takahashi, K.; Montecinos, A.; Goubanova, K.; Dewitte, B. ENSO regimes: Reinterpreting the canonical and Modoki El Niño. Geophys. Res. Lett. 2011, 38, L10704. [Google Scholar] [CrossRef]
- Lavado-Casimiro, W.; Espinoza, J.C. Impactos de El Niño y La Niña en las lluvias del Perú (1965–2007). Rev. Bras. Meteorol. 2014, 29, 171–182. [Google Scholar] [CrossRef]
- Cai, Z.; Tian, L.; Bowen, G.J. ENSO variability reflected in precipitation oxygen isotopes across the Asian Summer Monsoon region. Earth Planet. Sci. Lett. 2017, 475, 25–33. [Google Scholar] [CrossRef]
- Rodriguez-Caton, M.; Andreu-Hayles, L.; Daux, V.; Vuille, M.; Varuolo-Clarke, A.; Oelkers, R.; Christie, D.A.; D’Arrigo, R.; Morales, M.S.; Palat Rao, M.; et al. Hydroclimate and ENSO variability recorded by oxygen isotopes from tree rings in the South American Altiplano. Geophys. Res. Lett. 2022, 49, e2021GL095883. [Google Scholar] [CrossRef]
- Peng, Q.; Xie, S.P.; Wang, D.; Zheng, X.-T.; Zhang, H. Coupled ocean-atmosphere dynamics of the 2017 extreme coastal El Niño. Nat. Commun. 2019, 10, 298. [Google Scholar] [CrossRef] [PubMed]
- Kanner, L.C.; Burns, S.J.; Cheng, H.; Edwards, R.L. High-latitude forcing of the South American summer monsoon during the last glacial. Science 2012, 335, 570–573. [Google Scholar] [CrossRef]
- Mark, B.G.; French, A.; Baraer, M.; Carey, M.; Bury, J.; Young, K.R.; Polk, M.H.; Wigmore, O.; Lagos, P.; Crumley, R.; et al. Glacier loss and hydro-social risks in the Peruvian Andes. Glob. Planet. Chang. 2017, 159, 61–76. [Google Scholar] [CrossRef]
- Hersbach, H.; Bell, B.; Berrisford, P.; Hirahara, S.; Horányi, A.; Muñoz-Sabater, J.; Nicolas, J.; Peubey, C.; Radu, R.; Schepers, D.; et al. The ERA5 global reanalysis. Q. J. R. Meteorol. Soc. 2020, 146, 1999–2049. [Google Scholar] [CrossRef]
Figure 1.
(A) Location of the Mantaro River Basin within South America. D01: Domain with a spatial resolution of 27 km used for the calculation of wind back-trajectories. (B) The Marcapomacocha station (white square) and the Huayao station (white circle) located in the Mantaro River Basin (red line). The topography was derived from SRTM (Shuttle Radar Topography Mission) data with a resolution of 90 m. (C) Monthly mean precipitation in the Mantaro River Basin. Spatial distribution of (D) average annual precipitation (mm) and (E) average annual temperature over the MRB based on the long-term means from 2006 to 2019 with data from IMERG and ERA5, respectively.

Figure 2.
(A): Temporal variation in precipitation amount, Dxs, and δ18O from January 2006 to March 2018. Light blue bars and purple circles indicate monthly precipitation, Dxs (top panel) and δ18O (bottom panel) at the Huayao station, respectively. Grey bars and light blue circles indicate monthly precipitation, Dxs (top panel) and δ18O (bottom panel) at the Marcapomacocha station, respectively. The red dashed line represents the global average Dxs (10‰). Note that scale for δ18O is reversed. (B): Global (GMWL) and Local (LMWL) water lines, purple and light blue circles indicate δ18O and δ2H at the Huayao and Marcapomacocha Stations respectively.

Figure 3.
Top panel: Time series of monthly δ18O anomalies (blue dots and line) and standardized annual rainfall calculated for the hydrological year in the Mantaro Basin (gray bars). Bottom panel: Scatter plots between amount-weighted annual isotopic composition against annual local environmental parameters: precipitation (left panel), relative humidity (middle panel), and temperature (right panel). Black line represents the linear regression.

Figure 4.
Clusters of 7-day wind back–trajectories calculated using the HYSPLIT model for the Huayao station (A) and the Marcapomacocha station (B) at 500 hPa from December 2016–June 2018 and January 2006–March 2012, respectively. (C,D) Percentages of total precipitation (per month) for each cluster.

Figure 5.
Regional atmospheric circulation during the extreme events in the summers (January, February, and March) of 2010 (top panels) and 2017 (bottom panels). (A,F) Daily mean precipitation anomalies, (B,G) vertically integrated moisture flux and wind vectors, (C,H) frequency of back-trajectories in percent, (D,E,I,J) zonal cross-sections of moisture flux and moisture flux convergence along latitude of the Huayao and Marcapomacocha stations, respectively.

Disclaimer/Publisher’s Note: The statements, opinions and data contained in all publications are solely those of the individual author(s) and contributor(s) and not of MDPI and/or the editor(s). MDPI and/or the editor(s) disclaim responsibility for any injury to people or property resulting from any ideas, methods, instructions or products referred to in the content. |
© 2023 by the authors. Licensee MDPI, Basel, Switzerland. This article is an open access article distributed under the terms and conditions of the Creative Commons Attribution (CC BY) license (https://creativecommons.org/licenses/by/4.0/).
Share and Cite
MDPI and ACS Style
Apaéstegui, J.; Romero, C.; Vuille, M.; Sulca, J.; Ampuero, A. Moisture Sources and Rainfall δ18O Variability over the Central Andes of Peru—A Case Study from the Mantaro River Basin. Water 2023, 15, 1867. https://doi.org/10.3390/w15101867
AMA Style
Apaéstegui J, Romero C, Vuille M, Sulca J, Ampuero A. Moisture Sources and Rainfall δ18O Variability over the Central Andes of Peru—A Case Study from the Mantaro River Basin. Water. 2023; 15(10):1867. https://doi.org/10.3390/w15101867
Chicago/Turabian StyleApaéstegui, James, Carol Romero, Mathias Vuille, Juan Sulca, and Angela Ampuero. 2023. "Moisture Sources and Rainfall δ18O Variability over the Central Andes of Peru—A Case Study from the Mantaro River Basin" Water 15, no. 10: 1867. https://doi.org/10.3390/w15101867
Note that from the first issue of 2016, this journal uses article numbers instead of page numbers. See further details here.