
Spatio-Temporal Heterogeneity of Soil Moisture on Shrub–Grass Hillslope in Karst Region
by

Juncai Li
1, 
Xiaorong Meng
1,
Hua Li
1,
Xiaoxiao Gu
1,
Xiaojun Cai
1,
Yuanlong Li
1 and
Qiuwen Zhou
2,* 1
Kunming General Survey of Natural Resources Center, Technology Innovation Center for Natural Ecosystem Carbon Sink, Ministry of Natural Resources, Kunming 650100, China
2
School of Geography and Environmental Science, Guizhou Normal University, Guiyang 550001, China
*
Author to whom correspondence should be addressed.
Water 2023, 15(10), 1868; https://doi.org/10.3390/w15101868
Submission received: 9 March 2023
/
Revised: 26 April 2023
/
Accepted: 10 May 2023
/
Published: 15 May 2023
(This article belongs to the Special Issue High-Resolution Monitoring and Modelling for Water Resources Management: New Sensors, New Approaches and Applications)
Abstract
:Influenced by the topography, the spatial variation of soil thickness on karst slopes is very large, and accordingly the spatial variation of soil moisture is also large. Therefore, analyzing the spatial heterogeneity of soil moisture on hillslopes is important for maintaining ecosystem stability. Combining geostatistical methods and GIS technology, the spatial variability and distribution pattern of soil moisture and the influencing factors of spatial variation and surface soil moisture (0–7 cm) on a typical karst shrub–grass hillslope were analyzed. The results showed that the mean soil moisture and coefficient of variation (CV) ranged between 25.7–42.6% and 10.3–20.9%, respectively, showing a moderate variation. The soil moisture presented a moderate or strong spatial autocorrelation in the sampling scale. The occurrence of rainfall events can exert a great influence on reducing the spatial heterogeneity of soil moisture. The spatial distribution pattern of soil moisture showed roughly plaque or stripe distribution. When soil moisture was much lower, the patch space fragmentation of soil moisture was higher. The soil moisture was higher in the low and middle parts of the plot. We can conclude that factors such as topography, vegetation, and weather conditions will exert a significant effect on soil moisture spatial variability. Areas with lower slope and higher vegetation coverage were more conducive to the retention of soil moisture.
1. Introduction
Soil moisture is the link between the soil, vegetation, and atmosphere continuum, and it plays a significant role in controlling water resource allocation, energy conversion, and climate change. It plays a critical role in terrestrial eco-hydrological processes [1,2,3]. Soil moisture is not only the core of the connection and circulation of water systems in the Earth’s critical zones, but it is also an important component of surface water resources [4,5]. Its spatial distribution plays an important part in affecting runoff generation, soil erosion, vegetation cover, and the surface materials redistribution process [6,7].
The karst area in the southwest of China is one of the largest, most concentrated, and most developed karst landforms in the world [8,9]. The karst ecological ecosystems are fragile and have been degraded with shallow soil and a wide range of exposed bedrock [10,11]. Although precipitation in the karst area is abundant [12], however, precipitation in the area tends to infiltrate rapidly due to the unique two-dimensional hydraulic structure resulting from the dissolution of carbonate rocks by water, which leads to a special karst drought phenomenon [13,14,15]. Due to the special habitat conditions in karst areas, soil moisture content is not only the main limiting factor for vegetation growth in karst areas, but it is also the driving force of karst rocky desertification and one of the influential factors of soil loss [16,17].
Due to the importance of soil moisture in karst areas, the spatial heterogeneity of soil moisture under different vegetation types [18], land use types [7,19], climatic conditions [20,21], and other environmental conditions has received much attention [22,23,24]. For instance, Zhang et al. [25] believe that the water holding capacity of soil water in shrub land is stronger than that of grass land on karst hillslopes and that the temporal variation trend of soil water is the same as rainfall. Wang et al. [26] examined the temporal stability of surface soil moisture content on two karst hillslopes in southwest China, finding that the shrub land was wetter than the mixed grass-shrub land. Some scholars have also studied the spatial distribution and influential factors of soil moisture in karst peak clusters. For example, Famiglietti et al. [27] believes that the dominant factors of spatial variability of soil water content gradually transforms from soil heterogeneity to topography and soil-combined action after significant rainfall events. Owing to the rich and varied habitats in karst areas, the soil moisture is highly spatially variable.
Geostatistics is widely applied in the study of soil moisture because it can quantitatively describe the spatial variability of regional variables with the change of distance. Many scholars have adopted geostatistical methods to analyze spatio-temporal variability and influential factors of soil moisture in typical karst regions. For example, Zhang et al. [28] found that a strong spatial dependence of surface soil moisture exists in karst depressions. Rainfall events can effectively reduce the spatial heterogeneity of soil moisture and the variation of soil moisture in the dry season is more sensitive to the previous rainfall than in the wet season. Martinez-Murillo et al. [29] applied geostatistical methods to analyze the response of soil moisture to various environmental factors under different climatic conditions. Yang et al. [30] used different Kriging interpolation methods to evaluate and compare the spatial distribution of soil moisture based on topographical factors.
Although spatial heterogeneity of soil moisture has received much attention as an important landscape type in karst areas, the spatial heterogeneity of soil moisture on mixed shrub and shrub–grass hillslopes has received less attention, especially when combined with geostatistical methods and sample plot scale perspectives. Therefore, the purpose of this work is to reveal the spatio-temporal heterogeneity and spatial distribution of soil moisture on a karst shrub–grass hillslope. The geostatistics method was applied and a karst shrub–grass hillslope in the Huaxi District of Guizhou Province was selected as a case study. This work is not definitive but is a kind of exploratory study.
2. Materials and Methods
2.1. Study Area
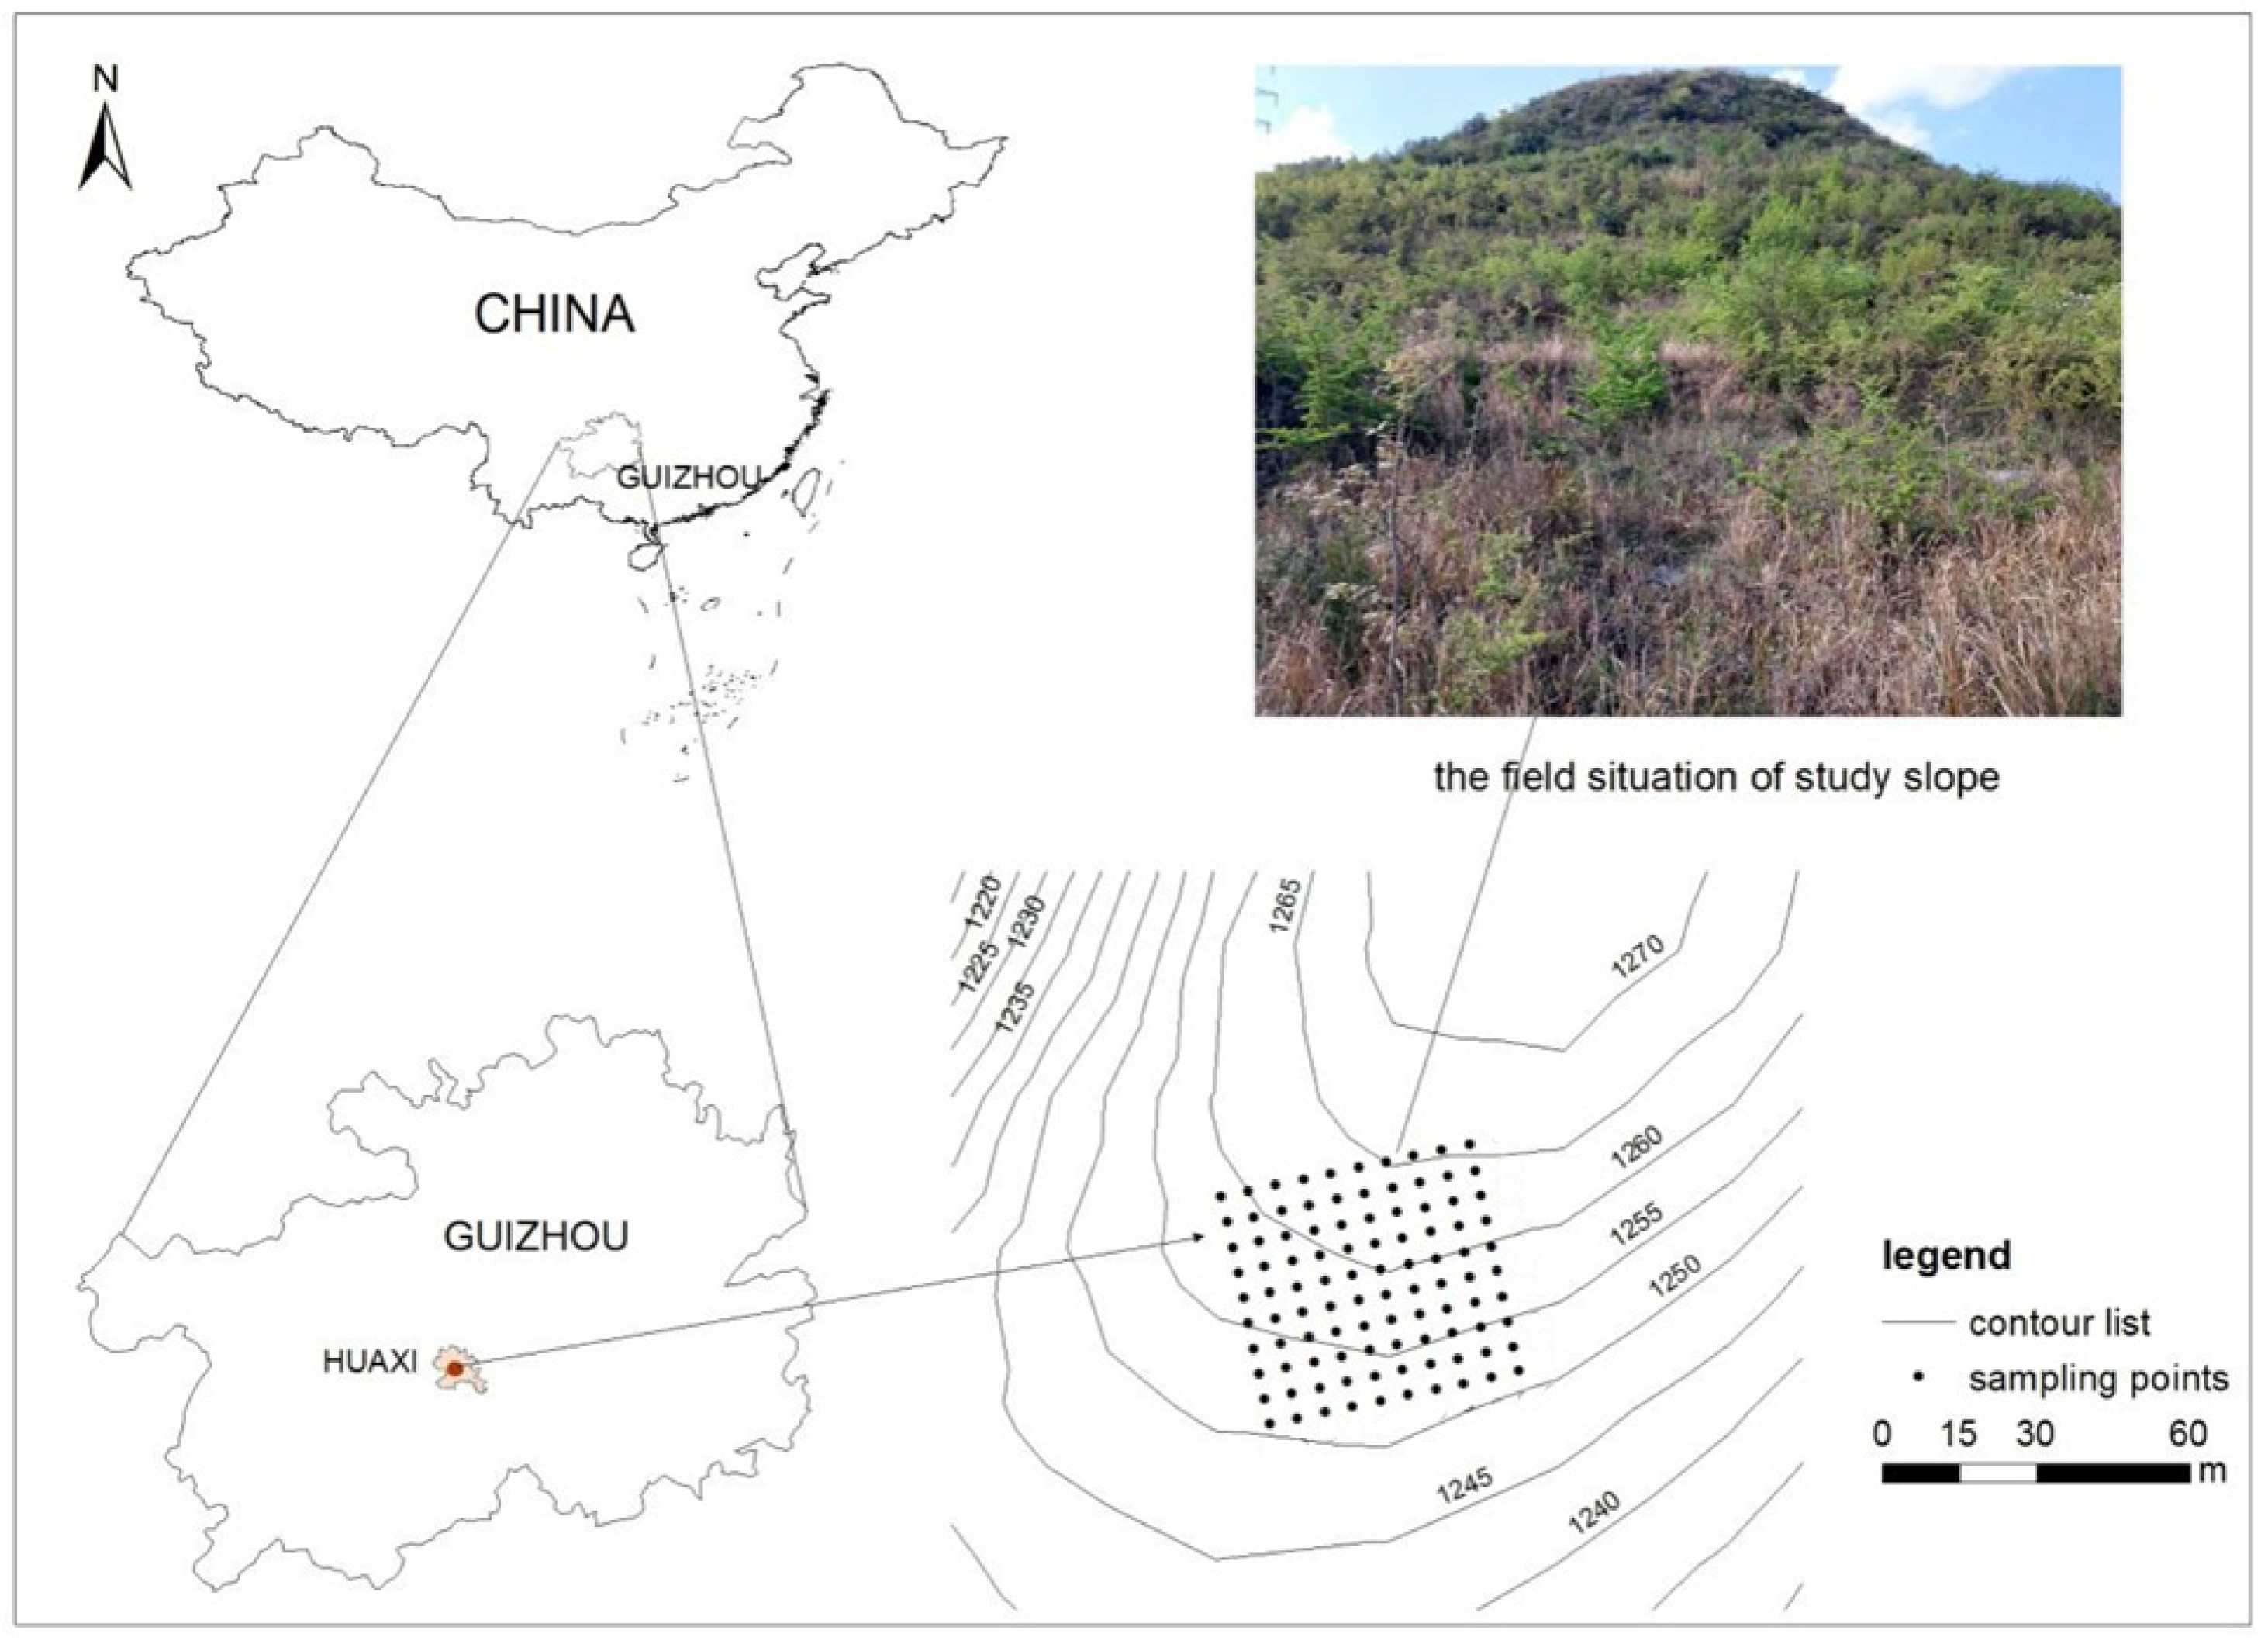
The study was conducted in the Doupengshan small watershed of Huaxi District, Guizhou Province (106°27′ E–106°52′ E, 26°11′ N–26°34′ N). The elevation range of this watershed is 1140–1240 m above sea level, and the average elevation reaches 1200 m. The landforms of the small watershed are mainly peak cluster depressions with broken terrain and a high degree of karst rocky desertification. Bedrock is composed of limestone and the soil type is predominantly Rendzic Leptosols with small soil thicknesses, between 10 and 30 cm. This area has a plateau monsoon humid climate where rainfall is abundant, but the spatio-temporal distribution differences of rainfall are evident. Specifically, the average annual temperature is 14.9 °C, the maximum temperature is 35.1 °C, the minimum annual temperature is −7.3 °C, and the annual rainfall is 1178.3 mm. The main vegetation types include trees, such as Pinus massoniana (Pinus massoniana Lamb), German oak (Quercus acutissima Carruth), Cinnamomum glanduliferum (Cinnamomum glanduliferum (Wall.) Nees), and Chinese sweet gum (Liquidambar formosana Hance), as well as shrubs and barren hills.
2.2. Sampling Point Layout
Considering the topographical features and vegetation distribution of the hillslope, a mixed shrub–grass hillslope (50 m × 50 m) was chosen for plot measuring in this area. Based on a grid sampling scheme measuring (5 m × 5 m), a total of 100 sampling quadrats were established. The soil moisture of the surface layer (0–7 cm) was determined by a Time Domain Reflectometer (TDR). The soil layer is shallow in karst areas, and the surface soil moisture is important to maintaining the stability of the karst ecosystem. Therefore, we selected the topsoil layer for sampling (0–7 cm). The measurement range of TDR ranges from 0 to 100%, the accuracy is ±2%, the response time is ≤2 s, and the working environment is −40–80 °C. The probe length is 7.5 cm, and for each measurement we removed any undecomposed litter from the surface and then inserted the probe vertically into the ground. Before the first measurement, 20 soil samples were taken from the sample plots and dried and weighed; then we converted the mass water content obtained by weighing the volume water content. Meanwhile, the soil moisture was measured with the TDR probe at the same location. The soil moisture results obtained from the drying and weighing were used to calibrate the TDR probe. The soil moisture was determined three times, and the mean soil moisture was taken as the soil moisture of the sample. The three measurement points were distributed at the midpoint of the diagonal of a 5 m × 5 m grid square and at one-quarter of the length of the diagonal. If there was bare rock on one diagonal measurement point, the measurement was switched to the other diagonal. If bare rock could not be avoided on both diagonals, the location of the measurement point was shifted appropriately. The biggest challenge in the measurement process was that soil with a lot of bare bedrock or gravel was often encountered, resulting in inaccurate measurements. Therefore, measurements should be taken at the point where soil properties are relatively uniform through appropriately shifting the position. Measurements were conducted a total of 9 times between 1 April 2018 and 17 June 2018. This period was chosen because April to June is the period of transition from spring to summer in this region. This period has both light and heavy rainfall intensities. It can represent different soil moisture conditions. The nine measurement dates were chosen based on the fact that the nine measurements were spread as evenly as possible over the study period. On this basis, we tried to choose a few dates when it was not raining on that day. However, since this period is the rainy season, it was still difficult to avoid the presence of rainfall on some dates. The rainfall statistics were measured by an automatic meteorological station. The geographical location information of the sampling points was recorded by portable GPS. The distribution of sampling points is shown in Figure 1.
The lower part of the selected slope grows densely with grass, the terrain is relatively flat, and the soil layer is much thicker. In the middle part of the plot, the soil is loose in texture with more gravel and the slope becomes steeper. The vegetation types are shrubs, herbs, and ferns. There is a platform in the upper part of the slope; the slope becomes gentle and thicker shrubs grow. The vegetation at the top of the plot is sparse, mainly growing vines and herbaceous plants, and the soil is loose in texture and the soil layer is shallow.
2.3. Data Analysis
Descriptive statistics and single-sample Kolmogorov–Smilov (KS) tests were conducted with SPSS 23 software [31]. Spatial autocorrelation analysis, omnidirectional experimental semivariogram calculation, and model fitting were achieved by the geostatistical software GS 9.0 [32], and ordinary Kriging interpolation was finished in Arcgis10.2 [33]. The geostatistical analysis method is described briefly as follows.
(1) Spatial autocorrelation analysis can be used to test whether the spatial variable has a spatial dependency. This work analyzes spatial autocorrelation of soil moisture by Moran’s I coefficient. The formula is as follows:
where xi and xj are the values of the variable x at the adjacent pairing space points i and j, respectively. Wij is the adjacent weight, and n is the total number of spatial units.
(2) The omnidirectional experimental semivariogram is a unique function that reflects the randomness and structure of the peculiar variable. The omnidirectional experimental semivariogram is generally considered to be meaningful within 1/2 of the maximum interval [34]. The formula is as follows:
where γ(h) is the semivariogram, h is the separation distance, N(h) is the number of pairs of points with the distance of vector h, Z(xi) is the value of the regionalized variable Z at xi, and Z(xi + h) is the value of the variable at a given lagged distance interval of xi + h.
(3) The models with the smallest root mean square error (RMSE) and the largest R2 are optimal models for omnidirectional experimental semivariograms. We tried to fit with the same model, but it is difficult to achieve the desired results with the same model for different sampling dates. Therefore, we chose the optimal model for each of the sampling dates, and there are three models: an exponential model (Equation (3)), a spherical model (Equation (4)) and a Gaussian model (Equation (5)) in this work [35,36,37]. The formulas are as follows:
where C0 is the nugget variance, C0 + C is the total sill, C is the partial sill, h is the lagged distance, and a is the range (correlation length). For the spherical and Gaussian models, the range and effective range coincide; this is not the case for the exponential model, where the range is 1/3 of the effective range. For the spherical and Gaussian models, the effective range is the distance at which the sill is approached, but for the exponential variogram the effective range is the distance at which the exponential variogram approaches 95% of the sill.
In this study, Moran’s I coefficient is mainly used to analyze the spatial autocorrelation degree of soil moisture. The omnidirectional experimental semivariogram is used to analyze the spatial variability of soil moisture, which mainly reflects the spatial stochasticity and structure. Although the above two indexes have some similarities, the focus is different.
3. Results
3.1. Statistical Characteristics of Soil Moisture
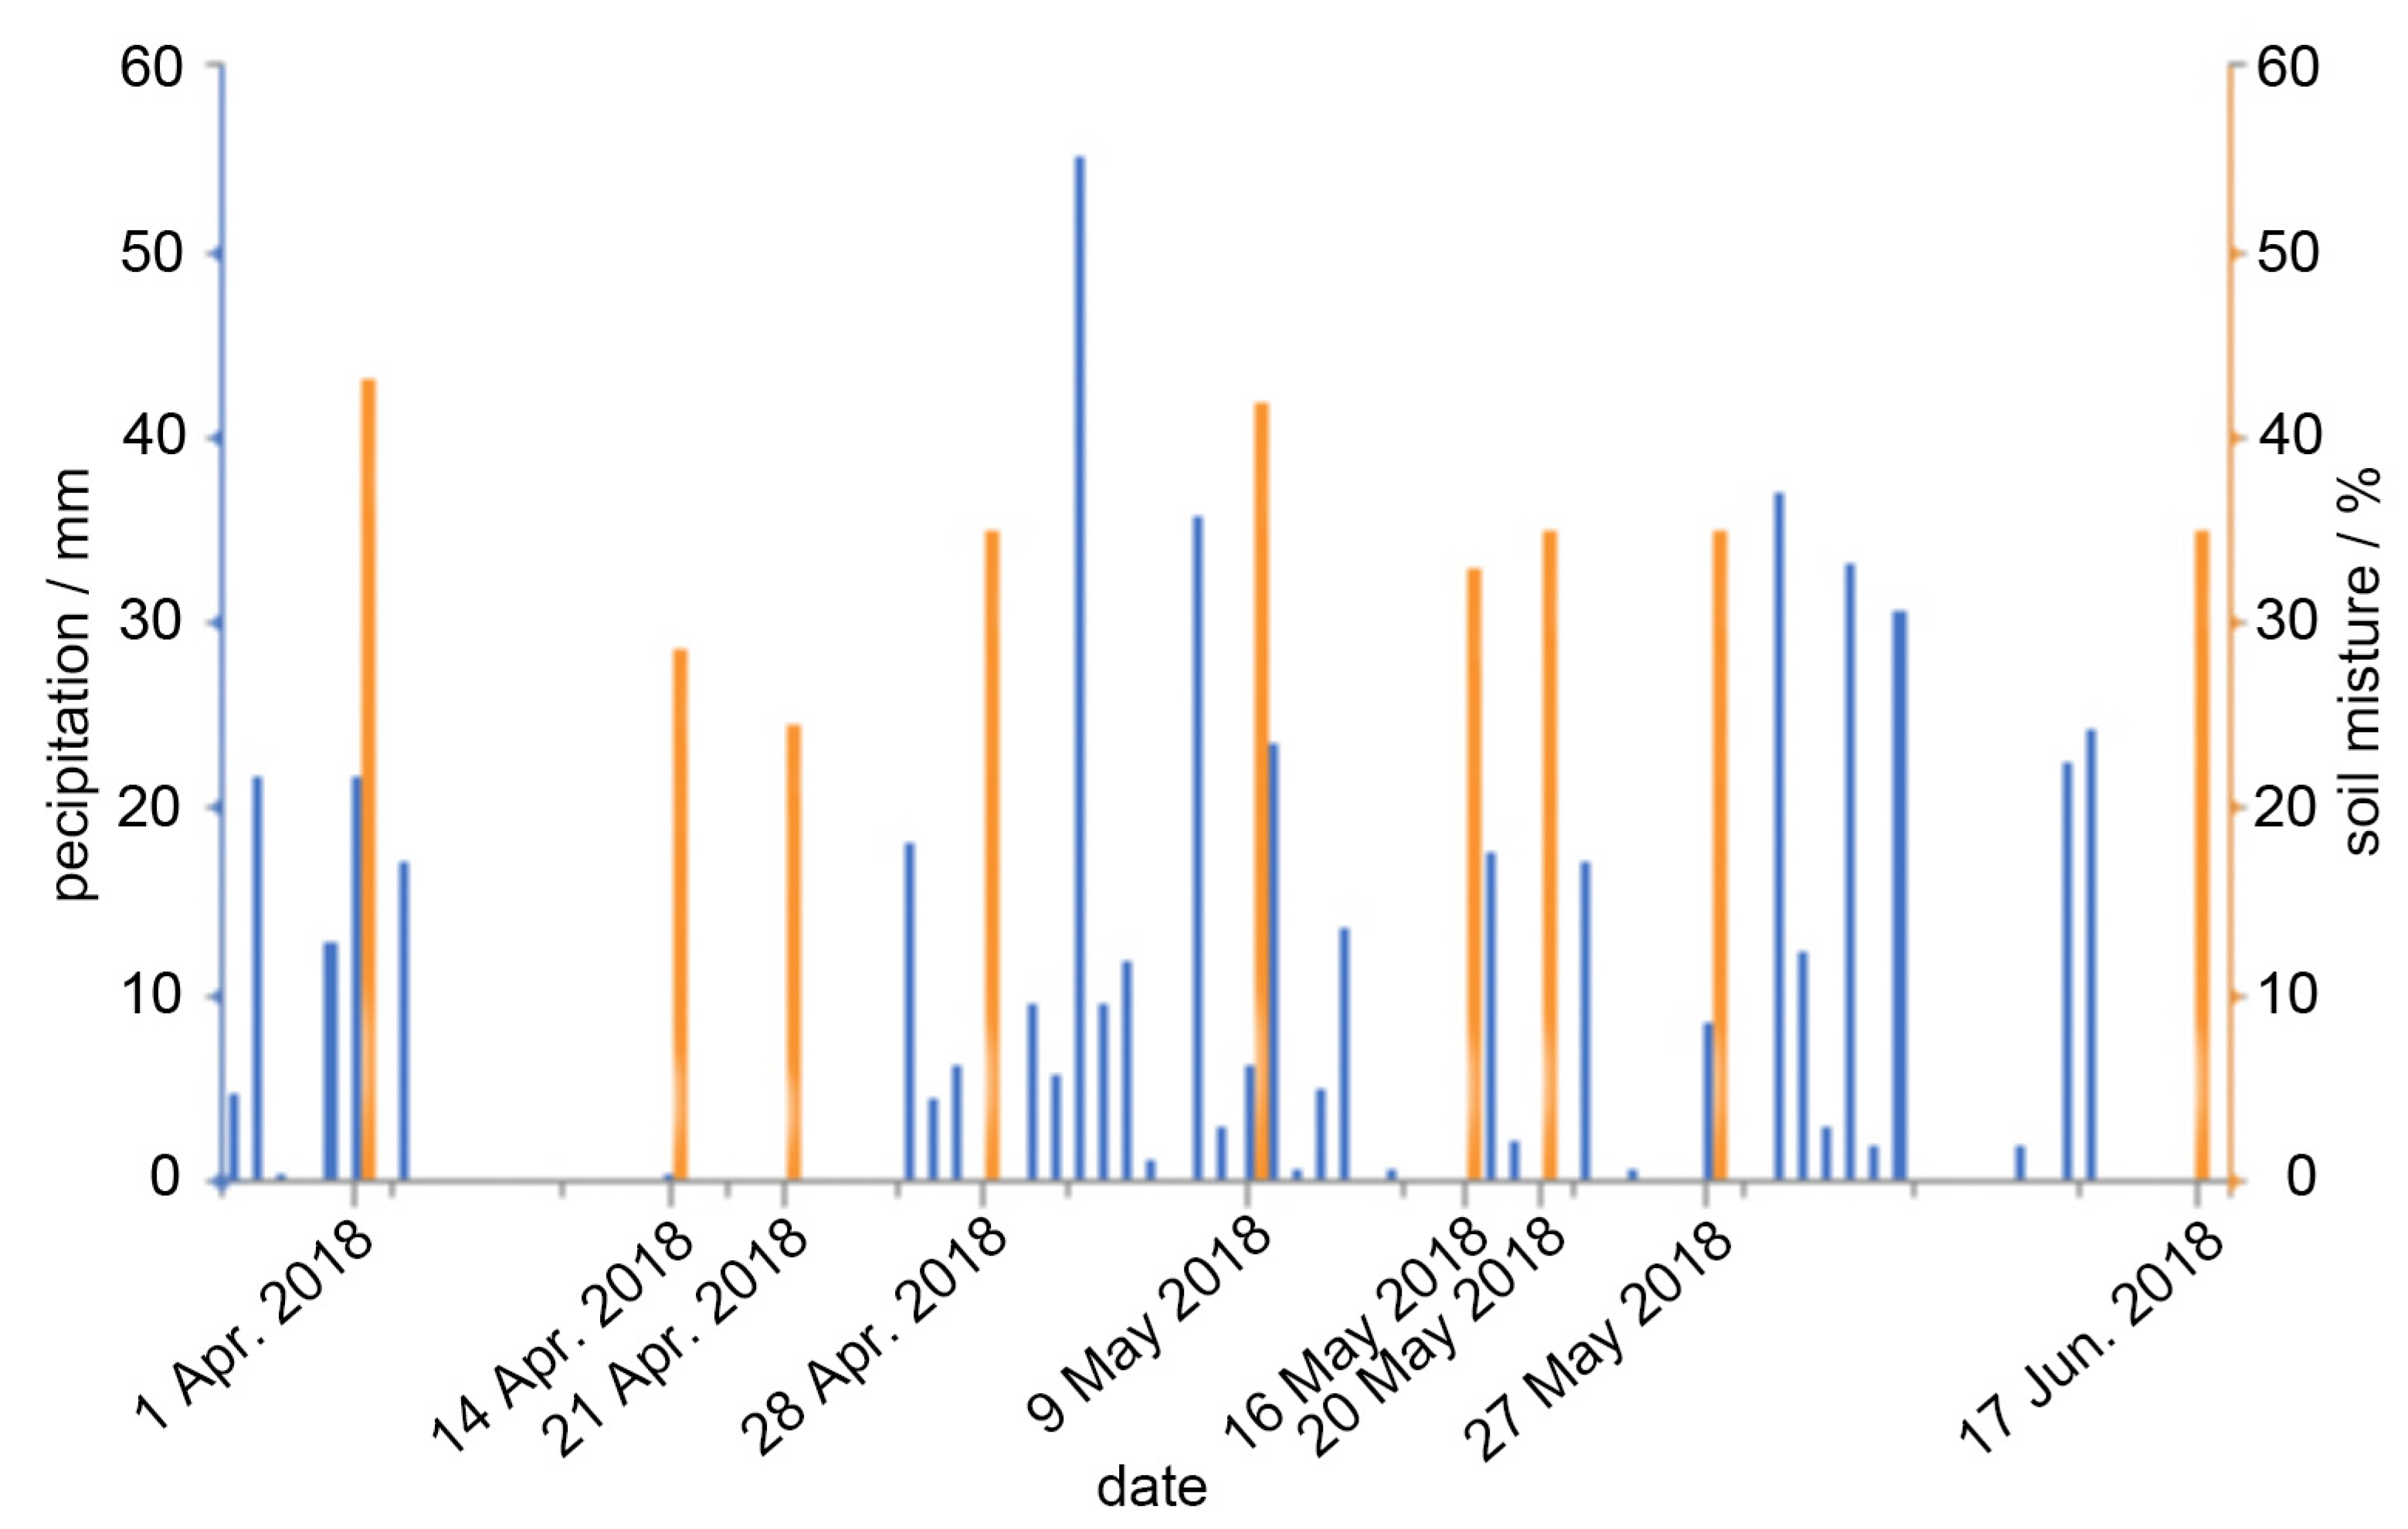
During the sampling period, the mean soil moisture (0–7 cm) on the hillslope ranged from 25.67% to 42.60%, and the maximum and minimum ranged between 38.17–58.37% and 11.50–24.80%, respectively (Table 1). The precipitation situation during the period is shown in Figure 2. After the rain, the soil moisture was significantly higher than when rainfall had not happened. The rainfall and mean soil moisture were significantly correlated (p < 0.01) and the correlation coefficient was 0.83. The coefficient of variation (CV) of soil moisture among the sample points ranged from 10.31% to 20.91%. The CV was larger on 21 April and 17 June, and it was the smallest on 27 May. Before conducting the geostatistical analysis, the data were subjected to the single-sample Kolmogorov–Smilov test with SPSS 23 software. The results showed that except for the sampling data that exhibited approximately normal distribution on 14 April, the other samples were in normal distribution at the level of 0.05. Therefore, we did not transform the data before performing the geostatistical analysis.
3.2. Spatial Autocorrelation Analysis of Soil Moisture
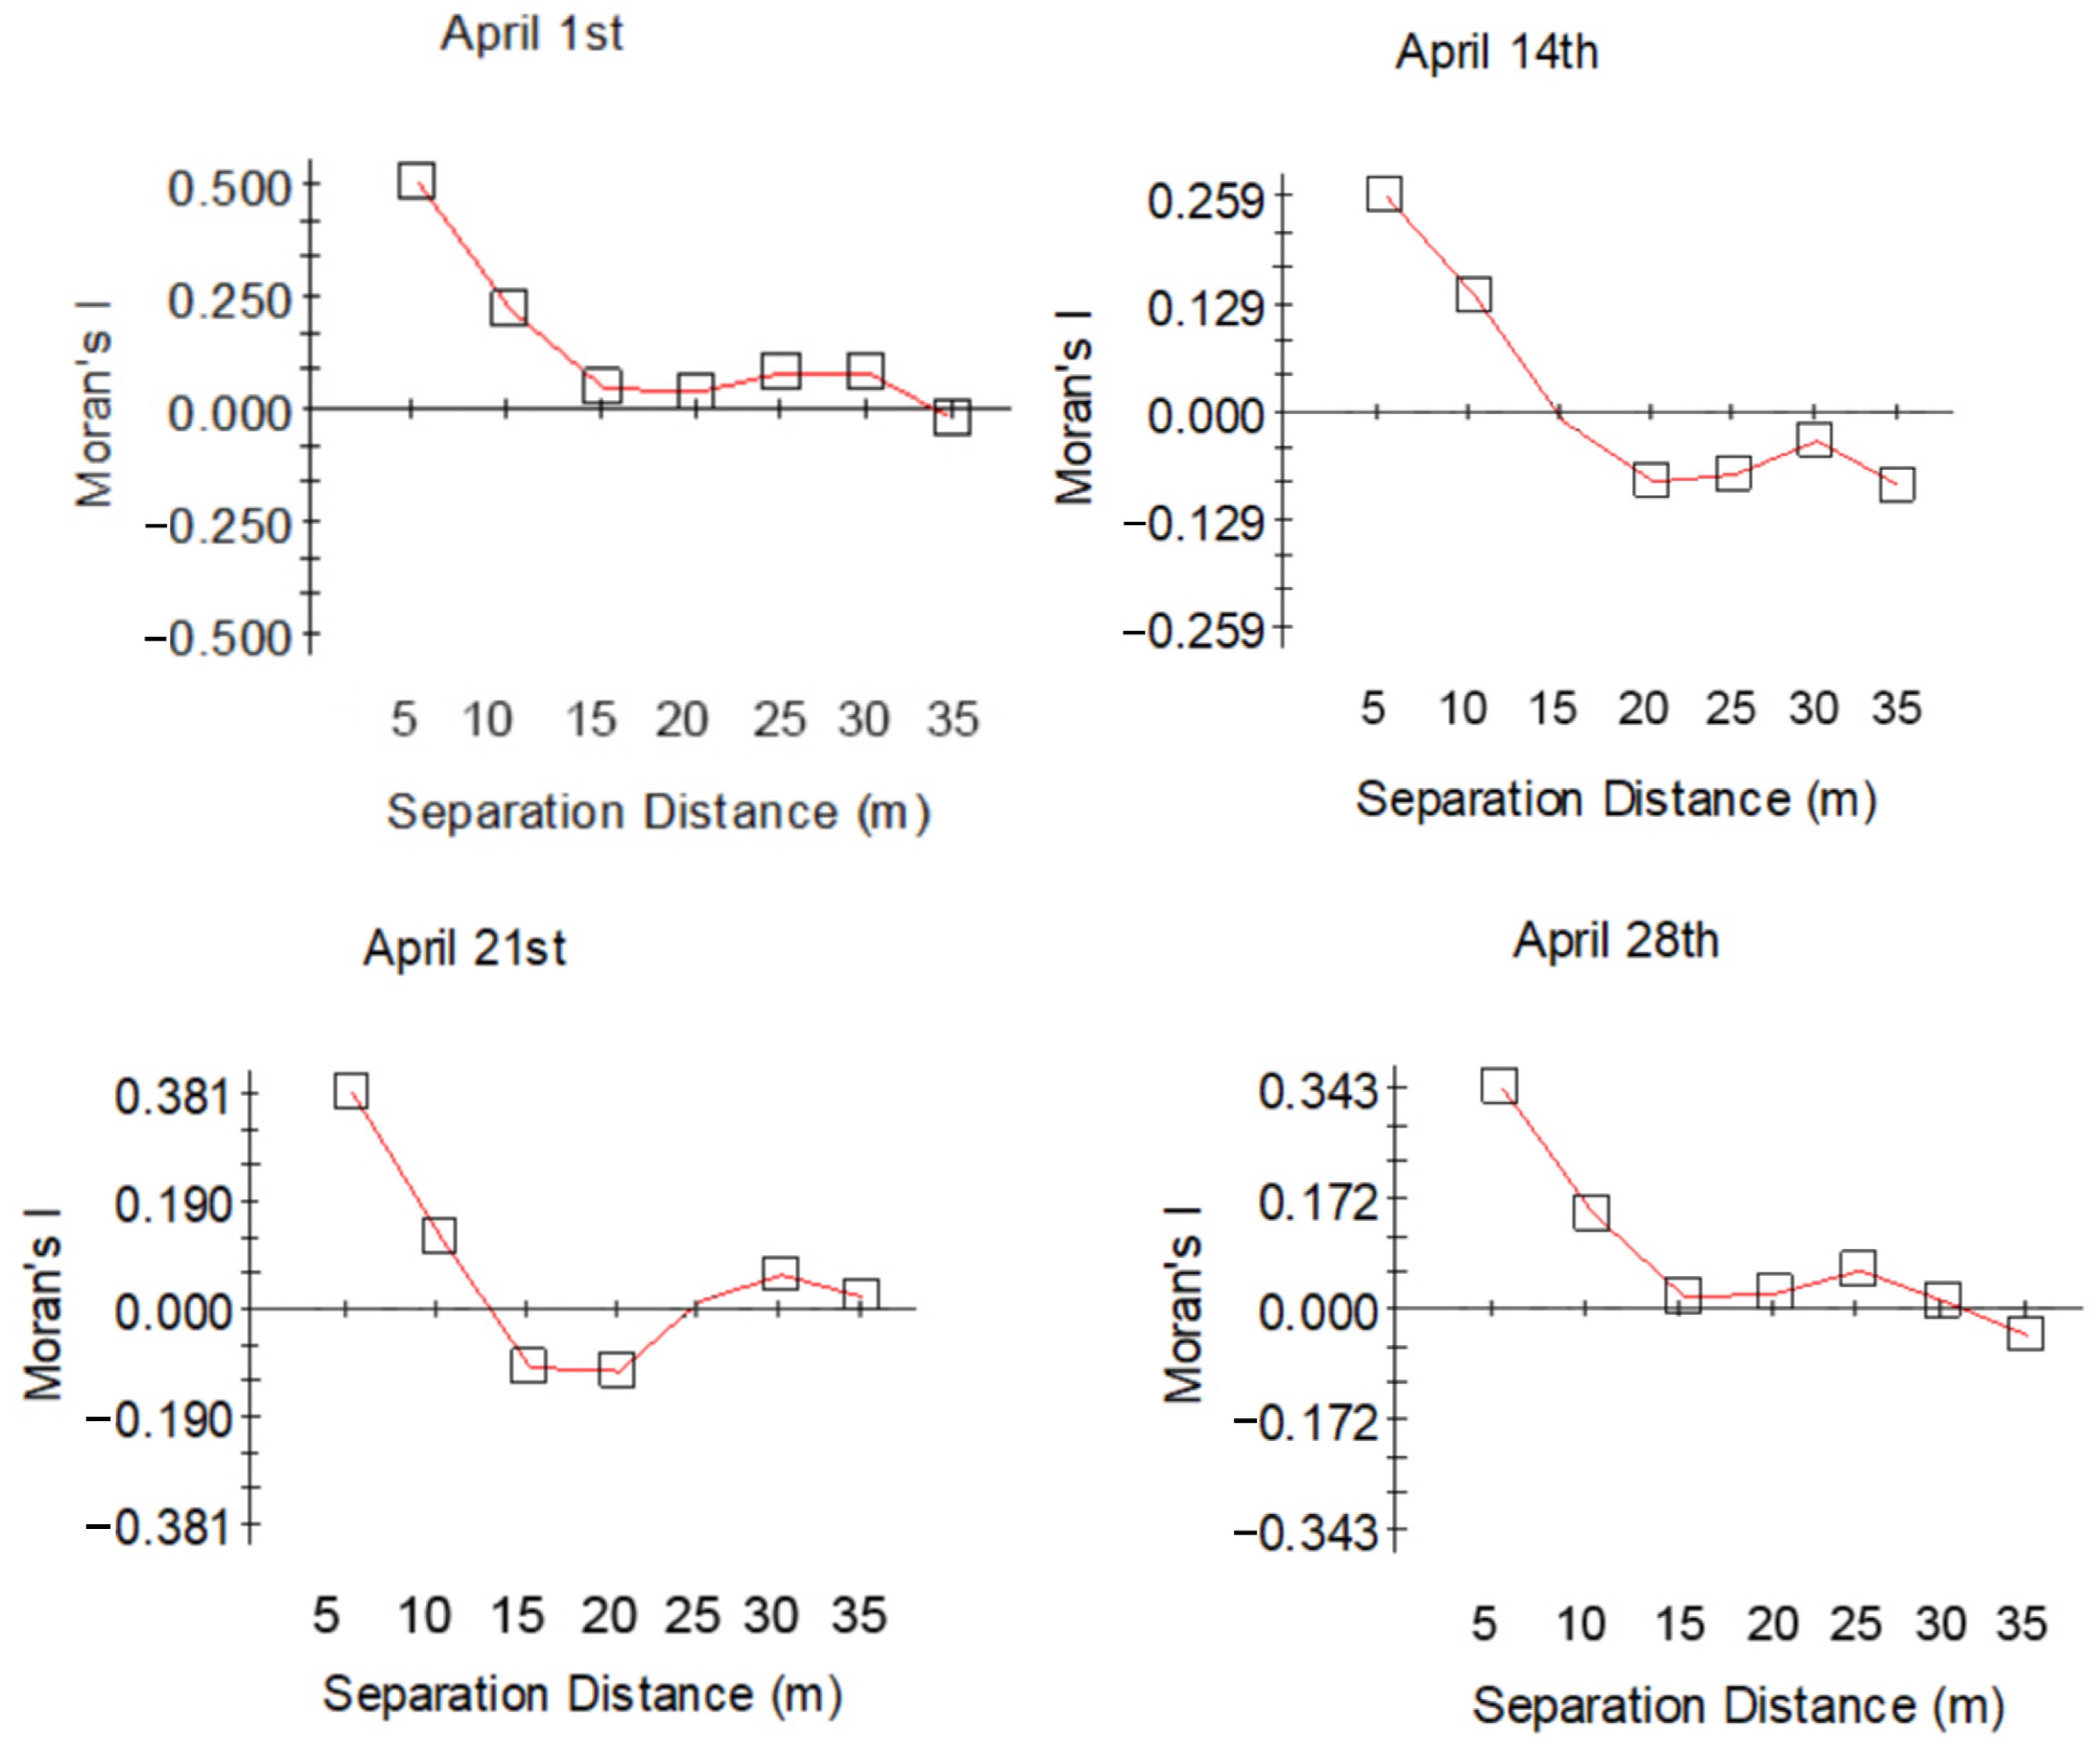
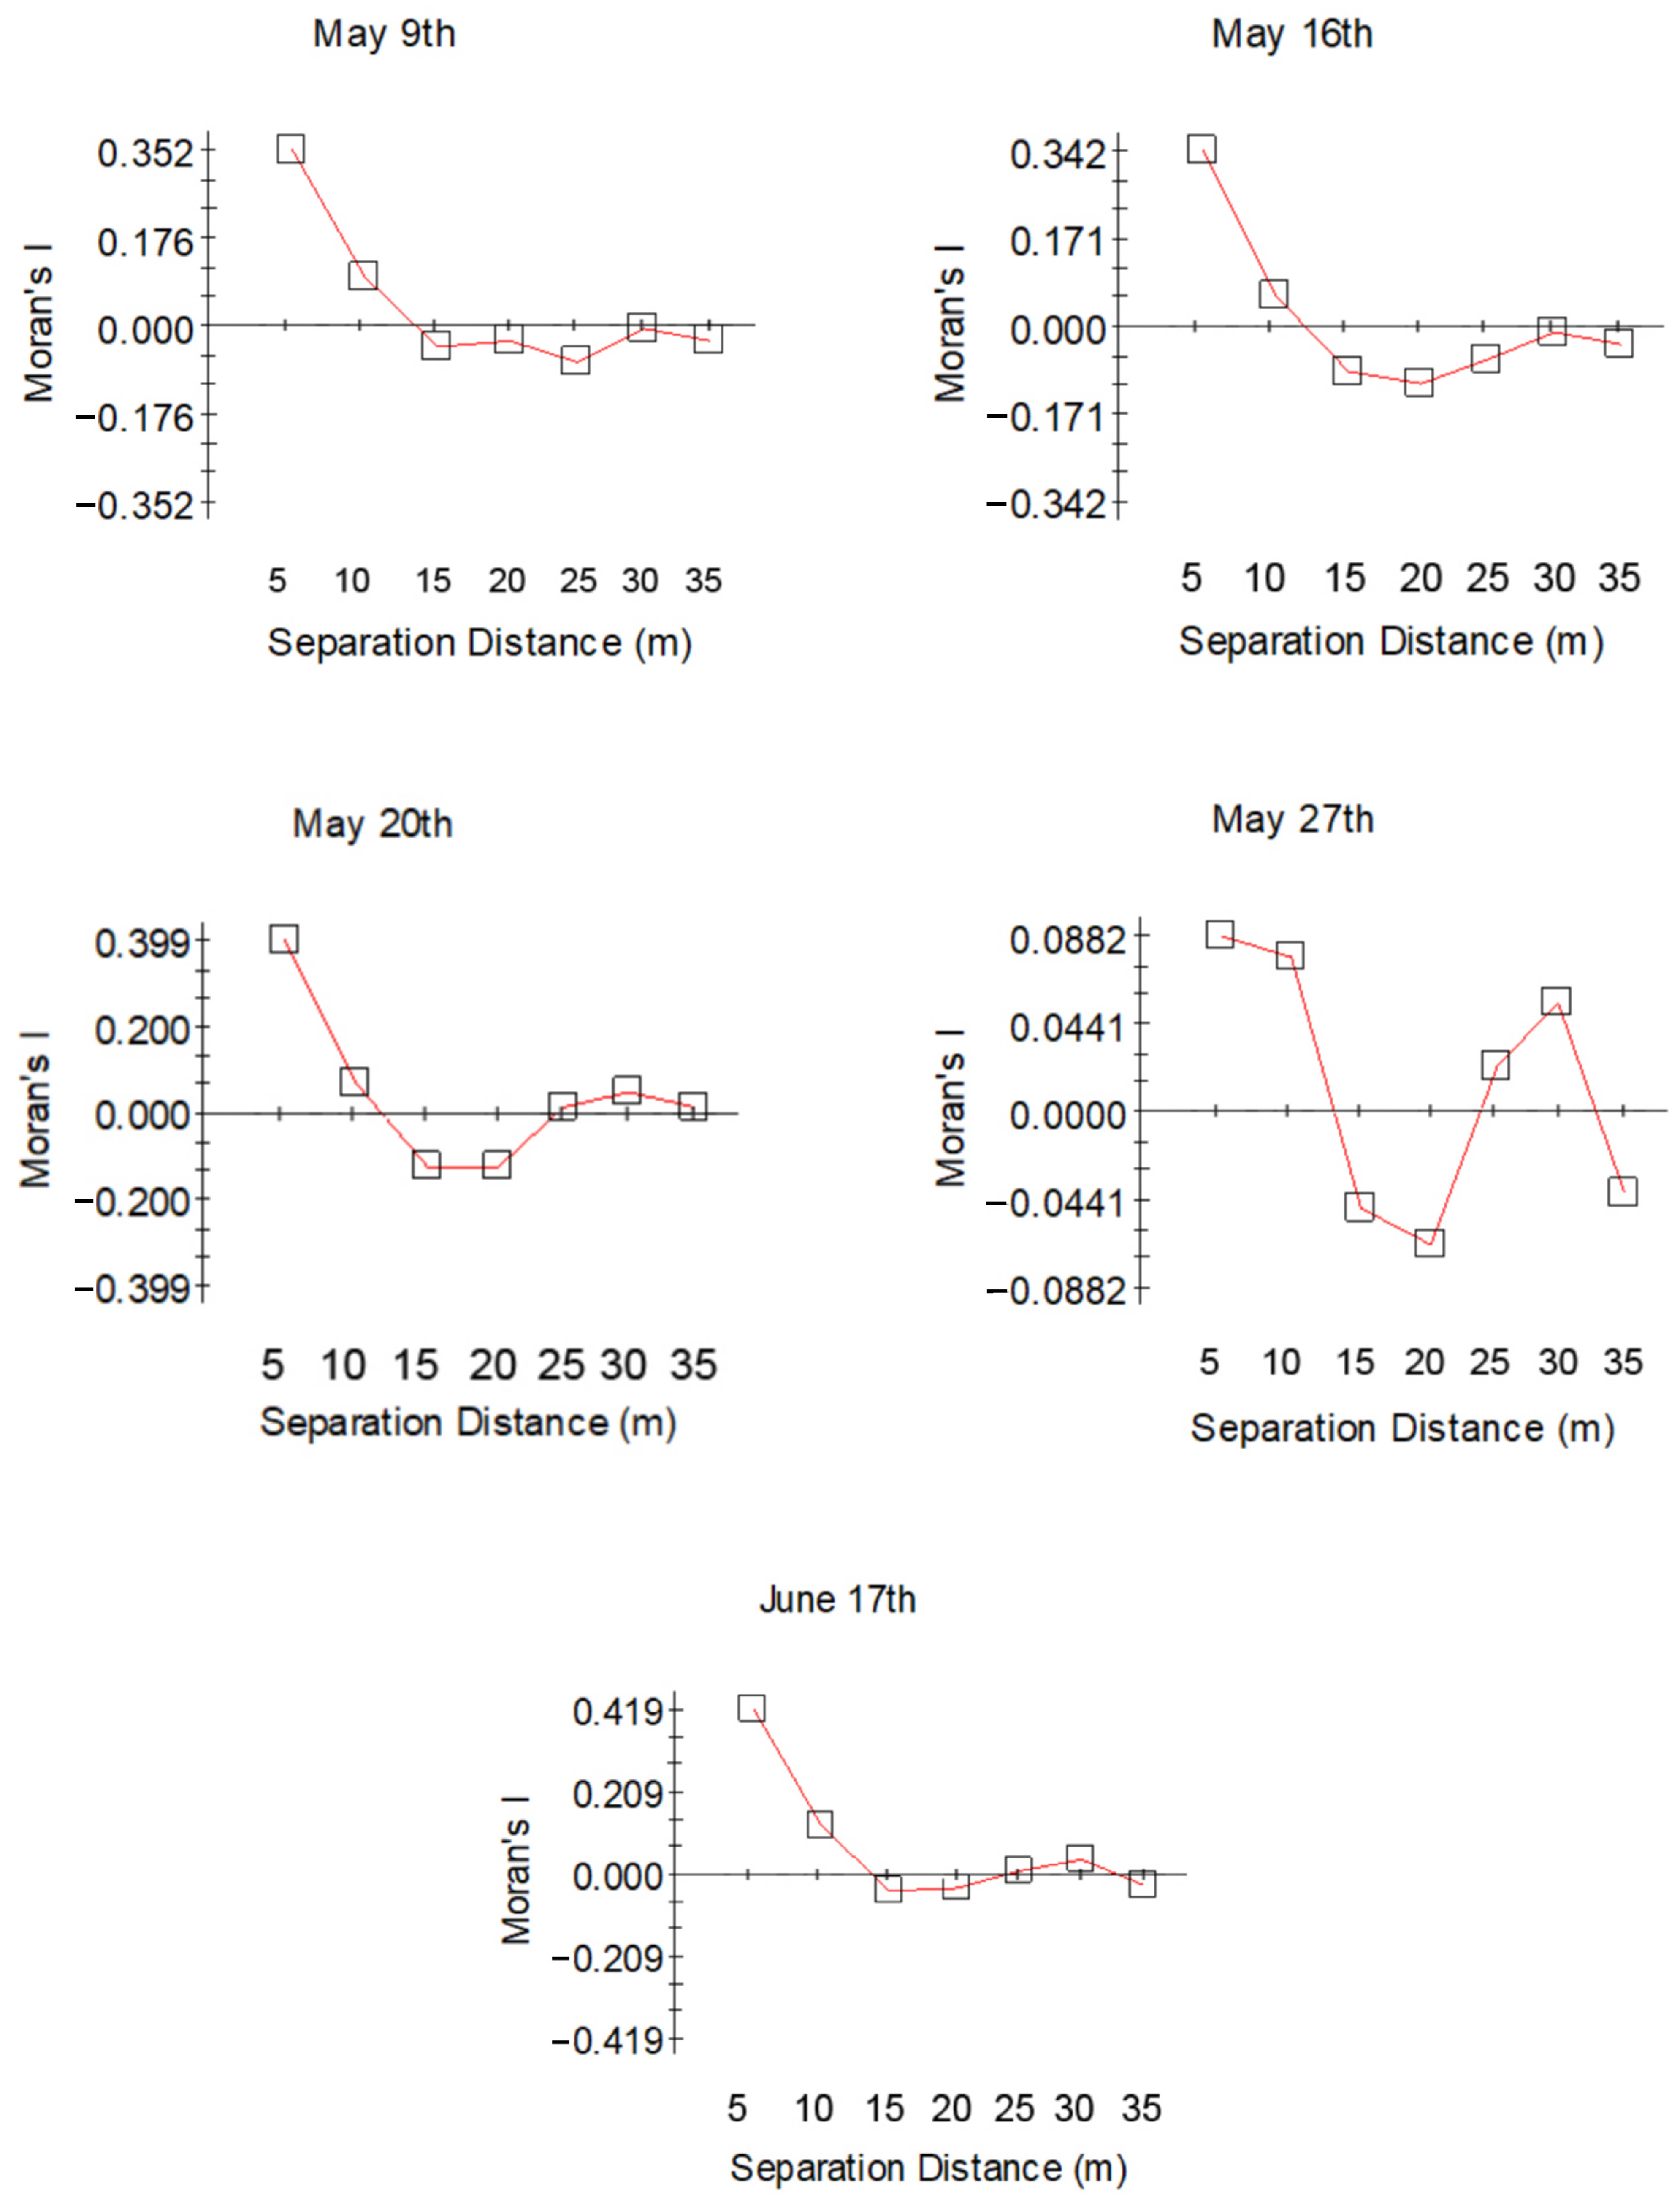
We calculated the Moran’s I coefficients at different distances. The distances were used as the x-axis and the Moran’s I coefficients as the y-axis (Figure 3), thus reflecting the variation of the spatial autocorrelation degree with distance. In the other eight measurements except for 27 May, Moran’s I coefficients were significant with p > 5% and Z-values greater than |1.96| [38,39]. However, the Moran’s I coefficient on 27 May was insignificant. As shown in Figure 3, all eight measurements exhibit similar characteristics, except for 27 May. That is, the Moran’s I coefficients gradually decrease from positive values as the distance increases and begin to converge to 0.0 at about 15 m, indicating that the soil moisture had a certain spatial structure and dependence overall. However, on 27 May, the Moran’s I coefficient of soil moisture changed greatly. The Moran’s I coefficient was positive in the range of 0–15 m and 24–32 m. There is a spatial negative correlation in the range of 15–24 m and 32–36 m.
3.3. Spatial Variability of Soil Moisture
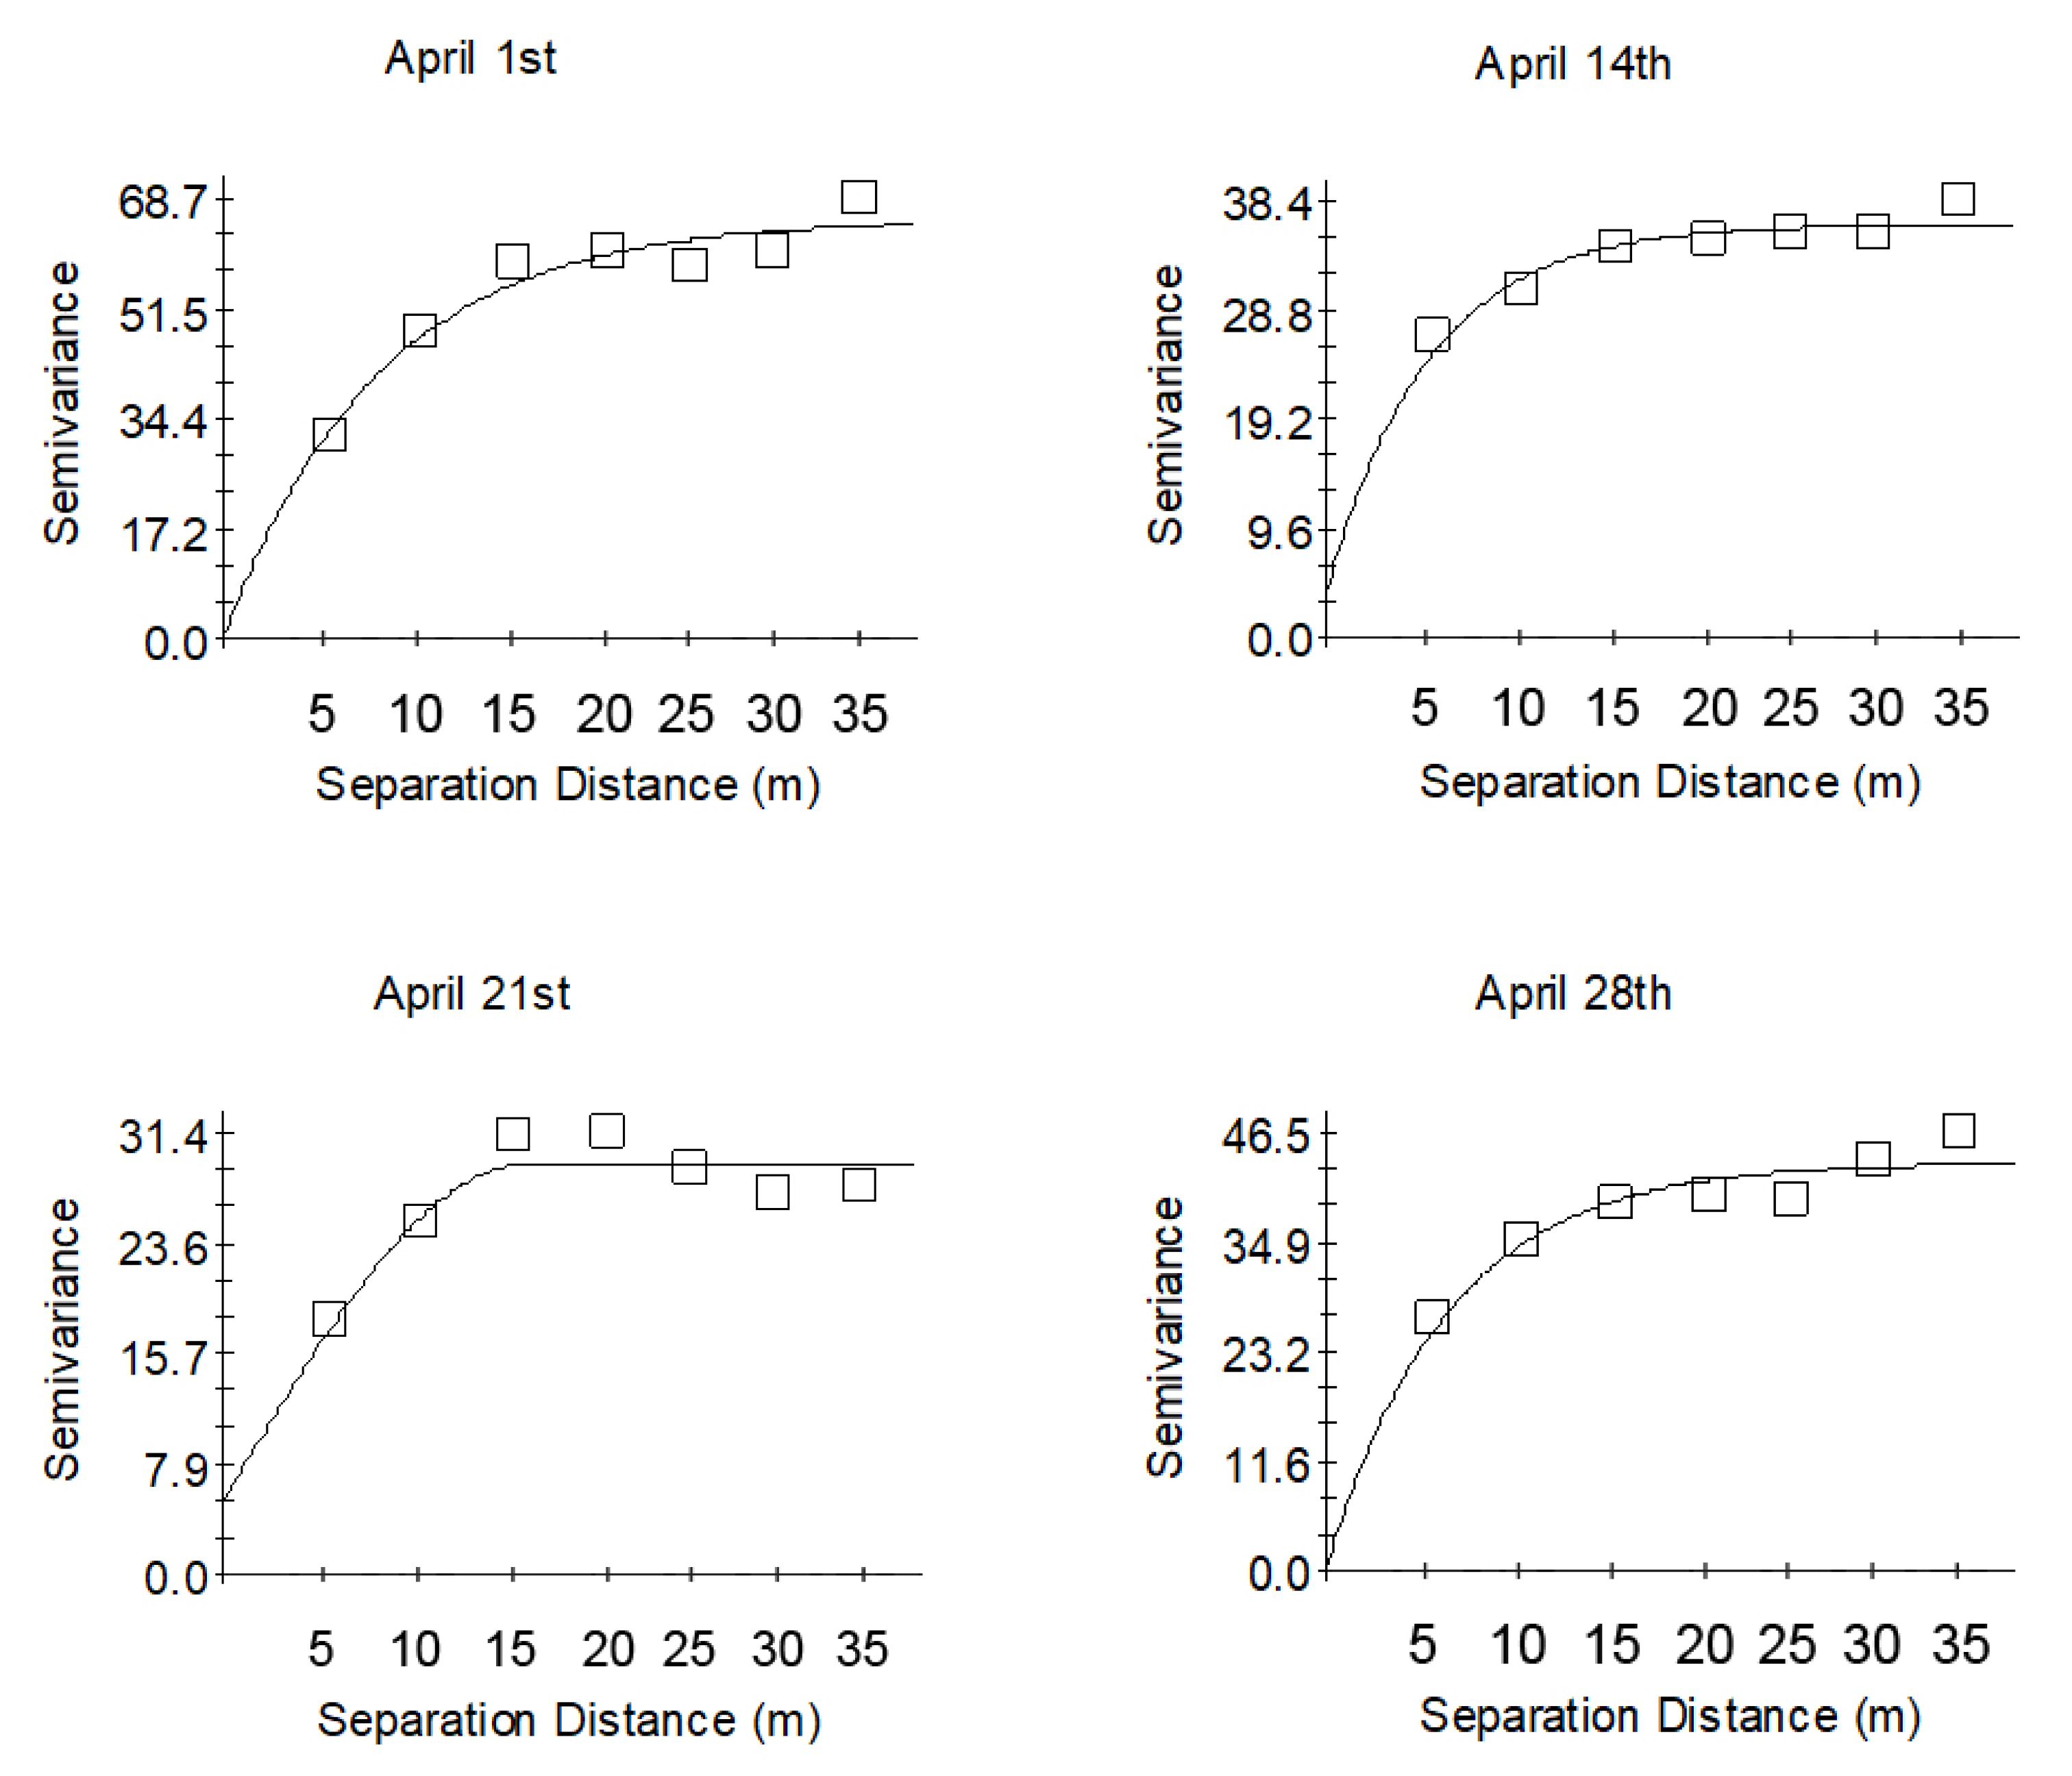
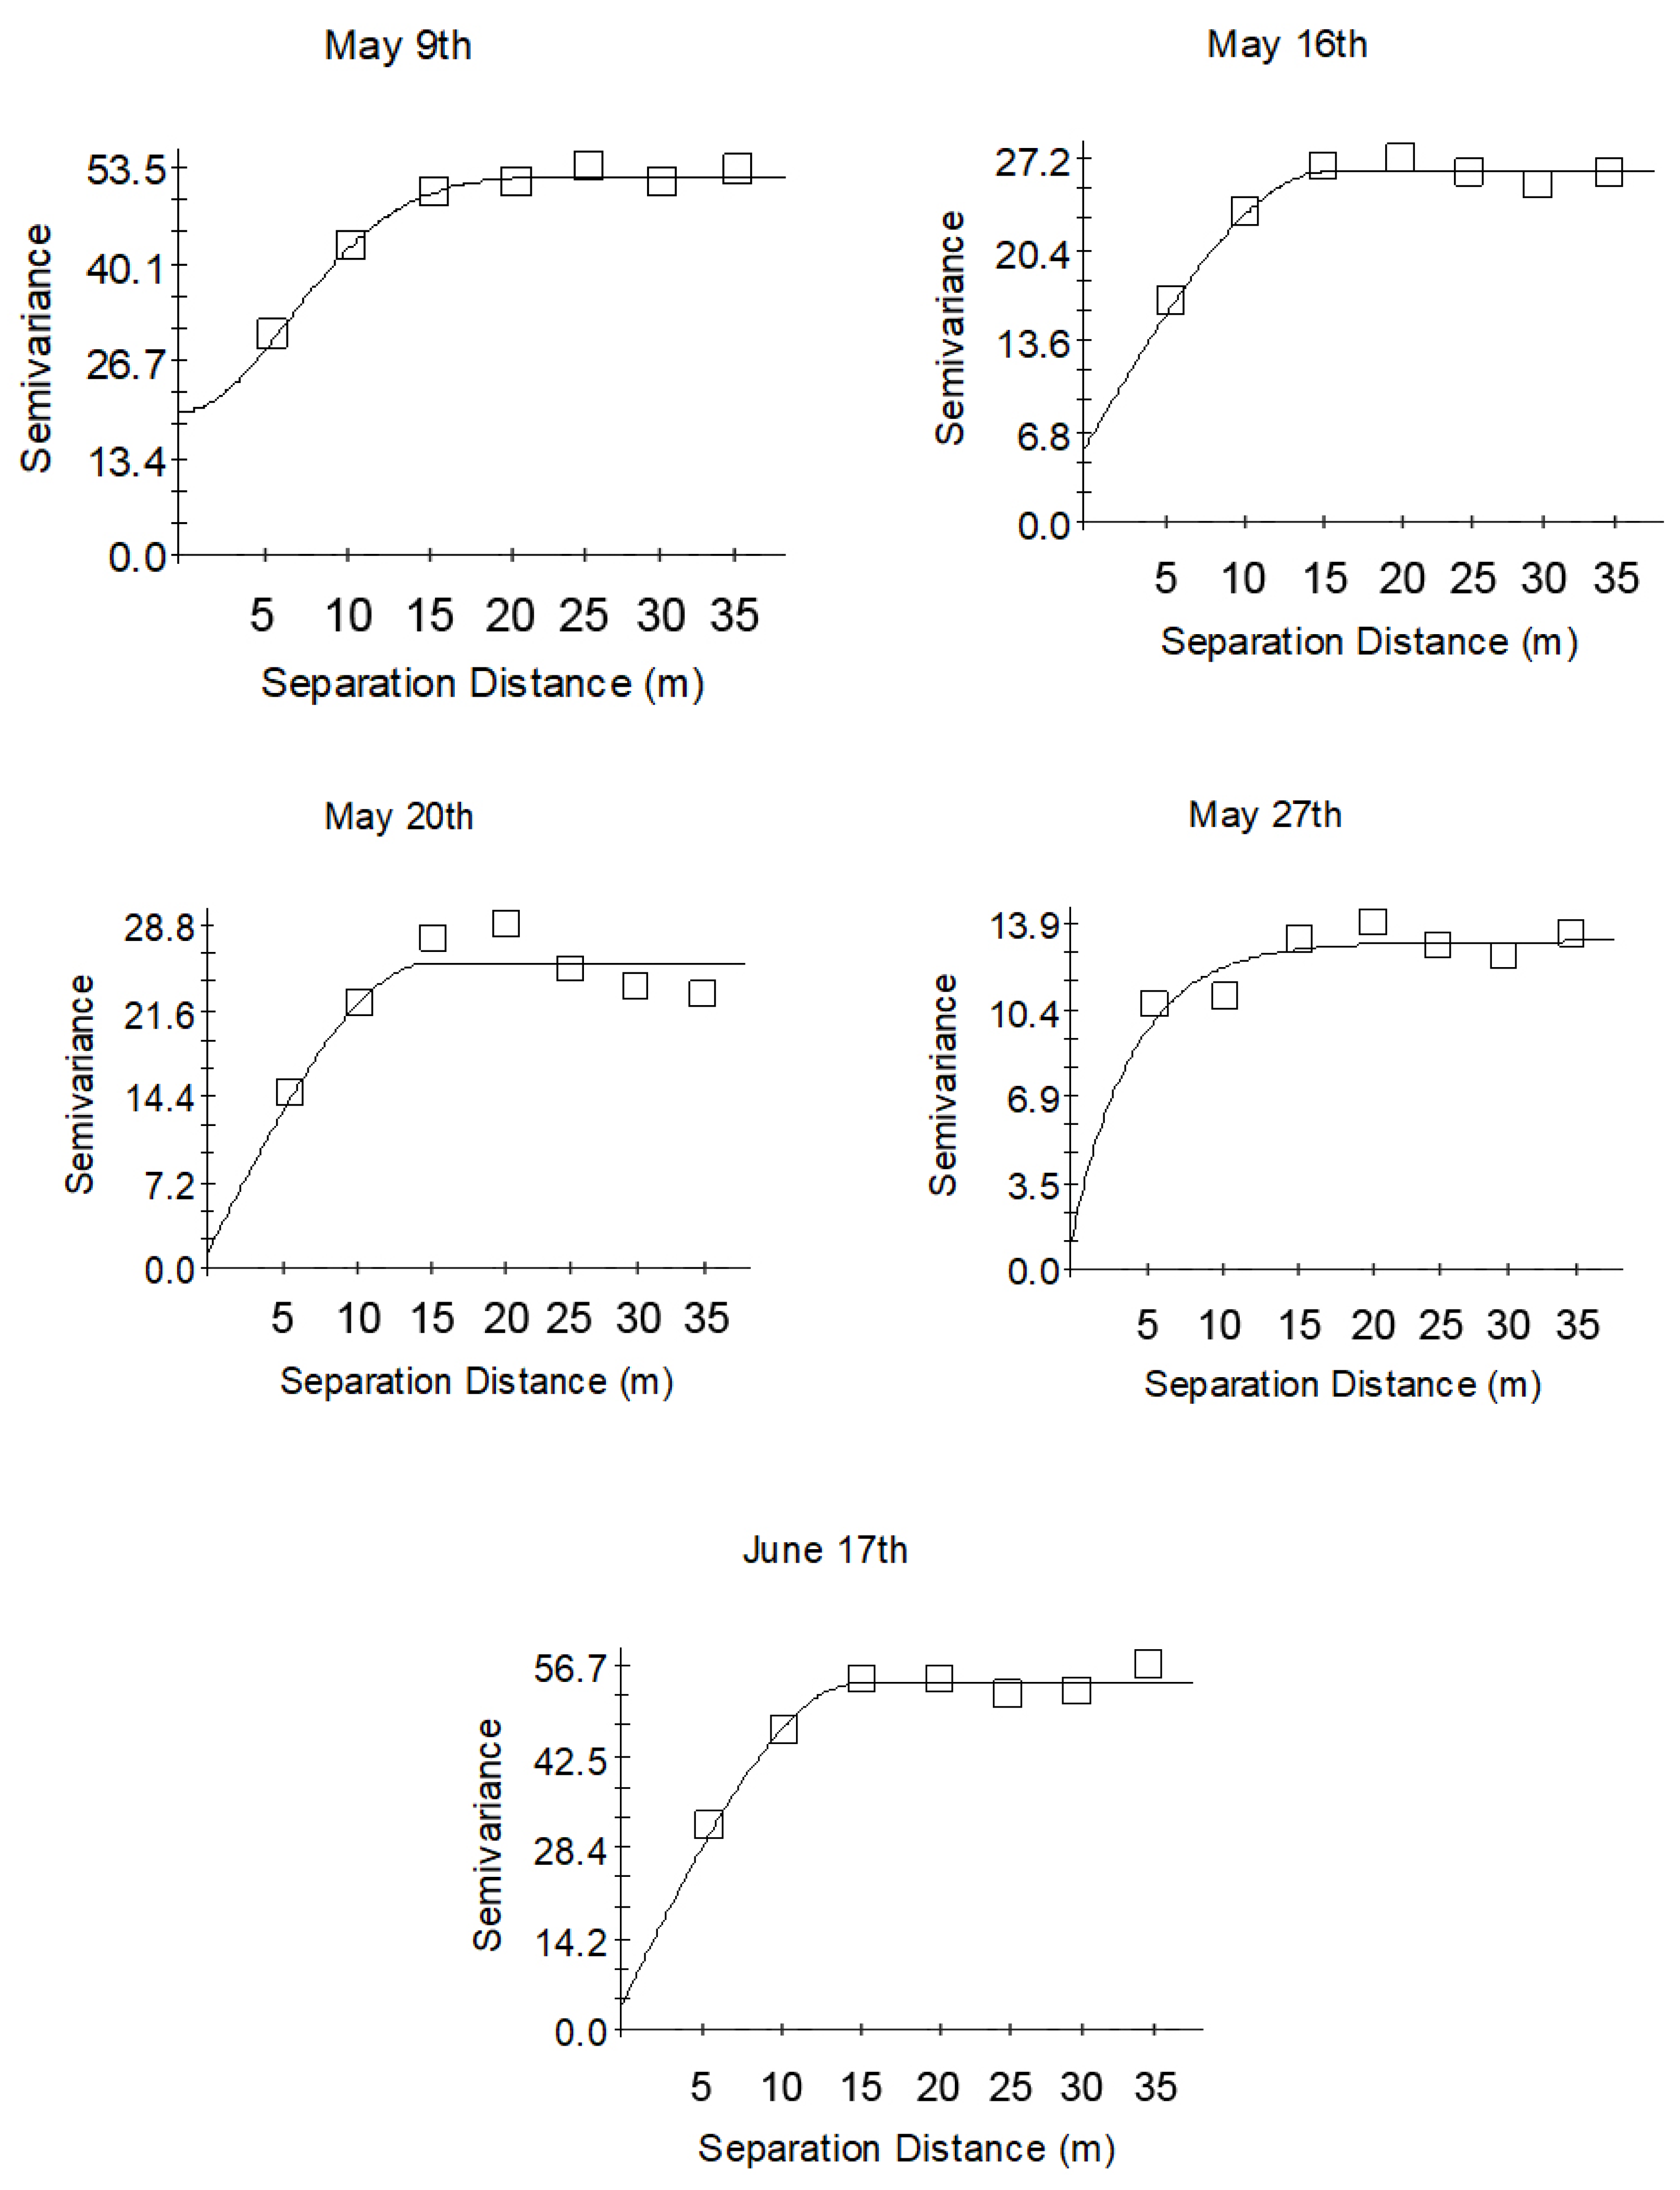
We selected the best-fit models with GS + 9.0 software and used these models for spatial interpolation. The characteristic parameters are shown in Table 2. During the fitting, we performed a comparison of different models and selected the most closely fitting of the exponential, spherical, and Gaussian models. The determination coefficient (R2) and RMSE were between 0.69–0.99 and 2.04–55.9, respectively. This indicates that the fitting models can reflect the spatial structure characteristics of soil moisture realistically. During the sampling period, the nugget and sill fluctuated between 0.1–19.6 and 13.16–65.5, respectively, and the largest nugget value appeared on 9 May. The range was between 12.96 m and 25.5 m and the maximum was approximately twice the minimum. It can be seen from Figure 4 that the omnidirectional experimental semivariogram on 21 April and 20 May performed a downward trend after reaching the sill, and the remaining omnidirectional experimental semivariogram of each sample tended to be stable after reaching the sill.
3.4. Changes of Soil Moisture Omnidirectional Experimental Semivariogram Parameters
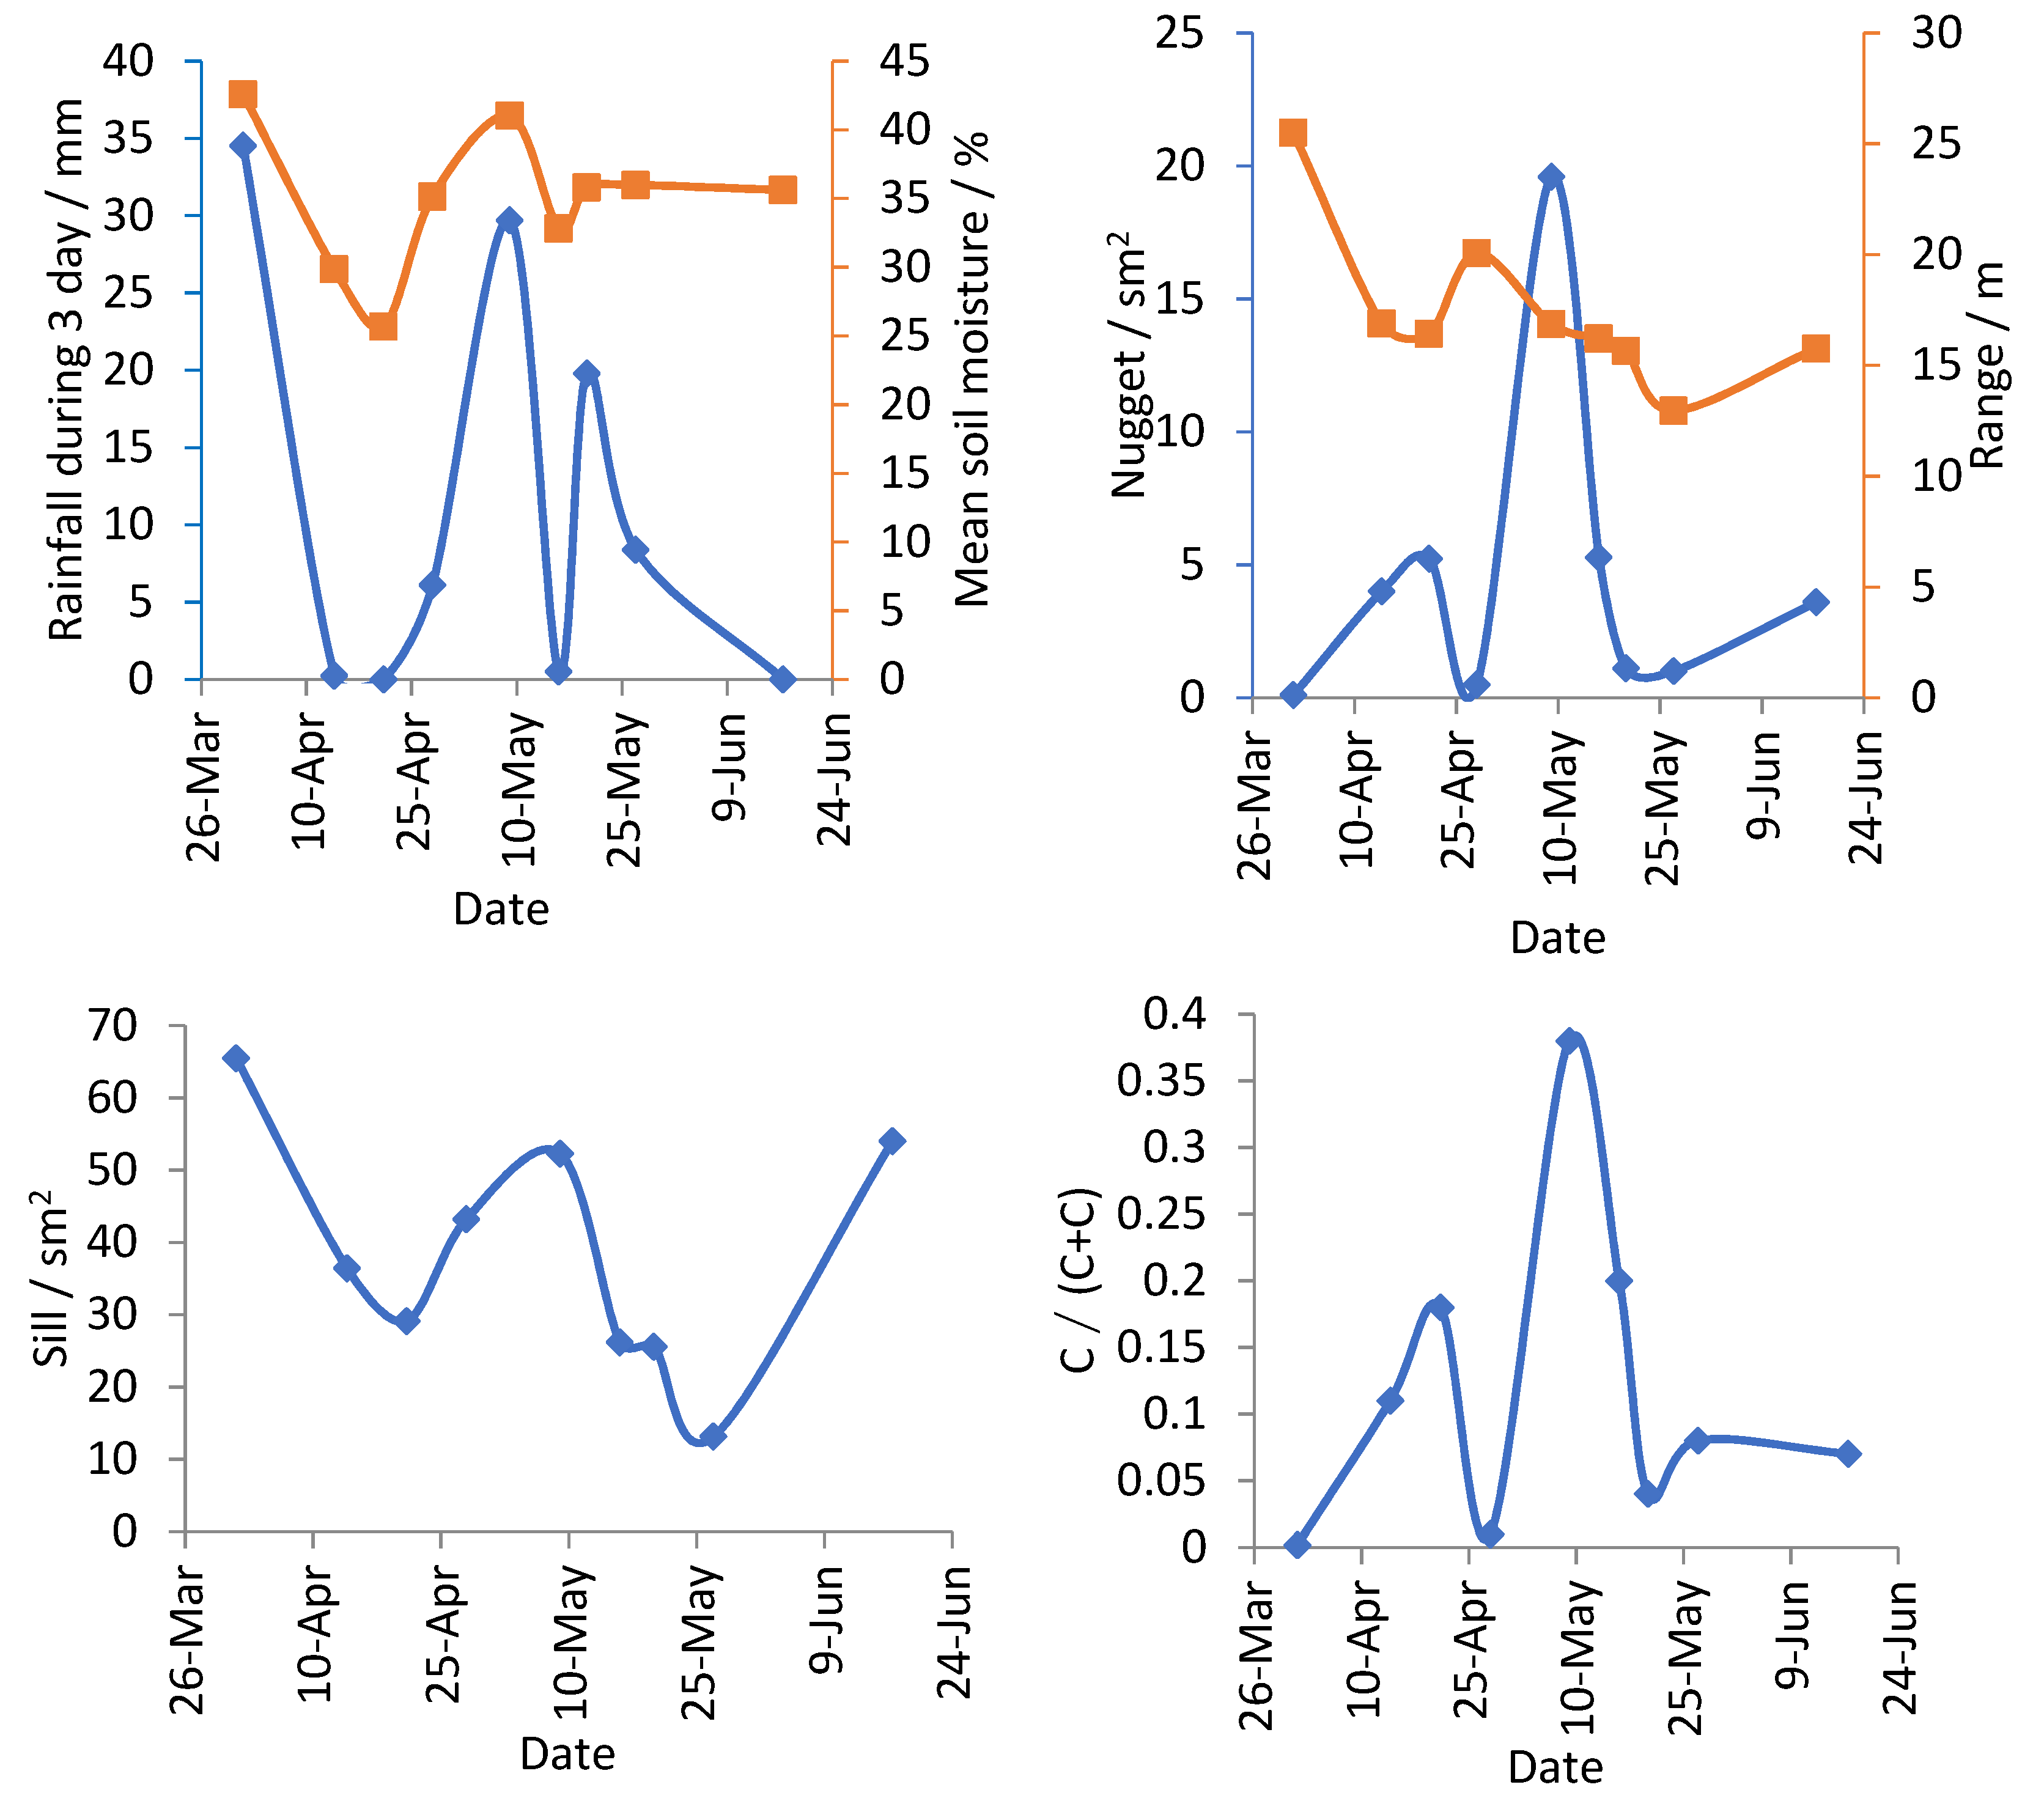
The variation of omnidirectional experimental semivariogram parameters is shown in Figure 5. The variation trend of soil moisture was identical with that of rainfall. The change of the nugget was roughly opposite to the soil moisture and rainfall in the beginning and end, and the variation trend of the nugget was identical with the soil moisture and rainfall at the middle period. Except for 9 May, the relationship between the nugget and previous rainfall reflected that the smaller nugget corresponded to much rainfall. The fluctuation of the sill was opposite to that of the soil moisture and previous rainfall in the end. The sampling process had undergone two cycles from wetting to drought. It was observed that the sill showed a decreasing-increasing-decreasing-increasing trend. It can be concluded that the spatial heterogeneity of soil moisture reduced effectively after rainfall events. The trend of the range of the sampling dates during the study period was approximately the same as the sill and roughly opposed to the variation trend of the C0/(C0 + C).
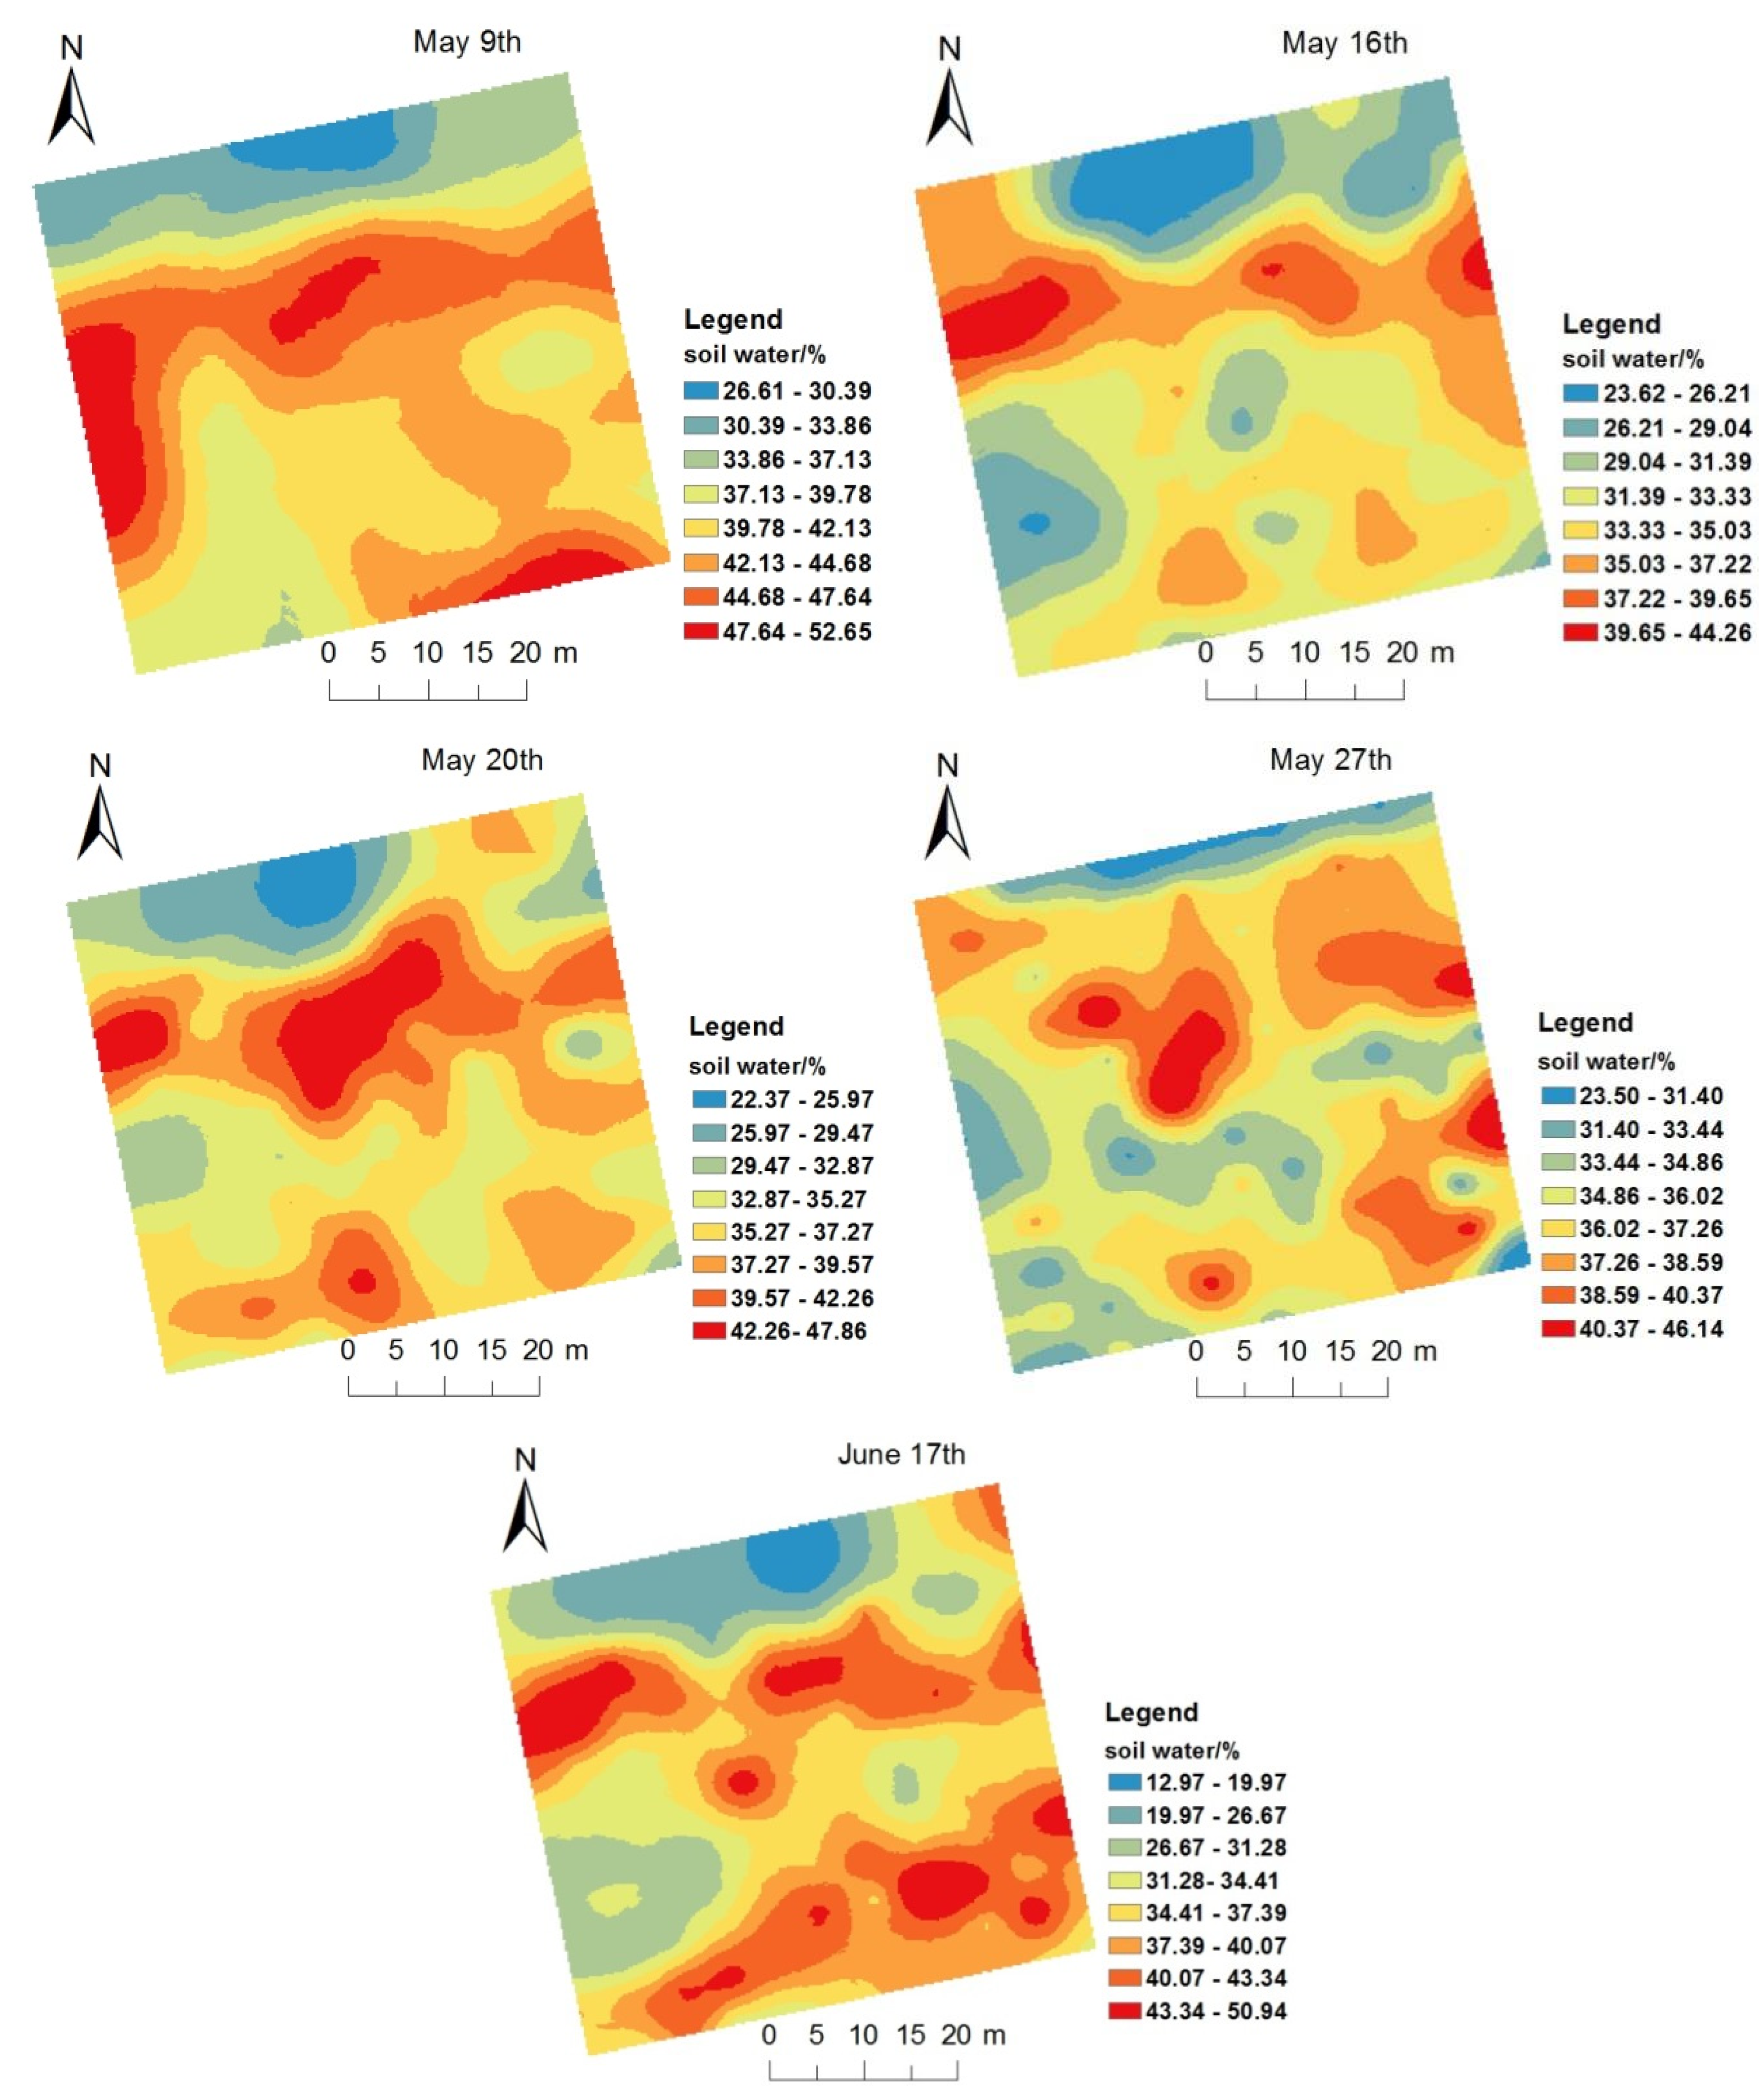
3.5. Spatial Distribution Pattern of Soil Moisture
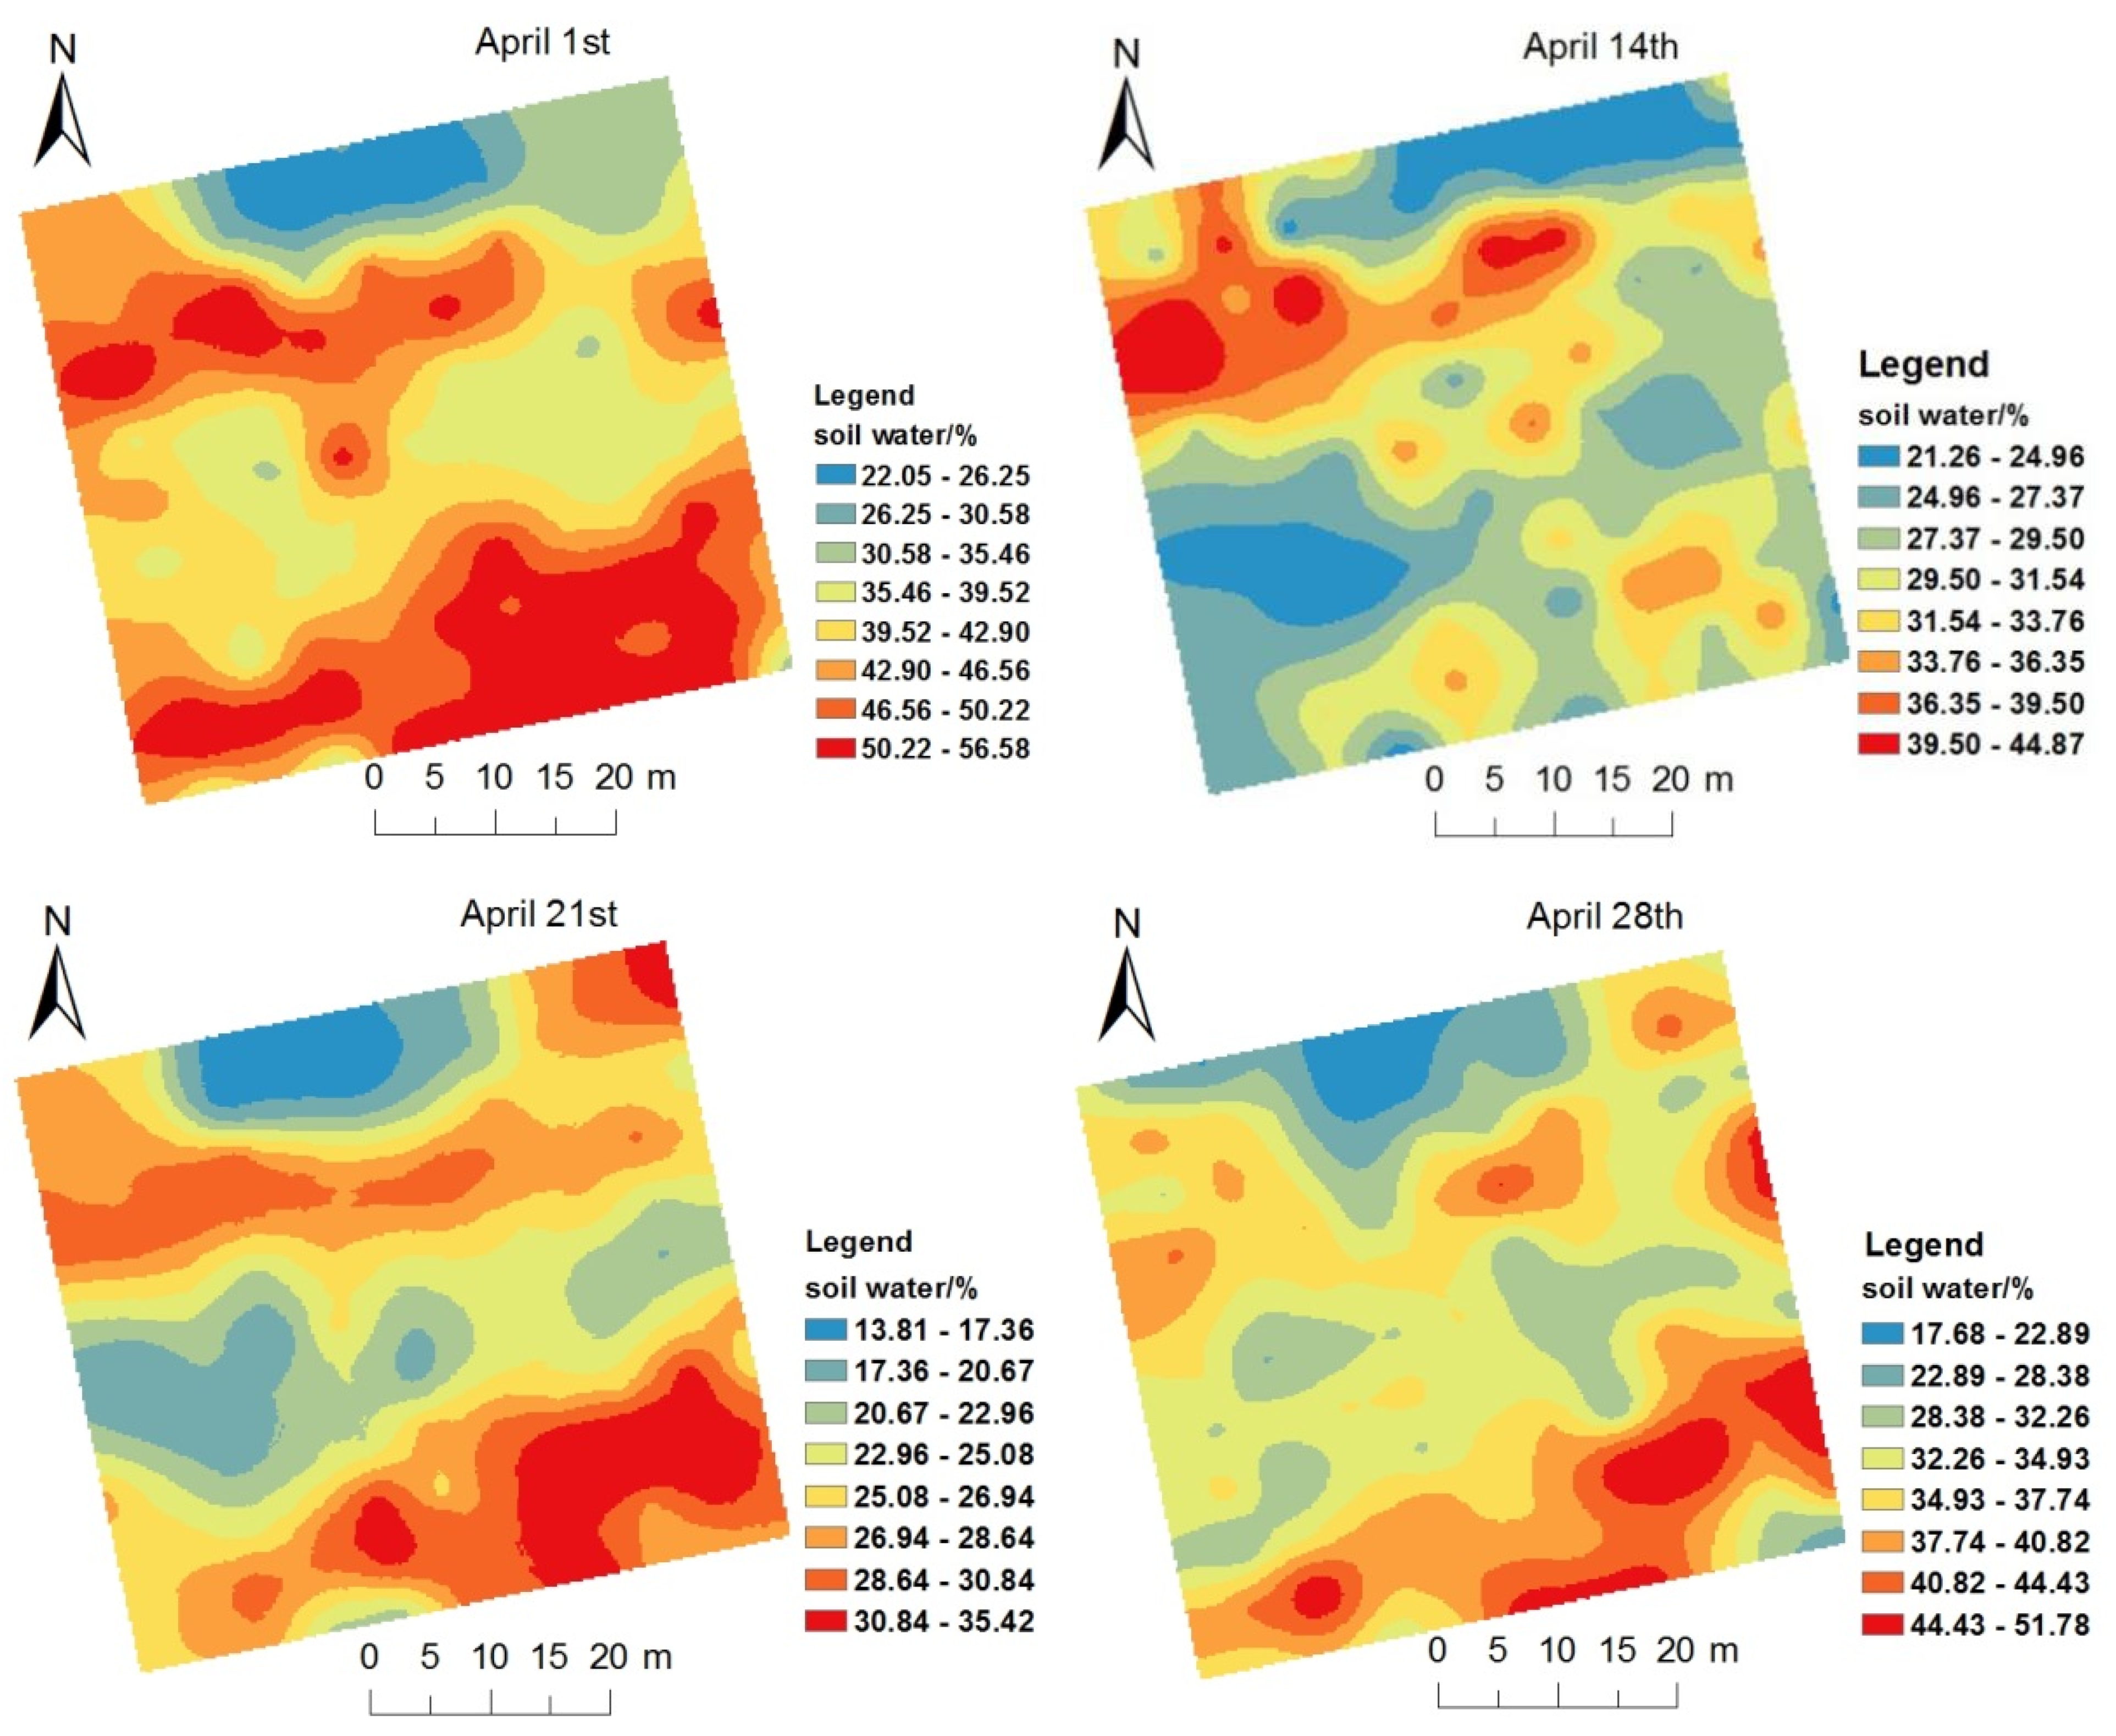
The spatial distribution of soil moisture was obtained by ordinary Kriging interpolation with Arcgis10.2, using the variogram model estimated before. The model parameters are shown in Table 2. It can be seen from Figure 6 that the spatial distribution pattern of the soil moisture was roughly plaque- or strip-like and higher soil moisture was distributed in the lower right and middle parts of the slope during the sampling period. The pattern of spatial distribution of soil moisture was not consistent across dates. On 1 April, 21 April, and 9 May, the spatial pattern of soil moisture exhibited a striped pattern. The other dates showed mainly plaque patterns. In addition, the location of the high and low soil moisture zones did not exactly coincide at different dates.
4. Discussion
4.1. Spatial Autocorrelation of Soil Moisture
In this study, auto-correlation coefficients gradually decreased from positive values as the distance increased and began to converge to 0.0 at about 15 m. The variation trend of the auto-correlation coefficient in this work was inconsistent with previous conclusions regarding karst depressions [40]. The research concluded that the auto-correlation coefficient of soil moisture in karst depressions showed a significant positive correlation within smaller lag distance, and it increased in a negative direction with the growth of the lag distance, finally reaching a significant negative correlation. The reason was that the terrain fluctuation in the central part of the karst depression was small and soybeans were interplanted with potatoes in the plot. The topographic factors and climatic conditions were the main factors that affected the spatial distribution of soil moisture in this research. However, our work was carried out on a karst shrub–grass hillslope. The degree of topographic fluctuation was larger and some differences existed in vegetation distribution at different locations on the hillslope. The existence of soil, gravel, and bare rock made the spatial correlation of soil moisture at different positions along the slope different. Compared with other sampling dates, the spatial auto-correlation coefficient of soil moisture on 27 May was smaller. Since there was significant rainfall on that day, the sampling time was close to the end of the rainfall. Thus, the spatial autocorrelation pattern of soil moisture was disturbed by the rainfall.
4.2. Spatial Distribution of Soil Moisture
The complexity of environmental factors such as vegetation, topography, and bare rock led to a discontinuous distribution pattern of soil moisture and fragmentation characteristics of habitats. Yang et al. [23] indicated that the spatial distribution of soil moisture in karst areas is closely related to vegetation, soil properties, and environmental factors. In the study, the spatial distribution pattern of soil moisture in each sampling was different during the sampling period. It can be speculated that the spatial distribution of soil moisture was determined by the combination of topography, vegetation, climate, and other factors. The area with a gentle slope and higher vegetation coverage was more conducive to the retention of soil moisture. This conclusion is inconsistent with relevant research on karst slopes [26]; in this study, soil thickness and gravel content were the main influencing factors on the spatial distribution of soil moisture. The reason was that two slopes of shrub and grass, respectively, were selected for the plot in his study. The distribution of vegetation in the plots was relatively homogeneous. However, the selected plot was a mixed shrub–grass hillslope in this paper. The distribution of vegetation in the plot was more chaotic, and the difference of vegetation distribution on the slope resulted in a different distribution pattern of soil moisture along the slope.
4.3. Comparative Analysis of Soil Moisture
In this work, the spatial variability of soil moisture on the surface of a shrub–grass slope in the karst region was analyzed. The results show that the spatial distribution pattern of soil moisture was affected by the combined effects of gravel exposure, topography, and vegetation. The gentle slope with high vegetation coverage was more conducive to retaining soil moisture. Although many studies have also analyzed the spatial heterogeneity characteristics of soil moisture using statistical methods, such studies have been mostly conducted in non-karstic areas [30,41,42]. Other studies have carried out studies on the spatial heterogeneity of soil moisture in karstic areas, but these studies have mostly used traditional statistical methods [29,43,44] and have not analyzed soil moisture spatial heterogeneity from a geostatistical point of view, especially for mixed shrub and shrub–grass sample plots scales.
In summary, the shrub–grass slope is a common vegetation type seen after restoration of rocky desertification land, and it is important for soil water retention for ecological construction in karst areas. Therefore, the progress of returning farmland to forests and grassland should be vigorously promoted in ecological restoration and soil and water conservation work in the future in karst regions. Some drought-tolerant tree species should be planted to enhance the holding capacity of soil water, and steep slopes should be avoided in agricultural production. Although the spatial variability analysis of soil moisture was carried out on a small scale which does not have universal significance, it still can provide some references for agricultural production and ecological restoration in karst regions.
5. Conclusions
Field sampling and geostatistic methods were combined to analyze spatio-temporal variability and spatial distribution patterns of soil moisture on a shrub–grass hillslope in the karst region. During the sampling period, the results showed that mean soil moisture ranged from 25.67% to 42.60%. The soil moisture was significantly positively correlated with the previous rainfall. When soil moisture was higher, the coefficient of variation was lower. The rainfall could effectively reduce the spatial heterogeneity of soil moisture for a period. Due to the comprehensive effects of topography, vegetation, and climate, some differences existed in the variation trend of the spatial correlation coefficient during the sampling period, but there was still a certain spatial dependence and structure overall. Soil moisture exhibited moderate or strong spatial correlation. The variation trend of the range was basically identical with the sill and roughly opposite to C0/C0 + C. The distribution pattern of soil moisture on the slope looked like plaque or strip. The lower the soil moisture was distributed, the higher the degree of plaque fragmentation and the poorer the spatial continuity. Generally, soil moisture was higher in the lower and middle parts of the plot, and the areas with gentle slopes and higher vegetation coverage contributed to reserve soil moisture.
Author Contributions
Writing—original draft preparation and funding acquisition, J.L.; methodology, X.M. and H.L.; software, X.G.; formal analysis, X.C.; investigation and data curation, Y.L.; conceptualization, writing—review and editing, investigation and data curation, and data curation, Q.Z. All authors have read and agreed to the published version of the manuscript.
Funding
This research was funded by the National Land Change Survey National Field Verification (Kunming Center) (Grant No. DD20230526).
Data Availability Statement
The data are available from the corresponding author on reasonable request.
Conflicts of Interest
The authors declare no conflict of interest.
References
- Gwak, Y.; Kim, S. Factors affecting soil moisture spatial variability for a humid forest hillslope. Hydrol. Process. 2017, 31, 431–445. [Google Scholar] [CrossRef]
- Lv, L.; Liao, K.; Zhou, Z.; Zhu, Q.; Shen, C. Determining hot moments/spots of hillslope soil moisture variations based on high-resolution spatiotemporal soil moisture data. Catena 2019, 173, 150–161. [Google Scholar] [CrossRef]
- Peng, D.; Zhou, Q.; Tang, X.; Yan, W.; Chen, M. Changes in soil moisture caused solely by vegetation restoration in the karst region of southwest China. J. Hydrol. 2022, 613, 128460. [Google Scholar] [CrossRef]
- Wang, C.; Zhao, C.; Xu, Z.; Wang, Y.; Peng, H. Effect of vegetation on soil water retention and storage in a semi-arid alpine forest catchment. J. Arid Land 2013, 5, 207–219. [Google Scholar] [CrossRef]
- Sun, F.; Lü, Y.; Wang, J.; Hu, J.; Fu, B. Soil moisture dynamics of typical ecosystems in response to precipitation: A monitoring-based analysis of hydrological service in the Qilian Mountains. Catena 2015, 129, 63–75. [Google Scholar] [CrossRef]
- Canton, Y.; Rodríguez-Caballero, E.; Contreras, S.; Villagarcia, L.; Li, X.Y.; Solé-Benet, A.; Domingo, F. Vertical and lateral soil moisture patterns on a Mediterranean karst hillslope. J. Hydrol. Hydromech. 2016, 64, 209–217. [Google Scholar] [CrossRef]
- Chen, H.; Zhang, W.; Wang, K.; Fu, W. Soil moisture dynamics under different land uses on karst hillslope in northwest Guangxi, China. Environ. Earth Sci. 2010, 61, 1105–1111. [Google Scholar] [CrossRef]
- Zhang, Z.; Chen, X.; Ghadouani, A.; Shi, P. Modelling hydrological processes influenced by soil, rock and vegetation in a small karst basin of southwest China. Hydrol. Process. 2011, 25, 2456–2470. [Google Scholar] [CrossRef]
- Yang, Q.; Zhang, F.; Jiang, Z.; Yuan, D.; Jiang, Y. Assessment of water resource carrying capacity in karst area of Southwest China. Environ. Earth Sci. 2016, 75, 37. [Google Scholar] [CrossRef]
- Yan, W.; Zhou, Q.; Peng, D.; Luo, Y.; Chen, M.; Lu, Y. Response of surface-soil quality to secondary succession in karst areas in Southwest China: Case study on a limestone slope. Ecol. Eng. 2022, 178, 106581. [Google Scholar] [CrossRef]
- Zhou, Q.; Zhu, A.X.; Yan, W.; Sun, Z. Impacts of forestland vegetation restoration on soil moisture content in humid karst region: A case study on a limestone slope. Ecol. Eng. 2022, 180, 106648. [Google Scholar] [CrossRef]
- Li, Y.; Xiong, K.; Liu, Z.; Li, K.; Luo, D. Distribution and influencing factors of soil organic carbon in a typical karst catchment undergoing natural restoration. Catena 2022, 212, 106078. [Google Scholar] [CrossRef]
- Bouabdelli, S.; Meddi, M.; Zeroual, A.; Alkama, R. Hydrological drought risk recurrence under climate change in the karst area of Northwestern Algeria. J. Water Clim. Change 2020, 11, 164–188. [Google Scholar] [CrossRef]
- Yan, Y.; Dai, Q.; Yang, Y.; Yan, L.; Yi, X. Epikarst shallow fissure soil systems are key to eliminating karst drought limitations in the karst rocky desertification area of SW China. Ecohydrology 2022, 15, e2372. [Google Scholar] [CrossRef]
- Gan, F.; Diao, X.; Tan, K.; Cao, G.; Zhang, Y.; Zhong, X.; Gao, Y. An evaluation of the use of IMERG products for representing drought in a typical rocky karst region experiencing rocky desertification in Guangxi, China. Remote Sens. Lett. 2022, 13, 1100–1109. [Google Scholar] [CrossRef]
- Yan, W.; Zhou, Q.; Peng, D.; Wei, X.; Tang, X.; Yuan, E.; Wang, Y.; Shi, C. Soil moisture responses under different vegetation types to winter rainfall events in a humid karst region. Environ. Sci. Pollut. Res. 2021, 28, 56984–56995. [Google Scholar] [CrossRef]
- Yuan, E.; Zhou, Q.; Yan, W.; Peng, D.; Wang, Y. Response of the winter soil moisture of different vegetation types to rainfall events in karst slope land. Hydrol. Res. 2022, 53, 1271–1285. [Google Scholar] [CrossRef]
- Zhou, Q.; Sun, Z.; Liu, X.; Wei, X.; Peng, Z.; Yue, C.; Luo, Y. Temporal soil moisture variations in different vegetation cover types in karst areas of southwest China: A plot scale case study. Water 2019, 11, 1423. [Google Scholar] [CrossRef]
- Chen, X.; Zhang, Z.; Chen, X.; Shi, P. The impact of land use and land cover changes on soil moisture and hydraulic conductivity along the karst hillslopes of southwest China. Environ. Earth Sci. 2009, 59, 811–820. [Google Scholar] [CrossRef]
- Deng, Y.; Wang, S.; Bai, X.; Luo, G.; Wu, L.; Chen, F.; Wang, J.; Li, Q.; Li, C.; Yang, Y.; et al. Spatiotemporal dynamics of soil moisture in the karst areas of China based on reanalysis and observations data. J. Hydrol. 2020, 585, 124744. [Google Scholar] [CrossRef]
- Deng, Y.; Wang, S.; Bai, X.; Luo, G.; Wu, L.; Chen, F.; Wang, J.; Li, Q.; Li, C.; Yang, Y.; et al. Characteristics of soil moisture storage from 1979 to 2017 in the karst area of China. Geocarto Int. 2021, 36, 903–917. [Google Scholar] [CrossRef]
- Yang, J.; Chen, H.; Nie, Y.; Wang, K. Dynamic variations in profile soil water on karst hillslopes in Southwest China. Catena 2019, 172, 655–663. [Google Scholar] [CrossRef]
- Li, C.; Chen, H.; Xu, Q.; Wu, P.; Fu, Z. Spatial variability of soil moisture on hillslope in typical karst peak-cluster depression areas. Carsologica Sin. 2018, 2, 159–167. [Google Scholar]
- Luo, W.; Xu, X.; Liu, W.; Liu, M.; Li, Z.; Peng, T.; Zhang, R. UAV based soil moisture remote sensing in a karst mountainous catchment. Catena 2019, 174, 478–489. [Google Scholar] [CrossRef]
- Zhang, C.; Zhang, W.; Chen, H.S.; Nie, Y.P.; Ye, Y.Y.; Wang, K.L. Temporal and spatial variation in surface soil moisture content of karst slopes in the dry season. Acta Ecol. Sin. 2015, 35, 6326–6334. [Google Scholar]
- Wang, S.; Chen, H.S.; Fu, Z.; Wang, K. Temporal stability analysis of surface soil water content on two karst hillslopes in southwest China. Environ. Sci. Pollut. Res. 2016, 23, 25267–25279. [Google Scholar] [CrossRef]
- Famiglietti, J.S.; Rudnicki, J.W.; Rodell, M. Variability in surface moisture content along a hillslope transect: Rattlesnake Hill, Texas. J. Hydrol. 1998, 210, 259–281. [Google Scholar] [CrossRef]
- Zhang, J.G.; Chen, H.S.; Su, Y.R.; Kong, X.L.; Zhang, W.; Shi, Y.; Liang, H.; Shen, G. Spatial variability and patterns of surface soil moisture in a field plot of karst area in southwest China. Plant Soil Environ. 2011, 57, 409–417. [Google Scholar] [CrossRef]
- Martínez-Murillo, J.F.; Hueso-González, P.; Ruiz-Sinoga, J.D. Topsoil moisture mapping using geostatistical techniques under different Mediterranean climatic conditions. Sci. Total Environ. 2017, 595, 400–412. [Google Scholar] [CrossRef]
- Yang, Q.; Jiang, Z.; Ma, Z.; Li, H. Spatial prediction of soil water content in karst area using prime terrain variables as auxiliary cokriging variable. Environ. Earth Sci. 2014, 72, 4303–4310. [Google Scholar] [CrossRef]
- Tuffour, H.O.; Abubakari, A.; Bashagaluke, J.B.; Djagbletey, E.D. Mapping spatial variability of soil physical properties for site-specific management. Int. Res. J. Eng. Technol. 2016, 3, 149–163. [Google Scholar]
- Mirzaei, R.; Sakizadeh, M. Comparison of interpolation methods for the estimation of groundwater contamination in Andimeshk-Shush Plain, Southwest of Iran. Environ. Sci. Pollut. Res. 2016, 23, 2758–2769. [Google Scholar] [CrossRef]
- Pesquer, L.; Cortes, A.; Pons, X. Parallel ordinary kriging interpolation incorporating automatic variogram fitting. Comput. Geosci. 2011, 37, 464–473. [Google Scholar] [CrossRef]
- Wang, J.; Fu, B.J.; Qiu, Y.; Chen, L.D. Semi-variogram of temporal and spatial variation of soil moisture in a small watershed of the Loess Hills. Acta Geogr. Sin. 2000, 55, 428–437. (In Chinese) [Google Scholar]
- Brooker, P.I. A parametric study of robustness of kriging variance as a function of range and relative nugget effect for a spherical semivariogram. Math. Geol. 1986, 18, 477–488. [Google Scholar] [CrossRef]
- Robert, A.; Richards, K.S. On the modelling of sand bedforms using the semivariogram. Earth Surf. Process. Landf. 1988, 13, 459–473. [Google Scholar] [CrossRef]
- Olea, R.A. Fundamentals of semivariogram estimation, modeling, and usage. In Stochastic Modeling and Geostatistics; Yarus, J.M., Chambers, R.L., Eds.; AAPG Datapages, Inc.: Tulsa, OK, USA, 1994; Volume 3, pp. 27–35. [Google Scholar]
- Murakami, D.; Yoshida, T.; Seya, H.; Griffith, D.A.; Yamagata, Y. A Moran coefficient-based mixed effects approach to investigate spatially varying relationships. Spat. Stat. 2017, 19, 68–89. [Google Scholar] [CrossRef]
- Cardoso, G.G.G.; Wanderley, R.C.; Souza, M.L.C. Physical attributes of a pasture soil in southeast Goiás determined by geostatistics. Eng. Agrícola 2016, 36, 143–151. [Google Scholar] [CrossRef]
- Zhang, J.; Chen, H.; Su, Y.; Wu, J.; Zhang, W. Spatial variability of surface soil moisture content in depression area of karst region under moist and arid conditions. J. Appl. Ecol. 2006, 17, 2277–2282. [Google Scholar]
- Yates, S.R.; Warrick, A.W. Estimating soil water content using cokriging. Soil Sci. Soc. Am. J. 1987, 51, 23–30. [Google Scholar] [CrossRef]
- Korres, W.; Reichenau, T.; Fiener, P.; Koyama, C.; Bogena, H.; Cornelissen, T.; Baatz, R.; Herbst, M.; Diekkrüger, B.; Vereecken, H.; et al. Spatio-temporal soil moisture patterns—A meta-analysis using plot to catchment scale data. J. Hydrol. 2015, 520, 326–341. [Google Scholar] [CrossRef]
- Ries, F.; Lange, J.; Schmidt, S.; Puhlmann, H.; Sauter, M. Recharge estimation and soil moisture dynamics in a Mediterranean, semi-arid karst region. Hydrol. Earth Syst. Sci. 2015, 19, 1439–1456. [Google Scholar] [CrossRef]
- Zhang, J.; Chen, H.; Su, Y.; Shi, Y.; Zhang, W.; Kong, X. Spatial variability of surface soil moisture in a depression area of karst region. Clean–Soil Air Water 2011, 39, 619–625. [Google Scholar] [CrossRef]
Figure 1.
Image of study area location and sampling points distribution.

Figure 2.
Daily rainfall distribution and soil moisture during sampling period.

Figure 3.
Spatial autocorrelation analysis of soil moisture.


Figure 4.
The variation trend of soil moisture omnidirectional experimental semivariogram function.


Figure 5.
The variation trend of omnidirectional experimental semivariogram parameters during sampling period.
Figure 5.
The variation trend of omnidirectional experimental semivariogram parameters during sampling period.

Figure 6.
Spatial distribution pattern of soil moisture.


Table 1.
Descriptive statistics of soil moisture in each sample.
| Sampling Date | Rainfall during 3 Days (mm) | Max (%) | Min (%) | Mean (%) | SD(%) | CV(%) | Skew | Kurtosis | Distribution Type |
|---|---|---|---|---|---|---|---|---|---|
| 1 April | 34.54 | 56.80 | 22 | 42.60 | 8.23 | 19.32 | −0.42 | −0.29 | N |
| 14 April | 0.25 | 47.07 | 20.87 | 29.87 | 5.88 | 19.69 | 0.81 | 0.40 | S |
| 21 April | 0 | 38.17 | 11.63 | 25.67 | 5.37 | 20.91 | −0.33 | −0.02 | N |
| 28 April | 6.10 | 52.2 | 17.50 | 35.15 | 6.72 | 17.35 | −0.07 | 0.57 | N |
| 9 May | 29.72 | 58.37 | 24.80 | 41.03 | 7.24 | 17.65 | 0.15 | −0.36 | N |
| 16 May | 0.51 | 48.37 | 20.27 | 32.82 | 5 | 15.23 | −0.01 | 0.23 | N |
| 20 May | 19.8 | 49.07 | 21.83 | 35.81 | 4.93 | 13.77 | −0.16 | 0.27 | N |
| 27 May | 8.38 | 47.40 | 20.70 | 35.98 | 3.71 | 10.31 | −0.26 | 2.57 | N |
| 17 June | 0 | 53.07 | 11.50 | 35.63 | 7.41 | 20.78 | −0.41 | 0.72 | N |
Note: The character “N” stands for normal distribution, and “S” stands for approximately normal distribution.
Table 2.
Characteristic parameters of omnidirectional experimental semivariogram function of soil moisture.
Table 2.
Characteristic parameters of omnidirectional experimental semivariogram function of soil moisture.
| Sampling Date | Nugget C0 | Total Sill C0 + C | C0/(C0 + C) | Range (m) | R2 | Residual | Models |
|---|---|---|---|---|---|---|---|
| 1 April | 0.1 | 65.5 | 0.01 | 25.5 | 0.94 | 55.9 | Exponential |
| 14 April | 4 | 36.43 | 0.11 | 16.89 | 0.91 | 8.41 | Exponential |
| 21 April | 5.23 | 29.13 | 0.18 | 16.42 | 0.87 | 16.6 | Spherical |
| 28 April | 0.5 | 43.24 | 0.01 | 20.07 | 0.89 | 26.6 | Exponential |
| 9 May | 19.6 | 52.31 | 0.38 | 16.87 | 0.99 | 3.77 | Gaussian |
| 16 May | 5.28 | 26.21 | 0.20 | 16.22 | 0.98 | 2.04 | Spherical |
| 20 May | 1.1 | 25.6 | 0.04 | 15.65 | 0.80 | 25 | Spherical |
| 27 May | 1 | 13.16 | 0.08 | 12.96 | 0.69 | 2.95 | Exponential |
| 17 June | 3.6 | 54.04 | 0.07 | 15.76 | 0.97 | 15.8 | Spherical |
Disclaimer/Publisher’s Note: The statements, opinions and data contained in all publications are solely those of the individual author(s) and contributor(s) and not of MDPI and/or the editor(s). MDPI and/or the editor(s) disclaim responsibility for any injury to people or property resulting from any ideas, methods, instructions or products referred to in the content. |
© 2023 by the authors. Licensee MDPI, Basel, Switzerland. This article is an open access article distributed under the terms and conditions of the Creative Commons Attribution (CC BY) license (https://creativecommons.org/licenses/by/4.0/).
Share and Cite
MDPI and ACS Style
Li, J.; Meng, X.; Li, H.; Gu, X.; Cai, X.; Li, Y.; Zhou, Q. Spatio-Temporal Heterogeneity of Soil Moisture on Shrub–Grass Hillslope in Karst Region. Water 2023, 15, 1868. https://doi.org/10.3390/w15101868
AMA Style
Li J, Meng X, Li H, Gu X, Cai X, Li Y, Zhou Q. Spatio-Temporal Heterogeneity of Soil Moisture on Shrub–Grass Hillslope in Karst Region. Water. 2023; 15(10):1868. https://doi.org/10.3390/w15101868
Chicago/Turabian StyleLi, Juncai, Xiaorong Meng, Hua Li, Xiaoxiao Gu, Xiaojun Cai, Yuanlong Li, and Qiuwen Zhou. 2023. "Spatio-Temporal Heterogeneity of Soil Moisture on Shrub–Grass Hillslope in Karst Region" Water 15, no. 10: 1868. https://doi.org/10.3390/w15101868
Note that from the first issue of 2016, this journal uses article numbers instead of page numbers. See further details here.