

Molybdenum Isotopic Fingerprints in Taiwan Rivers: Natural versus Anthropogenic Sources


1
Taiwan International Graduate Program-Earth System Science (TIGP-ESS), Academia Sinica and National Central University, Taipei 11529, Taiwan
2
Institute of Earth Sciences, Academia Sinica, Taipei 11529, Taiwan
3
Department of Earth Sciences, National Central University, Taoyuan 32001, Taiwan
*
Author to whom correspondence should be addressed.
Water 2023, 15(10), 1873; https://doi.org/10.3390/w15101873
Submission received: 28 March 2023
/
Revised: 27 April 2023
/
Accepted: 11 May 2023
/
Published: 15 May 2023
(This article belongs to the Section Hydrology)
Abstract
:Two rivers from Taiwan with different source inputs, the Danshuei (polluted) and Liwu (non-polluted), were selected to study the behavior of molybdenum (Mo) isotopes during weathering and riverine transport. In the Danshuei River, δ98/95Mo ranges from 0.83‰ to 1.50‰ (wet season) and 0.54‰ to 1.25‰ (dry season). With a few exceptions, δ98/95Mo in the Danshuei River is lighter during the wet season, while, in contrast, heavier in the dry season. In the Liwu River, δ98/95Mo varies from 0.54‰ to 1.30‰ and gets heavier along the mainstream. Using the MixSIAR model, three Mo sources are identified in the Danshuei River: seawater intrusion, rock–water interaction, and anthropogenic inputs. Seawater intrusion can explain the heavy δ98/95Mo downstream signal during the wet season contributing 14–39% from the MixSIAR model. However, the lighter δ98/95Mo signal during the dry season is most likely due to anthropogenic inputs in the middle and lower reaches of the Danshuei River contributing 75–98%. In the Liwu River, dissolved Mo isotopes correlate with SO42−/Na and (Sr/Na) ×1000 ratio, suggesting that pyrite oxidation coupled with carbonate weathering governs the heavy δ98/95Mo signature, with sequestration of light δ98/95Mo into secondary mineral phases in bedload sediments. Furthermore, these results have important implications for riverine Mo sources to the ocean, controlled by anthropogenic activity and weathering processes.
1. Introduction
In the last few decades, the fundamentals of molybdenum (Mo) isotope geochemistry in the marine system have been well studied [1,2]. However, the river system, being the most important transporter of the dissolved elements and suspended particles from the continents to the ocean, is intricate and dynamic [3,4,5,6]. Additionally, the river system is negatively impacted by increases in urbanization, agricultural activities, and industrial applications, which may further alter the hydrological processes [7,8]. Consequently, many aspects of Mo isotopic fractionation in the river system in response to natural and anthropogenic factors have not been well studied [1,2,9,10,11,12].
Molybdenum isotopes are a promising proxy to study oxidative weathering at a continental scale. Many recent studies have reported that the riverine δ98/95Mo is isotopically heavier than the average upper continental crust (UCC) δ98/95MoUCC = 0 to 0.4‰ [1,13,14,15]. Overall, the global riverine δ98/95Mo signature spans a wide range from δ98/95Mo = −0.1‰ to 2.3‰ [10,11,12,16,17,18,19]. This large Mo isotopic fractionation in global rivers most likely reflects the heterogeneity in lithologies, modes of continental weathering, and specific climatic/environmental settings. Some studies have suggested that the heavier riverine δ98/95Mo signature may be associated with the sequestration of lighter Mo isotopes in the residual weathering products, e.g., soil, clays, and/or organic matter [20,21,22]. In contrast, other studies have demonstrated that the weathering of catchment lithology, in particular, the preferential dissolution of mineral phases with a heavier δ98/95Mo signature such as the weathering of sulfide-rich minerals, may control the δ98/95Mo in the dissolved load [17,23]. Taiwan rivers flow through different lithologies within the same basin and are affected by several processes [9]. In addition to chemical weathering, the contribution of the anthropogenic input of Mo in the river systems has received little attention. Molybdenum is extensively used as an industrial material and is subsequently discharged as wastewater [24,25]. Lately, the potential point sources of pollution from anthropogenic activity on the surface Mo cycle from acid mine drainage and mine tailings (i.e., mine waste storage facilities) have been reported [24,25,26]. Evidently, the rock–water interaction and anthropogenic input could potentially affect the Mo isotope signature and its geochemical behavior during riverine transport. As a result, anthropogenic Mo can transform the natural Mo isotopic composition of river water and alter the surface Mo cycle. In this regard, understanding Mo behavior and its fractionation mechanism in polluted rivers is crucial to constrain the impact of anthropogenic contaminants.
Taiwan is one of the fastest-developing South Asian countries in the world, and its water quality is rapidly deteriorating [27]. The Danshuei River, the largest river in northern Taiwan, flows through the metropolitan area of Taipei, where a total population of ~6 million people resides, and is an important water resource for such a high population density. It receives both treated/untreated domestic sewage, agriculture, and industrial effluents, thus making it one of the most heavily polluted rivers in northern Taiwan [28,29,30,31], and it is a proper target for discussing Mo behavior in the polluted river system. To gather more insight on Mo isotope behavior, a well-drained, non-polluted Liwu River was chosen for comparison. It flows through the steep, eroding topography of eastern Taiwan and accounts for the highest silicate cation denudation rate of ~18 t km−2 in the world [32]. Liwu River water chemistry is controlled mainly by hydrological processes and its associated chemical weathering fluxes and is mostly free from anthropogenic pollution.
Herein, we present the isotopic ratio of dissolved riverine Mo for the first time in the Danshuei (polluted) and Liwu (non-polluted) Rivers in Taiwan, which will improve our understanding of riverine Mo behavior in two different settings. Based on these considerations, the main objectives of this study are: first, to investigate the comparative behavior of the dissolved δ98/95Mo ratio and its Mo concentration in these two river catchments; second, to identify the potential sources of Mo; and third, to understand the impact of anthropogenic influence on the Mo geochemical cycle.
2. Materials and Methods
2.1. Study Area
2.1.1. Danshuei River
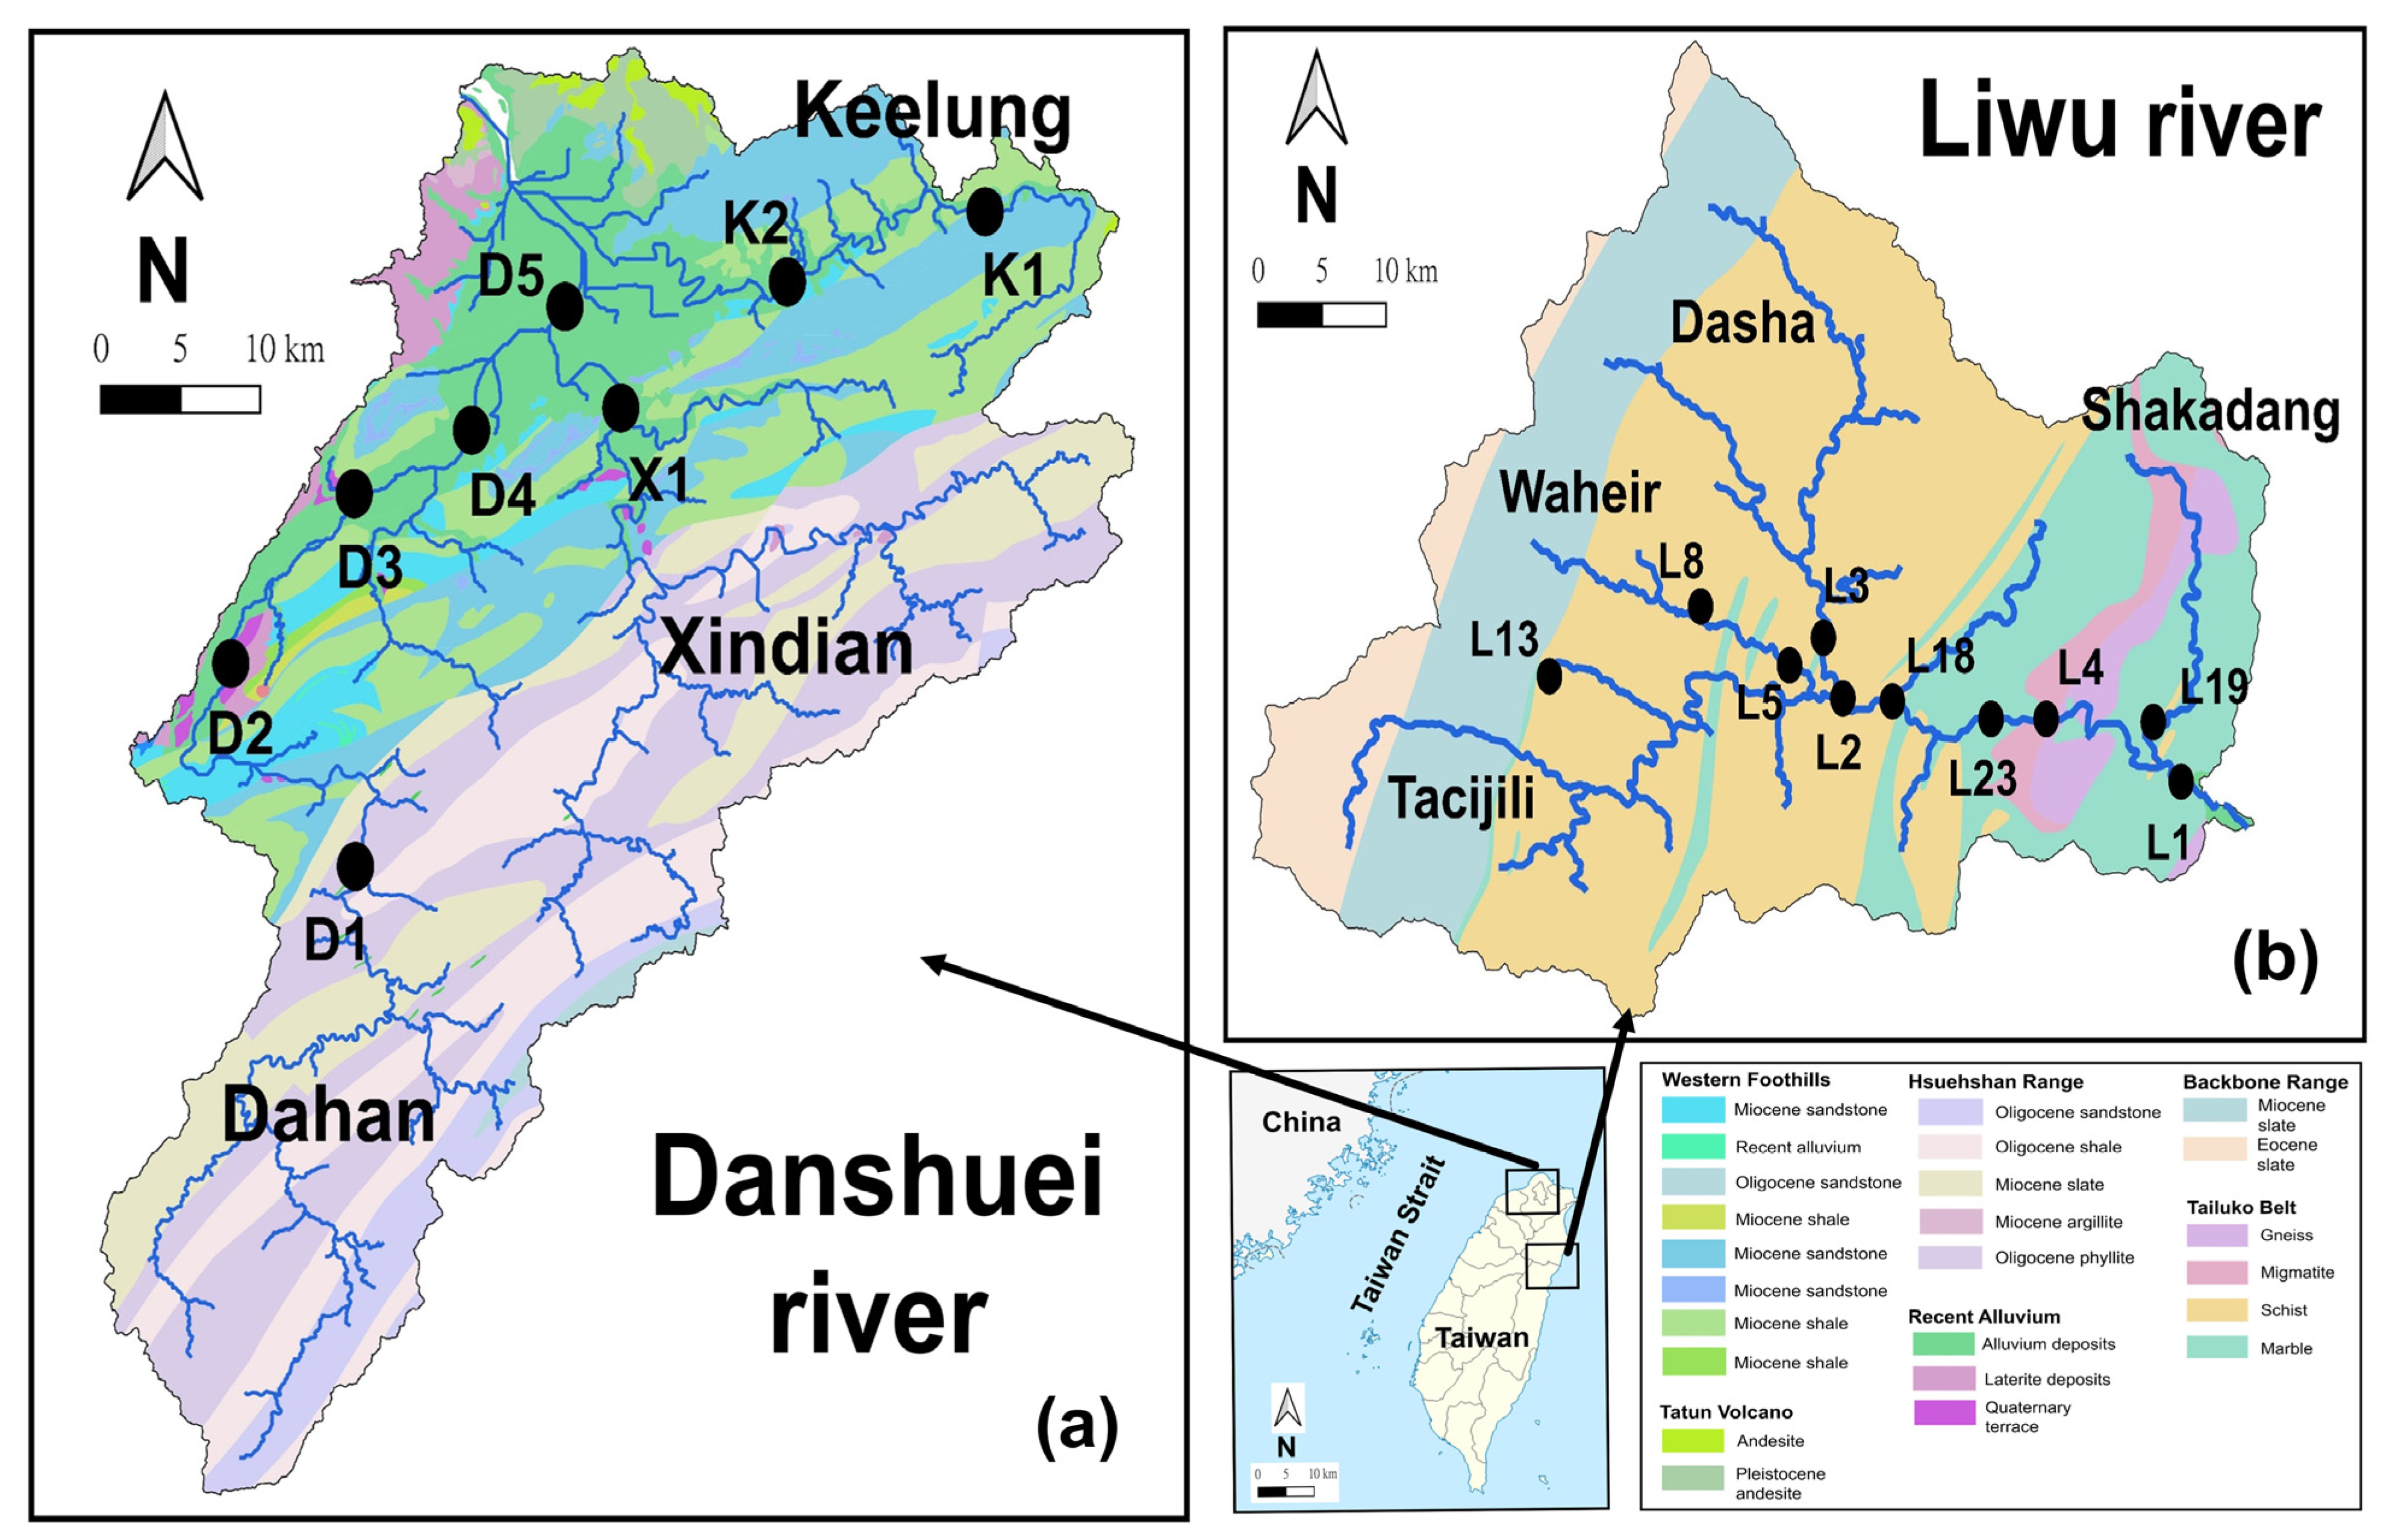
The Danshuei (25°10′ N; 121°10′ E) the third largest river in Taiwan, covers 7.6% of the total area, and has a mainstream length of 159 km with a drainage area of 2726 km2 [33]. It is a hypoxic subtropical estuary, with a channel gradient ranging from 0.15% to 27%. Because of its low channel gradient downstream, the seawater intrusion can reach up to 40–50 km [34,35]. It receives a mean annual precipitation of 2325 mm (Central Weather Bureau, http://www.cwb.gov.tw/ (accessed on 24 February 2022)) and has three major tributaries: the Dahan, Keelung, and Xindian Rivers. The confluence of the Dahan and Xindian Rivers forms the main Danshuei River (Figure 1a). The Dahan River contributes 31%, the Keelung River contributes 27%, while the Xindian River contributes 37% of the total freshwater discharge. The mean water discharge rate is 233 m3/s for the main Danshuei River, while the upstream average river discharge rates for the Dahan, Keelung, and Xindian are 62.1, 26.1, and 72.7 m3/s, respectively [36]. The Danshuei drainage basin comprises mainly low-grade metamorphic and sedimentary rocks containing shale, slate, phyllite, argillite, and sandstones [37]. In addition, the two major volcanic regions, the Tatun volcanic group (TVG) and Keelung volcanic comprise andesite rocks aged 0.1–2 Ma [38,39].
2.1.2. Liwu River
The Liwu River, which originates 3500 m above sea level, has a length of 55 km and a basin size of 616 km2 (Figure 1b) [40]. The landslide-dominated Liwu River watershed is primarily covered by dense tropical forest and is situated in Taiwan’s Taroko National Park. It has a very high catchment erosion rate of ~12.5 mm/yr, likely owing to frequent earthquakes, intense rainfall, and its steep topography, which give rise to landslides accompanied by rapid soil erosion [5]. Despite its small size, about ~14 Mt/yr of suspended load is discharged annually into the Philippine Sea [5,40]. The Liwu River has three major tributaries: the Waheir, Dasha, and Shakadang. The upper part of the Liwu catchment consists of Miocene to Eocene slate of the Backbone Range, with schists and marble of the Tailuko Belt in the middle and lower reaches [37]. The landslide-dominated Liwu River accounts for 22%, 56%, and 22% of slate, schist, and marble of the total drainage area [41]. No marble outcrops have been reported in the upper reaches of the Waheir and Dasha Rivers and their tributaries, as they drain completely through the Paleozoic-Mesozoic schist of the Tailuko Belt. However, the extent of the marble outcrop increases along the middle to lower reaches of the mainstream Liwu River.
2.2. Sampling and Analytical Procedures
River water samples were collected in pre-cleaned high-density polyethylene (HDPE) bottles, filtered through a 0.22 µm cellulose acetate filter, and acidified to pH ~2 with ultra-pure concentrated nitric acid. The sampling details are given in the Supplementary Materials. A double-spike method was used for Mo isotope measurement and its description is given in [9,42,43,44].
The Mo isotopic composition is expressed as δ98/95Mo notation as follows:
δ98/95Mo (‰) = [(98Mo/95Mo)sample/(98Mo/95Mo)NIST SRM-3134 − 1] × 1000
All the Mo isotope data cited from the literature in this study were normalized to NIST SRM-3134 = +0.25‰, a certified international inter-laboratory Mo isotope standard [45,46,47]. The accuracy and reproducibility of the Mo isotopic measurement were verified by periodic analysis of two international standard reference materials, BHVO-2 (δ98/95Mo = 0.21 ± 0.07‰, 2σ, n = 5) and IAPSO seawater (δ98/95Mo = 2.34 ± 0.08‰, 2 σ, n = 5). Both the standards were in good agreement with the previously published values [10,44,47,48,49,50]. The total procedural blank was negligible (<1% of total Mo analyzed).
3. Results
3.1. Hydrological Parameters and Major Ion in the Dissolved Load
The hydrological parameters and major ion data for the Danshuei River is shown in Table 1. The river water pH varied from slightly acidic to alkaline, with high pH values upstream in each tributary during both seasons. Sampling sites D4, D5, and K2 exhibit very high electrical conductivity (EC) and total dissolved solids (TDS) values during the wet season. The average TDS for the large rivers of the world is 286 mg/L [3]. The ion chemistry in the Danshuei River and its tributaries was dominated by Na+ and Cl− ions. During the wet season, the cation fraction varied in the order Na+ > Mg2+ > Ca2+ > K+, accounting for 81%, 10%, 5%, and 2% of the total cation (Table 1), while during the dry season, Na+ > Ca2+ > Mg2+ > K+ accounted for 50%, 27%, 13% and 4%, respectively. The Cl− and SO42− anion accounted for 92% and 8% in the wet season, and 37% and 51% in the dry season. The major ion concentration increases toward the lower reaches of the Danshuei River during the wet season, while the seasonal variation in major ion concentration remained small upstream of the river catchment.
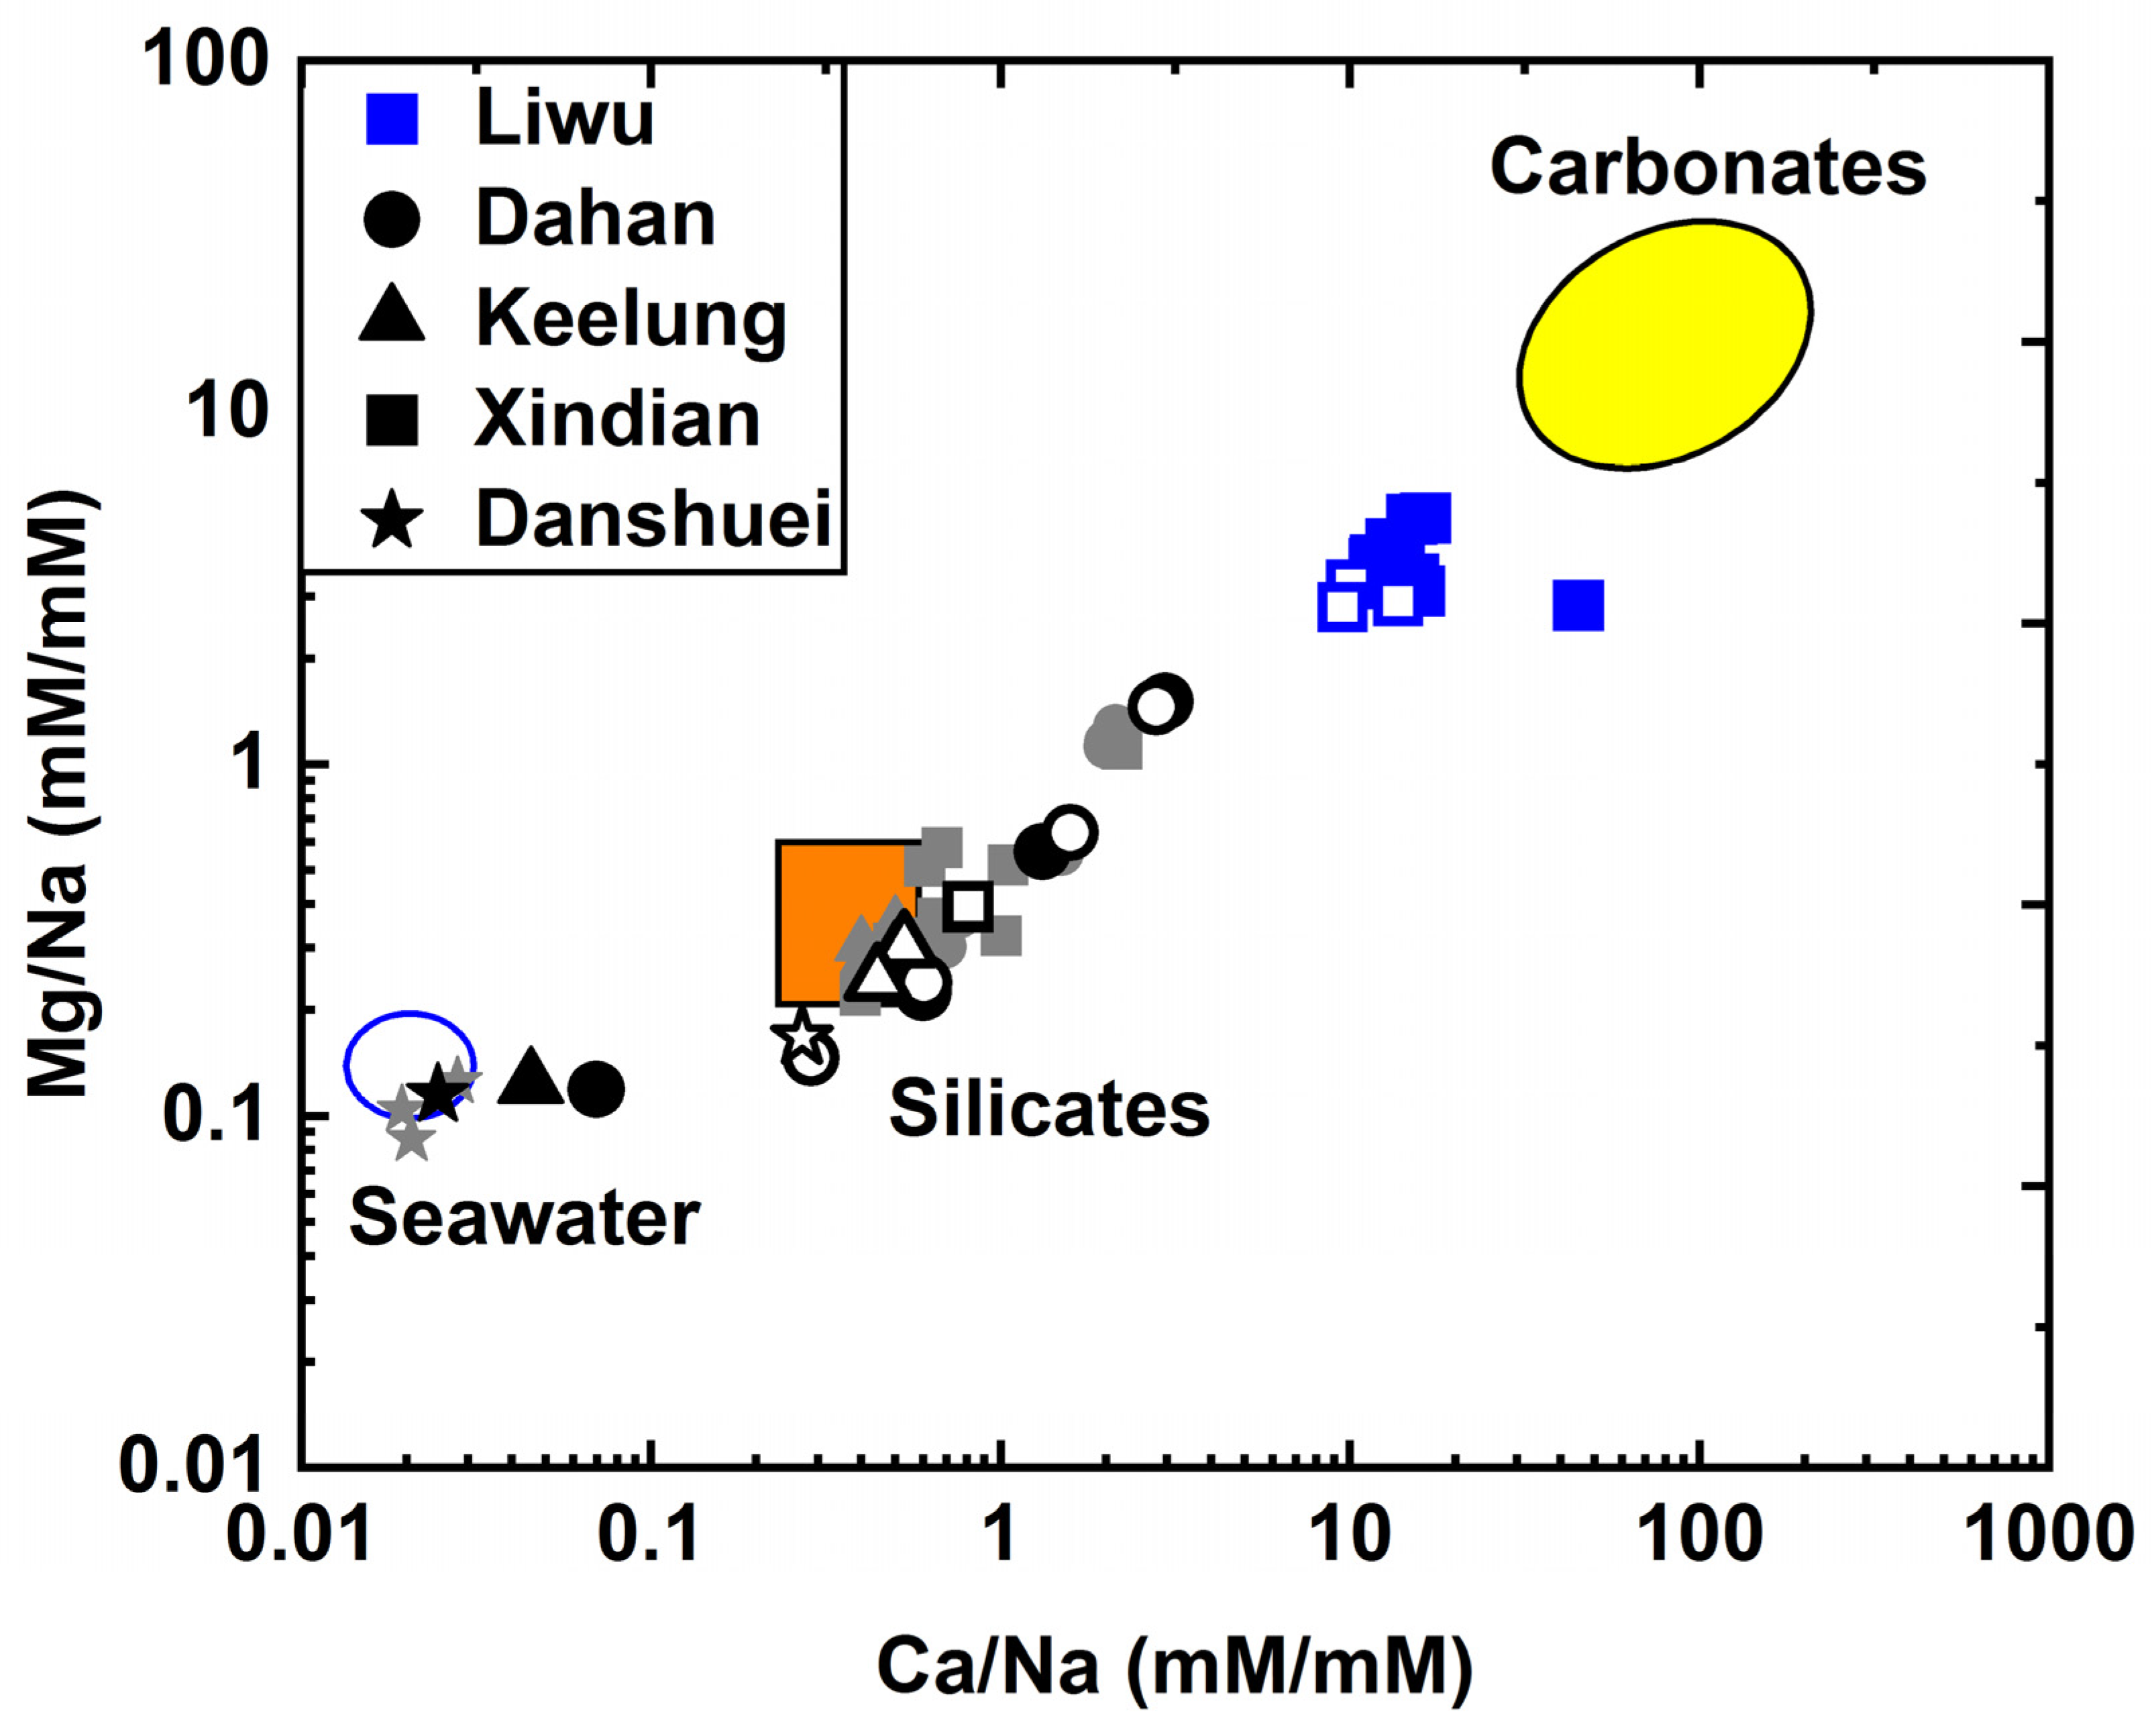
The hydrological parameters measured in the field and major ion data for the Liwu River are shown in Table 2. No apparent seasonal variation was found for both pH and TDS; however, the TDS value in the Liwu River (~226 mg/L) was slightly lower than the global average at 286 mg/L [3]. Ca2+ was the dominant cation for both the wet and dry seasons, followed by Mg2+, Na+, and K+ (Table 2). Both the Danshuei and Liwu River water samples lie between the silicate and carbonate end-member, while the three samples from the Danshuei River fall on the seawater end-member (Figure 2).
3.2. Temporal and Spatial Distribution of δ98/95Mo and Mo Concentration
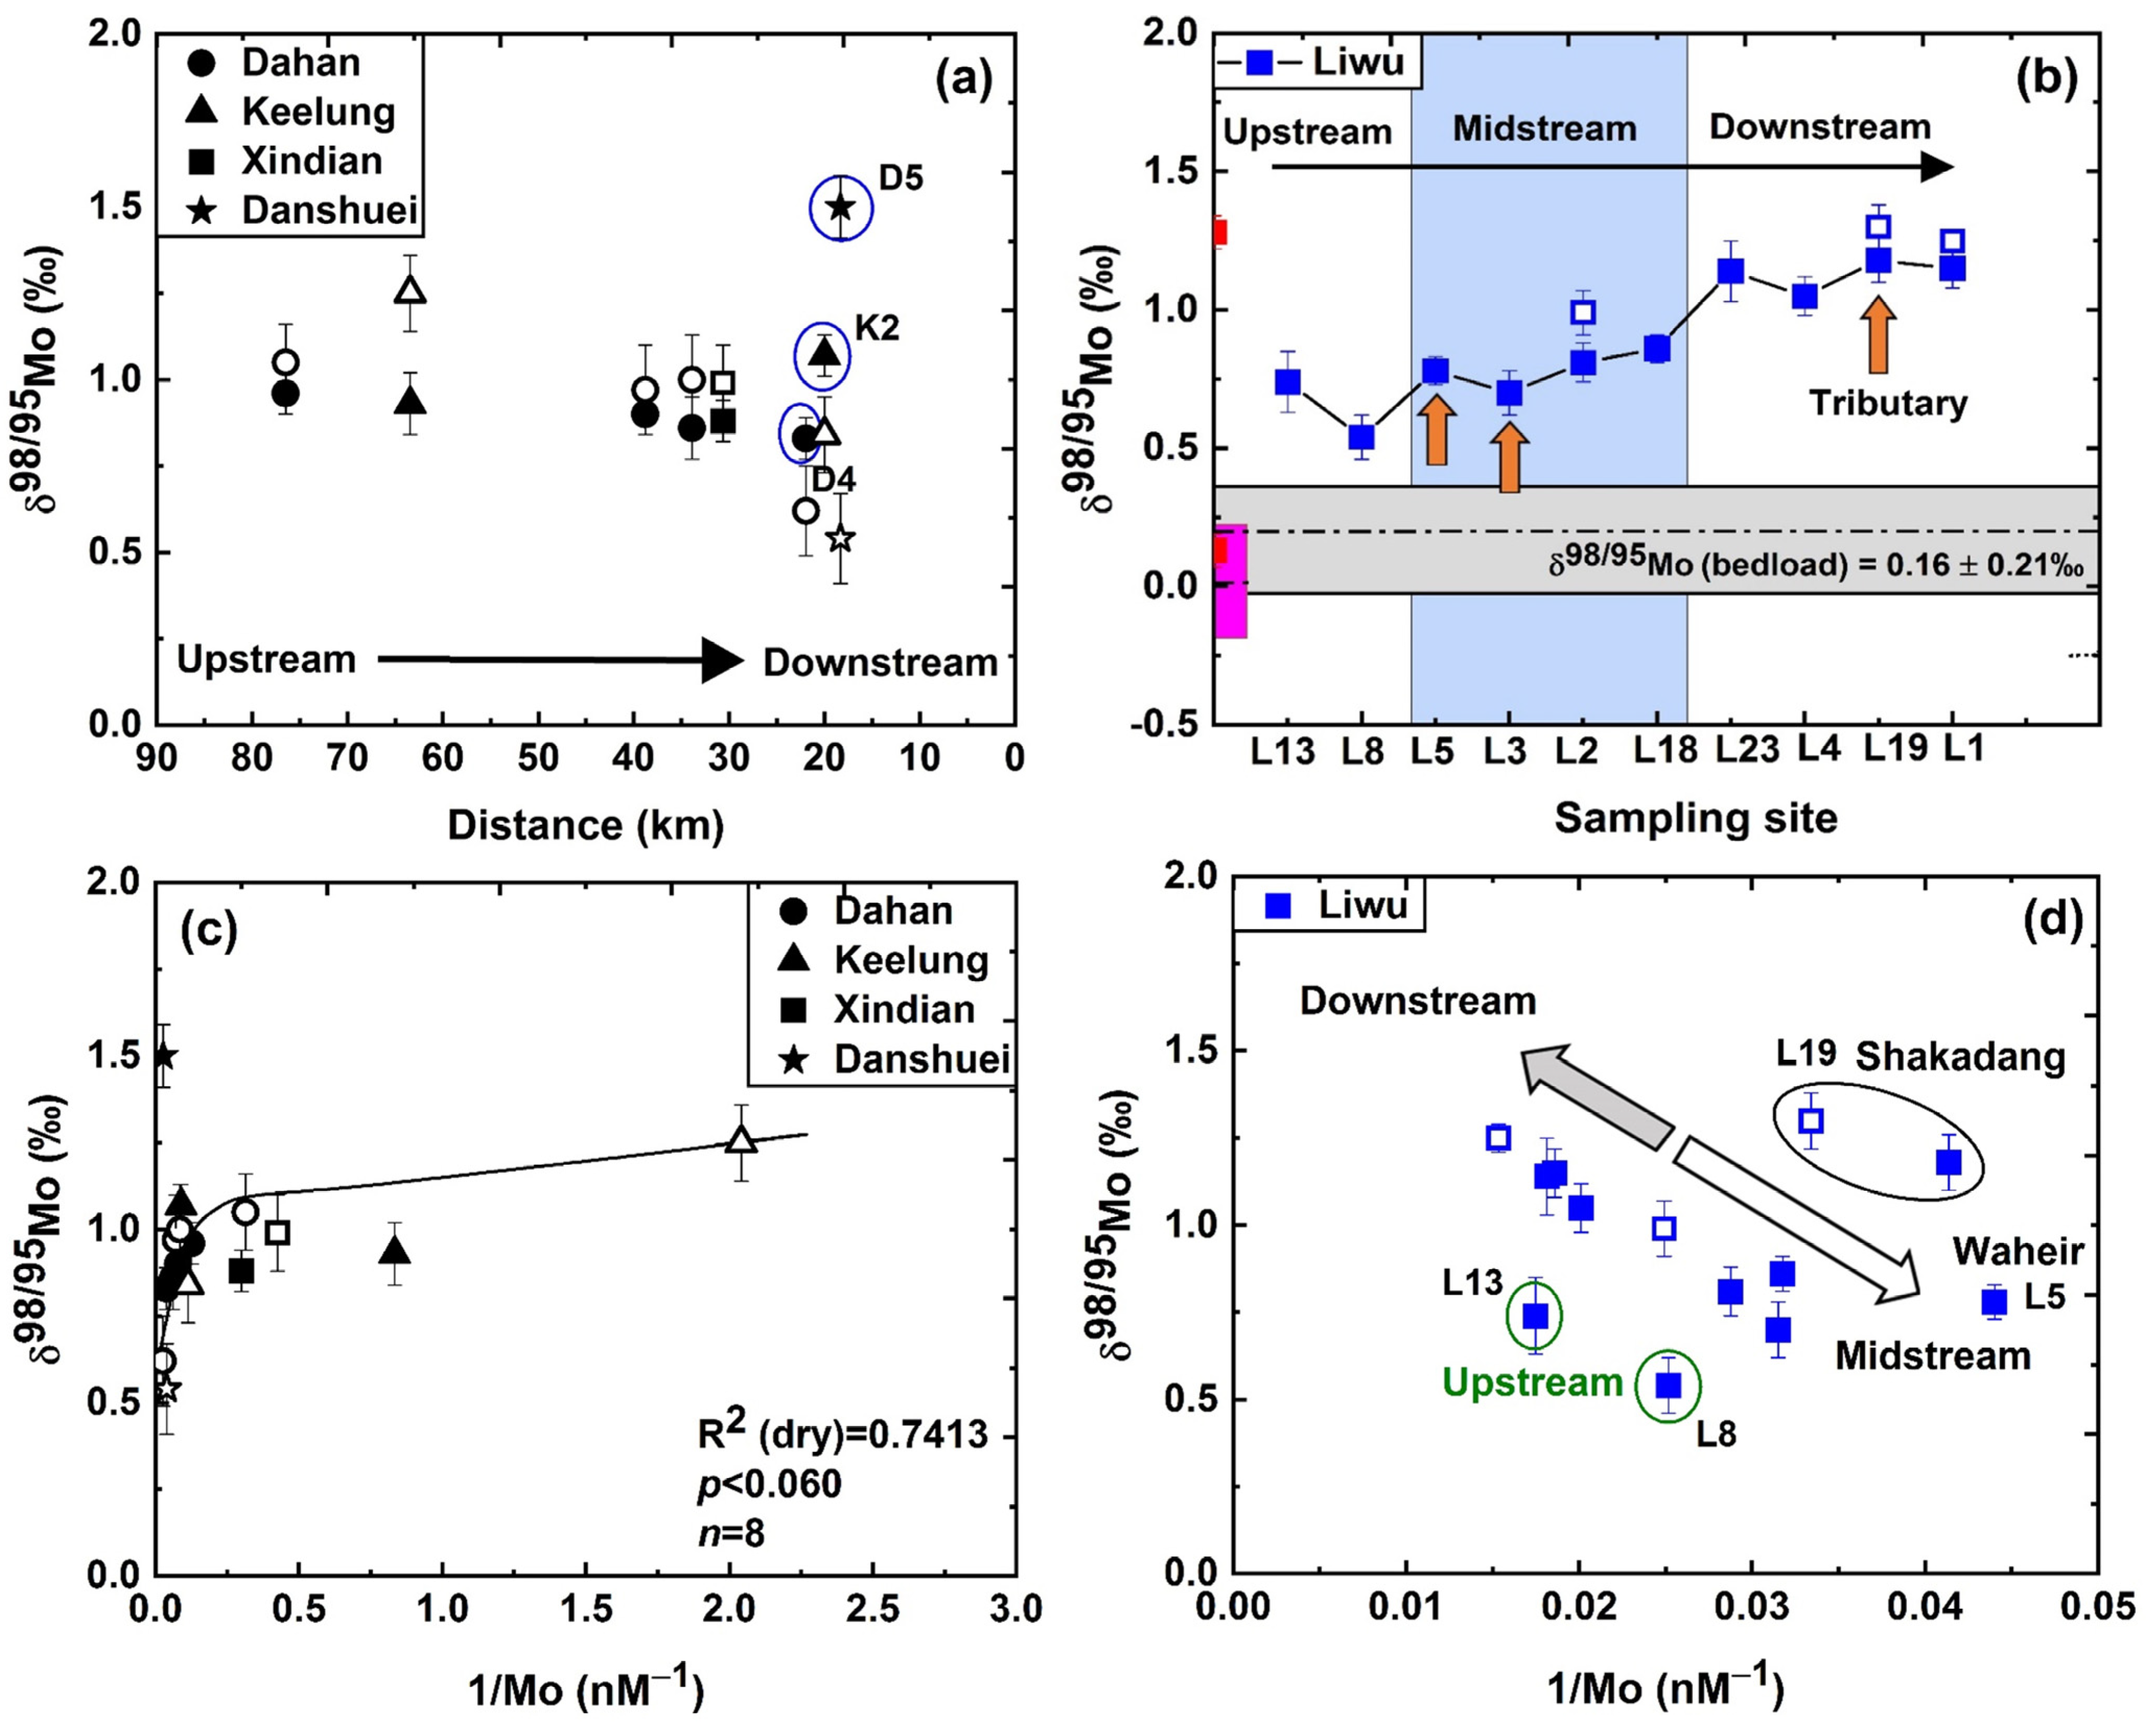
The temporal and seasonal variation of dissolved δ98/95Mo and the Mo concentration for the Danshuei and Liwu Rivers are given in Table 3 and Table 4. In the Danshuei River, the dissolved δ98/95Mo displays a large variation from 0.83‰ to 1.50‰ (with an average δ98/95Mo = 0.99 ± 0.22‰, 1 SD), with Mo concentration ranging from 1.20 to 37.77 nM in the wet season. During the dry season, the δ98/95Mo ranges from 0.54‰ to 1.25‰ (with an average δ98/95Mo = 0.91 ± 0.23‰, 1 SD), and Mo concentration ranges from 0.49 to 38.04 nM. In addition, the Danshuei River exhibits a large fractionation for the δ98/95Mo along the river catchment (Figure 3a); the upstream and midstream reaches were heavier in the dry season. In contrast, the lower reaches in the dry season show lighter δ98/95Mo signatures, while the heavier δ98/95Mo was observed in the lower reaches during the wet season. The concentration of Mo was low in the upper reaches of each tributary and gradually increases downstream along the mainstream river (Figure S1).
For the Liwu River, the δ98/95Mo ranges from 0.54‰ to 1.18‰ (with an average δ98/95Mo = 0.90 ± 0.22‰, 1 SD) during the wet season, while in the dry season, the δ98/95Mo was heavier, from 0.99‰ to 1.30‰, (with an average δ98/95Mo = 1.18 ± 0.17‰, 1 SD). In addition, the δ98/95Mo signal show a systematic increase from upstream to downstream along the Liwu River catchment (Figure 3b). The Mo concentration varies from 22.72 to 57.17 nM in the wet season and from 29.94 to 65.17 nM in the dry season, with no spatial distribution pattern (Figure S1). The middle reaches show low Mo abundance compared to the upper and lower reaches; however, interestingly, all sampling sites in the Liwu had a higher Mo abundance than the global average Mo concentration = 8 nM [51]. The δ98/95Mo in the Liwu riverine bedload sample show light Mo isotope values of −0.06‰ to 0.43‰ (Table 4).
4. Discussion
4.1. Major Elements
The molar ratio of Mg/Na versus Ca/Na is shown in Figure 2. The results illustrate that all the river water samples from the Danshuei and Liwu Rivers lie in the mixing line between silicate, carbonate, and seawater end-members [3]. This indicates that the dissolved load in these two rivers was mainly derived from the weathering of carbonate and silicate rocks [35,52], except for the three samples D4, D5, and K2 from the wet season. These three samples lie closer to the seawater composition and has very high Cl, Na, and other major ion concentrations (Figure 2; Table 1), suggesting that they were most likely affected by tidal intrusion. The upstream of the Dahan River, a tributary of the Danshuei River, had relatively high Mg/Na, Ca/Na, and Sr/Na ratios and contributes to a higher carbonate weathering. This may be the result of the selective weathering of disseminated calcite veins, which are common in metamorphic formations [35,53,54]. In contrast, samples from the mainstream Keelung, Xindian, and Danshuei Rivers lie closer to the silicate end-member, owing to weathering of Na-rich plagioclase and/or Na-bearing minerals. The low Mg/Na, Ca/Na, and Sr/Na ratio in these rivers may be attributed to the low physical weathering rate and/or limited rock–water interaction. In the Liwu River, water samples lie very close to the carbonate end-member as they contain more input from carbonate weathering, which is consistent with the presence of Tailuko marble in the Liwu catchment [32,55]. Hence, the Liwu River has more Ca2+ ions released relative to Na+, and the dissolution of carbonates dominates its river water chemistry.
4.2. Behavior of Mo Isotopic Composition and Its Concentration during Weathering and Riverine Transport Processes
The river water samples from the Danshuei (polluted) and Liwu (non-polluted) were investigated to check if there was any systematic isotopic fractionation in terms of Mo. The δ98/95Mo isotopic signal in the headwaters of the Danshuei River and its tributaries were heavy and became progressively lighter with a gradual increase in Mo concentration from upstream to downstream, excluding the samples D4, D5, and K2 marked in blue circles, which had significant seawater contributions during the wet season, as presented in Figure 3a. On the contrary, in the Liwu River, a very good systematic increase in the δ98/95Mo signature from the upper to the lower reaches was observed (Figure 3b). The average bedrock δ98/95Mo value in low-grade metamorphic, sedimentary, and volcanic rocks around Taiwan is much smaller [9] and cannot account for such a large variability observed in the dissolved load (~1‰) in Taiwan rivers. As a result, the observed shift toward a heavier δ98/95Mo signature in the dissolved load must be accompanied by some other processes during river transport. Based on Pearce et al. [18], the authors reported lighter δ98/95Mo upstream (close to the river source) and heavier δ98/95Mo downstream in Icelandic rivers. The same authors suggested that the observed enrichment of the heavy δ98/95Mo signal in the dissolved load along the river catchment should favor the removal of the lighter δ98/95Mo isotope via adsorption onto secondary mineral formation, such as Fe-Mn oxides [18]. Similar findings from other studies were also in line with the Icelandic rivers, where the δ98/95Mo signal in dissolved load becomes heavier downstream [11,18,56]. However, results from the Danshuei River catchment were in contrast to them (Figure 3a). The δ98/95Mo versus 1/Mo (Figure 3c) in the Danshuei River did not show any correlation in the wet season. This may be due to the physical mixing of river water and/or the strong exchange of materials during the wet season, where a lot of material gets mixed in because of enhanced mechanical erosion and landslides. However, during the dry season, it showed an excellent positive correlation (R2(dry) = 0.74), where samples with low Mo concentration had a heavier δ98/95Mo signal. The Mo abundance and other trace metal concentrations (Cu, Ni, Fe, and Zn; Table 3) gradually increases with a lighter δ98/95Mo value along the downstream of the Danshuei River catchment. Molybdenum is highly unreactive and present as a soluble molybdate (MoO42−) oxyanion in oxygenated water. If Mo was attributed to a simple binary mixing between the seawater and river water end-member in the Danshuei River, a negative trend should have been observed where upstream riverine Mo should have a low Mo concentration with lighter δ98/95Mo, while seawater should have a high Mo concentration with heavy δ98/95Mo. Such conservative mixing behavior of Mo has been reported in few estuaries such as the Narmada River in India, the Borgarfjörður estuary in Iceland, and the Itchen estuary in southeast England [16,18,56]. However, the data from the Danshuei River suggest that the observed pattern may be attributed to some other process and/or mixing of a third end-member with a lighter δ98/95Mo source, and which will be discussed further in Section 4.3.
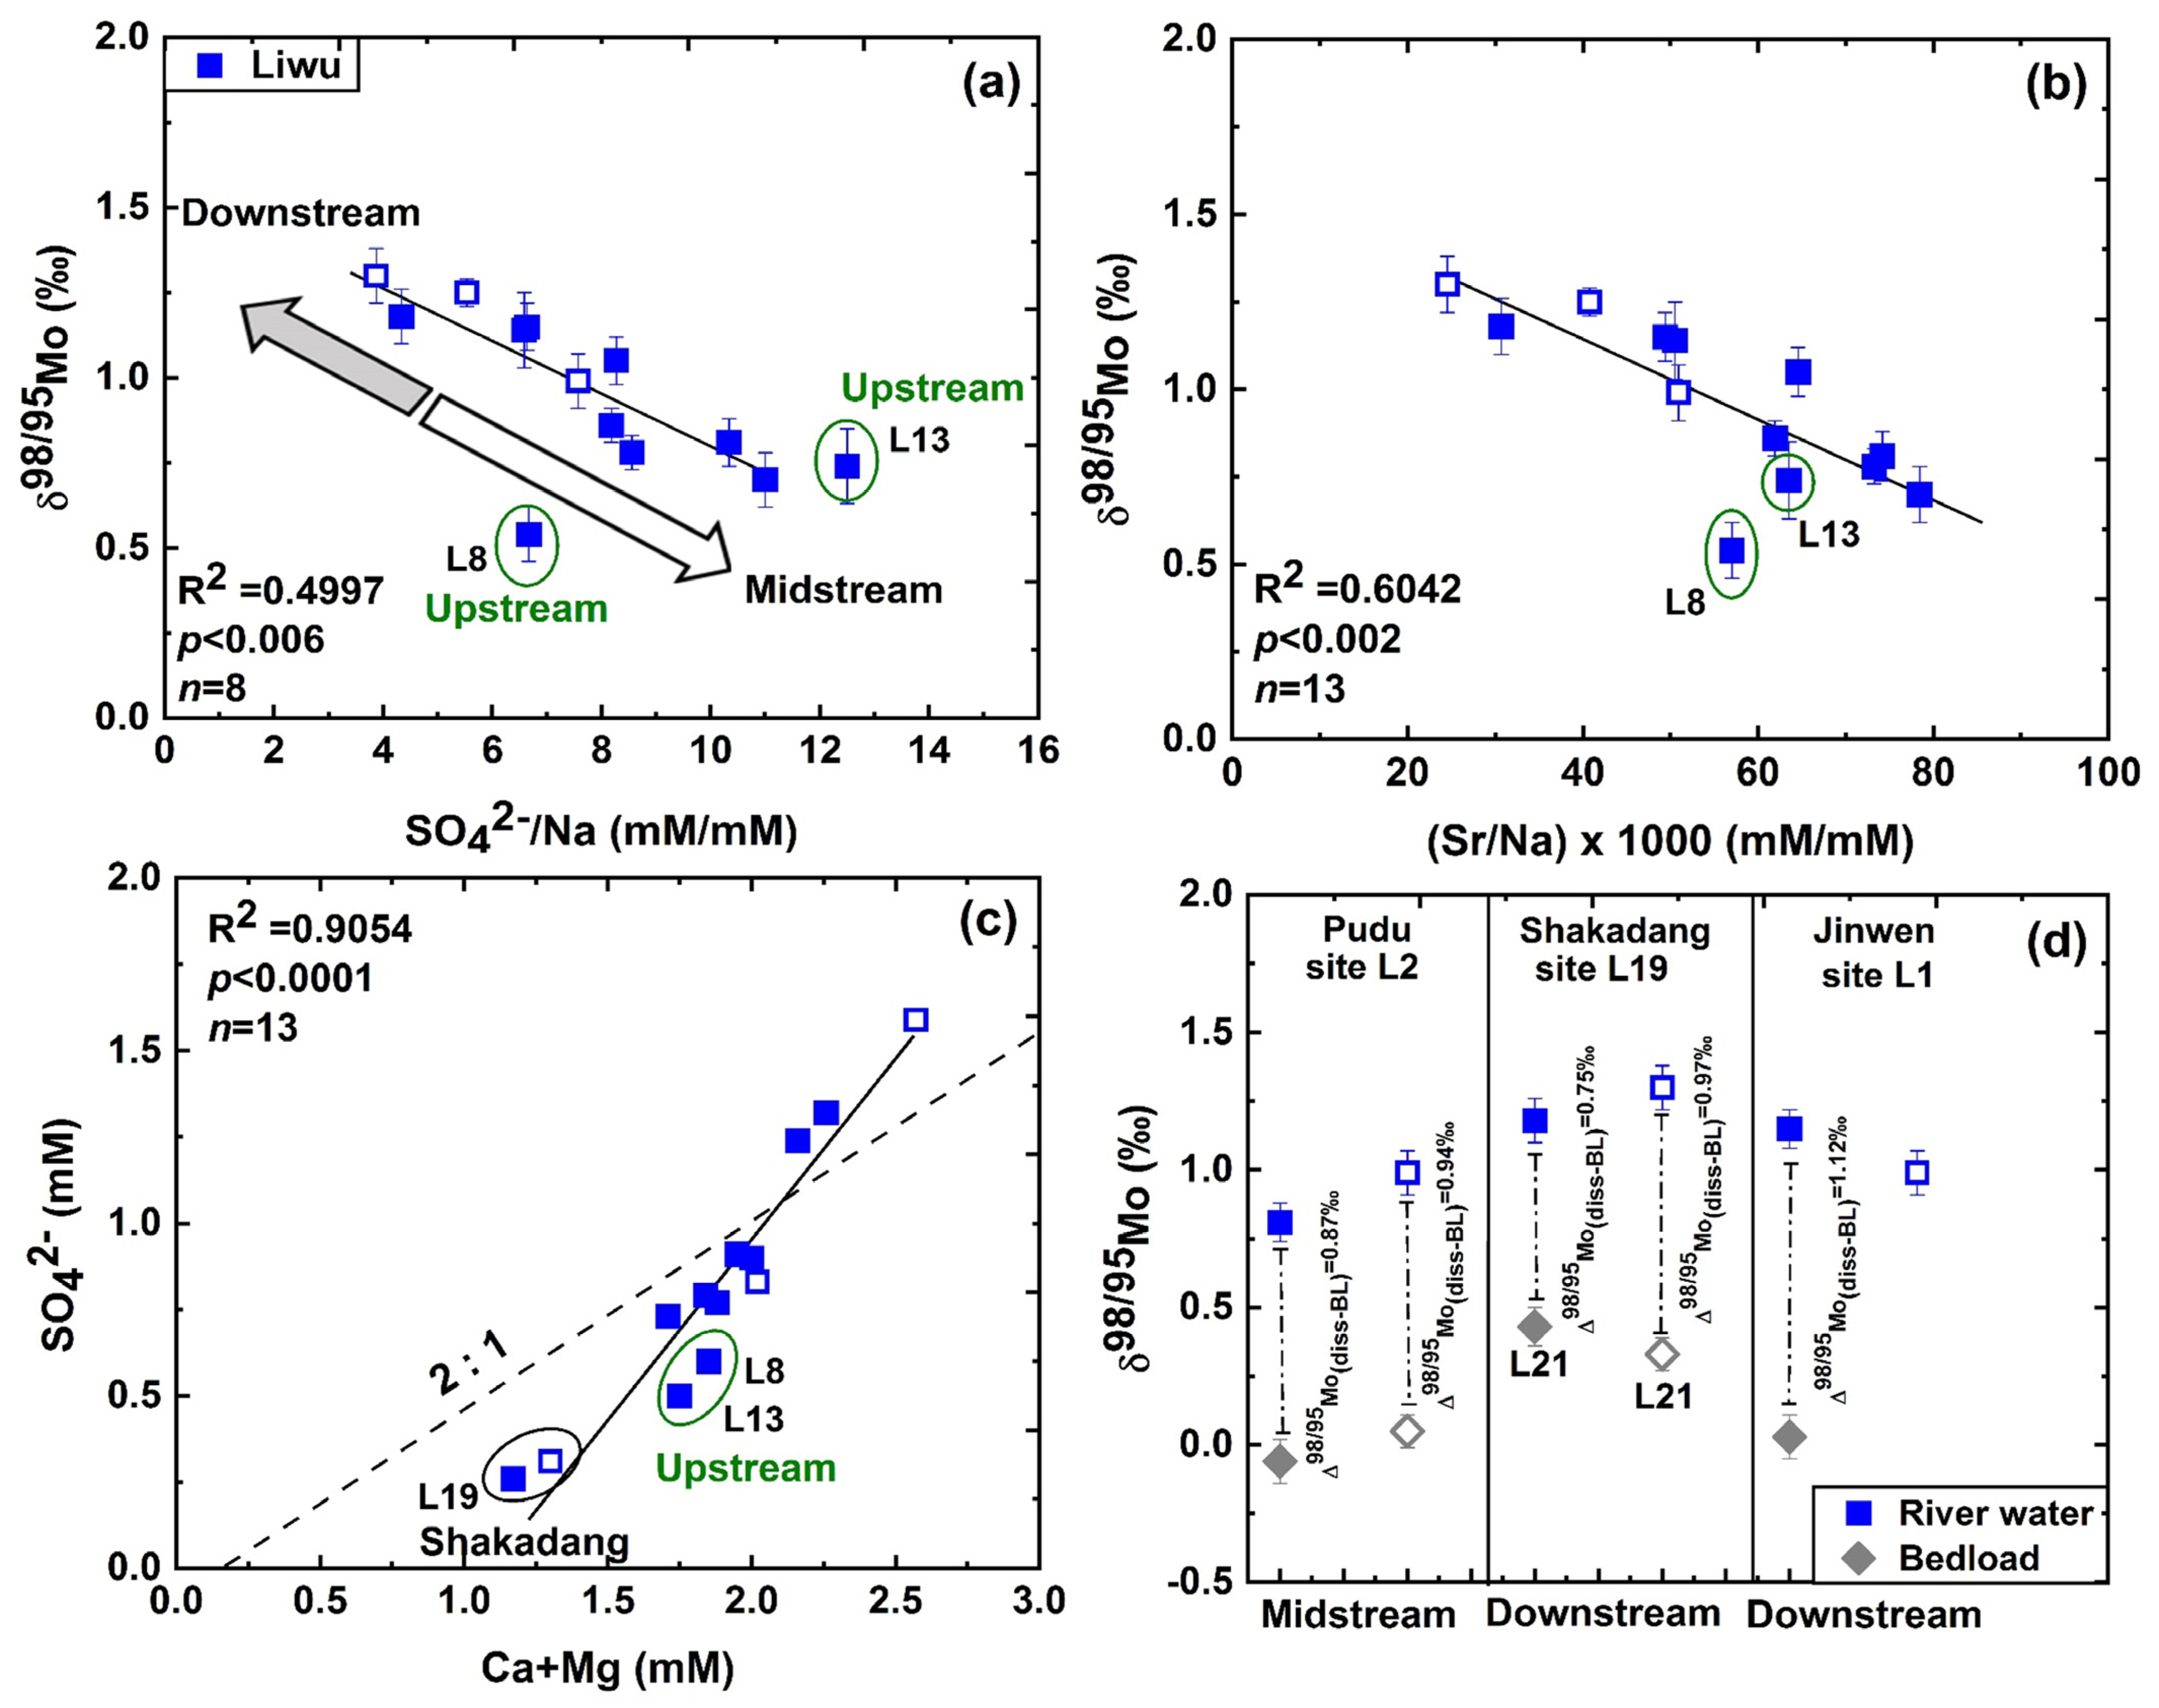
For the non-polluted natural Liwu River, δ98/95Mo was plotted against 1/Mo concentration in Figure 3d. Two upstream samples (L13, δ98/95Mo = 0.74 ± 0.11‰; L8, δ98/95Mo = 0.54 ± 0.08‰) and the Shakadang River (L19, δ98/95Mo (wet) = 1.18 ± 0.08‰; δ98/95Mo (dry) = 1.30 ± 0.08‰) deviate from the linear trend. Principally, both upstream samples (L13 and L8) lie far away from the mainstream river and had slightly different δ98/95Mo signatures. After their confluence, however, the δ98/95Mo signal show a good linear trend (R2 = 0.76; Figure 3d) from midstream to downstream, which may suggest that a single fractionation mechanism is responsible for the observed Mo isotopes in the Liwu River. A similar negative linear trend was also observed between δ98/95Mo and the SO42−/Na and (Sr/Na ×1000) ratio (Figure 4a,b). The Liwu River is largely free from human activity, and the river water chemistry is mainly governed by natural weathering processes. Since Mo in precipitation is extremely low (~0.04–0.3 nM) [22,57], the precipitation effect on δ98/95Mo riverine load is negligible [18]. Hence, all the Mo and other major ions in the Liwu River should have come from the natural weathering of source rocks. The data shows that the midstream Liwu River had a high SO42− concentration, high Sr concentration, and relatively high (Ca + Mg) concentrations with lighter δ98/95Mo and a low Mo concentration, and vice versa downstream. The middle reaches, in particular, the Dasha and Waheir tributary, drain schist and slate with disseminated calcites [41,58]. The enhanced dissolution of disseminated calcites in these low-grade metamorphic terranes is 350 times faster than plagioclase and may be responsible for the release of high (Ca + Mg), Sr, and SO42− content in the middle reaches of the Liwu River [53,59], while the Mo concentration reported in carbonates was very low <0.1 μg/g [60]. Both SO42− and (Ca + Mg) concentration plots show a good correlation (R2 = 0.90; Figure 4c) and may suggest that SO42−, (Ca + Mg), and Sr come from similar/same sources. The average SO42− concentration in global rivers is ~0.1 mM [61], while the SO42− concentration in the Liwu River was 3–15 times higher than the global average [62]. As Mo is abundant in pyrites and associated with sulfide-rich minerals because of its chalcophile tendency [63], Mo isotopic fractionation may be associated with the incongruent weathering of bedrock, especially the preferential dissolution of mineral phases that account for observed heavy δ98/95Mo signal [17,23,51]. Pyrites are abundant in the Liwu catchment [32,64]. As there is no evaporite deposit, e.g., gypsum, in the Liwu River, all the sulfates in the Liwu River are likely due to the oxidation of pyrites present in metamorphic and sedimentary rocks in the area [62]. Sulfuric acid sourced from pyrite weathering is a major weathering agent reported in Taiwan watersheds [9,65,66,67]. The sulfuric acid produced by the dissociation of pyrites provides sulfate and H+ ions into the river water and promotes the dissolution of carbonates. Thus, the incongruent weathering of bedrock coupled with sulfide oxidation and carbonate weathering may be attributed to the heavy δ98/95Mo in the Liwu River. The riverine bedload sediments in the Liwu were found to be lighter than the dissolved load and acts as a sink for the lighter Mo isotopes (Figure 4d). The observed high ∆98/95Mo (diss-BL), i.e., the difference in δ98/95Mo value between the dissolved load (diss) and their corresponding bedload samples (BL) values, reflect higher oxidative weathering in the landslide-dominated Liwu catchment and the removal of light δ98/95Mo potentially by secondary weathered products, such as oxides/clays in the riverine bedload. This may indicate the natural mechanism responsible for the fractionation of Mo isotopes during riverine transport and is also comparable to the δ98/95Mo signatures from the soil profile in Hawaii [20,68].
4.3. Characterizing the Natural and Anthropogenic Sources in the Danshuei River
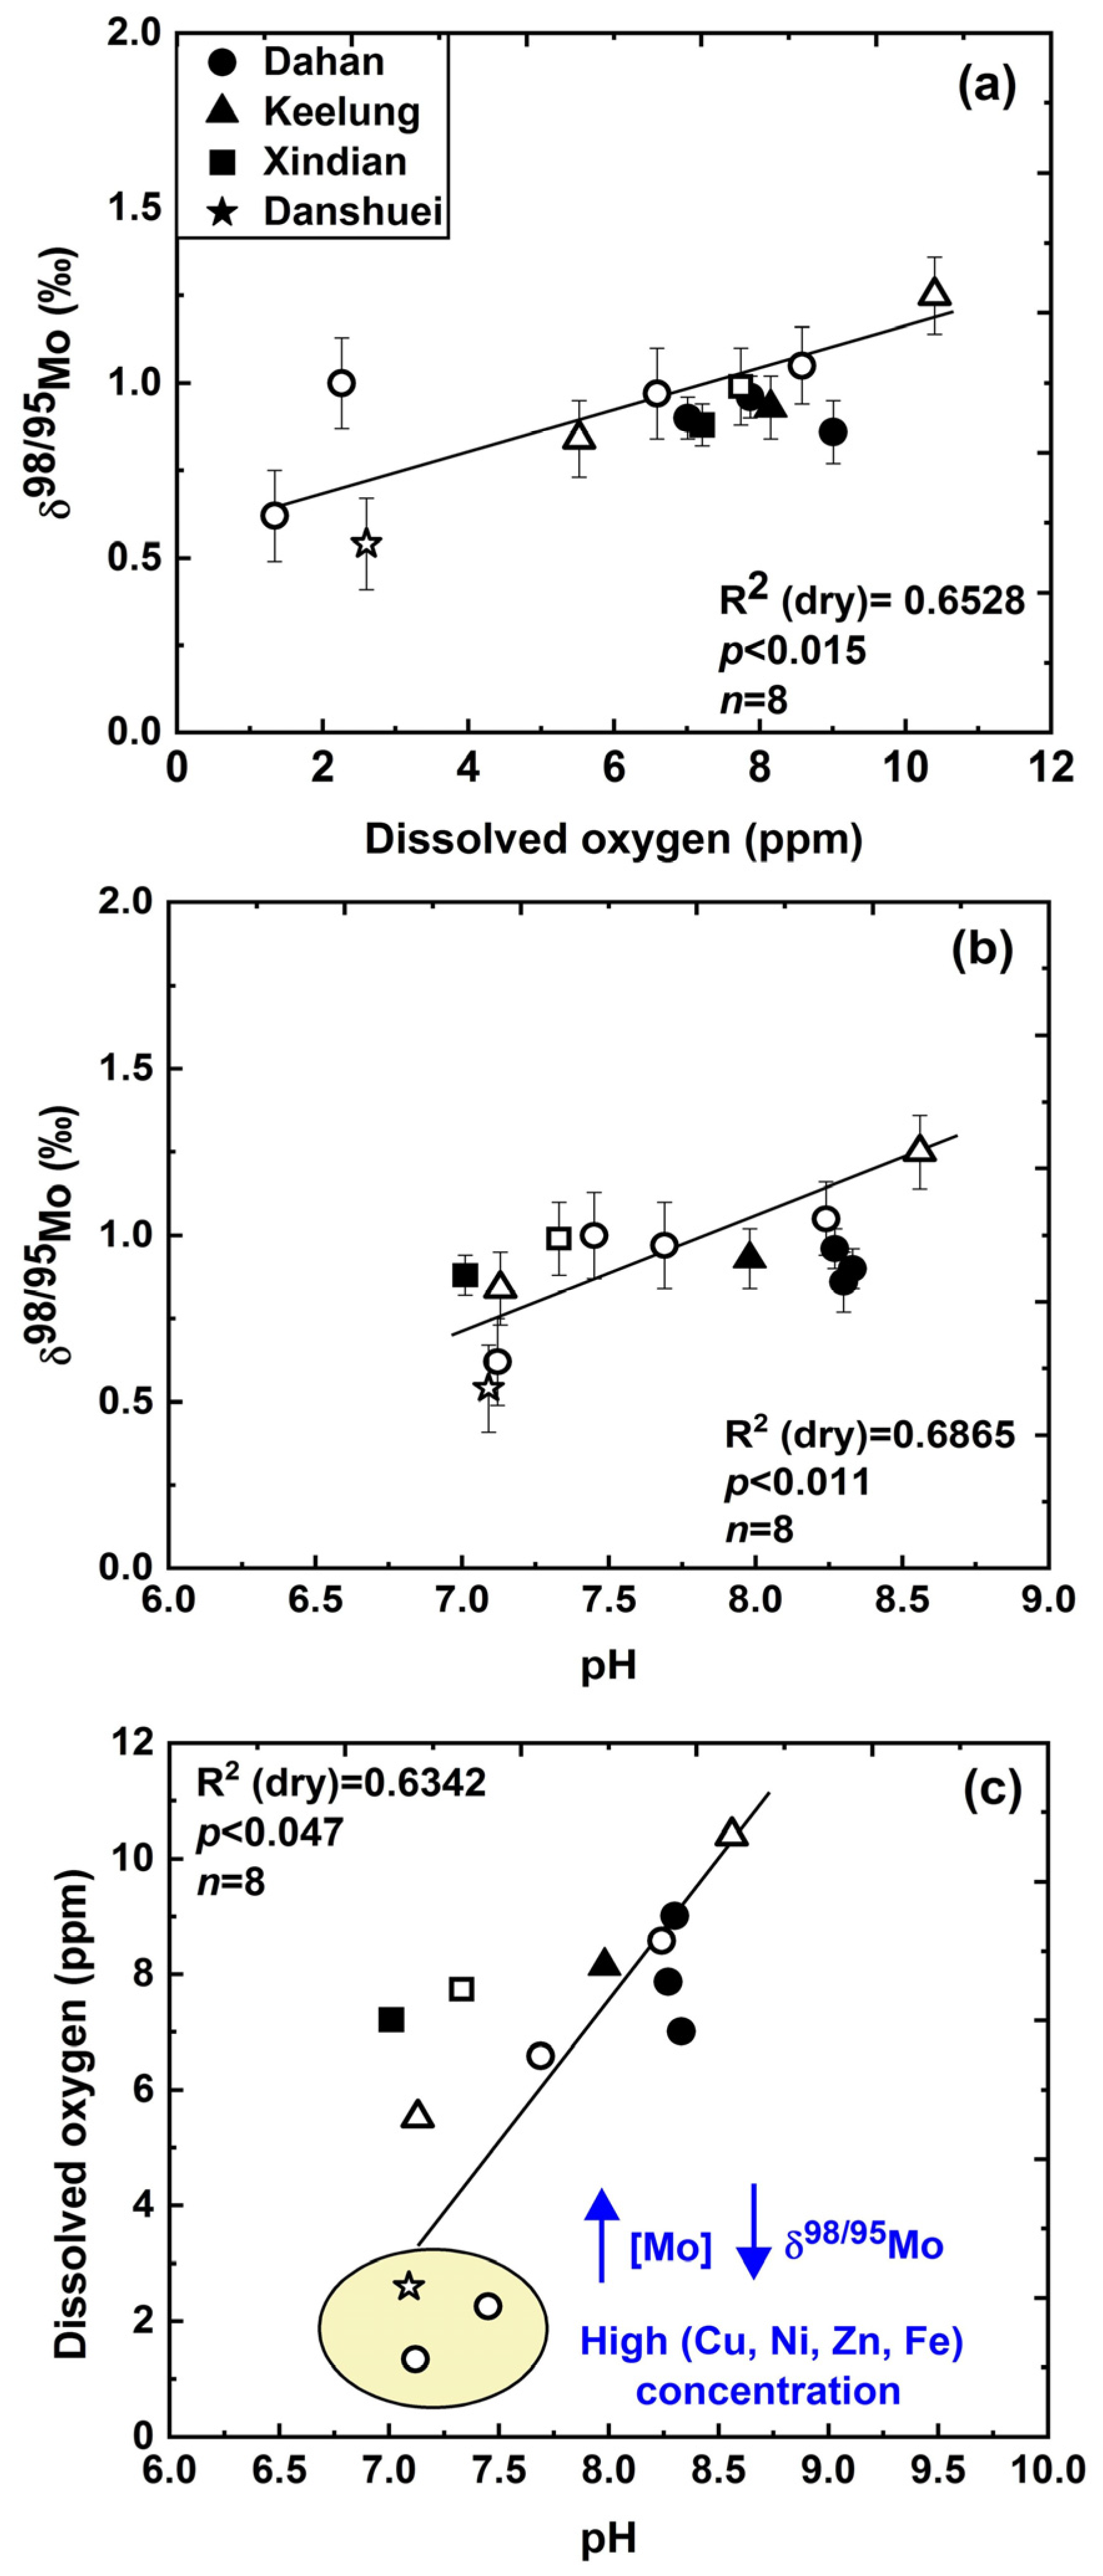
The δ98/95Mo signature show a good positive linear relationship with dissolved oxygen (DO) and pH (Figure 5a,b) during the dry season, with no significant change in the wet season observed in the Danshuei River. During the dry season, the upper reaches of the Danshuei River and its tributary had higher dissolved oxygen levels, ranging from 5.52 to 10.4 ppm, while the lower reaches were characterized with lower DO, <2.6 ppm for sites D3, D4, and D5. The headwaters are well aerated, but as the Danshuei River reaches the Taipei basin, the oxygen level drops sharply. Since the lower reaches of the Danshuei River catchment are densely populated and discharge a significant amount of domestic and industrial wastewater [27,69,70], it is speculated that the low dissolved oxygen level may be attributed to the large oxygen consumption due to wastewater discharge from the industrial sector. This inference draws additional support from the observation that these sites had elevated Mo and other trace element concentrations, e.g., Cu, Ni, Zn, and Fe, as shown in Table 3. The data show that in the Danshuei River, the pH value ranged from neutral to a strong alkaline condition (pH = 7.01–8.56). It is interesting to note that the pH ~7 at sites (D4, D5 during the dry season) had a light δ98/95Mo and very high [Mo], while at similar pH value sites (X1 in the wet season and K2 in the dry season) had a relatively high δ98/95Mo with a low concentration of Mo. Furthermore, both dissolved oxygen and pH show a good correlation (R2 = 0.63, Figure 4c) in the dry season, with an elevated Mo concentration and other trace element (Cu, Ni, Zn, and Fe) concentrations at low pH and low DO. However, the results from this study were in contrast to the findings from Revels et al. [19], where the authors proposed that low pH is associated with low Mo concentration and speculated that retention of lighter δ98/95Mo in soils to mineral surfaces and/or organic matter through sorption makes the dissolved load heavier in δ98/95Mo. At neutral pH conditions, Mo does not adsorb to the mineral surface [71]. Since Mo is very redox-sensitive and strongly influenced by response to changes in dissolved oxygen, it is suggested that Mo isotopes may be fractionated while undergoing reductive dissolution and changing the oxidation state from +6 to +4 at low dissolved oxygen [72,73]. A similar behavior was observed in the Coastal Plain rivers of Taiwan influenced by anthropogenic perturbations [9,74]. Owing to the anoxic condition of the Danshuei River, speciation and distribution patterns of trace metals with varying environmental conditions have also been reported previously [29,70].
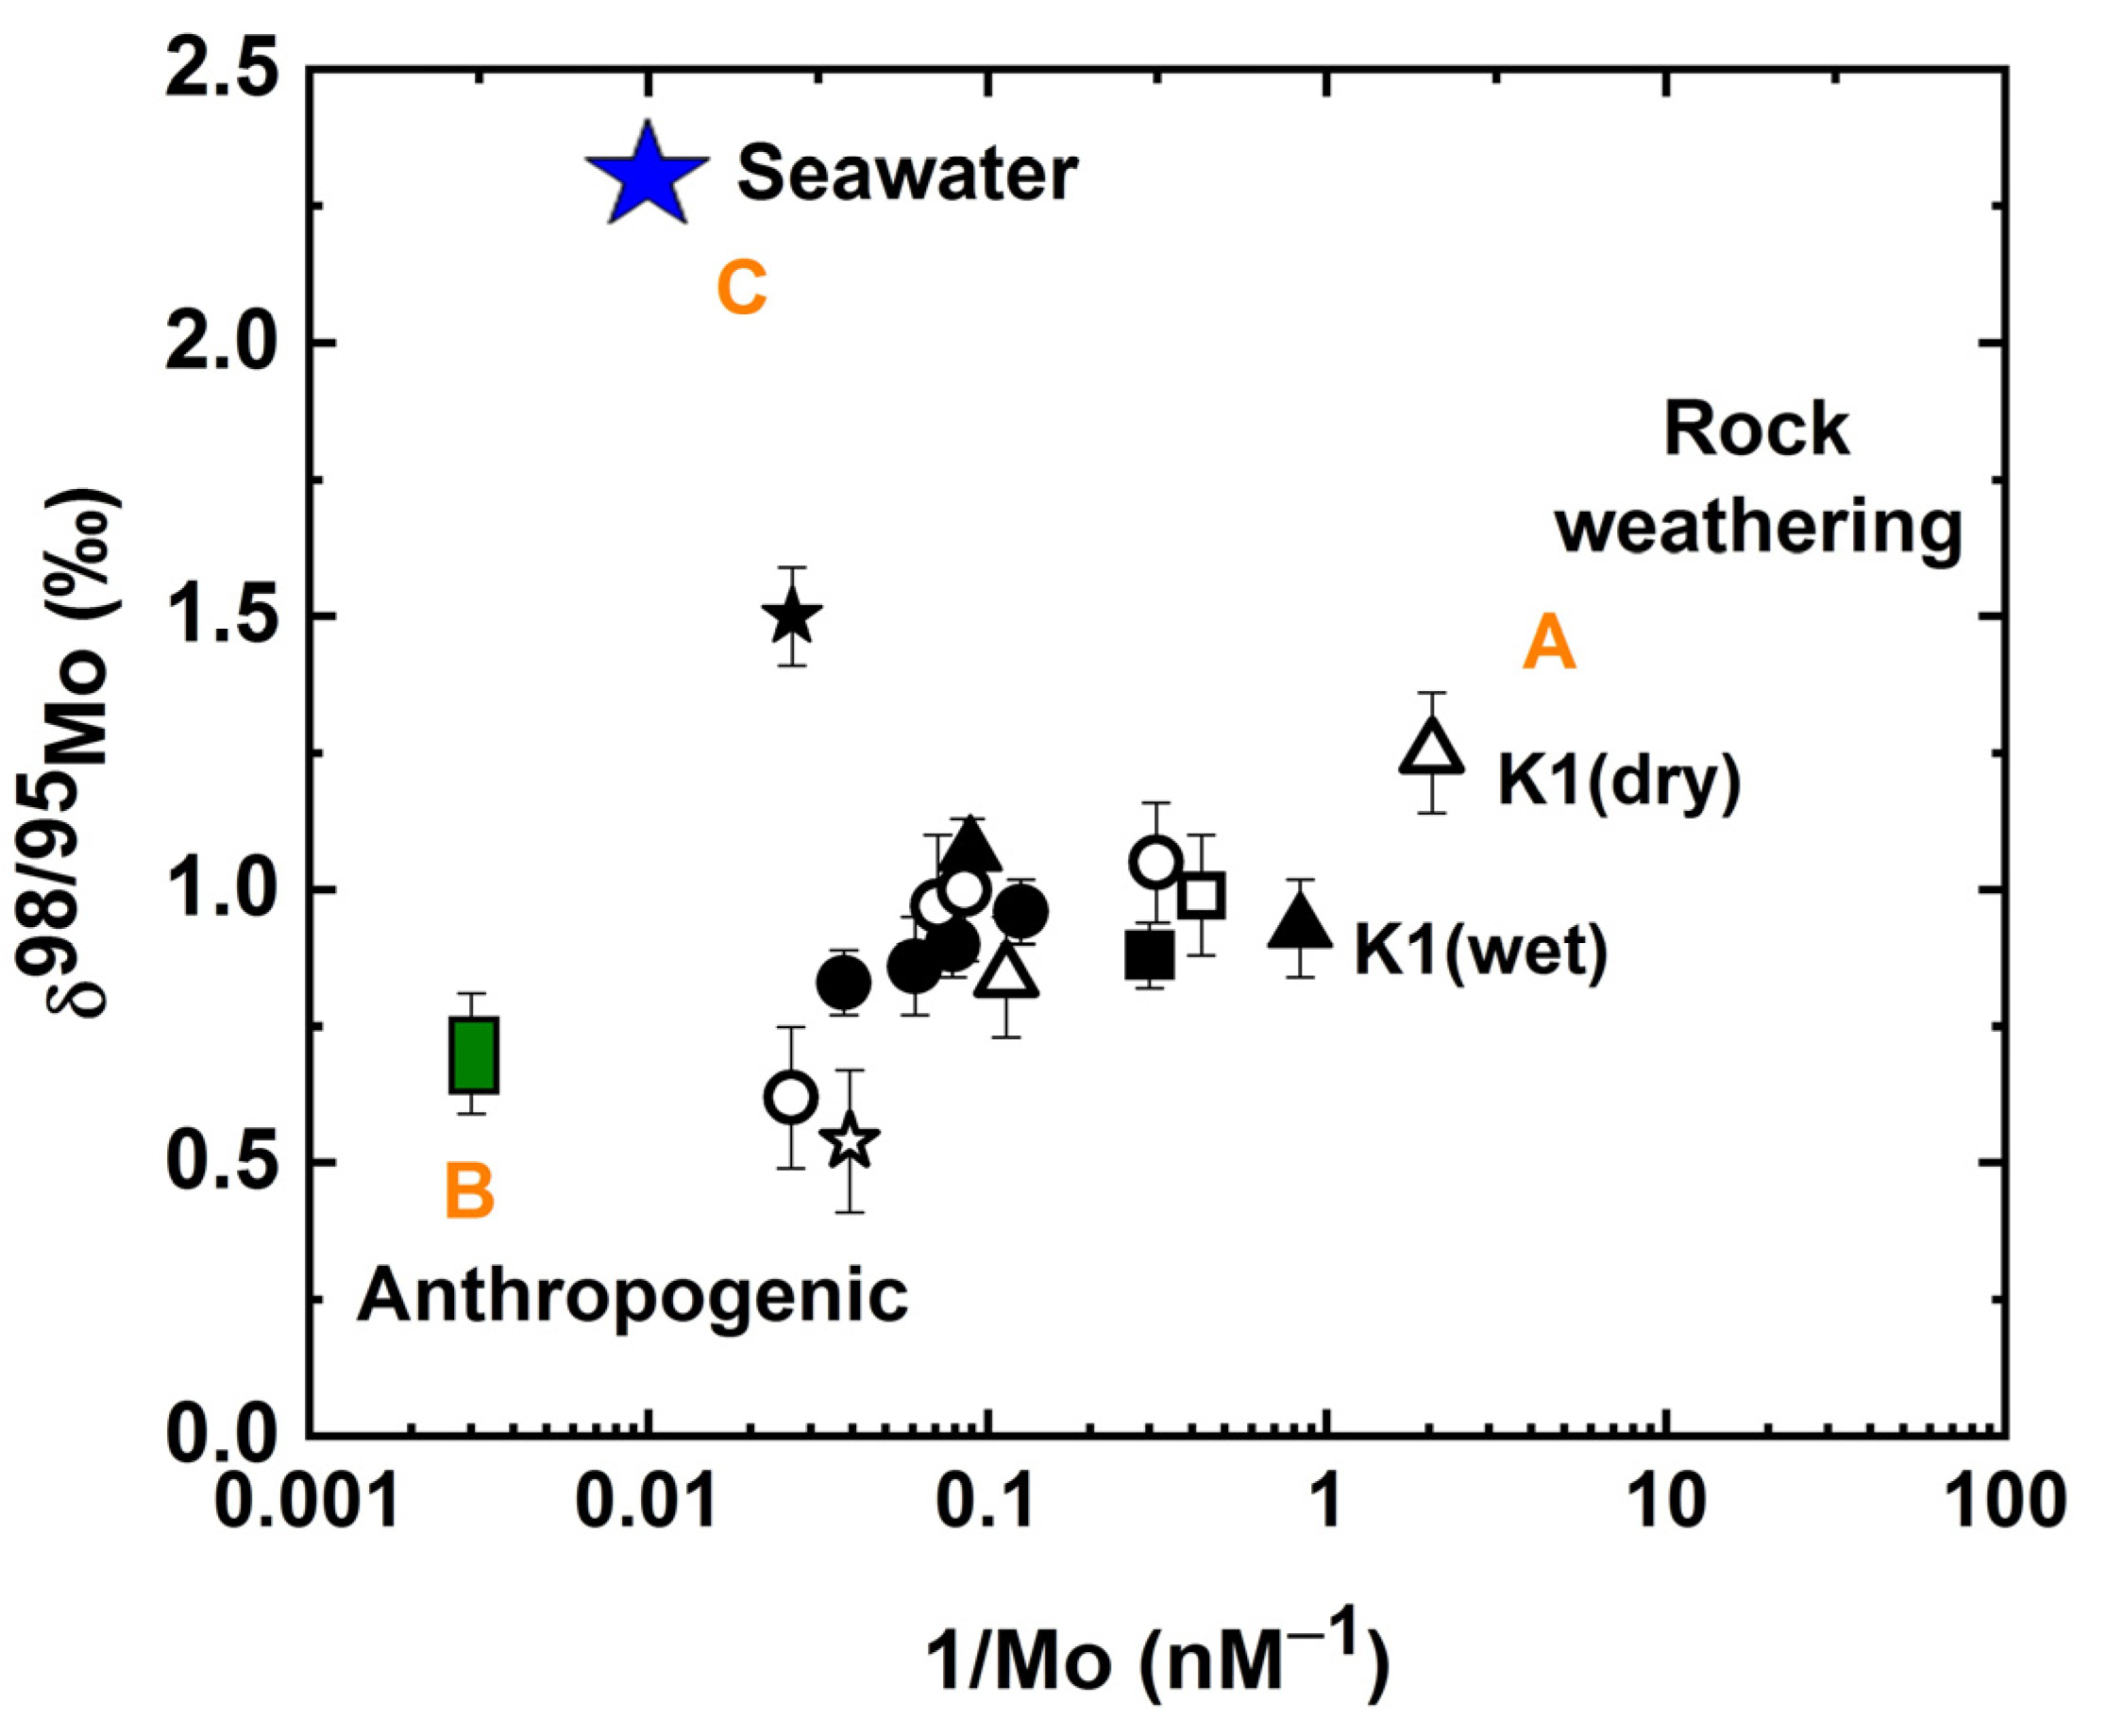
Potential sources that may influence the river water chemistry in the Danshuei catchment are plotted in Figure 6. The variation of δ98/95Mo in the highly polluted Danshuei River can be explained by the mixing of three end-member sources with distinct δ98/95Mo signatures. Three potential end-members are identified as (A) rock weathering: moderately high δ98/95Mo with very low Mo concentration; (B) anthropogenic input: light δ98/95Mo with highest Mo concentration; and (C) seawater intrusion: highest δ98/95Mo with high Mo concentration values (Figure 6). To characterize and quantify the source contribution from different end-members, a modeling approach using the MixSIAR model was applied [75,76,77]. For a single isotopic system, the following equation can be written with three end-member components:
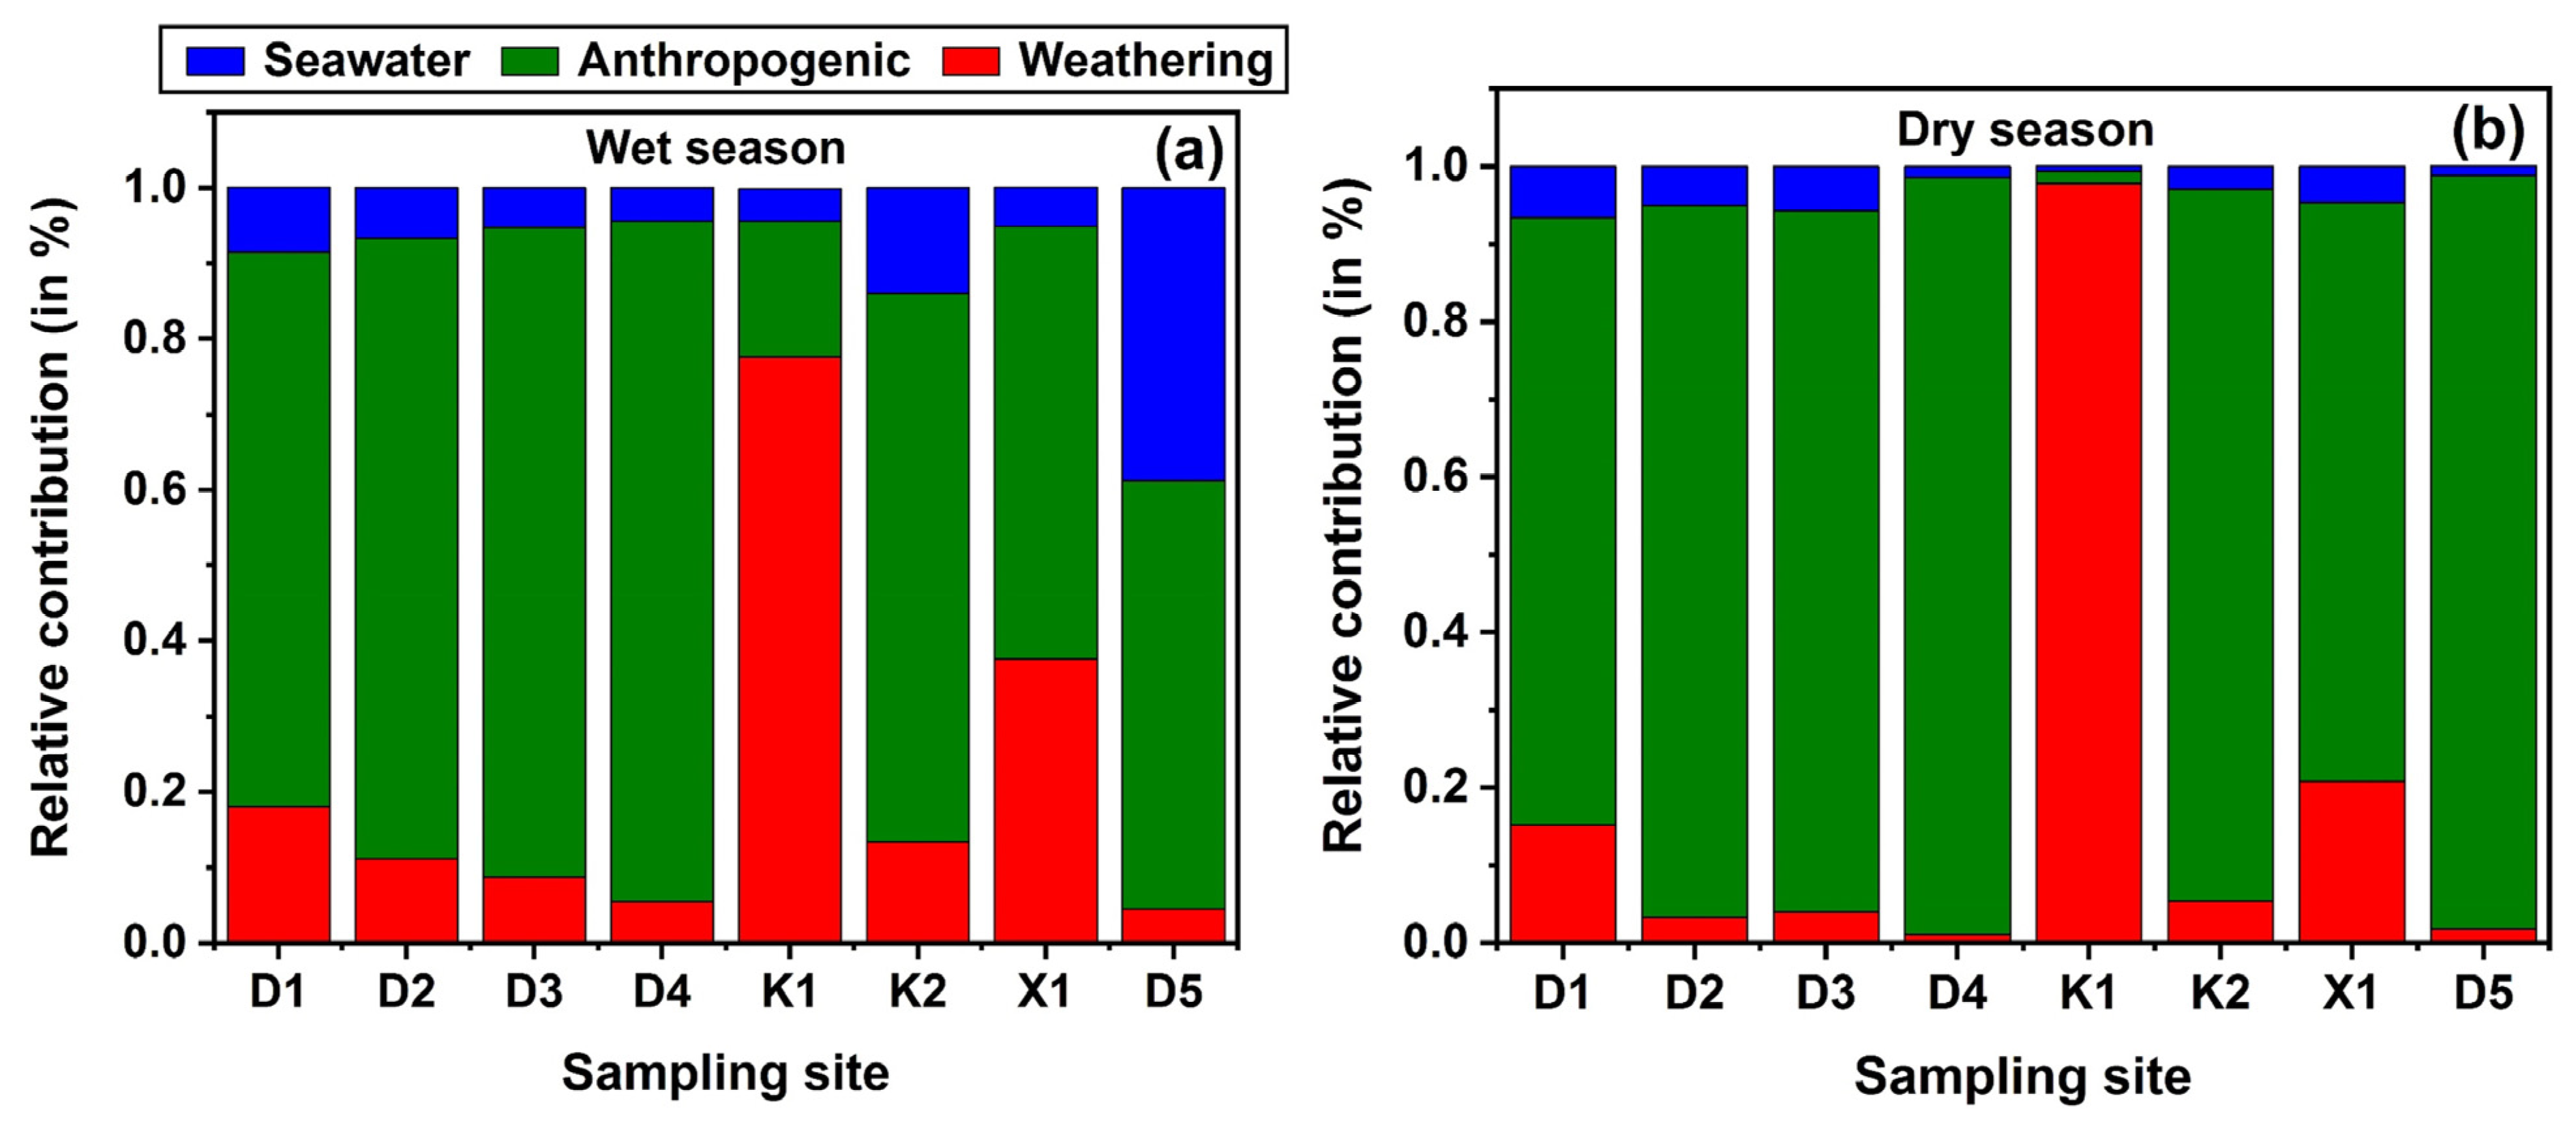
where f = fraction; X = Mo isotopic composition; M = measured signal resulting from the three different end-members A, B, and C, respectively. We did not have the specific δ98/95Mo to constrain the anthropogenic end-member from the nearby Danshuei catchment. However, δ98/95Mo signal in the primary/input and output industrial wastewater were analyzed from Guanyin Industrial Park in Taoyuan (Table S1) and Agongdian Industrial area in Kaohsiung (Table S2), and their mean δ98/95Mo value was taken as the anthropogenic end-member. These were the only available δ98/95Mo data for industrial sources at the moment. The details of the industrial wastewater sample are given in the Supplementary Materials. To constrain the rock weathering end-member, site KI was selected as it is located upstream and is relatively free from the heavily industrialized area [27]. The model input parameters constraining each end-member source are given in Table 5, while the model results are shown in Figure 7 (and Table 6) and indicate that the contribution from seawater Mo in the Danshuei Rivers was small (<7%) in the dry season when compared to the wet season. The upstream of the Dahan, Keelung, and Xindian tributaries show the highest weathering contribution in both seasons. The weathering contribution shows a gradual decline toward the lower reaches, whereas the anthropogenic contribution increases toward the middle and lower reaches in the Danshuei catchment. Lastly, the anthropogenic contribution was more pronounced in the dry season. The results demonstrate that the regular sampling of river catchment from headwaters to river mouth can reveal important details regarding the origin of solutes and perturbation within the catchment.
5. Conclusions
This study investigated the Mo behavior and its associated isotope fractionation mechanism in the Danshuei (polluted) and Liwu (non-polluted) Rivers in Taiwan. The results provide useful information to assess Mo behavior in two different river settings.
- (1)
- After excluding samples influenced by seawater intrusion, the spatial variation in the δ98/95Mo signal from the upper to lower reaches in the Danshuei River displays a decreasing trend. On the contrary, in the Liwu River, the dissolved δ98/95Mo displays a clear trend with a significant increase in the δ98/95Mo signal from upstream to downstream along the river profile.
- (2)
- The Mo isotope data in the Danshuei River can be best explained as: (a) anthropogenic input-induced reductive dissolution of soluble MoO42− oxyanion from +6 to +4 oxidation state at low dissolved oxygen, which may be accompanied by Mo isotope fractionation; (b) the mixing of three end-members, such as rock weathering, anthropogenic input, and seawater, that is characterized by different chemical and isotopic signature influences the Danshuei River water chemistry. The anthropogenic input and seawater are the primary contributors governing the middle and lower reaches, while the upper reaches are primarily governed by rock weathering.
- (3)
- In the Liwu River, a negative correlation was observed between δ98/95Mo versus 1/Mo, SO42/Na ratio, and (Sr/Na) × 1000 ratio from midstream to downstream along the river profile. This supports the hypothesis that Mo isotopic fractionation in the Liwu catchment is caused by simultaneous sulfuric-acid-induced oxidative weathering of pyrites and carbonates. Furthermore, the lighter δ98/95Mo is partitioned in riverine bedload sediments, acting as a sink for light Mo isotopes.
Overall, the results indicate that Mo isotopes are a potential tracer for establishing the anthropogenic contribution and natural Mo sources in the river system.
Supplementary Materials
The following supporting information can be downloaded at https://www.mdpi.com/article/10.3390/w15101873/s1: Figure S1: The spatial and seasonal distribution of Mo abundance in the (a) Danshuei and (b) Liwu Rivers. In the Danshuei River, the sampling sites (D4, D5, and K2) marked with blue circles are influenced by seawater intrusion during the wet season. The filled symbol represents the wet season samples, while the open symbol represents the dry season samples; Table S1: The δ98/95Mo isotopic composition and Mo abundance in wastewater from the Guanyin Industrial area, Taoyuan; Table S2: The δ98/95Mo isotopic composition and Mo abundance in wastewater from the Agongdian Industrial area, Kaohsiung; Table S3: Major ion concentration for the Danshuei River water in mg/L; Table S4: Major ion concentration in mg/L and Mo concentration in μg/L for Liwu River water; Table S5: Seasonal variation in Mo and trace element concentrations in μg/L from Danshuei River water.
Author Contributions
Conceptualization, D.-C.L. and K.-F.H.; methodology, Y.-H.L.; validation, S.V.E., Y.-H.L., K.-F.H. and D.-C.L.; formal analysis, S.V.E.; investigation, S.V.E. and Y.-H.L.; resources, D.-C.L. and K.-F.H.; data curation, S.V.E.; writing—original draft preparation, S.V.E.; writing—review and editing, D.-C.L., Y.-H.L. and K.-F.H.; visualization, S.V.E.; supervision, D.-C.L.; project administration, D.-C.L. and K.-F.H.; funding acquisition, D.-C.L. and K.-F.H. All authors have read and agreed to the published version of the manuscript.
Funding
This research was funded by the Ministry of Science and Technology of Taiwan, R.O.C. (MOST 109-2923-M-001-007, 110-2116-M-001-008, 111-2116-M-001-026, and 109-2116-M-001-019), Environmental Protection Administration of Taiwan, R.O.C. (EPA-108-03-01-01), and the Taiwan International Graduate Program (TIGP) scholarship from Academia Sinica and National Central University.
Data Availability Statement
All the data reported in this study are original and are listed in the tables of this manuscript and Supplementary Materials. The reference data were quoted from the references directly.
Acknowledgments
The authors would like to thank Yi-Yao Chang, Ming-Ru Wu, Jeng-Yuan Kang, Wen-Yu Hsu, and Hsin-Yi Peng for their support in the lab, fieldwork, and administrative work.
Conflicts of Interest
The authors declare no conflict of interest.
References
- Kendall, B.; Dahl, T.W.; Anbar, A.D. The Stable Isotope Geochemistry of Molybdenum. Rev. Mineral. Geochem. 2017, 82, 683–732. [Google Scholar] [CrossRef]
- Anbar, A.D.; Rouxel, O. Metal Stable Isotopes in Paleoceanography. Annu. Rev. Earth Planet. Sci. 2007, 35, 717–746. [Google Scholar] [CrossRef]
- Gaillardet, J.; Dupré, B.; Louvat, P.; Allegre, C. Global silicate weathering and CO2 consumption rates deduced from the chemistry of large rivers. Chem. Geol. 1999, 159, 3–30. [Google Scholar] [CrossRef]
- Dalai, T.K.; Nishimura, K.; Nozaki, Y. Geochemistry of molybdenum in the Chao Phraya River estuary, Thailand: Role of suboxic diagenesis and porewater transport. Chem. Geol. 2005, 218, 189–202. [Google Scholar] [CrossRef]
- Dadson, S.J.; Hovius, N.; Chen, H.; Dade, W.B.; Hsieh, M.L.; Willett, S.D.; Hu, J.C.; Horng, M.J.; Chen, M.C.; Stark, C.P.; et al. Links between erosion, runoff variability and seismicity in the Taiwan orogen. Nature 2003, 426, 648–651. [Google Scholar] [CrossRef]
- Dupré, B.; Dessert, C.; Oliva, P.; Goddéris, Y.; Viers, J.; François, L.; Millot, R.; Gaillardet, J. Rivers, chemical weathering and Earth’s climate. Comptes Rendus Geosci. 2003, 335, 1141–1160. [Google Scholar] [CrossRef]
- Akhtar, N.; Ishak, M.I.S.; Ahmad, M.I.; Umar, K.; Md Yusuff, M.S.; Anees, M.T.; Qadir, A.; Ali Almanasir, Y.K. Modification of the Water Quality Index (WQI) Process for Simple Calculation Using the Multi-Criteria Decision-Making (MCDM) Method: A Review. Water 2021, 13, 905. [Google Scholar] [CrossRef]
- Akhtar, N.; Syakir Ishak, M.I.; Bhawani, S.A.; Umar, K. Various Natural and Anthropogenic Factors Responsible for Water Quality Degradation: A Review. Water 2021, 13, 2660. [Google Scholar] [CrossRef]
- Ekka, S.V.; Liang, Y.-H.; Huang, K.-F.; Huang, J.-C.; Lee, D.-C. Riverine molybdenum isotopic fractionation in small mountainous rivers of Taiwan: The effect of chemical weathering and lithology. Chem. Geol. 2023, 620, 121349. [Google Scholar] [CrossRef]
- Zeng, J.; Han, G.; Zhu, J.-M. Seasonal and Spatial Variation of Mo Isotope Compositions in Headwater Stream of Xijiang River Draining the Carbonate Terrain, Southwest China. Water 2019, 11, 1076. [Google Scholar] [CrossRef]
- Wang, Z.; Ma, J.; Li, J.; Wei, G.; Chen, X.; Deng, W.; Xie, L.; Lu, W.; Zou, L. Chemical weathering controls on variations in the molybdenum isotopic composition of river water: Evidence from large rivers in China. Chem. Geol. 2015, 410, 201–212. [Google Scholar] [CrossRef]
- Horan, K.; Hilton, R.G.; McCoy-West, A.J.; Selby, D.; Tipper, E.T.; Hawley, S.; Burton, K.W. Unravelling the controls on the molybdenum isotope ratios of river waters. Geochem. Perspect. Lett. 2020, 13, 1–6. [Google Scholar] [CrossRef]
- Burkhardt, C.; Hin, R.C.; Kleine, T.; Bourdon, B. Evidence for Mo isotope fractionation in the solar nebula and during planetary differentiation. Earth Planet. Sci. Lett. 2014, 391, 201–211. [Google Scholar] [CrossRef]
- Yang, J.; Barling, J.; Siebert, C.; Fietzke, J.; Stephens, E.; Halliday, A.N. The molybdenum isotopic compositions of I-, S- and A-type granitic suites. Geochim. Cosmochim. Acta 2017, 205, 168–186. [Google Scholar] [CrossRef]
- Siebert, C.; Nägler, T.F.; von Blanckenburg, F.; Kramers, J.D. Molybdenum isotope records as a potential new proxy for paleoceanography. Earth Planet. Sci. Lett. 2003, 211, 159–171. [Google Scholar] [CrossRef]
- Archer, C.; Vance, D. The isotopic signature of the global riverine molybdenum flux and anoxia in the ancient oceans. Nat. Geosci. 2008, 1, 597–600. [Google Scholar] [CrossRef]
- Neubert, N.; Heri, A.R.; Voegelin, A.R.; Nägler, T.F.; Schlunegger, F.; Villa, I.M. The molybdenum isotopic composition in river water: Constraints from small catchments. Earth Planet. Sci. Lett. 2011, 304, 180–190. [Google Scholar] [CrossRef]
- Pearce, C.R.; Burton, K.W.; von Strandmann, P.A.E.P.; James, R.H.; Gíslason, S.R. Molybdenum isotope behaviour accompanying weathering and riverine transport in a basaltic terrain. Earth Planet. Sci. Lett. 2010, 295, 104–114. [Google Scholar] [CrossRef]
- Revels, B.N.; Rickli, J.; Moura, C.A.V.; Vance, D. The riverine flux of molybdenum and its isotopes to the ocean: Weathering processes and dissolved-particulate partitioning in the Amazon basin. Earth Planet. Sci. Lett. 2021, 559, 116773. [Google Scholar] [CrossRef]
- Siebert, C.; Pett-Ridge, J.; Opfergelt, S.; Guicharnaud, R.; Halliday, A.; Burton, K. Molybdenum isotope fractionation in soils: Influence of redox conditions, organic matter, and atmospheric inputs. Geochim. Cosmochim. Acta 2015, 162, 1–24. [Google Scholar] [CrossRef]
- Wang, Z.; Ma, J.; Li, J.; Wei, G.; Zeng, T.; Li, L.; Zhang, L.; Deng, W.; Xie, L.; Liu, Z. Fe (hydro) oxide controls Mo isotope fractionation during the weathering of granite. Geochim. Cosmochim. Acta 2018, 226, 1–17. [Google Scholar] [CrossRef]
- Marks, J.A.; Perakis, S.S.; King, E.K.; Pett-Ridge, J. Soil organic matter regulates molybdenum storage and mobility in forests. Biogeochemistry 2015, 125, 167–183. [Google Scholar] [CrossRef]
- Voegelin, A.R.; Nägler, T.F.; Pettke, T.; Neubert, N.; Steinmann, M.; Pourret, O.; Villa, I.M. The impact of igneous bedrock weathering on the Mo isotopic composition of stream waters: Natural samples and laboratory experiments. Geochim. Cosmochim. Acta 2012, 86, 150–165. [Google Scholar] [CrossRef]
- Harkness, J.S.; Darrah, T.H.; Moore, M.T.; Whyte, C.J.; Mathewson, P.D.; Cook, T.; Vengosh, A. Naturally Occurring versus Anthropogenic Sources of Elevated Molybdenum in Groundwater: Evidence for Geogenic Contamination from Southeast Wisconsin, United States. Environ. Sci. Technol. 2017, 51, 12190–12199. [Google Scholar] [CrossRef]
- Skierszkan, E.K.; Robertson, J.M.; Lindsay, M.B.J.; Stockwell, J.S.; Dockrey, J.W.; Das, S.; Weis, D.; Beckie, R.D.; Mayer, K.U. Tracing Molybdenum Attenuation in Mining Environments Using Molybdenum Stable Isotopes. Environ. Sci. Technol. 2019, 53, 5678–5686. [Google Scholar] [CrossRef]
- Skierszkan, E.K.; Stockwell, J.S.; Dockrey, J.W.; Weis, D.; Beckie, R.D.; Mayer, K.U. Molybdenum (Mo) stable isotopic variations as indicators of Mo attenuation in mine waste-rock drainage. Appl. Geochem. 2017, 87, 71–83. [Google Scholar] [CrossRef]
- Putri, M.; Lou, C.-H.; Syai’in, M.; Ou, S.-H.; Wang, Y.-C. Long-Term River Water Quality Trends and Pollution Source Apportionment in Taiwan. Water 2018, 10, 1394. [Google Scholar] [CrossRef]
- Jiann, K.-T.; Wen, L.-S. Intra-annual variability of distribution patterns and fluxes of dissolved trace metals in a subtropical estuary (Danshuei River, Taiwan). J. Mar. Syst. 2009, 75, 87–99. [Google Scholar] [CrossRef]
- Wen, L.-S.; Jiann, K.-T.; Liu, K.-K. Seasonal variation and flux of dissolved nutrients in the Danshuei Estuary, Taiwan: A hypoxic subtropical mountain river. Estuar. Coast. Shelf Sci. 2008, 78, 694–704. [Google Scholar] [CrossRef]
- Wang, Y.B.; Liu, C.W.; Liao, P.Y.; Lee, J.J. Spatial pattern assessment of river water quality: Implications of reducing the number of monitoring stations and chemical parameters. Env. Monit Assess 2014, 186, 1781–1792. [Google Scholar] [CrossRef]
- Chen, S.K.; Jang, C.S.; Chou, C.Y. Assessment of spatiotemporal variations in river water quality for sustainable environmental and recreational management in the highly urbanized Danshui River basin. Environ. Monit. Assess. 2019, 191, 100. [Google Scholar] [CrossRef] [PubMed]
- Calmels, D.; Galy, A.; Hovius, N.; Bickle, M.; West, A.J.; Chen, M.-C.; Chapman, H. Contribution of deep groundwater to the weathering budget in a rapidly eroding mountain belt, Taiwan. Earth Planet. Sci. Lett. 2011, 303, 48–58. [Google Scholar] [CrossRef]
- Lee, T.Y.; Shih, Y.T.; Huang, J.C.; Kao, S.J.; Shiah, F.K.; Liu, K.K. Speciation and dynamics of dissolved inorganic nitrogen export in the Danshui River, Taiwan. Biogeosciences 2014, 11, 5307–5321. [Google Scholar] [CrossRef]
- Liu, W.-C.; Hsu, M.-H.; Kuo, A.Y. Modelling of hydrodynamics and cohesive sediment transport in Tanshui River estuarine system, Taiwan. Mar. Pollut. Bull. 2002, 44, 1076–1088. [Google Scholar] [CrossRef] [PubMed]
- Chu, H.-Y.; You, C.-F. Dissolved constituents and Sr isotopes in river waters from a mountainous island – The Danshuei drainage system in northern Taiwan. Appl. Geochem. 2007, 22, 1701–1714. [Google Scholar] [CrossRef]
- Water Resource Agency Hydrological Yearbook, 2003. E-book, Water Resource Agency, Ministry of Economic Affair, Taiwan, ROC. Available online: https://eng.wra.gov.tw/ (accessed on 25 January 2022).
- Ho, C. An Introduction to the Geology of Taiwan; Ministry of Economic Affairs Taiwan, Central Geological Survey: Taipei City, Taiwan, 1988. [Google Scholar]
- Lan, C.Y.; Lee, T.; Mertzman, S.A.; Wu, T.W.; Jahn, B.M.; Yui, T.F.; Shen, J.J. Geochemical and isotopic study of gneiss-associated metabasites at the Central Range, Taiwan. Proc. Geol. Sot. China 1991, 34, 233–266. [Google Scholar]
- Chen, C.H.; Chung, S.H.; Huang, S.T. Carbonate minerals from the Central Range of Taiwan. Spec. Publ. Cent. Geol. Surv. MOEA 1993, 7, 51–77. [Google Scholar]
- Hartshorn, K.; Hovius, N.; Dade, W.B.; Slingerland, R.L. Climate-driven bedrock incision in an active mountain belt. Science 2002, 297, 2036–2038. [Google Scholar] [CrossRef]
- Deng, K.; Wittmann, H.; Yang, S.; von Blanckenburg, F. The Upper Limit of Denudation Rate Measurement From Cosmogenic 10Be(Meteoric)/9Be Ratios in Taiwan. J. Geophys. Res. Earth Surf. 2021, 126, e2021JF006221. [Google Scholar] [CrossRef]
- Anbar, A.D.; Knab, K.A.; Barling, J. Precise determination of mass-dependent variations in the isotopic composition of molybdenum using MC-ICPMS. Anal Chem 2001, 73, 1425–1431. [Google Scholar] [CrossRef]
- Siebert, C.; Nägler, T.F.; Kramers, J.D. Determination of molybdenum isotope fractionation by double-spike multicollector inductively coupled plasma mass spectrometry. Geochem. Geophys. Geosystems 2001, 2. [Google Scholar] [CrossRef]
- Liang, Y.-H.; Halliday, A.N.; Siebert, C.; Fitton, J.G.; Burton, K.W.; Wang, K.-L.; Harvey, J. Molybdenum isotope fractionation in the mantle. Geochim. Cosmochim. Acta 2017, 199, 91–111. [Google Scholar] [CrossRef]
- Goldberg, T.; Gordon, G.; Izon, G.; Archer, C.; Pearce, C.R.; McManus, J.; Anbar, A.D.; Rehkämper, M. Resolution of inter-laboratory discrepancies in Mo isotope data: An intercalibration. J. Anal. At. Spectrom. 2013, 28. [Google Scholar] [CrossRef]
- Nägler, T.F.; Anbar, A.D.; Archer, C.; Goldberg, T.; Gordon, G.W.; Greber, N.D.; Siebert, C.; Sohrin, Y.; Vance, D. Proposal for an international molybdenum isotope measurement standard and data representation. Geostand. Geoanalytical Res. 2014, 38, 149–151. [Google Scholar] [CrossRef]
- Greber, N.D.; Siebert, C.; Nägler, T.F.; Pettke, T. δ98/95Mo values and Molybdenum Concentration Data for NIST SRM 610, 612 and 3134: Towards a Common Protocol for Reporting Mo Data. Geostand. Geoanalytical Res. 2012, 36, 291–300. [Google Scholar] [CrossRef]
- Li, J.; Zhu, X.-k.; Tang, S.-h.; Zhang, K. High-Precision Measurement of Molybdenum Isotopic Compositions of Selected Geochemical Reference Materials. Geostand. Geoanalytical Res. 2016, 40, 405–415. [Google Scholar] [CrossRef]
- Gaschnig, R.M.; Reinhard, C.T.; Planavsky, N.J.; Wang, X.; Asael, D.; Jackson, M.G. The impact of primary processes and secondary alteration on the stable isotope composition of ocean island basalts. Chem. Geol. 2021, 581, 120416. [Google Scholar] [CrossRef]
- Greber, N.D.; Puchtel, I.S.; Nägler, T.F.; Mezger, K. Komatiites constrain molybdenum isotope composition of the Earth’s mantle. Earth Planet. Sci. Lett. 2015, 421, 129–138. [Google Scholar] [CrossRef]
- Miller, C.A.; Peucker-Ehrenbrink, B.; Walker, B.D.; Marcantonio, F. Re-assessing the surface cycling of molybdenum and rhenium. Geochim. Cosmochim. Acta 2011, 75, 7146–7179. [Google Scholar] [CrossRef]
- Li, Y.-H.; Chen, C.; Hung, J.-J. Aquatic chemistry of lakes and reservoirs in Taiwan. TAO 1997, 8, 405. [Google Scholar] [CrossRef]
- White, A.F.; Bullen, T.D.; Vivit, D.V.; Schulz, M.S.; Clow, D.W. The role of disseminated calcite in the chemical weathering of granitoid rocks. Geochim. Cosmochim. Acta 1999, 63, 1939–1953. [Google Scholar] [CrossRef]
- Beyssac, O.; Simoes, M.; Avouac, J.P.; Farley, K.A.; Chen, Y.-G.; Chan, Y.-C.; Goffé, B. Late Cenozoic metamorphic evolution and exhumation of Taiwan. Tectonics 2007, 26, n. [Google Scholar] [CrossRef]
- Su, N.; Yang, S.; Deng, K.; Chang, Y.-P.; Xu, J.; Wu, Z. Radiogenic and stable Sr isotopes constrain weathering processes in rapidly eroding Taiwan catchments. Earth Planet. Sci. Lett. 2021, 576. [Google Scholar] [CrossRef]
- Rahaman, W.; Goswami, V.; Singh, S.K.; Rai, V.K. Molybdenum isotopes in two Indian estuaries: Mixing characteristics and input to oceans. Geochim. Cosmochim. Acta 2014, 141, 407–422. [Google Scholar] [CrossRef]
- King, E.K.; Thompson, A.; Hodges, C.; Pett-Ridge, J.C. Towards Understanding Temporal and Spatial Patterns of Molybdenum in the Critical Zone. Procedia Earth Planet. Sci. 2014, 10, 56–62. [Google Scholar] [CrossRef]
- Yui, T.-F. Isotopic Composition of Carbonaceous Material in Metamorphic Rocks from the Mountain Belt of Taiwan. Int. Geol. Rev. 2005, 47, 310–325. [Google Scholar] [CrossRef]
- Jacobson, A.D.; Blum, J.D.; Chamberlain, C.P.; Craw, D.; Koons, P.O. Climatic and tectonic controls on chemical weathering in the New Zealand Southern Alps. Geochim. Cosmochim. Acta 2003, 67, 29–46. [Google Scholar] [CrossRef]
- Voegelin, A.R.; Nägler, T.F.; Samankassou, E.; Villa, I.M. Molybdenum isotopic composition of modern and Carboniferous carbonates. Chem. Geol. 2009, 265, 488–498. [Google Scholar] [CrossRef]
- Huang, X.; Sillanpää, M.; Gjessing, E.T.; Vogt, R.D. Water quality in the Tibetan Plateau: Major ions and trace elements in the headwaters of four major Asian rivers. Sci Total Env. 2009, 407, 6242–6254. [Google Scholar] [CrossRef]
- Yoshimura, K.; Nakao, S.; Noto, M.; Inokura, Y.; Urata, K.; Chen, M.; Lin, P.W. Geochemical and stable isotope studies on natural water in the Taroko Gorge karst area, Taiwan—Chemical weathering of carbonate rocks by deep source CO2 and sulfuric acid. Chem. Geol. 2001, 177, 415–430. [Google Scholar] [CrossRef]
- Vorlicek, T.P.; Kahn, M.D.; Kasuya, Y.; Helz, G.R. Capture of molybdenum in pyrite-forming sediments: Role of ligand-induced reduction by polysulfides 1 1Associate editor: M. Goldhaber. Geochim. Cosmochim. Acta 2004, 68, 547–556. [Google Scholar] [CrossRef]
- Torres, M.A.; West, A.J.; Li, G. Sulphide oxidation and carbonate dissolution as a source of CO2 over geological timescales. Nature 2014, 507, 346–349. [Google Scholar] [CrossRef] [PubMed]
- Meyer, K.J.; Carey, A.E.; You, C.-F. Typhoon impacts on chemical weathering source provenance of a High Standing Island watershed, Taiwan. Geochim. Cosmochim. Acta 2017, 215, 404–420. [Google Scholar] [CrossRef]
- Blattmann, T.M.; Wang, S.L.; Lupker, M.; Märki, L.; Haghipour, N.; Wacker, L.; Chung, L.H.; Bernasconi, S.M.; Plötze, M.; Eglinton, T.I. Sulphuric acid-mediated weathering on Taiwan buffers geological atmospheric carbon sinks. Sci. Rep. 2019, 9, 2945. [Google Scholar] [CrossRef]
- Das, A.; Chung, C.-H.; You, C.-F. Disproportionately high rates of sulfide oxidation from mountainous river basins of Taiwan orogeny: Sulfur isotope evidence. Geophys. Res. Lett. 2012, 39. [Google Scholar] [CrossRef]
- King, E.K.; Thompson, A.; Chadwick, O.A.; Pett-Ridge, J.C. Molybdenum sources and isotopic composition during early stages of pedogenesis along a basaltic climate transect. Chem. Geol. 2016, 445, 54–67. [Google Scholar] [CrossRef]
- Lin, H.J.; Shao, K.T.; Jan, R.Q.; Hsieh, H.L.; Chen, C.P.; Hsieh, L.Y.; Hsiao, Y.T. A trophic model for the Danshuei River Estuary, a hypoxic estuary in northern Taiwan. Mar Pollut Bull 2007, 54, 1789–1800. [Google Scholar] [CrossRef] [PubMed]
- Jiann, K.-T.; Wen, L.-S.; Santschi, P.H. Trace metal (Cd, Cu, Ni and Pb) partitioning, affinities and removal in the Danshuei River estuary, a macro-tidal, temporally anoxic estuary in Taiwan. Mar. Chem. 2005, 96, 293–313. [Google Scholar] [CrossRef]
- Conlan, M.J.; Mayer, K.U.; Blaskovich, R.; Beckie, R.D. Solubility controls for molybdenum in neutral rock drainage. Geochem. Explor. Environ. Anal. 2012, 12, 21–32. [Google Scholar] [CrossRef]
- Goldberg, T.; Archer, C.; Vance, D.; Poulton, S.W. Mo isotope fractionation during adsorption to Fe (oxyhydr)oxides. Geochim. Cosmochim. Acta 2009, 73, 6502–6516. [Google Scholar] [CrossRef]
- Malinovsky, D.; Baxter, D.C.; Rodushkin, I. Ion-Specific Isotopic Fractionation of Molybdenum during Diffusion in Aqueous Solutions. Environ. Sci. Technol. 2007, 41, 1596–1600. [Google Scholar] [CrossRef] [PubMed]
- Huang, J.C.; Lee, T.Y.; Kao, S.J.; Hsu, S.C.; Lin, H.J.; Peng, T.R. Land use effect and hydrological control on nitrate yield in subtropical mountainous watersheds. Hydrol. Earth Syst. Sci. 2012, 16, 699–714. [Google Scholar] [CrossRef]
- Stock, B.C.; Jackson, A.L.; Ward, E.J.; Parnell, A.C.; Phillips, D.L.; Semmens, B.X. Analyzing mixing systems using a new generation of Bayesian tracer mixing models. PeerJ 2018, 6, e5096. [Google Scholar] [CrossRef] [PubMed]
- Shao, Y.; Klose, M.; Wyrwoll, K.-H. Recent global dust trend and connections to climate forcing. J. Geophys. Res. Atmos. 2013, 118, 11107–111118. [Google Scholar] [CrossRef]
- Longman, J.; Struve, T.; Pahnke, K. Spatial and Temporal Trends in Mineral Dust Provenance in the South Pacific—Evidence From Mixing Models. Paleoceanogr. Paleoclimatol. 2022, 37, e2021PA004356. [Google Scholar] [CrossRef]
Figure 1.
Schematic map showing the lithology and sampling locations of the (a) Danshuei River; (b) Liwu River.
Figure 1.
Schematic map showing the lithology and sampling locations of the (a) Danshuei River; (b) Liwu River.

Figure 2.
The Ca/Na versus Mg/Na ratio in the dissolved load collected from the Danshuei and Liwu Rivers. The end-member composition of silicates, carbonates, and seawater is taken from Gaillardet et al. [3]. The open symbol represents samples from the dry season and the filled symbol represents wet season samples. The gray symbol represents Danshuei River data, which were taken from the previous study by Chu et al. [35] for comparison.

Figure 3.
The seasonal and spatial variations in δ98/95Mo composition in (a) the Danshuei River. The samples from the wet season (D4, D5, and K2) influenced by seawater intrusion are circled in blue; (b) the Liwu River. The orange arrows denote Liwu River tributaries and the gray band represents the riverine bedload sample from the Liwu River catchment with an average value of δ98/95Mo = 0.16 ± 0.21‰ (1 SD), which is indicative of the total variation observed within the bedload samples. The two marble rock samples are represented by red squares and the average Mo isotopic composition in the low-grade metamorphic and volcanic rock around Taiwan is marked by a pink box. The δ98/95Mo composition for these bedrocks is taken from Ekka et al. [9]. (c) The δ98/95Mo composition in the Danshuei River plotted against 1/Mo concentration. (d) The plot of δ98/95Mo composition versus 1/Mo concentration in the Liwu River displays a systematic progression of a heavier δ98/95Mo isotope from midstream to downstream of the river catchment. The filled symbol represents the wet season and the open symbol represents the dry season samples.

Figure 4.
The δ98/95Mo composition versus SO42−/Na concentration displays a linear trend from middle to lower reaches in (a) the Liwu River. The open square symbols represent the dry season, while the filled square symbols represent the wet season samples. (b) The δ98/95Mo composition versus (Sr/Na) ×1000 ratio in the Liwu River. (c) The relationship between SO42− and (Ca + Mg) concentration in the Liwu River. (d) The δ98/95Mo variability in dissolved load and their corresponding riverine bedload samples. The dissolved load is marked by blue square symbols and the bedload samples are marked by gray diamond symbols for the Liwu catchment. The open symbols represent the dry season, while the filled symbols represent the wet season. The dotted lines represent the difference in δ98/95Mo value between the dissolved load (diss) and their corresponding bedload samples (BL). Since no bedload sample was collected at site L19 (Shakadang main river), site 21 was chosen, which is also a part of the Shakadang River at another location.

Figure 5.
The variation of δ98/95Mo composition versus dissolved oxygen (DO) (a) in the Danshuei River. (b) The δ98/95Mo composition versus pH; (c) the correlation between dissolved oxygen and pH in the Danshuei River catchment. The term “[Mo]” indicates Mo concentration. Sites D5, D4, and K2 from the wet season, influenced by seawater intrusion, are not shown in the above plots. The open symbols represent the dry season, while the filled symbols represent the wet season.

Figure 6.
The plot of the δ98/95Mo ratio versus 1/Mo concentration and three potential end-member sources in the Danshuei River. To constrain the rock weathering end-member (A), site K1 was selected for the wet and dry seasons. To constrain the anthropogenic end-member (B) an average δ98/95Mo value in the industrial wastewater from Guanyin and Agongdian Industrial Park was taken, which is marked by a green rectangle symbol, and the seawater end-member (C) is marked by a blue star symbol. The open symbol represents the dry season and the filled symbol represents the wet season river water samples from the Danshuei River.

Figure 7.
The estimated relative contribution of potential end-member sources influencing the Danshuei River water chemistry during the (a) wet season, and (b) dry season.
Figure 7.
The estimated relative contribution of potential end-member sources influencing the Danshuei River water chemistry during the (a) wet season, and (b) dry season.


Table 1.
Hydrological parameters and major ion data for Danshuei River water.
| River | Site | Sample | Dist. | T | Sal. | pH | TDS | EC | ORP | DO | Na+ | Mg2+ | K+ | Ca2+ | Sr2+ | Si | Cl | NO3− | SO42− |
|---|---|---|---|---|---|---|---|---|---|---|---|---|---|---|---|---|---|---|---|
| (km) | °C | (‰) | mg/L | µs/cm | mV | ppm | mM | mM | mM | mM | μM | mM | mM | mM | mM | ||||
| Wet season | |||||||||||||||||||
| Dahan | Yixing | D1 | 76.5 | 26.0 | 0.15 | 8.27 | 158 | 315 | 107 | 7.87 | 0.30 | 0.46 | 0.03 | 0.90 | 2.97 | 0.15 | 0.02 | 0.01 | 0.52 |
| Dahan | Sanying | D2 | 38.8 | 28.6 | 0.18 | 8.33 | 191 | 383 | 76.9 | 7.01 | 0.74 | 0.42 | 0.09 | 0.98 | 2.63 | 0.21 | 0.51 | 0.01 | 0.42 |
| Dahan | Ganyuang | D3 | 33.9 | 28.1 | 0.28 | 8.3 | 294 | 585 | 93.9 | 9.01 | 2.04 | 0.46 | 0.15 | 1.23 | 3.08 | 0.17 | 1.15 | 0.15 | 0.70 |
| Dahan | Dahan | D4 | 21.95 | 30.4 | 1.10 | 7.5 | 1089 | 2177 | 149 | 5.74 | 13.65 | 1.63 | 0.41 | 0.95 | 4.00 | 0.19 | 13.07 | n.d | 1.47 |
| Keelung | Ruifang | K1 | 63.45 | 28.3 | 0.08 | 7.98 | 86 | 172 | 145 | 8.15 | 0.65 | 0.18 | 0.04 | 0.33 | 0.91 | 0.13 | 0.28 | 0.03 | 0.23 |
| Keelung | Dazhi | K2 | 20.0 | 29.9 | 0.79 | 6.81 | 796 | 1593 | 133 | 2.86 | 10.48 | 1.29 | 0.31 | 0.48 | 2.51 | 0.12 | 11.10 | 0.07 | 0.77 |
| Xindian | Xiulang | X1 | 30.63 | 28.6 | 0.07 | 7.01 | 77 | 155 | 142 | 7.21 | 0.43 | 0.17 | 0.04 | 0.35 | 1.03 | 0.17 | 0.19 | 0.02 | 0.17 |
| Danshuei | Zhongzing | D5 | 18.33 | 30.1 | 5.71 | 7.31 | 5105 | 10210 | 173 | 6.25 | 86.57 | 9.96 | 2.03 | 2.13 | 16.32 | 0.09 | 94.70 | n.d | 5.58 |
| Dry season | |||||||||||||||||||
| Dahan | Yixing | D1 | 76.5 | 16.0 | 0.14 | 8.24 | 144 | 288 | 216 | 8.58 | 0.29 | 0.42 | 0.02 | 0.80 | 2.85 | 0.14 | 0.02 | 0.01 | 0.52 |
| Dahan | Sanying | D2 | 38.8 | 19.4 | 0.14 | 7.69 | 150 | 300 | 198 | 6.59 | 0.52 | 0.33 | 0.08 | 0.83 | 2.17 | 0.16 | 0.37 | 0.01 | 0.42 |
| Dahan | Ganyuang | D3 | 33.9 | 20.4 | 0.26 | 7.45 | 267 | 534 | 185 | 2.26 | 1.74 | 0.42 | 0.15 | 1.05 | 2.85 | 0.16 | 1.01 | 0.15 | 0.70 |
| Dahan | Dahan | D4 | 21.95 | 19.8 | 0.29 | 7.12 | 295 | 590 | 89.6 | 1.34 | 3.13 | 0.46 | 0.16 | 0.90 | 2.28 | 0.21 | 1.77 | n.d | 1.47 |
| Keelung | Ruifang | K1 | 63.45 | 15.9 | 0.09 | 8.56 | 93 | 186 | 139 | 10.4 | 0.57 | 0.17 | 0.03 | 0.30 | 0.80 | 0.11 | 0.28 | 0.03 | 0.23 |
| Keelung | Dazhi | K2 | 20.0 | 18.9 | 0.15 | 7.13 | 154 | 307 | 188 | 5.52 | 0.96 | 0.23 | 0.09 | 0.43 | 1.03 | 0.10 | 0.62 | 0.07 | 0.77 |
| Xindian | Xiulang | X1 | 30.63 | 19.7 | 0.06 | 7.33 | 65 | 130 | 182 | 7.74 | 0.40 | 0.16 | 0.03 | 0.33 | 0.91 | 0.17 | 0.19 | 0.02 | 0.17 |
| Danshuei | Zhongzing | D5 | 18.33 | 19.2 | 0.23 | 7.09 | 239 | 478 | 176 | 2.60 | 2.22 | 0.37 | 0.12 | 0.60 | 1.60 | 0.14 | 1.63 | n.d | 5.58 |
Notes: Dist.: distance from the river mouth; T: temperature; Sal.: salinity; TDS: total dissolved solids; EC: electrical conductivity; ORP: oxidation-reduction potential; DO: dissolved oxygen; n.d: not defined. For reference the major ion concentration data is also given in mg/L in the Supplementary Materials (Table S3).
Table 2.
Hydrological parameters and major ion data for Liwu River water.
| Site | Sample | T | pH | TDS | ORP | DO | Na+ | Mg2+ | K+ | Ca2+ | Sr2+ | Si | Cl | NO3 | SO42− |
|---|---|---|---|---|---|---|---|---|---|---|---|---|---|---|---|
| °C | mg/L | mV | ppm | mM | mM | mM | mM | μM | mM | mM | mM | mM | |||
| Wet season | |||||||||||||||
| Jinwen Bridge | L1 | 23.88 | 8.32 | 183 | 182.1 | 4.10 | 0.11 | 0.41 | 0.06 | 1.30 | 5.43 | 0.04 | 0.03 | 0.02 | 0.73 |
| Pudu Bridge | L2 | 20.77 | 8.20 | 181 | 144.5 | 10.83 | 0.12 | 0.45 | 0.08 | 1.71 | 8.90 | 0.05 | 0.01 | 0.01 | 1.24 |
| Dasha River | L3 | 21.67 | 8.51 | 226 | 64.2 | 7.40 | 0.12 | 0.41 | 0.09 | 1.85 | 9.41 | 0.05 | 0.01 | 0.01 | 1.32 |
| Swallow Grotto Bridge | L4 | 21.87 | 8.06 | 192 | 94.2 | 7.75 | 0.11 | 0.48 | 0.06 | 1.47 | 7.10 | 0.04 | 0.01 | 0.02 | 0.91 |
| Waheir River | L5 | 20.89 | 8.42 | 181 | 58.1 | 6.43 | 0.09 | 0.44 | 0.04 | 1.44 | 6.59 | 0.04 | 0.01 | 0.02 | 0.77 |
| Luoshao Bridge | L8 | 18.89 | 8.38 | 149 | 117 | 9.17 | 0.09 | 0.46 | 0.04 | 1.39 | 5.13 | 0.05 | 0.02 | 0.07 | 0.60 |
| Cuigu Bridge | L13 | 14.30 | 8.32 | 139 | 94 | 7.08 | 0.04 | 0.10 | 0.07 | 1.65 | 2.54 | 0.04 | 0.01 | 0.03 | 0.50 |
| Yuewang Pavillion Bridge | L18 | 21.76 | 8.28 | 189 | 83.5 | 7.70 | 0.11 | 0.46 | 0.06 | 1.54 | 6.81 | 0.04 | 0.01 | 0.01 | 0.90 |
| Shakadang (main) | L19 | 26.46 | 8.18 | 124 | 166 | 4.21 | 0.06 | 0.19 | 0.07 | 0.98 | 1.84 | 0.03 | 0.06 | 0.03 | 0.26 |
| Ning-An Bridge | L23 | 23.41 | 8.10 | 187 | 183.1 | 4.32 | 0.12 | 0.45 | 0.06 | 1.39 | 6.06 | 0.04 | 0.03 | 0.02 | 0.79 |
| Dry season | |||||||||||||||
| Jinwen Bridge | L1 | 18.63 | 7.85 | 173 | 71.7 | 6.05 | 0.15 | 0.49 | 0.07 | 1.53 | 6.11 | 0.04 | 0.05 | 0.02 | 0.83 |
| Pudu Bridge | L2 | 8.30 | 8.30 | 221 | 41.4 | 10.83 | 0.21 | 0.58 | 0.09 | 1.99 | 10.69 | 0.05 | 0.02 | 0.01 | 1.59 |
| Shakadang (main) | L19 | 18.81 | 8.27 | 133 | 142.4 | 8.06 | 0.08 | 0.23 | 0.09 | 1.07 | 1.96 | 0.03 | 0.06 | 0.02 | 0.31 |
Notes: T: temperature; TDS: total dissolved solids; ORP: oxidation-reduction potential; DO: dissolved oxygen. For reference the major ion concentration data is also given in mg/L in the Supplementary Materials (Table S4).
Table 3.
The seasonal variation in δ98/95Mo isotopic composition, Mo abundance, and trace element concentration in the Danshuei River.
Table 3.
The seasonal variation in δ98/95Mo isotopic composition, Mo abundance, and trace element concentration in the Danshuei River.
| River | Site | Sample | δ98/95Mo | 2 SD | Mo | Fe | Zn | Cu | Ni |
|---|---|---|---|---|---|---|---|---|---|
| (‰) | nM | nM | nM | nM | nM | ||||
| Wet season | |||||||||
| Dahan | Yixing | D1 | 0.96 | 0.06 | 8.00 | 39.94 | 13.92 | 2.52 | 1.53 |
| Dahan | Sanying | D2 | 0.90 | 0.06 | 12.71 | 106.91 | 0.15 | 16.05 | 7.84 |
| Dahan | Ganyuang | D3 | 0.86 | 0.09 | 16.40 | 587.93 | 30.90 | 30.53 | 183.17 |
| Dahan | Dahan | D4 | 0.83 | 0.06 | 26.55 | 603.51 | 199.76 | 91.44 | 455.27 |
| Keelung | Ruifang | K1 | 0.93 | 0.09 | 1.20 | 398.82 | 6.58 | 8.18 | 4.09 |
| Keelung | Dazhi | K2 | 1.07 | 0.06 | 11.27 | 176.40 | 15.30 | 4.41 | 25.22 |
| Xindian | Xiulang | X1 | 0.88 | 0.06 | 3.34 | 378.58 | 6.58 | 8.18 | 4.09 |
| Danshuei | Zhongzing | D5 | 1.50 | 0.09 | 37.77 | 448.60 | 583.05 | 12.91 | 169.39 |
| Dry season | |||||||||
| Dahan | Yixing | D1 | 1.05 | 0.11 | 3.19 | 22.56 | 11.17 | 1.89 | 2.22 |
| Dahan | Sanying | D2 | 0.97 | 0.13 | 14.05 | 396.67 | 218.72 | 22.51 | 20.96 |
| Dahan | Ganyuang | D3 | 1.00 | 0.13 | 11.72 | 464.18 | 79.99 | 44.07 | 231.21 |
| Dahan | Dahan | D4 | 0.62 | 0.13 | 38.04 | 676.40 | 5676.20 | 120.87 | 785.99 |
| Keelung | Ruifang | K1 | 1.25 | 0.11 | 0.49 | 402.58 | 9.94 | 5.35 | 4.43 |
| Keelung | Dazhi | K2 | 0.84 | 0.11 | 8.83 | 966.51 | 23.40 | 11.80 | 31.52 |
| Xindian | Xiulang | X1 | 0.99 | 0.11 | 2.35 | 367.66 | 9.94 | 5.35 | 4.43 |
| Danshuei | Zhongzing | D5 | 0.54 | 0.13 | 25.53 | 573.96 | 463.29 | 28.01 | 158.97 |
Notes: SD: standard deviation; Mo: molybdenum concentration; δ98/95Mo: isotopic composition of molybdenum. For reference the Mo concentration and trace element concentration data are also given in μg/L in the Supplementary Materials (Table S5).
Table 4.
The δ98/95Mo isotopic composition and Mo concentration in river water and riverine bedload sediment from the Liwu River.
Table 4.
The δ98/95Mo isotopic composition and Mo concentration in river water and riverine bedload sediment from the Liwu River.
| River Water | Riverine Bedload Sediment | ||||||||
|---|---|---|---|---|---|---|---|---|---|
| Site Name | Sample | δ98/95Mo | 2 SD | Mo | Site Name | Sample | δ98/95Mo | 2 SD | Mo |
| (‰) | nM | (‰) | ppm | ||||||
| Wet season | Wet season | ||||||||
| Jinwen Bridge | L1 | 1.15 | 0.07 | 53.80 | Jinwen Bridge | L1 | 0.03 | 0.08 | 0.70 |
| Pudu Bridge | L2 | 0.81 | 0.07 | 34.76 | Pudu Bridge | L2 | −0.06 | 0.08 | 1.05 |
| Dasha River | L3 | 0.70 | 0.08 | 31.73 | Shakadang (branch) | L21 | 0.43 | 0.07 | 0.29 |
| Swallow Grotto Bridge | L4 | 1.05 | 0.07 | 49.77 | |||||
| Waheir River | L5 | 0.78 | 0.05 | 22.72 | |||||
| Luoshao Bridge | L8 | 0.54 | 0.08 | 39.74 | |||||
| Cuigu Bridge | L13 | 0.74 | 0.11 | 57.17 | |||||
| Yuewang Pavillion Bridge | L18 | 0.86 | 0.05 | 31.48 | |||||
| Shakadang (main) | L19 | 1.18 | 0.08 | 24.17 | |||||
| Ning-An Bridge | L23 | 1.14 | 0.11 | 55.16 | |||||
| Dry season | Dry season | ||||||||
| Jinwen Bridge | L1 | 1.25 | 0.04 | 65.17 | Pudu Bridge | L2 | 0.05 | 0.06 | 0.78 |
| Pudu Bridge | L2 | 0.99 | 0.08 | 40.13 | Shakadang (branch) | L21 | 0.33 | 0.06 | 0.35 |
| Shakadang (main) | L19 | 1.30 | 0.08 | 29.94 | |||||
Notes: SD: standard deviation. For reference the Mo concentration data from Liwu River water are also given in μg/L in the Supplementary Materials (Table S4).
Table 5.
The input parameters for different end-member components used in the MixSIAR model.
| Wet Season | ||||
|---|---|---|---|---|
| End-Member | δ98/95Mo | 1 SD | 1/Mo | 1 SD |
| (‰) | (nM−1) | |||
| A (Rock weathering) | 0.93 | 0.21 | 0.83 | 0.08 |
| B (Anthropogenic) | 0.7 | 0.11 | 0.003 | 0.0003 |
| C (Seawater) | 2.3 | 0.05 | 0.01 | 0.0005 |
| Dry Season | ||||
| End-Member | δ98/95Mo (‰) | 1 SD | 1/Mo (nM−1) | 1 SD |
| A (Rock weathering) | 1.25 | 0.21 | 2.04 | 0.2 |
| B (Anthropogenic) | 0.7 | 0.11 | 0.0025 | 0.0003 |
| C (Seawater) | 2.3 | 0.05 | 0.01 | 0.0005 |
Note: SD: Standard deviation.
Table 6.
The relative source contribution of different end-members in the Danshuei River using the MixSIAR model.
Table 6.
The relative source contribution of different end-members in the Danshuei River using the MixSIAR model.
| % Contribution from Three End-Member Sources | ||||||||
|---|---|---|---|---|---|---|---|---|
| River | Site | Sample | EM-A (Weathering) | SD | EM-B (Anthropogenic) | SD | EM-C (Seawater) | SD |
| Wet season | ||||||||
| Dahan | Yixing | D1 | 18% | 11% | 73% | 11% | 9% | 5% |
| Dahan | Sanying | D2 | 11% | 7% | 82% | 8% | 7% | 5% |
| Dahan | Ganyuang | D3 | 9% | 6% | 86% | 7% | 5% | 4% |
| Dahan | Dahan | D4 | 6% | 5% | 90% | 6% | 4% | 4% |
| Keelung | Ruifang | K1 | 78% | 13% | 18% | 12% | 4% | 4% |
| Keelung | Dazhi | K2 | 13% | 9% | 73% | 10% | 14% | 6% |
| Xindian | Xiulang | X1 | 38% | 13% | 57% | 14% | 5% | 5% |
| Danshuei | Zhongzing | D5 | 5% | 6% | 57% | 10% | 39% | 9% |
| Dry season | ||||||||
| Dahan | Yixing | D1 | 15% | 1% | 78% | 7% | 7% | 7% |
| Dahan | Sanying | D2 | 3% | 0% | 92% | 6% | 5% | 6% |
| Dahan | Ganyuang | D3 | 4% | 0% | 90% | 7% | 6% | 7% |
| Dahan | Dahan | D4 | 1% | 0% | 98% | 2% | 1% | 2% |
| Keelung | Ruifang | K1 | 98% | 2% | 2% | 2% | 1% | 1% |
| Keelung | Dazhi | K2 | 5% | 0% | 92% | 4% | 3% | 4% |
| Xindian | Xiulang | X1 | 21% | 1% | 75% | 6% | 5% | 6% |
| Danshuei | Zhongzing | D5 | 2% | 0% | 97% | 2% | 1% | 2% |
Note: SD: Standard deviation; EM: End-member.
Disclaimer/Publisher’s Note: The statements, opinions and data contained in all publications are solely those of the individual author(s) and contributor(s) and not of MDPI and/or the editor(s). MDPI and/or the editor(s) disclaim responsibility for any injury to people or property resulting from any ideas, methods, instructions or products referred to in the content. |
© 2023 by the authors. Licensee MDPI, Basel, Switzerland. This article is an open access article distributed under the terms and conditions of the Creative Commons Attribution (CC BY) license (https://creativecommons.org/licenses/by/4.0/).
Share and Cite
MDPI and ACS Style
Ekka, S.V.; Liang, Y.-H.; Huang, K.-F.; Lee, D.-C. Molybdenum Isotopic Fingerprints in Taiwan Rivers: Natural versus Anthropogenic Sources. Water 2023, 15, 1873. https://doi.org/10.3390/w15101873
AMA Style
Ekka SV, Liang Y-H, Huang K-F, Lee D-C. Molybdenum Isotopic Fingerprints in Taiwan Rivers: Natural versus Anthropogenic Sources. Water. 2023; 15(10):1873. https://doi.org/10.3390/w15101873
Chicago/Turabian StyleEkka, Shail Vijeta, Yu-Hsuan Liang, Kuo-Fang Huang, and Der-Chuen Lee. 2023. "Molybdenum Isotopic Fingerprints in Taiwan Rivers: Natural versus Anthropogenic Sources" Water 15, no. 10: 1873. https://doi.org/10.3390/w15101873
Note that from the first issue of 2016, this journal uses article numbers instead of page numbers. See further details here.