
Research on Improvement of Slope Protection Concrete Precast Block Joints Based on Physical Model Experiment

1
Jiangxi Academy of Water Science and Engineering, Nanchang 330029, China
2
College of Civil and Transportation on Engineering, Hohai University, Nanjing 210098, China
3
Jiangxi Engineering Technology Research Center on Hydraulic Structures, Nanchang 330029, China
4
China School of Ocean Engineering, Harbin Institute of Technology at Weihai, Weihai 264209, China
5
Nanjing Hydraulic Research Institute, Nanchang 330029, China
*
Authors to whom correspondence should be addressed.
Water 2023, 15(10), 1874; https://doi.org/10.3390/w15101874
Submission received: 21 December 2022
/
Revised: 16 April 2023
/
Accepted: 25 April 2023
/
Published: 15 May 2023
(This article belongs to the Special Issue Safety Evaluation of Dam and Geotechnical Engineering)
Abstract
:Precast concrete block slope protection is widely used due to its advantages of easy detection and laying, ease of organization, and the limited time required for construction. In order to prevent the soil or gravel bedding of precast concrete from being subjected to wind and wave pressures, the joints between precast concrete blocks are usually filled with mortar. However, the existing standards do not specify the width or material of the joints. Furthermore, excessively wide mortar joints or shrinkage of the mortar can result in loss, a hollowed-out cushion, and damage to the slope, thus compromising the quality of slope protection engineering. To establish standards for controlling the quality of slope protection seams, this paper designed and conducted a physical model test of precast concrete block revetment seams. By embedding pore water pressure sensors in the cushion layer, changes in the pore water pressure were observed under varying conditions, including different water pore pressure sensor locations, water levels in front of the embankment, and different joint widths. Based on the test results, design standards for joint widths and recommendations for the treatment of joint mortar materials were proposed. After adding different amounts of a calcium oxide–calcium sulfoaluminate composite expansion agent (HME) into a joint mortar material, the paper also carried out a shear test on the contact surface between the joint mortar and the slope protection concrete after adding varying amounts of a calcium oxide-calcium sulfoaluminate composite expansion agent (HME) to the joint mortar material. Following a microporous structure test, recommendations for joint mortar construction treatment were proposed. The results indicate that the pore water pressure of the precast concrete slope protection cushion is closely related to the position of the cushion, the water level in front of the embankment, and the width of the paving seam. When the masonry seam width increased from 0.5 mm to 1 mm and from 1 mm to 1.5 mm, the variation ranges of the pore water pressure were 40–80% and 6–20%, respectively, with the latter being significantly lower than the former. Therefore, in practical engineering, joint treatment should take into account the impact of the cushion position, the water level in front of the dike, and the joint mortar width. Mortar shedding within the range of wave climbing height should be addressed promptly, and joint width should be controlled to below 1 cm as much as possible to effectively prevent damage to the cushion surface. The addition of an expansion agent can improve the bond strength of the concrete and mortar to a certain extent. The study found that an 8% content of the expansion agent resulted in the best mortar bond strength and the densest microstructure. These research findings can serve as a basis for the development of quality control standards for precast concrete slope protection.
1. Introduction
Prefabricated slope protection on reservoir banks plays a critical role in maintaining slope stability and reducing the scouring effects of water flow on slope surfaces. This protection is essential to ensure the safety of reservoir dams and river dikes. According to statistics, more than 98,000 reservoirs and 312,000 km of embankments for grade 5 or above rivers have been built in China, with hexagonal precast concrete blocks being the preferred slope protection method. The Chinese standard SL634-2012 [1] outlines the quality requirements and detection methods for appearance dimensions, slope protection thickness, and the quality of paving and filtration. While the standard mandates no gaps in the paving seams, gaps are necessary to maintain the stability of the precast blocks due to construction conditions and temperature deformation [2,3,4]. Currently, mortar is the most commonly used joint material. However, based on long-term engineering practice, when the gap is too wide, or the joint material falls off, waves can easily dislodge the underlying layer of stone and earth dam soil material used to protect the slope, leading to slope collapse and unstable slope protection.
Regarding slope stability designs, E.I. Mikhnevich [5] proposes determining the diameter of dumped rip-rap material and the thickness of plates for slope protection of earth dams in the zone of active wave impact. Zhao Nenghao [6] has established a coupling model that incorporates both pore water pressure and pore water gravity to realize their mutual influence on slopes. Wang Xiaobing [7] investigated the probabilistic stability of embankment slopes subjected to water level drawdown using the random field finite element method (RFEM) with strength reduction technology. Zhilu Zheng [8] emphasizes the need to control the space between building blocks to within 2–5 mm to ensure their aesthetics and safety. Ji Zheng [9] suggests that horizontal seam widths and seam widths of straight sections of precast block slope protection should be controlled at 8 mm and 10 mm, respectively. Due to the time-consuming nature of three-dimensional analyses of slope stability, Yong Liu [10] proposed a two-dimensional plane strain analysis method that offers an appropriate level of conservativeness, making it useful for slope stability designs. Decheng LIU [11] utilized a two-dimensional limit equilibrium transfer coefficient method to analyze the stability of an entire reservoir bank under various working conditions and proposed comprehensive treatment measures involving foot walls, precast block slope protection, and drainage ditches. In another study, the influence of different slope protection conditions on slope deformation was summarized, and the influence of soil compaction, soil moisture content, and slope ratio on the horizontal displacement restraint capacity was investigated. The stability of slopes was determined through a laboratory model test of eco-concrete slope protection [12].
It is widely known that the most commonly used joint material is cement mortar, which is made up of cement, fine aggregates, and water. However, the fluidity and strength of cement mortar, as well as the construction process, can impact the filling and plastering of joints. Mortar is also susceptible to falling off or resisting cushion loss due to wave-current scour and weight adjustment of precast blocks. Seifan Mostafa [13] conducted a study on the effects of nano and micro Fe3O4 on the fresh and mechanical properties of plain mortar and mortar modified with fly ash. Dongyu Niu [14] investigated the mechanical properties of asphalt mortar with different admixtures and found that adding additives improved its water stability. Lv Dan [15] prepared three types of asphalt mortars with different mineral powder fillers and tested their low-temperature cohesive strengths using technology for testing cohesive tensile strength. John Shaise K [16] reviewed the properties of fly ash and fly ash-slag geopolymer mortar, including microstructural properties, fresh properties (such as setting time and workability), hardened properties (such as compressive strength and tensile strength), and durability properties (such as thermal resistance, shrinkage, acid resistance, chloride resistance, and sulfate resistance). Rocha Joaquin Humberto Aquino [17] evaluated the influence of waterproof and adhesive additives on the mechanical properties, such as compressive and flexural strength, of render mortar over a 28-day period. Additionally, some scholars [18,19,20,21,22] have utilized nanotechnology and fibers to enhance the mechanical properties of mortar materials.
The stability of precast block slope protection is directly related to the quality of masonry. Previous research has analyzed the stability of slope protection and provided construction guidance for masonry materials and construction quality control. However, the width of masonry and material improvement has not been adequately researched. Therefore, this paper established a physical model of the masonry joints of precast concrete slope protection. By placing pore water pressure gauges in the slope protection cushion, the changes in the pore water pressure in the cushion were studied under different positions of the gauges, different water levels in front of the dike, and different widths of the joints. The bonding properties of the joint mortar were also improved by adding an expansion agent with a double-expansion source. Appropriate joint widths and expansion agent dosages were proposed for concrete slope protection based on the research findings. These results can serve as a valuable reference for precast concrete slope protection.
2. Experiment Design
2.1. Materials
In this study, ordinary Portland cement (P.O 42.5, GB175-2007, [23]) and a calcium oxide-calcium sulfoaluminate composite expansion agent (HME, produced by Jiangsu Subote New Material Co., Ltd. in China) were used, and the physical properties of the raw materials are presented in Table 1, Table 2 and Table 3. The materials included natural medium sand with a fineness module of 2.9 and natural gravel with a maximum particle size of 40 mm (following the Chinese standard SL/T 352-2020 [24], Specifications for Hydraulic Concrete Construction), and their grain compositions are given in Table 4 and Table 5.
2.2. Mix Proportions and Preparation of Samples
2.2.1. Mix Proportions and Preparation of Prefabricated Blocks
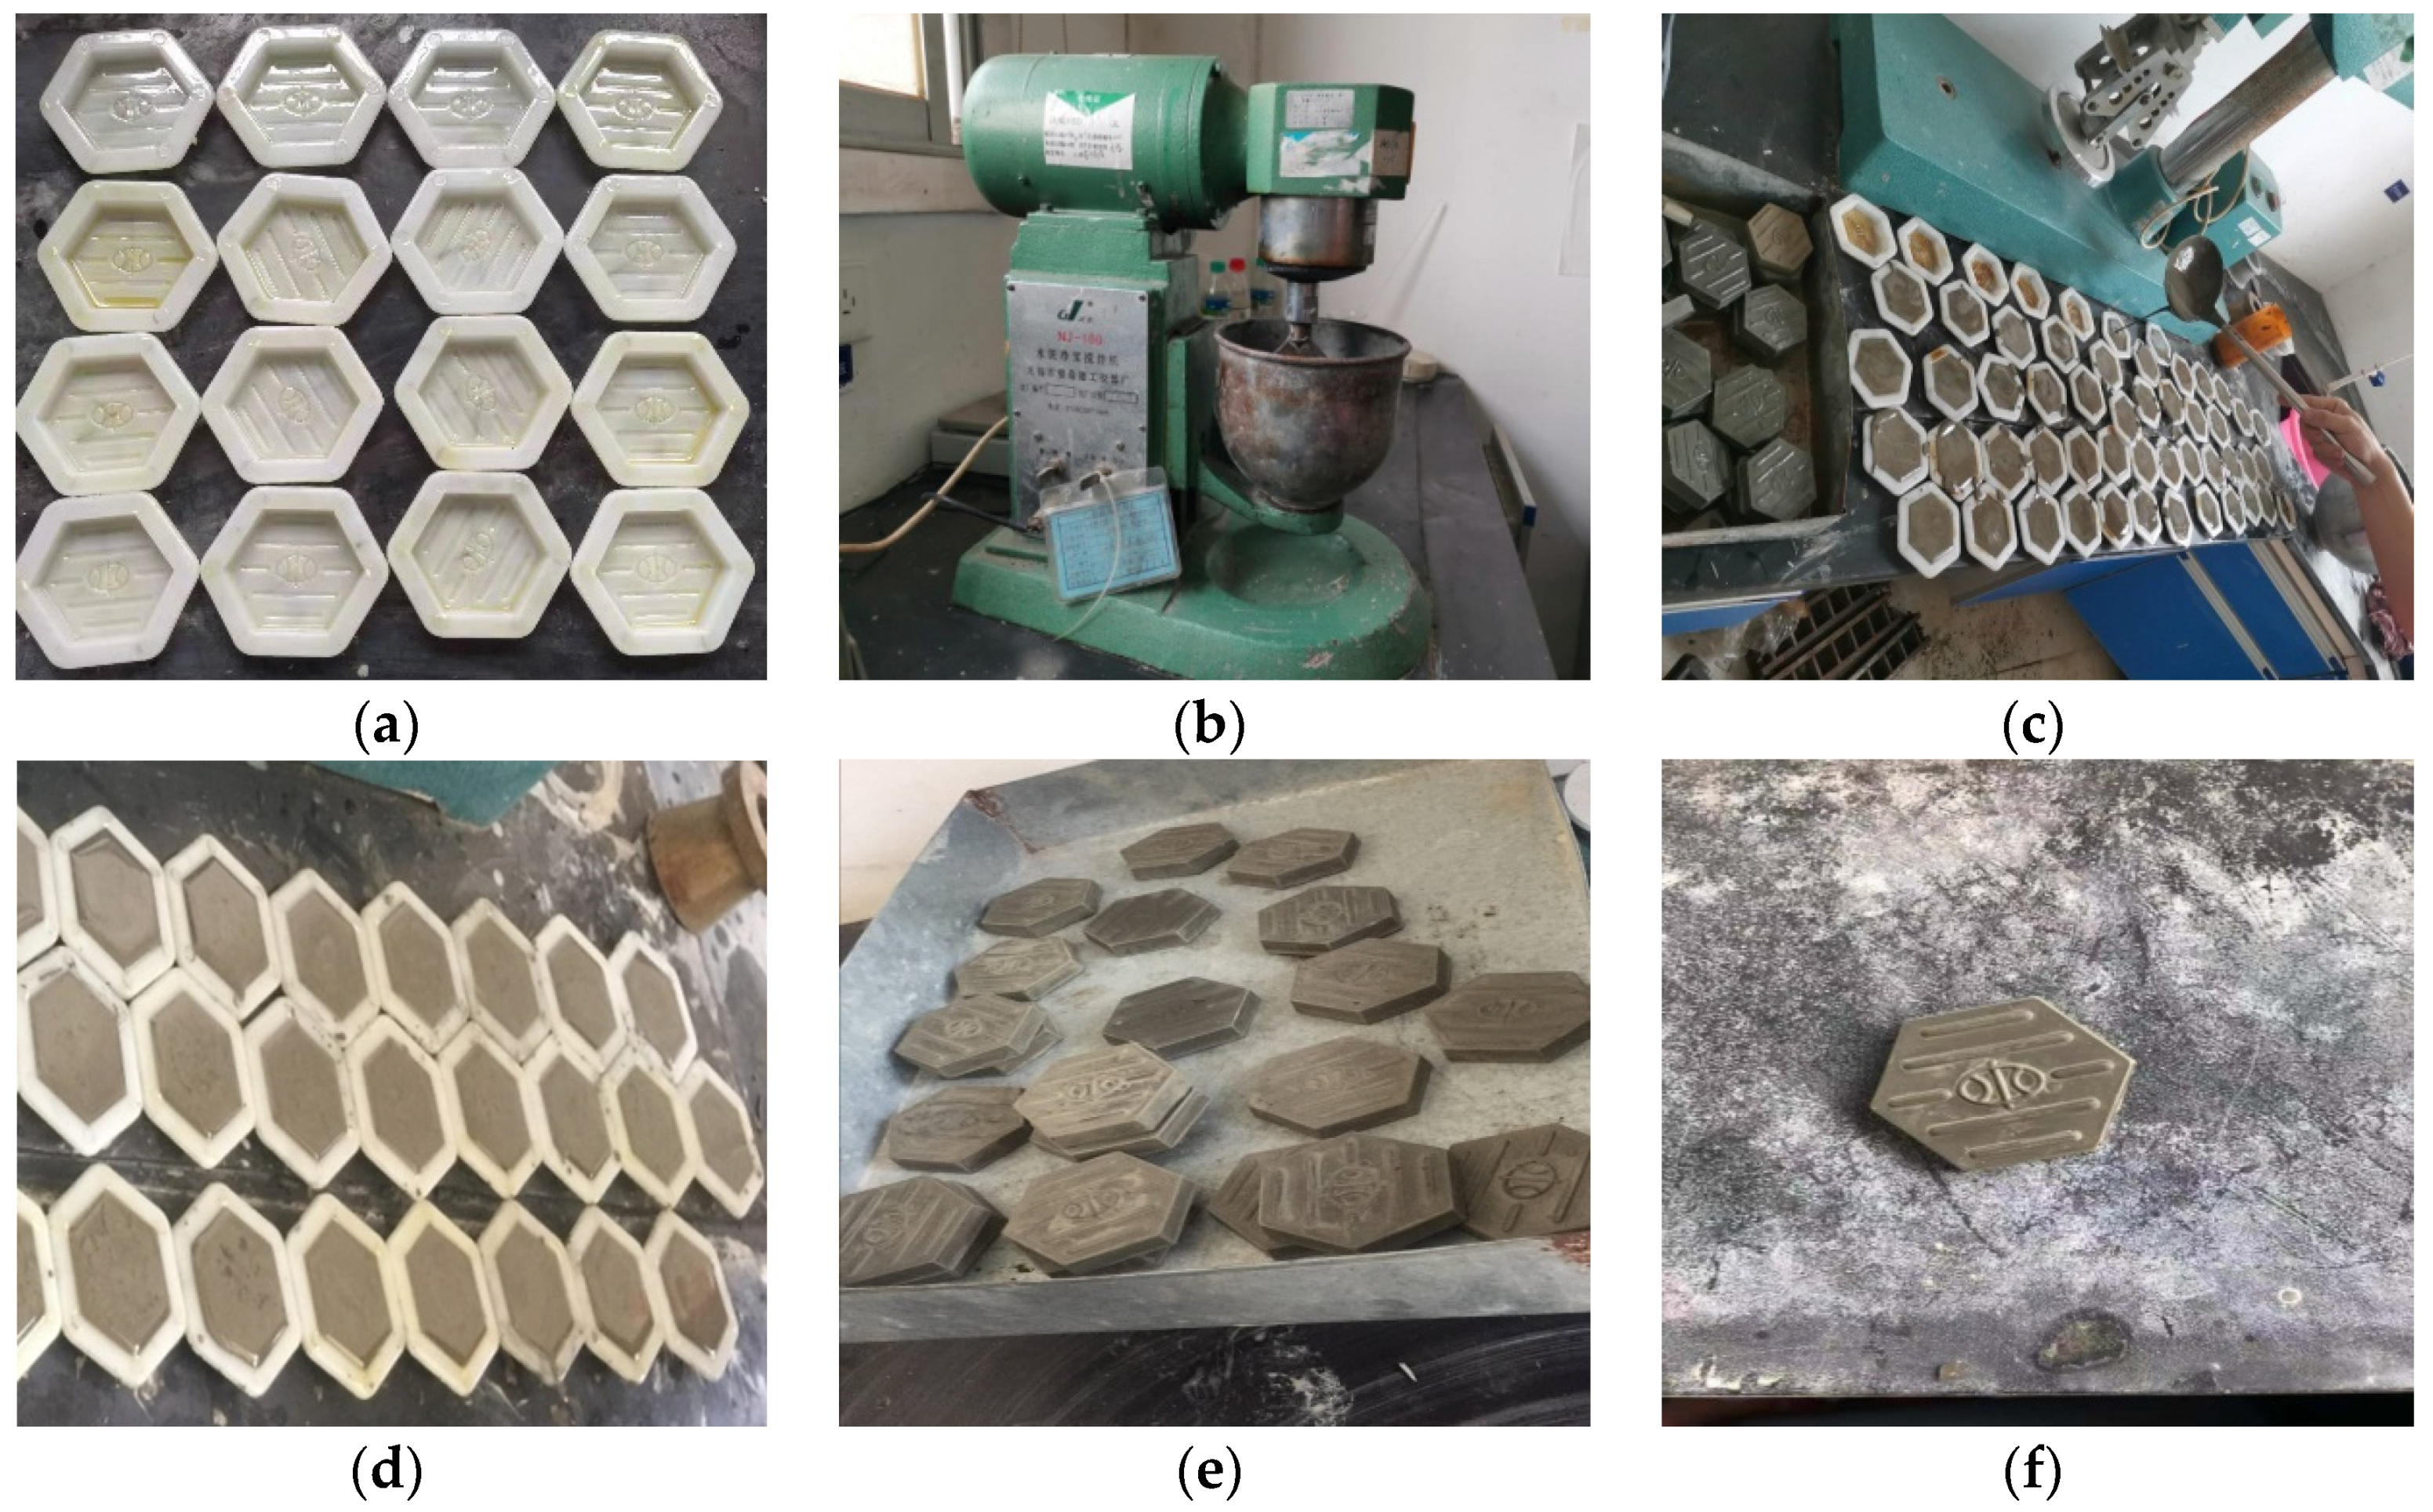
The dimensions of hexahedral prefabricated slope protection are regulated by the Hydraulic Design Manual [25] to have a side length of 0.3–0.4 m and a thickness of 0.15–0.20 m. In this study, the prefabricated blocks had a side length of 0.3 m and a thickness of 0.11 m, and a model with a scale of 1:10 was created with a side length of 30 mm and a thickness of 11 mm. The match ratio of the prefabricated blocks was ignored, as it did not affect the test results. The prefabricated blocks were formed with cement paste to have a compressive strength of C15, as detailed in Table 6. After brushing, mixing, pouring, forming, and demolding, all samples were cured and are shown in Figure 1.
2.2.2. Mix Proportions and Preparation of Joint Mortar
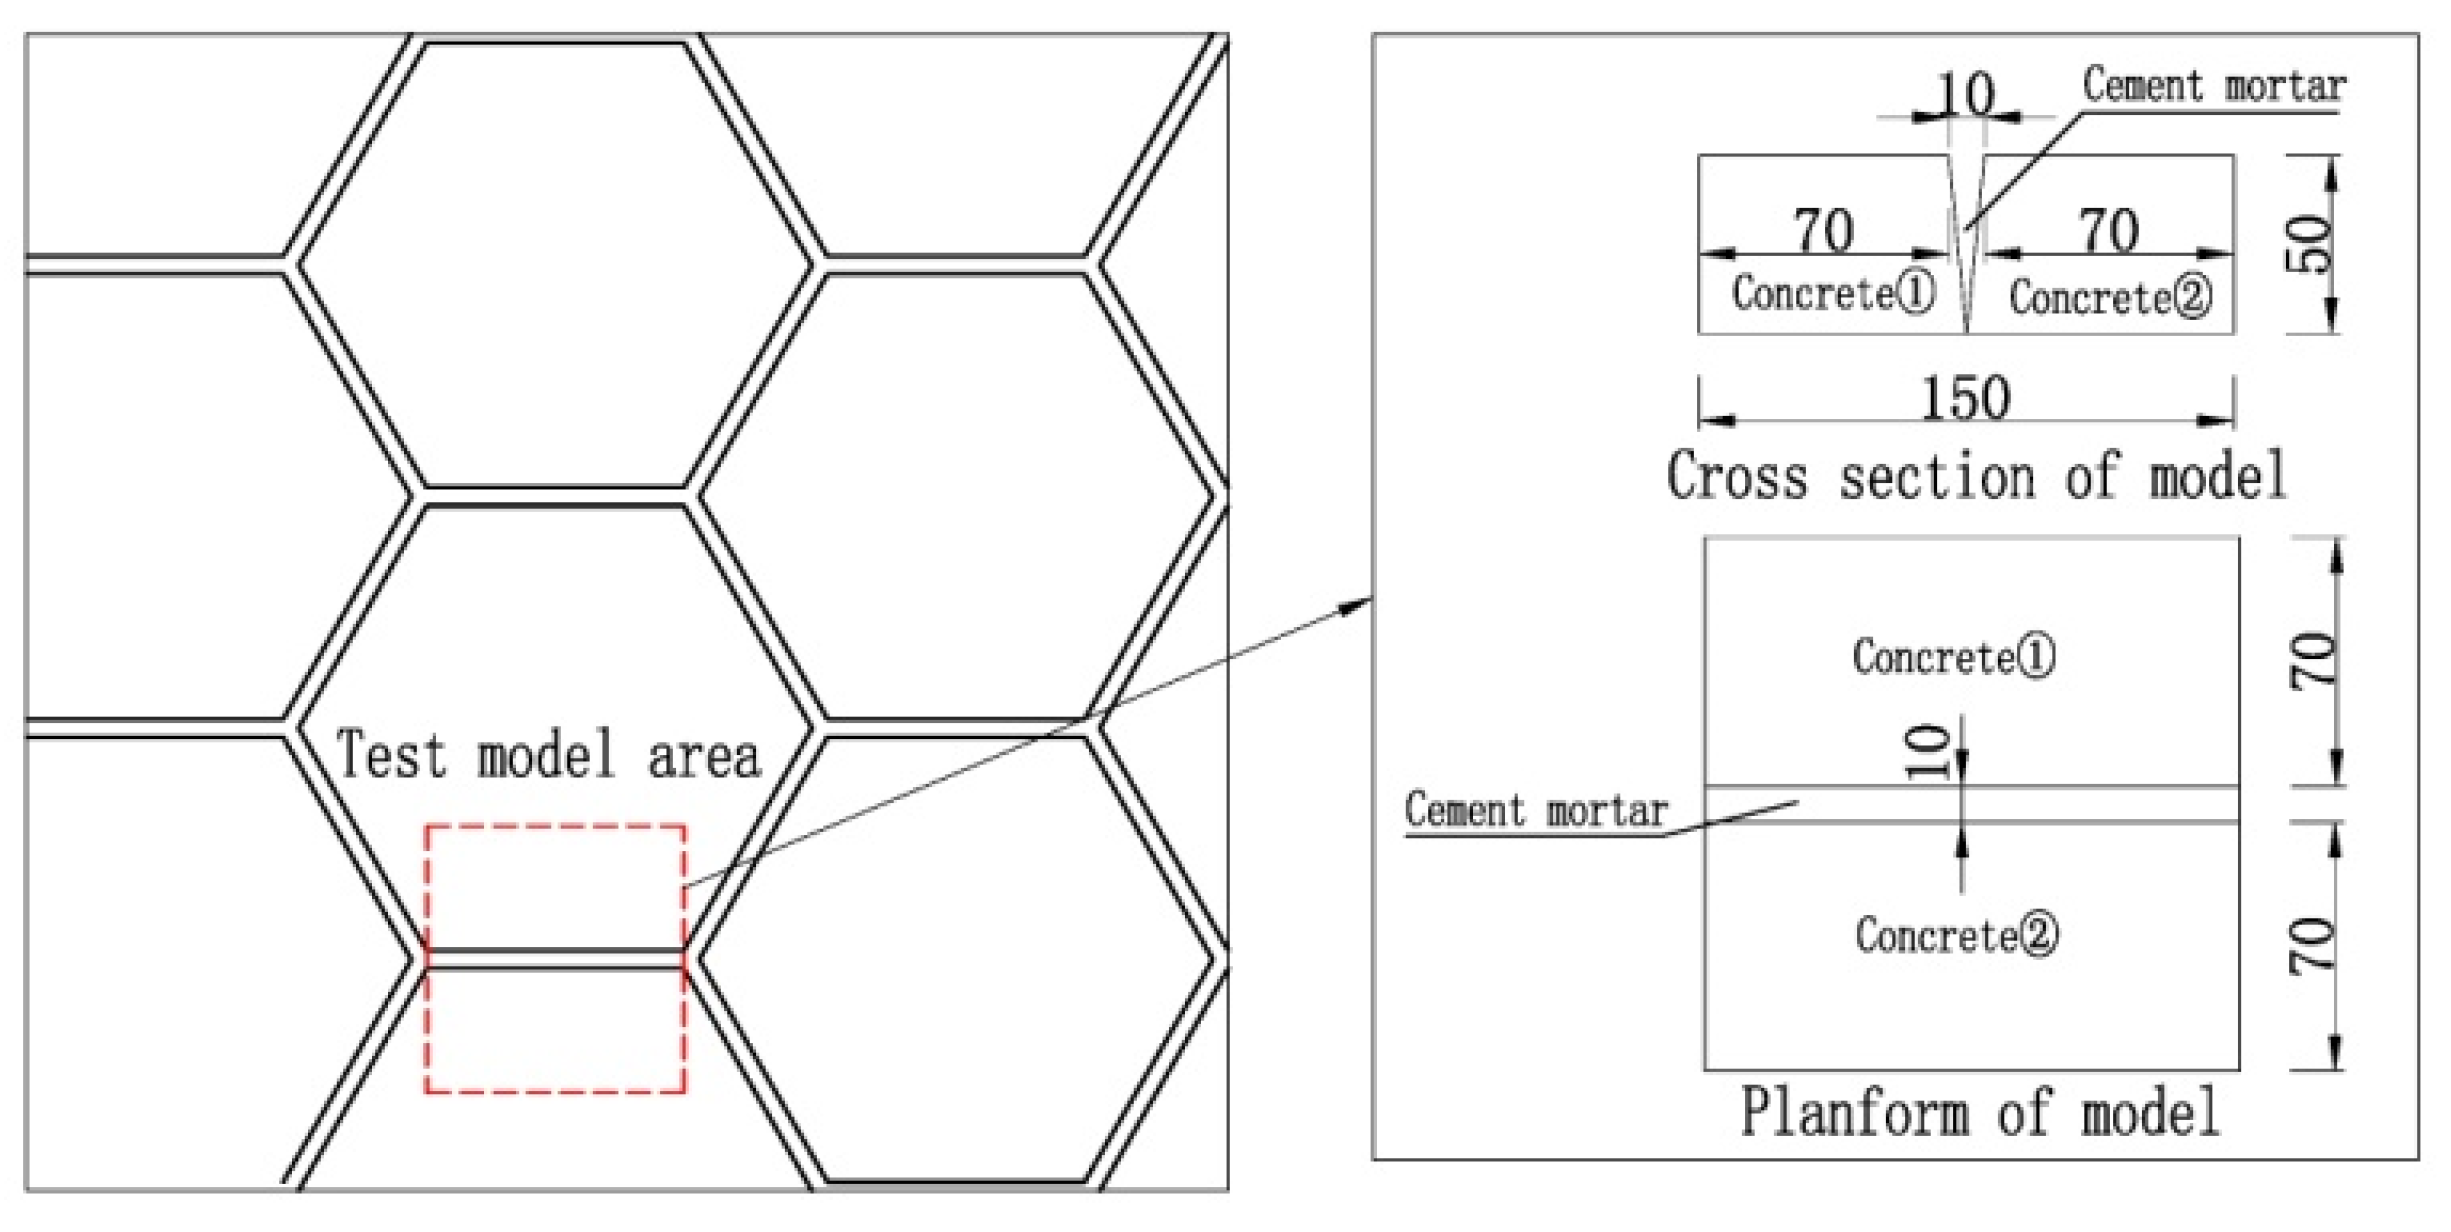
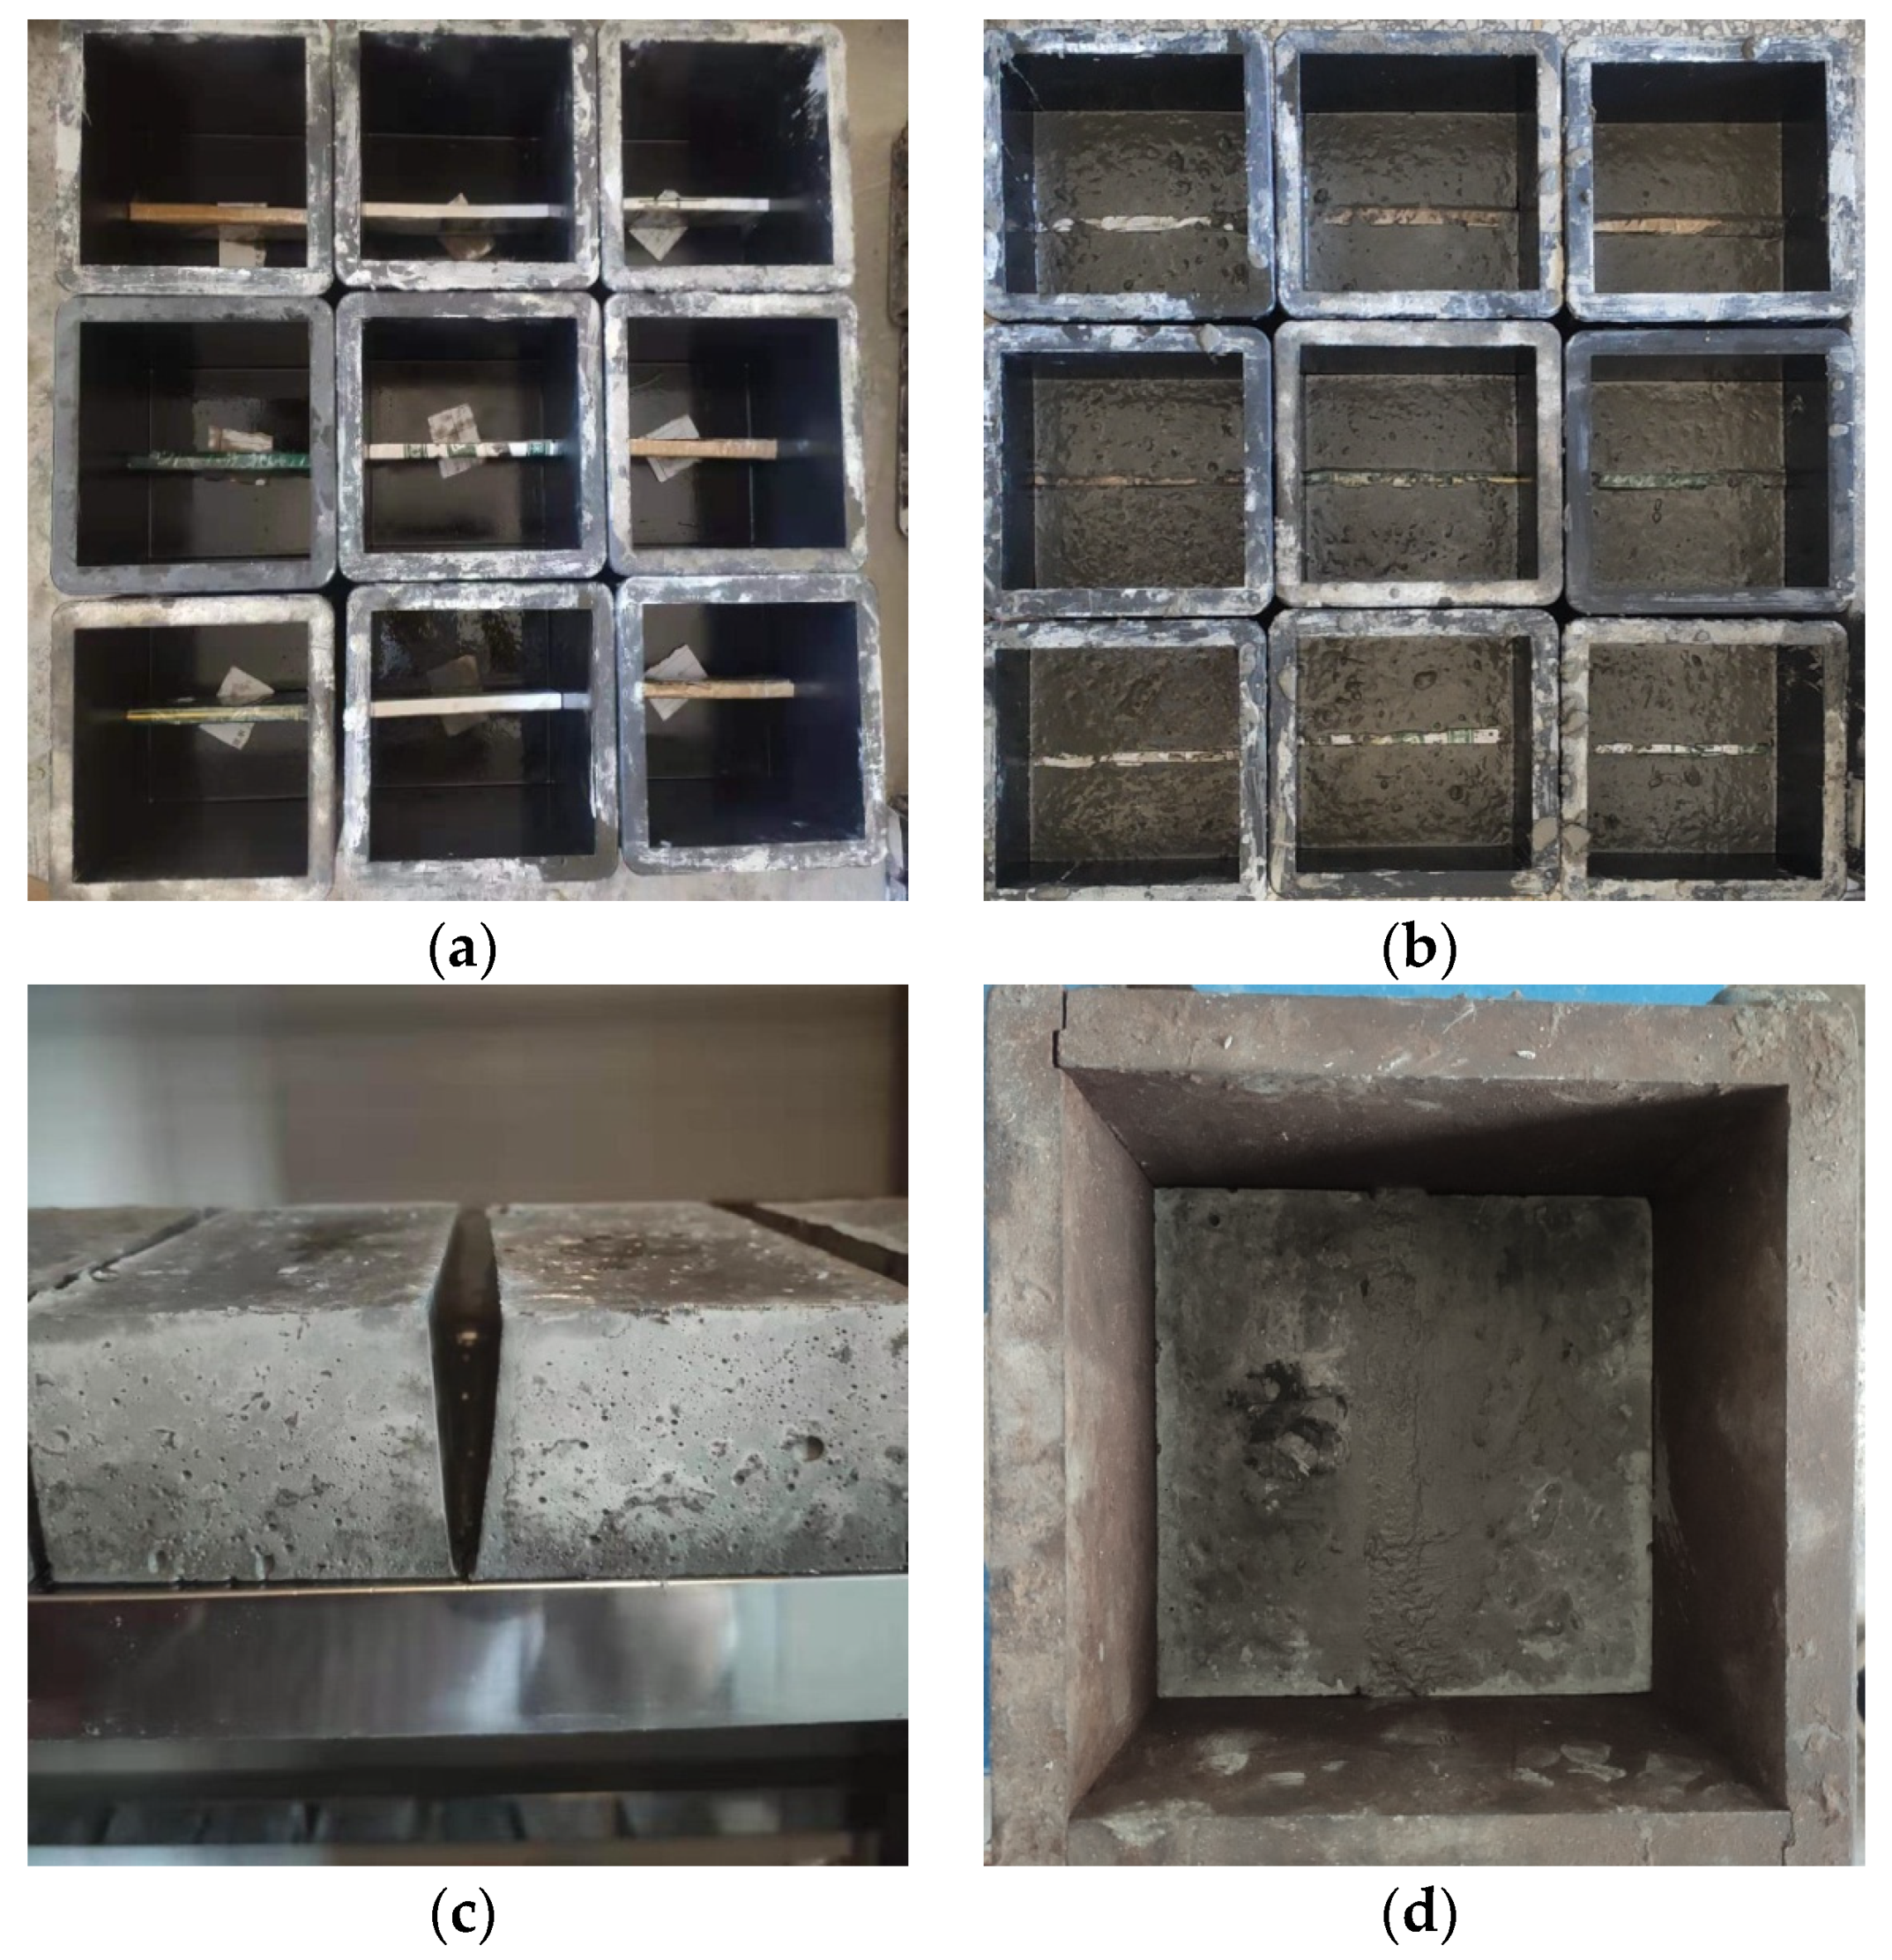
Based on the conditions of precast concrete block laying for slope protection, specific areas were chosen to conduct bond performance tests between the cement mortar and precast concrete blocks intended for slope protection use, as depicted in Figure 2. In order to establish the test model conveniently, a scaled version of the regional model was used with a length scale of 1:2. The test model was carried out using test blocks and molds. During the molding process, concrete ➀ and concrete ➁ were formed and maintained first, with both having a strength of C15. Following the curing process, cement mortar was poured into the paving seam. Figure 3 illustrates the pouring situation of the test model.
To investigate the effect of different admixture strengths and dosages on the bonding property between cement mortar and precast concrete blocks used for slope protection, 3 groups of mixing ratios were designed using the mixing ratio design method of hydraulic concrete and hydraulic mortar, in accordance with the SL/T 352-2020 Hydraulic Concrete Test Specification. These were M15 cement mortar, M20 cement mortar, and M20+ cement mortar (with 8% HME added to consider the mortar shrinkage cracking effect of the seam falling off). The mix proportions of the cement mortar are detailed in Table 7.
Figure 4 displays the specimen model after molding, and all specimens were cured for 24 h in a standard curing chamber (20 °C/95% RH) before demolding. Subsequently, the specimens were further cured for 28 days in the same curing chamber. After curing, the strengths of the cement paste, cement mortar, and concrete were tested.
2.3. Width Model of Paving Seam
2.3.1. Observation and Monitoring Equipment
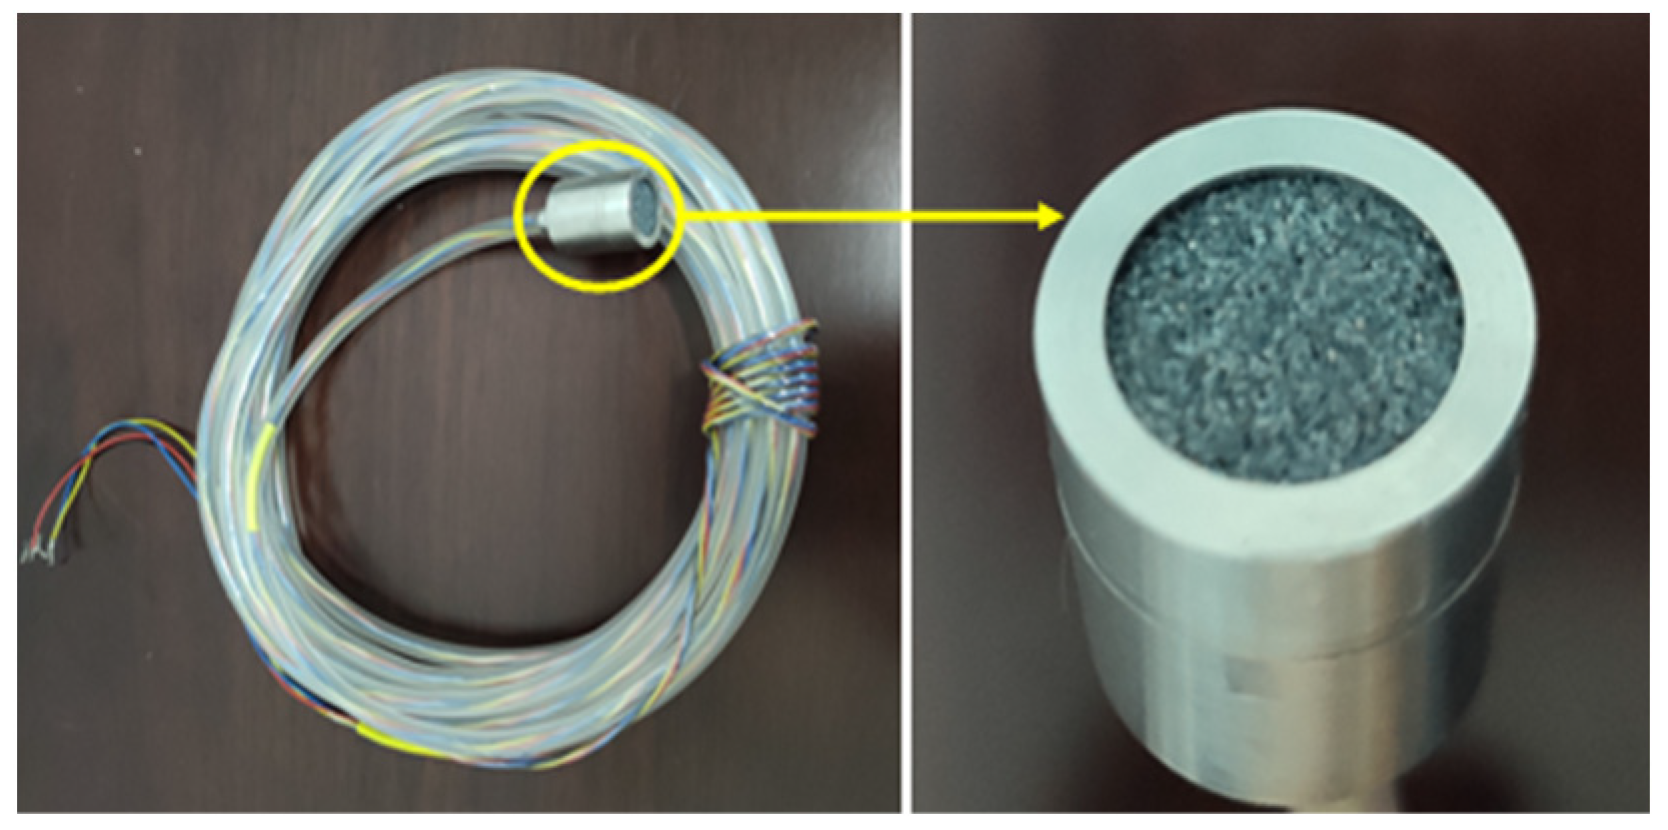
The strain-type micropore water pressure gauge sensor has a measuring range of 0–10 kPa, an accuracy of less than 0.03 kPa, a sensitivity coefficient of 0.5 mV/kPa, and a conversion coefficient of 0.002 kPa/με after acquisition. Figure 5 shows the strain-type micropore water pressure gauge sensor.
In order to realize the collection of stress in the strain-type micropore water pressure sensor, a static resistance strain tester was used to measure the variation in the physical parameters of the pore water pressure through the transformation of a strain full-bridge circuit so as to study the influence of the variation in the pore water pressure in the cushion layer under wave action.
Assuming that the value of the pore water pressure gauge collected through the static resistance strain gauge is , then the real-time stress value was calculated according to Formula (1):
where is the sensor sensitivity coefficient, is the real-time stress value of the sensor, is the 0 output strain value of the sensor, and is the output strain value corresponding to .
2.3.2. General Layout of Model
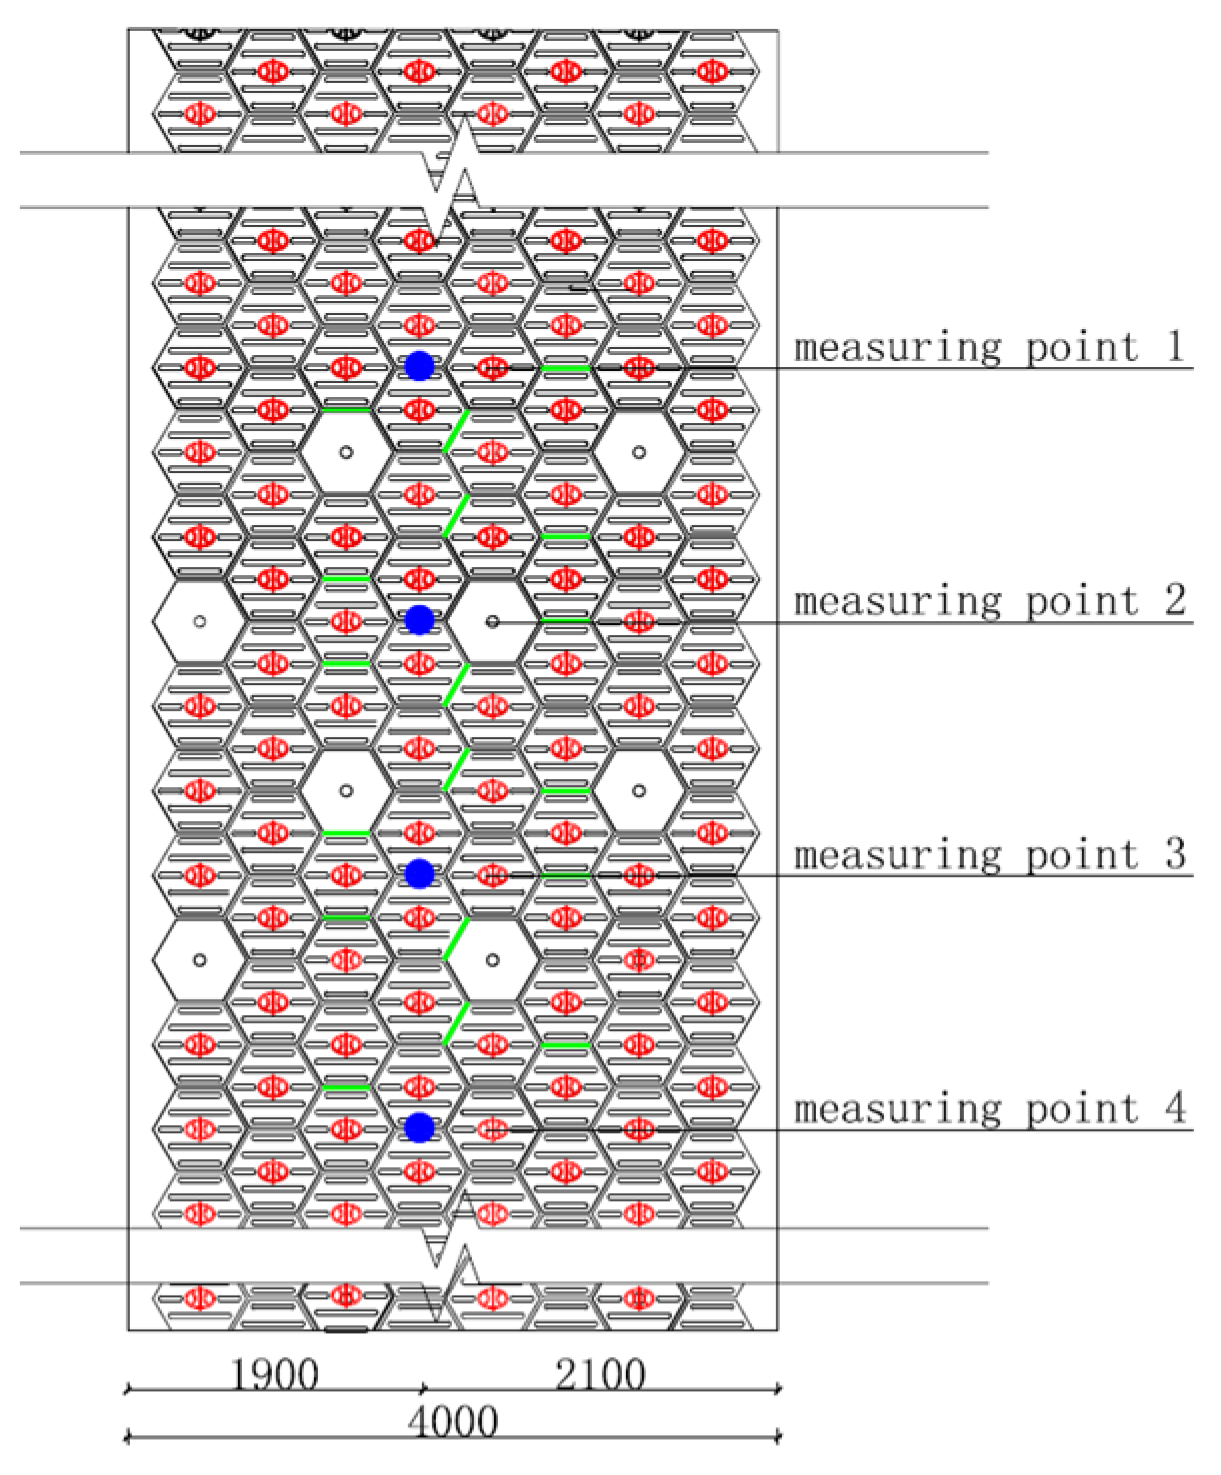
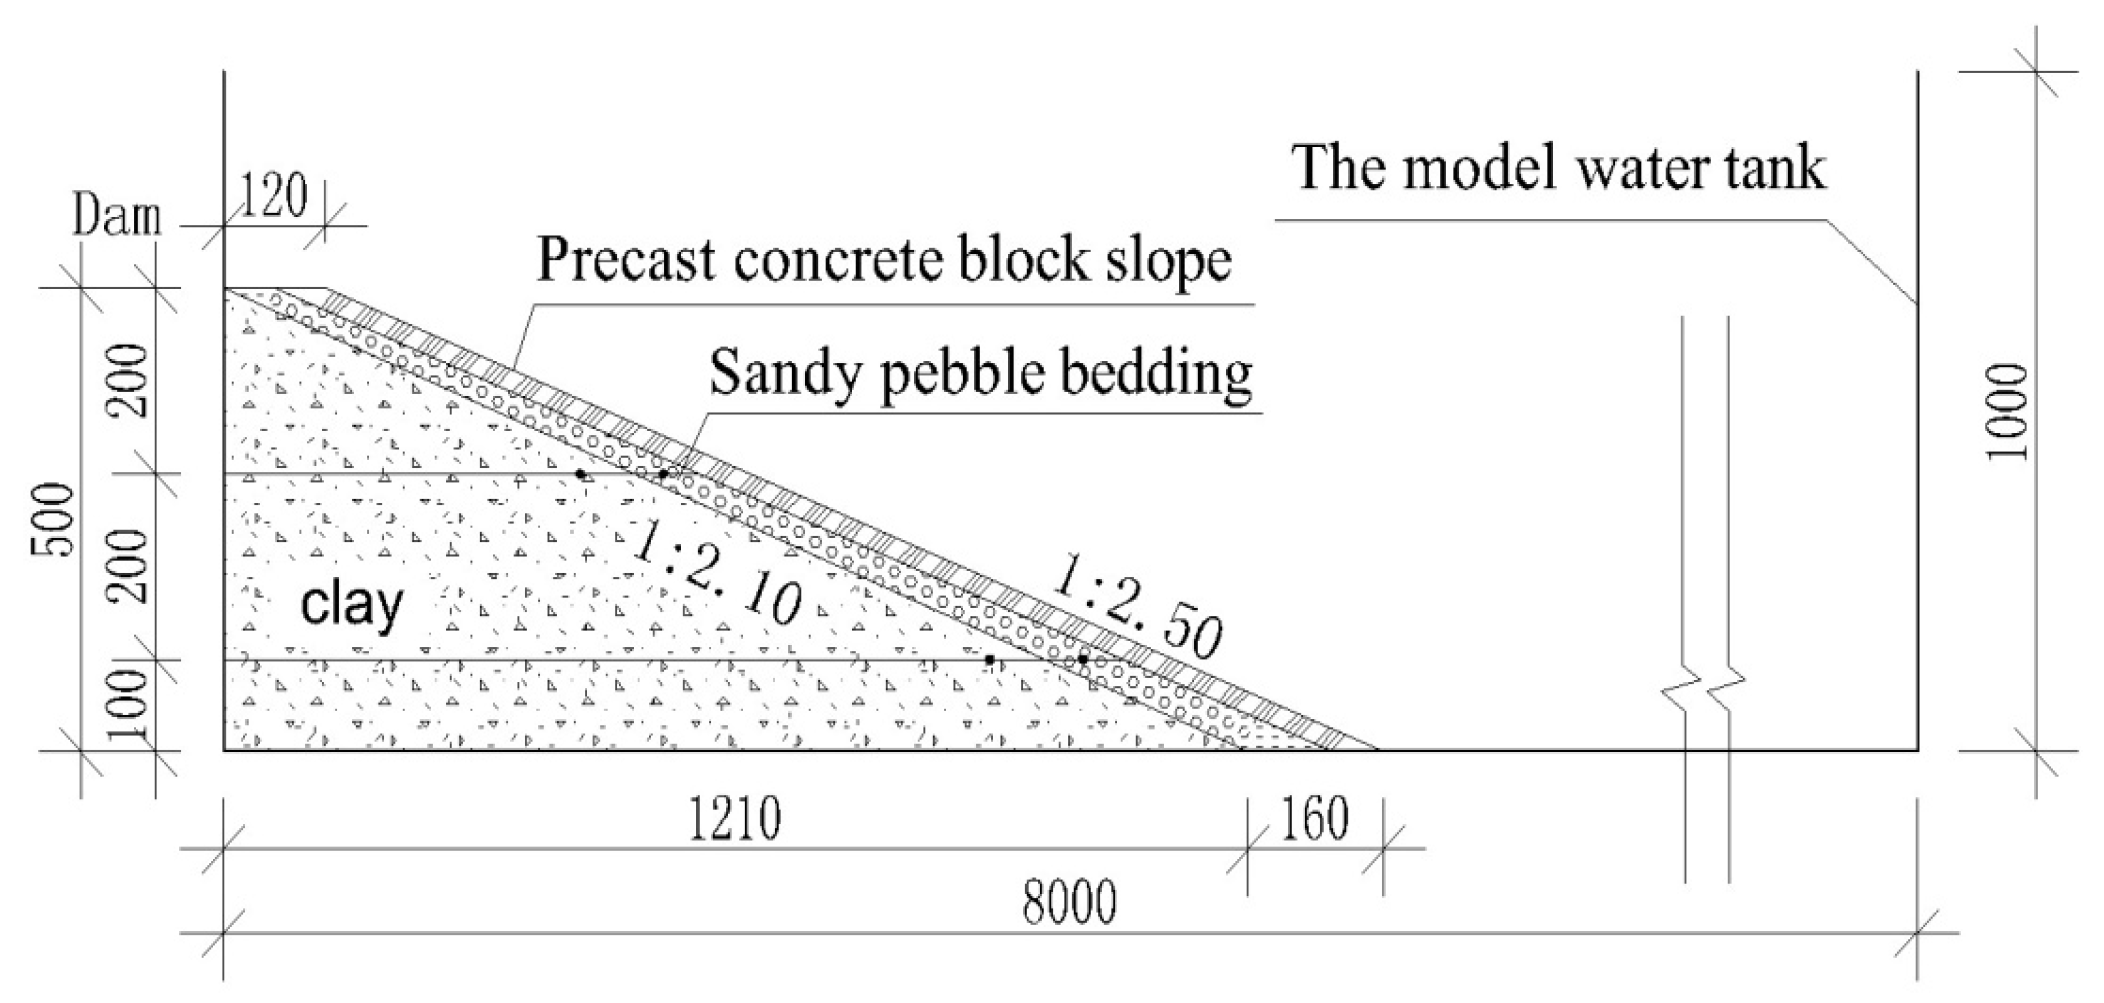
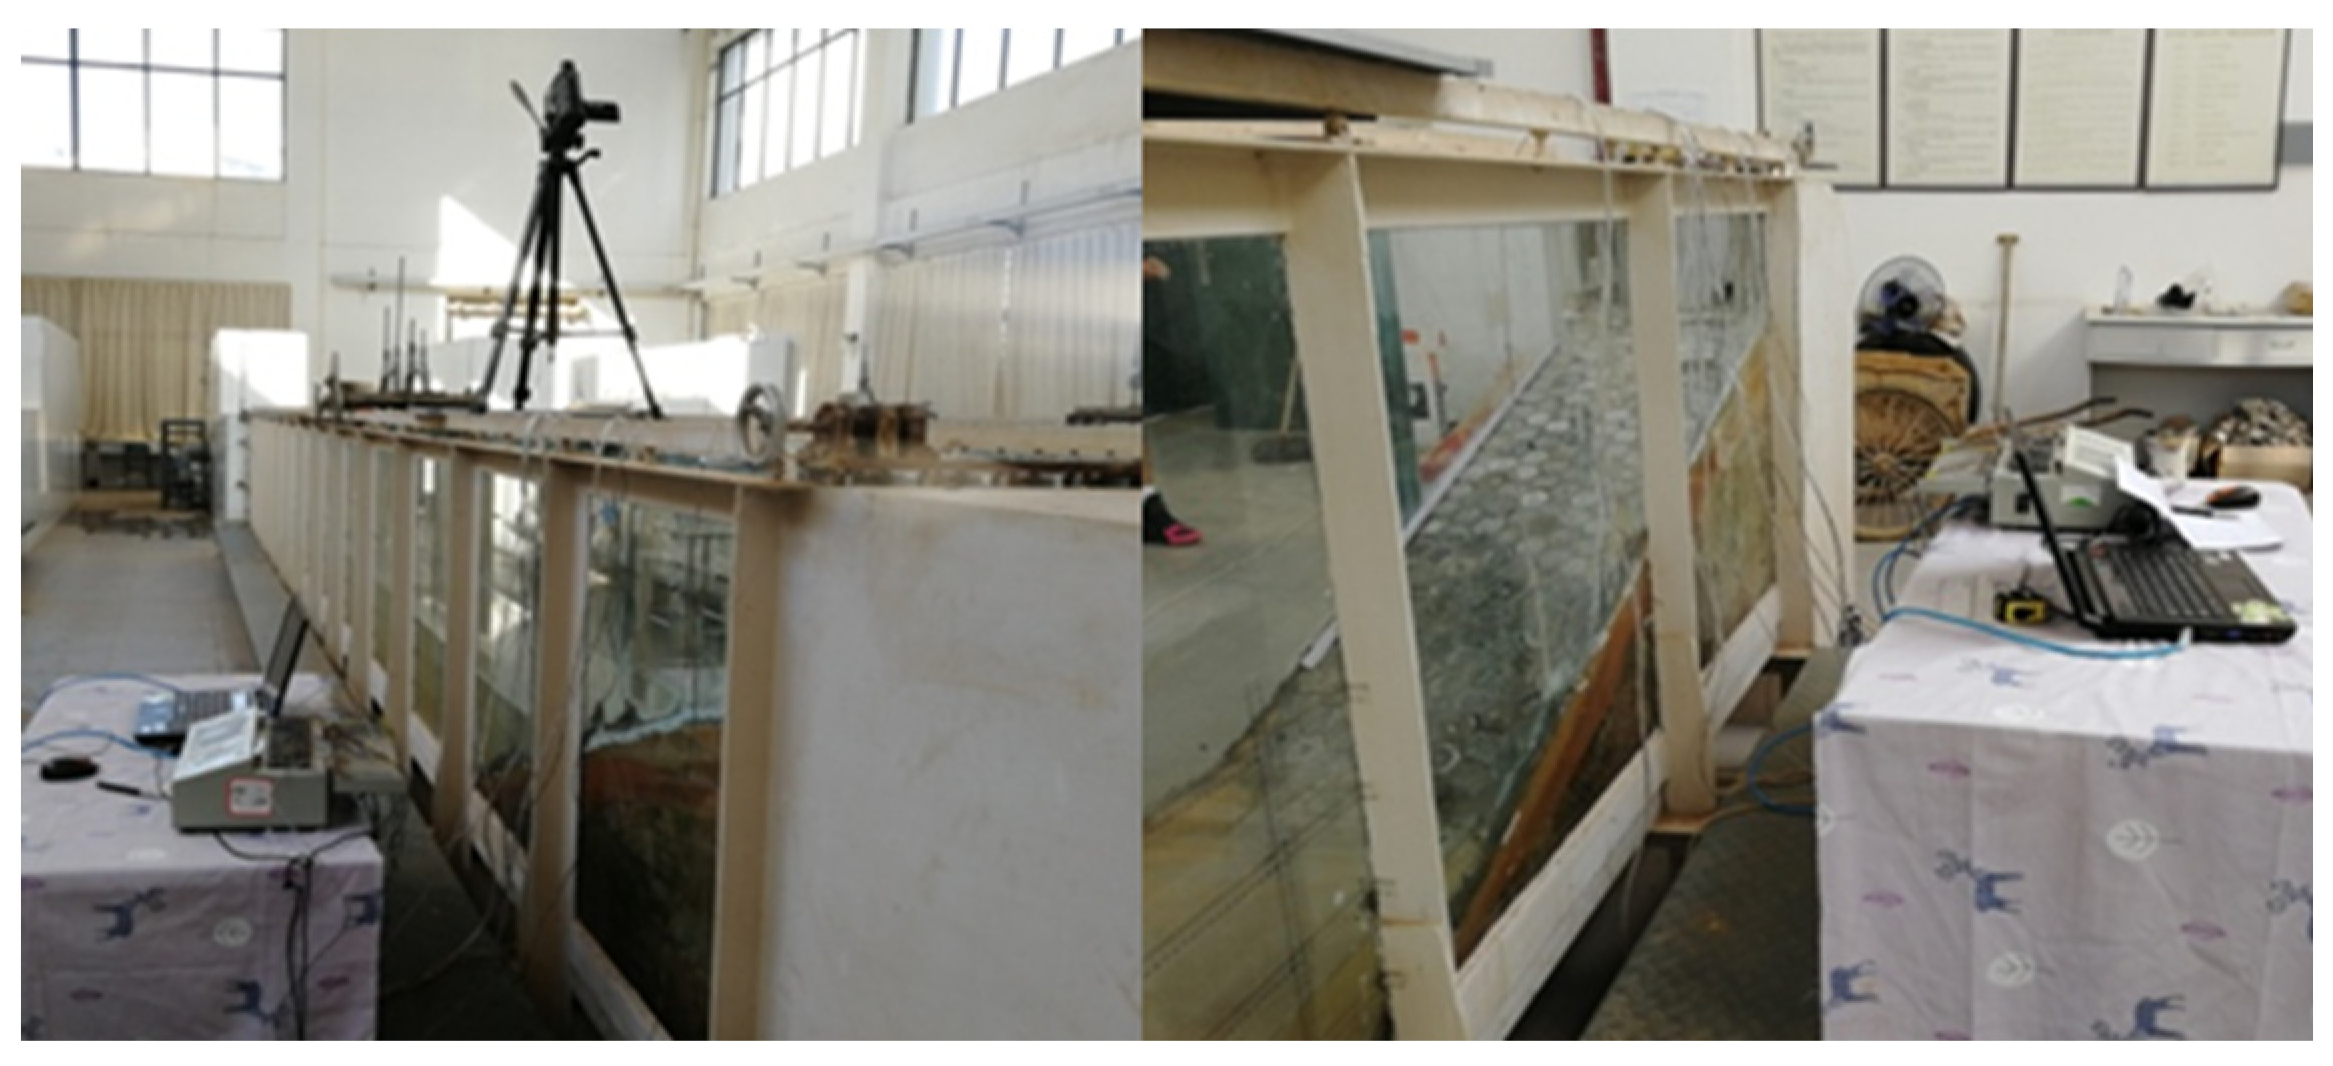
The gravity similarity criterion was used to design the physical model of the paving seam with a geometric scale of 1:10 for the slope protection section of the soil embankment. The slope model had a height of 0.5 m, a ratio of 1:2.5, and a width of 0.4 m. A hexagonal precast block with a side length of 300 mm, made at a geometric scale of 1:10, was used for the model test to truly restore the soil embankment slope protection. The bedding material for slope protection was arranged using the coarse-grained material grading scale method proposed by Guo Wanli [26]. A wave generator was placed at the end of the model water tank to simulate different wave heights. To observe the influence of different locations, water levels in front of the embankment, and paving seam widths on the change in the pore water pressure in the cushion layer and to provide a reference value for the width of paving seams in prefabricated slope protection blocks, 4 strain-type micropore water pressure sensors were arranged on the same dam axis with a vertical spacing of 60 mm. The pore water pressure gauges 14 corresponded to measuring points 14, and their arrangement is shown in Table 8 and Figure 6, while Figure 7 shows a profile view of the precast concrete block slope.
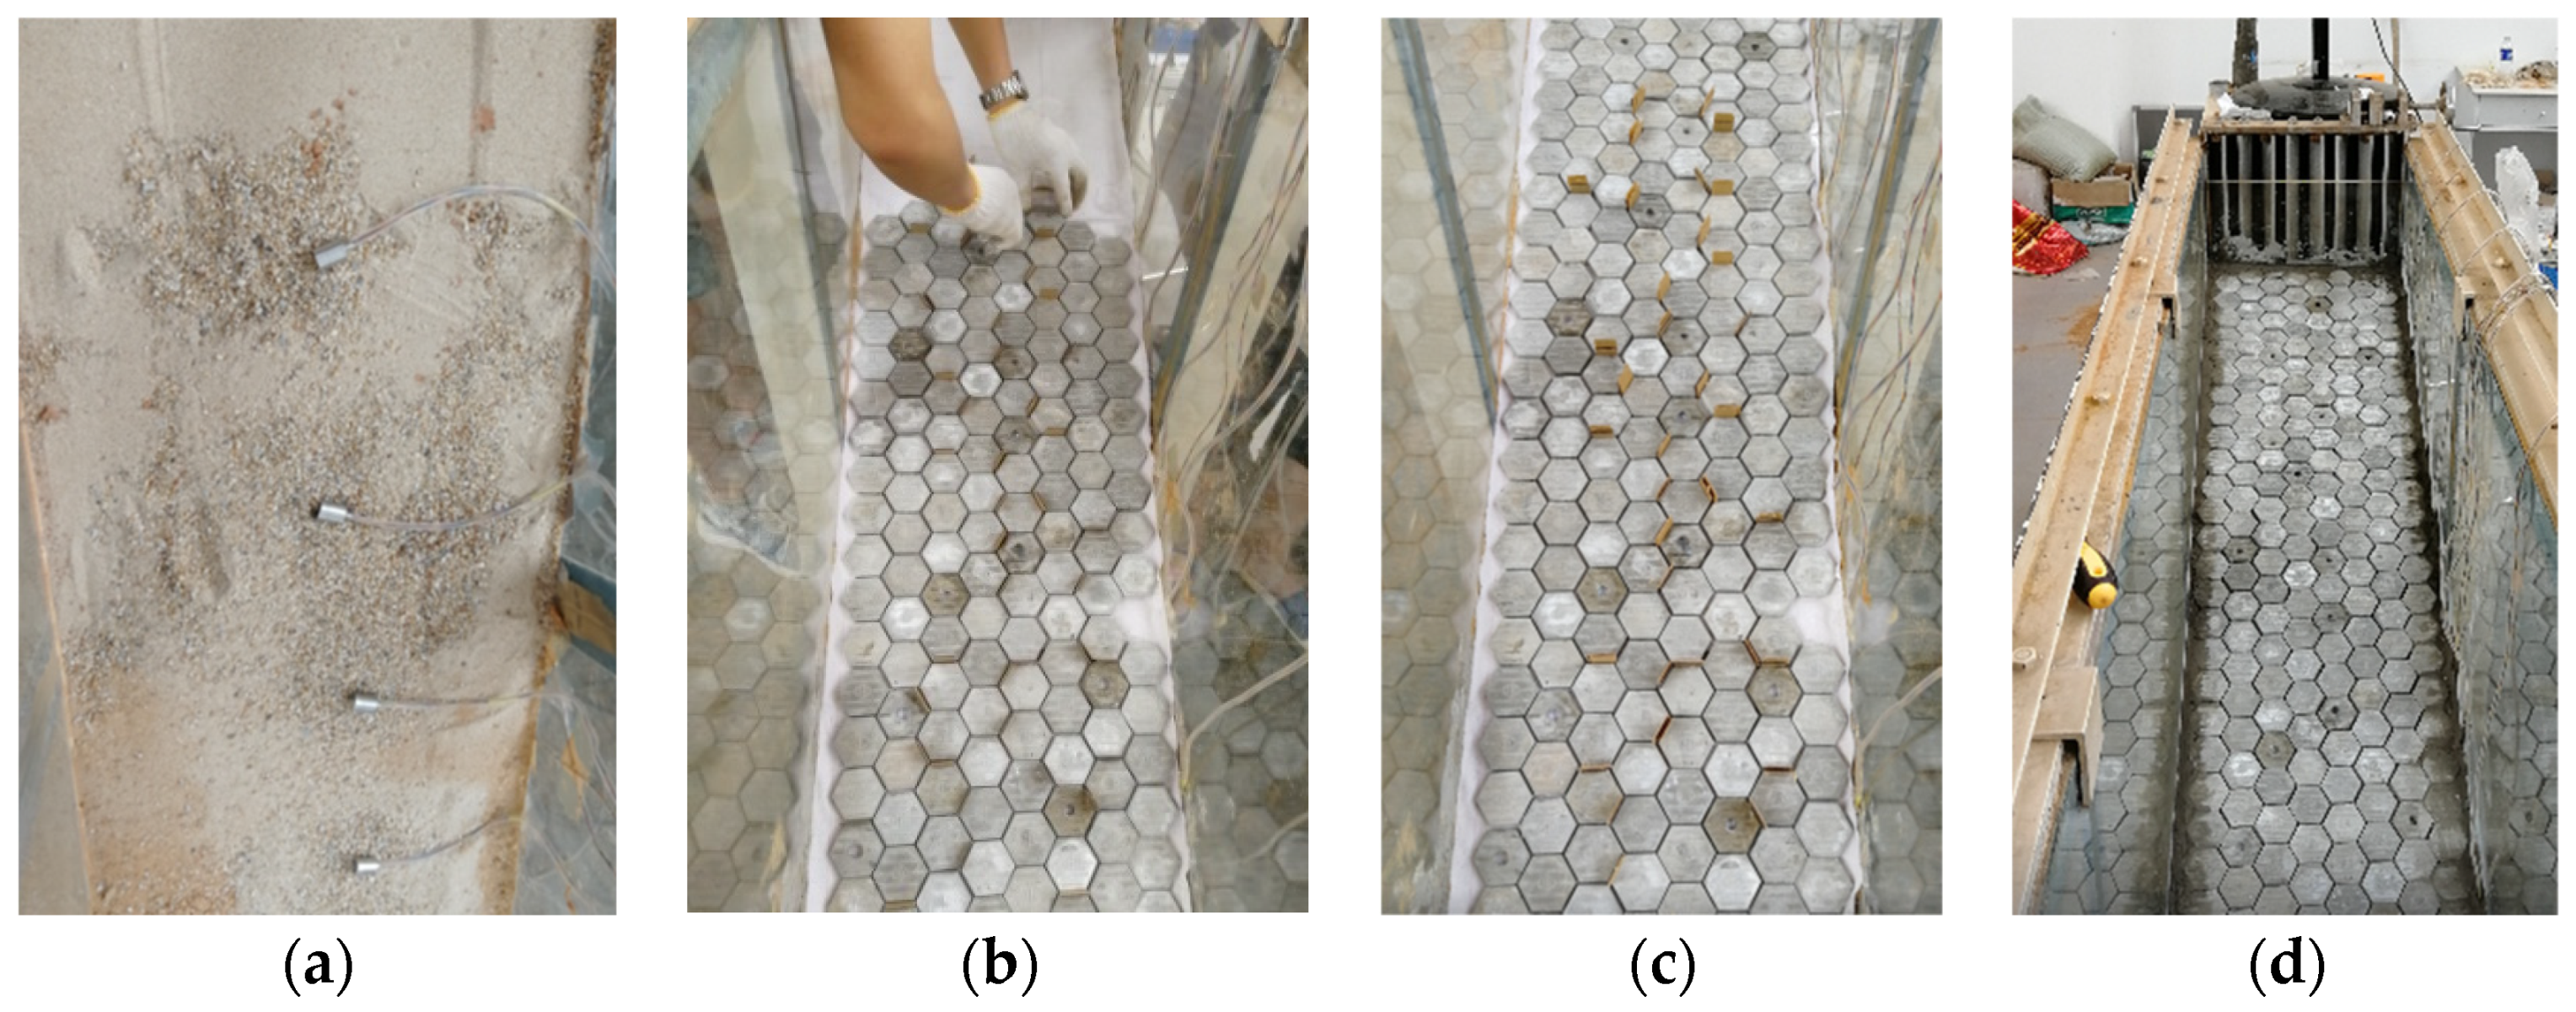
2.3.3. Laying the Precast Block and Setting the Paving Seam
Considering that the test mainly studies the falling off of prefabricated block joint material caused by long-term erosion attributable to waves, and the subsequent failure of the cushion layer, a reference value for the width of the joint was proposed. Therefore, in order to simulate the changes in the cushion layer under the action of waves under different shedding conditions, prefabricated blocks with different paving seam widths were laid by inserting acrylic plates with different thicknesses in combination with the actual possible different widths of paving seams. The laying process of the precast blocks is shown in Figure 8.
2.4. Test Program Design
2.4.1. Paving seam Width
To understand the paving seam widths of existing slope protection materials, a key survey was conducted on a precast block slope protection project on site, and a total of 60 paving seams were measured at 20 points. The measurement method consisted of measuring the maximum seam width at 1 place every 50 m2 of slope protection.
For the convenience of analyses and comparisons, the layout pattern of the paving seams (mainly referring to the numbers of transverse, oblique, and vertical joints) between the 2 measurement points was consistent. Three different water levels were set in front of the embankment: 22.5 cm, 27.6 cm, and 30.6 cm. The wave-making period was set to 800 RPM, and the conversion formula between the speed of the generator and the wave period is shown in Equation (2). The wave-making period was calculated to be 1.875 s. According to the wave height calculated by Mingwei Wei et al. [27] using the water depth and the wave-making period, the wave heights simulated by the model were 0.12 m, 0.15 m, and 0.17 m. The specific working conditions are shown in Table 9.
where T is the wave-making period of the wave-making machine. V is the speed of the wave generator (turns per minute).
T = 60/(V/25)
The test operation procedure is as follows: After the slope protection is laid, water is injected into the model groove. When the water is injected into the set water level, the generator is turned on, and the strain gauge is turned on at the same time to record the sensor data. After the completion of the first group of working conditions, the water in the tank is drained, and the precast concrete blocks are removed; at the same time, the clay and the sand are added to the cushion, the pore water pressure gauge is buried in the same position, and the precast concrete blocks are laid again. In the test, the laying conditions of the cushion, pore water pressure gauge, and precast concrete blocks should be as consistent as possible under multiple working conditions. For specific collection, see Figure 9: Acquisition system layout.
2.4.2. Paving Seam Materials
(a) Compressive/Shear strength of paving seam materials
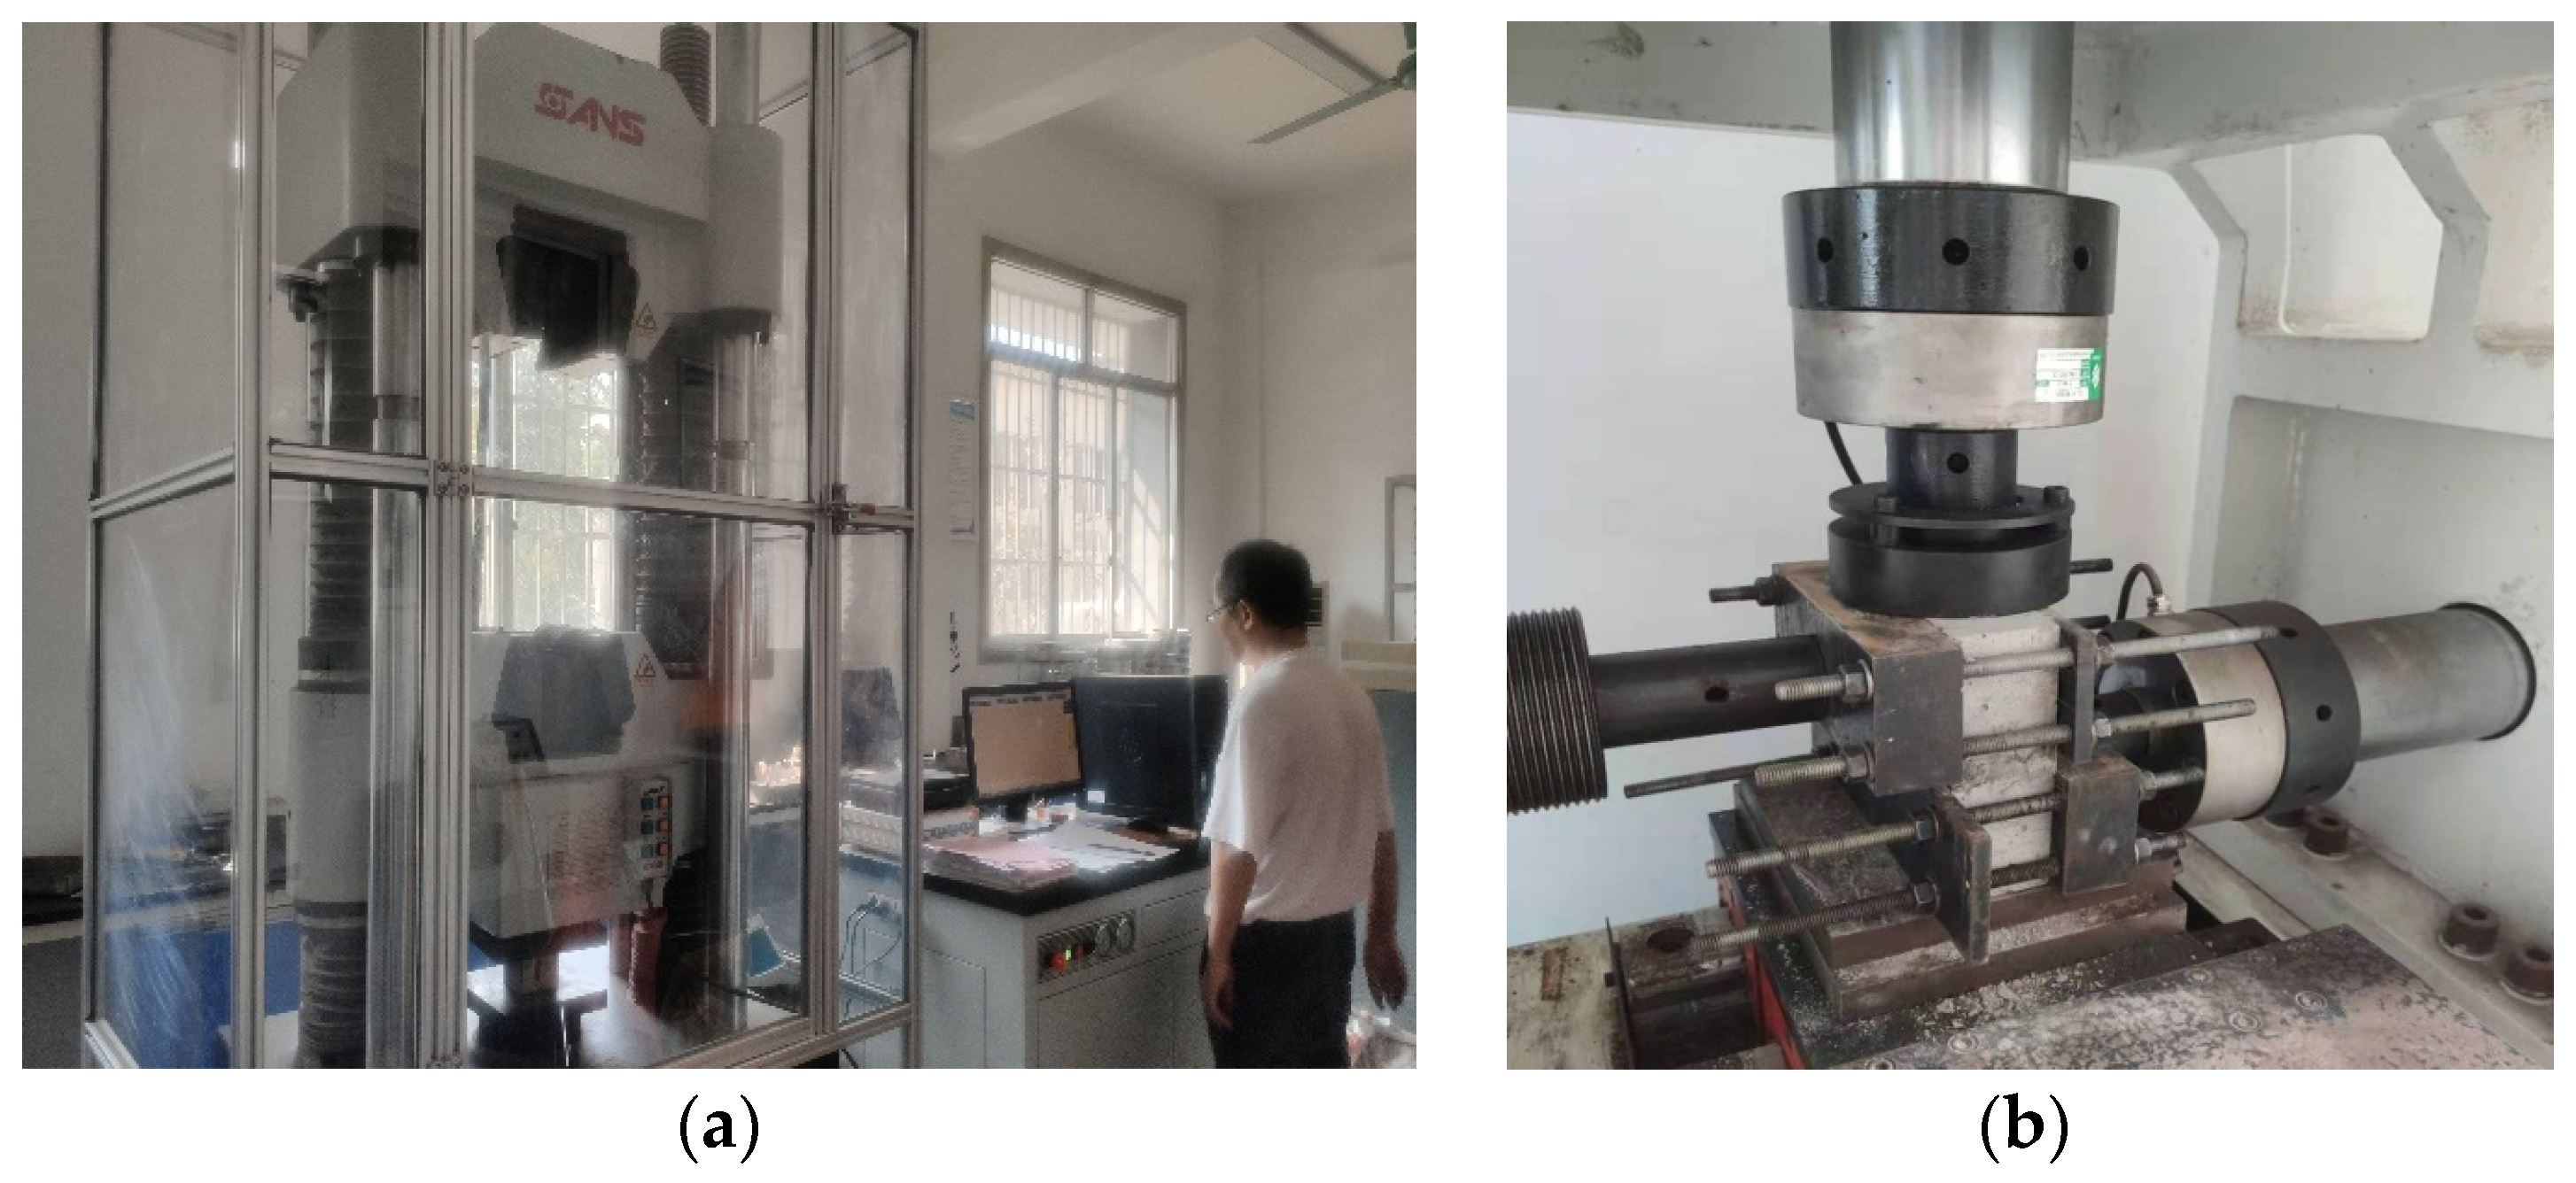
Material model samples of 70.7 mm × 70.7 mm × 70.7 mm were used for a compressive strength test, and material model samples of 150 mm × 150 mm × 50 mm with the paving seam materials were used for a shear strength test. The compressive and shear strengths were tested using a universal machine and a microcomputer-controlled electric stress-type rock shear instrument. Considering that no axial stress was present in the actual situation, the shear strength of the concrete and joint mortar was examined during the test process in order to analyze the bond performance between them.
During a shear test, normal stress is first applied to a predetermined level, and then the normal deformation is measured. When the difference between 2 normal deformation readings is less than 1%, a shear load is applied. During the shear process, the normal stress of the sample should be kept constant, the initial shear load rate should be 0.4 MPa/min, and the load and shear deformation values should be measured and recorded at appropriate loading intervals. When the horizontal deformation caused by the increased shear load is 1.5 times greater than that of the previous load, the shear load rate is halved, and the measurement interval is shortened until shear. The shear failure loads were recorded. The loading process of the specimens is shown in Figure 10.
(b) Microstructure analysis of paving seam materials
To further analyze the improvements in the properties of paving seams treated with an expansion agent, the internal structures of M20 and M20 with an 8% expansion agent were analyzed using a YG-97A capacitive mercury injection apparatus. The main measurements taken were pore volume and pore size distribution after treatment.
The capacitive mercury injection apparatus operates based on the principle of capillary pressure and the non-wettability of mercury on solid samples. Under the action of applied pressure, mercury is pressed into solid pores. The volume of mercury injected under different pressures can be measured to obtain the pore volume with the corresponding pore radius, according to Washburn’s [28] cylindrical pore model (as shown in Formula (3)). By measuring the pore volume, the pore size distribution curve (porosity) of the material can be obtained.
Cylindrical pore model:
where is the pressure of the mercury pressed into the pores (MPa), is the equivalent opening size (mm), is the surface tension coefficient of the mercury (mN/m), and is the contact angle between the mercury and the porous concrete material.
3. Analysis of Model Test Results
3.1. Statistics of Paving Seam Width
The survey statistics provided the paving seam widths of the precast concrete block slopes, as shown in Table 10. According to the data, the maximum widths of the level-direction, vertical-direction, and oblique-direction paving seams are 11.3 mm, 10.6 mm, and 15.8 mm, respectively. All of the seam widths are irregular, with the oblique-direction paving seam being slightly wider. Seam widths under 6 mm account for 11.7% of the total, seam widths between 6 mm and 15 mm account for 11.7% of the total, and seam widths between 15 mm and 20 mm account for 3.3% of the total. Based on these findings, the model test used three paving seam widths, namely 15 mm, 10 mm, and 5 mm, with corresponding model paving seam layouts of 1.5 mm, 1 mm, and 0.5 mm, respectively.
3.2. Variation Law of Pore Water Pressure
3.2.1. Variation Law of Pore Water Pressure at Different Positions
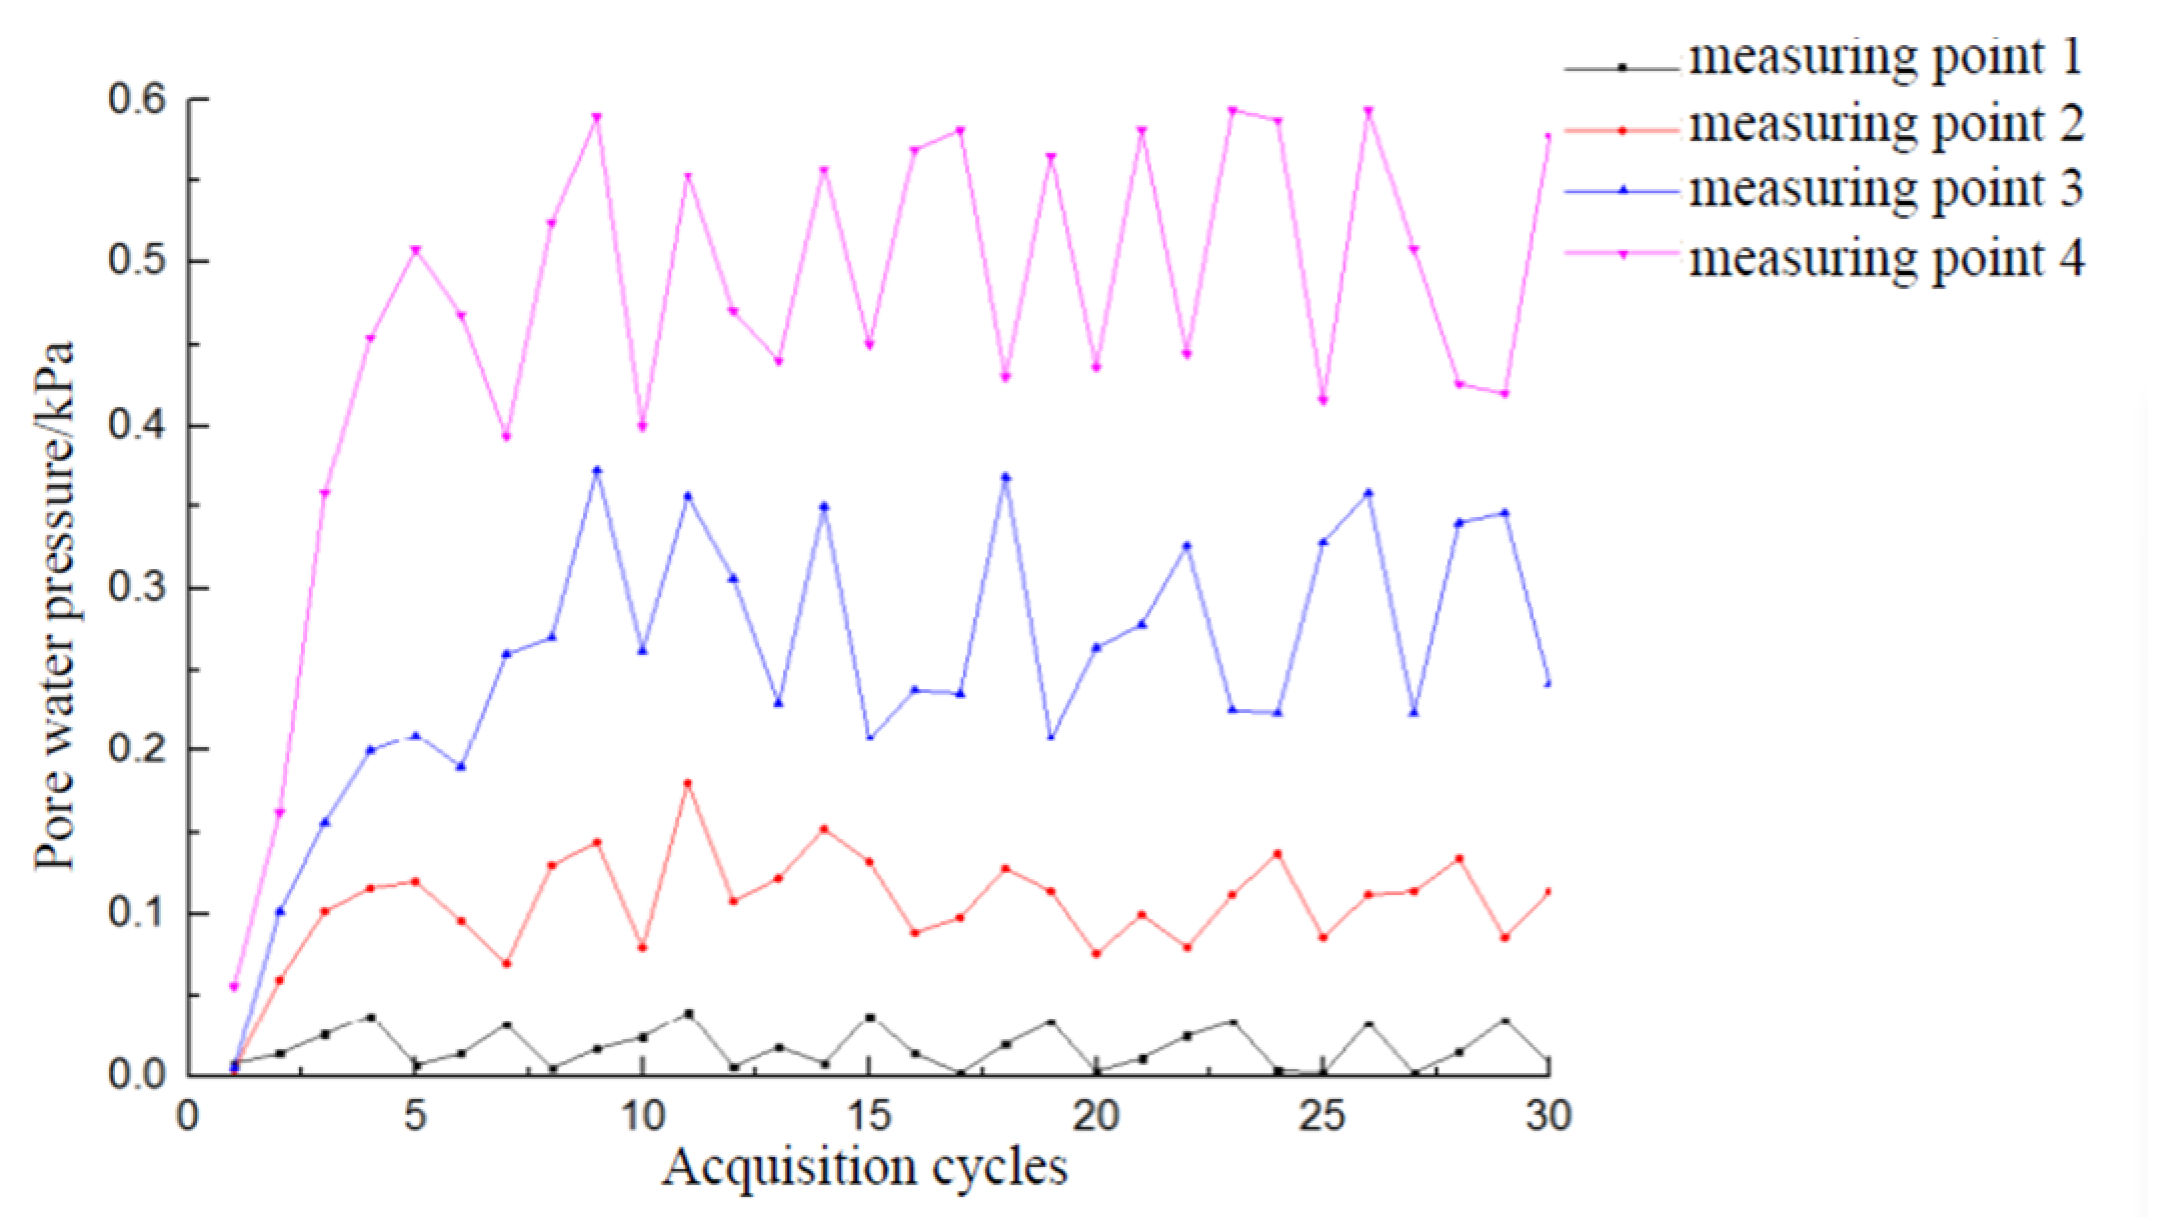
In total, five working conditions were tested. Overall, the pore water pressure changed in a manner similar to the wave period under different working conditions, with the difference mainly reflected in the water level in front of the embankment. For example, taking the strain value of the static resistance strain gauge in the first 30 acquisition cycles of working condition 4, Formula (1) was used to convert the pore water pressure, and the variation trend of the pore water pressure is shown in Table 11 and Figure 11. Based on the results, the following conclusions can be drawn:
(1) Under the condition of the same seam width and water level in front of the embankment, the variation pattern of pore water pressure at different positions of the cushion varied during the wave process. At measuring point 1, located at a vertical height of 330 mm from the dam, the pore water pressure changed during the wave process due to a maximum wave height of 0.12 m and a water level in front of the dam of 22.5 cm;
(2) At measuring point 2, located at a vertical height of 270 mm from the bottom of the embankment, the arrangement of the paving seams in the slope led to water seepage through the seams. The pore water pressure increased linearly from the first to the fifth wave periods, reaching 0.12 kPa in the fifth wave period and then fluctuating around 0.10 kPa;
(3) The pore water pressure at measuring point 3 at a vertical height of 210 mm from the bottom of the embankment and at measuring point 4 at a vertical height of 150 mm fluctuated greatly, and the pore water pressure at measuring point 4 was obviously greater than that at measuring point 3. The pore water pressure at measuring points 3 and 4 increased linearly from the first to the fifth wave periods, and it fluctuated from the sixth wave period. The pore water pressure at measuring point 3 fluctuated within the range of 0.29–0.46 kPa, and that at measuring point 4 fluctuated within the range of 0.49–0.68 kPa.
In conclusion, when the masonry joint width and the water level in front of the embankment were kept constant, the pore water pressure in the cushion was found to be influenced by the location of the pore water pressure gauge, which was consistent with the impact of wave climbing height on the cushion. However, since pore water penetrates upward slowly, the pore water pressure in the cushion above the water level in front of the embankment changed only slightly. For the cushion below the water level in front of the embankment, the pore water pressure differed at different measuring points. This was because the water pressure at different measuring points was influenced by the water level in front of the embankment, while the reciprocating cycle of waves affected the seepage time of water in the joint, resulting in an unsynchronized pore water pressure between different measuring points.
3.2.2. Variation Law of Pore Water Pressure at Different Levee Water Levels
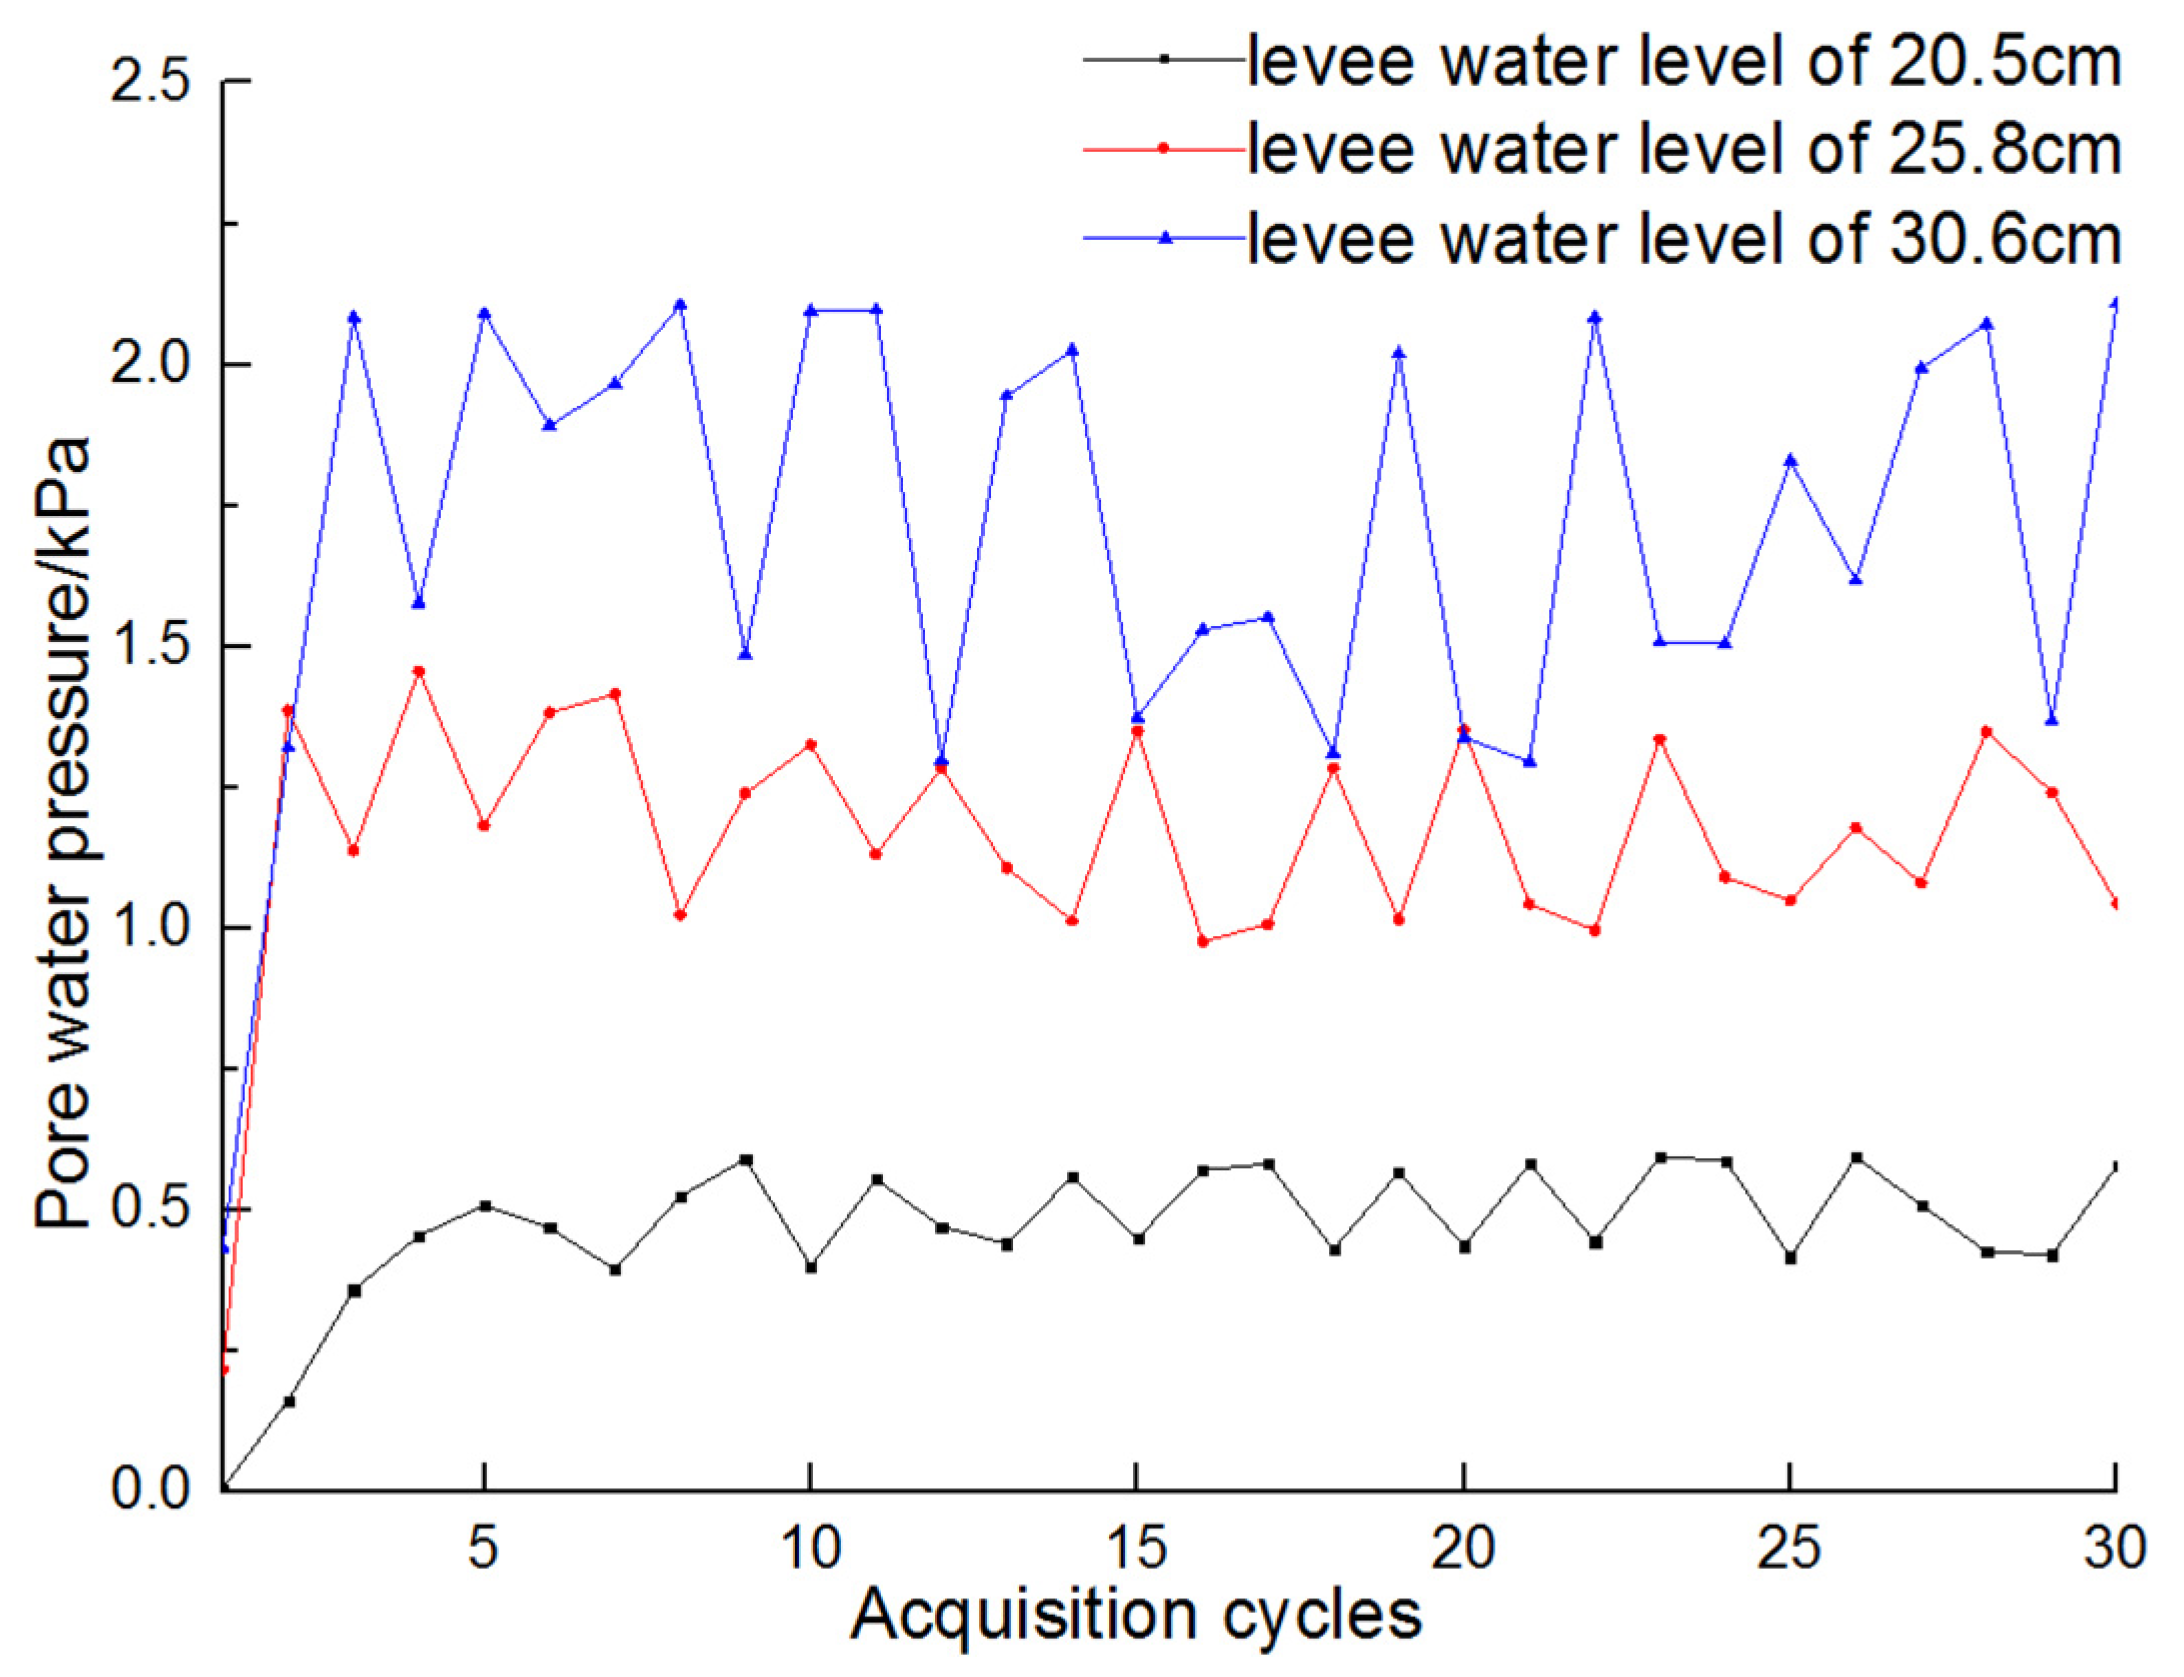
The changes in the pore water pressure under different levee water levels in working conditions 3 (crack width is 1.5 mm), 4, and 5 are shown in Table 12 and Figure 12. The pore water pressure at the three different water level measuring points fluctuates with the wave period. When the water level is 22.5 cm, the fluctuation range of the pore water pressure at measuring point 4 is 0.49–0.69 kPa. When the water level in front of the embankment is 27.6 cm, the fluctuation range of the pore water pressure at measuring point 4 is 1.1–1.5 kPa. When the water level in front of the embankment is 30.6 cm, the fluctuation range of the pore water pressure at measurement point 4 is 1.30–2.10 kPa.
Finally, when the seam width remains constant, the pore water pressure of the cushion at different water levels in front of the dike varies with the wave cycle. The larger the water level in front of the dike, the higher the measured pore water pressure and the greater the fluctuation range. This is because the wave water penetrates into the cushion through gaps, influenced by the static water pressure in front of the dike and the seepage pressure of waves, leading to a gradual increase in the original water pressure in the cushion. When the increasing water pressure cannot dissipate in time, the buried pore water pressure sensor reads a higher pore water pressure value. This explains why a higher water level in front of the embankment increases the likelihood of the cushion being affected by water pressure, causing sand to run and resulting in cushion hollowing over time. Therefore, when the water level in front of the dike is high, it is recommended to repair the fallen masonry joints as soon as possible to minimize the risk of cushion hollowing.
3.2.3. Variation Law of Pore Water Pressure at Different Paving Seam Widths
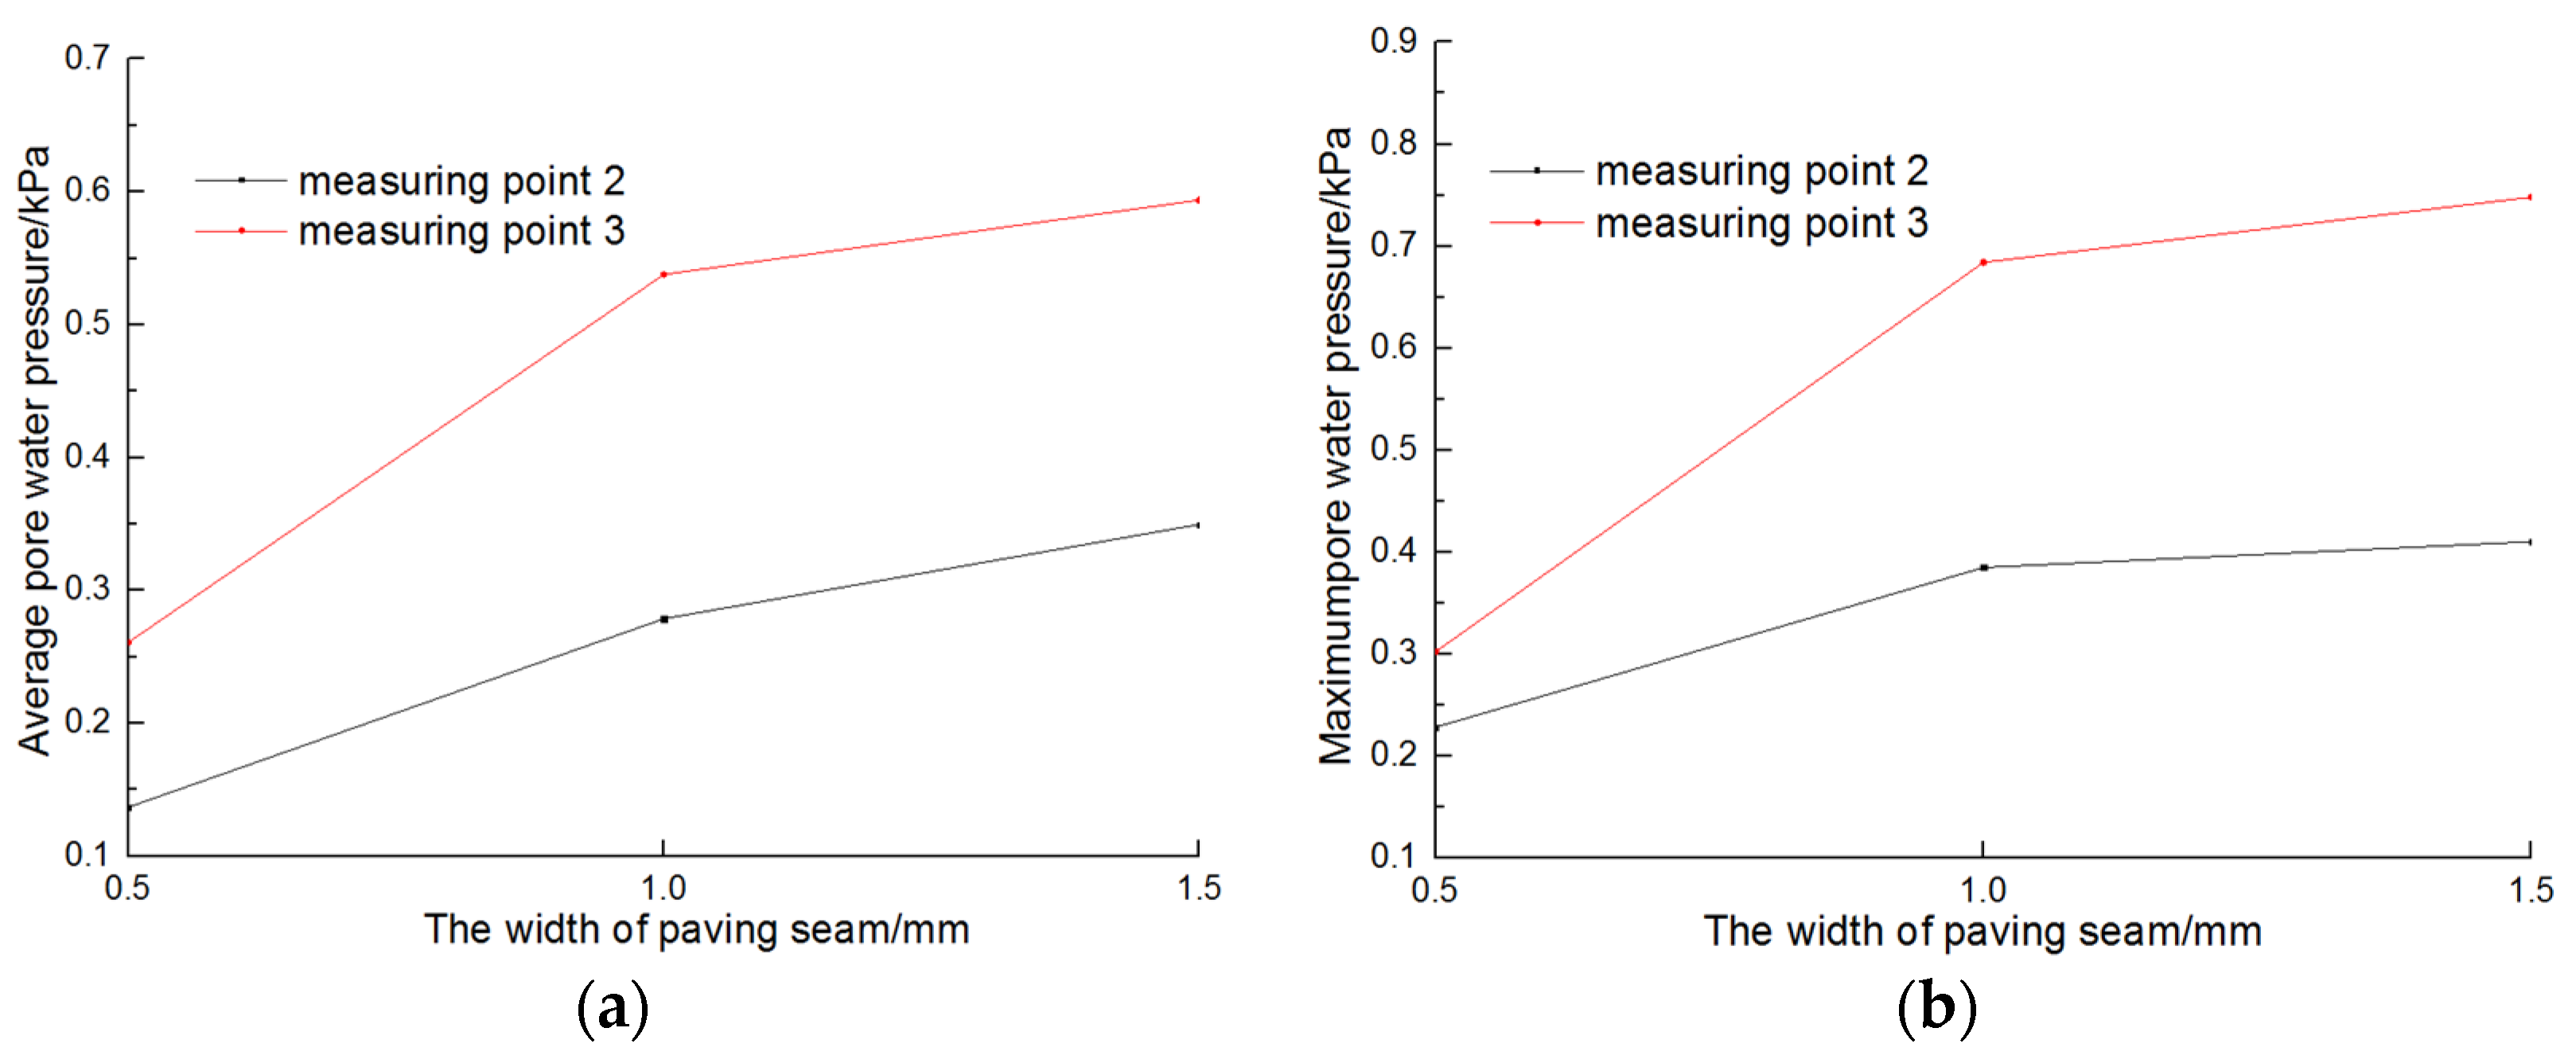
The changes in the average and maximum pore water pressures under different levee water levels under working conditions 1, 2, and 3 are shown in Figure 13. The following conclusions can be drawn:
(1) As the width of the paving seam increases, the pore water pressure values at measuring points 2 and 3 also increase. In addition, the maximum and average pore water pressure during the wave period range increase;
(2) The pore water pressure at measuring point 3 is consistently greater than that at measuring point 2 under various paving seam widths, as observed by comparing the average and maximum pore water pressure values at both points. This variation in pore water pressure is also consistent with the differences in pore water pressure observed at different positions;
(3) Comparing the maximum pore water pressure values at measuring points 2 and 3 with the same paving seam widths shows that the values at measuring point 2 are 0.397 kPa, 0.545 kPa, and 0.577 kPa, while those at measuring point 3 are 0.472 kPa, 0.844 kPa, and 0.913 kPa for paving seam widths of 0.5 mm, 1.0 mm, and 1.5 mm, respectively. The maximum pore water pressure at measuring point 2 increases by 37.3% from 0.5 mm to 1.0 mm and by 5.9% from 1.0 mm to 1.5 mm, while the maximum pore water pressure at measuring point 3 increases by 78.8% and 8.2%, respectively. The increase in pore water pressure at measuring points 2 and 3 is much more significant when the width of the paving seam changes from 0.5 mm to 1.0 mm compared to the changes observed in the range of 1.0–1.5 mm;
(4) When the paving seam width is the same, the average pore water pressure at measuring point 2 is compared to that at measuring point 3. The average pore water pressure values at measuring point 2 are 0.295 kPa, 0.427 kPa, and 0.508 kPa, while the average pore water pressure values at measuring point 3 are 0.420 kPa, 0.678 kPa, and 0.743 kPa for paving seam widths of 0.5 mm, 1.0 mm, and 1.5 mm, respectively. The average pore water pressure at measuring point 2 increases by 44.7% from 0.5 mm to 1.0 mm and by 19.0% from 1.0 mm to 1.5 mm, while the average pore water pressure at measuring point 3 increases by 61.4% and 9.6% for the same paving seam widths. The increase in average pore water pressure at measuring points 2 and 3 is much greater in the range of 0.5 mm to 1.0 mm than in the range of 1.0 mm to 1.5 mm.
From the above, it can be observed that under the same water level and paving seam width conditions, the average and maximum pore water pressures at the low position are higher than those at the high position. When the paving seam width increases from 0.5 mm to 1 mm, there is a significant difference in the increased amplitude of the maximum and average pore water pressures at measuring points, even though the width only increases by 0.5 mm. When the paving seam width is less than 1 mm, the maximum and average pore water pressures at the measuring points increase by about 50%. However, when the width is greater than 1 mm, the maximum and average pore water pressures increase by at least 10%. Therefore, it is recommended to control the joint width to be less than 1 cm during the process of laying precast concrete blocks, as this can help reduce the risk of cushion loss even if the cushion falls off during operation.
3.3. Compressive/Shear Strength of Paving Seam Materials
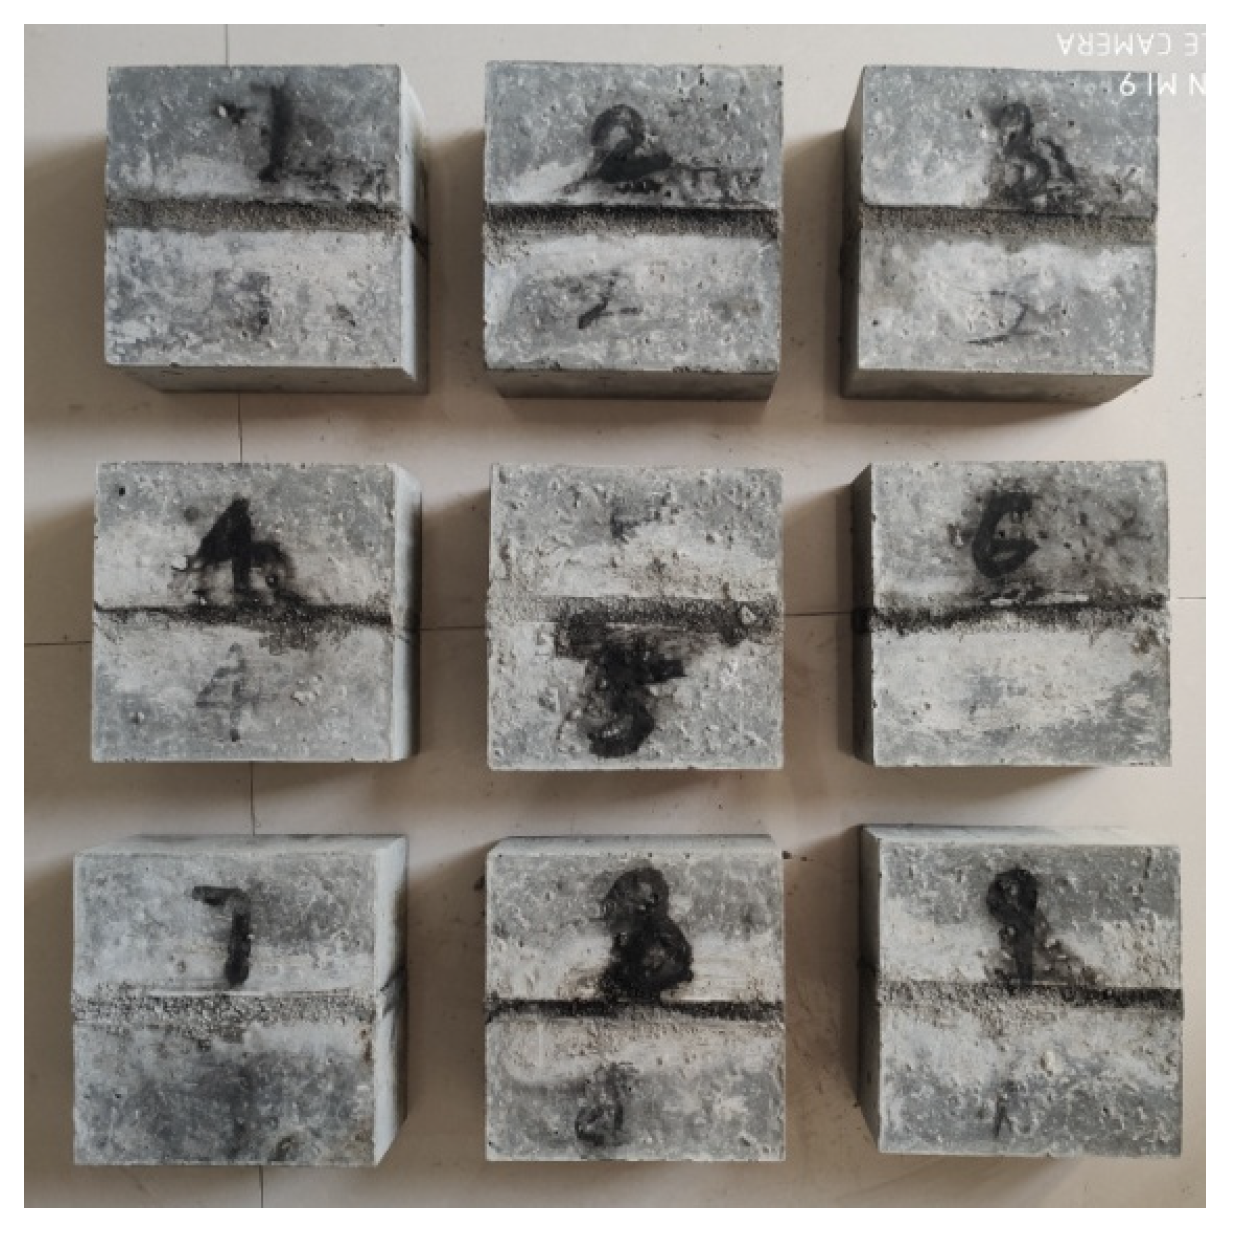
The results of the measured shear strength of the cemented surface are presented in Table 13. The experimental results show that the destructive development situation of mortar paving seams of different strength grades is almost the same, with destruction occurring in the paving seam. Upon examining the destroyed part of the mortar, it can be observed that the cement surface of the paving seam materials is well-poured, and the holes are relatively small, with no obvious impact on the strength. The findings reveal that the shear strength of the mortar paving seam materials increases with the mortar strength.
Comparing the M15 and M20 mortar paving seam materials indicates that the greater the mortar strength, the higher the shear strength. The results show that the mortar compressive strength increases by 23.5%, and the mortar shear strength increases by 32.5%. Furthermore, comparing M20 with M20 containing an 8% expansion agent, the compressive strength of the latter increases by 2.2%, and the mortar shear strength increases by 17.4%. Therefore, a reasonable amount of an expansion agent can lead to better pore distribution of the mortar of a cemented surface, improve the strength of mortar to a certain extent, and significantly enhance the shear strength of mortar.
3.4. Microstructure Analysis of Paving Seam Materials
In order to accurately reflect the field conditions, the experiment used samples obtained after the mortar paving seam shear test. However, the irregular shape of the mortar material after the test made it difficult to measure its apparent volume. As a result, the experiment only analyzed the pore size distribution of M20 and M20+. Pores were classified into four grades based on pore size: pores with a size of less than 20 nm were deemed harmless, pores with a size between 20 and 50 nm were considered less harmful, pores between 50 and 200 nm were regarded as harmful, and pores larger than 200 nm were labeled as very harmful [29].
Table 14 indicates that the addition of an expansion agent has a significant effect on the pore size distribution of the mortar, particularly on the percentages of multiple damaged holes and less damaged holes. The percentage of pore size distribution with harmful holes decreases from 57.4% to 41.6%, while that of less damaged holes increases from 12.7% to 30.5%, and that of harmful holes decreases from 27.9% to 25.9%. Overall, a reasonable amount of admixture makes the structure of the mortar more compact. This is due to the expansion agent promoting the growth of needle-stick ettringite Aft crystals in the mortar. As the content of the expansion agent increases, the number of needle-stick ettringite Aft crystals also increases, which results in a more compact contact surface between the concrete and the mortar due to the expansion effect. This is conducive to improving the shear strength of cemented surfaces.
4. Conclusions
In this study, a physical model of precast concrete blocks with different paving seam widths and joint materials was established to analyze the changes in pore water pressure under various positions, water levels, and paving seam widths through the use of embedded pore water pressure sensors. The aim was to provide suggestions for the width and material treatment of paving seams. Based on the results, the following conclusions can be drawn:
- (1)
- Pore water pressure is significantly affected by the position of the slope cushion, the water level in front of the embankment, and the width of the paving seam;
- (2)
- Control of the paving seam width to less than 1 cm is an effective measure for preventing cushion loss considering the influence of construction and other factors.
- (3)
- Paving seam plumpness and mortar strength are both crucial factors that affect the shear strength of the cemented surface of paving seam materials, and they have a mutual influence on each other;
- (4)
- Properly adding an expansion agent can improve the properties of mortar paving seam materials and significantly enhance the bond property between mortar and slope protection concrete.
Author Contributions
Conceptualization, F.C. and S.H.; methodology, F.C.; software, D.L.; validation, F.C., S.H. and Q.F.; formal analysis, Q.F.; investigation, L.J.; resources, F.C.; data curation, Z.H.; writing—original draft preparation, F.C.; writing—review and editing, F.C. and S.H.; visualization, D.L.; supervision, Z.H.; project administration, F.C.; funding acquisition, F.C. and S.H. All authors have read and agreed to the published version of the manuscript.
Funding
This work was supported by the Open Research Fund Projects of the Changjiang River Scientific Research Institute (CKWV20221027/KY), Open Research Fund Projects of Jiangxi Academy of Water Science and Engineering (2020GCZX05, 2021SKSG07), Water conservancy major science and technology project of Jiangxi Province (202325ZDKT23).
Data Availability Statement
Data will be made available upon request.
Conflicts of Interest
The authors declare no conflict of interest.
References
- SL634-2012; Standard for Acceptance and Evaluation of Construction Quality of Embankment Projects. CWP (China Water Power Press): Beijing, China, 2012.
- Kang, J. Deformation analysis and treatment suggestions of precast concrete block slope protection. Hebei Prov. Water Conserv. 2018, 10, 38. [Google Scholar]
- Li, B. Key points of construction technology of precast concrete slope protection for Henan Keji Dam. Heilongjiang Sci. Technol. Inf. 2016, 6, 196. [Google Scholar]
- Zhou, A. Damage reason, harm and prevention of slope protection of earth-rock dam. Henan Sci. Technol. 2014, 19, 176–177. [Google Scholar]
- Mikhnevich, E.I. Methodology for calculation of of rigidity in earth dam slope protection under conditions of wave impact. Sci. Tech. 2018, 12, 100–105. [Google Scholar] [CrossRef]
- Zhao, N.; Lu, H.; Zhang, R. The Coupling Effect of Pore Water Pressure and Pore Water Gravity in Unsaturated Soils under Rainfall Condition and Its Influence on Slope Stability. Geofluids 2022, 2022, 9492514. [Google Scholar] [CrossRef]
- Wang, X.; Xia, X.; Zhang, X.; Gu, X.; Zhang, Q. Probabilistic Risk Assessment of Soil Slope Stability Subjected to Water Drawdown by Finite Element Limit Analysis. Appl. Sci. 2022, 12, 10282. [Google Scholar] [CrossRef]
- Zheng, Z. Application of concrete block slope protection in hydraulic engineering. China’s Water Transp. 2011, 11, 140–141. [Google Scholar]
- Zheng, J.; Zhang, C.; Liu, C. Discussion on quality acceptance of laying joint width in precast concrete block slope protection project. China Water Transp. 2015, 15, 305–306. [Google Scholar]
- Liu, Y.; Zhang, W.; Zhang, L.; Zhu, Z.; Hu, J.; Wei, H. Probabilistic stability analyses of undrained slopes by 3D random fields and finite element methods. Geosci. Front. 2018, 9, 1657–1664. [Google Scholar] [CrossRef]
- Niu, D.; Han, S.; Li, X.; Li, B.; Ren, W. Mechanical property of asphalt with additive. J. Traffic Transp. Eng. 2016, 16, 8–16. [Google Scholar]
- Liu, D.; Chen, J.; Yue, W.; Zhang, Y. Stability Analysis of Reservoir Bank and Study on Landslide Control Measures—Taking Baiheqiao Reservoir in Kaixian County, Chongqing as an example. In Proceedings of the 8th International Symposium on Project Management, Beijing, China, 4–5 July 2020; pp. 223–236. [Google Scholar] [CrossRef]
- Seifan, M.; Mendoza, S.; Aydin, B. Effect of nano and micro iron oxide particles on the workability, strength and absorption rate of cement mortar containing fly ash. Eur. J. Environ. Civ. Eng. 2022, 26, 3898–3912. [Google Scholar] [CrossRef]
- Chen, H.; Wang, F.; Xu, G.; Guo, L. Laboratory Model Test of Eco-Concrete Slab Slope Protection. In Proceedings of the 8th International Conference on Civil Engineering, Nanchang, China, 4–5 December 2021; pp. 372–381. [Google Scholar] [CrossRef]
- Dan, L.; Zheng, C.; Qin, Y.; Bi, H.; Li, K.; Huang, J. Analysing the effects of the mesoscopic characteristics of mineral powder fillers on the cohesive strength of asphalt mortars at low temperatures. Constr. Build. Mater. 2014, 65, 330–337. [Google Scholar] [CrossRef]
- John, S.K.; Nadir, Y.; Girija, K. Effect of source materials, additives on the mechanical properties and durability of fly ash and fly ash-slag geopolymer mortar: A review. Constr. Build. Mater. 2021, 280, 122443. [Google Scholar] [CrossRef]
- Rocha, J.H.A.; Galarza, F.P. Mechanical Properties Evaluation of Render Mortars with Different Waterproof Additive Compositions. Key Eng. Mater. 2021, 6202, 161–167. [Google Scholar] [CrossRef]
- Savchenko, S.; Antoniuk, N. Assessment of the impact of modifier and filler on the physical and mechanical and operational properties of plastering mortars. IOP Conf. Ser. Mater. Sci. Eng. 2021, 1164, 012004. [Google Scholar] [CrossRef]
- Corinaldesi, V.; Nardinocchi, A.; Donnini, J. The influence of expansive agent on the performance of fibre reinforced cement-based composites. Constr. Build. Mater. 2015, 91, 171–179. [Google Scholar] [CrossRef]
- Feng, Y.; Yang, Q.; Chen, Q.; Kero, J.; Andersson, A.; Ahmed, H.; Engström, F.; Samuelsson, C. Characterization and evaluation of the pozzolanic activity of granulated copper slag modified with CaO. J. Cleaner Prod. 2019, 232, 1112–1120. [Google Scholar] [CrossRef]
- Polat, R.; Demirbog, R.; Khushefati, W.H. Effects of nano and micro size of CaO and MgO, nano-clay and expanded perlite aggregate on the autogenous shrinkage of mortar. Constr. Build. Mater. 2015, 81, 268–275. [Google Scholar] [CrossRef]
- Jia, Z.; Yang, Y.; Yang, L.; Zhang, Y.; Sun, Z. Hydration products, internal relative humidity and drying shrinkage of alkali activated slag mortar with expansion agents. Constr. Build. Mater. 2018, 158, 198–207. [Google Scholar] [CrossRef]
- GB175-2007; Common Portland Cement. CNSMC (China National Standardization Management Committee): Beijing, China, 2007.
- DL/T 5144-2015; Specifications for Hydraulic Concrete Construction. CNEA (China National Energy Administration): Beijing, China, 2015.
- CWP. Hydraulic Design Manual, 2nd ed.; China Water Power Press: Beijing, China, 2014. [Google Scholar]
- Guo, W.; Zhu, J.; Wen, Y. Unified description for four grading scale methods for coarse aggregate. Chin. J. Geotech. Eng. 2016, 38, 1473–1480. [Google Scholar]
- Wei, M. System Parameters Calculation and Software Design for Port Engineering Model Text. Ph.D. Thesis, Tianjin University of Technology, Tianjin, China, 2012. [Google Scholar]
- Brue, F.; Davy, C.A.; Skoczylas, F.; Burlion, N.; Bourbon, X. Effect of temperature on the water retention properties of two high performance concretes. Cem. Concr. Res. 2012, 42, 384–396. [Google Scholar] [CrossRef]
- Stovall, T.; de Larrard, F.; Buil, M. Linear packing density model of grain mixtures. Powder Technol. 1986, 48, 1–12. [Google Scholar] [CrossRef]
Figure 1.
The forming process of prefabricated blocks. (a) Brushing. (b) Mixing. (c) Pouring. (d) Forming. (e) Removing. (f) Curing.
Figure 1.
The forming process of prefabricated blocks. (a) Brushing. (b) Mixing. (c) Pouring. (d) Forming. (e) Removing. (f) Curing.

Figure 2.
Bond property test model.

Figure 3.
Pouring conditions of the test model. (a) Fix the position and shape of the paving seams. (b) Pour concrete on both sides of the paving seams. (c) Cure after demolding. (d) Pour cement mortar on paving seams.
Figure 3.
Pouring conditions of the test model. (a) Fix the position and shape of the paving seams. (b) Pour concrete on both sides of the paving seams. (c) Cure after demolding. (d) Pour cement mortar on paving seams.

Figure 4.
Specimen model after molding.

Figure 5.
Strain micropore water pressure gauge sensor.

Figure 6.
Plan of pore water pressure gauge.

Figure 7.
Profile view of precast concrete block slope.

Figure 8.
The laying process of precast concrete blocks. (a) Placing the sensors. (b) Laying the precast blocks. (c) Paving seam arrangement. (d) Finished model.
Figure 8.
The laying process of precast concrete blocks. (a) Placing the sensors. (b) Laying the precast blocks. (c) Paving seam arrangement. (d) Finished model.

Figure 9.
Acquisition system layout.

Figure 10.
Specimen loading process. (a) Compression test. (b) Shear strength test.

Figure 11.
Variation curves of pore water pressure at different measuring points under working condition 4.
Figure 11.
Variation curves of pore water pressure at different measuring points under working condition 4.

Figure 12.
Variation curves of pore water pressure at different levee levels.

Figure 13.
Graph of pore water pressure variation. (a) Average pore water pressure. (b) Maximum pore water pressure.
Figure 13.
Graph of pore water pressure variation. (a) Average pore water pressure. (b) Maximum pore water pressure.


Table 1.
Physical and mechanical properties of the cement.
| Specific Surface Area (m2/kg) | Initial Setting Time (min) | Final Setting Time (min) | Flexural Strength (MPa) | Compressive Strength (MPa) | |||
|---|---|---|---|---|---|---|---|
| 3 d | 28 d | 3 d | 28 d | ||||
| P.O 42.5 | 340 | 168 | 279 | 4.8 | 7.7 | 27.6 | 46.4 |
Table 2.
Physical and mechanical properties of HME.
| Density (g/cm3) | Specific Surface Area (m2/kg) | Initial Setting Time (min) | Final Setting Time (min) | Compressive Strength (MPa) | Restrained Expansion Rate (%) | |||
|---|---|---|---|---|---|---|---|---|
| 7 d | 28 d | 7 d | 28 d | |||||
| HME | 2.90 | 390 | 170 | 220 | 22.9 | 41.8 | 0.15 | 0.10 |
Table 3.
Chemical composition of HME (%).
| SiO3 | CaO | MgO | Fe2O3 | Al2O3 | K2O | Na2O | SO3 | |
|---|---|---|---|---|---|---|---|---|
| HME | 1.03 | 52.70 | 1.81 | 0.66 | 13.61 | 0.40 | 0.14 | 28.33 |
Table 4.
Grain composition of the natural medium sand.
| Aperture Size (mm) | 5.0 | 2.5 | 1.25 | 0.63 | 0.315 | 0.16 | <0.16 | Fineness Module |
|---|---|---|---|---|---|---|---|---|
| Cumulative Residue Amount (wt.%) | 1.5 | 5.2 | 11.9 | 39.2 | 90.5 | 98.0 | 100.0 | 2.9 |
Table 5.
Grain composition of the gravel.
| Aperture Size (mm) | 40 | 30 | 20 | 10 | 5 | <5.0 |
|---|---|---|---|---|---|---|
| Cumulative Residue Amount (wt.%) | 0 | 6.7 | 43.5 | 73.2 | 99.2 | 100.0 |
Table 6.
Mix proportions of cement paste samples (kg/m3).
| Cement | Sand | Water | Compressive Strength of 28 d/MPa | |
|---|---|---|---|---|
| C15 | 260 | 764 | 173 | 17.8 |
Table 7.
Mix proportions of paving seam treatment mortar (kg/m3).
| Cement | Water | Sand | Expanding Agent | W/b | |
|---|---|---|---|---|---|
| M15 | 400 | 350 | 1350 | / | 0.875 |
| M20 | 300 | 210 | 1350 | / | 0.70 |
| M20+ | 300 | 210 | 1350 | 24 | 0.70 |
Table 8.
Arrangement of pore water pressure gauge.
| Sensor Number | 1 | 2 | 3 | 4 |
|---|---|---|---|---|
| Vertical distance from the axis of the embankment top/mm | 360 | 510 | 660 | 810 |
| Vertical distance from the embankment bottom/mm | 330 | 270 | 210 | 150 |
Table 9.
Working conditions.
| Working Condition | The Width of Paving Seam/mm | Water Depth in Front of the Dam/cm | Actual Simulation of Wave Height/m | Wave Period/s |
|---|---|---|---|---|
| 1 | 0.5 | 27.6 | 0.15 | 1.875 |
| 2 | 1.0 | 27.6 | 0.15 | 1.875 |
| 3 | 1.5 | 27.6 | 0.15 | 1.875 |
| 4 | 1.5 | 22.5 | 0.12 | 1.875 |
| 5 | 1.5 | 30.6 | 0.17 | 1.875 |
Table 10.
The paving seam widths of precast concrete block slope from survey statistics.
| No. | The Width of Paving Seam/mm | No. | The Width of Paving Seam/mm | ||||
|---|---|---|---|---|---|---|---|
| Level Direction | Vertical Direction | Oblique Direction | level Direction | Vertical Direction | Oblique Direction | ||
| 1 | 7.5 | 6.7 | 11.2 | 11 | 8.3 | 7.6 | 13.5 |
| 2 | 5.8 | 6.9 | 13.2 | 12 | 10.2 | 6.7 | 10.3 |
| 3 | 8.4 | 9.3 | 10.7 | 13 | 9.6 | 6.9 | 11.3 |
| 4 | 9.6 | 8.2 | 15.8 | 14 | 7.9 | 7.9 | 15.2 |
| 5 | 7.6 | 10.5 | 5.2 | 15 | 11.3 | 8.2 | 9.5 |
| 6 | 7.7 | 9.5 | 5.5 | 16 | 8.7 | 9.3 | 9.6 |
| 7 | 5.5 | 8.6 | 10.6 | 17 | 6.8 | 10.1 | 9.8 |
| 8 | 6.9 | 6.9 | 5.9 | 18 | 10.6 | 10.6 | 5.7 |
| 9 | 10.9 | 8.3 | 11.3 | 19 | 5.9 | 8.8 | 7.6 |
| 10 | 7.3 | 7.8 | 12.5 | 20 | 6.9 | 7.6 | 9.8 |
Table 11.
Pore water pressure at different measuring points in working condition 4.
| Acquisition Cycles | Pore Water Pressure of Measuring Point/kPa | Acquisition Cycles | Pore Water Pressure of Measuring Point/kPa | ||||||
|---|---|---|---|---|---|---|---|---|---|
| 1 | 2 | 3 | 4 | 1 | 2 | 3 | 4 | ||
| 1 | 0.008 | 0.004 | 0.005 | 0.056 | 16 | 0.014 | 0.089 | 0.238 | 0.570 |
| 2 | 0.014 | 0.060 | 0.102 | 0.162 | 17 | 0.002 | 0.098 | 0.236 | 0.582 |
| 3 | 0.026 | 0.102 | 0.156 | 0.358 | 18 | 0.020 | 0.128 | 0.368 | 0.430 |
| 4 | 0.038 | 0.116 | 0.200 | 0.454 | 19 | 0.034 | 0.114 | 0.208 | 0.566 |
| 5 | 0.007 | 0.120 | 0.210 | 0.508 | 20 | 0.003 | 0.076 | 0.264 | 0.436 |
| 6 | 0.014 | 0.096 | 0.190 | 0.468 | 21 | 0.011 | 0.100 | 0.278 | 0.582 |
| 7 | 0.032 | 0.070 | 0.260 | 0.394 | 22 | 0.025 | 0.080 | 0.326 | 0.444 |
| 8 | 0.005 | 0.130 | 0.270 | 0.524 | 23 | 0.034 | 0.112 | 0.226 | 0.594 |
| 9 | 0.017 | 0.144 | 0.372 | 0.590 | 24 | 0.004 | 0.137 | 0.224 | 0.588 |
| 10 | 0.024 | 0.080 | 0.262 | 0.400 | 25 | 0.002 | 0.086 | 0.328 | 0.416 |
| 11 | 0.040 | 0.180 | 0.356 | 0.554 | 26 | 0.033 | 0.112 | 0.358 | 0.594 |
| 12 | 0.006 | 0.108 | 0.306 | 0.470 | 27 | 0.002 | 0.114 | 0.224 | 0.508 |
| 13 | 0.018 | 0.122 | 0.230 | 0.440 | 28 | 0.015 | 0.134 | 0.340 | 0.426 |
| 14 | 0.008 | 0.152 | 0.350 | 0.558 | 29 | 0.035 | 0.086 | 0.346 | 0.420 |
| 15 | 0.038 | 0.132 | 0.208 | 0.450 | 30 | 0.008 | 0.114 | 0.242 | 0.578 |
Table 12.
Pore water pressure at different levee levels.
| Acquisition Cycles | Pore Water Pressure of Different Levee Levels/kPa | Acquisition Cycles | Pore Water Pressure of Different Levee Levels/kPa | ||||
|---|---|---|---|---|---|---|---|
| 20.5 cm | 25.8 cm | 30.6 cm | 20.5 cm | 25.8 cm | 30.6 cm | ||
| 1 | 0.006 | 0.216 | 0.432 | 16 | 0.570 | 0.976 | 1.529 |
| 2 | 0.162 | 1.386 | 1.320 | 17 | 0.582 | 1.007 | 1.551 |
| 3 | 0.358 | 1.137 | 2.084 | 18 | 0.430 | 1.284 | 1.310 |
| 4 | 0.454 | 1.456 | 1.576 | 19 | 0.566 | 1.015 | 2.019 |
| 5 | 0.508 | 1.182 | 2.090 | 20 | 0.436 | 1.352 | 1.338 |
| 6 | 0.468 | 1.382 | 1.891 | 21 | 0.582 | 1.043 | 1.295 |
| 7 | 0.394 | 1.415 | 1.966 | 22 | 0.444 | 0.996 | 2.084 |
| 8 | 0.524 | 1.023 | 2.106 | 23 | 0.594 | 1.335 | 1.507 |
| 9 | 0.590 | 1.239 | 1.485 | 24 | 0.588 | 1.090 | 1.504 |
| 10 | 0.400 | 1.325 | 2.094 | 25 | 0.416 | 1.049 | 1.828 |
| 11 | 0.554 | 1.131 | 2.097 | 26 | 0.594 | 1.178 | 1.616 |
| 12 | 0.470 | 1.284 | 1.298 | 27 | 0.508 | 1.080 | 1.994 |
| 13 | 0.440 | 1.107 | 1.944 | 28 | 0.426 | 1.348 | 2.072 |
| 14 | 0.558 | 1.013 | 2.025 | 29 | 0.420 | 1.241 | 1.367 |
| 15 | 0.450 | 1.350 | 1.373 | 30 | 0.578 | 1.043 | 2.109 |
Table 13.
Shear strength of the cemented surface.
| Grade | Serial Number | Mortar Strength/MPa | Measured Value of Mortar Strength/MPa | Average Shear Strength/MPa |
|---|---|---|---|---|
| M15 | 1 | 17.2 | 0.86 | 0.82 |
| 2 | 0.79 | |||
| 3 | 0.82 | |||
| M20 | 4 | 22.5 | 1.25 | 1.23 |
| 5 | 1.24 | |||
| 6 | 1.21 | |||
| M20+ | 7 | 23.0 | 1.46 | 1.49 |
| 8 | 1.48 | |||
| 9 | 1.52 |
Table 14.
Pore size distribution of M20 and M20+ mortars.
| Classes of Mortar | Materials of Paving Seam | Pore Size Distribution/% | ||
|---|---|---|---|---|
| Less Damaged Holes 20–50 μm | Harmful Holes/50–200 μm | Very Harmful Holes/over 200 μm | ||
| M20 |  | 12.70% | 27.90% | 57.40% |
| M20+ |  | 30.50% | 25.90% | 41.60% |
Disclaimer/Publisher’s Note: The statements, opinions and data contained in all publications are solely those of the individual author(s) and contributor(s) and not of MDPI and/or the editor(s). MDPI and/or the editor(s) disclaim responsibility for any injury to people or property resulting from any ideas, methods, instructions or products referred to in the content. |
© 2023 by the authors. Licensee MDPI, Basel, Switzerland. This article is an open access article distributed under the terms and conditions of the Creative Commons Attribution (CC BY) license (https://creativecommons.org/licenses/by/4.0/).
Share and Cite
MDPI and ACS Style
Chen, F.; Hu, S.; Fang, Q.; Ju, L.; Liu, D.; Huang, Z. Research on Improvement of Slope Protection Concrete Precast Block Joints Based on Physical Model Experiment. Water 2023, 15, 1874. https://doi.org/10.3390/w15101874
AMA Style
Chen F, Hu S, Fang Q, Ju L, Liu D, Huang Z. Research on Improvement of Slope Protection Concrete Precast Block Joints Based on Physical Model Experiment. Water. 2023; 15(10):1874. https://doi.org/10.3390/w15101874
Chicago/Turabian StyleChen, Fang, Songtao Hu, Qinghe Fang, Liehong Ju, Da Liu, and Zhe Huang. 2023. "Research on Improvement of Slope Protection Concrete Precast Block Joints Based on Physical Model Experiment" Water 15, no. 10: 1874. https://doi.org/10.3390/w15101874
Note that from the first issue of 2016, this journal uses article numbers instead of page numbers. See further details here.