
Bamboo-Activated Carbon Synthesized by One-Pot Pyrolysis and FeCl2 Activation for the Removal of Cr(VI) in Aqueous Solutions

Key Laboratory of Bamboo and Rattan Science & Technology, International Center for Bamboo and Rattan, Beijing 100102, China
*
Author to whom correspondence should be addressed.
Water 2023, 15(10), 1891; https://doi.org/10.3390/w15101891
Submission received: 31 March 2023
/
Revised: 4 May 2023
/
Accepted: 11 May 2023
/
Published: 16 May 2023
(This article belongs to the Section Wastewater Treatment and Reuse)
Abstract
:The present study utilized a FeCl2-based environmentally sustainable activation technique to produce activated carbon from bamboo. The research aimed to evaluate the influence of activation temperature on the physical and chemical characteristics of the activated carbon and its ability to adsorb Cr(VI). The results of the experiment indicated that the yield of activated carbon prepared by this method was in the range of 25.5–37.5%, which was comparatively higher than the yield obtained through traditional KOH and steam activation techniques. Moreover, this method resulted in a well-developed pore structure with pore sizes primarily ranging from 0.5 nm to 1.0 nm. A gradual increase in the specific surface area and pore volume was observed with an increase in the activation temperature. The maximum values of 1290.9 m2/g and 0.67 m3/g for specific surface area and pore volume, respectively, were achieved at an activation temperature of 900 °C. The adsorption capacity of Cr(VI) was subject to variation in correspondence with alterations in the pore structure of activated carbon. The maximum adsorption capacity recorded was 13.65 mg/g. This suggested that the adsorption capability was predominantly influenced by the pore configuration. The study of kinetics and isothermal adsorption indicates that the quasi-second-order kinetic model was a more effective approach for characterizing the adsorption process of Cr(VI) on activated carbon. Additionally, the Freundlich model demonstrated superior fitting performance compared to the Langmuir model.
1. Introduction
Hexavalent chromium (Cr(VI)) exhibits a high degree of reactivity and possesses potent oxidative properties that could result in considerable harm to both the environment and the well-being of humans. It can enter the human body through the skin, respiratory tract, and esophagus. Within the body, it is transferred to the kidney and liver through the blood, which can lead to DNA damage and carcinogenesis [1,2,3]. The WHO has established stringent regulations regarding the permissible levels of chromium (VI) in potable water. As per the guidelines set forth by the WHO, the upper limit for the concentration of Cr(VI) ought not to surpass 0.05 mg per liter [4]. The United States EPA has established a regulatory threshold for the aggregate chromium concentration in potable water, set at 0.1 mg per liter [5]. The implementation of these guidelines is crucial to ensure that drinking water is safe for human consumption. The well-being and safety of the human population is at stake due to the existence of Cr(VI) in liquid solutions. Therefore, it is essential to take measures to effectively remove Cr(VI) from water and protect public health. Researchers have developed a variety of methods to remove chromium from water, such as photocatalysis [6], redox [7], membrane separation [8], adsorption [9], and biological treatment methods [10]. Adsorption has gained popularity as a method of choice for the removal of Cr(VI) from liquid solutions owing to its economical and effective nature [11].
Activated carbon has attracted significant attention as an adsorbent owing to its affordable price tag, favorable stability in both physical and chemical properties, abundant raw materials, and well-developed pore structure [12,13,14]. Physical and chemical activation methods are typically used to prepare activated carbon. The preparation process generally includes two phases: (1) a carbonization phase, in which the raw material is pyrolyzed into a carbon precursor with fewer pores; (2) an activation phase, in which developed pores are generated through the action of an activator [15]. The activation methods are relatively complex processes that consume high energy. In addition, using corrosive and toxic chemical activators such as KOH, ZnCl2, and H3PO4 for activation requires expensive equipment and produces difficult-to-treat wastewater. New activation methods, such as template methods, are difficult to carry out at industrial scale due to their high costs. Therefore, developing green and environmentally friendly activated carbon preparation methods is increasingly important. In recent years, iron salt activators have been used to prepare activated carbon because of their low pollution, low corrosion, low cost, and simple activation process. Studies show that FeCl2 is similar to FeCl3 and ZnCl2, thereby facilitating the dehydration and aromatization of biomass while impeding the formation of tar that could obstruct pores [16,17,18,19]. Moreover, FeCl2 is better able to impregnate raw materials than FeCl3, which is more conducive to activation [20]. Yet, the technology of soaking, drying in the air, and then activating has not been studied.
Bamboo was employed as a raw material in this work to manufacture activated carbon by one-pot pyrolysis and FeCl2 activation. The preparation process is simpler and more environmentally friendly than other multistep methods. The effect of pyrolysis temperature on physicochemical parameters and mechanism was investigated in detail. Batch adsorption experiments were conducted to assess the efficiency of Cr(VI) removal and to examine the adsorption isotherms and kinetics.
2. Materials and Methods
2.1. Materials
The bamboo specimens for the study were gathered through the Anhui Tai-ping Experimental Center of the International Center for Bamboo and Rattan Germplasm Re-source Base. The required chemicals, including FeCl2·4H2O and K2Cr2O7, were procured from Sinopharm Chemical Reagent Co. Ltd. (Shanghai, China). The preparation of all solutions used in the study was carried out using water that had been deionized in the laboratory.
2.2. Preparation of Activated Carbon
Air-dried bamboo samples were crushed, ground, and sieved to 40–60 mesh. An amount of 12.5 g of FeCl2·4H2O was first dissolved in 30 mL of water that had been deionized to obtain an FeCl2 solution. To activate, a quantity of 5 g of bamboo powder was first soaked in the FeCl2 solution for a period of 24 h. Then, the impregnated bamboo powder was transferred to an oven and dried at a temperature of 60 °C until a constant weight was reached. The mixture (FeCl2/bamboo) was heated in a tube furnace for 1 h at the set temperature (700–1000 °C) under continuous N2 flow (0.1 L/min) with an average heating rate of 10 °C/min. Throughout the entire procedure, the temperature was kept at the same level. The samples were allowed to cool to room temperature before being immersed in 1 M hydrochloric acid. Subsequently, the specimens underwent multiple rinses with deionized water until the pH of the rinsate stabilized at a consistent level (pH 7). Following this, the samples were subjected to desiccation in an oven set at a temperature of 105 °C. The products acquired were assigned the label ACFeX, where the symbol X represents the temperature of activation.
2.3. Characterization
The thermal properties of bamboo powder and activated carbon were evaluated using a synchronous thermal analyzer (TG-DSC, STA 449F3, Netzsch, Selb, Germany) under a nitrogen atmosphere, employing an average heating rate of 10 °C/min, over a temperature that varied from 30 °C to 1000 °C. A scanning electron microscope (SEM, ZEISS Gemini 300, Carl ZEISS, Jena, Germany) and a transmission electron microscope (TEM, JEM-2100, JEOL, Tokyo, Japan) were utilized in order to investigate the topography of the surfaces of both the raw materials and finished products. With the goal to ascertain the degree of porosity exhibited by activated carbons, N2 adsorption–desorption isotherms were conducted at a temperature of 77 Kelvin, utilizing a surface area analyzer manufactured by Quanta chrome/Autosorb-iQ in the United States. The utilization of the Brunauer–Emmett–Teller (BET) equation was employed to investigate the specific surface area, commonly referred to as SBET. Density functional theory, abbreviated as DFT, was applied in order to compute the mean pore size, denoted by Dp, as well as the pore size distributions. A suitable hypothetical pore model was selected after the nitrogen adsorption curve was obtained. Subsequently, the simulation curve was derived through the utilization of DFT theory, while the calculation of the pore size distribution was accomplished via the non-negative least square method. The determination of the overall pore volume (Vtot) was carried out utilizing the N2 adsorption volume at a designated pressure ratio of P/P0 = 0.99. The t-plot method was employed to determine the micropore surface area (Smic) and pore volume (Vmic). The BJH method was employed to compute the values of mesoporous surface area (Smes) and pore volume (Vmes). The examination of the functional groups of the products was conducted via Fourier-transform infrared spectroscopy (FTIR) utilizing a Thermo Electron Corporation apparatus located in the United States. The spectral range utilized for scanning was 400–4000 cm−1, with a resolution of 4 cm−1. X-ray diffractometry (XRD, D8ADVANCE, Bruker, Karlsruhe, Germany) was utilized to analyze the crystal structures of the products. The experimental protocol involved setting the scanning rate at 0.2° s−1 and conducting an analysis within the range of 5° to 60° under Cu-Kα radiation (λ = 1.541 Å).
2.4. Adsorption Experiments
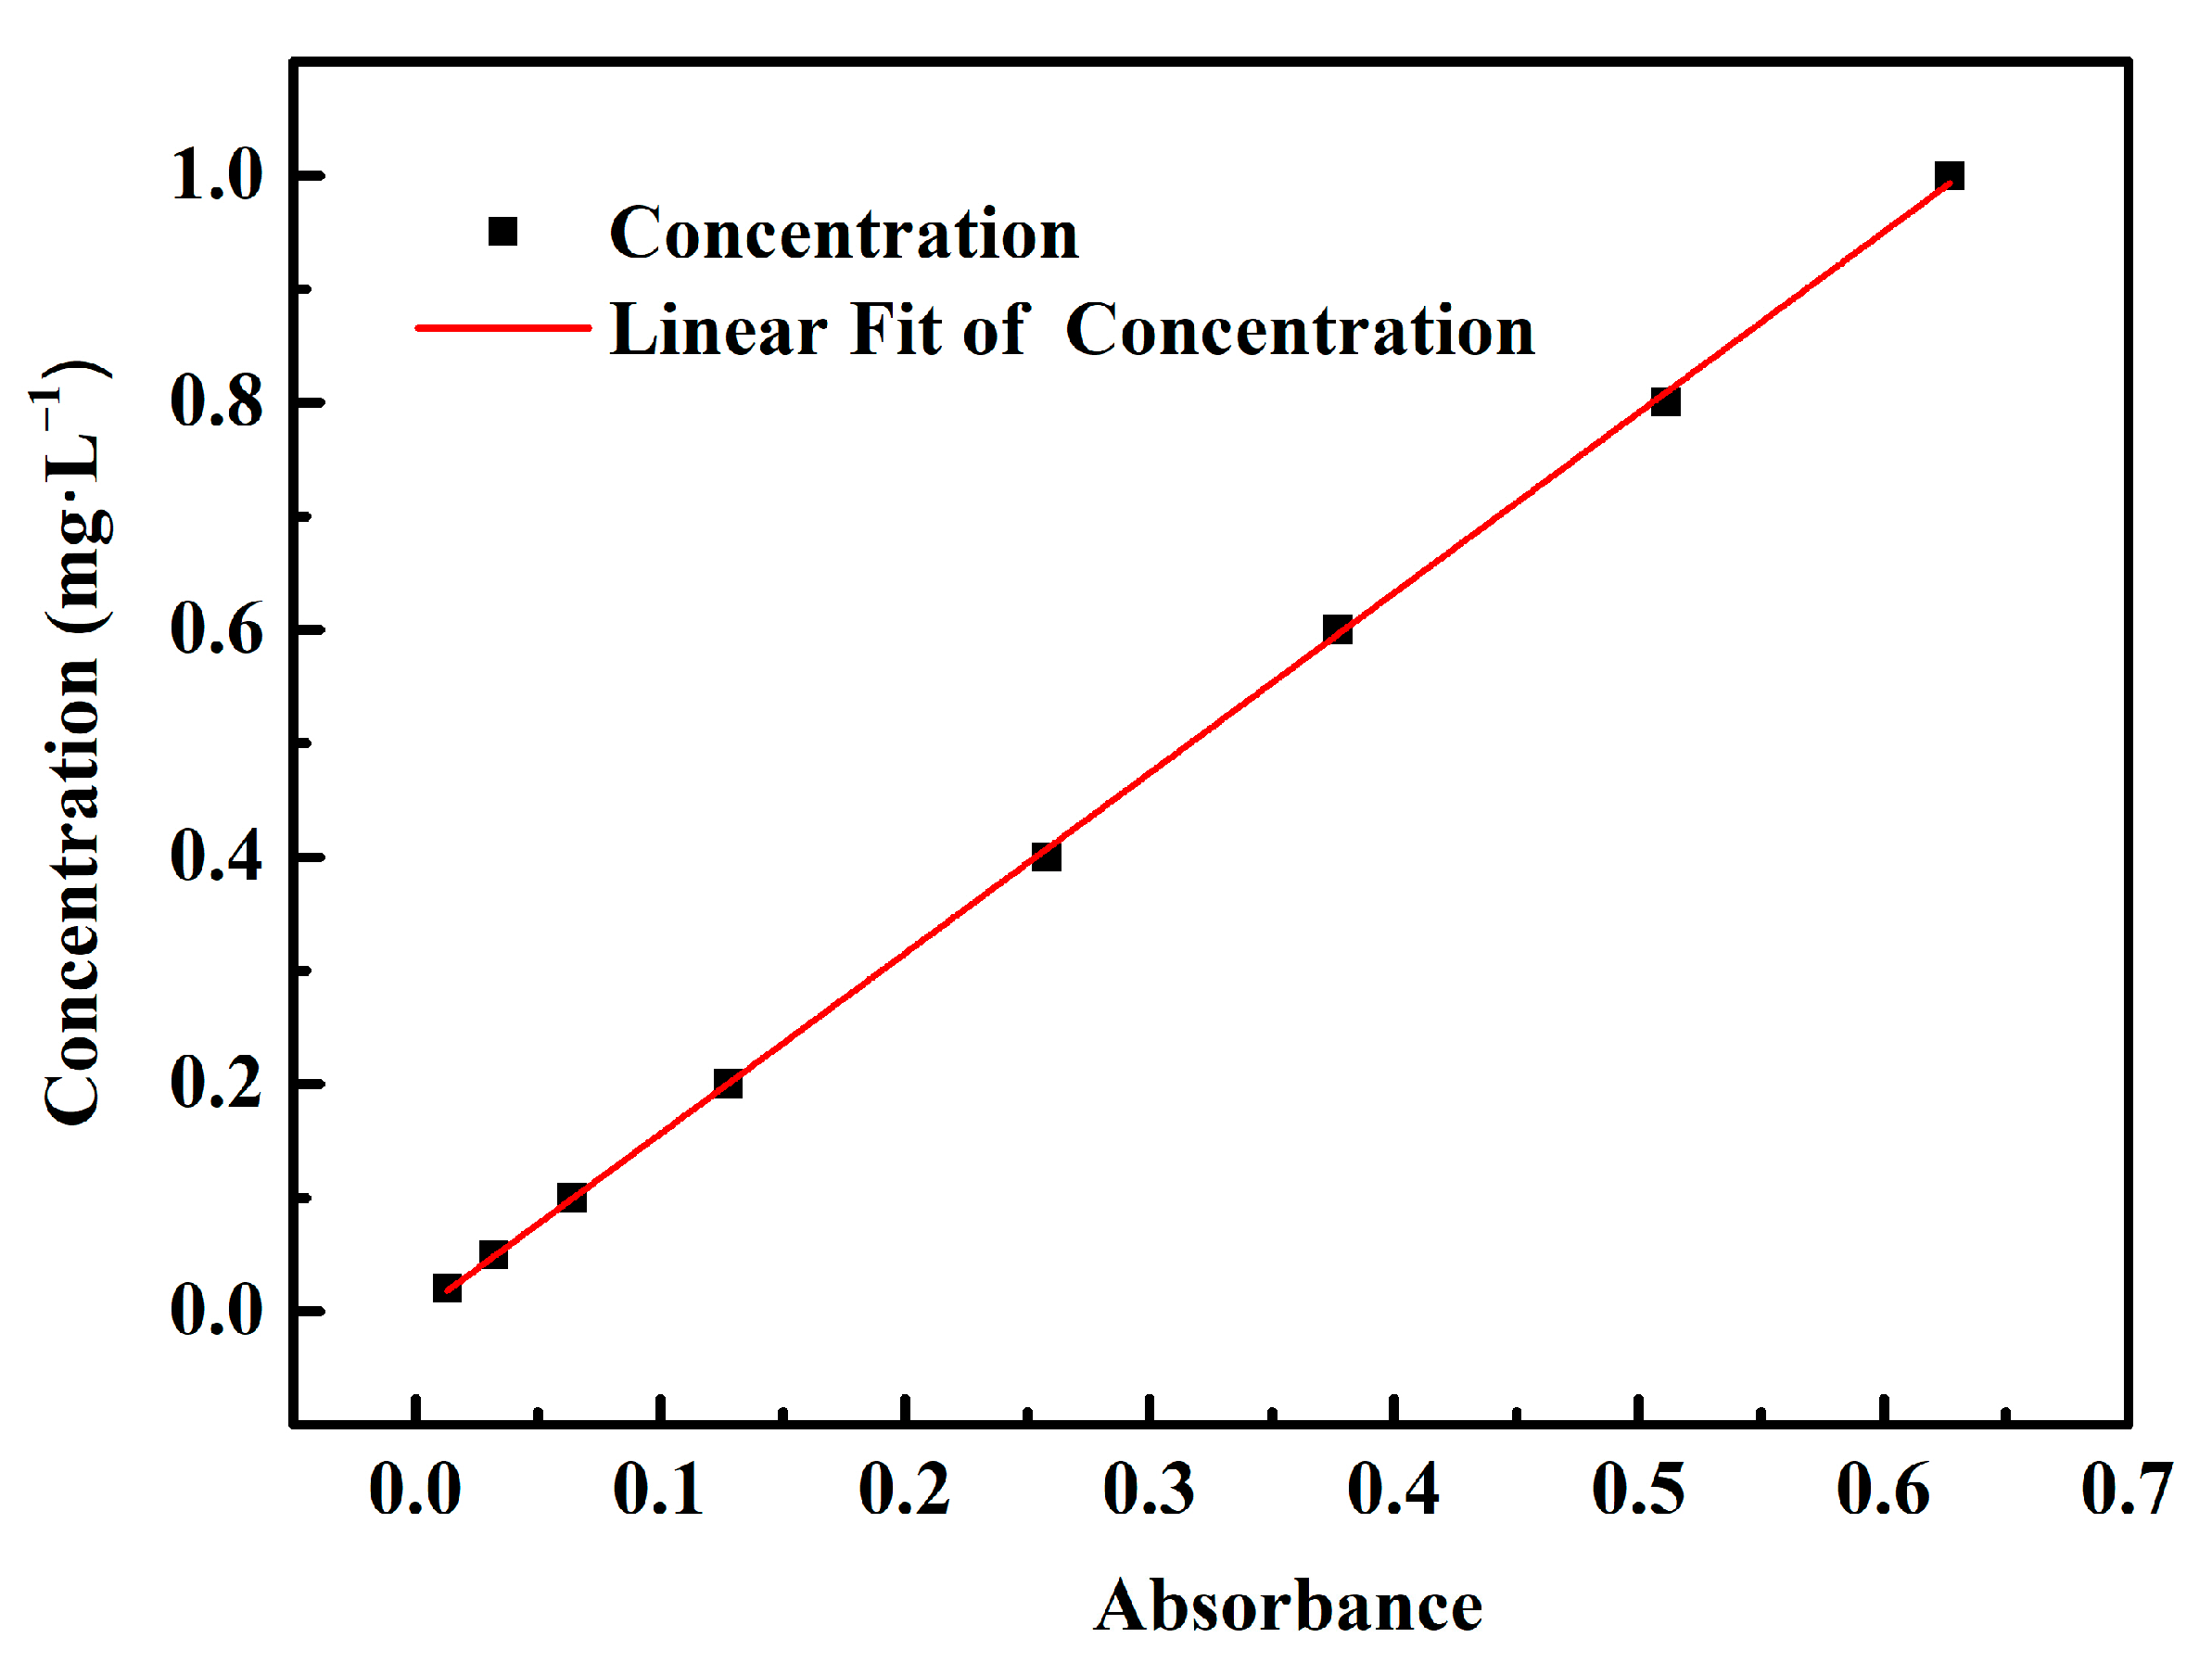
Activated carbon (100 mg) and a solution containing Cr(VI) at a concentration of 20 mg/L (100 mL) was added to conical flask. In a thermostatic water bath oscillator, the mixtures were shaken for 240 min at 25 °C and 150 rpm. Then, the solutions were subjected to filtration utilizing filter membranes with a pore size of 0.45 μm. The solutions that remained were evaluated for their Cr(VI) concentration through the use of UV-Vis spectrophotometry (UV-754, Shanghai, China) at 540 nm absorption maximum, according to the standard curve of Cr(VI) concentration (Figure 1). Subsequently, the adsorption capacity was calculated. The investigation performed an analysis on the kinetics of adsorption at a concentration of 20 mg/L. The duration of adsorption was altered between 30 min and 240 min. The study investigated the isothermal adsorption procedure at a temperature of 25 °C, employing diverse adsorption concentrations within the range of 20 mg/L to 50 mg/L. In order to obtain the standard curve of Cr(VI), a series of Cr(VI) standard solutions were tested. These solutions included concentrations of 0 mg/L, 0.05 mg/L, 0.1 mg/L, 0.2 mg/L, 0.4 mg/L, 0.6 mg/L, 0.8 mg/L, and 1.0 mg/L. The resulting standard curve is depicted in Figure 1, and the linear regression equation for the curve is y = −0.0026 + 1.5874x, with an R2 value of 0.9998.
3. Results and Discussion
3.1. Thermal Analysis
Bamboo comprises cellulose, hemicelluloses, and lignin as its primary constituents, each with distinct pyrolysis temperature ranges of 315–400 °C, 220–315 °C, and 160–900 °C, respectively [21]. As shown in Figure 2a, the process of pyrolyzing bamboo powder can be broken down into three distinct stages. During the initial phase, the sample underwent a weight reduction of 3.15% as a result of dehydration, transpiring at temperatures below 200 °C. In the subsequent phase, occurring within the temperature interval of 200–400 °C, a marked reduction in the TG profile was observed, leading to a 69.63% reduction in mass. This phase represents the primary period of mass reduction. The last stage was observed at a temperature exceeding 400 °C, during which a minor reduction in mass (10.76%) was observed, and the curve demonstrated a tendency to plateau at temperatures surpassing 600 °C. This phase primarily corresponds to the breakdown of lignin, as stated in reference [22].
The pyrolysis processes of bamboo powder (Figure 2a) and FeCl2/bamboo powder (Figure 2b) were obviously different. FeCl2/bamboo powder had a significant mass loss (16.7%) at below 200 °C that was much higher than that of untreated bamboo powder because iron cations catalyzed the dehydration of cellulose [16]. The observed reduction in mass within the temperature range of 200–600 °C was determined to be 23.2%. This phenomenon can be attributed primarily to the progressive degradation of cellulose, hemicelluloses, and lignin. The mass loss was 28.2% at above 600 °C. The fastest mass loss occurred, and the activation reaction was the most intense, near 700 °C. Therefore, the temperature required for activation falls within the range of 700 to 1000 °C.
Figure 2c displays the yield of bamboo-activated carbon produced at different temperatures. Increasing the activation temperature from 700 °C to 1000 °C resulted in a drop in yield from 37.5% to 25%. The yield of bamboo-activated carbon was found to vary depending on the method of preparation. Specifically, bamboo-activated carbon produced through KOH activation exhibited a yield range of 7.1–19.6%, while that produced through steam activation exhibited a yield range of 6.15–26.9% [23,24,25,26,27,28]. The utilization of FeCl2 activation has been observed to result in a greater yield of activated carbon in comparison to conventional methods such as KOH and steam activation.
3.2. Morphology Analysis
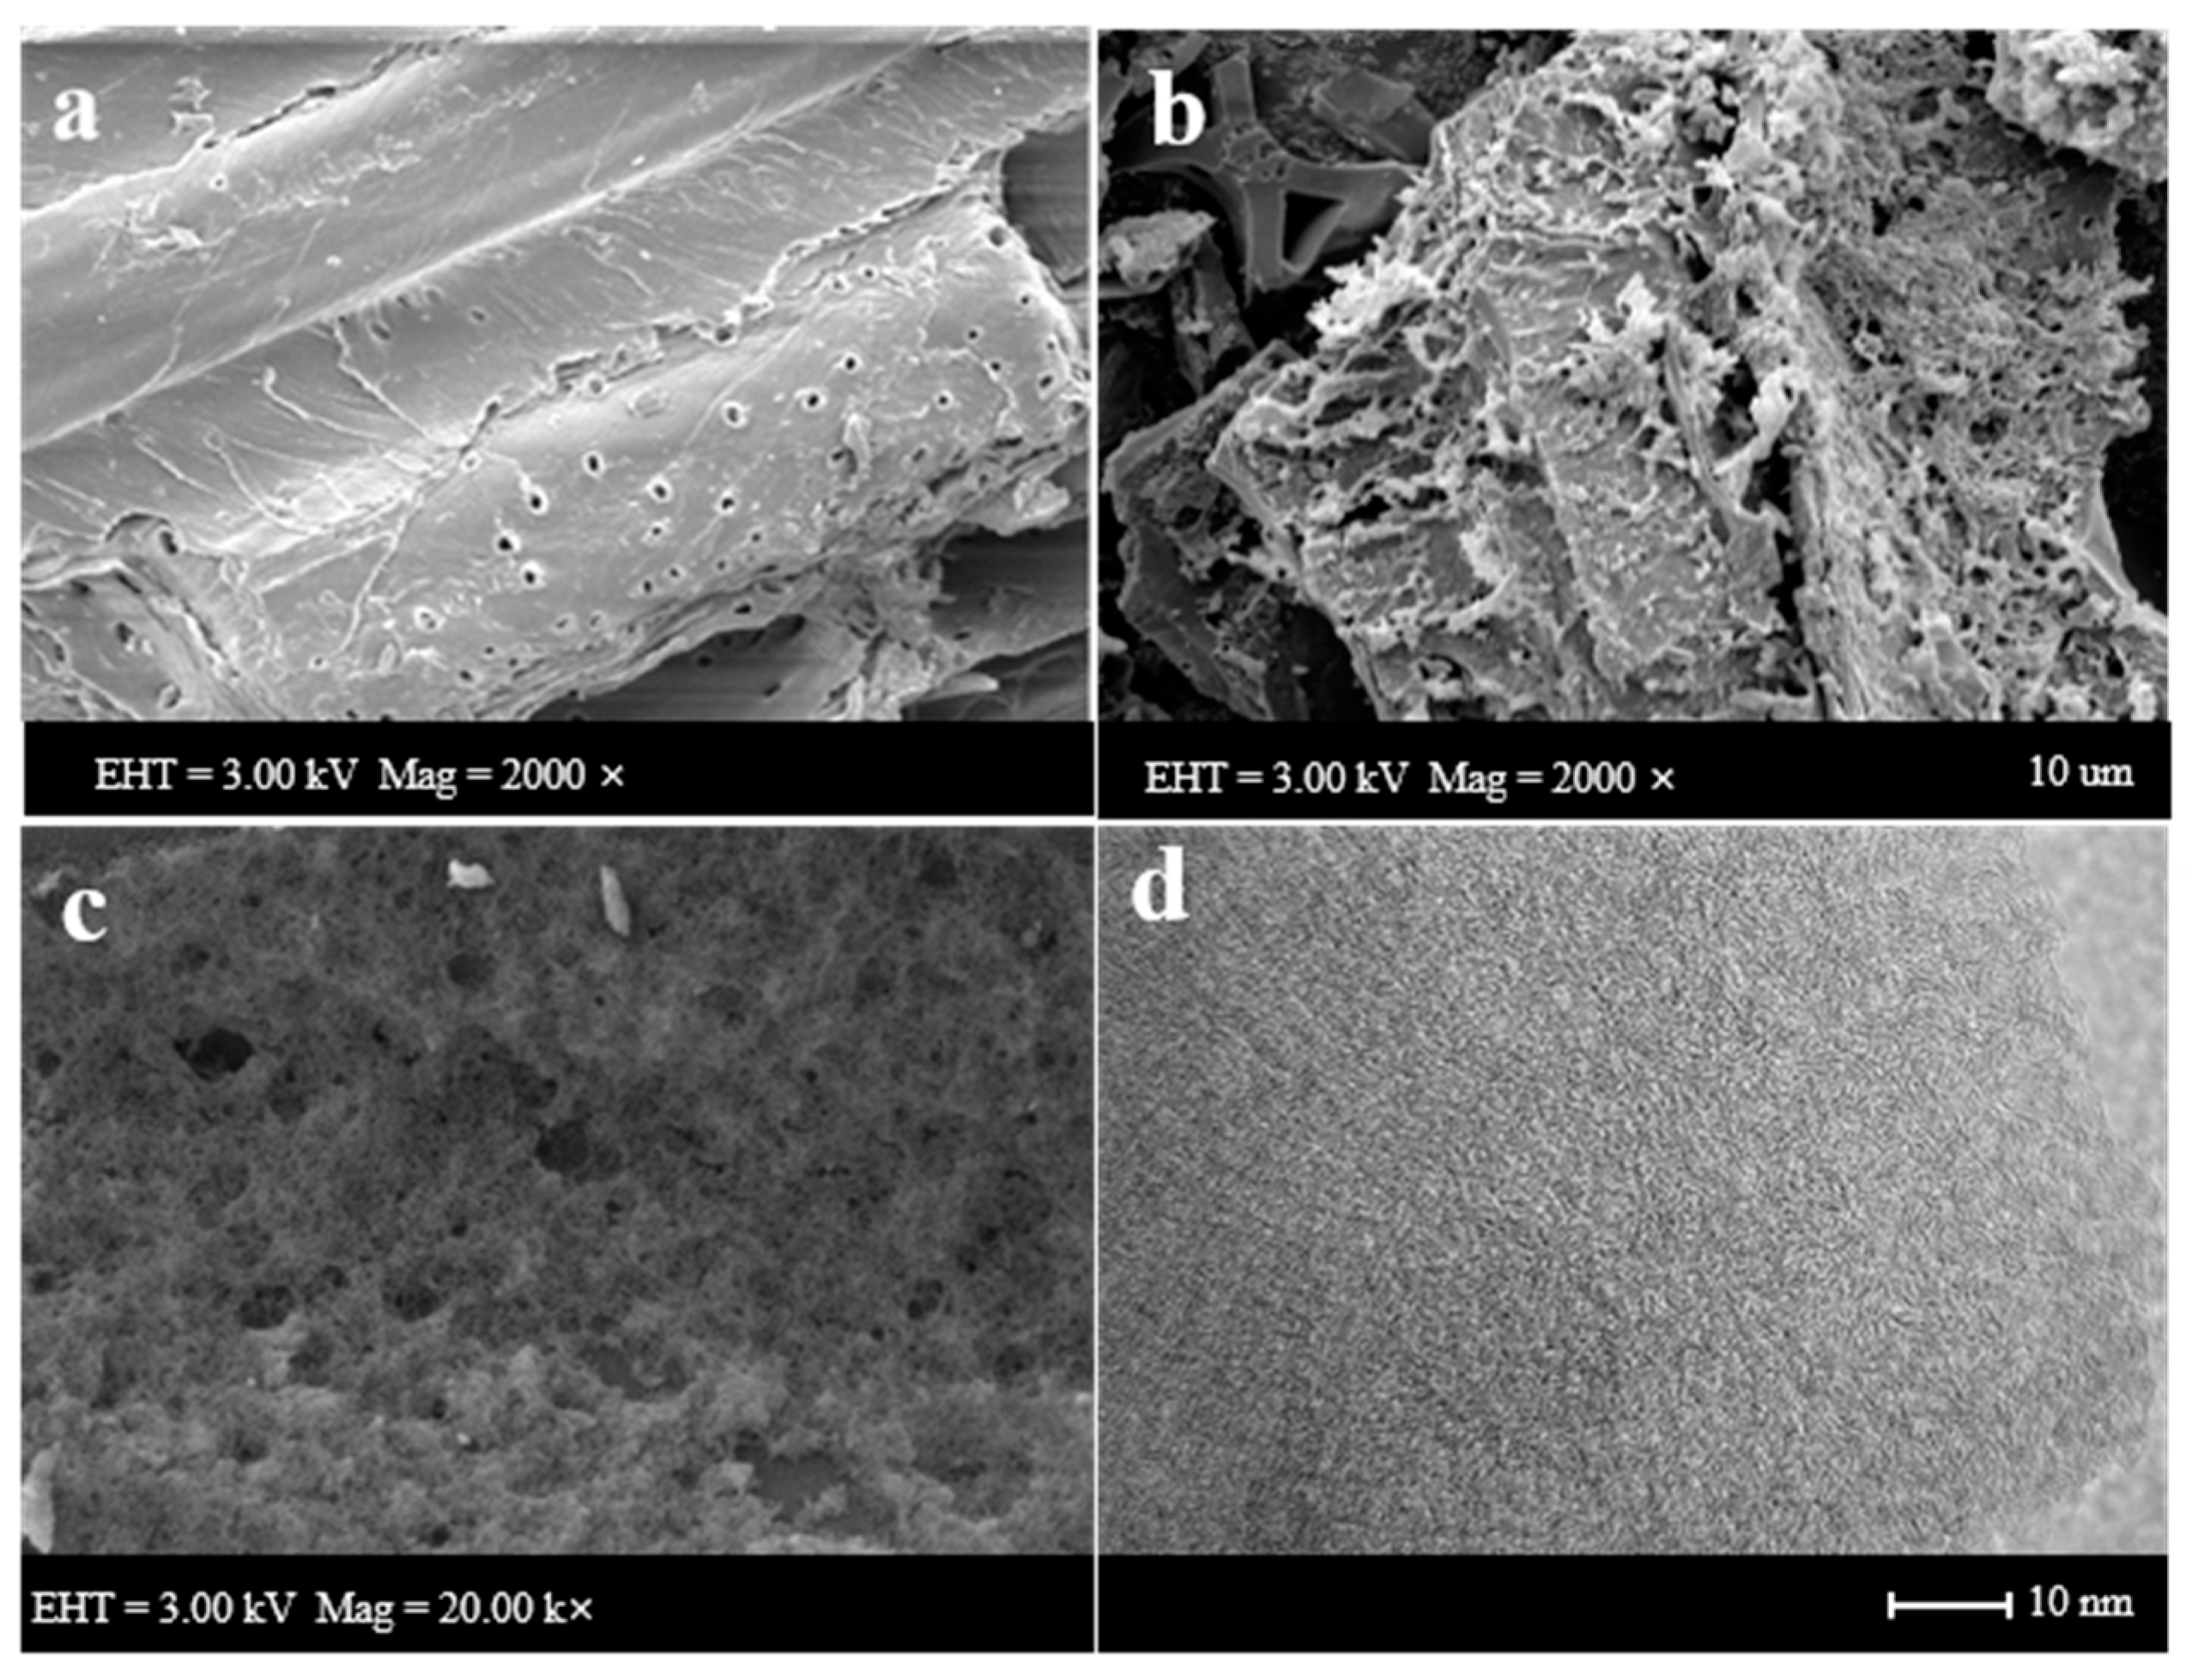
The morphology of bamboo powder and activated carbon, obtained through an impregnation ratio of 2.5:1 (FeCl2: bamboo powder) and a reaction temperature of 900 °C, is depicted in Figure 3. The surface of bamboo powder (a) was smooth and dense, and contained very few pores. After being activated by FeCl2, the material maintained its original skeleton structure, but the number of wrinkles on the surface increased, and porous structures appeared (b,c). These might be due to the etching of carbon atoms by iron oxides, the escape of water vapor, and the carbon dioxide generated during the reaction. The pore shapes are mainly slit and cylindrical. The structure of activated carbon is mainly disordered, but a few ordered structures can be observed, which may be graphite-like crystallites (d) [29].
3.3. Pore Structural Analysis
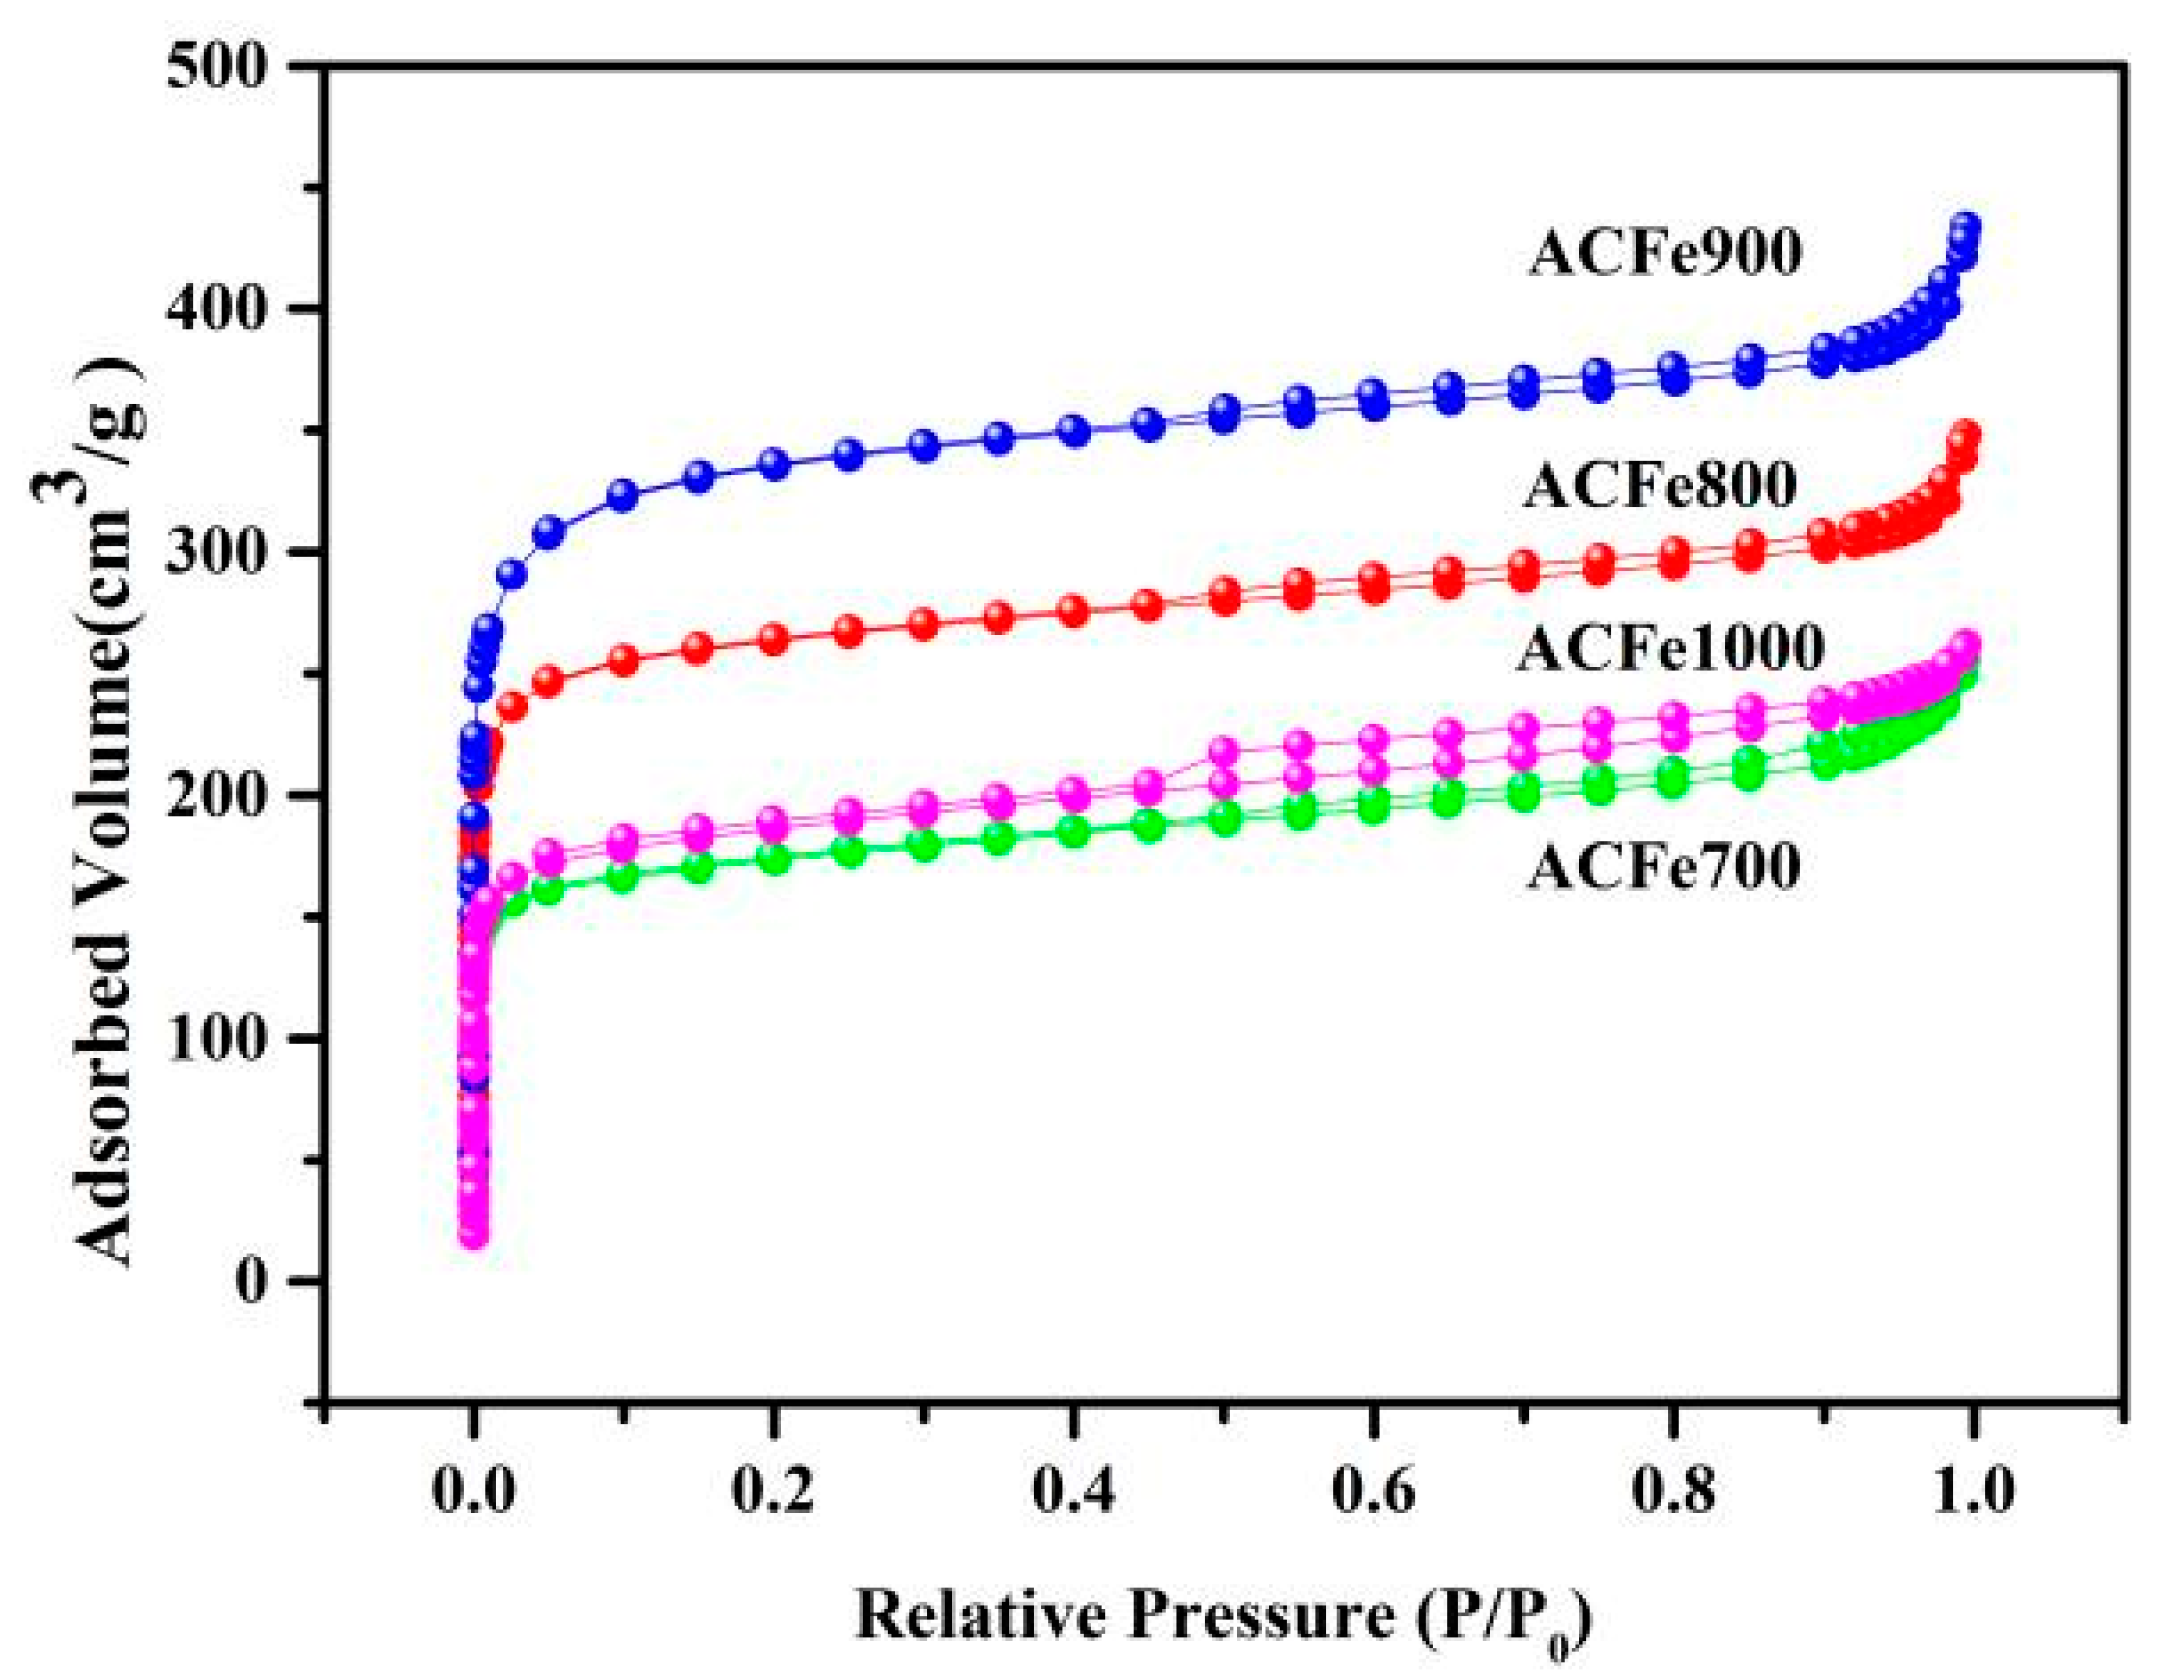
Modifications in the porous architecture of the activated carbon can be inferred from the alterations observed in the nitrogen adsorption–desorption isotherms. The isotherm of activated carbons prepared at varying activation temperatures is depicted in Figure 4. As per the definition provided by the IUPAC, the isotherms of activated carbons shown in the figure can be interpreted to belong to type I(b), indicating the existence of microporous carbon [30]. At a low relative pressure (0 < P/P0 < 0.1), the amount of adsorbed nitrogen increased sharply, indicating that micropores were filled. As the pressure increased, a “knee”-like bend was observed in the isotherm. This indicates that the saturation point for monolayer adsorption began to overlap with the initial point for multilayer adsorption. Multilayer adsorption occurred, which mainly corresponded to the filling of mesopores. However, the increase was relatively gentle, which indicated that the number of mesopores was relatively few. The presence of macropores was observed through the continuous adsorption of nitrogen at a significantly elevated relative pressure of approximately 1.0. According to the findings presented in reference [31], it was observed that the formation of pores with a slit-like shape was evidenced by the H4-type hysteresis loops. Results imply the development of many pores as the activation temperature is increased from 700 °C to 900 °C, leading to a considerable increase in the nitrogen adsorption capacity of the samples. The higher the carbonization temperature was above 900 °C, the less of nitrogen was adsorbed in the pores of the obtained material.
The activation temperature-dependent pore structure properties of the activated carbons produced are listed in Table 1. As the activation temperature increased from 700 °C to 900 °C, the total specific surface area, micropore specific surface area, mesopore specific surface area, total pore volume, micropore volume, and mesopore volume of the activated carbons all increased proportionally. They reached maximal values at 900 °C, which are 1290.93 m2/g, 1192.19 m2/g, 54.76 m2/g, 0.67 m3/g, 0.49 m3/g, and 0.17 m3/g. When the temperature exceeded 900°C, excessive heat treatment caused the existing micropore and mesopore structure to shrink and collapse continuously, thereby reducing the specific surface area and pore volume of micropores and mesopores. The Smic/SBET values of all samples were above 70% (86.7%, 91.6%, 92.4%, and 71.1%). The values of Vmic/Vtot were all above 60% (60.0%, 70.4%, 73.1%, and 63.6%). This showed that the pores created by FeCl2 activation were mainly micropores, and the increase in mesopore volume was probably due to the activator expanding the micropores.
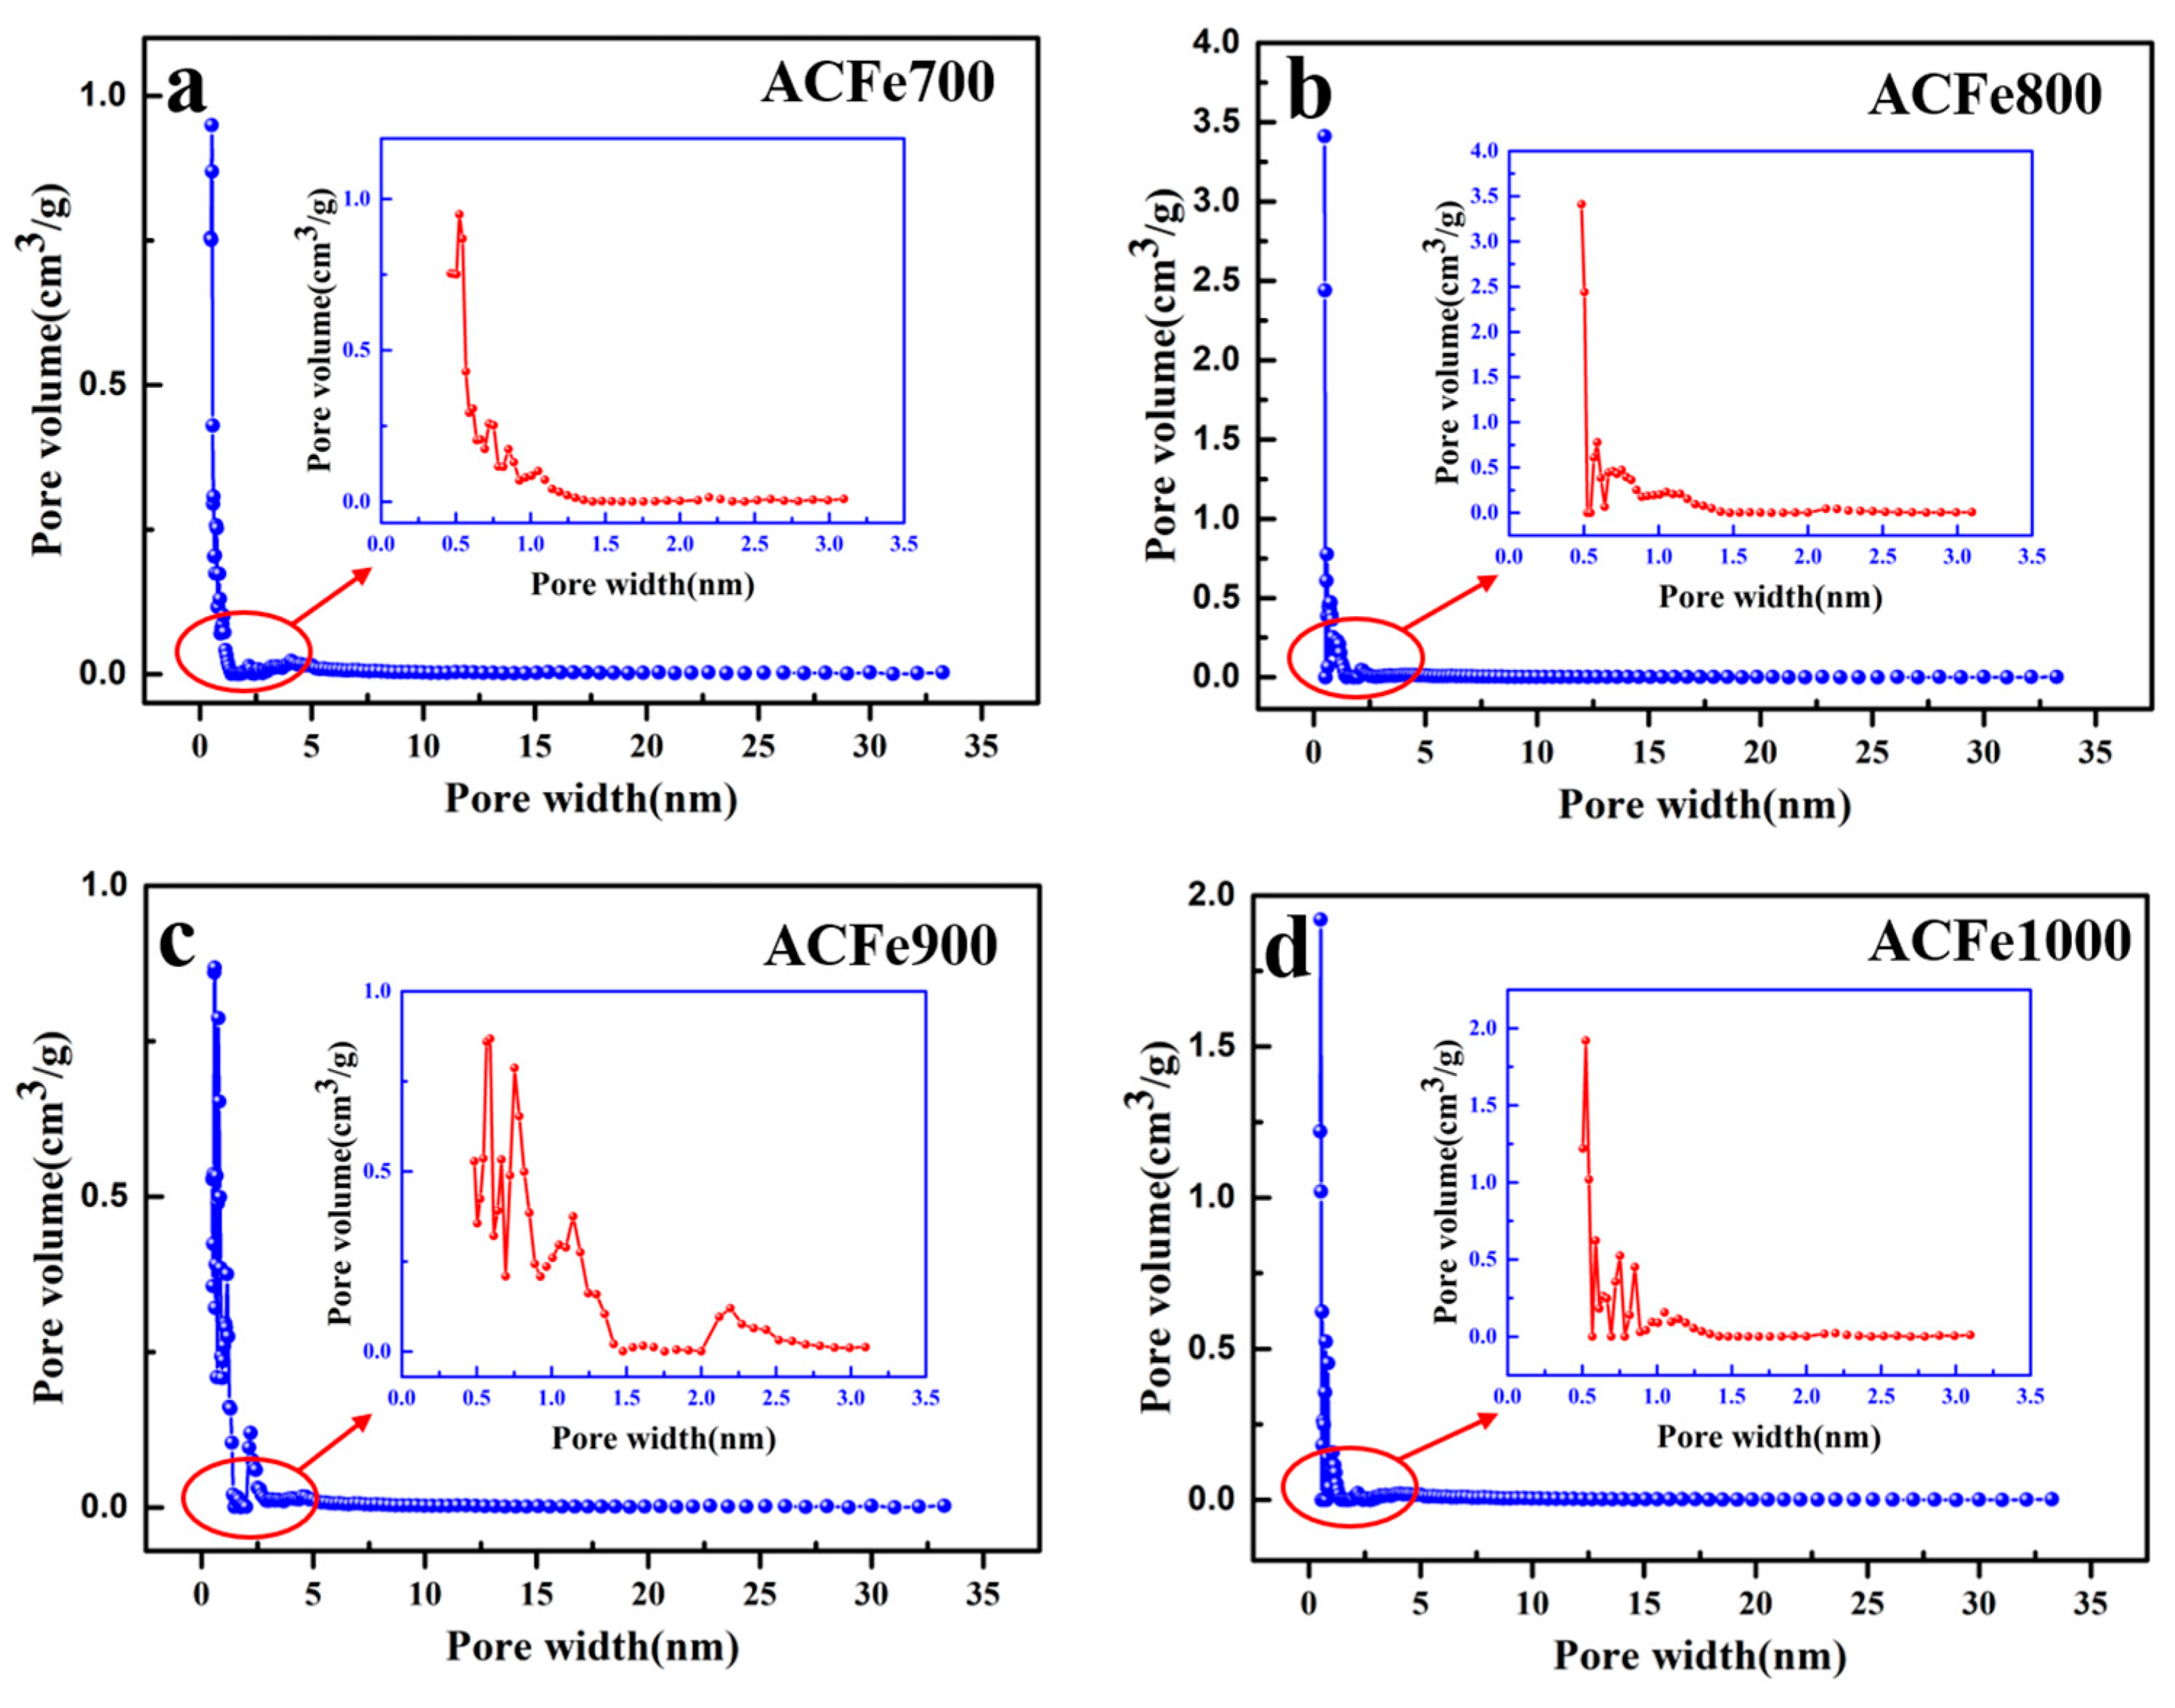
DFT analysis showed that the prepared activated carbon contained not only slit-shaped pores but also cylindrical pores. As shown in Figure 5, the samples mainly contained micropores (d < 2 nm). Furthermore, the pore size distribution of all samples was primarily concentrated within the range of 0.5–1 nm. The proportion of mesopores with a 2–3 nm pore size in ACFe900 was significantly higher than that of other samples. The data suggests that with an increase in activation temperature from 700 °C to 900 °C, there was a progressive augmentation in the size of the pores. The thermal treatment conducted at a temperature of 900 °C led to a rise in the quantity of mesopores. However, the average pore diameter (Table 1) gradually decreased with increasing temperature. This showed that the pores created by FeCl2 activation were mainly micropores. Although the number of larger-diameter micropores and mesopores increased significantly due to pore expansion, its influence on the average pore size was far weaker than that of micropores (0.5 < d < 1 nm). A notable reduction in the quantity of micropores and mesopores was observed, concomitant with a rise in the average pore size, as the activation temperature was elevated to 1000 °C. The mean pore diameter exhibited an increment due to the pore collapse induced by the excessive thermal treatment. Additionally, it is noteworthy that the dominant species of Cr(VI) found in industrial wastewater is CrO42−, which has a hydrated ionic radius of 0.35 nm according to reference [32]. The synthesized activated carbon has been evaluated to be suitable for the adsorption of Cr(VI) due to its pore structure, as determined in this study.
3.4. FTIR Analysis
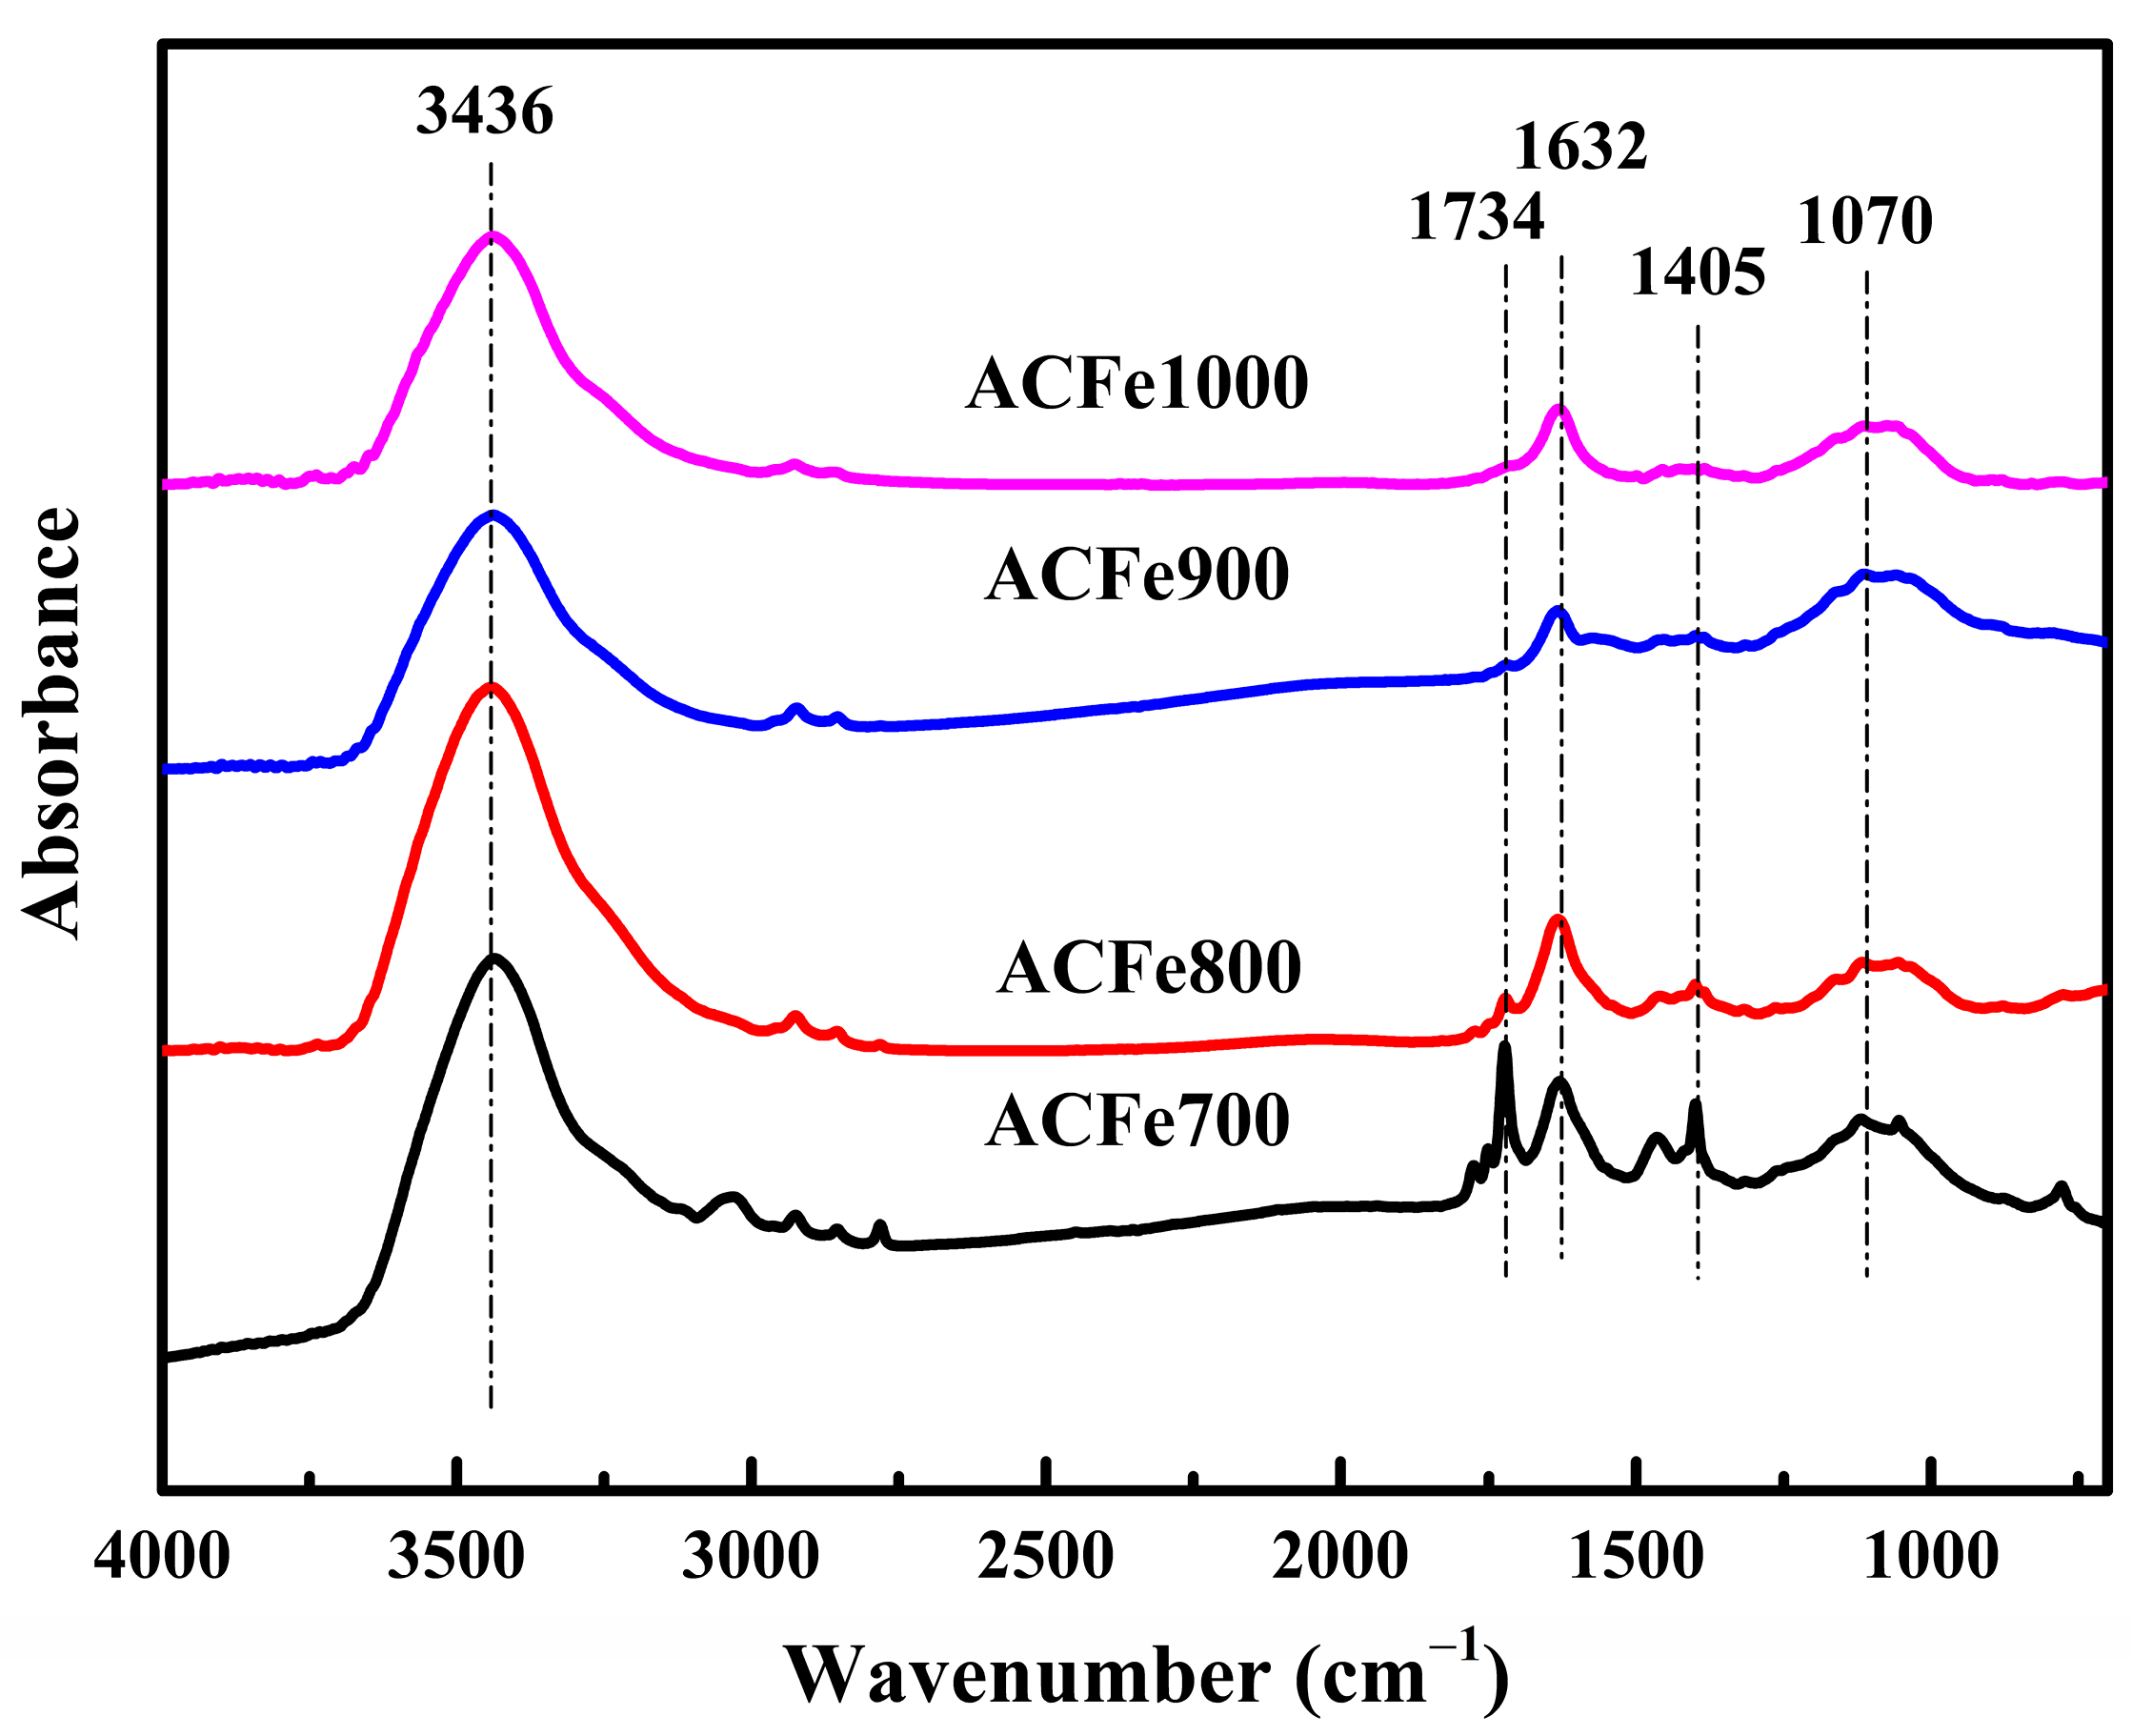
Figure 6 depicts the FTIR spectra of activated carbons. The stretching vibration of -OH groups was determined to be responsible for the absorption band that was positioned at 3436 cm−1. Spectral analysis revealed the presence of 2 distinct peaks at wavenumbers 1734 cm−1 and 1632 cm−1, which were attributed to the stretching of the carbonyl (C=O) group in carboxyl functional groups. The spectral peaks observed at a wavenumber of 1405 cm−1 were attributed to the symmetrical bending of methyl groups or -CH2 scissoring vibrations. The C-C stretching vibration was attributed to the characteristic peak observed at 1070 cm−1, as reported in previous studies [18,24,33]. Activated carbons exhibited a significant decrease in the number of oxygen-containing functional groups compared to untreated bamboo powder (Figure S1). As the temperature of activation was varied between 700 °C and 1000 °C, the peak observed at 1734 cm−1 exhibited a gradual disappearance, while the intensity of the peaks at 3436 cm−1 and 1632 cm−1 exhibited a gradual weakening. The findings indicate a gradual reduction in the quantity of oxygen-containing functional groups as the activation temperature increases.
3.5. XRD Analysis
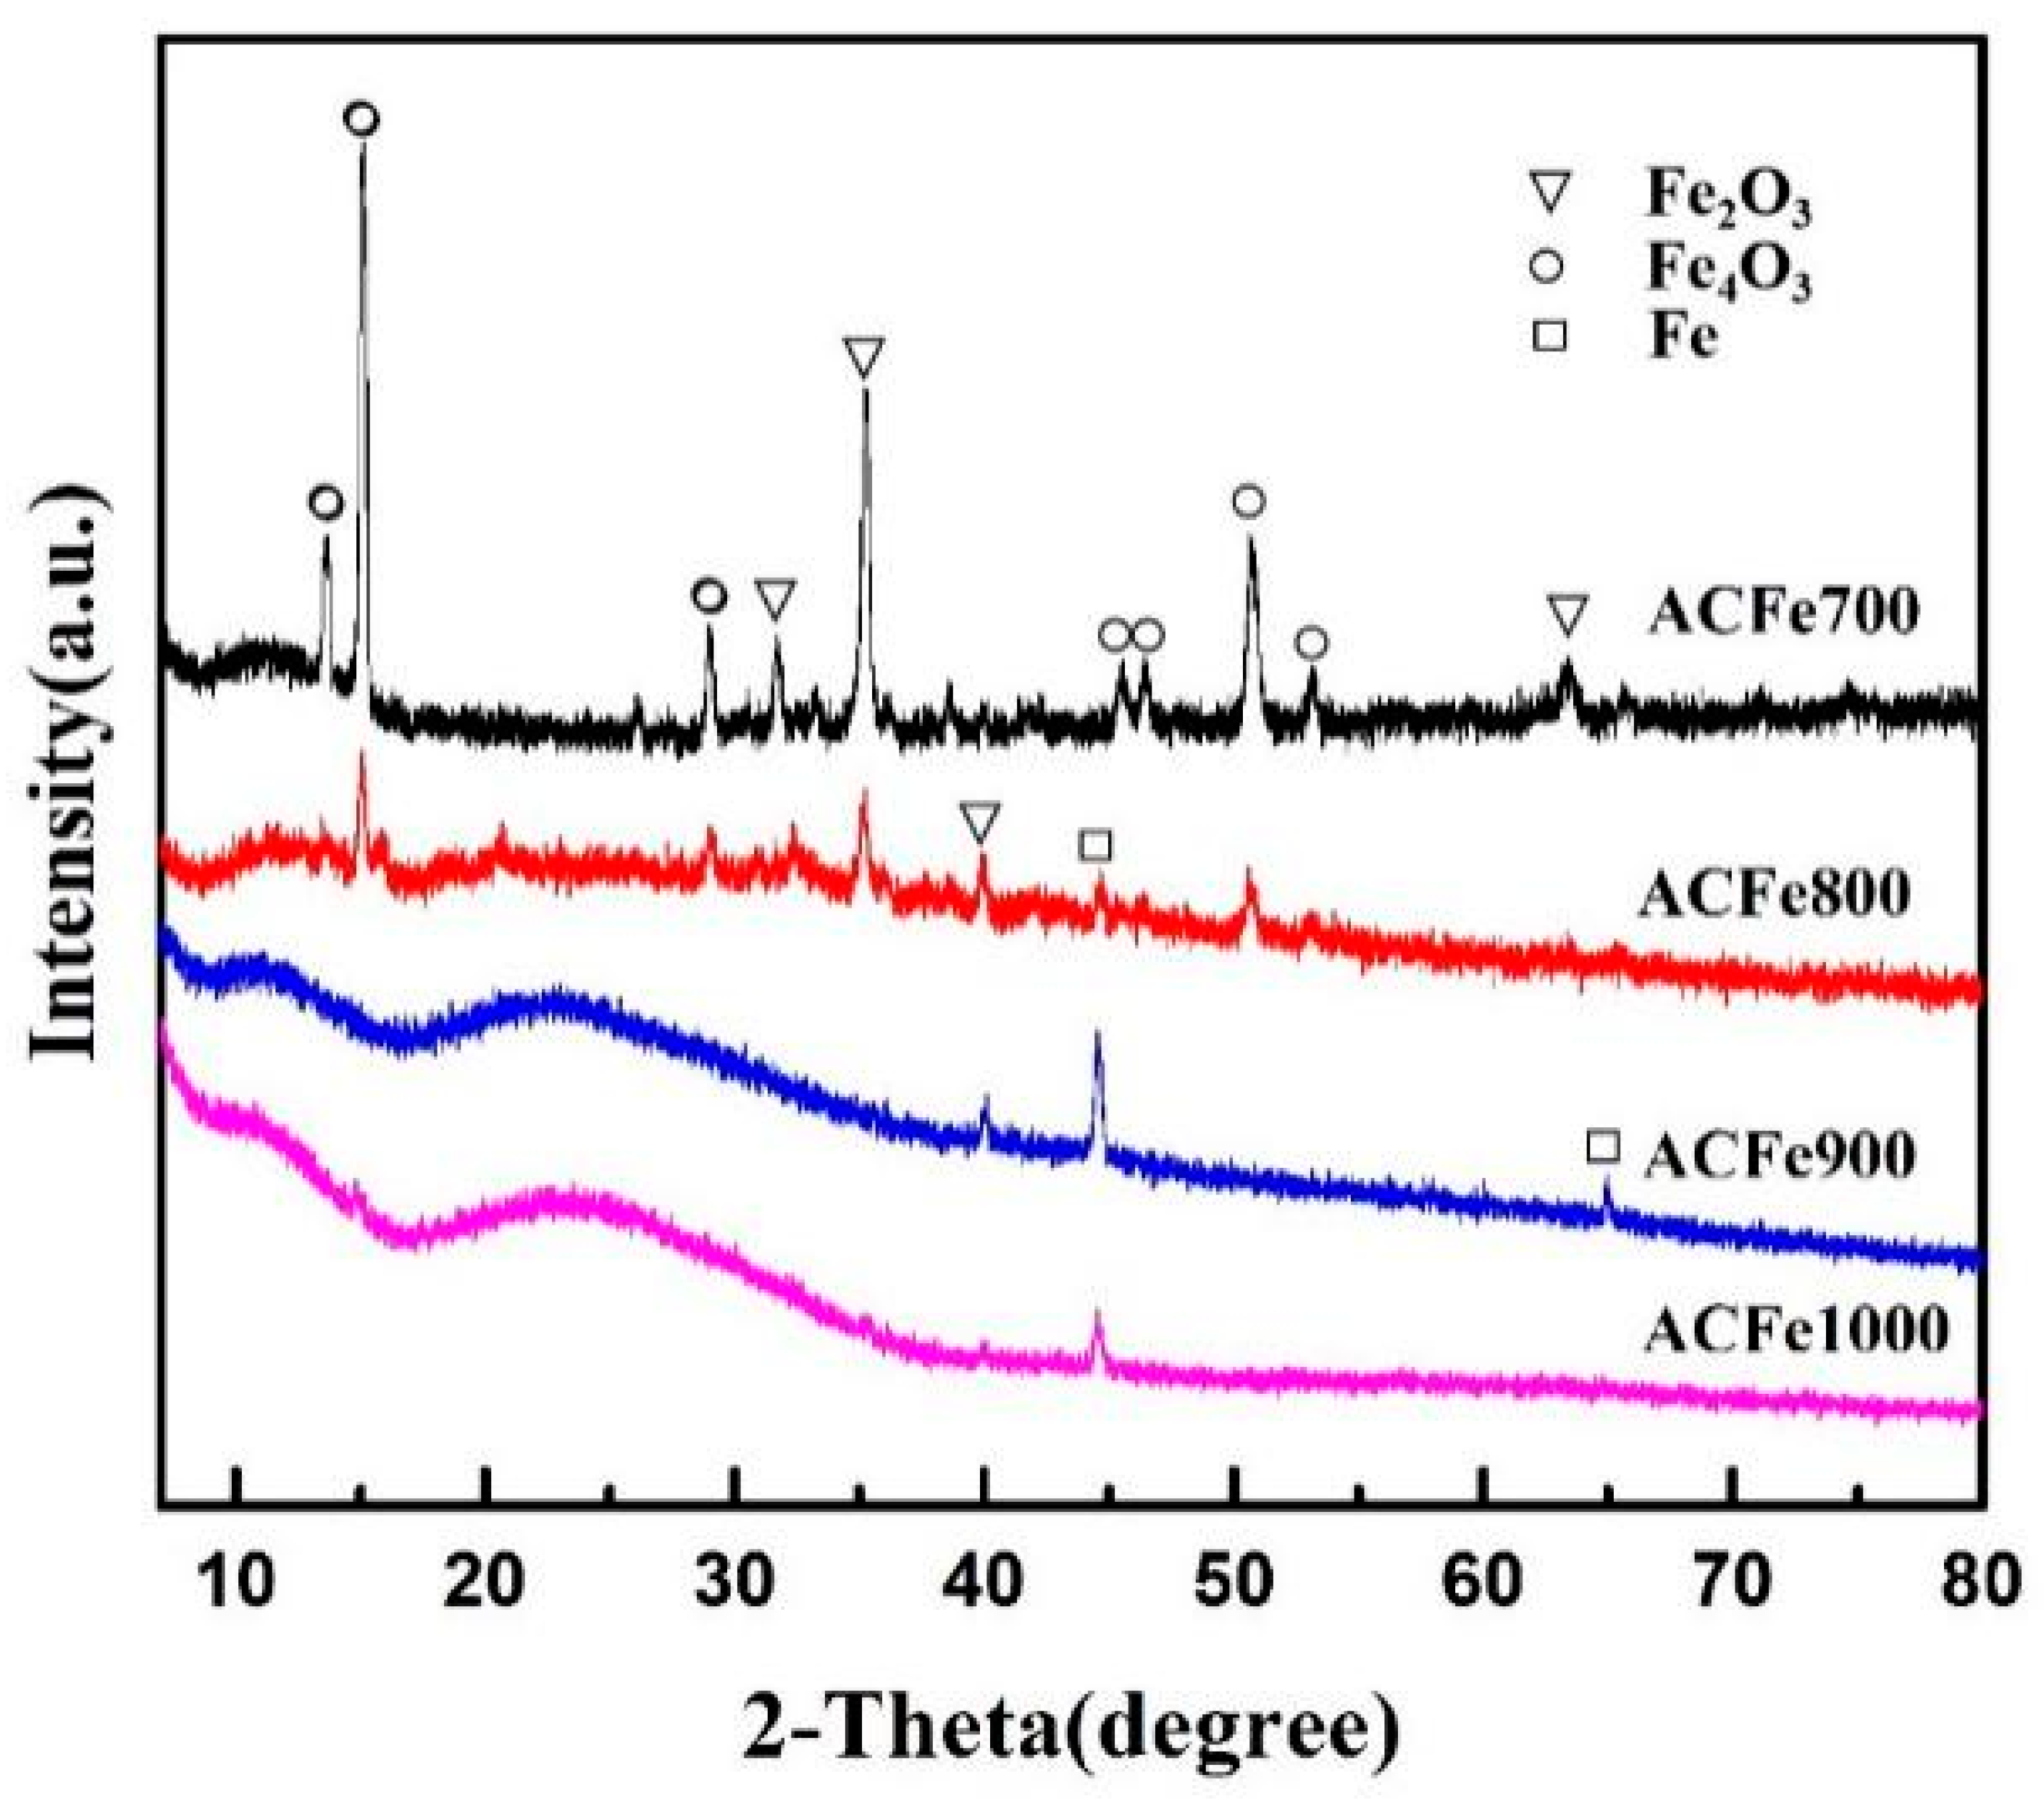
The XRD pattern presented in Figure 7 depicts the activated carbons that were produced at varying activation temperatures. By analyzing the forms of iron at different temperatures, the activation mechanism of the activation process can be deduced. The XRD pattern exhibited characteristics peaks at 2θ = 13.6°, 15.1°, 29.0°, 45.6°, 46.5°, 50.9°, and 53.4°, which correspond to Fe3O4. The peaks at 2θ = 31.7°, 43.5°, and 63.95° were attributed to Fe2O3. The characteristic peaks at 2θ = 35.9° and 72.3° were ascribed to FeO. The peaks at 2θ = 43.6° and 63.9° were attributed to Fe [34]. Dissolution of FeCl2·4H2O in water and subsequent drying resulted in hydrolysis and oxidation. The Fe(OH)2 and Fe(OH)3 underwent reactions (1) and (2) at high temperature and anaerobic condition [35]. As depicted in Figure 7, a gradual weakening of the intensity of the characteristic peak of Fe3O4, Fe2O3, and FeO was observed with an increase in activation temperature from 700 °C to 1000 °C, ultimately leading to their disappearance. The intensity of the distinctive peak associated with iron exhibited a gradual increase. This demonstrated that Fe3O4, Fe2O3, and FeO reacted with C to form Fe via Equations (3)–(5). These reactions created abundant pores [36] but also caused the mass loss in Figure 2b. At a temperature of 900 °C, the predominant outcome of the reaction was the formation of Fe, and the reactions involving Fe3O4, Fe2O3, and FeO with C were essentially fully realized. Bamboo powder contained cellulose crystal structure (Figure S2) which disappeared after activation. In addition, when the activation temperature reached the range of 900 °C and 1000 °C, the characteristic peak of graphite appeared at 2θ = 23.5°. A high temperature could increase the regular arrangement of graphite-like crystallites and improve the stability of samples. This inevitably led to shrinkage and collapse of pores. The activated carbon produced at a temperature of 1000 °C demonstrated heightened crystallinity and was impervious to etching, resulting in a significant reduction in the number of micropores generated.
Fe(OH)2 → FeO + H2O
2Fe(OH)3 → Fe2O3 + 3H2O
2FeO+C → 2Fe+CO2
3Fe2O3 + C → 2Fe3O4 + CO
Fe3O4 + 2C → 3Fe + 2CO2
3.6. Sorption Studies
3.6.1. Sorption Capacity
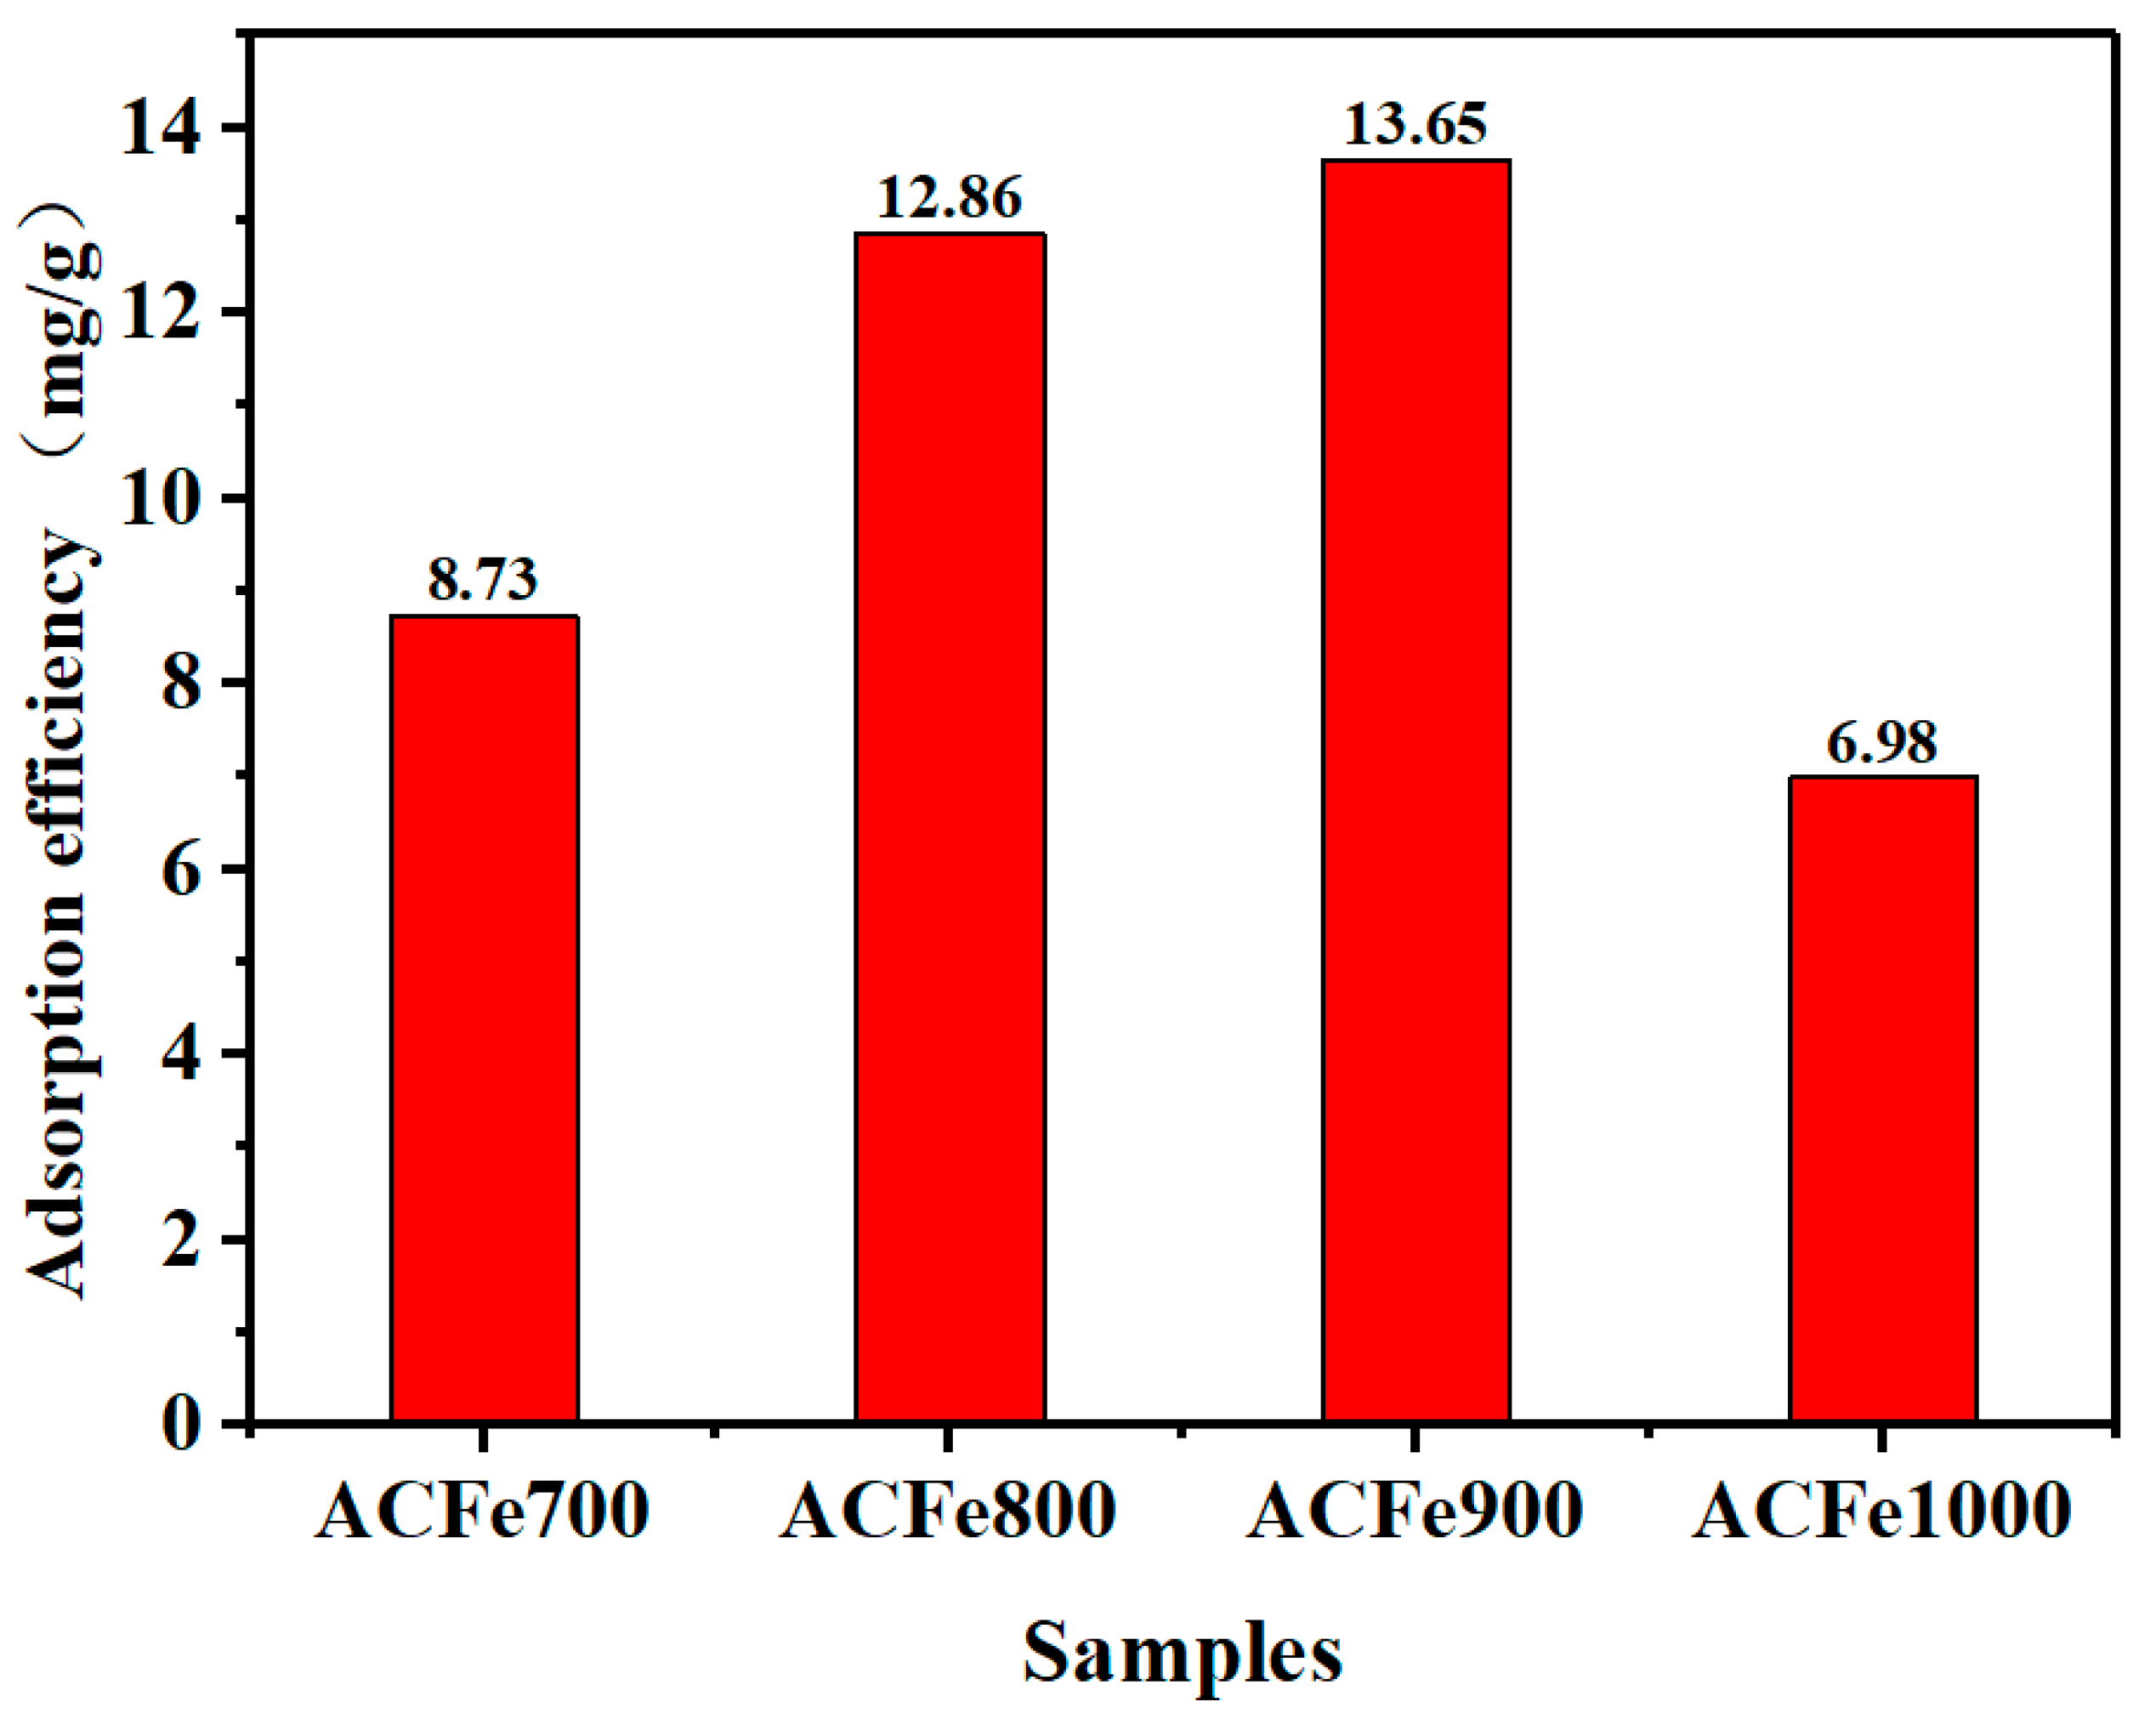
The findings depicted in Figure 8 demonstrate a progressive improvement in the adsorption efficiency of activated carbons. The adsorption capability reaches a magnitude of 13.65 mg/g as the activation temperature is increased from 700 °C to 900 °C. A reduction in the adsorption capacity of ACFe1000 was noted, resulting in a value of 6.98 mg/g. The physical adsorption sites were facilitated by micropores, whereas adsorption kinetics were improved by mesopores [37]. Furthermore, the existence of oxygen-containing functional groups resulted in the creation of chemical adsorption sites. The ACFe900 exhibited a higher specific surface area as well as pore volume in both micropores and mesopores compared to the other samples, which consequently led to the highest adsorption capacity. This study shows that the specific surface area, pore volume, and adsorption capacity of Cr(VI) are all affected by temperature in a predictable fashion. The quantity of oxygen-containing functional groups present in activated carbons exhibited a gradual reduction as the activation temperature was increased. The measured trend in Cr(VI) binding capacity does not match the above statement. The present study has revealed that the pore structure of the activated carbon is the primary determinant of Cr(VI) adsorption in water. Table 2 provides a concise overview of the maximum adsorption capabilities demonstrated by various biomass-derived activated carbons, relative to ACFe900. The results show that ACFe900 can hold a good amount of Cr(VI). Therefore, ACFe900 shows promise as an adsorbent for eliminating Cr(VI).
3.6.2. Adsorption Kinetics
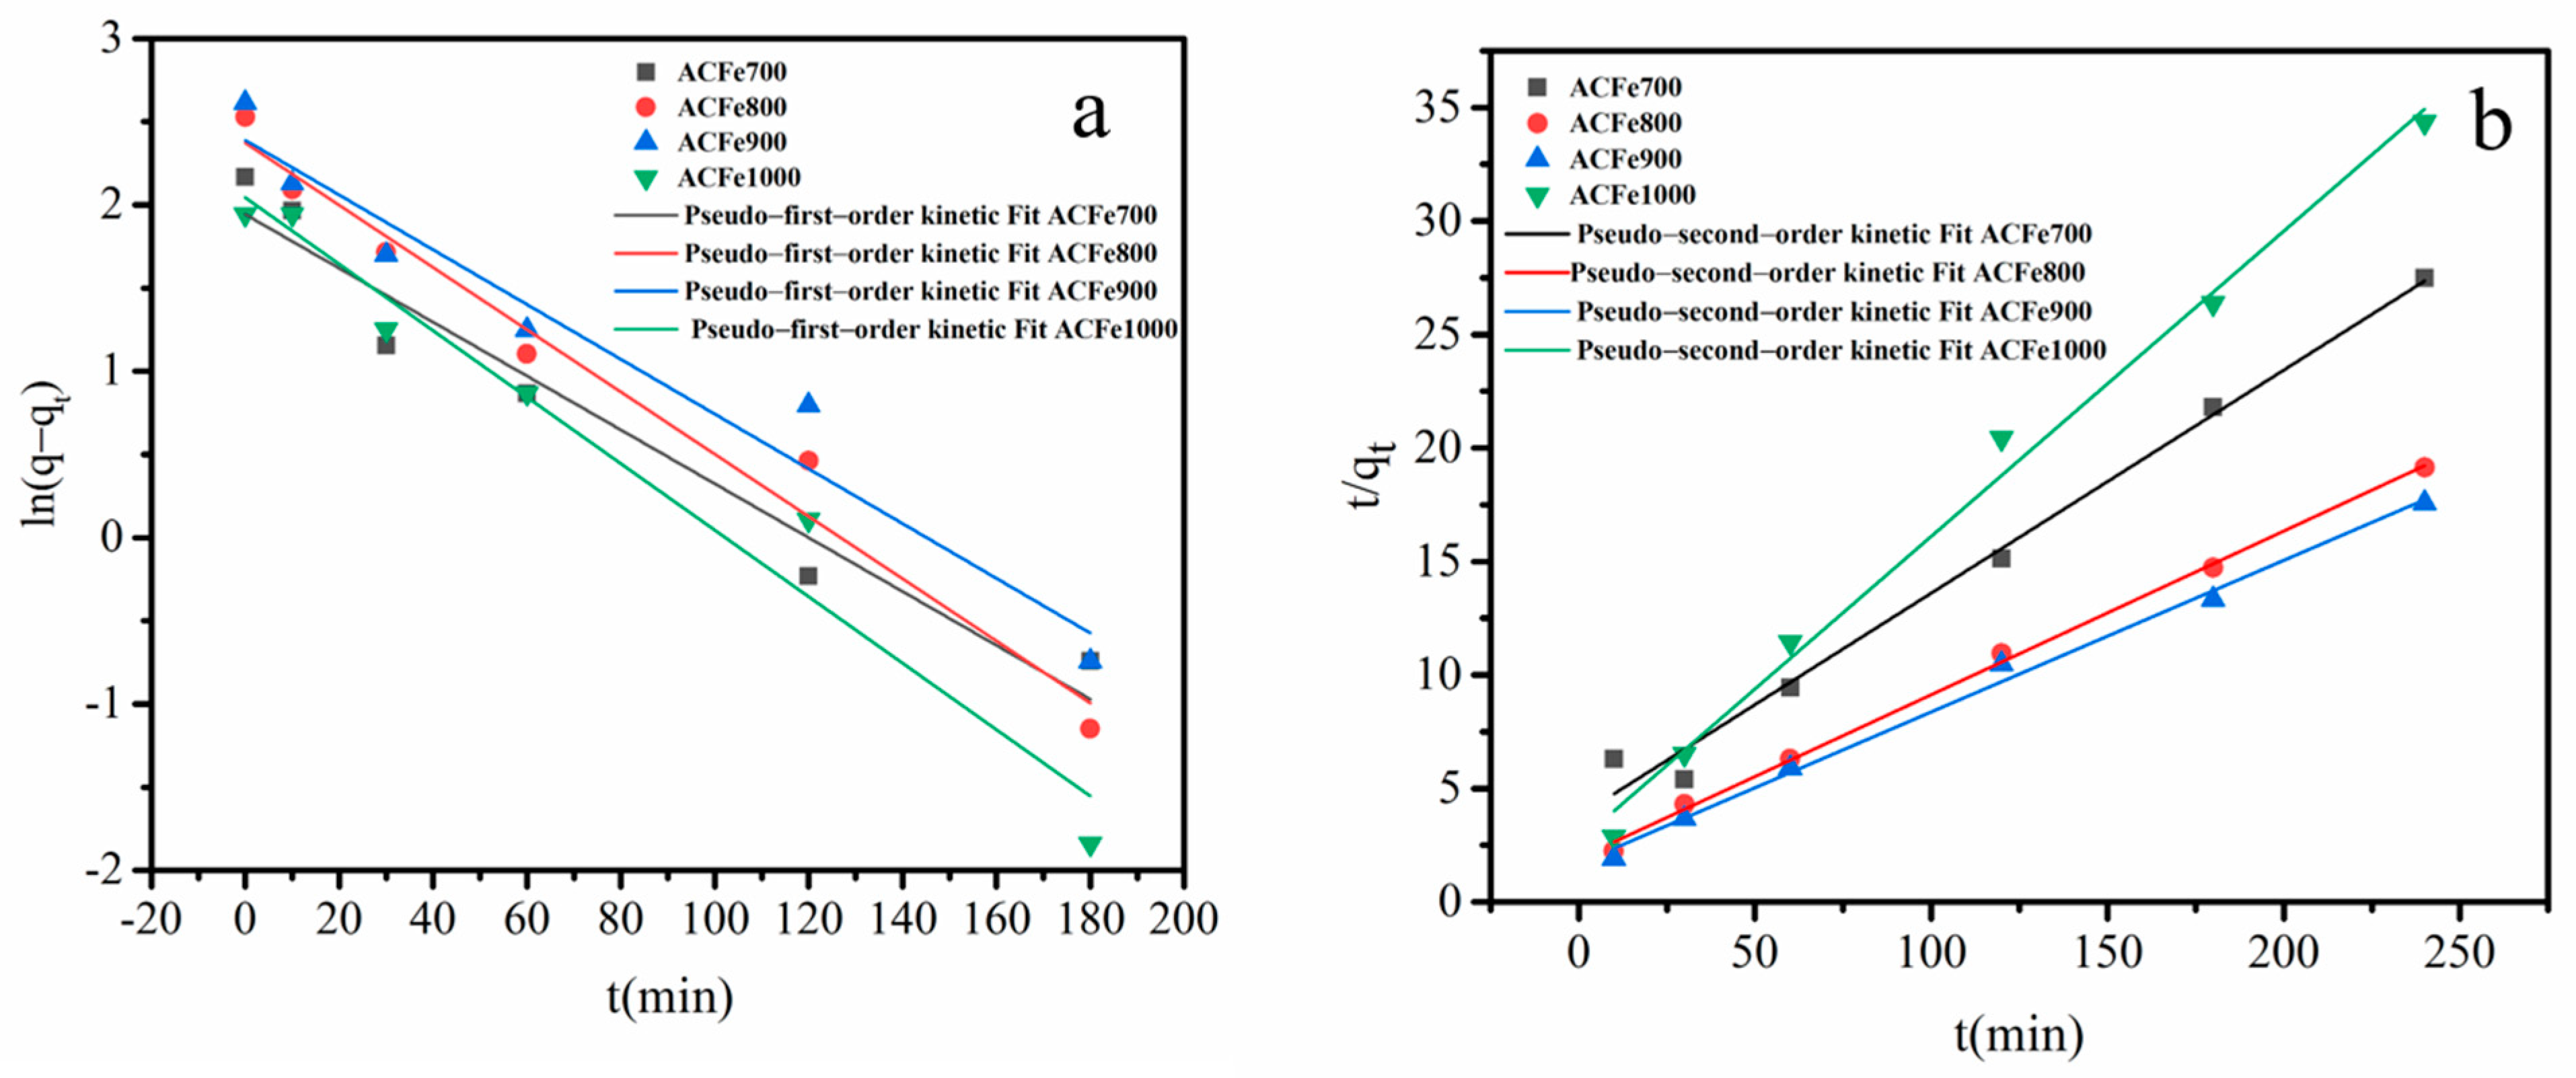
We used pseudo-first-order equations and the pseudo-second-order equations to model the adsorption isotherms in order to perform a more in-depth analysis of the adsorption mechanism of Cr(VI). This allowed us to examine the adsorption mechanism in greater detail. These equations are represented as follows:
The data obtained from the experiment was subjected to the adsorption kinetic model and the results are presented in Figure 9 and Table 3. The results indicate that the correlation coefficients (R2) of ACFe700, ACFe800, ACFe900, and ACFe1000 were superior to those obtained from the pseudo-first-order kinetic equation, as per the pseudo-second-order kinetic equation. Specifically, the R2 values for ACFe700, ACFe800, ACFe900, and ACFe1000 were 0.9858, 0.9977, 0.9929, and 0.9914, respectively. The utilization of the pseudo-second-order kinetic equation yielded results that demonstrated a greater degree of proximity to the experimental values. The pseudo-second-order adsorption kinetic model was found to be a more effective explanation for the adsorption process of Cr(VI) by activated carbon.
3.6.3. Isothermal Adsorption Study
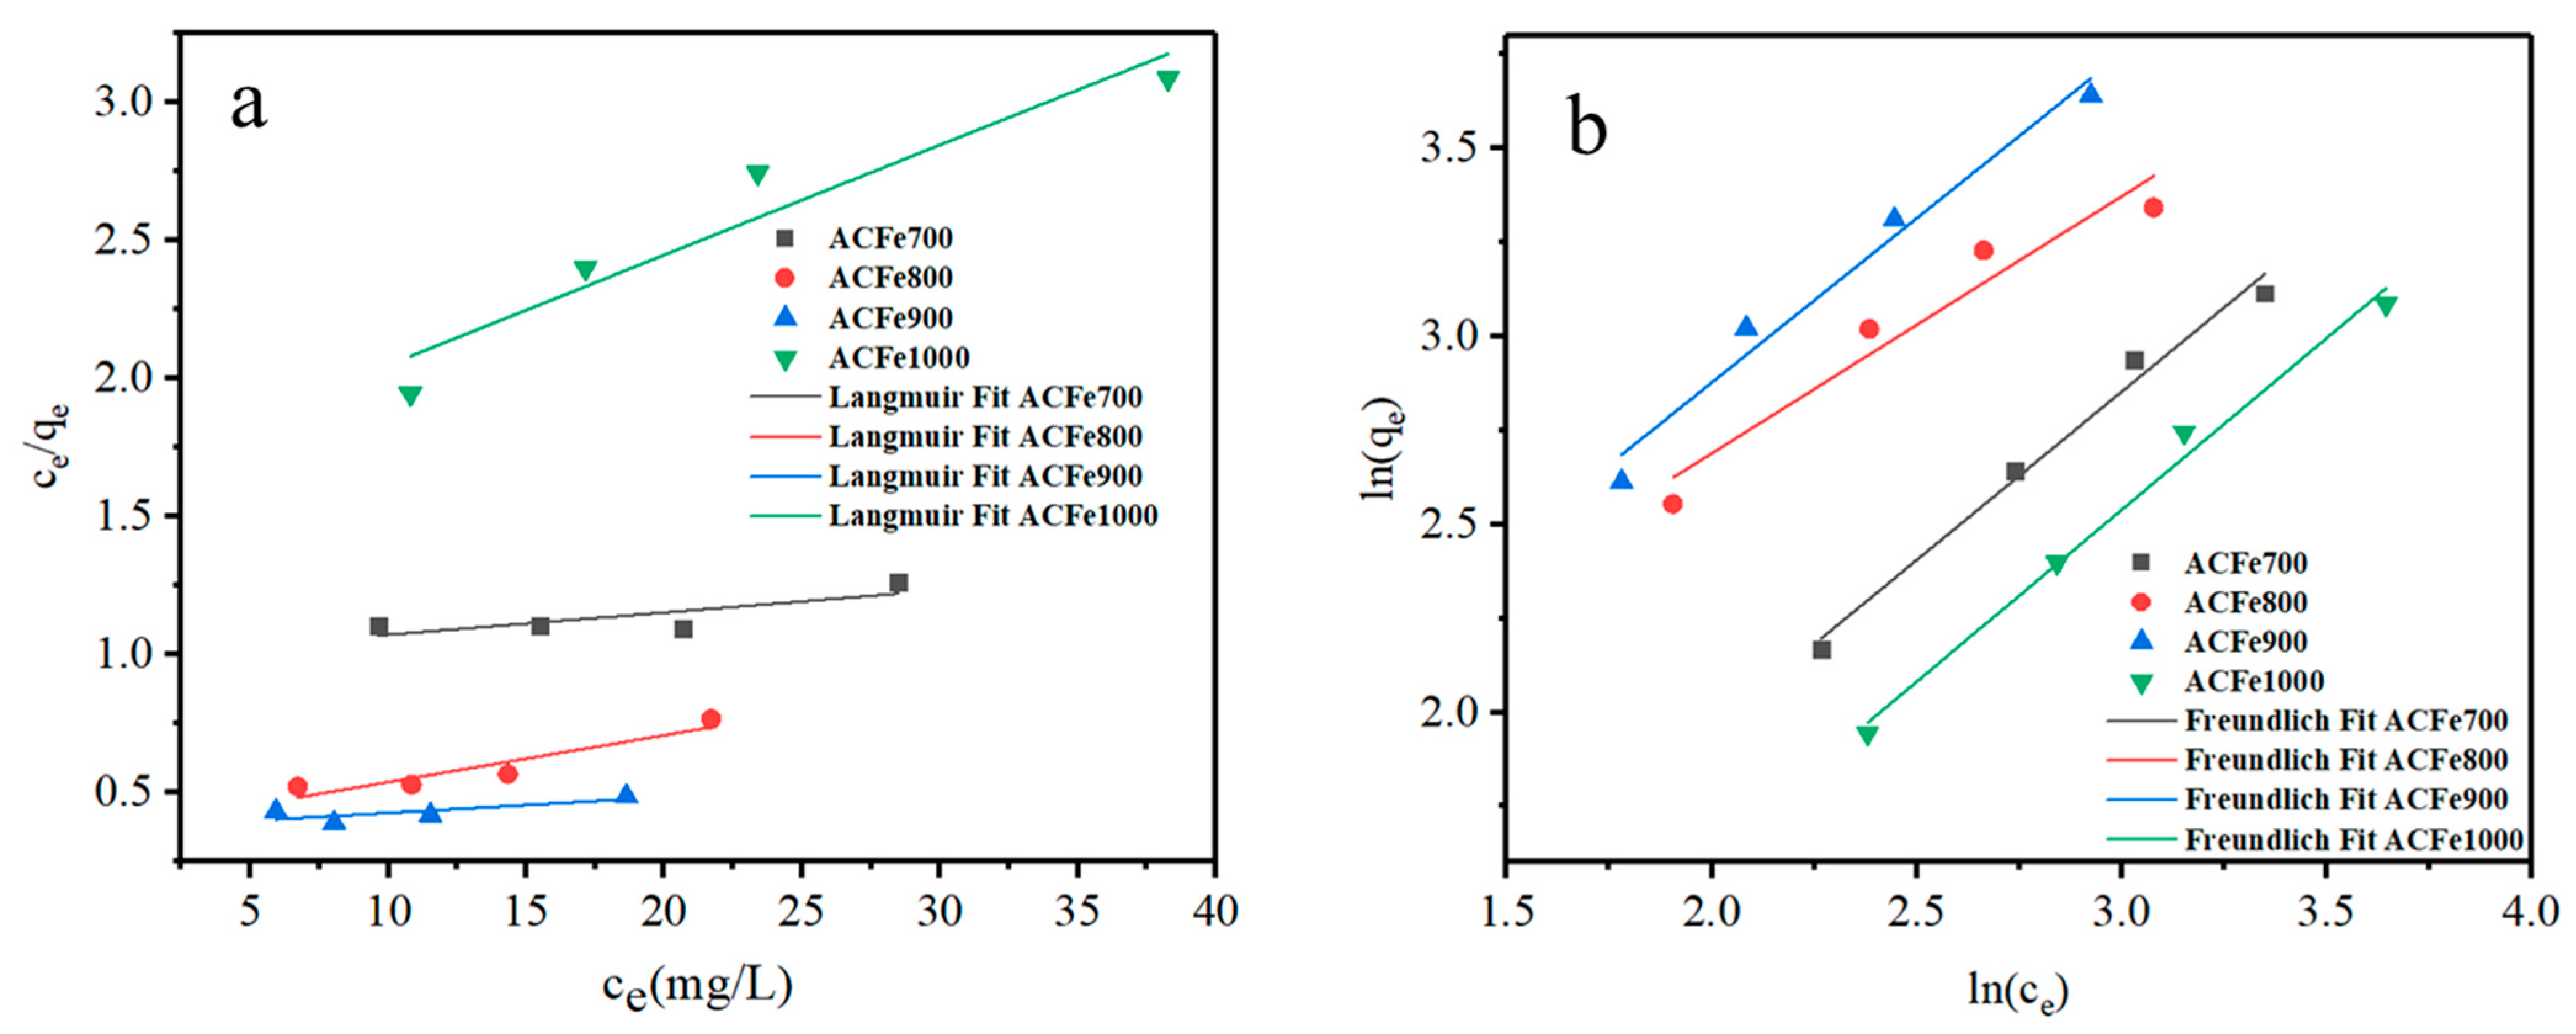
The present study examined the adsorption characteristics of Cr(VI) onto activated carbon through the utilization of the Freundlich and Langmuir adsorption isotherm models. These models are mathematically expressed as follows:
Figure 10 and Table 4 show how the Langmuir and Freundlich isotherm models were applied to match the data from the experiments. The Freundlich equation showed that the R2 values for ACFe700, ACFe800, ACFe900, and ACFe1000 were all superior than those of the Langmuir adsorption isotherm model. These values were 0.9788, 0.9346, 0.9932, and 0.9854, correspondingly. The aforementioned statement suggests that the Freundlich adsorption isotherm model, which pertains to multilayer adsorption, is more appropriate for explaining how Cr(VI) binds to activated carbon. The aforementioned study indicates that values of n exceeding 1 are indicative of a favorable adsorption process. Furthermore, it was observed that an increase in the value of n corresponded to a higher degree of favorability in the adsorption process [45]. The results overwhelmingly indicate that the adsorption of chromium (VI) is more advantageous on ACFe900. This is supported by the relatively higher values of n observed in comparison to the other samples. The highest KF value observed for ACFe900 also demonstrated its optimal adsorption capacity.
4. Conclusions
The activation method utilizing FeCl2 is a process that is both facile to operate and environmentally sustainable. The activated carbon that was prepared demonstrated a highly developed pore structure, with the majority of the pore sizes falling within the 0.5–1.0 nm range. The aforementioned range is deemed to be optimal for the process of adsorption of chromium (VI). The specific surface area and pore volume of activated carbon displayed a non-linear pattern in relation to the activation temperature. There was an initial increase followed by a subsequent decrease, ultimately resulting in the highest values observed for ACFe900. The research findings indicate that the adsorption capacity was primarily influenced by the pore structure, with ACFe900 exhibiting a maximum Cr(VI) adsorption capacity of 13.65 mg/g. In order to more accurately characterize the adsorption process of Cr(VI) on activated carbon, it is preferable to make use of the pseudo-second-order kinetics model in conjunction with the Freundlich model. The adsorption process is observed to take place through multilayer adsorption.
Supplementary Materials
The following supporting information can be downloaded at: https://www.mdpi.com/article/10.3390/w15101891/s1, Figure S1: FTIR spectra of bamboo, FeCl2·4H2O, and the mixture of bamboo and FeCl2·4H2O; Figure S2: X-ray diffraction of bamboo, FeCl2·4H2O and the mixture of bamboo and FeCl2·4H2O.
Author Contributions
Conceptualization, M.Z. and X.L.; methodology, M.Z.; formal analysis, L.S.; investigation, J.M.; data curation, M.Z.; writing—original draft preparation, M.Z.; writing—review and editing, L.S.; supervision, J.M.; project administration, X.L.; funding acquisition, X.L. All authors have read and agreed to the published version of the manuscript.
Funding
This research was funded by Fundamental Research Funds for the International Center for Bamboo and Rattan (Project number 21618-1).
Institutional Review Board Statement
Not applicable.
Data Availability Statement
Not applicable.
Conflicts of Interest
The authors declare no conflict of interest.
References
- Xu, D.; Huang, Y.; Ma, Q.; Qiao, J.; Guo, X.; Wu, Y. A 3D porous structured cellulose nanofibrils-based hydrogel with carbon dots-enhanced synergetic effects of adsorption and photocatalysis for effective Cr(VI) removal. Chem. Eng. J. 2023, 456, 141104. [Google Scholar] [CrossRef]
- Liang, Y.; An, W.; Hu, J.; Zhu, Y.; Cui, W. Removal of chromium (VI) by a self-regenerating and metal free g-C3N4/graphene hydrogel system via the synergy of adsorption and photo-catalysis under visible light. Appl. Catal. B Environ. 2017, 219, 53–62. [Google Scholar] [CrossRef]
- Pađan, J.; Marcinek, S.; Cindrić, A.M.; Layglon, N.; Lenoble, V.; Salaün, P.; Garnier, C.; Omanović, D. Improved voltammetric methodology for chromium redox speciation in estuarine waters. Anal. Chim. Acta 2019, 1089, 40–47. [Google Scholar] [CrossRef]
- Bahador, F.; Foroutan, R.; Esmaeili, H.; Ramavandi, B. Enhancement of the chromium removal behavior of Moringa oleifera activated carbon by chitosan and iron oxide nanoparticles from water. Carbohydr. Polym. 2021, 251, 117085. [Google Scholar] [CrossRef] [PubMed]
- Liang, H.; Sun, R.; Song, B.; Sun, Q.; Peng, P.; She, D. Preparation of nitrogen-doped porous carbon material by a hydrothermal-activation two-step method and its high-efficiency adsorption of Cr(VI). J. Hazard. Mater. 2020, 387, 121987. [Google Scholar] [CrossRef]
- Li, S.; Cai, M.; Liu, Y.; Wang, C.; Yan, R.; Chen, X. Constructing Cd0.5Zn0.5S/Bi2WO6 S-scheme heterojunction for boosted photocatalytic antibiotic oxidation and Cr(VI) reduction. Adv. Powder Mater. 2023, 2, 100073. [Google Scholar] [CrossRef]
- Zhang, J.; Ma, Y.; Zhang, W.; Huang, X.; Wang, X.; Huang, Y.; Zhang, P. CuBi2O4/calcined ZnAlBi-LDHs heterojunction: Simultaneous removal of Cr(VI) and tetracycline through effective adsorption and photocatalytic redox. J. Clean. Prod. 2022, 365, 132810. [Google Scholar] [CrossRef]
- Zhang, L.; An, B.; Chen, H.; Chu, J.; Ma, J.; Fan, Y.; Wang, Z. Botryoidal nanolignin channel stabilized ultrasmall PdNP incorporating with filter membrane for enhanced removal of Cr(VI) via synergetic filtration and catalysis. Sep. Purif. Technol. 2022, 296, 121409. [Google Scholar] [CrossRef]
- Yuan, X.; Li, J.; Luo, L.; Zhong, Z.; Xie, X. Advances in sorptive removal of hexavalent chromium [Cr(VI)] in aqueous solutions using polymeric materials. Polymers 2023, 15, 388. [Google Scholar] [CrossRef]
- Sharma, P.; Singh, S.P.; Parakh, S.K.; Tong, Y.W. Health hazards of hexavalent chromium [Cr(VI)] and its microbial reduction. Bioengineered 2022, 13, 4923–4938. [Google Scholar] [CrossRef]
- Pakade, V.E.; Tavengwa, N.T.; Madikizela, L.M. Recent advances in hexa-valent chromium removal from aqueous solutions by adsorptive methods. RSC Adv. 2019, 9, 26142–26164. [Google Scholar] [CrossRef] [PubMed]
- Kuang, Y.; Zhang, X.; Zhou, S. Adsorption of methylene blue in water onto activated carbon by surfactant modification. Water 2020, 12, 587. [Google Scholar] [CrossRef]
- Li, Y.; Zhang, D.; Zhang, Y.; He, J.; Wang, Y.; Wang, K.; Xu, Y.; Li, H.; Wang, Y. Biomass-derived microporous carbon with large micropore size for high-performance supercapacitors. J. Power Sources 2020, 448, 227396. [Google Scholar] [CrossRef]
- Kifetew, M.; Alemayehu, E.; Fito, J.; Worku, Z.; Prabhu, S.V.; Lennartz, B. Adsorptive removal of reactive yellow 145 dye from textile industry effluent using teff straw activated carbon: Optimization using central composite design. Water 2023, 15, 1281. [Google Scholar] [CrossRef]
- Zhong, M.; Liu, X.; Shang, L.; Tian, G.; Yang, S.; Ma, J. Research advance of adjustment for pore size distribution of plant-based activated carbon. Biomass Chem. Eng. 2022, 56, 57–66. [Google Scholar] [CrossRef]
- Wang, S.; Liu, Q.; Liao, Y.; Luo, Z.; Cen, K. A study on the mechanism research on cellulose pyrolysis under catalysis of metallic salts. Korean J. Chem. Eng. 2007, 24, 336–340. [Google Scholar] [CrossRef]
- Abd Hamid, S.B.; Teh, S.J.; Lim, Y.S. Catalytic Hydrothermal upgrading of α-cellulose using iron salts as a lewis acid. Bioresources 2015, 10, 5974–5986. [Google Scholar] [CrossRef]
- Xu, Z.; Zhou, Y.; Sun, Z.; Zhang, D.; Huang, Y.; Gu, S.; Chen, W. Understanding reactions and pore-forming mechanisms between waste cotton woven and FeCl3 during the synthesis of magnetic activated carbon. Chemosphere 2020, 241, 125120. [Google Scholar] [CrossRef] [PubMed]
- Oliveira, L.C.; Pereira, E.; Guimaraes, I.R.; Vallone, A.; Pereira, M.; Mesquita, J.P.; Sapag, K. Preparation of activated carbons from coffee husks utilizing FeCl3 and ZnCl2 as activating agents. J. Hazard. Mater. 2009, 165, 87–94. [Google Scholar] [CrossRef]
- Ohmukai, Y.; Hasegawa, I.; Fujisawa, H.; Okuma, O.; Mae, K. Production of an iron-loaded carbonaceous material through pyrolyzing biomass impregnated with FeCl2. Fuel 2008, 87, 2041–2049. [Google Scholar] [CrossRef]
- Wu, X.; Ba, Y.; Wang, X.; Niu, M.; Fang, K. Evolved gas analysis and slow pyrolysis mechanism of bamboo by thermogravimetric analysis, fourier transform infrared spectroscopy and gas chromatography-mass spectrometry. Bioresour. Technol. 2018, 266, 407–412. [Google Scholar] [CrossRef]
- El-Sayed, S.A.; Mostafa, M.E. Pyrolysis characteristics and kinetic parameters determination of biomass fuel powders by differential thermal gravimetric analysis (TGA/DTG). Energy Convers. Manag. 2014, 85, 165–172. [Google Scholar] [CrossRef]
- Lo, S.F.; Wang, S.Y.; Tsai, M.J.; Lin, L.D. Adsorption capacity and removal efficiency of heavy metal ions by Moso and Ma bamboo activated carbons. Chem. Eng. Res. Des. 2012, 90, 1397–1406. [Google Scholar] [CrossRef]
- Zhang, Y.J.; Xing, Z.J.; Duan, Z.K.; Li, M.; Wang, Y. Effects of steam activation on the pore structure and surface chemistry of activated carbon derived from bamboo waste. Appl. Surf. Sci. 2014, 315, 279–286. [Google Scholar] [CrossRef]
- González, P.G.; Pliego-Cuervo, Y.B. Physicochemical and microtextural characterization of activated carbons produced from water steam activation of three bamboo species. J. Anal. Appl. Pyrolysis 2013, 99, 32–39. [Google Scholar] [CrossRef]
- Khalil, H.P.S.; Jawaid, M.; Firoozian, P.; Rashid, U.; Islam, A.; Akil, H.M. Activated carbon from various agricultural wastes by chemical activation with KOH: Preparation and characterization. J. Biobased Mater. Bioenergy 2013, 7, 708–714. [Google Scholar] [CrossRef]
- Liu, H.; Zhang, H.; Wu, H.; Liu, M.; Chang, J. Study on fabrication of bamboo based high specific surface area activated carbon. Chem. Ind. For. Prod. 2001, 21, 11–15. [Google Scholar]
- Zhang, Y.J. Preparation of Bamboo Based Activated Carbon and Its Application in Chromium Waste Water Treatment. Master’s Thesis, Xiangtan University, Xiangtan, China, 2015. (In Chinese). [Google Scholar] [CrossRef]
- Yang, H.; Huan, B.; Chen, Y.; Gao, Y.; Li, J.; Chen, H. Biomass-based pyrolytic polygeneration system for bamboo industry waste: Evolution of the char structure and the pyrolysis mechanism. Energy Fuel 2016, 30, 6430–6439. [Google Scholar] [CrossRef]
- Thommes, M.; Kaneko, K.; Neimark, A.V.; Olivier, J.P.; Rodriguez-Reinoso, F.; Rouquerol, J.; Sing, K.S. Physisorption of gases, with special reference to the evaluation of surface area and pore size distribution (IUPAC Technical Report). Pure Appl. Chem. 2015, 87, 1051–1069. [Google Scholar] [CrossRef]
- Zhang, W.; Chen, L.; Xu, L.; Dong, H.; Hu, H.; Xiao, Y.; Zheng, M.; Liu, Y.; Liang, Y. Advanced nanonetwork-structured carbon materials for high-performance formaldehyde capture. J. Colloid. Interf. Sci. 2019, 537, 562–568. [Google Scholar] [CrossRef] [PubMed]
- Gaikwad, M.S.; Balomajumder, C. Removal of Cr(VI) and fluoride by membrane capacitive deionization with nanoporous and microporous Limonia acidissima (wood apple) shell activated carbon electrode. Sep. Purif. Technol. 2018, 195, 305–313. [Google Scholar] [CrossRef]
- Xu, Z.; Tian, D.; Sun, Z.; Zhang, D.; Zhou, Y.; Chen, W.; Deng, H. Highly porous activated carbon synthesized by pyrolysis of polyester fabric wastes with different iron salts: Pore development and adsorption behavior. Colloid. Surface A 2019, 565, 180–187. [Google Scholar] [CrossRef]
- Hu, X.; Xu, J.; Wu, M.; Xing, J.; Bi, W.; Wang, K.; Ma, J. Effects of biomass pre-pyrolysis and pyrolysis temperature on magnetic biochar properties. J. Anal. Appl. Pyrolysis 2017, 127, 196–202. [Google Scholar] [CrossRef]
- Zhang, J.; Zhang, X.; Pang, L.; He, Z.; Sun, S. Research on performance of FeCl3 and FeCl2 solution systems. J. Shandong Jiaotong Univ. 2012, 20, 6. [Google Scholar] [CrossRef]
- Zhu, X.; Liu, Y.; Luo, G.; Qian, F.; Zhang, S.; Chen, J. Facile fabrication of magnetic carbon composites from hydrochar via simultaneous activation and magnetization for triclosan adsorption. Environ. Sci. Technol. 2014, 48, 5840–5848. [Google Scholar] [CrossRef]
- Panda, D.; Saini, C.; Kumar, E.A.; Singh, S.K. In situ casting of rice husk ash in metal organic frameworks induces enhanced CO2 capture performance. Sci. Rep. 2020, 10, 20219. [Google Scholar] [CrossRef]
- Li, L.; Li, Y.; Liu, Y.; Ding, L.; Jin, X.; Lian, H.; Zheng, J. Preparation of a novel activated carbon from cassava sludge for the high-efficiency adsorption of hexavalent chromium in potable water: Adsorption performance and mechanism insight. Water 2021, 13, 3602. [Google Scholar] [CrossRef]
- Rai, M.; Shahi, G.; Meena, V.; Meena, R.; Chakraborty, S.; Singh, R.; Rai, B.N. Removal of hexavalent chromium Cr(VI) using activated carbon prepared from mango kernel activated with H3PO4. Resour. Technol. 2016, 2, S63–S70. [Google Scholar]
- Mohan, D.; Rajput, S.; Singh, V.K.; Steele, P.H.; Pittman, C.U. Modeling and evaluation of chromium remediation from water using low cost biochar, a green adsorbent. J. Hazard. Mater. 2011, 188, 319–333. [Google Scholar] [CrossRef]
- Al-Othman, Z.; Ali, R.; Naushad, M. Hexavalent chromium removal from aqueous medium by activated carbon prepared from peanut shell: Adsorption kinetics, equilibrium and thermodynamic studies. Chem. Eng. J. 2012, 184, 238–247. [Google Scholar] [CrossRef]
- Chen, T.; Zhou, Z.; Xu, S.; Wang, H.; Lu, W. Adsorption behavior comparison of trivalent and hexavalent chromium on biochar derived from municipal sludge. Bioresour. Technol. 2015, 190, 388–394. [Google Scholar] [CrossRef] [PubMed]
- Shi, Y.; Zhang, T.; Ren, H.; Kruse, A.; Cui, R. Polyethylene imine modified hydrochar adsorption for chromium (VI) and nickel (II) removal from aqueous solution. Bioresour. Technol. 2018, 247, 370–379. [Google Scholar] [CrossRef]
- Sahlabji, T.; El-Nemr, M.A.; Nemr, A.E.; Ragab, S.; Alghamdi, M.M.; El-Zahhar, A.A.; Idris, A.A.; Monit Said, T.O. High surface area microporous activated carbon from Pisum sativum peels for hexavalent chromium removal from aquatic environment. Toxin Rev. 2022, 41, 639–649. [Google Scholar] [CrossRef]
- Fu, K.; Yue, Q.; Gao, B.; Wang, Y.; Li, Q. Activated carbon from tomato stem by chemical activation with FeCl2. Colloid. Surface A 2017, 529, 842–849. [Google Scholar] [CrossRef]
Figure 1.
Standard curve of Cr(VI) concentration.

Figure 2.
TG-DTG curves of bamboo powder (a) and FeCl2/bamboo powder and (b) yields of activated carbons prepared at different activation temperatures (c).
Figure 2.
TG-DTG curves of bamboo powder (a) and FeCl2/bamboo powder and (b) yields of activated carbons prepared at different activation temperatures (c).

Figure 3.
SEM images of bamboo powder (a), activated carbon (b,c), and TEM micrograph of activated carbon (d).
Figure 3.
SEM images of bamboo powder (a), activated carbon (b,c), and TEM micrograph of activated carbon (d).

Figure 4.
Nitrogen adsorption–desorption isotherms of activated carbons.

Figure 5.
Pore size distribution of activated carbons.

Figure 6.
FTIR spectra of activated carbons.

Figure 7.
X-ray diffraction of activated carbons.

Figure 8.
Adsorption capacity for Cr(VI) of activated carbons.

Figure 9.
The pseudo−first−order kinetic model (a) and the pseudo−second−order kinetic model (b) of Cr(VI) adsorption by activated carbons.
Figure 9.
The pseudo−first−order kinetic model (a) and the pseudo−second−order kinetic model (b) of Cr(VI) adsorption by activated carbons.

Figure 10.
Langmuir adsorption isotherm model (a) and Freundlich adsorption isotherm model (b) of Cr(VI) adsorption by activated carbons.
Figure 10.
Langmuir adsorption isotherm model (a) and Freundlich adsorption isotherm model (b) of Cr(VI) adsorption by activated carbons.


Table 1.
Pore structure characteristics of activated carbons.
| Samples | SBET (m2/g) | Smic (m2/g) | Smes (m2/g) | Vtot (m3/g) | Vmic (m3/g) | Vmes (m3/g) | Dp (nm) |
|---|---|---|---|---|---|---|---|
| ACFe700 | 670.00 | 581.21 | 54.76 | 0.40 | 0.24 | 0.13 | 2.32 |
| ACFe800 | 1030.36 | 944.18 | 54.95 | 0.54 | 0.38 | 0.14 | 2.09 |
| ACFe900 | 1290.93 | 1192.19 | 69.70 | 0.67 | 0.49 | 0.17 | 2.08 |
| ACFe1000 | 719.09 | 510.92 | 42.93 | 0.33 | 0.21 | 0.10 | 2.27 |
Table 2.
Comparison of adsorption capacities of various biomass-derived activated carbons.
| Adsorbent | Adsorption Capacity (mg/g) | Reference |
|---|---|---|
| ACFe900 | 13.65 | Present work |
| Cassava sludge | 9.84 | [38] |
| Mango kernel | 6.08 | [39] |
| Oak wood | 5.50 | [40] |
| Peanut shell | 8.31 | [41] |
| Municipal sludge | 7.00 | [42] |
Table 3.
Adsorption dynamic model fitting parameters.
| Adsorbent | Experimental Value | Pseudo-First-Order Kinetic Model | Pseudo-Second-Order Kinetic Model | ||||
|---|---|---|---|---|---|---|---|
| qe.exp (mg/g) | qe.cal (mg/g) | K1 (min−1) | R2 | qe.cal (mg/) | K2 (g/mg·min) | R2 | |
| ACFe700 | 8.73 | 6.98 | 0.0162 | 0.9460 | 9.51 | 0.0035 | 0.9858 |
| ACFe800 | 12.86 | 10.73 | 0.0187 | 0.9719 | 13.87 | 0.0031 | 0.9977 |
| ACFe900 | 13.65 | 10.91 | 0.0164 | 0.9470 | 14.97 | 0.0032 | 0.9929 |
| ACFe1000 | 6.98 | 5.72 | 0.0199 | 0.9570 | 7.43 | 0.0078 | 0.9914 |
Table 4.
Langmuir and Freundlich adsorption isothermal model for Cr(VI) fitting parameters.
| Adsorbent | Langmuir Model | Freundlich Model | ||||
|---|---|---|---|---|---|---|
| qm (mg/g) | KL (L/g) | R2 | KF (L/g) | n | R2 | |
| ACFe700 | 123.61 | 0.008 | 0.4557 | 1.22 | 1.12 | 0.9788 |
| ACFe800 | 59.00 | 0.045 | 0.8130 | 3.55 | 1.14 | 0.9346 |
| ACFe900 | 175.13 | 0.015 | 0.7123 | 3.74 | 1.46 | 0.9932 |
| ACFe1000 | 25.09 | 0.024 | 0.8803 | 1.18 | 1.09 | 0.9854 |
Disclaimer/Publisher’s Note: The statements, opinions and data contained in all publications are solely those of the individual author(s) and contributor(s) and not of MDPI and/or the editor(s). MDPI and/or the editor(s) disclaim responsibility for any injury to people or property resulting from any ideas, methods, instructions or products referred to in the content. |
© 2023 by the authors. Licensee MDPI, Basel, Switzerland. This article is an open access article distributed under the terms and conditions of the Creative Commons Attribution (CC BY) license (https://creativecommons.org/licenses/by/4.0/).
Share and Cite
MDPI and ACS Style
Zhong, M.; Liu, X.; Ma, J.; Shang, L. Bamboo-Activated Carbon Synthesized by One-Pot Pyrolysis and FeCl2 Activation for the Removal of Cr(VI) in Aqueous Solutions. Water 2023, 15, 1891. https://doi.org/10.3390/w15101891
AMA Style
Zhong M, Liu X, Ma J, Shang L. Bamboo-Activated Carbon Synthesized by One-Pot Pyrolysis and FeCl2 Activation for the Removal of Cr(VI) in Aqueous Solutions. Water. 2023; 15(10):1891. https://doi.org/10.3390/w15101891
Chicago/Turabian StyleZhong, Meijuan, Xinge Liu, Jianfeng Ma, and Lili Shang. 2023. "Bamboo-Activated Carbon Synthesized by One-Pot Pyrolysis and FeCl2 Activation for the Removal of Cr(VI) in Aqueous Solutions" Water 15, no. 10: 1891. https://doi.org/10.3390/w15101891
Note that from the first issue of 2016, this journal uses article numbers instead of page numbers. See further details here.