Article

Enhanced Removal of As(V) and Pb(II) from Drinking and Irrigating Water Effluents Using Hydrothermally Synthesized Zeolite 5A

by
Angie F. Mayta-Armas
1,
Yamerson Canchanya-Huaman
1,
Jemina Pomalaya-Velasco
1,
Yéssica Bendezú-Roca
1,
Noemi-Raquel Checca-Huaman
2 and
Juan A. Ramos-Guivar
3,*
1
Laboratorio de No Metálicos, Facultad de Ingeniería Química, Universidad Nacional del Centro del Perú (UNCP), Av. Mariscal Ramón Castilla N° 3909, El Tambo, Huancayo 12000, Peru
2
Centro Brasileiro de Pesquisas Físicas, Rio de Janeiro 22290-180, RJ, Brazil
3
Grupo de Investigación de Nanotecnología Aplicada para Biorremediación Ambiental, Energía, Biomedicina y Agricultura (NANOTECH), Facultad de Ciencias Físicas, Universidad Nacional Mayor de San Marcos, Av. Venezuela Cdra 34 S/N, Ciudad Universitaria, Lima 15081, Peru
*
Author to whom correspondence should be addressed.
Water 2023, 15(10), 1892; https://doi.org/10.3390/w15101892
Submission received: 28 March 2023 / Revised: 10 April 2023 / Accepted: 10 April 2023 / Published: 17 May 2023
(This article belongs to the Section Soil and Water)

Abstract

:
Zeolites 5A were obtained by ion exchange of a zeolite 4A, previously synthesized by the hydrothermal method from precursor kaolin, with the aim of removal As(V) from drinking water and Pb(II) from irrigation surface water. Zeolite 5A was characterized before and after adsorption by X-ray diffraction, scanning electron microscopy, energy dispersive spectroscopy, and X-ray photoelectron spectroscopy. To find the adsorption mechanisms of both As and Pb in real waters, experiments on adsorption kinetics, optimum pH, adsorbent dose, and adsorption isotherms were developed. Adsorption kinetics and adsorption isotherm models were evaluated, and the selection criterion for the appropriate model was made using the residual sum of squares (RSS) and Bayesian information criterion (BIC). As a result, removal adsorption of As(V) and Pb(II) was higher than 95% in 9 and 12 h, respectively. The estimated maximum adsorption capacities for As and Pb were 36.35 mg g−1 and 46.67 mg g−1, respectively. Zeolite 5A is a low-cost adsorbent, through which a concentration of less than 0.01 mg L−1 of As and Pb was obtained in drinking and irrigation water, which is below the permissible limit established by the World Health Organization (WHO).

1. Introduction

A few metals are essential for some living beings, but if they exceed certain concentrations, they become toxic [1]. Among them is arsenic (As), which is known as a very dangerous and toxic contaminant present in water bodies, and which is being consumed by humans in drinking water and through water used to irrigate crops. The compounds of As are odorless and tasteless, making it impossible to detect their presence in water and food. Therefore, water pollution with arsenic is a current problem faced by many countries in the world, since it can cause damage to health by prolonged consumption of water at concentrations greater than the 0.01 mg L−1 limit recommended by the World Health Organization (WHO). This can cause chronic intoxication, and the most common effects are skin cancer and skin lesions. Moreover, it causes liver and kidney diseases, cardiovascular disease, diabetes, neurotoxicity, and developmental problems [2]. As is found in water effluents with a valence state of +3 and +5, as As(III) trivalent state, or arsenite, and As(V) pentavalent state, or arsenate. Arsenite is the state with greater mobility in the medium and which presents greater affinity to proteins; hence, it is more toxic than arsenate [3]. In reducing environments, predominantly in groundwater, arsenite transport is allowed; on the other hand, in oxidizing environments typical of free aquifers, such as surface water, arsenate is transported. Removal of As(III) by adsorption, ion exchange, or other treatment technologies is difficult, but As(V) at pH 4–6 can be removed by a variety of adsorbents or other chemicals [4].
Furthermore, lead (Pb) is another heavy metal that is very polluting. This is a chemical element that is rarely found free in nature, and it is mostly combined with other metals (lead glance) [5]. The lead species has an oxidation state (+2) in the liquid phase, and when it is in the solid phase, it has an oxidation state (+4). Pb ions generate high toxic effects at low concentrations and can accumulate in the nutrient chain, causing serious health problems in humans [6]. This problem occurs mostly in developing countries, where industrial activities such as mining, glass–ceramic production, fertilizer use, textile production, coating, automotive production, and use in metallurgical industries are growing [7,8]. The heavy metals are discharged into surface waters, thus degrading their quality and limiting their use, but the main problem is in the consumption of these waters, because they cause potential damage to the central nervous system and reproductive functions, and they can result in cancer and brain damage, in addition to affecting organs such as the liver and kidney [9].
Currently, different treatment techniques have been developed for the removal of As and Pb from water. Conventional methods include coagulation and precipitation, ion exchange, adsorption, reverse osmosis, and others [10,11,12]. The coagulation–precipitation method requires large-scale installations for its application; reverse osmosis requires membranes with costly maintenance or replacement; and ion exchange is limited due to exchange competition with other ions, as well as using expensive resins [13]. Adsorption is proposed because it is one of the most widely used methods for the removal of heavy metals in aqueous media. This method has great advantages, such as high adsorption capacity, fast kinetics, compact facilities, and reuse sustainability, and it does not produce chemical sludge or huge amounts of water that requires post-treatment after its application. In addition, it is very economical [6,14,15]. Within adsorption, the use of nanotechnology has been developed for the removal of As and Pb as a more economical and efficient alternative due to the larger surface area of the adsorbents; the use of zeolite nanoparticles for this purpose has attracted much interest. The efficiency of this method depends on both the characteristics of the adsorbent and the adsorbate. An effective adsorbent for the removal of certain species from water must have a high surface area and an affinity for the adsorbate. The characteristics of the adsorbate to be taken into account are polarity, water solubility, molecular size, and shape [3]. In addition, its dependence on parameters such as temperature, contact time, adsorbent dose, and pH of the medium must be considered. It should be remembered that this method is limited by the adsorption capacity of the adsorbent since it can be affected by competition from other ions presented in water bodies.
Zeolites have demonstrated remarkable adsorption capacities for heavy metals in aqueous solutions and desalinization processes due to their porosity and chemical composition characteristics. Several researchers have studied the removal of As(V) and Pb(II) using both natural and synthetic zeolites [16,17,18,19,20,21]; however, natural zeolites have a disadvantage in their composition since they have other metals and crystalline phases [22]. Among the different types of zeolites, zeolites A are promising due to their well-defined structure and high porosity, as well as due to their high cation exchange capacity and large number of active sites. Using zeolite 5A, an As(V) removal efficiency of 95.59% has been achieved from an aqueous solution of As(V) with an initial concentration of 100 mg L−1 [23], and the percentage removal of Pb(II) achieved was 96.3% in a solution with a concentration of Pb (II) 50 mg L−1 [24].
As mentioned above, zeolite 5A is a promising adsorbent for the removal of As and Pb in synthetic solutions of a unique heavy metal ion. However, experiments in real waters have not been carried out using this adsorbent yet, so such results are not determinant for an effective application in real contaminated waters, where there is coexistence of other ions. Therefore, there is even less knowledge with respect to the evaluation of equilibrium time, the study of kinetic models, optimum pH, adsorbent dose, and isotherm modeling of the adsorption process for As(V) and Pb(II) using zeolite 5A obtained from kaolin. More importantly, no work has been performed on the removal of As(V) and Pb(II) in water used for human consumption and irrigation, and little is known about the physicochemical properties after adsorption of these heavy metals.
The main objective of this work is to study the adsorption of As(V) and Pb(II) on zeolite 5A in real water with the presence of other ions, and the results can be applied to the design of a water treatment system using a low cost and easy to synthesize adsorbent. For this purpose, zeolite 5A has been synthesized by a novel hydrothermal method from kaolin, as well as 11Z5A, for As(V) removal, and 18PZ5A, for Pb(II) removal. These zeolites were characterized (before and after adsorption) by X-ray diffraction (XRD), scanning electron microscopy (SEM), transmission electron microscopy (TEM), energy dispersive spectroscopy (EDS), and X-ray photoelectron spectroscopy (XPS). Rietveld refinement determined a nanocrystallite size of 99.21 nm and 68.53 nm for 11Z5A and 18PZ5A, respectively. As(V) and Pb(II) adsorption experiments were carried out in drinking and irrigation waters at modified concentrations to evaluate the removal profile of the synthesized 5A zeolites, the optimal removal conditions, and the adsorption mechanism. Finally, both zeolites were applied to these drinking and irrigation waters without concentration modifications, achieving concentrations of less than 0.01 mg L−1, below the permissible limit established by the WHO.

2. Materials and Methods

2.1. Materials and Chemicals

Kaolin and commercial 5A zeolite were obtained from Sigma Aldrich (Burlington, MA, USA) and used without further purification. Water concentrations were adjusted using analytical grade sodium arsenate salt (Na2HAsO4•7H2O) which was obtained from Sigma Aldrich, and the lead standard with a concentration of 999 ± 3 µg mL−1 was purchased from SCP Science. Sodium hydroxide (NaOH) and hydrochloric acid (HCl) of analytical grade were obtained from Merck.
Drinking water with As was obtained from the natural water source of Quero, Junin, Peru, located at the geographical coordinates 9°35′21.2″ S 39°55′34.4″ W, which had a concentration of 0.0583 mg L−1 of As. Irrigation water with Pb was obtained from the CIMIRM irrigation canal, El Mantaro, Junin, Peru, with geographic coordinates 11°41′21.5″ S 75°22′24.5″ W and with a Pb concentration of 0.0178 mg L−1. The sampling protocol consisted of collecting 20 L of water in a sampling bucket previously rinsed three times with the water to be sampled. Samples were taken from the surface to avoid raising sediments. After sampling, they were preserved with HNO3 (1:1) until reaching pH < 2.

2.2. Synthesis of Adsorbents

Zeolite 5A was obtained by ion exchange of a zeolite 4A synthesized by the hydrothermal method from kaolin, comprising: (1) the process of metakaolinization that consisted of a thermal treatment of kaolin, (2) synthesis of zeolite 4A, in which metakaolin was mixed with NaOH solution under stirring, and finally, (3) obtaining zeolite 5A by ion exchange, where zeolite 4A was dissolved in a solution of CaCl2 under constant stirring. Two types of zeolites were prepared (11Z5A and 18PZ5A) by varying the NaOH concentration in the hydrothermal reaction and the temperature and time in the cation exchange, which are described in reference [25].

2.3. Characterization of the Adsorbents

The samples were characterized by X-ray diffraction (XRD) experiments that were performed using an Empyrean diffractometer operating with CuKα radiation at wavelength λ = 1.5406 Å. The diffractograms were collected using a step scanning configuration between 2θ = 5–80° and 0.01° per step. Crystallographic phase identification of the synthesized zeolite 5A was conducted by Match V3 software having the initial parameters of the cubic crystalline structure, space group Fm 3 ¯ c , cell parameter a = 24.47 Å, and with the crystallographic information files (CIF) #2102128. The software FullProf Suite (Gif sur Yvette Cedex, France, version January 2021) was employed for the Rietveld refinement, where the Thompson–Cox–Hastings (TCH) pseudo-Voigt Axial divergence asymmetry function was used as a function of the diffraction peak profile. Finally, the Caglioti parameters, U = 0.0093, V = −0.0051, and W = 0.0013 from the instrumental resolution function (IRF) of the diffractometer have been obtained from the aluminum oxide Al2O3 standard [26,27].
For determination of average particle size and zeolite’s morphologies, the electron imaging (EM) microscopy technique was applied. The elemental compositions of the samples were investigated by EDS mapping to evaluate the atomic composition.
Chemical surface analyses on the studied samples were performed by X-ray photoelectron spectroscopy (XPS) using the SPECS PHOIBOS 100/150 equipment with a hemispheric analyzer spectrometer, operating at 1486.6 eV of Al Kα. The XPS spectra were collected with a high-resolution polychromatic X-ray source within an energy step of 0.02 eV. Casa-XPS software (SPECS company) was used to adjust the peak positions of the Al 2p, Si 2p, O 1s, Ca 2p, Na 1s, As 3p, Pb 4f, and C 1s levels to figure out the chemical binding energies (BE) of the formed species, as well as to calculate the relative atomic quantities on the sample surfaces. The spectra were calibrated using adventitious carbon (B.E. reference) at C 1s = 284.6 eV after previously using the electron flood gun at 12 µA and 1 eV.

2.4. Adsorption Experiments

2.4.1. Arsenic Removal

For the experiments, drinking water was required, and the As(V) concentration was increased from 0.058 mg L−1 to 23.083 mg L−1 by dilution from a stock solution of As(V) to 100 mg L−1.
  • Adsorption kinetics
The As(V) adsorption kinetics of contaminated water were developed to determine the equilibrium time and to study the kinetic models. The adsorption process consisted of using a dose of 11Z5A of 2 g L−1, stirred at 200 rpm, pH 6.5, at room temperature (RT), for different contact times in the range of 1 to 30 h. Once the adsorption process was finished, the solution was filtered with filter paper N° 42 (125 mm) until a solution free of suspended particles was obtained.
  • pH effect
After determining the optimum time, the dependence of pH on the As(V) adsorption process was evaluated. Seven experiments were performed, which consisted of using a dose of 11Z5A of 2 g L−1 under constant agitation at 200 rpm, RT, optimal time, and varying the pH in the range of 2 to 10. The pH was adjusted by adding drops of NaOH and HCl at different concentrations. (0.05 M, 0.1 M, 1 M, and 4 M). After adsorption, the samples were filtered.
  • Adsorbent dose
The purpose of the dose effect was to find the highest adsorption percentage in which the amount of adsorbent matches the amount of As ions. The process consisted of varying the adsorbent dose in the range of 1 to 4 g L−1, working with 50 mL of drinking water, at optimum pH, optimum time, agitated at 200 rpm, and at RT. After the adsorption process, the samples were filtered.
  • Adsorption isotherms
Finally, to determine the maximum adsorption capacity, experiments were carried out by varying the concentration of As in the drinking water from 3 to 80 mg L−1. From the previous experiments, optimum time, pH, and adsorbent dose were defined. The experiments were performed with 50 mL of contaminated water, agitated at 200 rpm at RT, and after agitation, the samples were filtered. The results aim to obtain an adsorption model and study its nature according to the best fit to the Freundlich, Langmuir, Redlich Peterson, Sips, and Temkin isotherm models.
  • Removal of As from drinking water using 11Z5A
Arsenic removal experiments were carried out with 11Z5A in the Quero water source, Jauja, Junin with an actual As concentration of 0.0583 mg L−1. First, experiments to evaluate the optimum adsorbent dose were carried out in the range of 1 g L−1 to 4 g L−1, at pH 6.5, contact time of 18 h, agitated at 200 rpm, and RT. Second, a factorial design was carried out to evaluate the influence of two factors on As removal. These factors were: pH (4.5, 5.5, and 6.5) and contact time (8, 13, and 18 h). During the interaction of the three levels the adsorbent was kept constant at the dose previously determined.

2.4.2. Lead Removal

For the following removal experiments, irrigation water was required, and the Pb(II) concentration was increased from 0.018 mg L−1 to 56.35 mg L−1 by dilution from a stock solution of Pb(II) 1000 mg L−1.
  • Adsorption kinetics
The adsorption kinetics of Pb(II) in contaminated waters were developed to determine the equilibrium time. The adsorption process consisted of using a dose of 18PZ5A of 1 g L−1, stirred at 200 rpm, pH 5.5, at different contact times in a range from 1 to 27 h. The solution was then filtered with filter paper N° 42 to obtain a solution free of suspended particles.
  • pH effect
A total of 6 experiments were carried out in which 0.05 g of zeolite 5A was added to 50 mL of contaminated water, stirred at 200 rpm while varying the pH in the range of 2–8, and at RT. To stabilize and maintain the pH constant, as required, it was necessary to use NaOH and HCl solutions at different concentrations (0.05 M, 0.1 M, 1 M, and 4 M).
  • Adsorption isotherms
Finally, knowing the equilibrium time and optimum pH, the maximum adsorption capacity was determined. The adsorption isotherm experiments were carried out by varying the concentrations in a range from 5 to 60 mg L−1, using a dose of 18PZ5A adsorbent of 1 g L−1, under constant agitation at 200 rpm at RT.
  • Removal of Pb from irrigation water with 18PZ5A
The removal of Pb with 18PZ5A from CIMIRM canal water at an actual concentration of 0.018 mg L−1 Pb was carried out in 50 mL of water, with a dose of 18PZ5A of 1 g L−1 at a pH of 6.5, contact time of 1 h, stirred at 200 rpm, and at RT.

2.4.3. Theorical Background of Adsorption Models

For the study of the adsorption process of As and Pb on zeolite 5A, both adsorption kinetic models and adsorption isotherms were applied, which will be described below.
  • Adsorption kinetics models
The pseudo-first order (PFO) kinetic model describes the initial stage of the adsorption process [28] and assumes that each metal ion of either As or Pb corresponds to an adsorption site of 11Z5A and 18PZ5A, respectively [29]. The PFO equation is described as follows:
dq t dt = k 1 q e q t
where qe and qt (mg g−1) represent the adsorbed amounts at equilibrium and at time t (h) respectively, k1 (h−1) is the adsorption rate constant. Integrating Equation (1) for the following boundary conditions (t = 0, qt = 0 and t = t, qt = qt), gives the following Equation (2):
q t = q e 1 e k 1 t
applying a natural logarithm to both members of Equation (2) allows us to obtain Equation (3):
ln q e q t = ln q e k 1 t
Assuming that the adsorbate is adsorbed on the active sites of the adsorbent [29], the pseudo second order (PSO) equation is given as [30]:
dq t dt = k 2 q e q t 2
where k2 (g mg−1 h−1) is the PSO adsorption kinetic rate constant. Integrating Equation (4), using the same boundary conditions as in the PFO model, gives us:
q t = k 2 q e 2 t 1 + k 2 q e 2 t
By subtracting t and qt from Equation (5), the following Equation (6) is obtained:
t q t = 1 k 2 q e 2 + t q e
The Elovich (E) kinetic approach is expressed by Equation (7) [29]:
dq t dt = α e β q t
where β (g mg−1) is the desorption constant linked to surface coverage and α is the initial adsorption rate (mg g−1 h−1). Through integrating Equation (7) with the same boundary conditions as described in the previous models, Equation (8) is obtained:
q = 1 β ln α β + 1 β ln t
The intraparticle diffusion model (IDM) is based on adsorbate transport through the internal structure of the adsorbent pores and diffusion of itself into the adsorbate, which results in the adsorbent having a homogeneous porous structure [29]. This process is controlled by adsorption in the adsorbent pores. Equation (9) defines the IDM:
q t = k p t + C 1
where k p (mg g−1 h−1/2) is the intraparticle diffusion rate constant and C1 is the boundary layer thickness (mg g−1). Intraparticle diffusion is characterized by the dependence between the specific adsorption and the square root of the contact time, where the slope is the intraparticle diffusion speed [31].
  • Adsorption isotherm models
The Langmuir isotherm model assumes that only one solute species will occupy an active site on the homogeneous surface of the adsorbent [30], and that there are no interactions between adsorbed species [32]. Equation (10) represents the above-mentioned model:
q e = K L C e q max   1 + k L C e
where Ce (mg L−1) is the equilibrium concentration of the adsorbate, qmax (mg g−1) is the maximum adsorption capacity, and KL (L mg−1) is a constant related to the adsorption energy.
The Freundlich isotherm model assumes that the adsorption process occurs on heterogeneous surfaces and does not restrict the formation of monolayers or a multilayer [30]. This is expressed by Equation (11).
q e = k F C e 1 n
where kF (mg g−1) (mg L−1)−1/n is a constant representing the adsorption capacity, and n is the adsorption intensity.
Redlich–Peterson is a three-parameter model, a hybrid Langmuir–Freundlich [33]. It can be applied in both homogeneous and heterogeneous systems, and its empirical equation is presented in Equation (12).
q e = AC e   1 + BC e β
where A is the Redlich–Peterson isotherm constant (L g−1), B is a constant (L mg−1), and β is the exponent whose value is given between 0 and 1. When β = 1, the equation reduces to the Langmuir model equation (at high concentrations); if β tends to zero, it approaches the Freundlich isotherm model (at high concentrations), and, when β = 0, it reduces at Henry’s equation [34,35].
Sips isotherm model is a three-parameter model, a combination of Langmuir and Freundlich isotherm models. It predicts non-uniform surfaces in the adsorption. The model is described in Equation (13).
q e = q m s k s C e m s   1 + k s C e m s
where q m s (mg g−1) is the Sips maximum adsorption capacity, ks  ( L   mg 1 ) m s is the Sips equilibrium constant, and ms is the Sips model constant. At low adsorbate concentrations, when Ce and ks approach 0, the Sips equation approximates the Freundlich isotherm, but, at high adsorbate concentrations, when ms is equals 1, a monolayer adsorption capacity typical of the Langmuir isotherm is expected [36].
The Temkin model assumes that adsorption decreases with increasing adsorbent surface sites and a homogeneous distribution of binding energies up to a maximum binding energy. It is used for adsorption heat research. Equation (14) shows the Temkin isotherm model:
q e = RT b T ln K T C e
where R (8.31 J mol−1 K−1) is the gas constant, T (K) is the absolute temperature, bT (J mol−1) is the variation of the adsorption energy, and KT (L g−1) is the constant equilibrium bond [37].

2.4.4. Error Analysis

An error analysis is required to decide on the model that best fits the experimental data, because both kinetic models and adsorption isotherms have different numbers of parameters that prevent them from being compared under the same criteria. Furthermore, it is not enough to conclude which model fits better based on the correlation coefficient (R2). The following statistical equations are considered:
  • Residual sum of squares (RSS):
    RSS = i n q i , exp q i , model 2
  • Bayesian information criterion (BIC):
    BIC = nLn RSS n + pLn n
where qi,exp is the experimental adsorption capacity, qi,model is the theoretical adsorption capacity determined by the model, n is the number of experimental data, and p is the number of parameters estimated in the fit model [38]. As a selection criterion, the model with the lowest BIC value is the best fitting model [39].

3. Results and Discussion

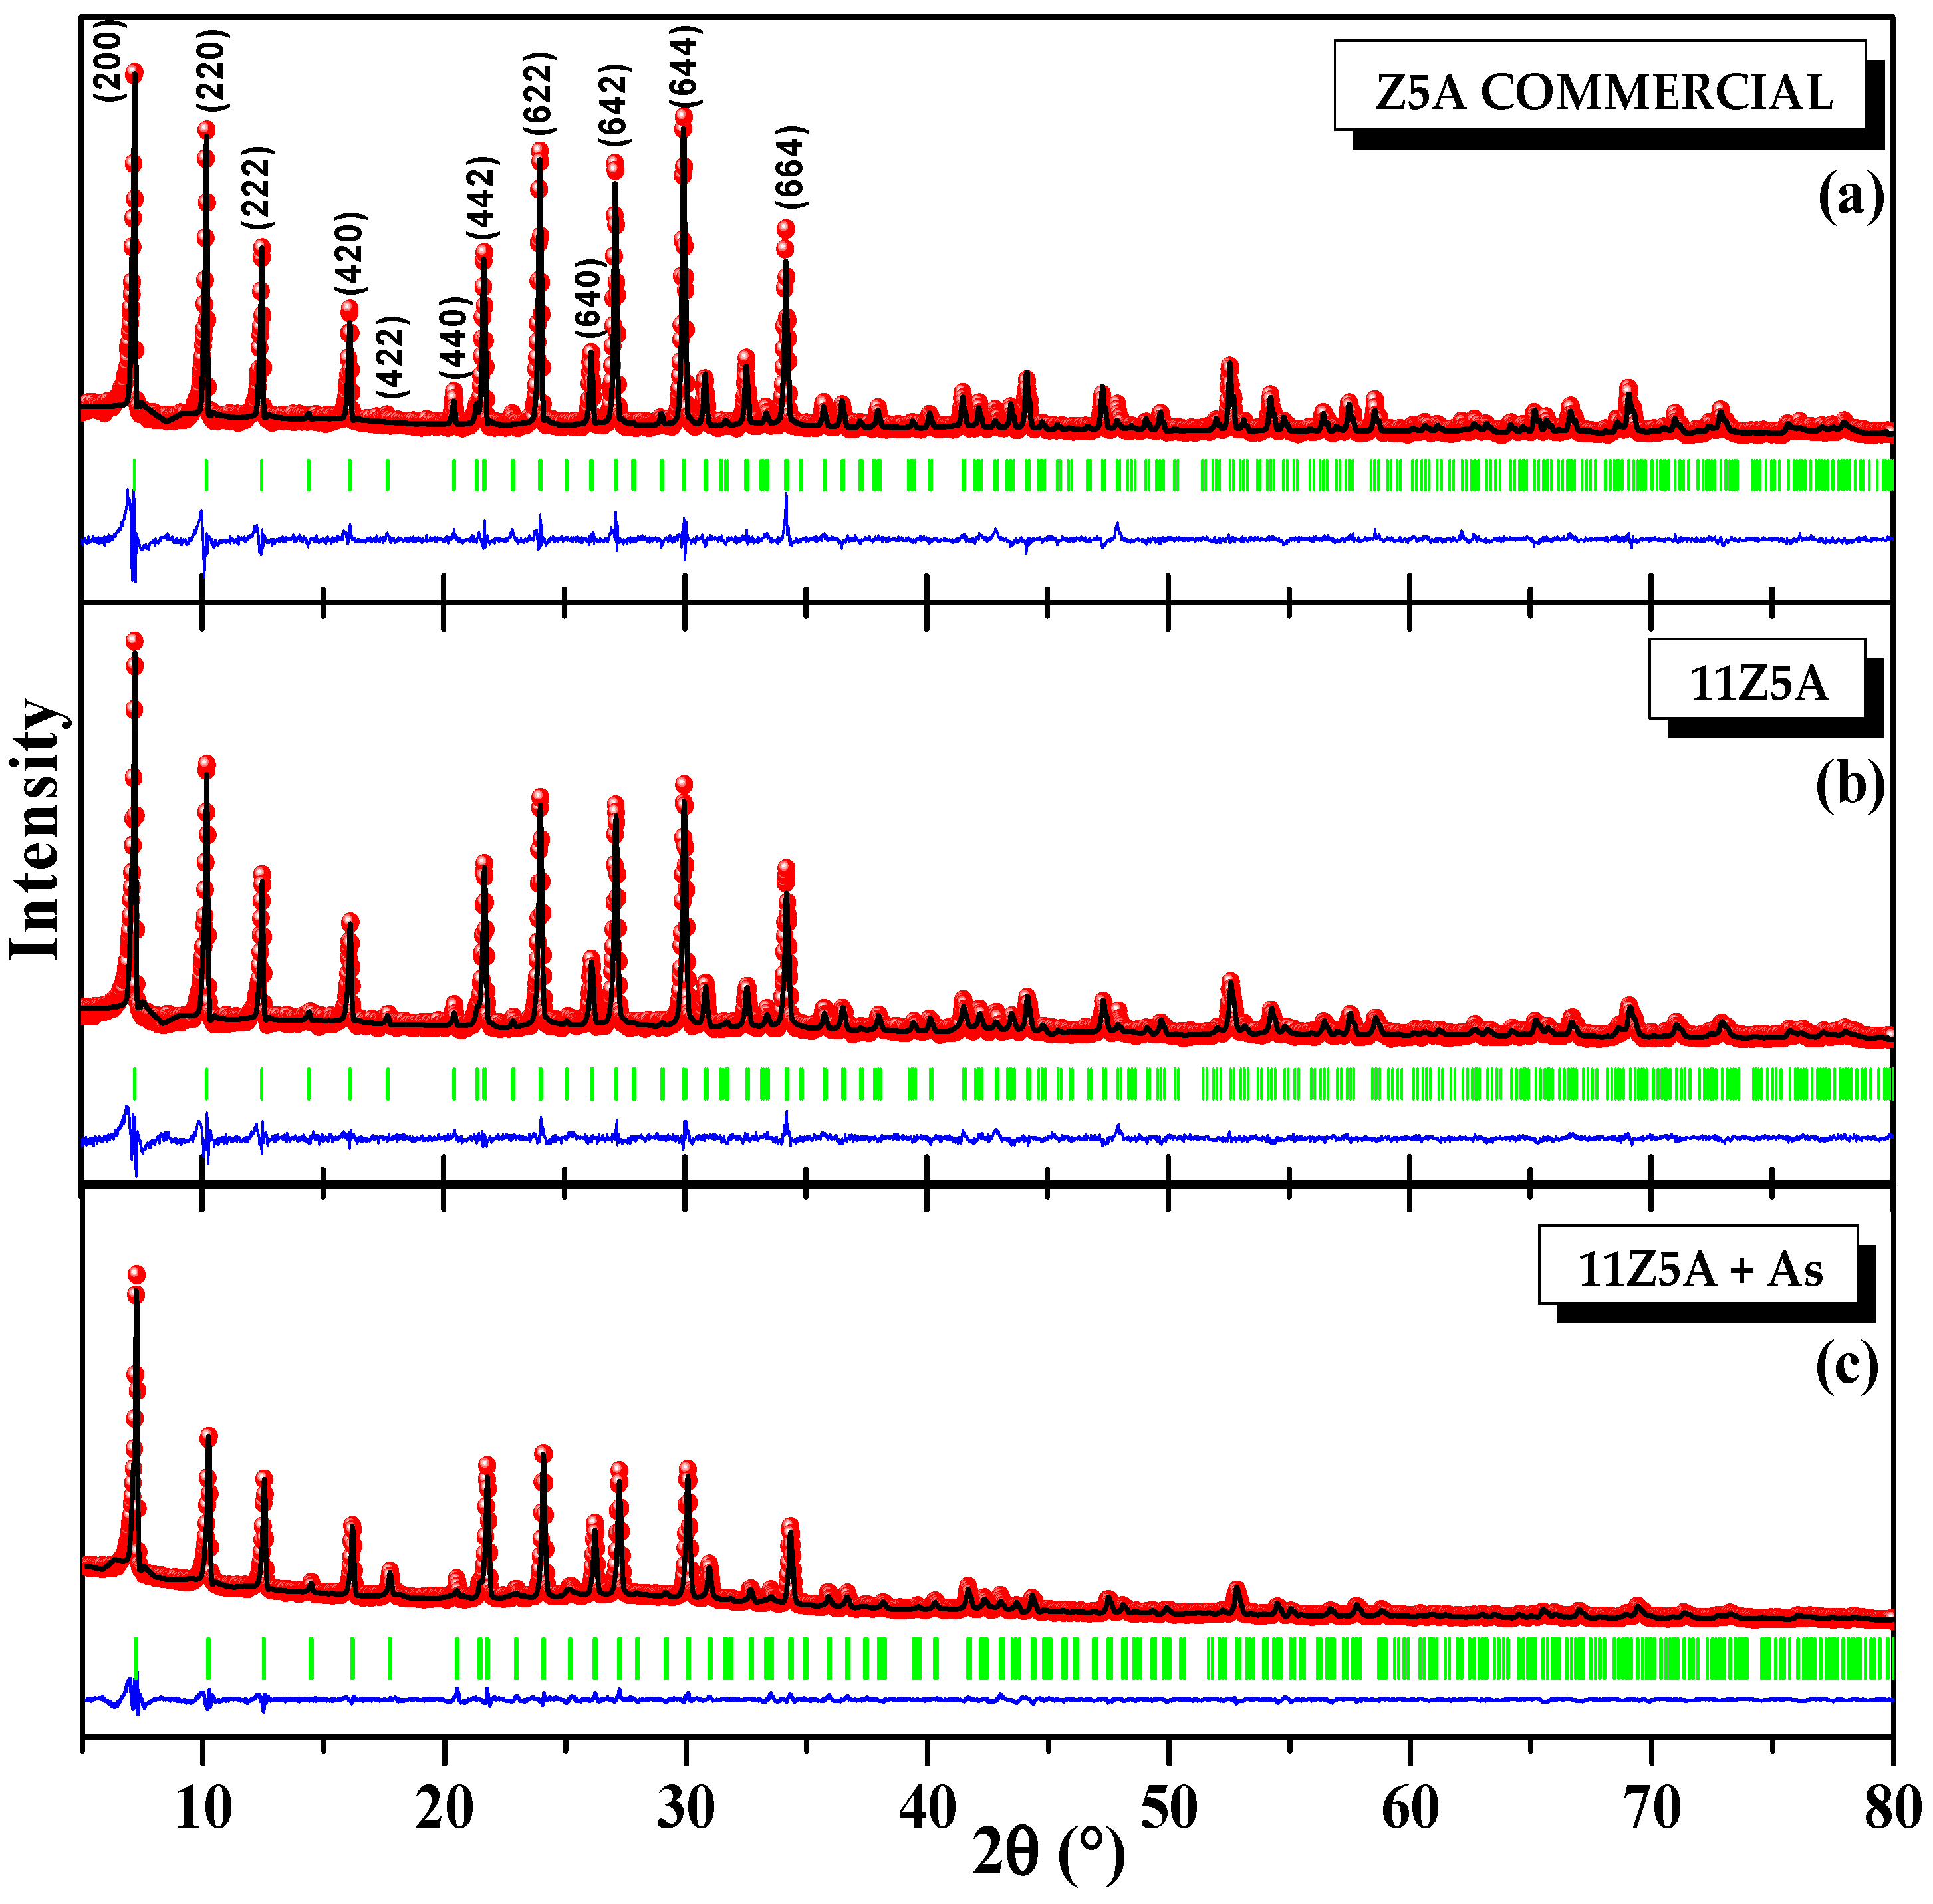
3.1. X-ray Diffraction and Rietveld Analysis of Zeolite 11Z5A (before and after As Adsorption Experiments)

Figure 1 shows the X-ray diffractograms of the synthesized and commercial zeolites 5A with the chemical formula 8 Ca 6 [ AlO 2 12 SiO 2 12 ] · 30 H 2 O , in which only zeolite 5A peaks of cubic structure are observed. The diffractogram of the synthesized zeolite 5A shows a high correspondence with the commercial zeolite sample, with a slight variation in intensity, indicating a minimal difference in purity and crystalline structure. It is observed that the characteristic peaks of the synthesized zeolite are consistent with the commercial zeolite, having some characteristic peaks at 2θ = 7.4°, 10.37°, 12.68°, and 16.34°, showing that the zeolite 5A synthesized from kaolin was successful. The goodness of fit is verified with low values of χ2 = 3.10 and 2.31 for commercial zeolite 5A and synthesized zeolite 5A, respectively. The average crystallite size was 99.21 nm for the synthesized zeolite 5A and 163.8 nm for the commercial zeolite 5A. Furthermore, in Figure 1, the refined diffractogram after adsorption of As(V) can be seen. When comparing with 11Z5A zeolites before the adsorption process, there was no significant change in the characteristic diffraction’s peaks, and no new peaks appeared, suggesting that the well-crystallized zeolites have been stable in As(V) removal, keeping their crystallite size (Table 1).
By comparing our results with those obtained by Nguyen et al. [40], no changes in their diffractogram before or after the adsorption process was observed. This may be due to the small amounts of As compared to the other compounds in the adsorbent, or that the possible As compounds that may be formed in the adsorption are amorphous or do not have a crystalline symmetry; neither case would be detected by XRD.

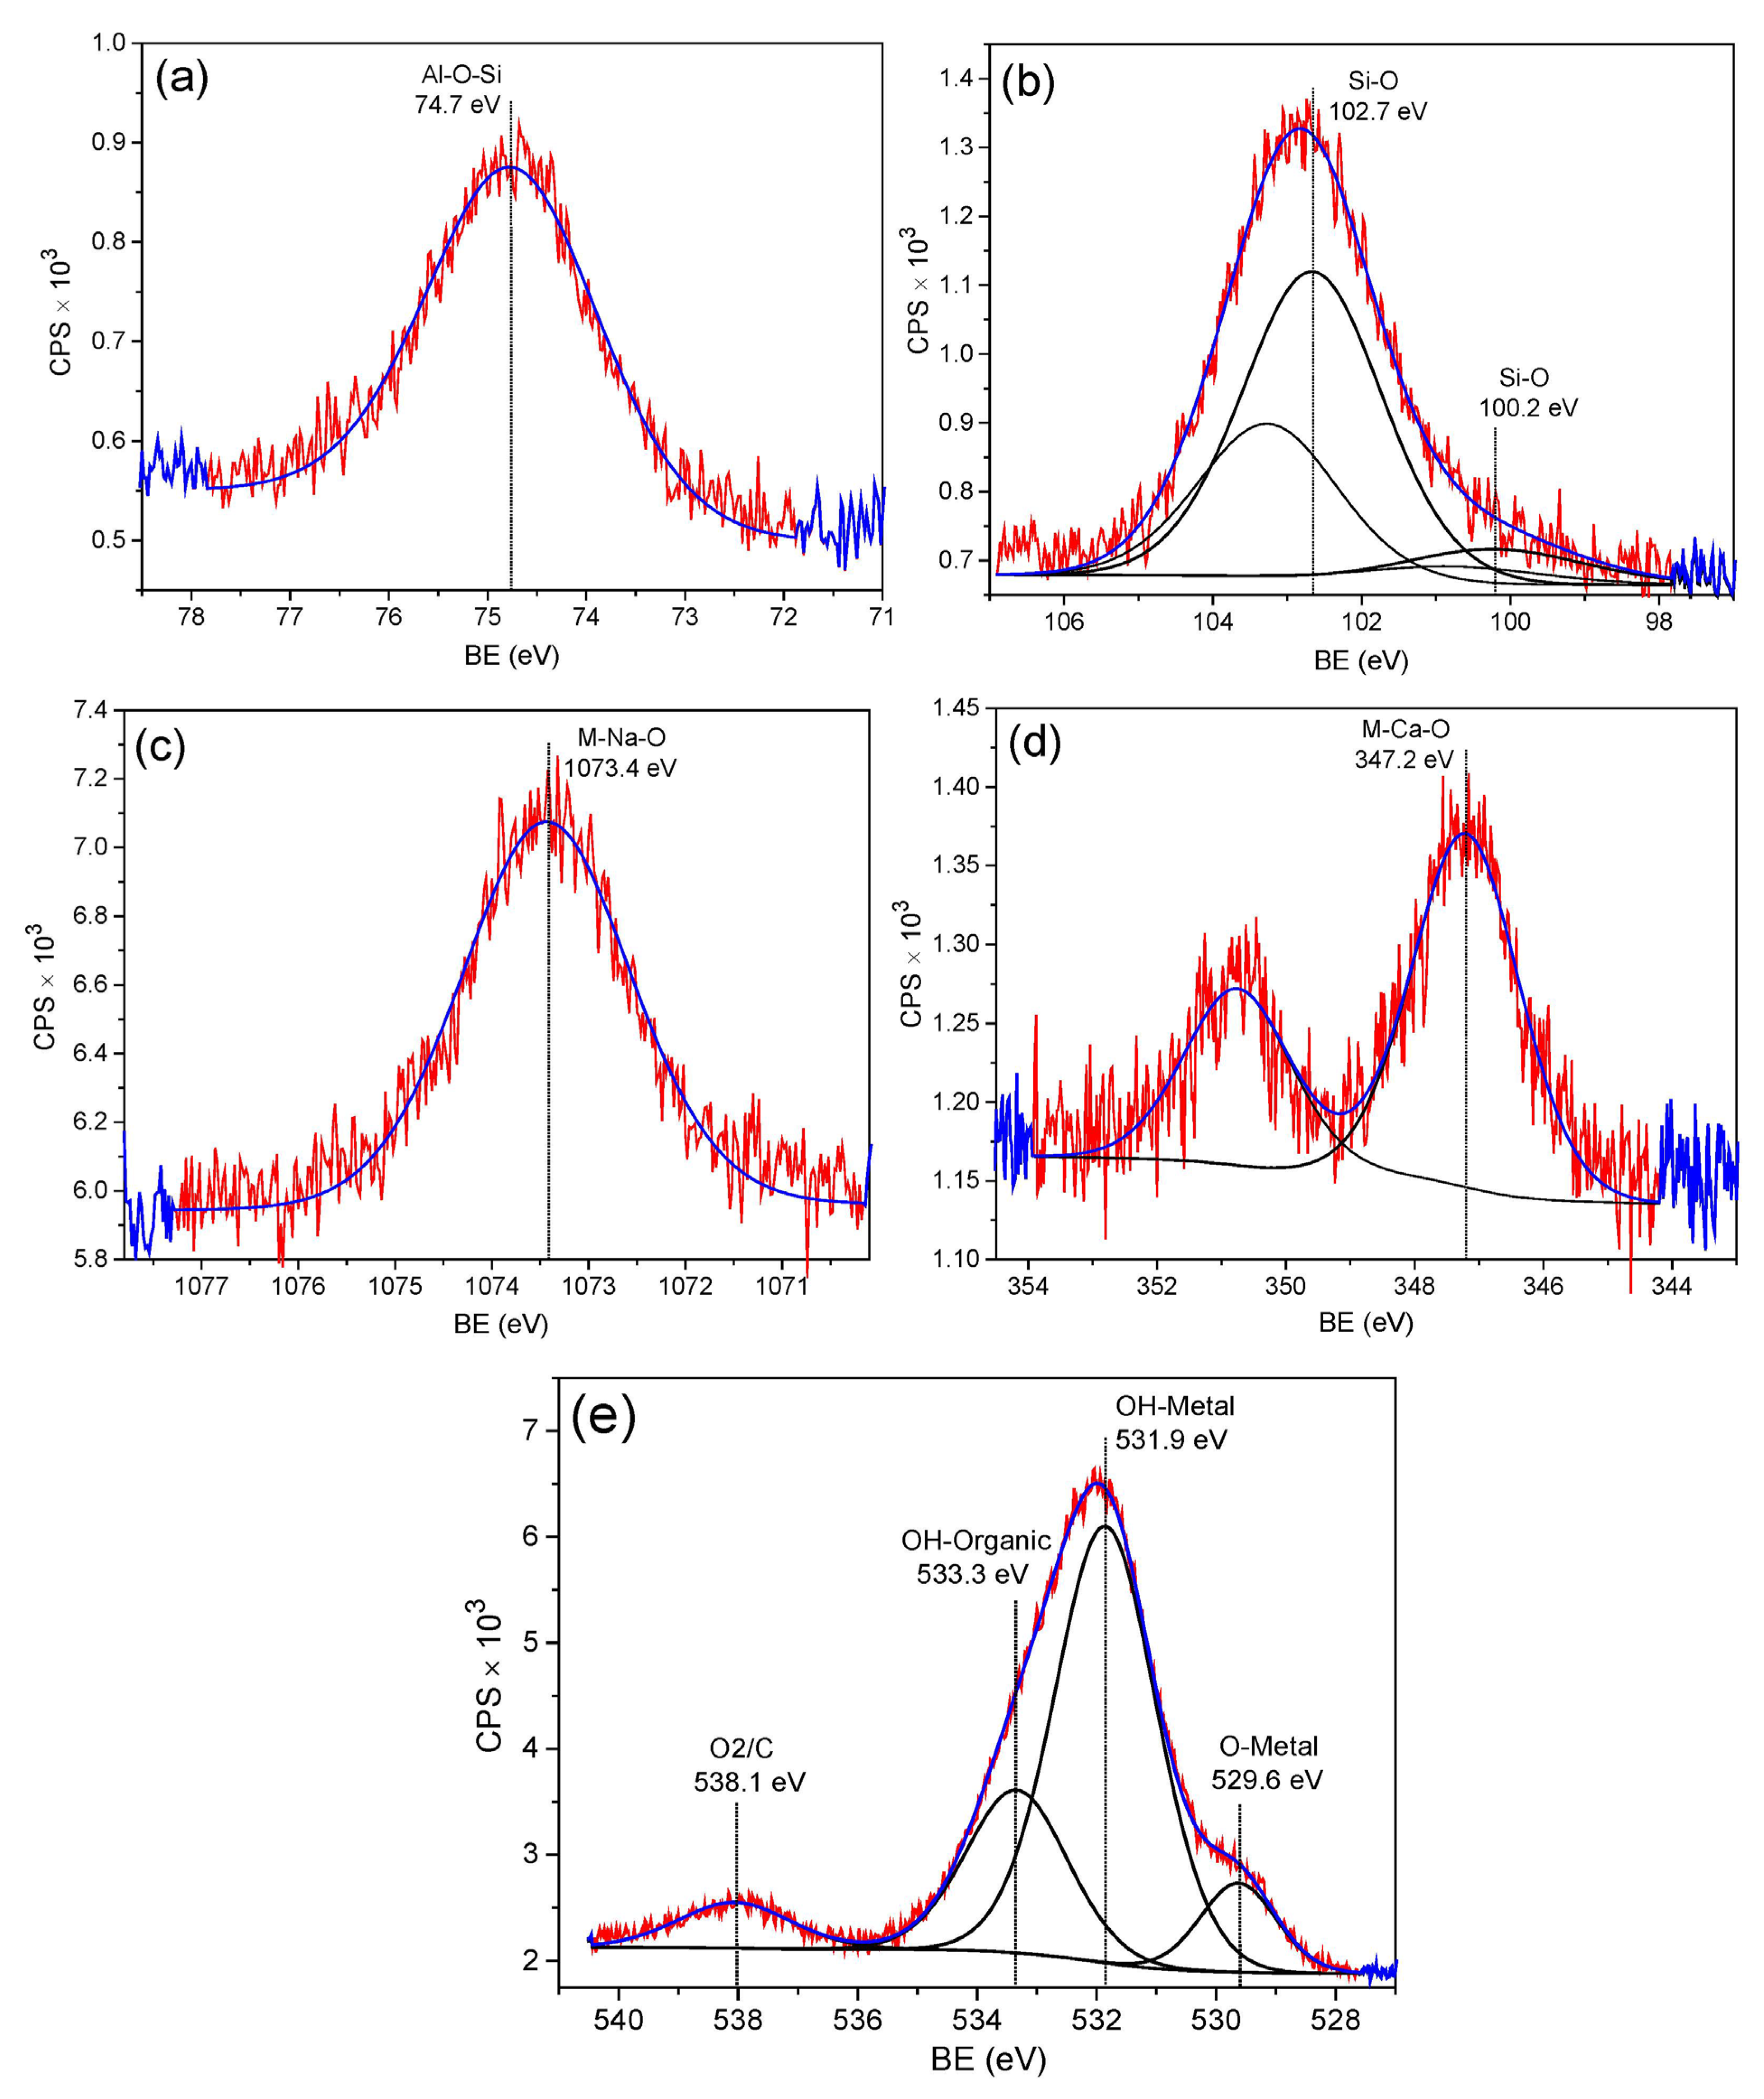
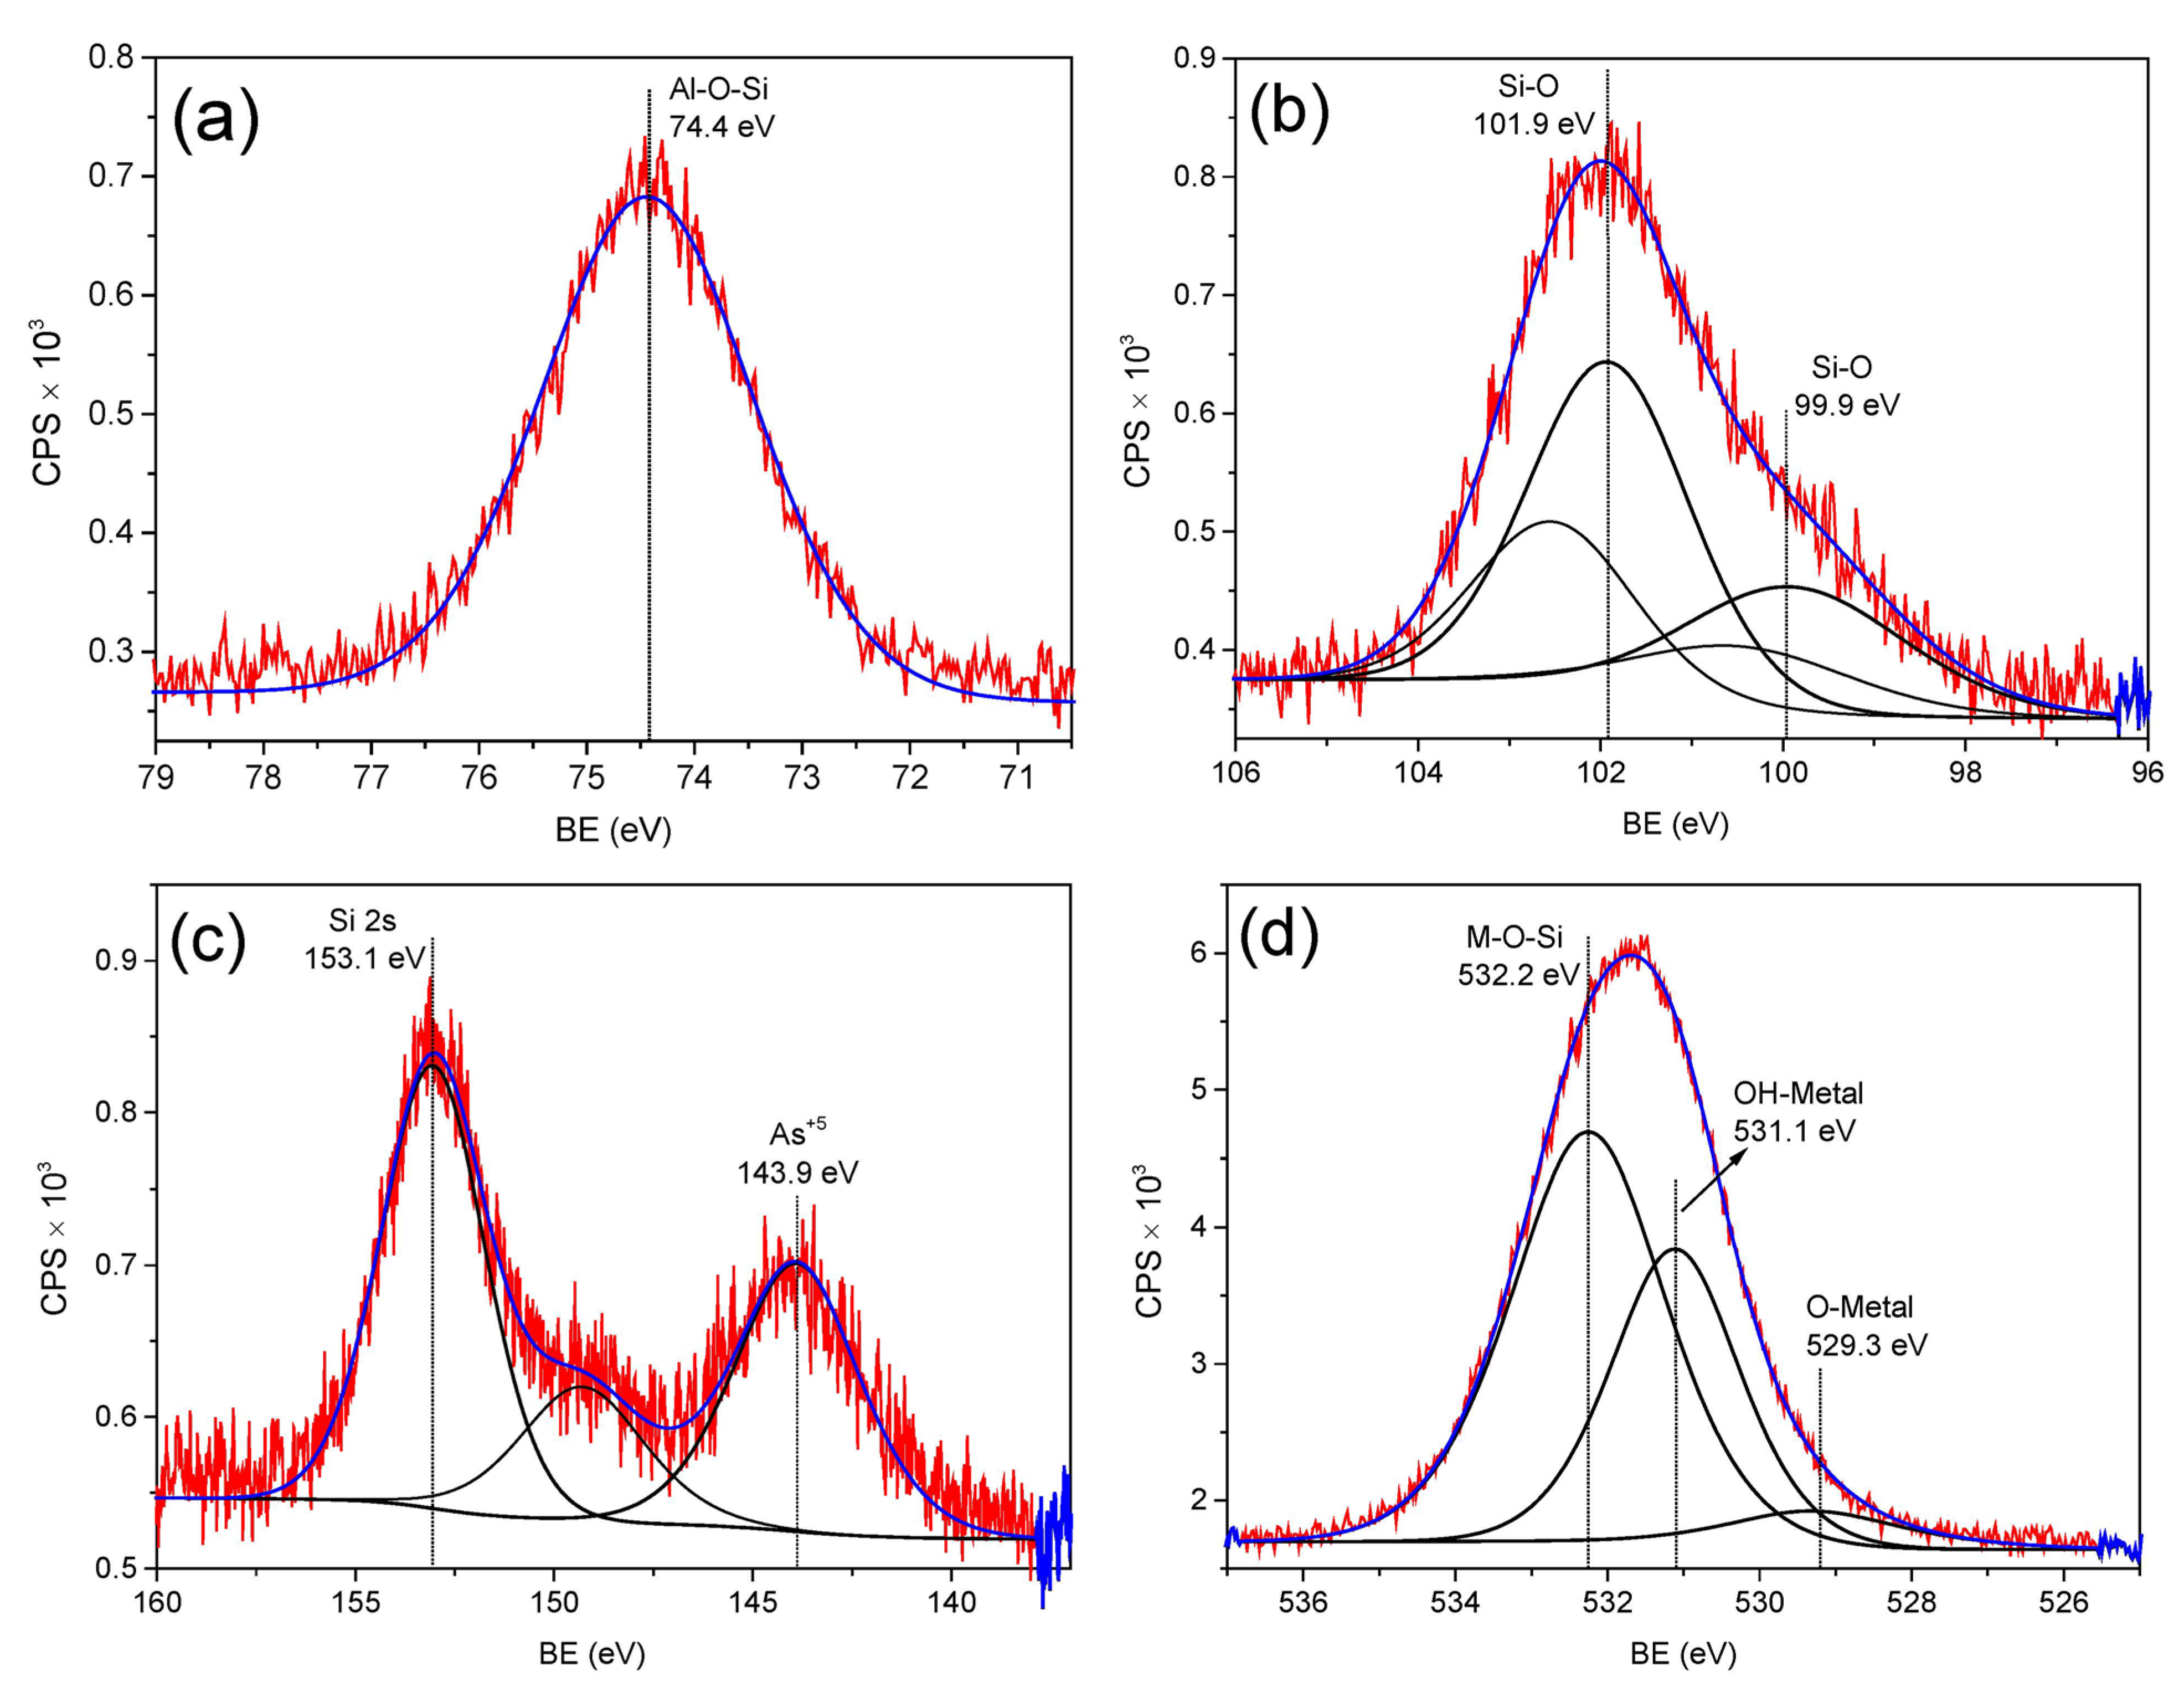
3.2. XPS Analysis of Zeolite 11Z5A (before and after As Adsorption Experiments)

Sample 11Z5A showed typical elements of a zeolite [41] rich in Na and Ca on its surface, as shown in Figure 2 and Table 2. The formation of SiO2 with binding energy of 102.7 eV was also observed [41]. The zeolite sample adsorbed with As (11Z5A-As) showed changes in the original surface, as seen in Figure 3. In this adsorption process, the release of Na and Ca occurred on the surface of the zeolite; in addition, we observed the release of the SiO2 detected in the original sample. Additionally, this adsorption process did not produce significant alteration in the oxidation states of the zeolite itself, as is the case for Al 2p and Si 2p. This indicates that the incorporation of As occurred in the sites released by Na and Ca.

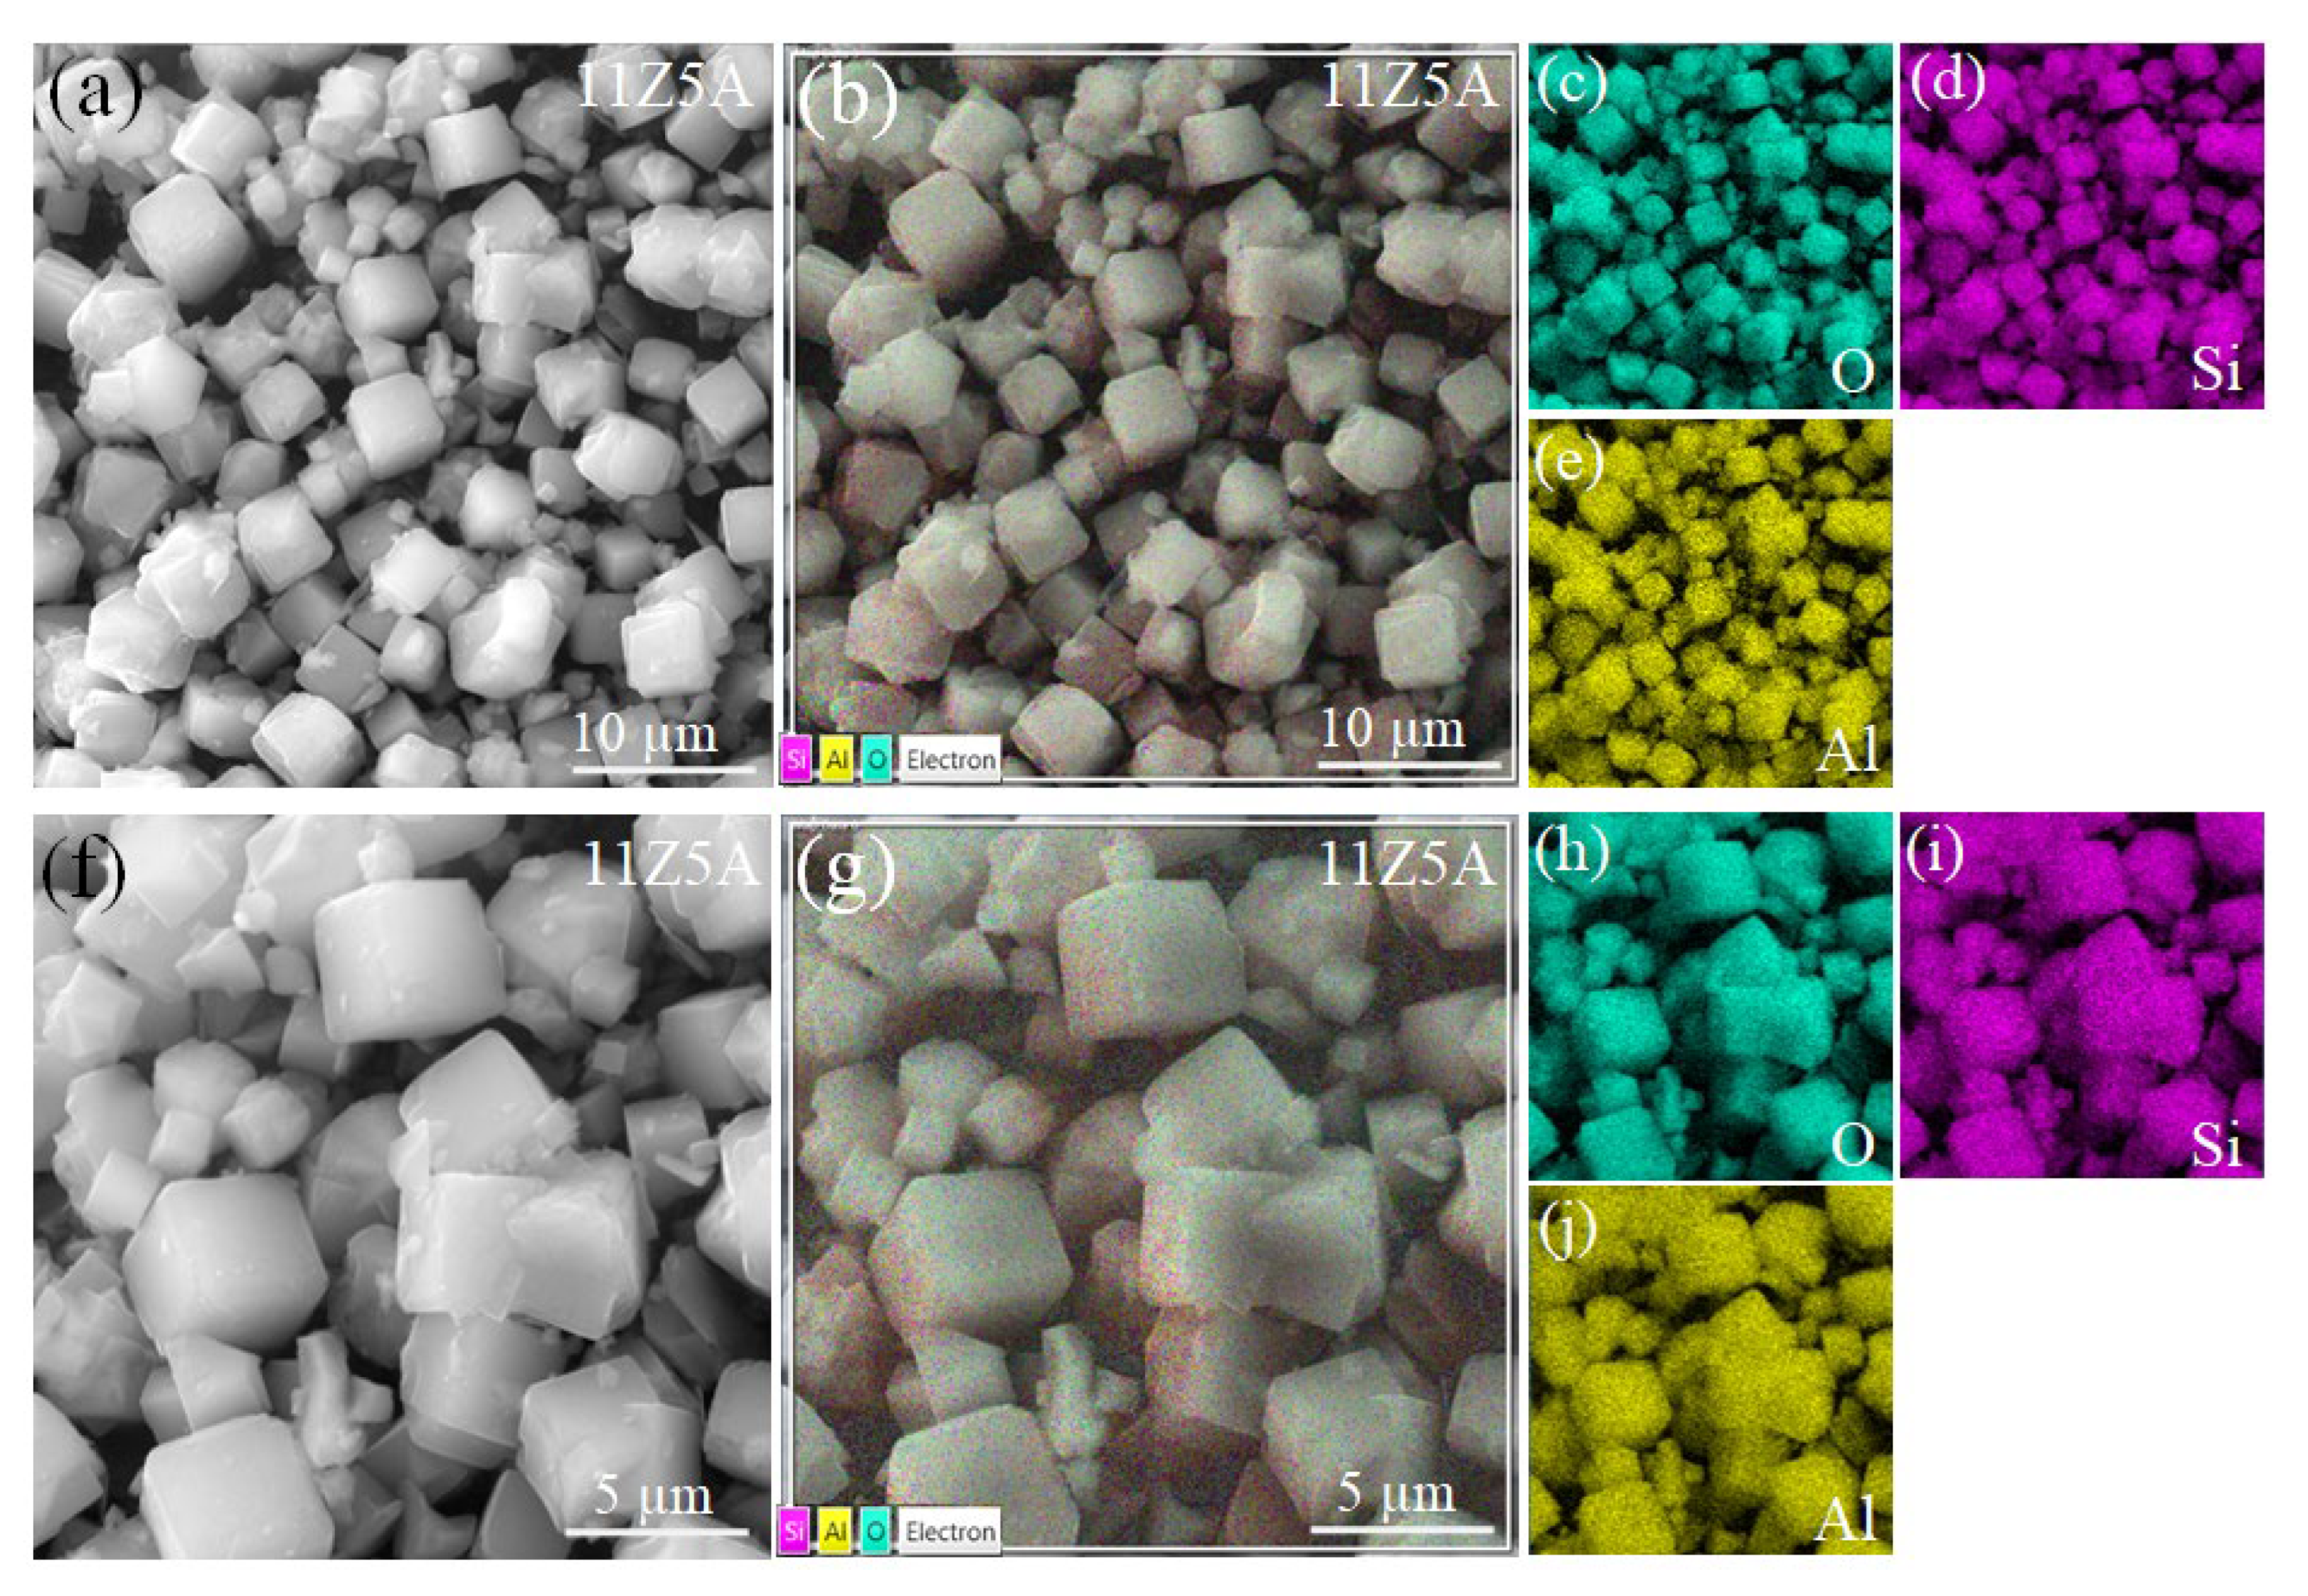
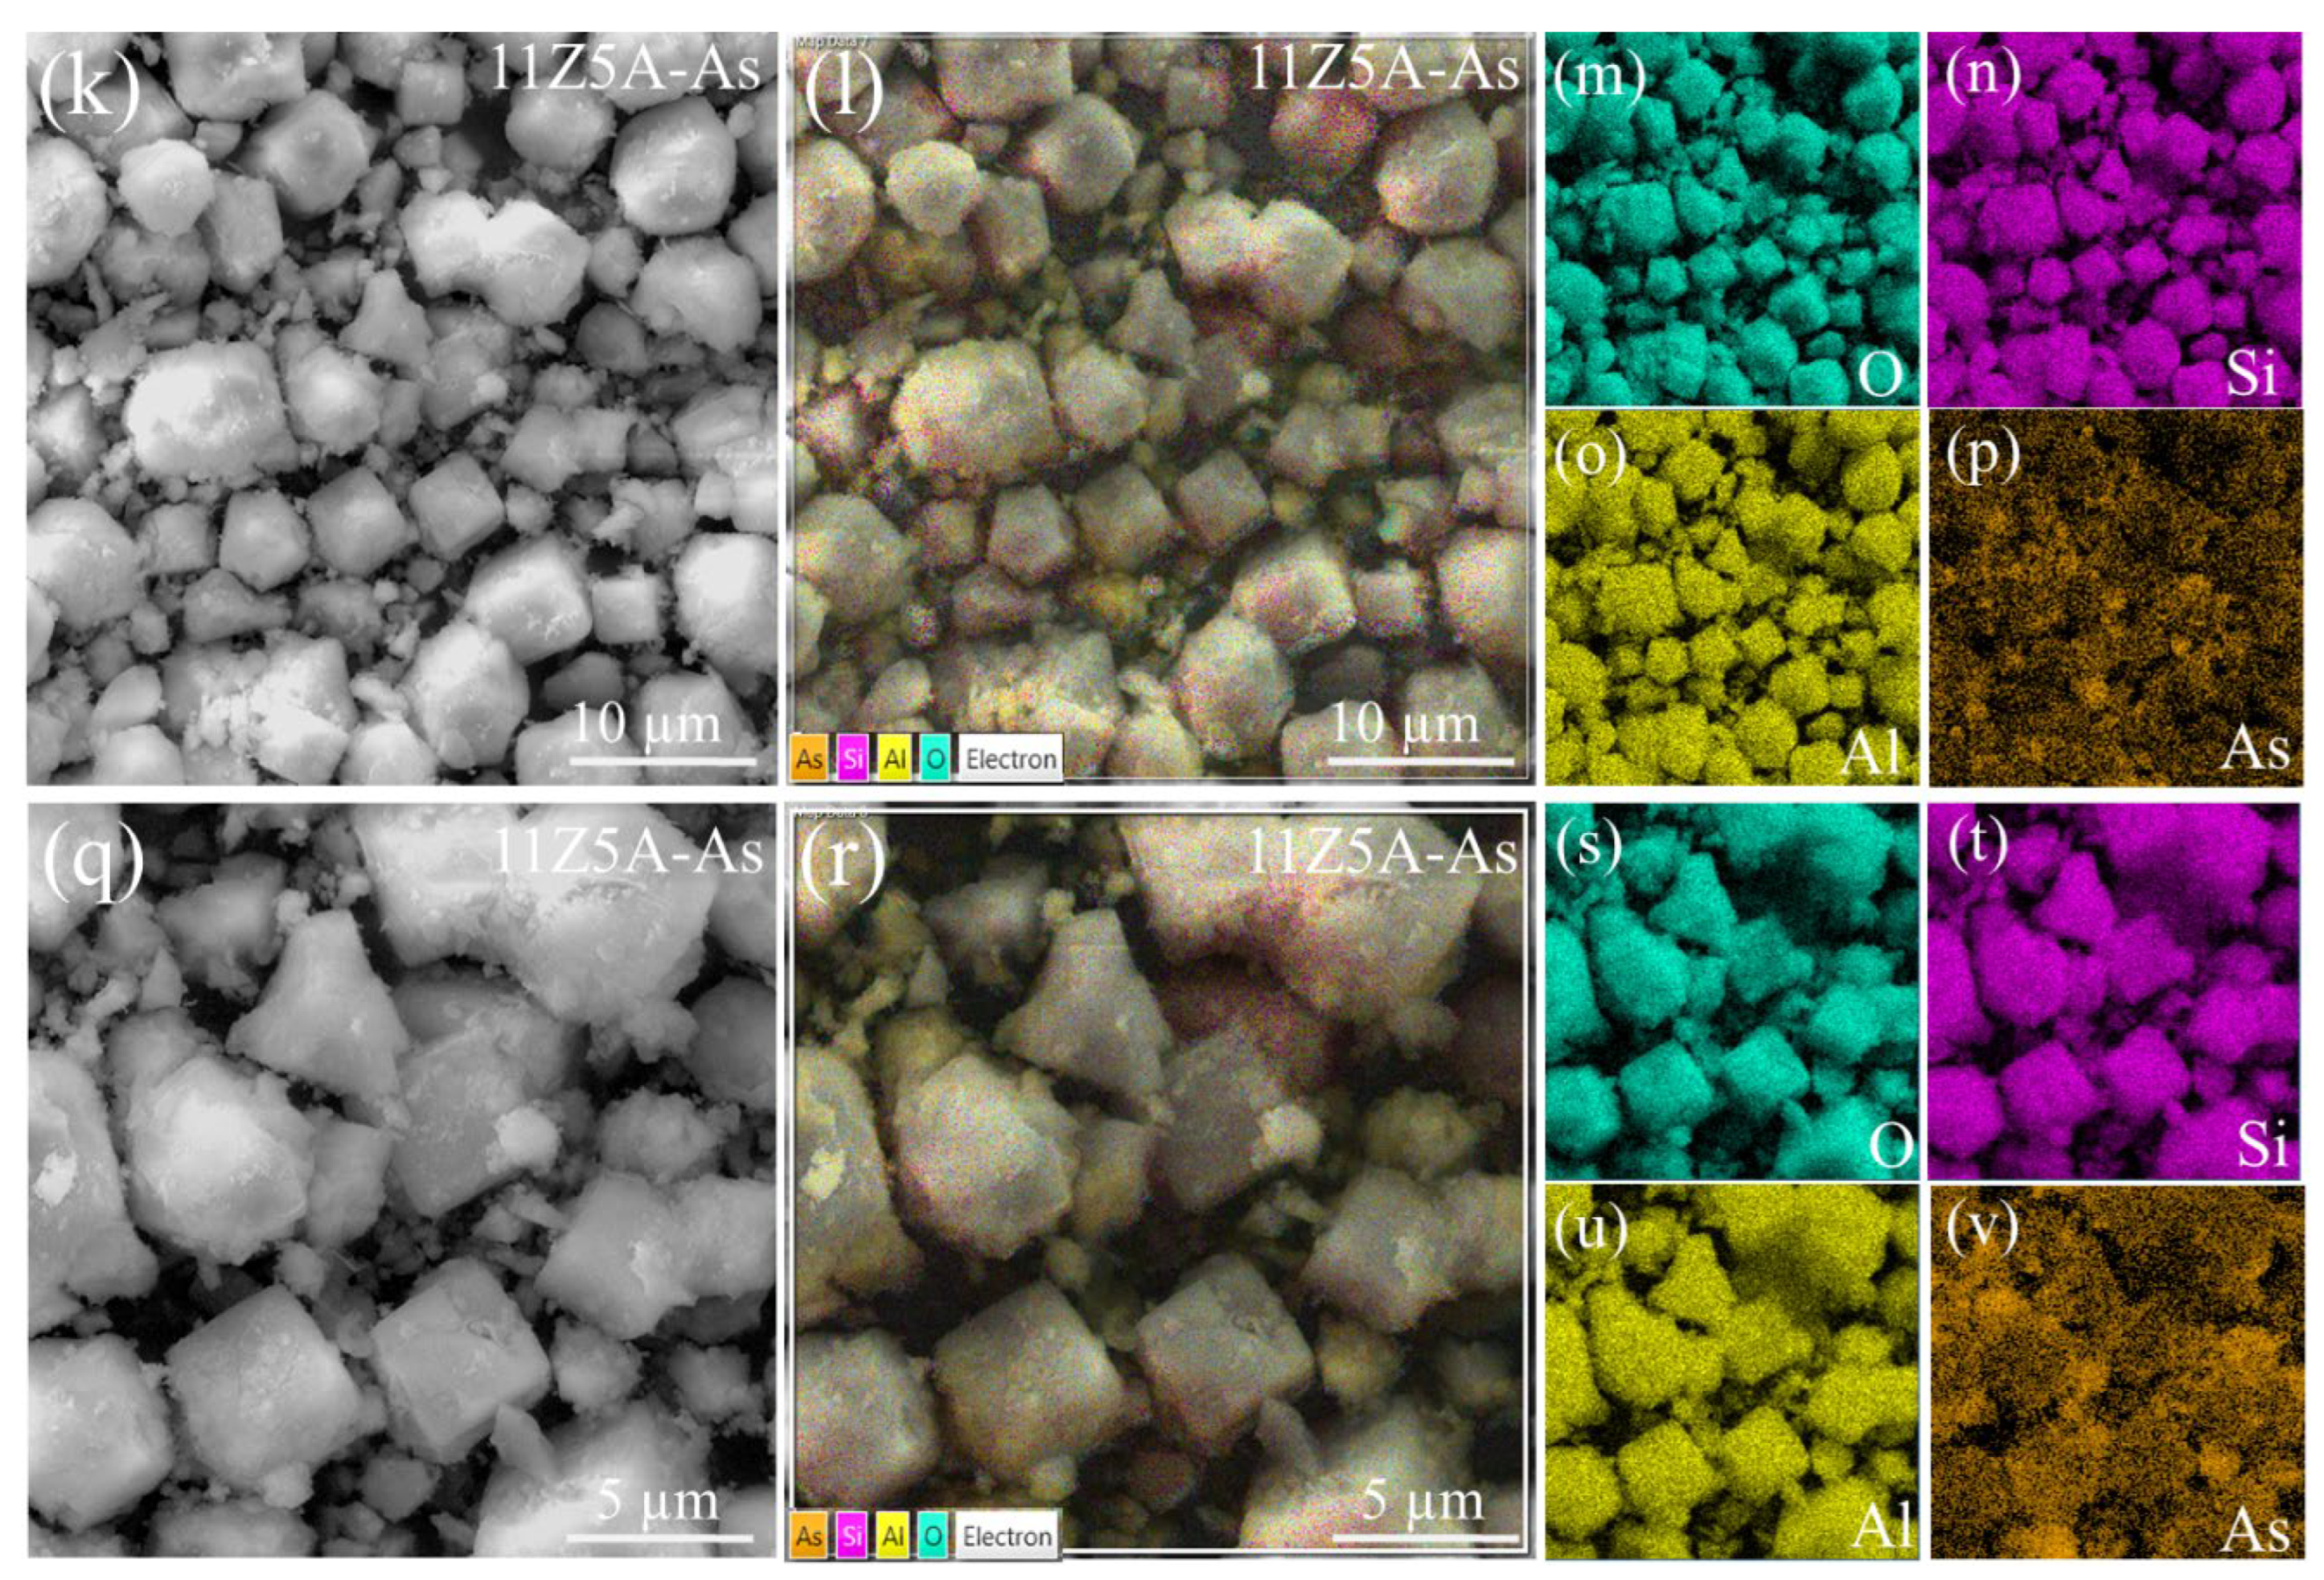
3.3. SEM Analysis of Zeolite 11Z5A (before and after As Adsorption Experiments)

Figure 4a,f show that the characteristic regular cubic shape for 11Z5A exhibits a mean edge size of 3.8 µm. Their respective EDS mapping, Figure 4b,g, and elemental EDS mapping images, Figure 4c–e,h–j, show the presence of Si, Al, and O as major constituents. When adsorbing As, polyhedral geometries are observed, as can be seen in Figure 4k,l,q,r, where irregular shapes are adopted, with sizes between 3 and 8 µm. Si, Al, O, and As were found to be the main elements in Figure 4m–p,s–v and Figure S1. The content of As adsorbed was found to be 2 %wt (See Table S1). Despite the adsorption procedure exhibiting a change in morphology, the structure is not significantly affected, as proved by Rietveld refinement.

3.4. X-ray Diffraction and Rietveld Analysis of Zeolite 18PZ5A (before and after Pb Adsorption)

In the Supplementary Material, Figure S2 shows the X-ray diffractograms of the synthesized 18PZ5A zeolite, and Table S2 summarizes the refined parameters (before adsorption). The results indicated that zeolite 5A was obtained as the main constituent phase; they coincided with the characteristic peaks of the zeolite mentioned above. Quartz was also obtained at 2θ = 26°; this was found in a lower proportion because the synthesized products from natural kaolin contain quartz as an impurity. A goodness of fit was obtained with a low value of χ2 = 3.3, and the mean crystallite size was 68.5 nm. According to the XRD data, compared to 11Z5A, the intensities of the peaks in the diffractogram increase in 18PZ5A due to the increase in NaOH concentration.
On the other hand, Figure S3 shows a phase change after Pb adsorption. Most of the diffraction peaks of 18PZ5A-Pb were significantly weakened by their participation in the adsorption; as a consequence, it was not possible to calculate the crystallite size of zeolite 18PZ5A after Pb adsorption. There was a partial dissociation of the zeolite 5A, and the water environment generates OH−ions that would combine with the Pb2+ ions to form Pb(OH)2. The 18PZ5A has abundant vacancies available on the surface for these ions that would be replaced [19].

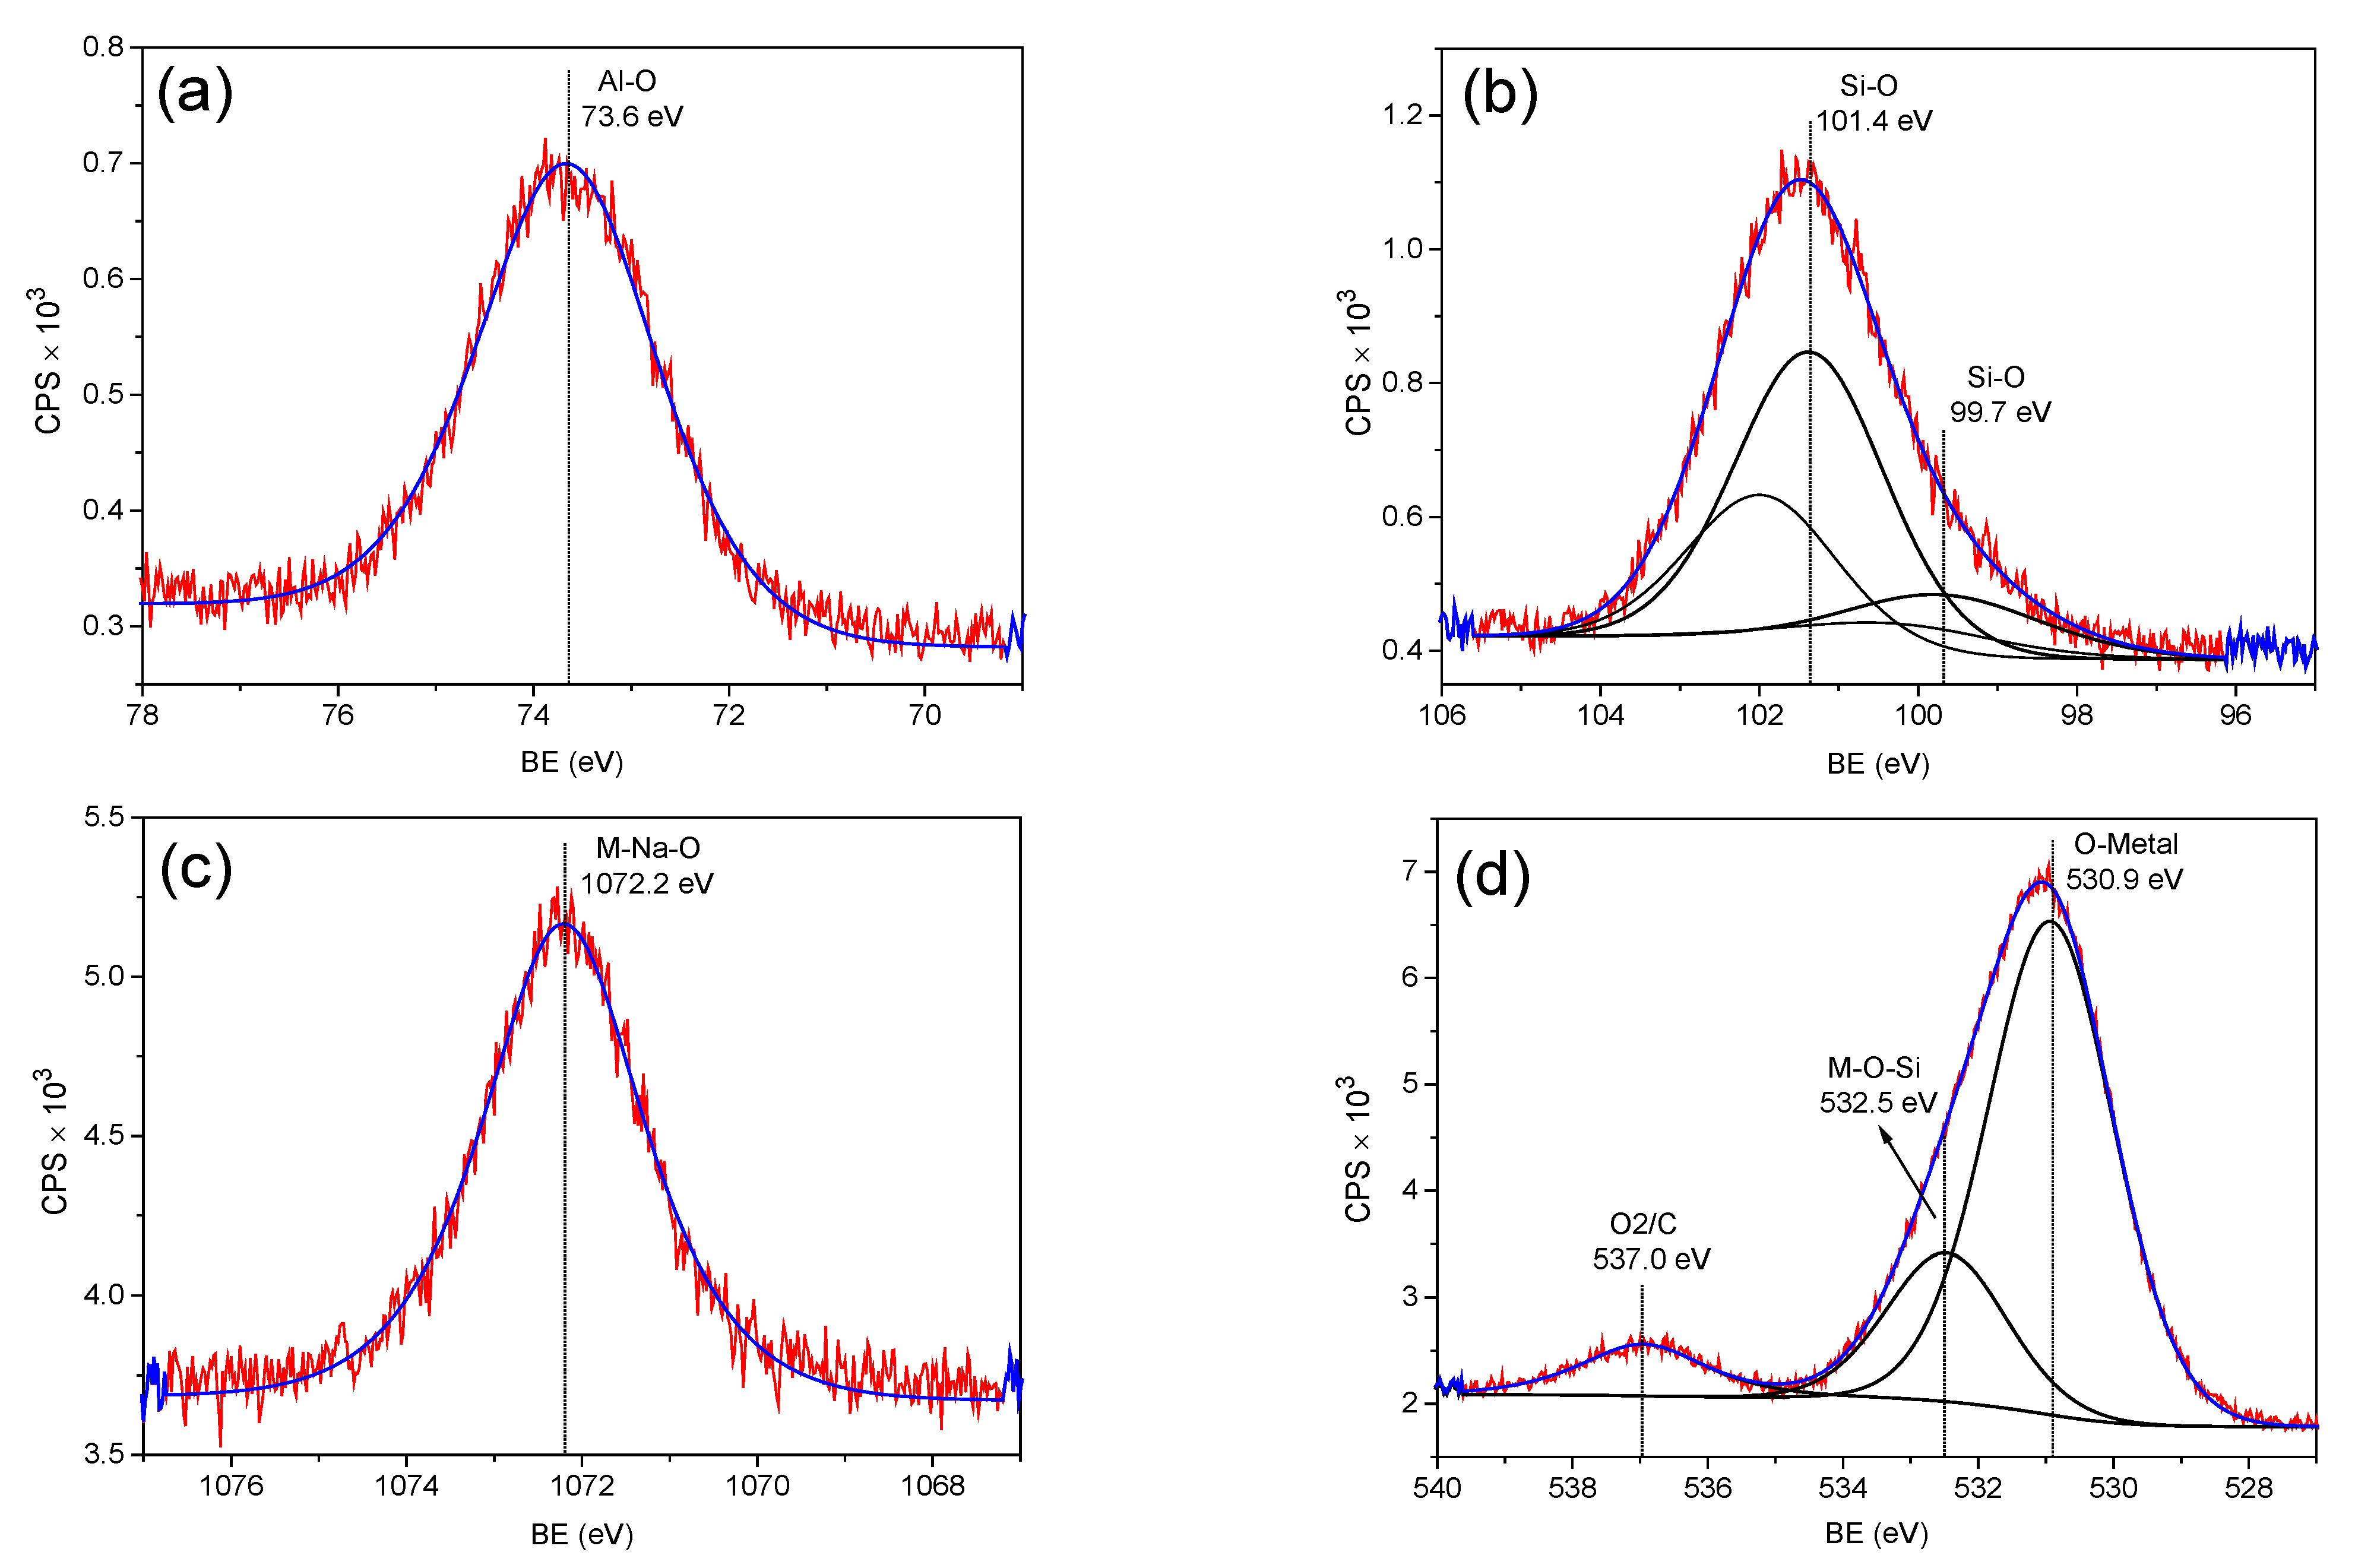
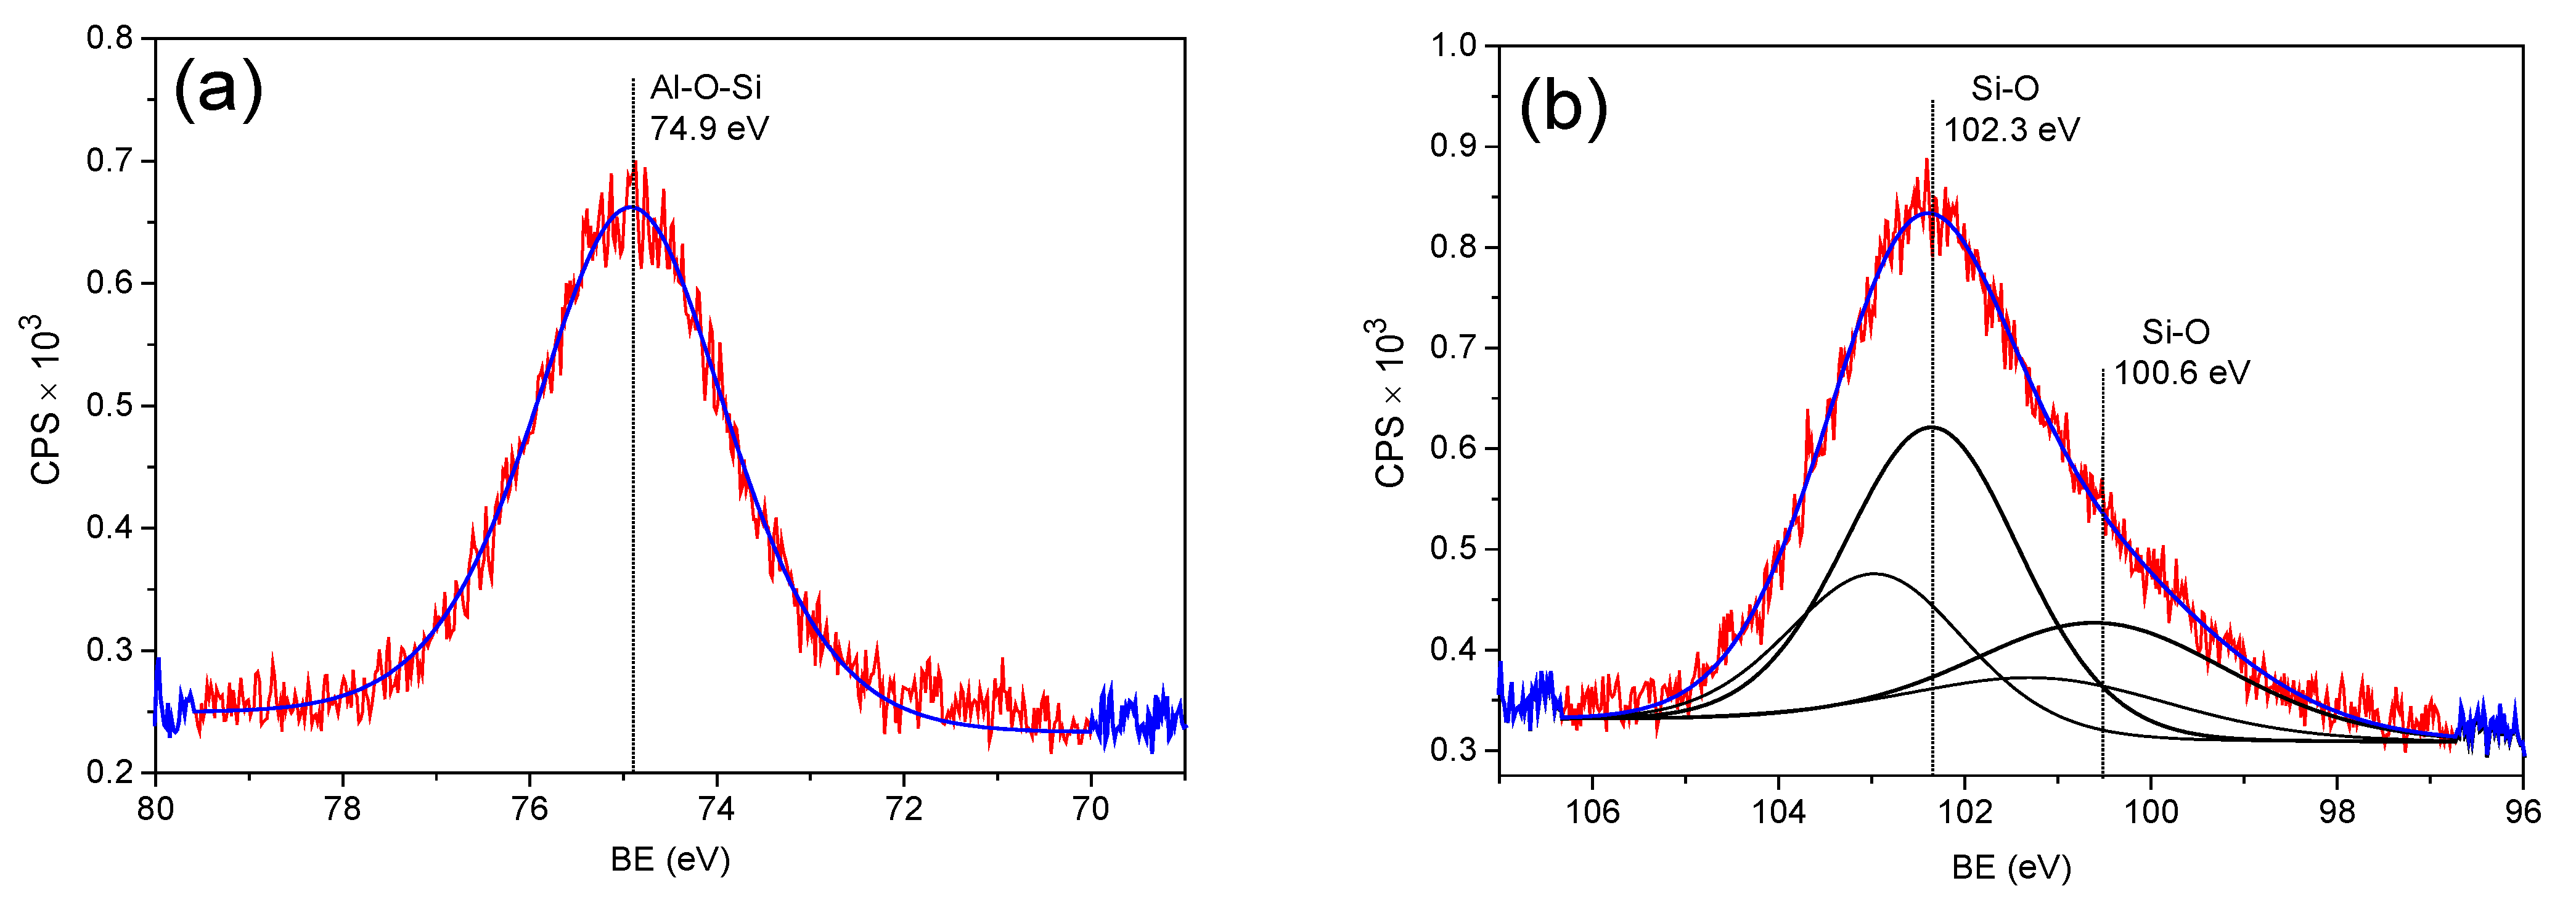
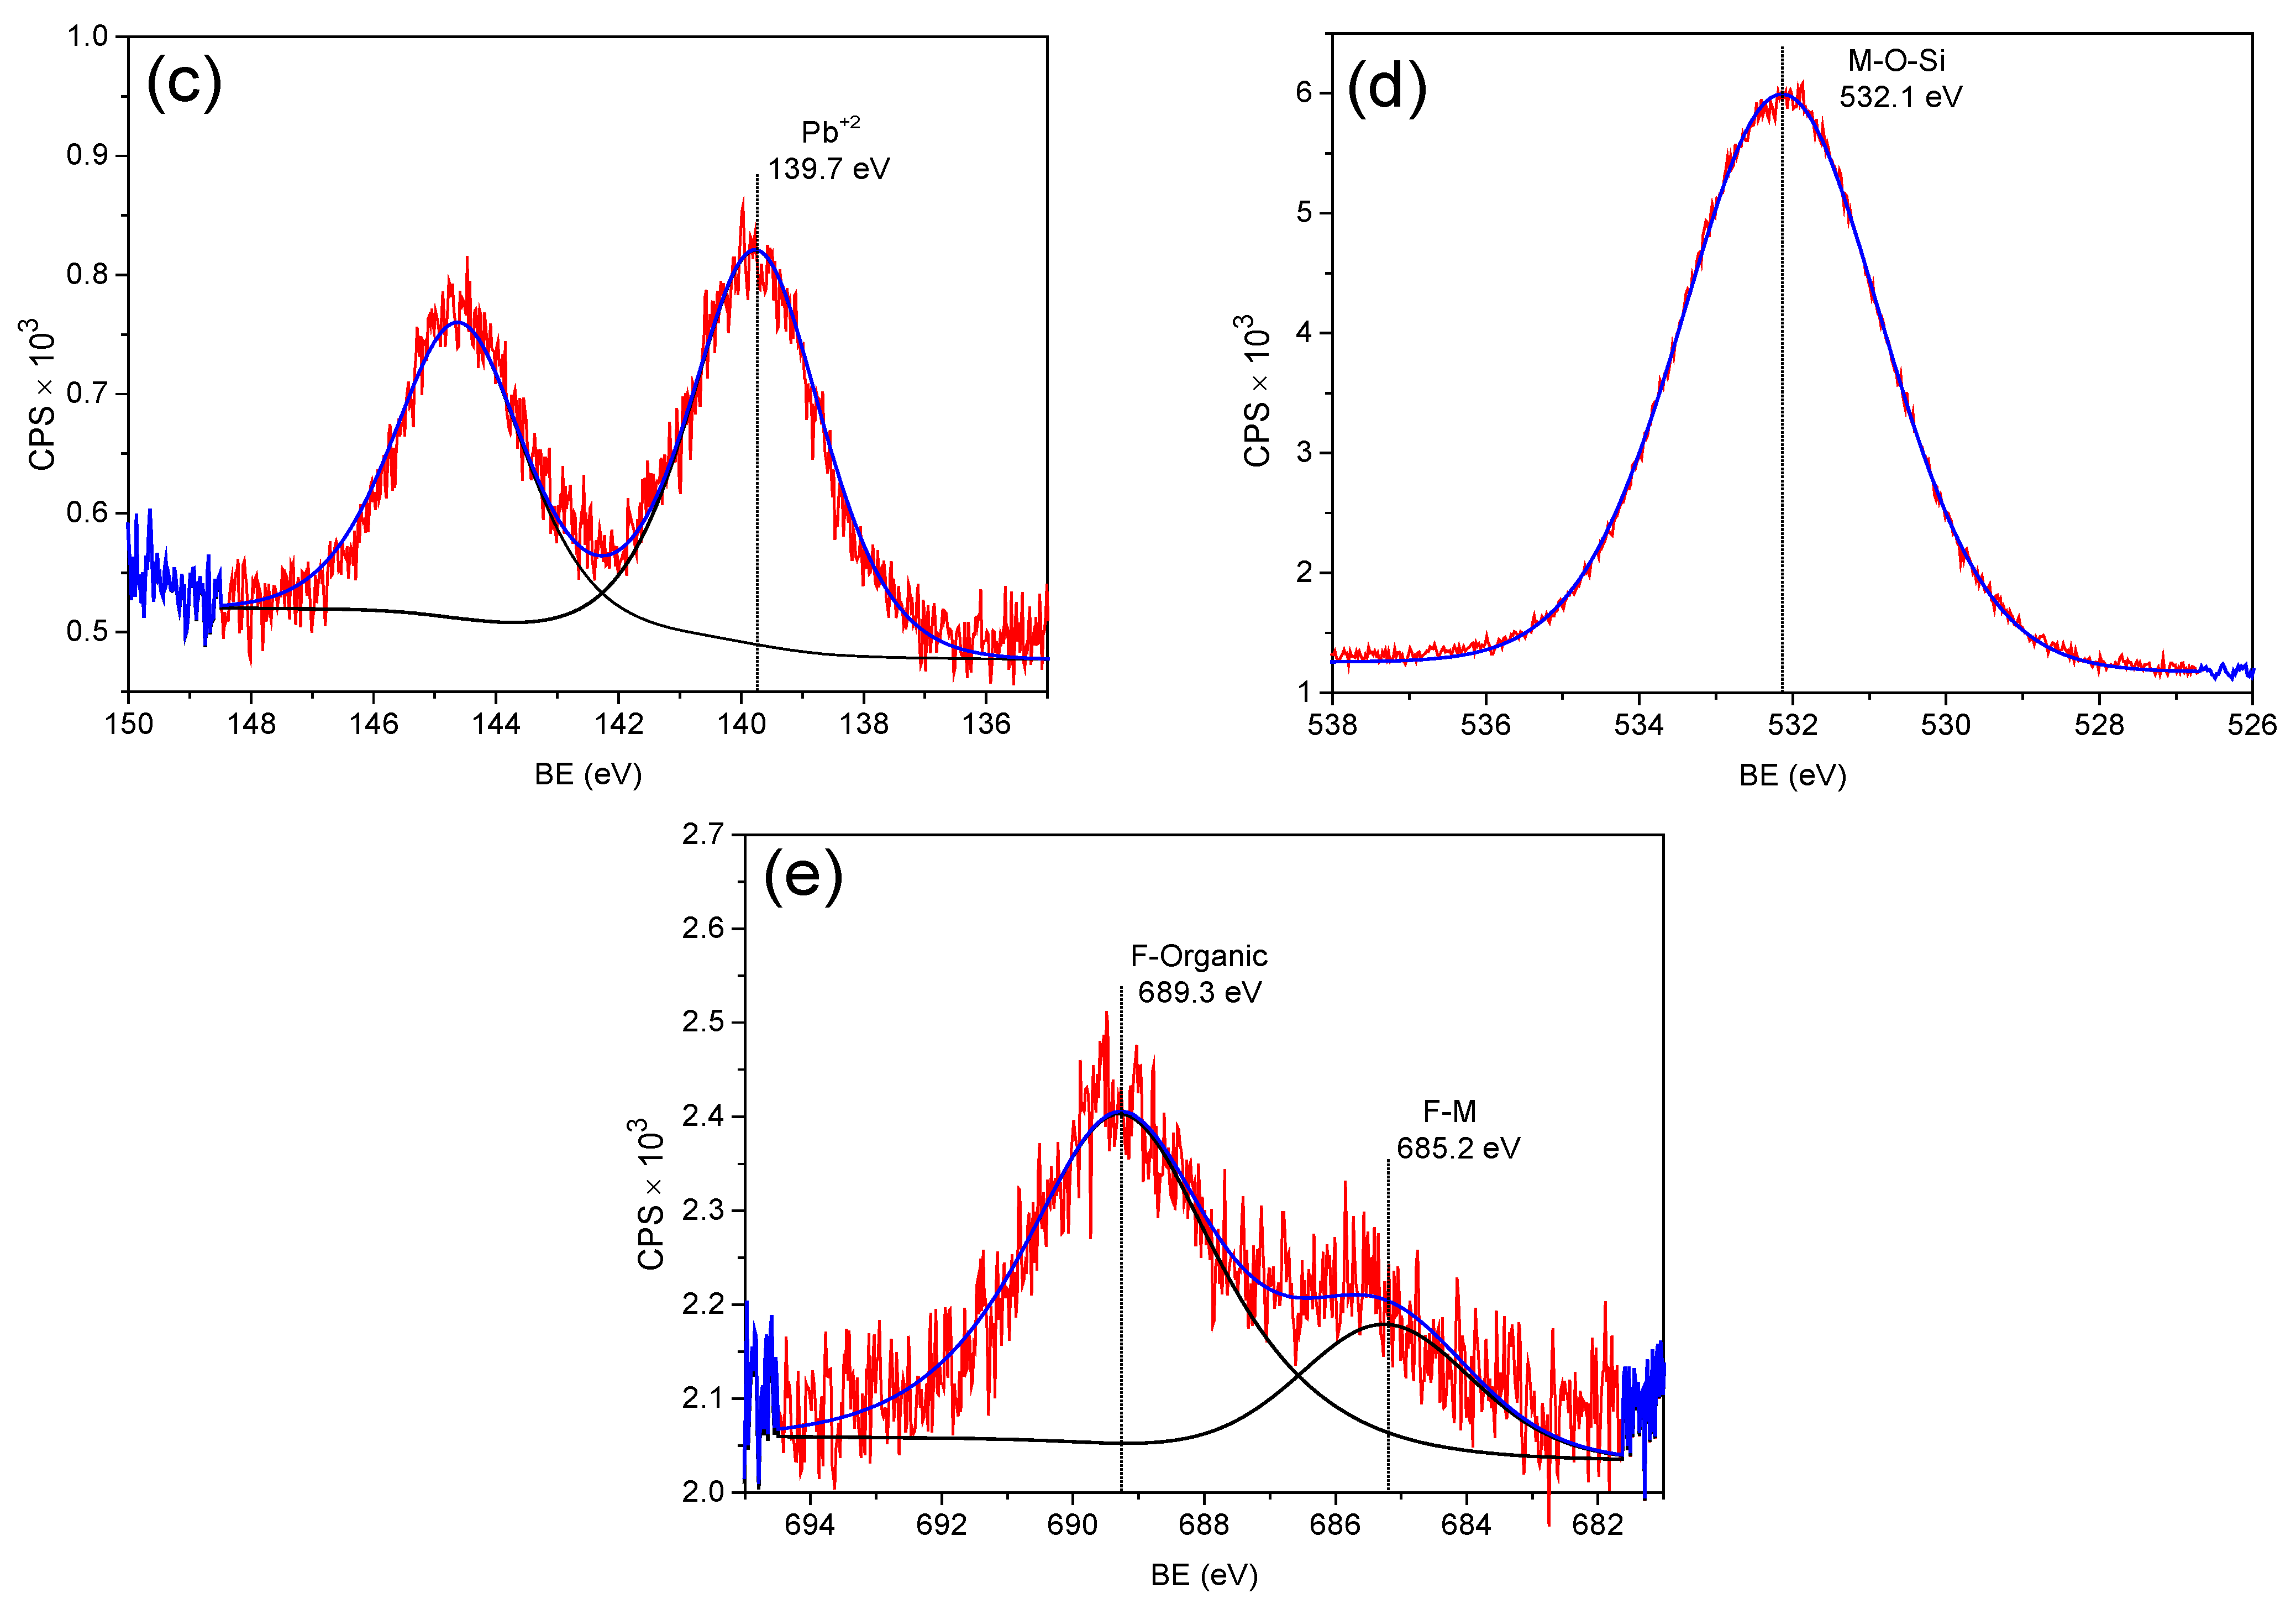
3.5. XPS Analysis of Zeolite 18PZ5A (before and after Pb Adsorption)

The sample 18PZ5A (Figure 5) showed the formation of a zeolite without the presence of Ca on its surface [41]. This slightly altered the BE of Al 2p to 73.6 eV. Moreover, the formation of SiO2 was not observed, as in the case of the 11Z5A sample. On the other hand, in the Pb adsorption process (Figure 6), an increase in the BE of Al 2p from 73.6 eV to 74.9 eV was observed, and in the case of Si 2p3/2, it increased from 101.4 eV to 102.3 eV, see Table 2. These increases show that the Pb replaced the Na atoms in the zeolite, and, at the same time, that the alteration of the neighbors’ atoms of Al and Si is due to the ionic radius of Pb being greater than that of Na, thus altering the local electronic cloud.
Fluoride was also observed in this adsorption process, perhaps due to a contamination found in the aqueous solution. The atomic amount of F found on the surface was higher than Pb, indicating that zeolite adsorption favors atoms with smaller atomic radii. Comparing the two samples of synthesized zeolites (11Z5A vs. 18PZ5A), the zeolite adsorbs As atoms better than Pb because As has a smaller ionic radius than Pb.

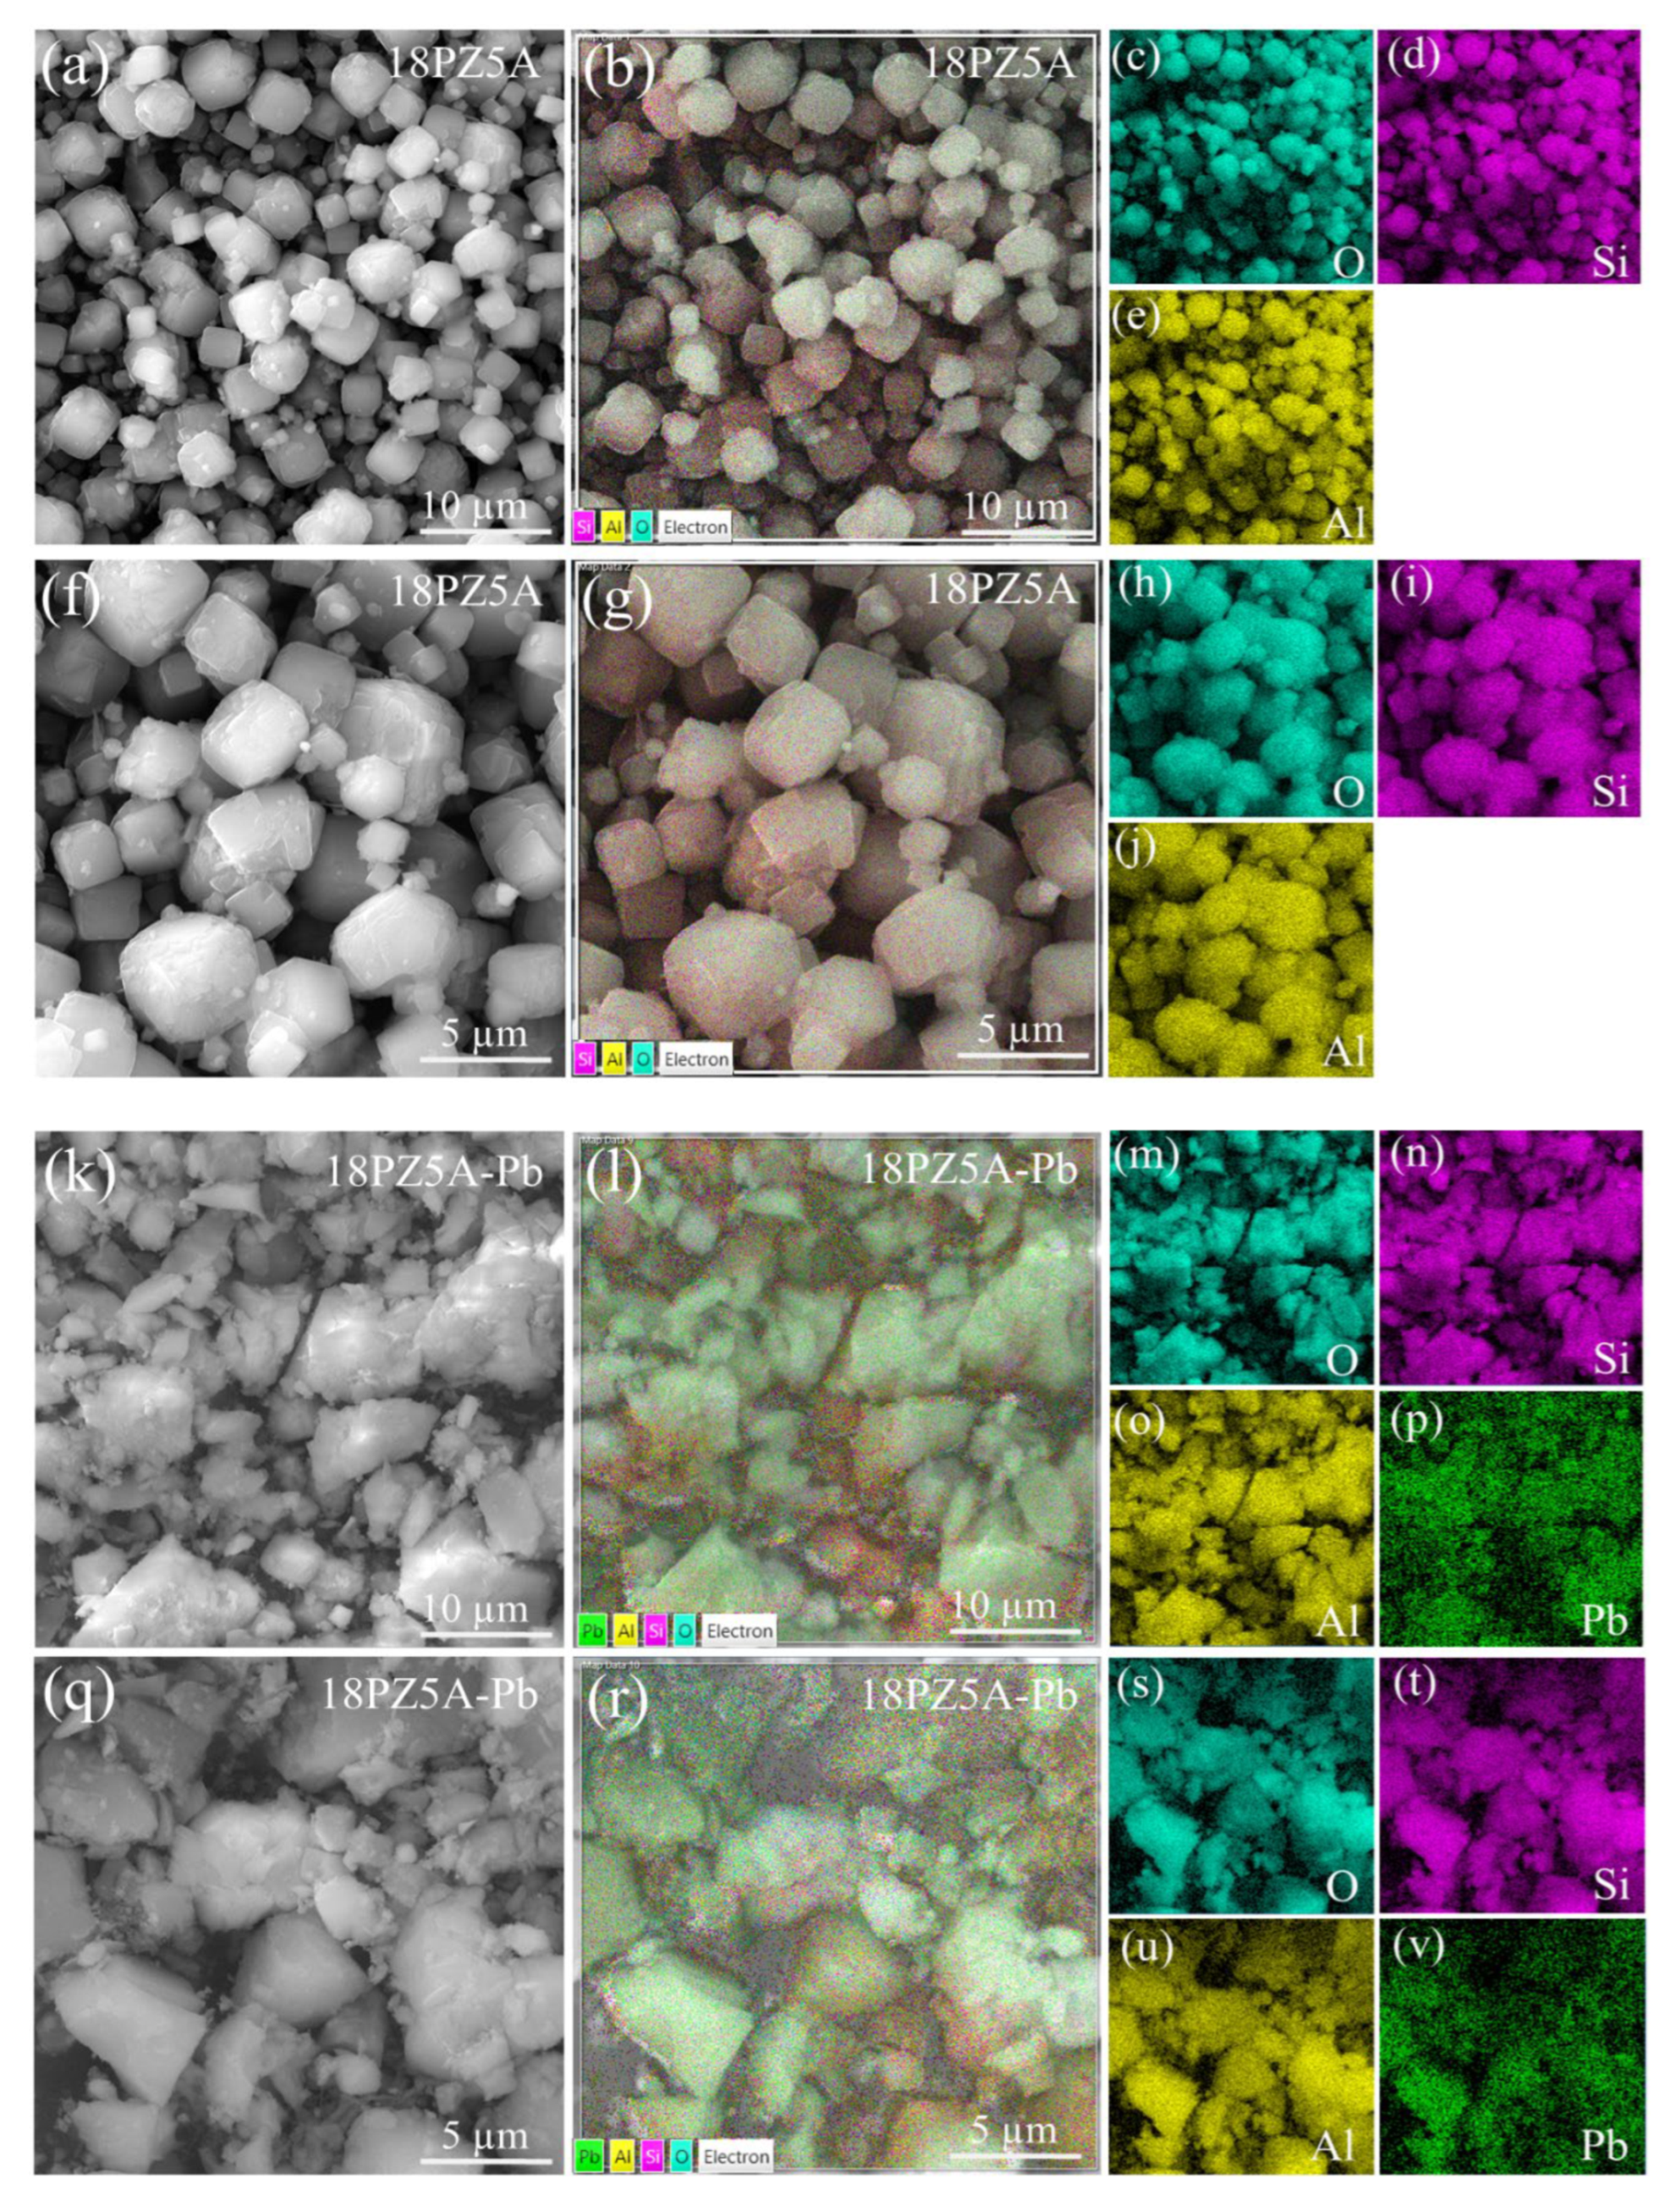
3.6. SEM Analysis of Zeolite 18PZ5A (before and after Pb Adsorption)

Figure 7a,f show that the characteristic regular cubic shape for 18PZ5A exhibited mean edge sizes from 2.4 to 4.8 µm. Their respective EDS mapping, Figure 7b,g, and elemental EDS mapping images, see Figure 7c–e,h–j, show the presence of Si, Al, and O as major constituents. When adsorbing Pb, polyhedral geometries are observed (Figure 7k,l,q,r) where irregular shapes are adopted with sizes up to 5 µm, and Al, Si, Pb, and O elements were observed in Figure 7m–p,s–v and Figure S1. The content of Pb adsorbed was found to be 4.1 %wt (See Table S1). In this case, the Pb adsorption procedure exhibited a change in the morphology as well as in the structure, which was significantly affected, as can be seen in Figure S3.

3.7. Removal Experiments

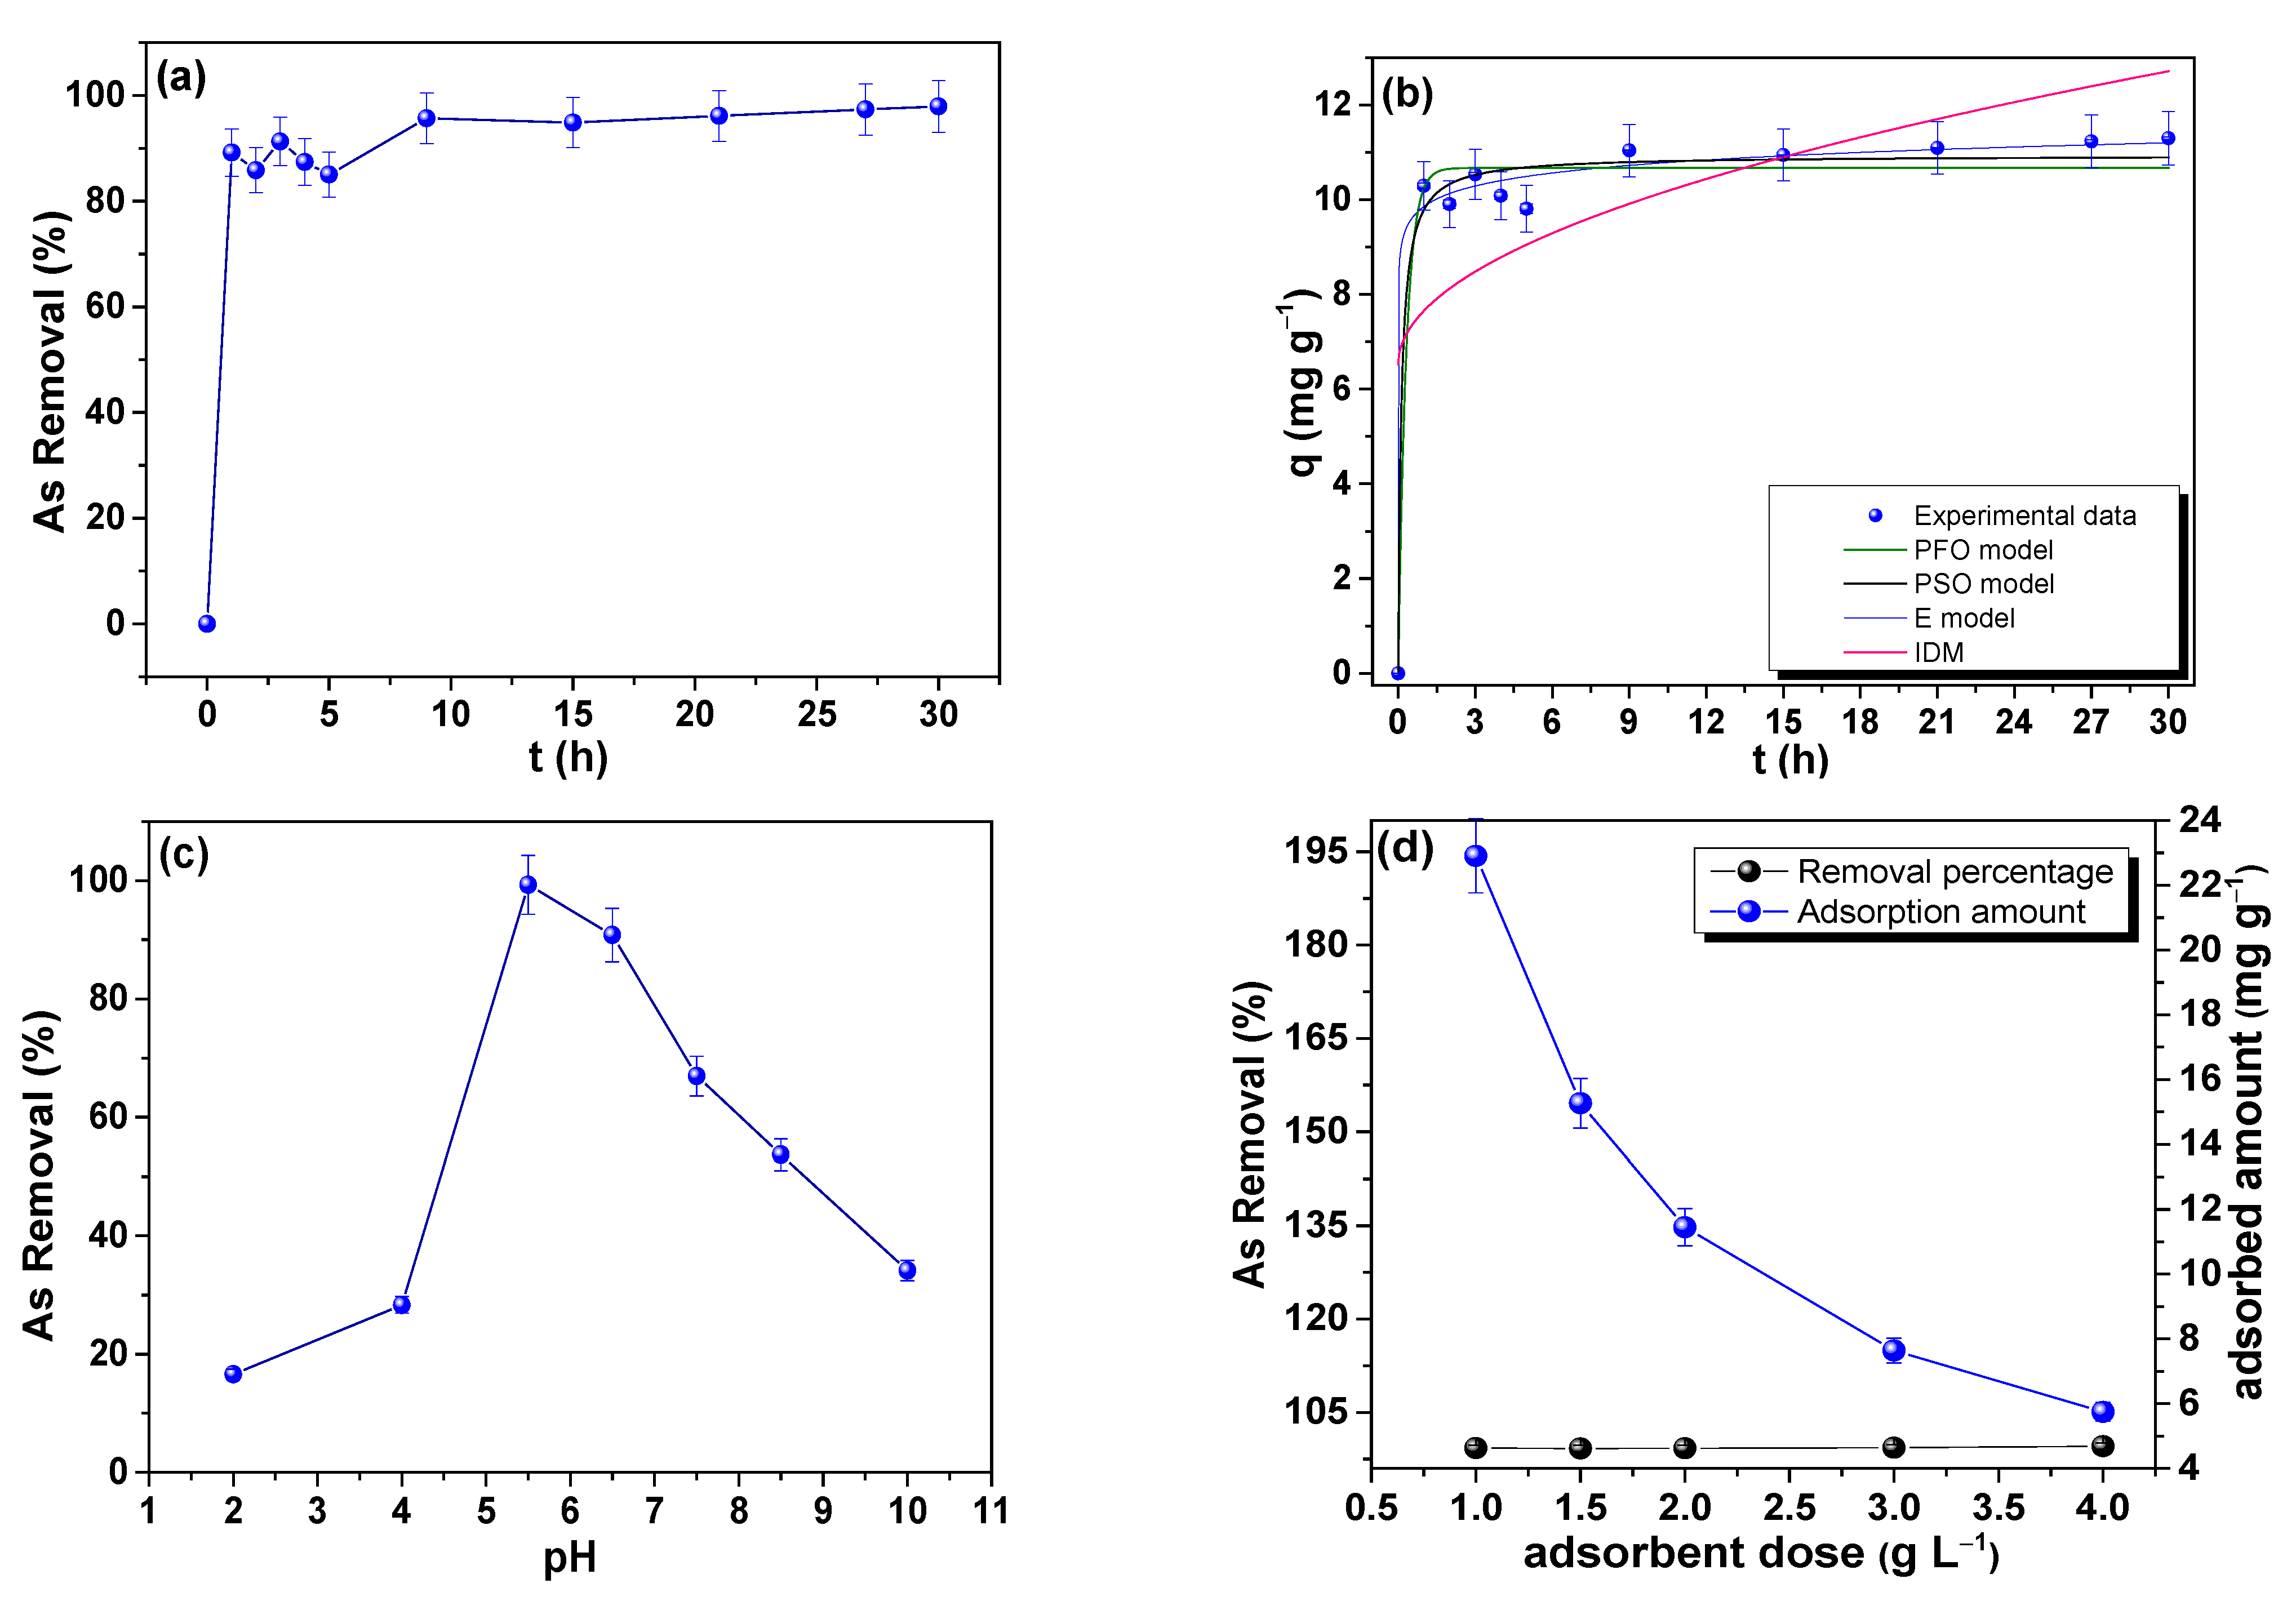
3.7.1. Adsorption Kinetics of As

The experiments of adsorption kinetics of As(V) in drinking water were developed with the purpose of determining the equilibrium time and studying its behavior with the adsorption kinetics models. The results are shown in Table S3. Figure 8a shows the kinetic profile of As adsorption on zeolite 11Z5A, which presents a removal percentage higher than 89% in the first hour of contact. Equilibrium was reached after 9 h of contact, at which point 95.66% of As removal was reached; with a longer the contact time, the percentage of As removal remained relatively constant. Therefore, it could be inferred that the adsorbent material is saturated. This time is shorter than the one reported by Melo et al. [50], where it was observed that the greater the contact time, the greater the adsorption in the tests performed, achieving a removal rate of 94% at 12 h for As(V) adsorption on zeolite 5A.
It is known that linear fits (Figure S4) are mostly used to determine the kinetic model based on the correlation factor R2, and the parameters are compared with the experimental data, which may be different due to the linearization of the equations. Therefore, to avoid inconveniences, it is recommended to perform a nonlinear fit (Figure 8b). As can be seen in Table 3, it gives values closer to the experimental data compared to the linear fit (Table S4). Tor et al. [34] recommends performing both linear and nonlinear fits to make the decision of the model that best represents the adsorption process. The behavior of the adsorption process has a best fit with the E kinetic model (R2 = 0.9896), followed by the PSO (R2 = 0.9801) and the PFO (R2 = 0.9709), as shown in Table 3.
The R2 values for the E and PSO kinetic models are close to 1, suggesting that the kinetic results of As(V) adsorption can be governed by As chemisorption on zeolite 5A. However, to find the best kinetic model describing the adsorption data, we employed the BIC calculation given by Equation (16), using the values in Table 3. According to Cao et al. [39], the best model has the lowest (most negative) BIC value. We conclude that the E model provides the best correlation of the kinetic data of As(V) adsorption on the surface of zeolite 5A; hence, a chemisorption process was confirmed. In this sense, the E kinetic model is suitable.

3.7.2. Effect of pH on the As Adsorption

The dependence of the pH on the adsorption process of As(V) was evaluated and is shown in Figure 8c. The pH is one of the most important factors for adsorption, as it can affect the chemical form of As in solution and cause changes in the surface charge of the adsorbent. For explaining the adsorption behavior, the value of the point of zero charge pHpzc is required. This is the pH value at which the sum of the positive and negative surface charges is balanced, being 8.48 for zeolite 5A [23]. In essence, at lower pHpzc values, there is a higher adsorption efficiency on zeolite 5A because the positive potential at the zeolite surface is beneficial for anionic adsorption of As(V). According to the As(V) species stability diagram, there are: H 3 AsO 4 at pH 0–2, H 2 AsO 4 at pH 3–6, HAsO 4 2 at pH 7–11, and AsO 4 3 in the range of pH 12–14 [3]. The percentage of As(V) removal was greater than 90% at a pH between 5.5 and 6.5. In this range, As is negatively charged; therefore, one of the main adsorption mechanisms could be the formation of complexed/precipitated As species on the zeolite surface [23]. Otherwise, it can be seen that, at pH values lower than 5.5, the percentage of As removal has an abrupt decrease. Zeolite has a cation retention capacity, which is evaluated according to its cation exchange capacity (CEC). The excessive decrease in the pH to 4.5 reduces the CEC because the adsorption selectivity of the hydronium ion (H+) towards the negative charge of the zeolite is stronger; this also implies a decrease in Ca2+ retention capacity, and thus a decrease in As adsorption, since there is more H+ preference in zeolite 5A [51]. In the present study, a maximum As removal of 99.29% was obtained at pH 5.5, so this pH was chosen as an optimum value.

3.7.3. Effect of Adsorbent Dose on As Adsorption

The adsorbent dose in the removal process was evaluated to find the highest adsorption percentage in which the amount of adsorbent matches the amount of As ions.
The changes of the percentage removal and adsorption amount of 11Z5A as a function of mass are plotted in Figure 8d. It was observed that a lower dose of 1 g L−1 was already enough to remove 99% of As from the water. The increase in dose from 1 g L−1 to 4 g L−1 showed a slight increase in the percentage removal, because of the greater the mass of the adsorbent and the greater availability of adsorption sites; however, the adsorption amount decreases with increasing dose. The maximum retention capacity of an active site cannot be reached as there are too many active sites available to adsorb the few As ions [52,53]. On the other hand, it could be because not all sites are easily accessible and were not fully occupied [54]. Therefore, the lowest adsorbent dose of 1 g L−1 was selected as the optimal one, since it obtained a high removal percentage and adsorption amount.

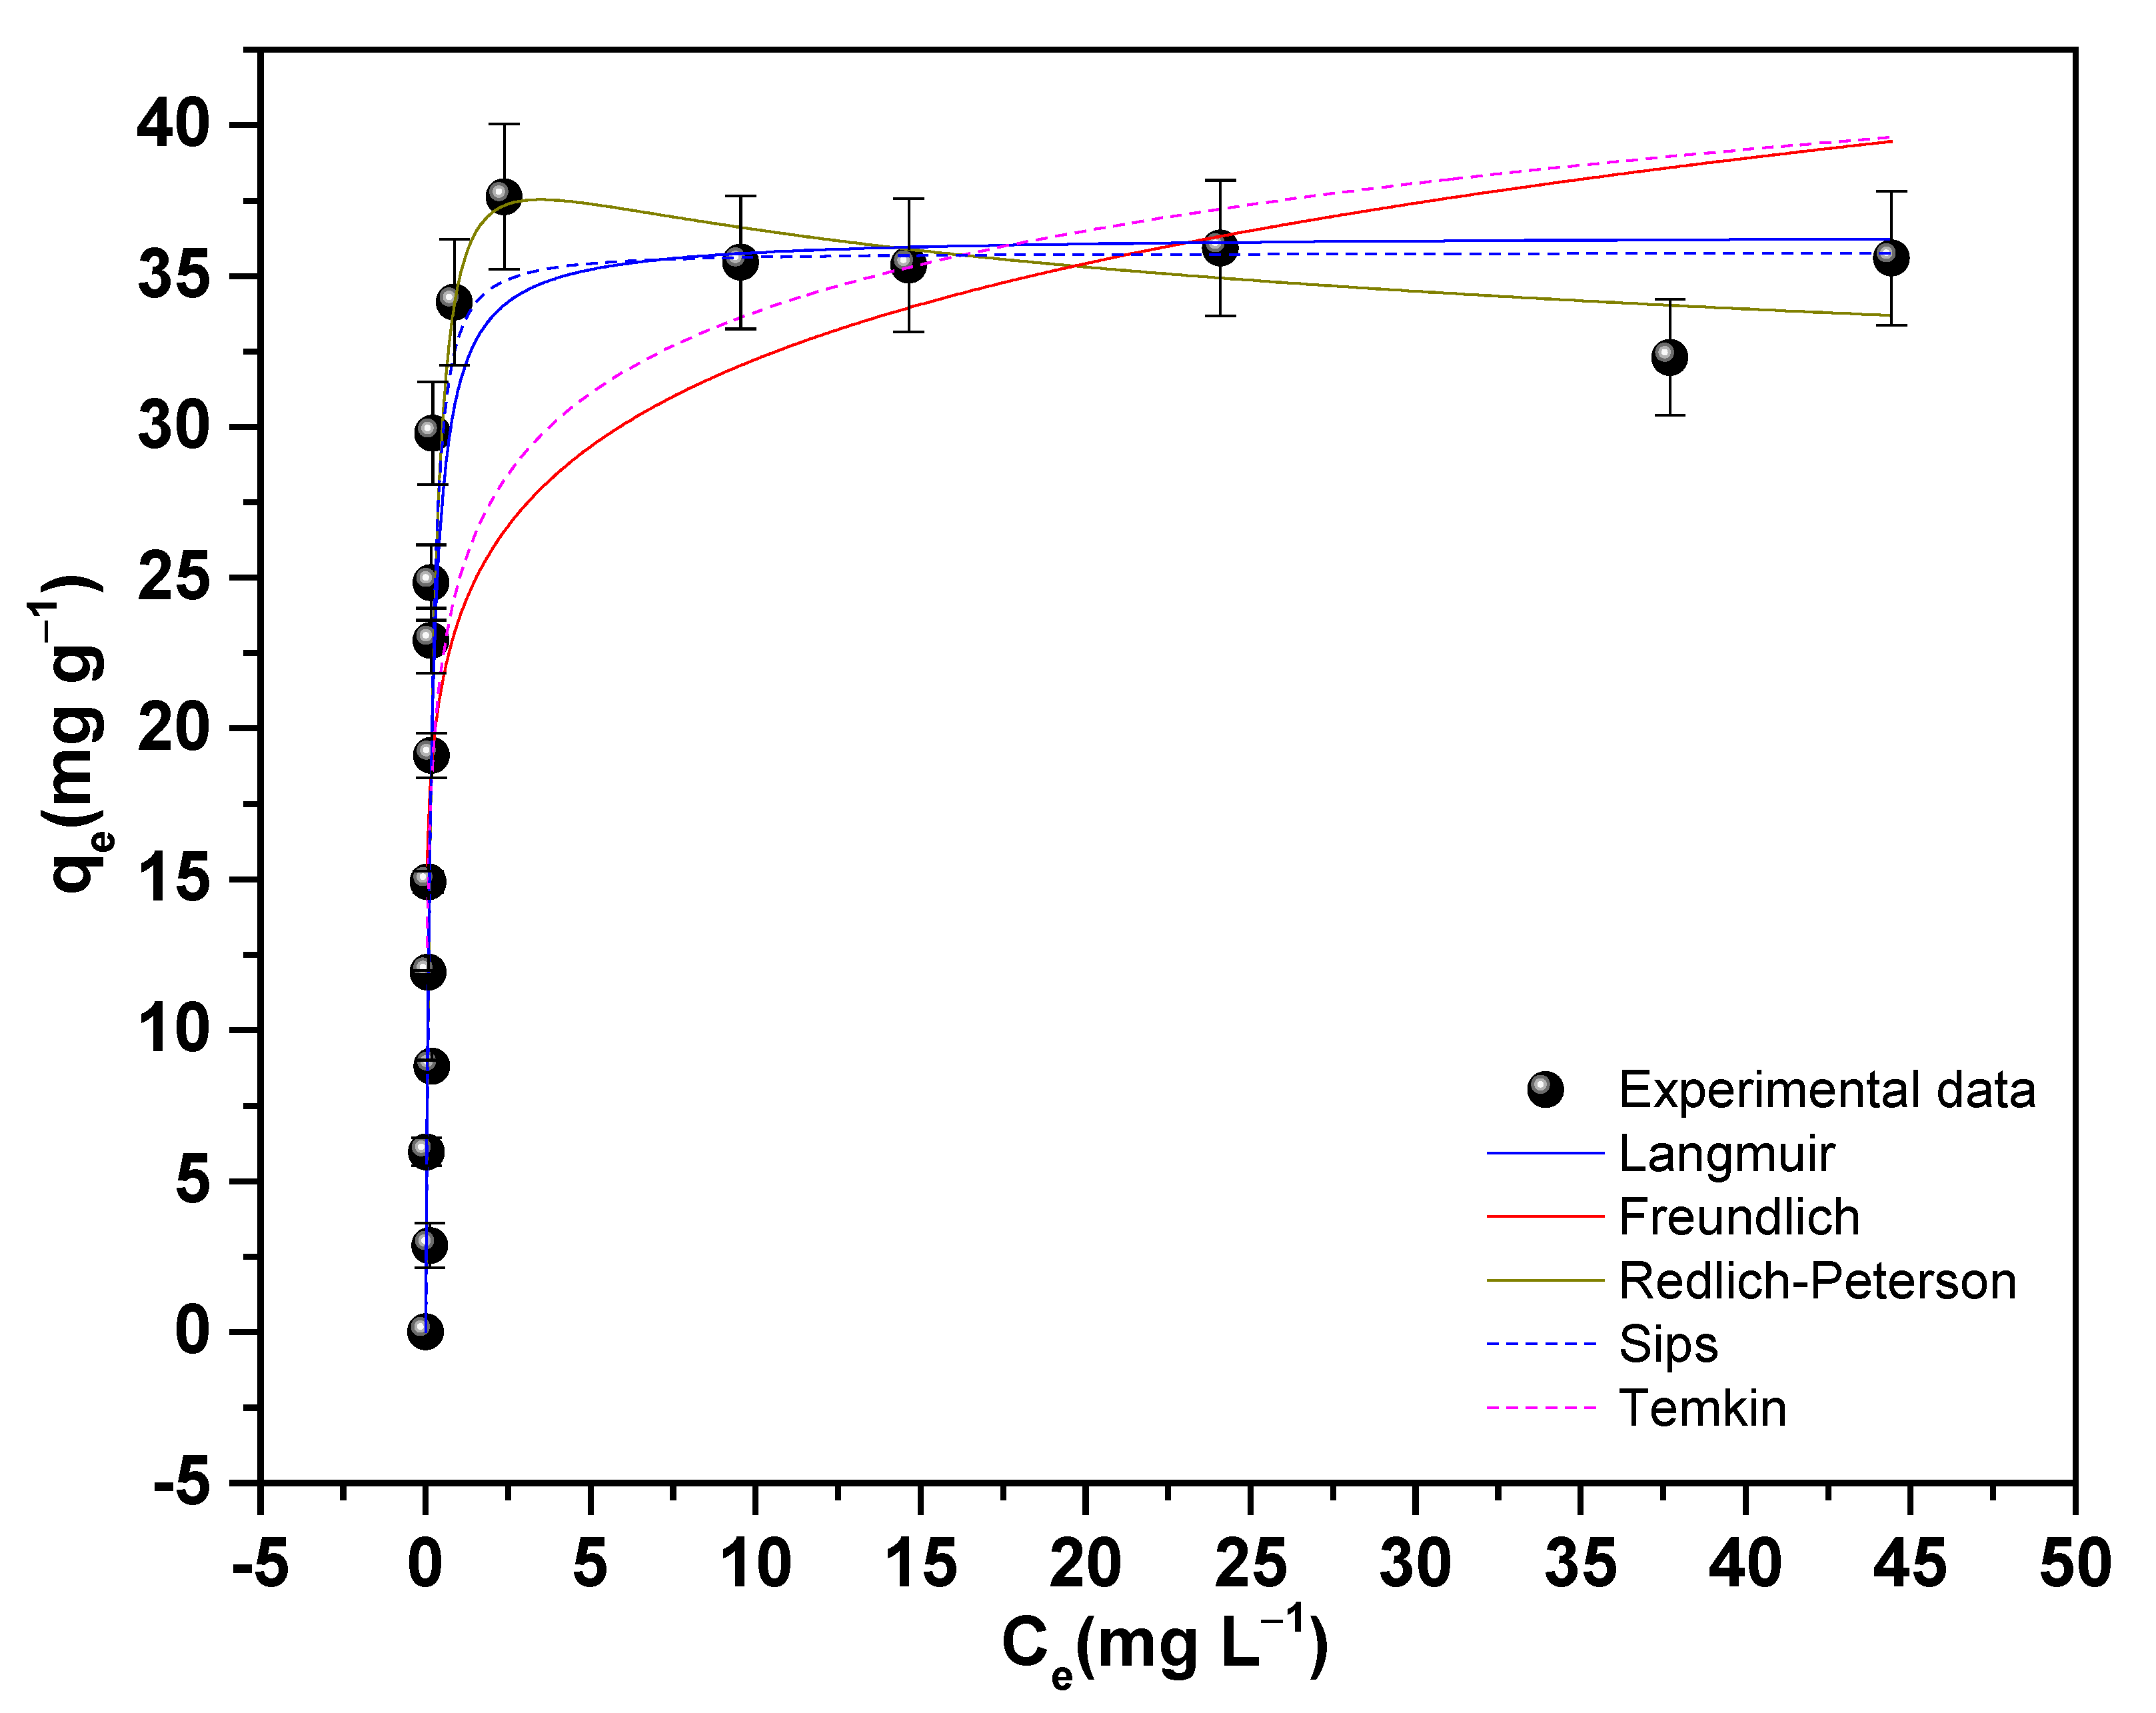
3.7.4. Adsorption Isotherms of As(V) on 11Z5A

Figure 9 shows the adsorption isotherms of As(V) on 11Z5A, which were obtained at a pH 5.5, an adsorbent dose of 1 g L−1, while stirring it for an equilibrium time of 9 h. According to the IUPAC classification [55], the isotherm of Figure 9 is type I, because it shows an increase in adsorbed As ions at low concentrations, and it stabilizes at high concentrations. Moreover, for this type of isotherm, the adsorbent is microporous, and the adsorption is performed by the filling of these sorption sites [34]. The parameters obtained from the nonlinear fit of the adsorption models to the experimental data are shown in the Table 4, where the highest correlation coefficient R2 of 0.81 is obtained by the Langmuir and Redlich–Peterson model. According Lima et al. [38], when the difference in BIC value between two models is less than two, in this case, those with higher R2 value, there is no significative difference between the models, so both could explain the adsorption process. The Redlich–Peterson model has value of β = 1, so the Langmuir adsorption mechanism is confirmed. Therefore, it is possible that the adsorption process of As(V) on 11Z5A happens on a homogeneous monolayer surface, where As(V) ions are adsorbed at different sites without interaction. According to the Langmuir model prediction, the maximum adsorption capacity is 36.35 mg g−1. Likewise, the Sips model presents a good fit to the experimental data; as a result, an adsorption capacity of 35.8 mg g−1 was obtained, a value close to that obtained by the Langmuir model. However, the ms value was more than 1, indicating that it is possible that a cooperative reaction between a sorption site and n arsenic ions occurred. This means that the adsorption of a first As ion enhances the adsorption of more As ions [56]. The adsorption capacity value is higher than the values reported in other studies, in which only zeolite 5A was used, as shown in Table 5.

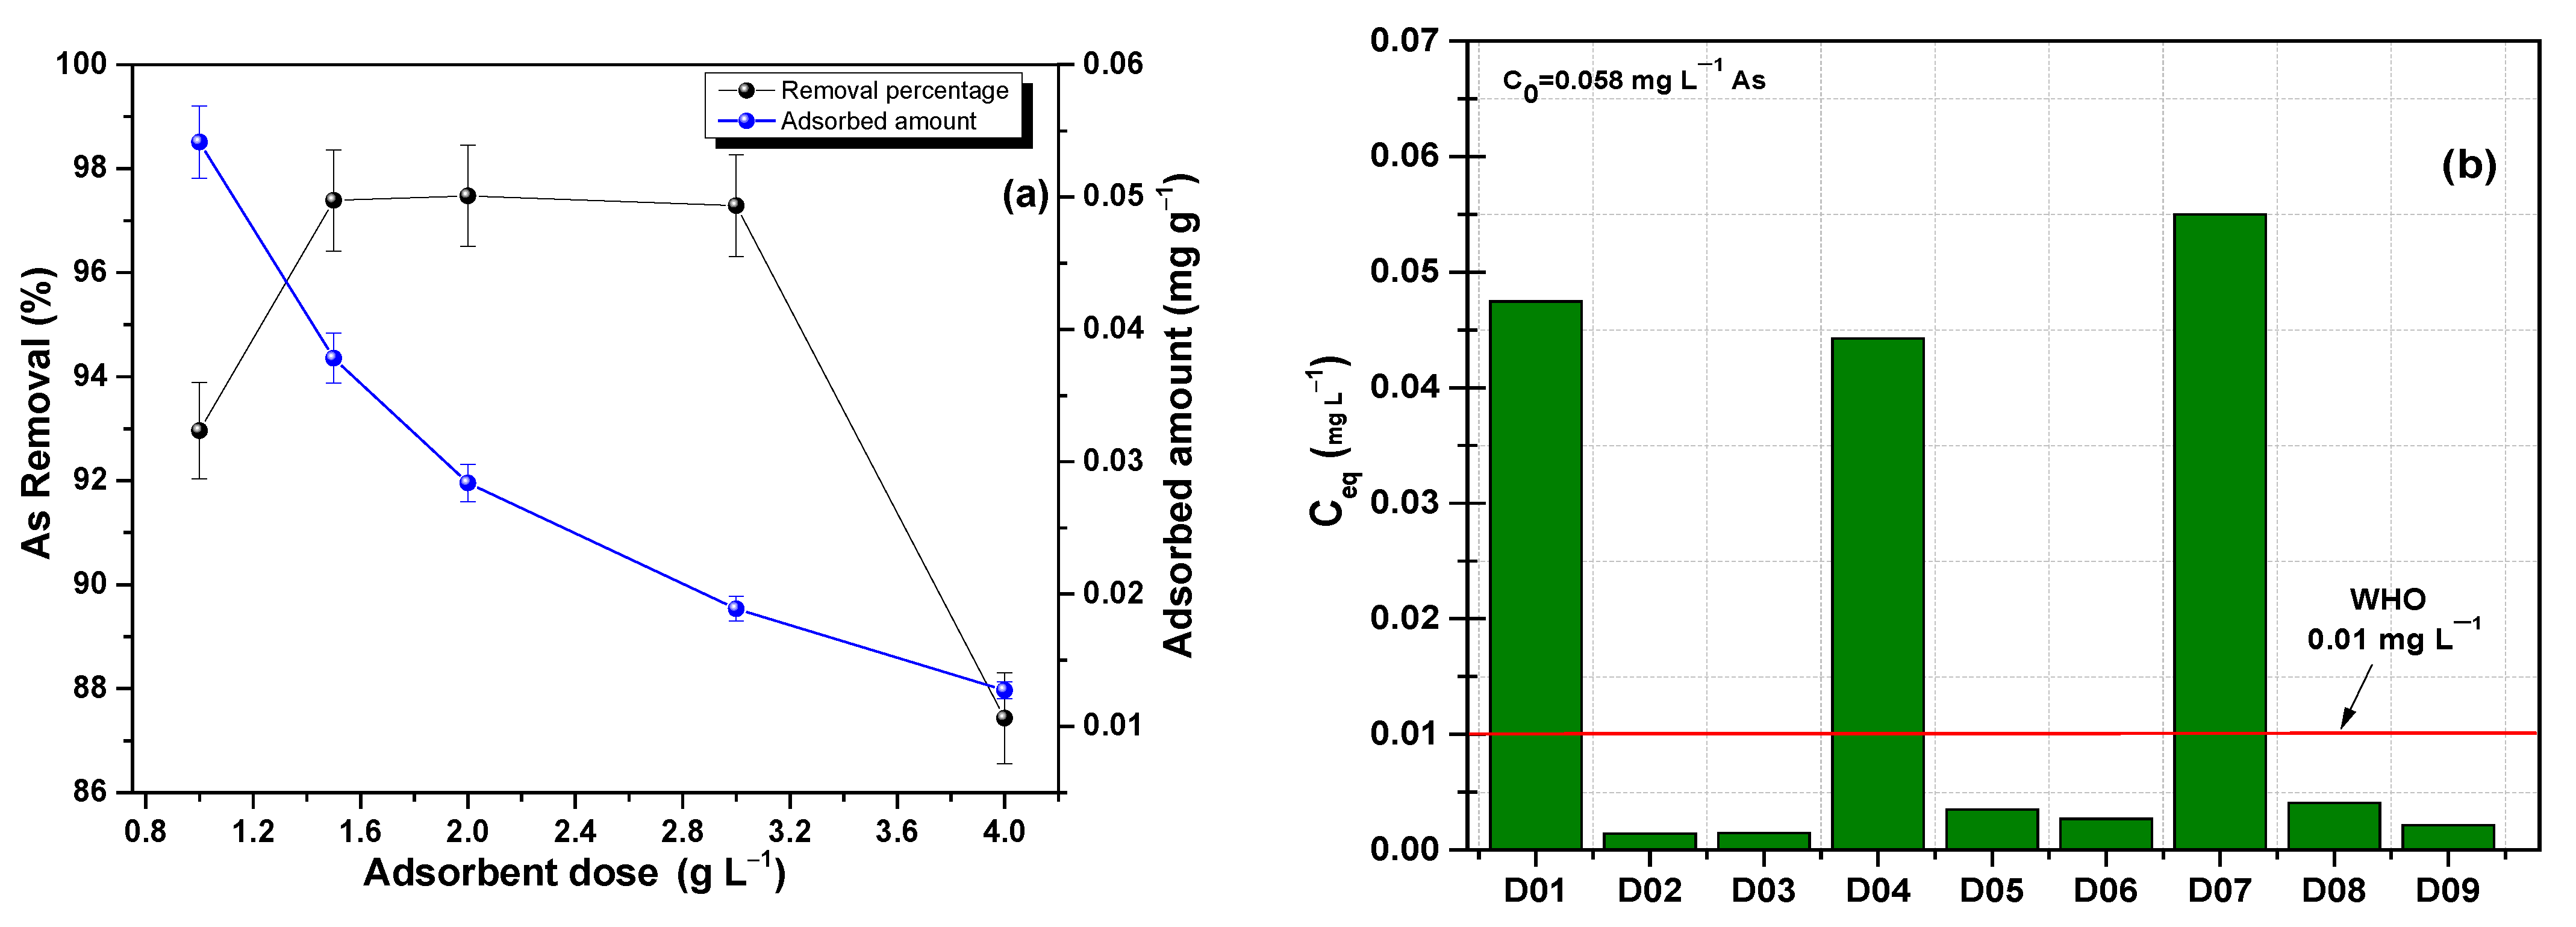
3.7.5. Removal of As from Drinking Water with 11Z5A

First, the adsorbent doses (1 g L−1 to 4 g L−1) were evaluated in order to obtain an adequate dose to be used in subsequent experiments for the adsorption of As from water for human consumption from the Quero water source, Jauja, Junin, at an initial As concentration of 0.058 mg L−1 (Table S5). In Figure 10a, the changes in the percentage removal and adsorbed amount of 11Z5A as a function of the dose can be seen. Initially, there is an increase in the removal percentage with increasing dose of 11Z5A from 1 g L−1 to 1.5 g L−1; however, with a further increase in dose, the adsorption amount decreases. When the adsorbent dose is adjusted to the amount of As ions in the solution, saturation of the adsorption sites is reached [54]. This was seen when the percentage of As removal with 11Z5A was maintained from 1.5 g L−1 and reached its maximum value at 2 g L−1. After saturation, the removal process still occurs despite having a low capacity, showing a slight decrease in the percentage removal at a mass of 3 g L−1 and reaching an even lower percentage removal of 87% at 4 g L−1. An excessive increase in adsorbent mass can cause a decrease in the effective surface area due to the conglomeration of adsorbent particles, which reduces the number of effective active sites for adsorption [54]. Therefore, a dose of 1.5 g L−1 of 11Z5A is the optimum to use for the experimental design. Of the nine experiments carried out at the three contact times in interaction with the three pH levels (Table S6), it was seen that As(V) was removed at pH 5.5 and 6.5, reaching concentrations below 0.01 mg L−1, which is the permissible limit for arsenic concentration in drinking water established by the WHO (Figure 10b). The maximum removal percentage of 97.60% was estimated at pH 5.5 and 8 h, presenting an As concentration in the treated water of less than 0.0014 mg L−1, well below 0.01 mg L−1. The percentage of As removal was not affected in the presence of other metal ions, such as Mg2+, Pb2+, Ca2+, and Zn2+, among others present in the water, indicating that these ions had little effect on the adsorption efficiency of As(V) since they mostly have very low concentrations in water. Yang et al. [23] mentioned that, in the case of a high concentration of coexisting metal cations in water, the adsorption rate of zeolite 5A for metal cations may gradually decrease due to adsorbent saturation at the adsorption site.
Our studied parameters have shown that the adsorbed amount reaches a maximum value of 99.29% at pH 5.5, close to neutral, indicating that zeolite 5A is a potential adsorbent for As in drinking water, in comparison with Yang et al. [23] who removed approximately 75% of As(V) at an acid pH of 4, which required more pH regulation. On the other hand, Qiu and Zheng [57], at pH 6, obtained a removal capacity of 4.1 mg g−1, which was much lower compared to the present work (Table 5). In general, taking a look at Table 5, zeolite 5A had a higher removal rate than other main systems, which also use other materials functionalized with zeolite 5A.
Table 5. Comparison among adsorbents found in the literature applied for As(V) removal.
AdsorbentpHTime (h)Doseqmax.
(mg g−1)
Removal %Kinetic ModelAdsorption ModelRef.
NZVI-5A zeoliteNot affected-0.2 g72.09>80PSOLangmuir
R2 = 0.99
[23]
Zeolite 5A440.2 g31.27>75Linear-PSOFreundlich
R2 = 0.99
[23]
Zeolite/Fe3O440.67-47.496.8Linear-PSOLangmuir[28]
Copper exchanged zeolite A (CEZ)7--1.4898Linear-PSOLangmuir
R2 = 0.90
[58]
Fe3O4-NaA zeolite71.50.05 g L−1-87--[59]
Zeolite 5A624 4.1---[57]
γ-Fe2O3-coated zeolite (MNCZ)2.50.250.5 g L−14495.6-Freundlich
R2 = 0.89
[60]
Zeolite 5A 125 g L−1----[50]
This work
(zeolite 11Z5A)
5.591 g L−136.3599.3Nor-linear PSOLangmuir
R2 = 0.81

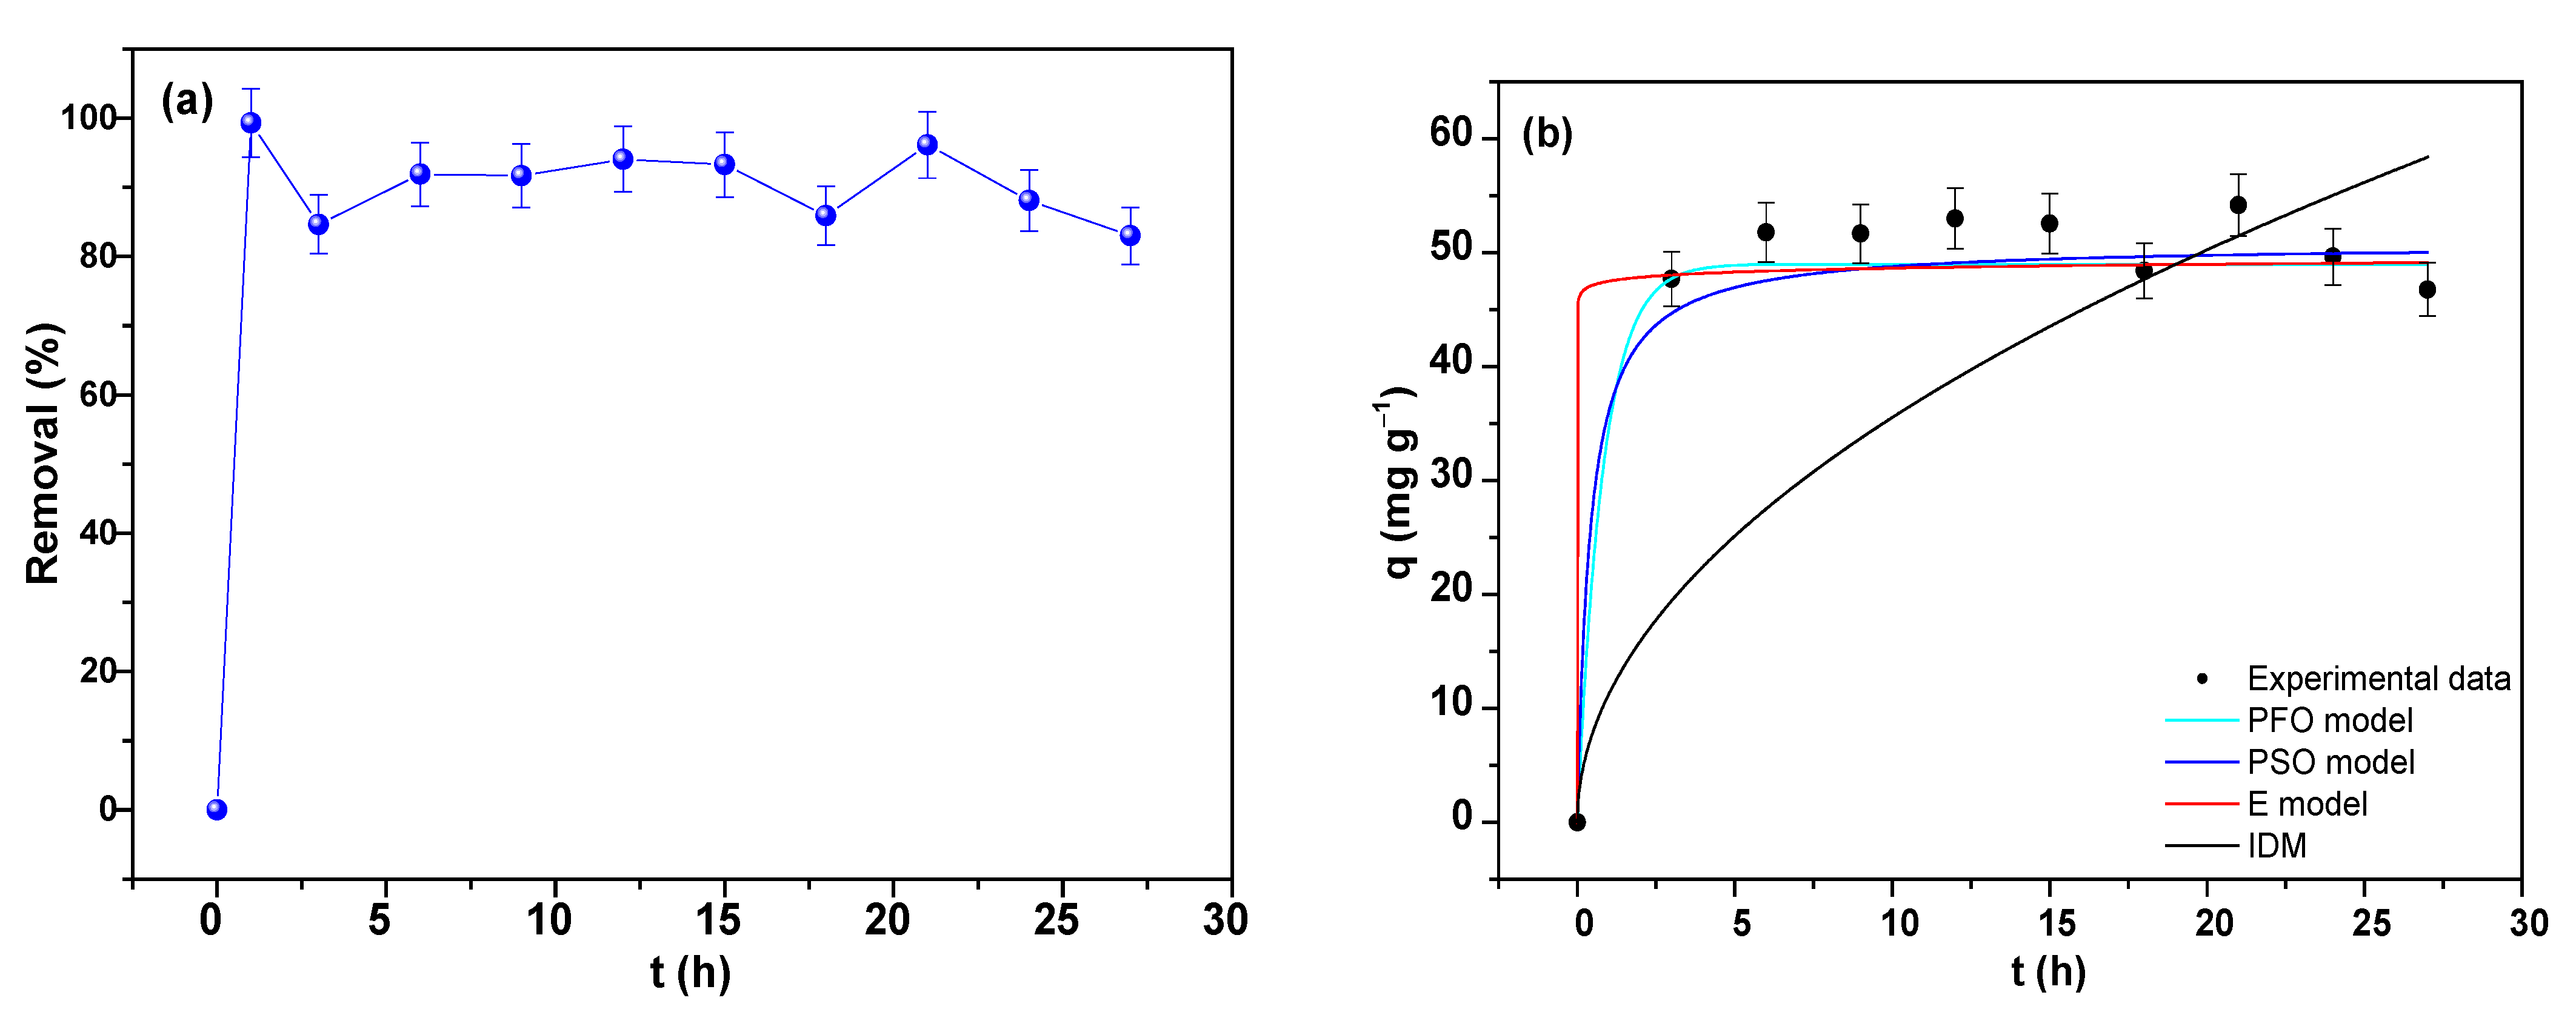
3.7.6. Adsorption Kinetics of Pb

Figure 11a shows the graphic representation of the removal percentage at the different time intervals of Table S7, in which a removal percentage greater than 82% is seen in all the experiments carried out. Equilibrium was reached after 12 h, eliminating 94.06% of Pb(II).
The adsorption kinetics experiments of Pb(II) in the irrigation water were developed in order to determine the equilibrium time and to determine the mechanism that controls the adsorption process with the different models of adsorption kinetics (Figure 11b). A non-linear modeling was carried out; it has been suggested as the best technique because it provides more real data with respect to the linear model (Figure S5) [61]. The calculated kinetic parameters by linear and nonlinear fits are shown in Table S8 and Table 6, respectively.
All of the kinetic models PFO, PSO, E and IDM showed a good fit with the experimental data. However, by comparing the R2 values, it can be determined that the adsorption behavior of 18PZ5A was more consistent with PFO and E, given that they had the same value. The PFO model assumes that adsorption is based on the adsorption capacity of the adsorbent [62], and the E model is generally applied in chemisorption processes; it assumes that the active sites of the adsorbent are heterogeneous [63]. From the value of R2, it cannot be determined which model better describes the adsorption since it is an independent criterion [64]. The BIC and RRS values were used to optimize the variance bias compensation [65] and select the corresponding model. The results of Table 6 show that the lowest values for BIC and RSS were obtained with E; the model can be accurately predicted with the lowest value of BIC and RSS [38]. In this way, the E model best describes Pb adsorption, and zeolite 18PZ5A has a heterogeneous surface.

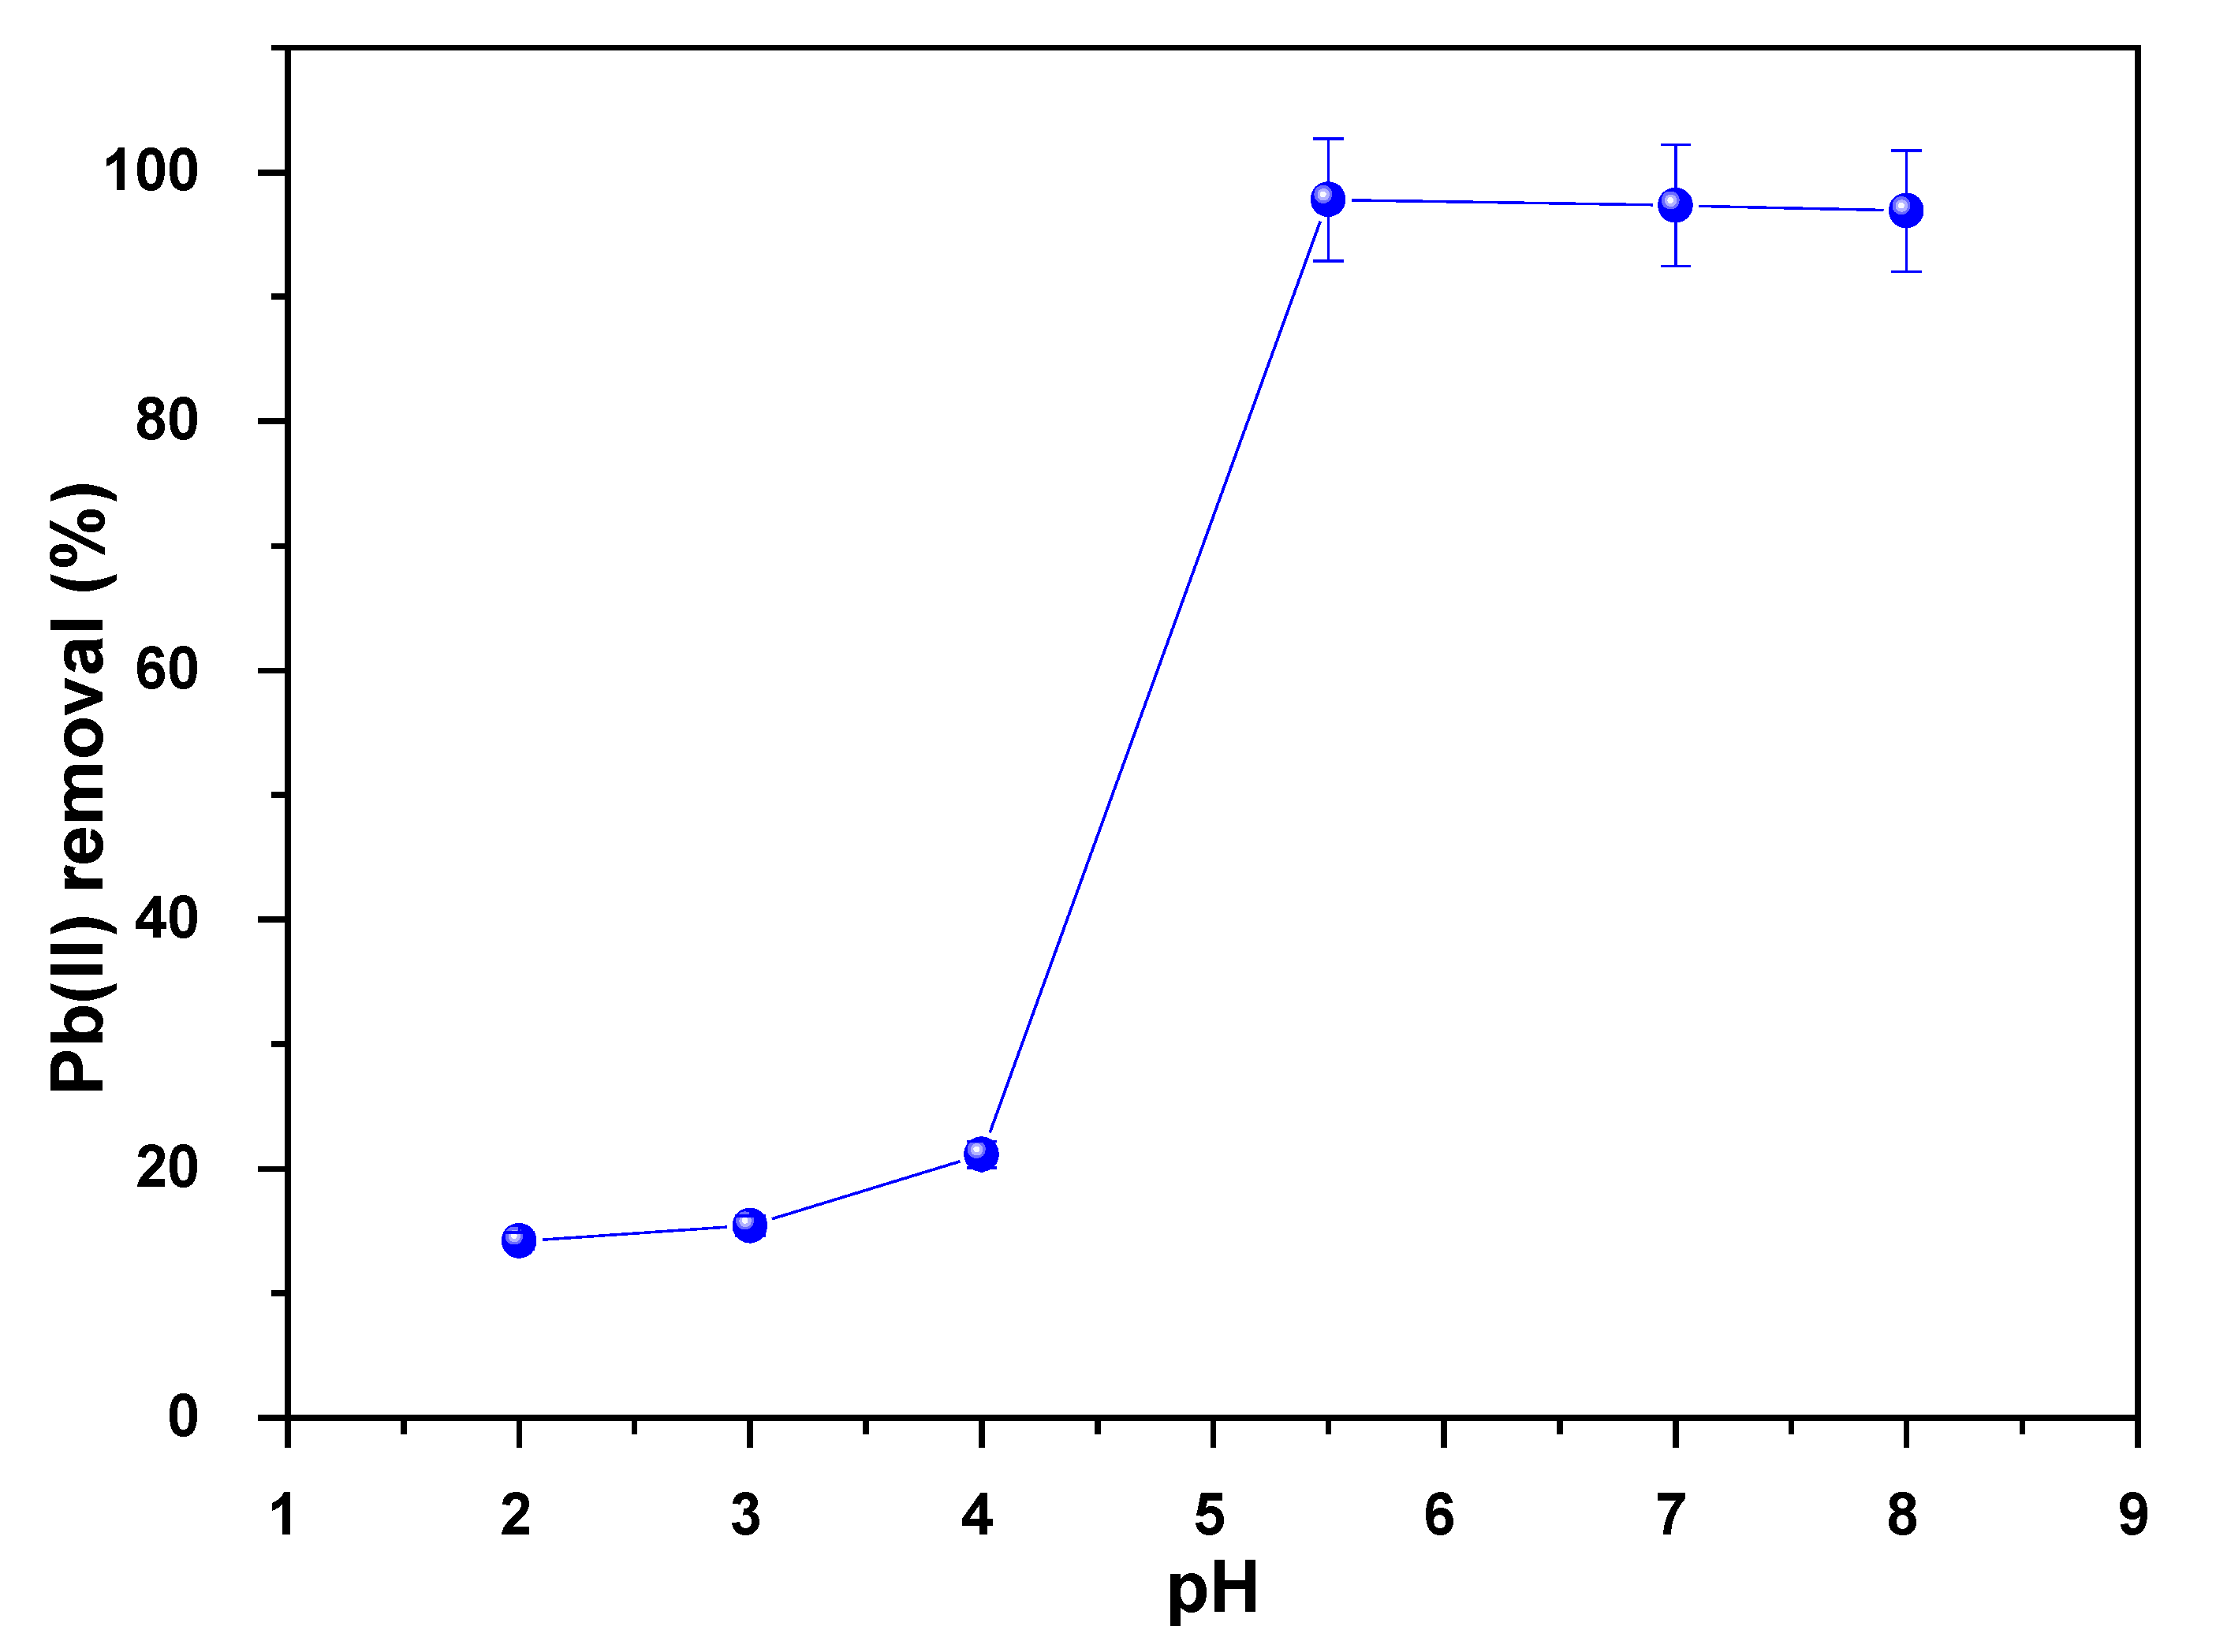
3.7.7. Effect of pH on the Pb Adsorption

Figure 12 shows the effect of pH on the Pb(II) adsorption. In a range from 2 to 5.5, the adsorption percentage increases as the pH increases. Above 5.5, it is observed that the adsorption percentage gradually decreases. At low pH, the surface of 18PZ5A is covered with H+ ions, with which Pb(II) ions compete for adsorption sites [19]. As the pH increases, the H+ ions decrease; this means that there are more Pb(II) ions adsorbed. In addition, it causes the dissociation of the hydroxyl compounds (SiOH and AlOH) present on the surface of the zeolite [66], leaving more active sites for adsorption. However, the percentage of removal did not increase at pH values greater than 5.5 because as the basicity increases there is greater deprotonation, and, at a given moment, there is repulsion of electrons from the Pb(II) species and the negatively charged surface of 18PZ5A [28], decreasing the adsorption capacity. On the other hand, with the increase in the pH value, the formation of complex species of Pb(II) increases. In the present study, a maximum Pb removal of 97.8% was obtained with a pH of 5.5; therefore, this pH was chosen as an optimal value.

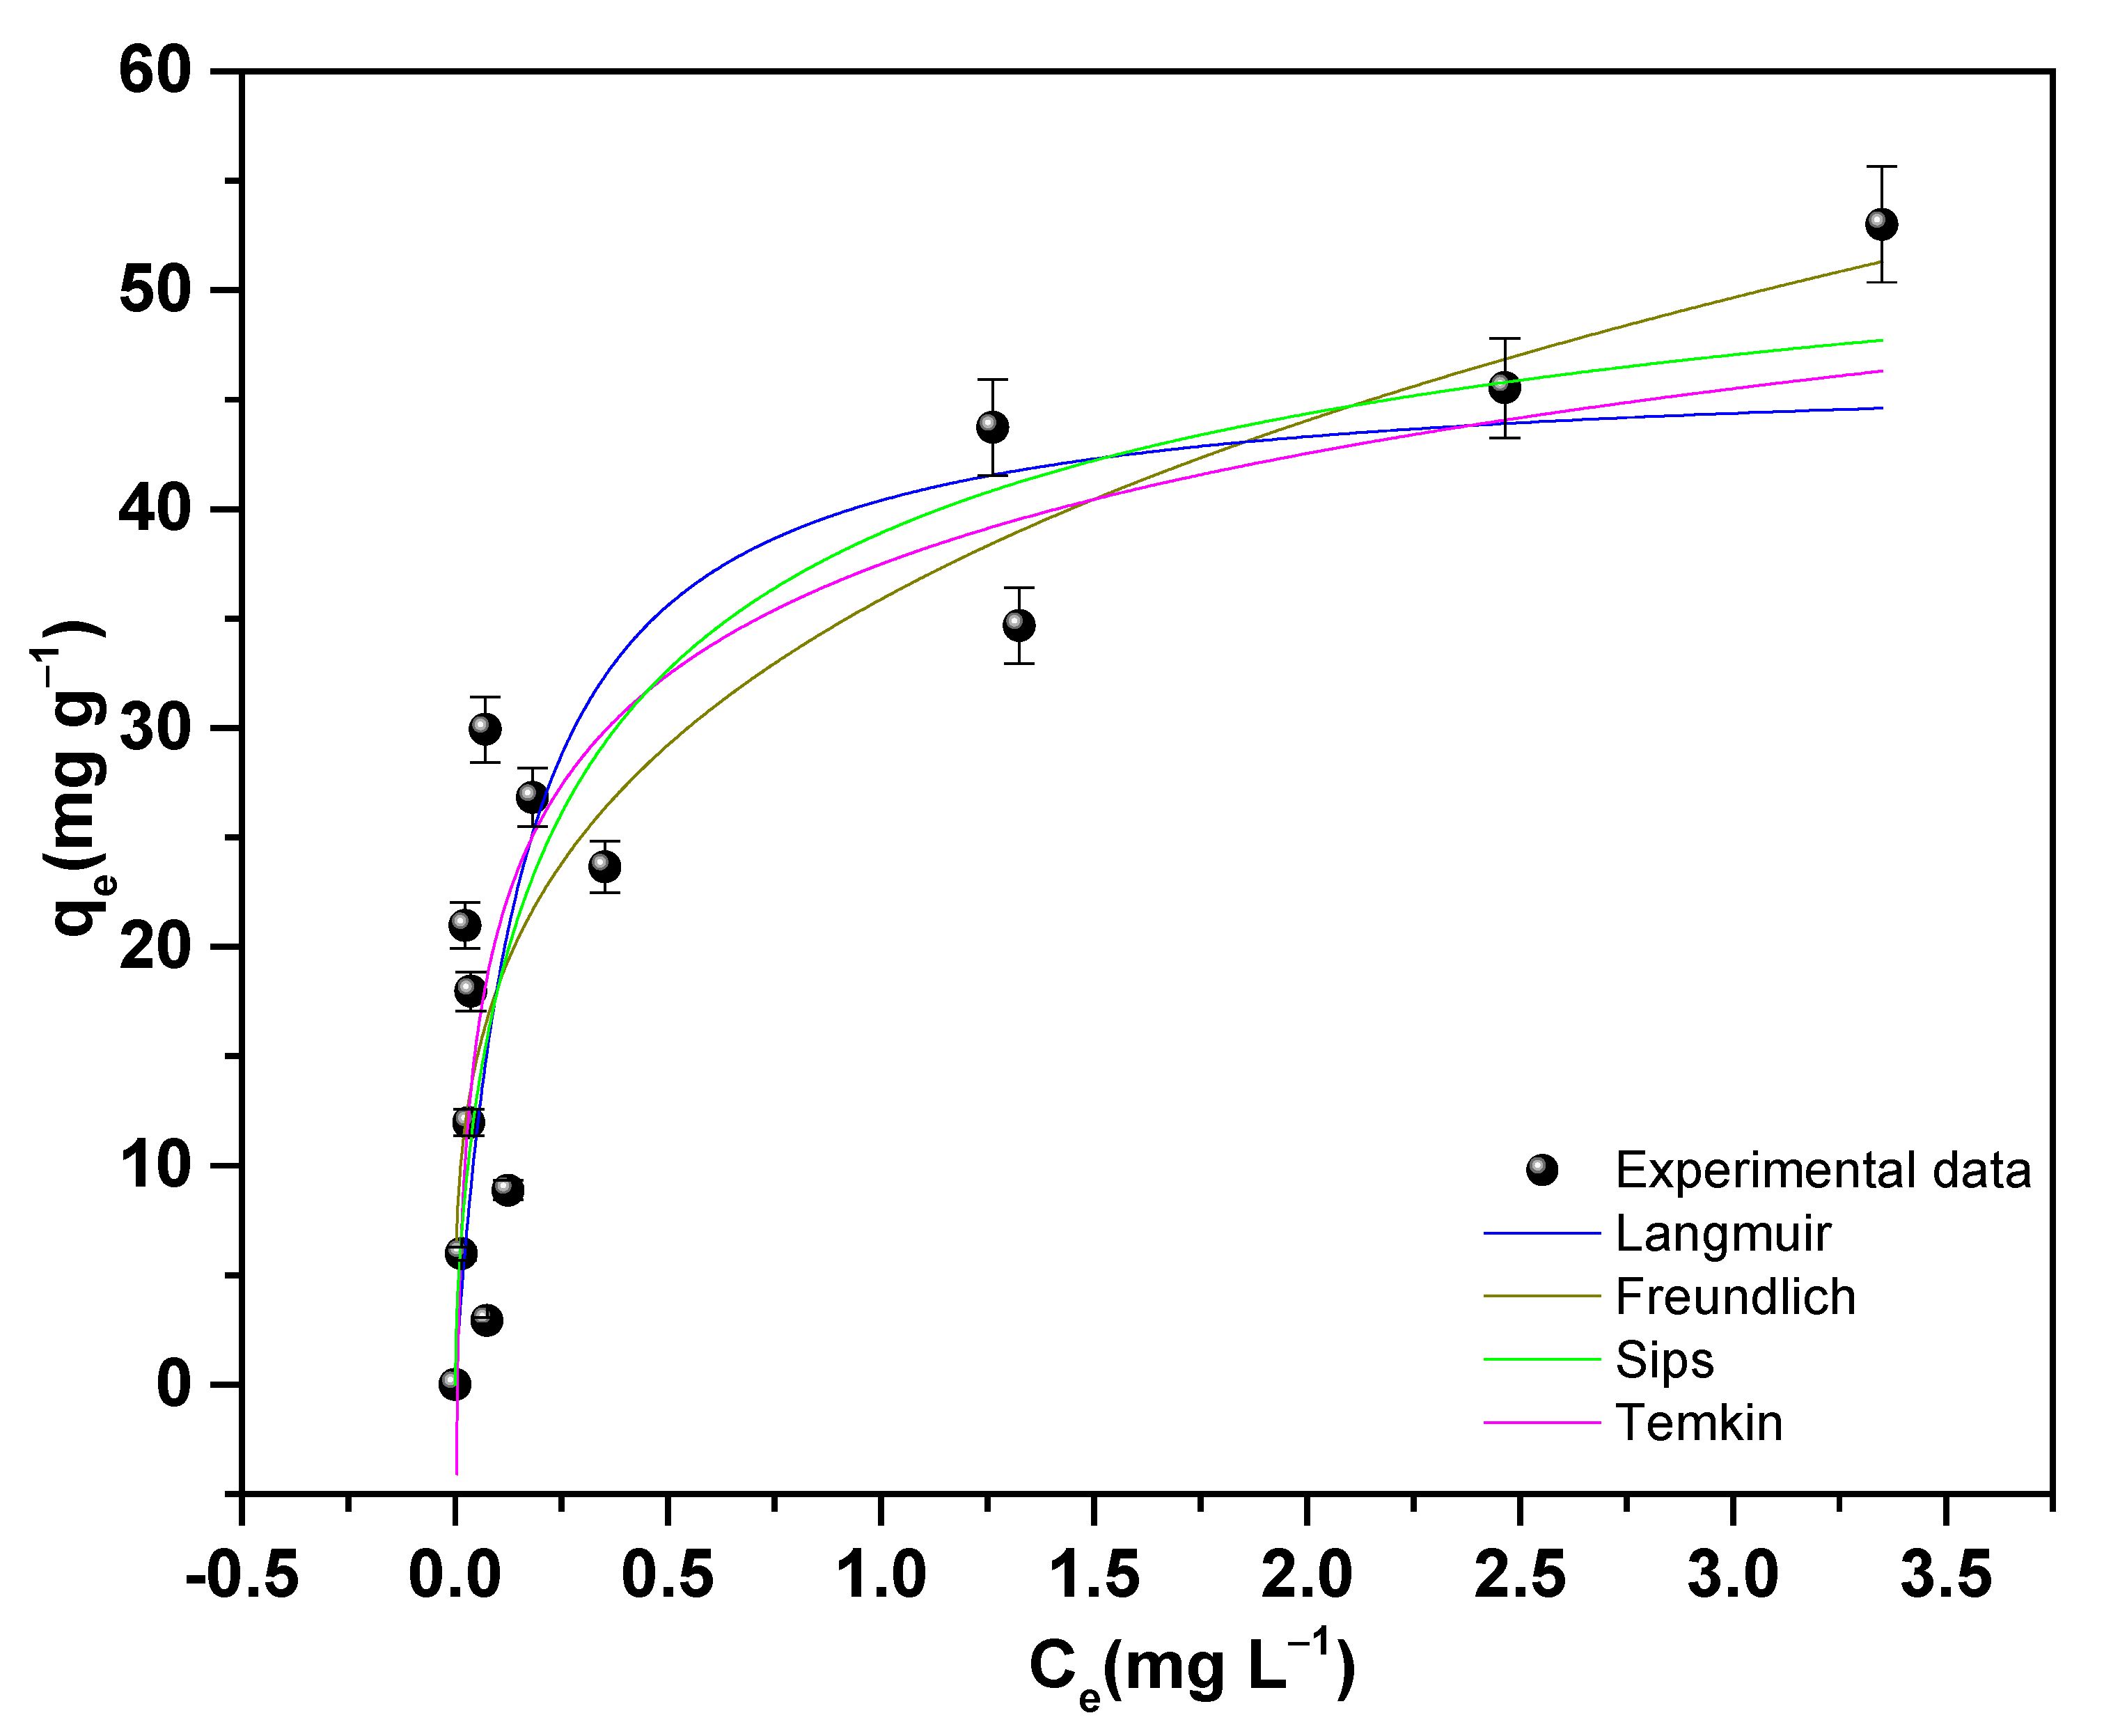
3.7.8. Adsorption Isotherms of Pb(II) on 18PZ5A

Figure 13 shows the results of fitting the experimental data with the isotherm models. In much of the previous work reported on Pb removal, the Langmuir isotherm better fits the experimental data. In this case, comparing the models with the value of R2, the Freundlich isotherm has a better fit (R2 = 0.75 (Table 7)). This model assumes that, due to the diversity of adsorption sites on the zeolite surface, the surface of the adsorbent is multilayer and not homogeneous [28]. The heterogeneous character of the 18PZ5A surface is also confirmed by the parameter n; if it is less than 1, the adsorption is chemical, and if it is greater than 1, the adsorption is physical and favorable [32]. A value of 3.45 was obtained, indicating a favorable and heterogeneous physisorption condition. On the other hand, the Temkin isothermal model also had a relatively high value of R2 compared to the others; this model describes the relationship between the adsorbent and the heat of adsorption [67]. Another value to consider is bT, which makes reference to the high iteration between adsorbate and adsorbent [32]. After evaluating the isotherm models by various criteria, we observed that R2 is the only parameter that repeats and allows comparison with the models, so previously described statistical equations were used to evaluate modeling errors [38] such as the BIC and RSS. The lowest BIC value was obtained in the Freundlich isotherm. The difference in this BIC value with that of another applied model is greater than 2, so there is a positive perspective that the model with the lower BIC value is the appropriate one. Thus, we select the Freundlich model as the most appropriate to describe the adsorption process, thus agreeing with the results obtained from adsorption kinetics. The Freundlich constant kF is 35.87 (mg g−1) (mg L−1)−1/n, and, according to the prediction of the Langmuir model, the maximum adsorption capacity is 46.67 mg g−1. This value is higher than the values reported in some studies, as shown in Table 8.

3.7.9. Removal of Pb from Irrigation Water with 18PZ5A

In addition to Pb, other heavy metals were found in the CIMIRM channel, such as Zn, Ni, and Cu. According to the tests carried out, as the pH increases, the adsorption percentage increases until reaching a maximum at pH 6.5. At a pH of 4.5 and 5.5, the adsorption percentage is lower due to the competition that exists between Pb ions and other heavy metal ions for the active centers of 18PZ5A. A similar behavior was observed by Joseph et al. [68], who investigated the simultaneous removal of Cd(II), Co(II), Cu(II), Pb(II), and Zn(II). Studies [69,70,71,72] show that there is a great affinity of zeolite for Pb. It is assumed that competitive adsorption is the main reason for the adsorption results in an acidic medium. By increasing the pH, the competition is less since most of the Pb ions can be exchanged or adsorbed by 18PZ5A. An adsorption percentage greater than 96.63% was obtained at a pH of 6.5.
The different zeolite samples reported in Table 8 show different adsorption behaviors and, consequently, different adsorption percentages. The percentage of Pb removal depends mainly on the amount of zeolite at a certain volume, contact time, and pH [73].
The adsorption capacity of Pb with natural zeolites reported by Yousefi et al. [74] was 100 mg g−1 eliminating 90% of Pb, Alswat et al. [28] used zeolite/CuO (modified zeolite) where they obtained lower adsorption capacity of 47.3 mg g−1 but higher adsorption percentage of 96.7%, the zeolites synthesized in this work with a low adsorption capacity of 35.86 mg g−1 and a high removal percentage of 97.8% obtained better results. It is believed that the rapid passage is due to the availability of active sites on 18PZ5A, and as these sites become more and more occupied, sorption becomes slower [75]. In addition, we can deduce that better results are obtained with synthesized zeolites.
The experimental data of Pb adsorption that analyzed the rate can be well represented, for the most part by, the pseudo-second order kinetic model (see Table 8). Regarding the adsorption mechanism, the Langmuir model better fits the adsorption data of Pb [76].
Table 8. Comparison among adsorbents found in the literature for Pb removal.
AdsorbentpHTime (h)Dose
(g L−1)
qmax.
(mg g−1)
Removal %Kinetic ModelAdsorption ModelRef.
H-clinoptilolite5.4110.09.9875Nonlinear-PFOFreundlich
R2 = 0.92
[62]
ZSM-50.752-74.1--Langmuir
R2 = 0.99
[77]
zeolite/Fe3O440.673.033.981.3Linear-PSOLangmuir
R2 = 0.99
[28]
Zeolite/CuO40.673.047.496.8Linear-PSOLangmuir
R2 = 0.99
[28]
K-Type Zeolite560.2102.075.7Nonlinear-PSOFreundlich
R2 = 0.99
[19]
Clay-zeolite4.97241.0131.6 Linear-PSOLangmuir
R2 = 0.99
[32]
Natural zeolite3-62210090Nonlinear-Double Exponential modelLangmuir
R2 = 0.99
[74]
New zeolite-type7.312.525.8899.6Nonlinear-Pseudo second orderLangmuir
R2 = 0.98
[78]
Fe3O4@PDA@L-Cys5.5141.546.95>90Linear Pseudo second orderLangmuir
R2 = 0.9903–0.9970
[79]
This work (zeolite 18PZ5A)6.512146.6797.8Nonlinear Pseudo first orderFreundlich
R2 = 0.75

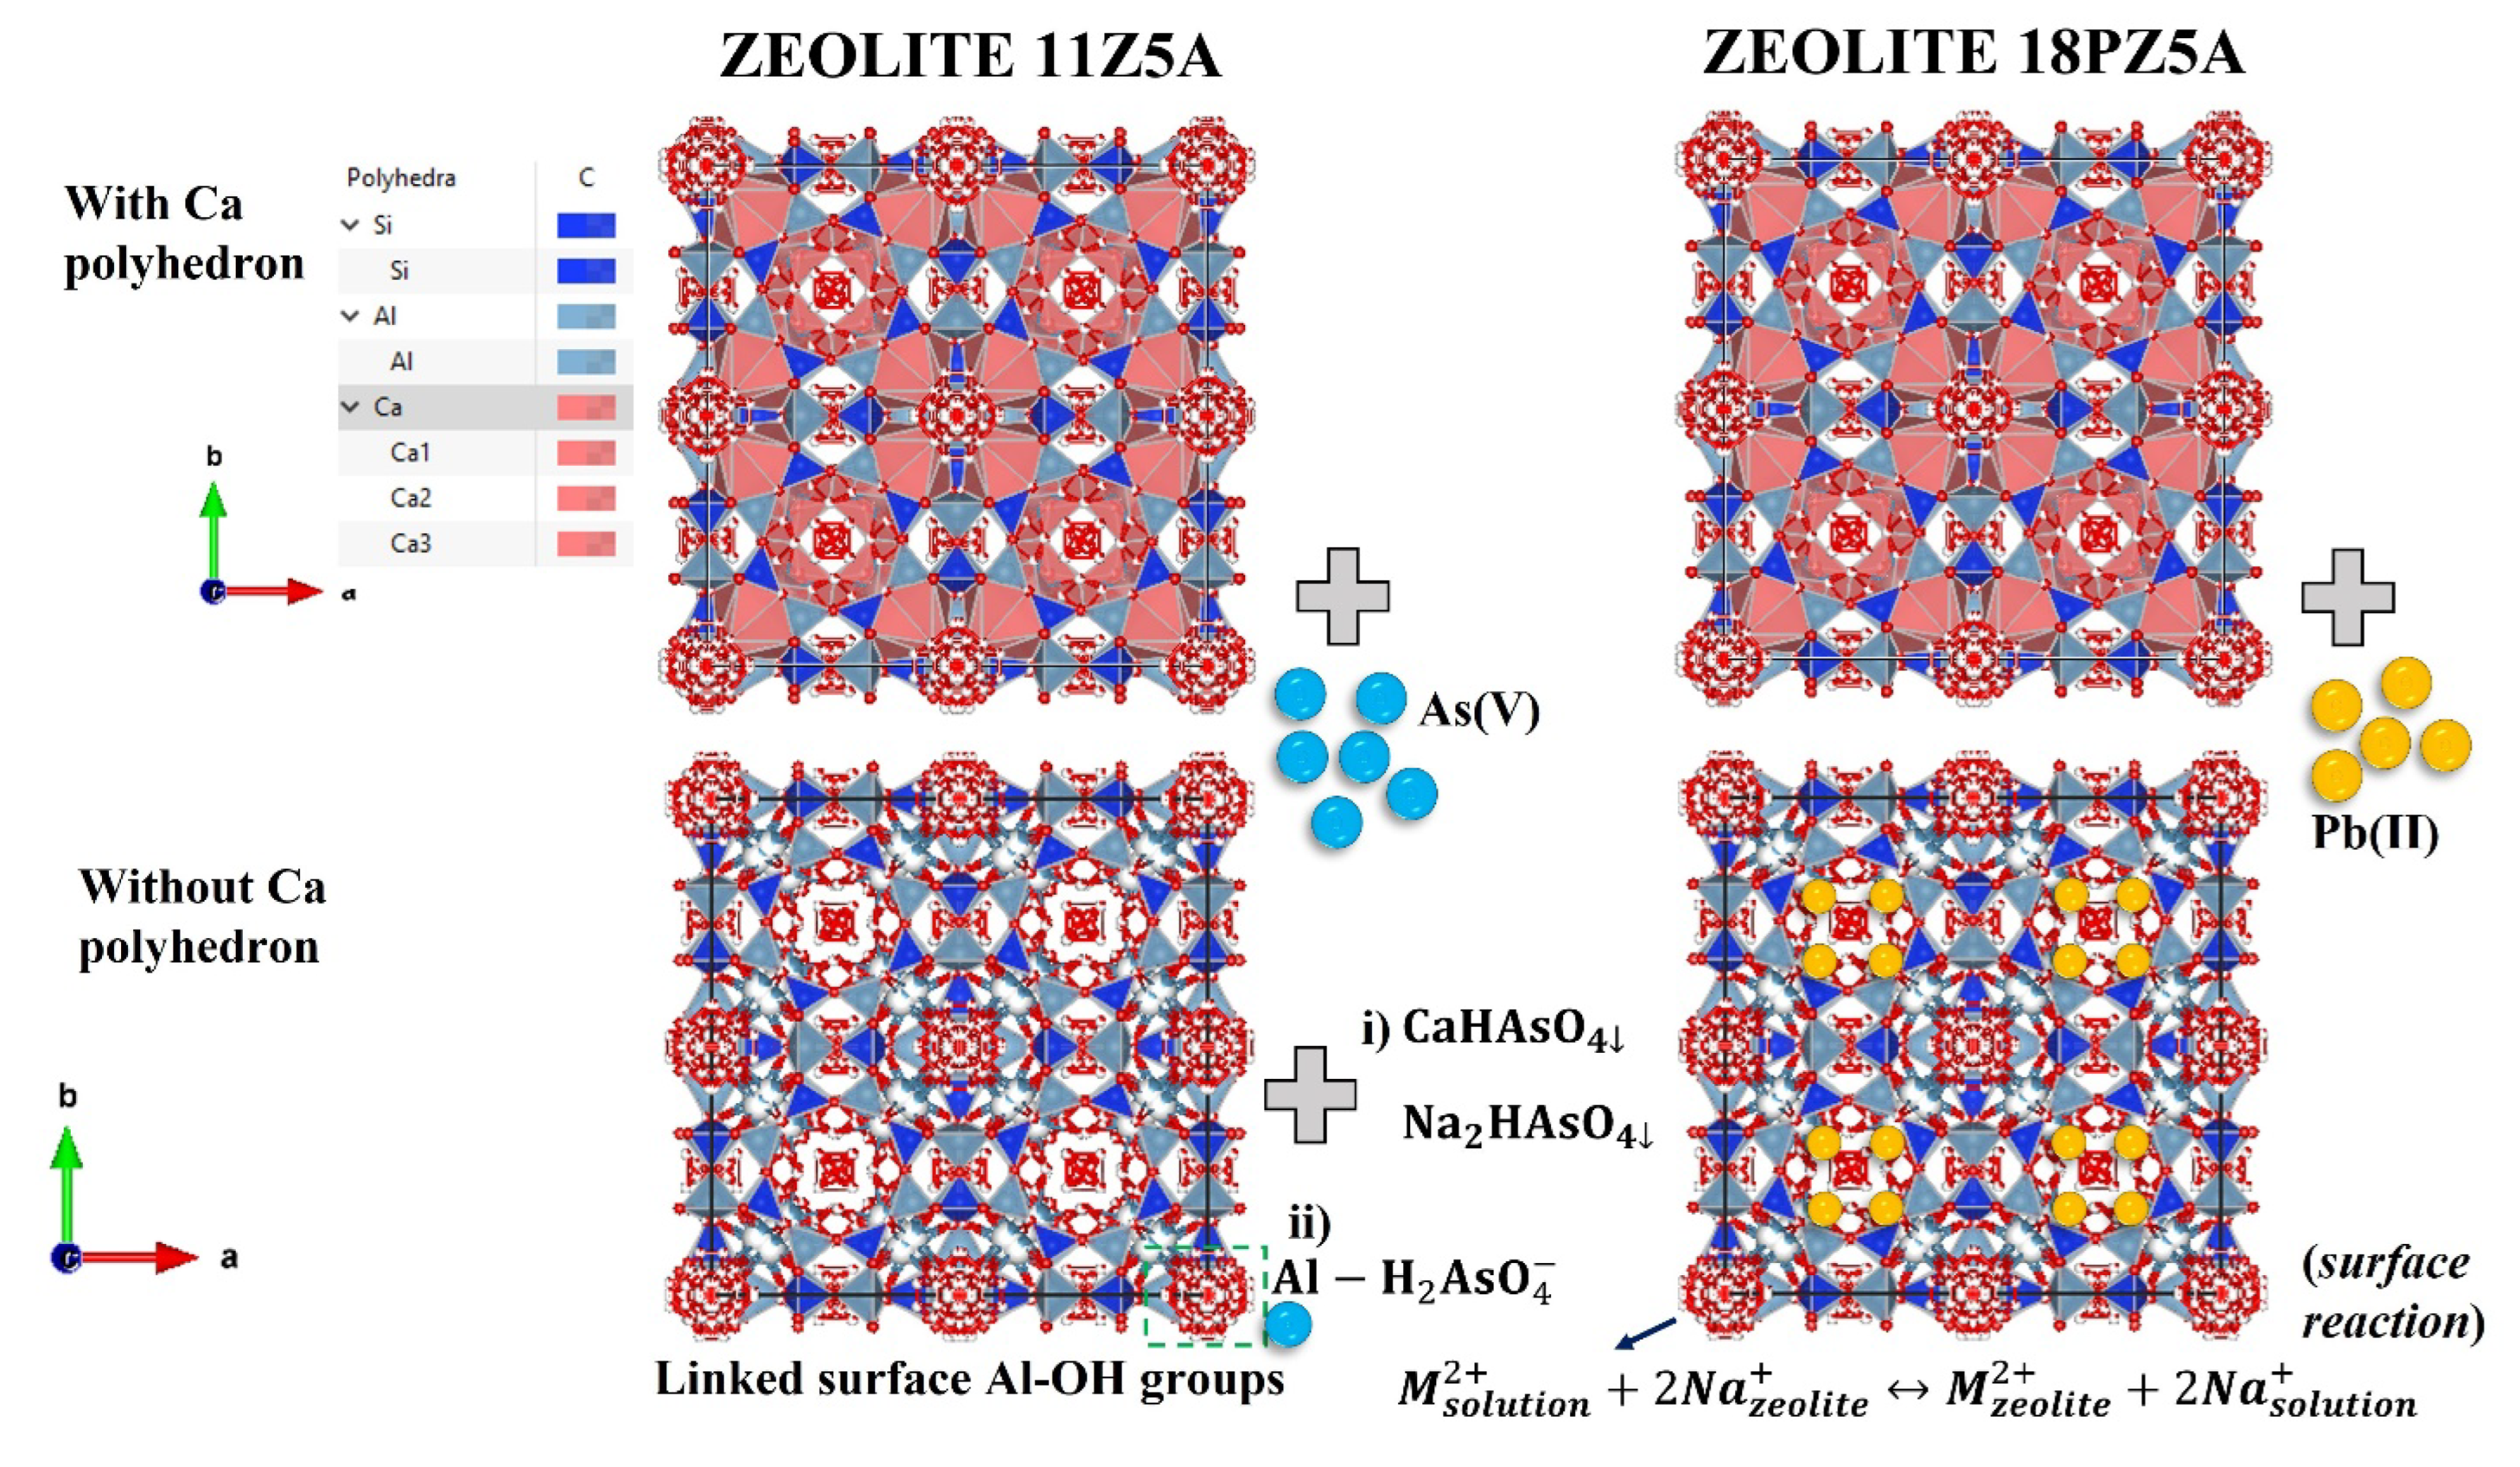
3.7.10. Adsorption Mechanism

As we previously described, the common As(V) species between pH values of 4 and 8 are HAsO 4 2 and H 2 AsO 4 . XPS, kinetic, pH, and isotherm experiments showed the formation of complexed/precipitated As species on the zeolite surface. It seems that preliminary substitution chemical reactions occurred at the surface as precipitated forms, as given by the Equations (17) and (18):
Ca 2 + + HAsO 4 2 CaHAsO 4
2 Na + HAsO 4 2 Na 2 HAsO 4
The precipitate given in Equation (17) was also observed by Yang et al. [23]. Moreover, these equations explained the XPS results shown in Table 2, where surface Ca and Na are not seen in the spectra after As(V) adsorption. During the experiments, it was necessary to filter the zeolite 5A for ICP quantification. Hence, the precipitates were washed during this process. Second, a ligand exchange complexation between aluminol groups (Al-OH) and As species is also expected. Due to the protonated surface of zeolite 5A, we expected [57]:
Al OH + H 2 AsO 4 Al H 2 AsO 4
Al OH +   HAsO 4 2 + H 2 O AlH 2 AsO 4 + 2 OH
Equations (19) and (20) strongly reinforced the two-adsorption mechanism between zeolite 5A and As(V) species. Shevade et al. [80] reported that the complexation between Al-OH surface groups is stronger than the silanol surface groups.
In the case of Pb(II) removal, XPS did not show Ca contributions at the surface. We expect that the cationic exchange occurs with Ca ions located at the bulk (occurring at 5 Å pore size). Moreover, Na was found on the surface, according to XPS results, and it was suspected that it interacted with Pb(II) cations via the next equation [81]:
M solution 2 + + 2 Na zeolite + M zeolite 2 + + 2 Na solution +
where M is the divalent cation. Equation (21) occurs favorably in the surface of 18PZ5A, as shown in Scheme 1.

4. Conclusions

In this study, zeolites 5A (11Z5A and 18PZ5A) were obtained by ion exchange of a zeolite 4A synthesized by the hydrothermal method from kaolin, which were used to remove As(V) from drinking water and Pb(II) from irrigation water. XRD characterization confirmed the presence of the crystalline phase of the zeolites 5A in both samples. Likewise, through the Rietveld analysis, the crystallite sizes of 99.2 nm for 11Z5A and 68.5 nm for 18PZ5A were determined. XPS analysis showed typical zeolite elements as Ca and Na for both 11Z5A and 18PZ5A. By SEM analysis, the characteristic cubic shape of zeolite 5A was observed, and, by EDS, the elements Si, Al, and O were determined to be the main element constituents. The adsorption kinetic experiments showed a removal of more than 95%, both for As ions with 11Z5A and for Pb ions with 18PZ5A, reaching equilibrium times of 9 h and 12 h, respectively. The fit parameters to the kinetic models and adsorption isotherms showed that the As(V) removal process was governed by a chemisorption that took place on a homogeneous monolayer surface. In the case of Pb(II), according to the kinetic study, it behaved by chemisorption, and, by the isotherms study, it was governed by physisorption on a heterogeneous and multilayer surface. The maximum adsorption capacity of Langmuir was 36.35 mg g−1 for As(V) and 46.67 mg g−1 for Pb(II); these values are higher than those reported in previous studies. The favorable pH values were 6.5 and 5.5 for the adsorption of As(V) and Pb(II), respectively, which were close to the pH of water at their sampling points, which reduces the use of chemical reagents in the process. In the removal of As(V) and Pb(II) from water without modification of their concentrations, more than 97.60% of As and 96.63% of Pb were removed despite the presence of other ions, such as Ca2+, Mg+2, and Zn2+, reaching concentrations below the limits established by the WHO. Thus, both zeolites can achieve an excellent adsorption performance in real body waters. The possible mechanism of As adsorption is the formation of complexed/precipitated As species on the 11Z5A surface as a consequence of Ca and Na substitution, as well as a ligand exchange complexation between Al-OH and As species; moreover, for the adsorption of Pb, we expect that the cationic exchange occurs with Ca ions located at the bulk (occurring at 5 Å pore size), as well as with the interaction of Na with Pb(II) cations on the surface of 18PZ5A. Additionally, an advantage of this study was observed in the adsorbent dose of 1 g L−1, which was enough to achieve a high removal of both heavy metals, which suggests a good profitability to carry out an application on a pilot scale. In addition, an enhancement in the equilibrium time by mixing 18PZ5A phase and nanoparticles (composite with enhanced specific surface area) could avoid the segregation of 18PZ5A after Pb(II) adsorption. The zeolites 5A presented in this work are easy and low-cost to obtain. This is a promising adsorbent material for water remediation processes due to the results presented.

Supplementary Materials

The following supporting information can be downloaded at: https://www.mdpi.com/article/10.3390/w15101892/s1, Figure S1: EDS spectrum for 11Z5A and 18PZ5A before and after As(V) and Pb(II) adsorption; Table S1: Elemental composition for the studied samples obtained from EDS spectrum analysis; Figure S2: Rietveld refinement performed to zeolite type 5A (18PZ5A); Figure S3: XRD of zeolite 18PZ5A after the lead removal; Table S2: Rietveld refinement parameters of synthesized zeolite 18PZ5A; Table S3: Effect of time on the As removal efficiency of zeolite 11Z5A; Figure S4: Linear fitting of As(V) adsorption kinetic models with 11Z5A. PFO (a), PSO (b), E (c), and IDM. L1: Step 1, L2: Step 2. C0=23.083 mg L−1; Table S4: Parameters of As(V) adsorption kinetic models with 11Z5A obtained by linear fits; Table S5: Effect of adsorbent dose on the removal process of As(V) from drinking water; Table S6: Results of the final As concentration of the experimental design; Table S7: Effect of time on the Pb removal efficiency of zeolite 18PZ5A; Figure S5: Linear fitting of Pb(II) adsorption kinetic models with 18PZ5A. PFO (a), PSO (b), E (c), and IDM (d); Table S8: Parameters of Pb(II) adsorption kinetic model with 18PZ5A obtained by linear fits.

Author Contributions

Conceptualization, A.F.M.-A., Y.C.-H., J.P.-V., Y.B.-R., N.-R.C.-H. and J.A.R.-G.; methodology, A.F.M.-A., Y.C.-H., J.P.-V., Y.B.-R., N.-R.C.-H. and J.A.R.-G.; software, A.F.M.-A., Y.C.-H., J.P.-V., Y.B.-R., N.-R.C.-H. and J.A.R.-G.; validation, A.F.M.-A., Y.C.-H., J.P.-V., Y.B.-R., N.-R.C.-H. and J.A.R.-G.; formal analysis, A.F.M.-A., Y.C.-H., J.P.-V., Y.B.-R., N.-R.C.-H. and J.A.R.-G.; investigation, A.F.M.-A., Y.C.-H., J.P.-V., Y.B.-R., N.-R.C.-H. and J.A.R.-G.; resources, A.F.M.-A., Y.C.-H., J.P.-V., Y.B.-R., N.-R.C.-H. and J.A.R.-G.; data curation, A.F.M.-A., Y.C.-H., J.P.-V., Y.B.-R., N.-R.C.-H. and J.A.R.-G.; writing—original draft preparation, A.F.M.-A., Y.C.-H., J.P.-V., Y.B.-R., N.-R.C.-H. and J.A.R.-G.; writing—review and editing, A.F.M.-A., Y.C.-H., J.P.-V., Y.B.-R., N.-R.C.-H. and J.A.R.-G.; visualization, A.F.M.-A., Y.C.-H., J.P.-V., Y.B.-R., N.-R.C.-H. and J.A.R.-G.; supervision, Y.B.-R. and J.A.R.-G.; project administration, Y.B.-R. and J.A.R.-G.; funding acquisition, Y.B.-R. and J.A.R.-G. All authors have read and agreed to the published version of the manuscript.

Funding

This research was funded by Fondo Nacional de Desarrollo Científico, Tecnológico y de Innovación Tecnológica (PROCIENCIA-CONCYTEC), project number: 177-2020-FONDECYT (PROCIENCIA), project CLEAN NANOMAGNETIC. “The APC was funded by PROCIENCIA”.

Data Availability Statement

The original data related to this research can be obtained at any time via the corresponding author’s email: [email protected].

Acknowledgments

We thank PROCIENCIA for financially supporting this work.

Conflicts of Interest

The authors declare no conflict of interest.

References

  1. Aguilar-Ibarra, A. Calidad Del Agua: Un Enfoque Multidisciplinario, 1st ed.; Instituto de Investigaciones Económicas, UNAM: Ciudad de Mexico, Mexico, 2010. [Google Scholar]
  2. OMS. Arsenic in Drinking-Water; WHO: Geneva, Switzerland, 2011; Volume 27. [Google Scholar] [CrossRef]
  3. Payne, K.B.; Abdel-Fattah, T.M. Adsorption of Arsenate and Arsenite by Iron-Treated Activated Carbon and Zeolites: Effects of PH, Temperature, and Ionic Strength. J. Environ. Sci. Health Part A 2005, 40, 723–749. [Google Scholar] [CrossRef] [PubMed]
  4. Henke, K.R. Arsenic: Environmental Chemistry, Health Threats and Waste Treatment, 1st ed.; John Wiley & Sons: West Sussex, UK, 2009. [Google Scholar] [CrossRef]
  5. Anthony, J.W.; Bideaux, R.A.; Bladh, K.W.; Nichols, M.C. (Eds.) “Galena”. Handbook of Mineralogy; Mineralogical Society of America: Chantilly, VA, USA, 1990; Volume 1, ISBN 0962209708. [Google Scholar]
  6. Mostafa, N.G.; Yunnus, A.F.; Elawwad, A. Adsorption of Pb(II) from Water onto ZnO, TiO2, and Al2O3: Process Study, Adsorption Behaviour, and Thermodynamics. Adsorpt. Sci. Technol. 2022, 1, 1–13. [Google Scholar] [CrossRef]
  7. Elawwad, A.; Naguib, A.; Abdel-Halim, H. Modeling of Phenol and Cyanide Removal in a Full-Scale Coke-Oven Wastewater Treatment Plant. Desalin. Water Treat. 2016, 57, 25181–25193. [Google Scholar] [CrossRef]
  8. Ghorbani, M.; Seyedin, O.; Aghamohammadhassan, M. Adsorptive Removal of Lead (II) Ion from Water and Wastewater Media Using Carbon-Based Nanomaterials as Unique Sorbents: A Review. J. Environ. Manag. 2020, 254, 109814. [Google Scholar] [CrossRef] [PubMed]
  9. Yang, H.; Lu, M.; Chen, D.; Chen, R.; Li, L.; Han, W. Efficient and Rapid Removal of Pb2+ from Water by Magnetic Fe3O4@MnO2 Core-Shell Nanoflower Attached to Carbon Microtube: Adsorption Behavior and Process Study. J. Colloid Interface Sci. 2020, 563, 218–228. [Google Scholar] [CrossRef]
  10. Karapinar, H.S.; Kilicel, F.; Ozel, F.; Sarilmaz, A. Fast and Effective Removal of Pb(II), Cu(II) and Ni(II) Ions from Aqueous Solutions with TiO2 Nanofibers: Synthesis, Adsorption-Desorption Process and Kinetic Studies. Int. J. Environ. Anal. Chem. 2021, 1, 1–21. [Google Scholar] [CrossRef]
  11. Shu, Y.; Huang, R.; Wei, X.; Liu, L.; Jia, Z. Pb(II) Removal Using TiO2-Embedded Monolith Composite Cryogel as an Alternative Wastewater Treatment Method. Water. Air. Soil Pollut. 2017, 228, 1–16. [Google Scholar] [CrossRef]
  12. Zhang, Y.; Song, X.; Zhang, P.; Gao, H.; Ou, C.; Kong, X. Production of Activated Carbons from Four Wastes via One-Step Activation and Their Applications in Pb2+ Adsorption: Insight of Ash Content. Chemosphere 2020, 245, 125587. [Google Scholar] [CrossRef]
  13. Vu, K.B.; Kaminski, M.D.; Nunez, L. Review of Arsenic Removal Technologies for Contaminated Groundwaters; U.S. Department of Energy, Office of Scientific and Technical Information: IL, USA, 2003. [Google Scholar]
  14. Kurian, M. Cerium Oxide Based Materials for Water Treatment-A Review. J. Environ. Chem. Eng. 2020, 8, 104439. [Google Scholar] [CrossRef]
  15. Rudi, N.N.; Muhamad, M.S.; Te Chuan, L.; Alipal, J.; Omar, S.; Hamidon, N.; Hamid, N.H.A.; Sunar, N.M.; Ali, R.; Harun, H. Evolution of adsorption process for manganese removal in water via agricultural waste adsorbents. Heliyon 2020, 6, e05049. [Google Scholar] [CrossRef]
  16. Taamneh, Y.; Sharadqah, S. The Removal of Heavy Metals from Aqueous Solution Using Natural Jordanian Zeolite. Appl. Water Sci. 2017, 7, 2021–2028. [Google Scholar] [CrossRef]
  17. Wingenfelder, U.; Hansen, C.; Furrer, G.; Schulin, R. Removal of Heavy Metals from Mine Waters by Natural Zeolites. Environ. Sci. Technol. 2005, 39, 4606–4613. [Google Scholar] [CrossRef] [PubMed]
  18. Bilici Baskan, M.; Pala, A. Removal of Arsenic from Drinking Water Using Modified Natural Zeolite. Desalination 2011, 281, 396–403. [Google Scholar] [CrossRef]
  19. Kobayashi, Y.; Ogata, F.; Saenjum, C. Removal of Pb2+ from Aqueous Solutions Using K-Type Zeoite Synthesized from Coal Fly Ash. Water 2020, 12, 2375. [Google Scholar] [CrossRef]
  20. Anis, S.F.; Hashaikeh, R.; Hilal, N. Functional materials in desalination: A review. Desalination 2019, 468, 114077. [Google Scholar] [CrossRef]
  21. Shahmirzadi, M.A.A.; Hosseini, S.S.; Luo, J.; Ortiz, I. Significance, evolution and recent advances in adsorption technology, materials and processes for desalination, water softening and salt removal. J. Environ. Manag. 2018, 215, 324–344. [Google Scholar] [CrossRef]
  22. Busca, G. Zeolites and Other Structurally Microporous Solids as Acid–Base Materials. In Heterogeneous Catalytic Materials; Elsevier: Amsterdam, The Netherlands, 2014; pp. 197–249. [Google Scholar] [CrossRef]
  23. Yang, L.; Gao, M.; Wei, T.; Nagasaka, T. Synergistic Removal of As(V) from Aqueous Solution by Nanozero Valent Iron Loaded with Zeolite 5A Synthesized from Fly Ash. J. Hazard. Mater. 2021, 424, 127428. [Google Scholar] [CrossRef] [PubMed]
  24. Payne, K.B.; Abdel-Fattah, T.M. Adsorption of Divalent Lead Ions by Zeolites and Activated Carbon: Effects of PH, Temperature, and Ionic Strength. J. Environ. Sci. Health Part A 2012, 39, 2275–2291. [Google Scholar] [CrossRef]
  25. 000519-2022/DIN; Método Para La Obtención De Nanozeolita 5A Mediante Intercambio Iónico De Una Zeolita 4A Sintetizada Por El Método Hidrotermal a Partir De Caolín. INDECOPI: Lima, Perú, 2022.
  26. Canchanya-Huaman, Y.; Mayta-Armas, A.F.; Pomalaya-Velasco, J.; Bendezú-Roca, Y.; Guerra, J.A.; Ramos-Guivar, J.A. Strain and Grain Size Determination of CeO2 and TiO2 Nanoparticles: Comparing Integral Breadth Methods versus Rietveld, μ-Raman, and TEM. Nanomaterials 2021, 11, 2311. [Google Scholar] [CrossRef]
  27. Rueda-Vellasmin, R.; Checca-Huaman, N.R.; Passamani, E.C.; Litterst, F.J.; Ramos-Guivar, J.A. Mössbauer Studies of Core-Single-Shell and Core-Double-Shell Polymer Functionalized Magnetic Nanoparticles. Hyperfine Interact. 2022, 243, 1–19. [Google Scholar] [CrossRef]
  28. Alswat, A.A.; Ahmad, M.B.; Saleh, T.A. Zeolite Modified with Copper Oxide and Iron Oxide for Lead and Arsenic Adsorption from Aqueous Solutions. J. Water Supply Res. Technol.-AQUA 2016, 65, 465–479. [Google Scholar] [CrossRef]
  29. Pinzón-Bedoya, M.L.; Villamizar, L.E.V. Modelamiento de La Cinética de Bioadsorción de Cr (III) Usando Cáscara de Naranja. DYNA 2009, 76, 95–106. [Google Scholar]
  30. Imessaoudene, A.; Cheikh, S.; Bollinger, J.C.; Belkhiri, L.; Tiri, A.; Bouzaza, A.; El Jery, A.; Assadi, A.; Amrane, A.; Mouni, L. Zeolite Waste Characterization and Use as Low-Cost, Ecofriendly, and Sustainable Material for Malachite Green and Methylene Blue Dyes Removal: Box–Behnken Design, Kinetics, and Thermodynamics. Appl. Sci. 2022, 12, 7587. [Google Scholar] [CrossRef]
  31. Choy, K.K.H.; Ko, D.C.K.; Cheung, C.W.; Porter, J.F.; McKay, G. Film and Intraparticle Mass Transfer during the Adsorption of Metal Ions onto Bone Char. J. Colloid Interface Sci. 2004, 271, 284–295. [Google Scholar] [CrossRef]
  32. Medina-Rodríguez, D.F.; Martin-Torres, D.M.S.; García, C.M.L.; De Luis, V.; Aguilar-ramírez, S.D.; Jaramillo-Fierro, X.V.; Daniel, J.; Garcia-López, A.L. Removal of Pb (II) in Aqueous Solutions Using Synthesized Zeolite X from Ecuadorian Clay. Ing. Investig. 2021, 41, e89671. [Google Scholar] [CrossRef]
  33. Redlich, O.; Peterson, D.L. A Useful Adsorption Isotherm. J. Phys. Chem. 1959, 63, 1024. [Google Scholar] [CrossRef]
  34. Tor, A.; Danaoglu, N.; Arslan, G.; Cengeloglu, Y. Removal of Fluoride from Water by Using Granular Red Mud: Batch and Column Studies Removal of Fluoride from Water by Using Granular Red Mud: Batch and Column Studies. J. Hazard. Mater. 2009, 164, 271–278. [Google Scholar] [CrossRef] [PubMed]
  35. Foo, K.Y.; Hameed, B.H. Insights into the Modeling of Adsorption Isotherm Systems. Chem. Eng. J. 2010, 156, 2–10. [Google Scholar] [CrossRef]
  36. Ramos Guivar, J.A.; Bustamante, D.A.; Gonzalez, J.C.; Sanches, E.A.; Morales, M.A.; Raez, J.M.; López-Muñoz, M.J.; Arencibia, A. Adsorption of Arsenite and Arsenate on Binary and Ternary Magnetic Nanocomposites with High Iron Oxide Content. Appl. Surf. Sci. 2018, 454, 87–100. [Google Scholar] [CrossRef]
  37. Muthuselvi, R.; Vashantha, R. Kinetic and Isotherm Studies on Adsorption of Nickel (II) Ions by Brassera Oleracea as a Bioadsorbent. Int. J. Sci. Res. 2016, 5, 2413–2420. [Google Scholar] [CrossRef]
  38. Lima, E.C.; Sher, F.; Guleria, A.; Reza, M.; Anastopoulos, I.; Nguyen, H.; Hosseini-bandegharaei, A. Is One Performing the Treatment Data of Adsorption Kinetics Correctly? J. Environ. Chem. Eng. 2021, 9, 104813. [Google Scholar] [CrossRef]
  39. Cao, Y.; Dong, S.; Dai, Z.; Zhu, L.; Xiao, T.; Zhang, X. Adsorption Model Identification for Chromium (VI) Transport in Unconsolidated Sediments. J. Hydrol. 2021, 598, 126228. [Google Scholar] [CrossRef]
  40. Nguyen, T.T.Q.; Loganathan, P.; Nguyen, T.V.; Vigneswaran, S. Removing Arsenic from Water with an Original and Modified Natural Manganese Oxide Ore: Batch Kinetic and Equilibrium Adsorption Studies. Environ. Sci. Pollut. Res. 2019, 27, 5490–5502. [Google Scholar] [CrossRef]
  41. Barr, T.L. The Nature of the Relative Bonding Chemistry in Zeolites: An XPS Study. Zeolites 1990, 10, 760–765. [Google Scholar] [CrossRef]
  42. Mcintyre, N.S.; Cook, M.G. X-Ray Photoelectron Studies on Some Oxides and Hydroxides of Cobalt, Nickel, and Copper. Anal. Chem. 1975, 47, 2208–2213. [Google Scholar] [CrossRef]
  43. Moulder, J.F.; Stickle, W.F.; Sobol, P.E.; Domben, K.D. Handbook of X-ray Photoelectron Spectroscopy; Perkin-Elmer Corporation: Eden Prairie, MN, USA, 1995. [Google Scholar]
  44. Biesinger, M.C.; Payne, B.P.; Grosvenor, A.P.; Lau, L.W.M.; Gerson, A.R.; Smart, R.S.C. Resolving Surface Chemical States in XPS Analysis of First Row Transition Metals, Oxides and Hydroxides: Cr, Mn, Fe, Co and Ni. Appl. Surf. Sci. 2011, 257, 2717–2730. [Google Scholar] [CrossRef]
  45. Beamson, G.; Briggs, D. The Scienta ESCA300 Database; Wiley: Chichester, UK, 1992; Volume 5, p. 2205. [Google Scholar]
  46. Nilsson, A.; Palmer, R.E.; Tillborg, H.; Hernnäs, B.; Guest, R.J.; Mårtensson, N. Orientation-Dependent Final-State Effects in Photoelectron Spectra of Physisorbed Molecules. Phys. Rev. Lett. 1992, 68, 982–985. [Google Scholar] [CrossRef] [PubMed]
  47. Allen, B.G.C.; Curtis, M.T.; Hooper, A.J.; Tucker, P.M.; Generat-, C.E.; Laboratories, B.N.; Gloucestershire, G.L.; Parkinson, R.F.L.D.; Mallett, S.; Dalton, J.C.S. X-Ray Photoelectron Spectroscopy of Iron-Oxygen Systems. J. Chem. Soc. Dalt. Trans. 1974, 1, 1525–1530. [Google Scholar] [CrossRef]
  48. Stec, W.J.; Morgan, W.E.; Albridge, R.G.; Van Wazer, J.R. Measured Binding Energy Shifts of the “3p” and “3d” Electrons in Arsenic Compounds. Inorg. Chem. 1972, 11, 219–225. [Google Scholar] [CrossRef]
  49. Kazak, O.; Tor, A. In Situ Preparation of Magnetic Hydrochar by Co-Hydrothermal Treatment of Waste Vinasse with Red Mud and Its Adsorption Property for Pb(II) in Aqueous Solution. J. Hazard. Mater. 2020, 393, 122391. [Google Scholar] [CrossRef]
  50. Melo, C.R.; Riella, H.G.; Kuhnen, N.C.; Angioletto, E.; Melo, A.R.; Bernardin, A.M.; Da Rocha, M.R.; Da Silva, L. Synthesis of 4A Zeolites from Kaolin for Obtaining 5A Zeolites through Ionic Exchange for Adsorption of Arsenic. Mater. Sci. Eng. B Solid-State Mater. Adv. Technol. 2012, 177, 345–349. [Google Scholar] [CrossRef]
  51. Munthali, M.W.; Elsheikh, M.A.; Johan, E.; Matsue, N. Proton Adsorption Selectivity of Zeolites in Aqueous Media: Effect of Si/Al Ratio of Zeolites. Molecules 2014, 19, 20468–20481. [Google Scholar] [CrossRef] [PubMed]
  52. Gorzin, F.; Bahri Rasht Abadi, M.M. Adsorption of Cr(VI) from Aqueous Solution by Adsorbent Prepared from Paper Mill Sludge: Kinetics and Thermodynamics Studies. Adsorpt. Sci. Technol. 2018, 36, 149–169. [Google Scholar] [CrossRef]
  53. Katenta, J.; Nakiguli, C.; Mukasa, P.; Ntambi, E. Removal of Chromium (VI) from Tannery Effluent Using Bio-Char of Phoenix Reclinata Seeds. Green Sustain. Chem. 2020, 10, 91–107. [Google Scholar] [CrossRef]
  54. Tahir, H. Comparative Trace Metal Contents in Sediments and Liquid Wastes from Tanneries and the Removal of Chromium Using Zeolite-5A. Electron. J. Environ. Agric. Food Chem. 2005, 4, 1021–1032. [Google Scholar]
  55. Thommes, M.; Kaneko, K.; Neimark, A.V.; Olivier, J.P.; Rodriguez-Reinoso, F.; Rouquerol, J.; Sing, K.S.W. Physisorption of Gases, with Special Reference to the Evaluation of Surface Area and Pore Size Distribution (IUPAC Technical Report). Pure Appl. Chem. 2015, 87, 1051–1069. [Google Scholar] [CrossRef]
  56. Keren, Y.; Borisover, M.; Bukhanovsky, N. Chemosphere Sorption Interactions of Organic Compounds with Soils Affected by Agricultural Olive Mill Wastewater. Chemosphere 2015, 138, 462–468. [Google Scholar] [CrossRef]
  57. Qiu, W.; Zheng, Y. Arsenate Removal from Water by an Alumina-Modified Zeolite Recovered from Fly Ash. J. Hazard. Mater. 2007, 148, 721–726. [Google Scholar] [CrossRef]
  58. Pillewan, P.; Mukherjee, S.; Meher, A.K.; Rayalu, S.; Bansiwal, A. Removal of Arsenic (III) and Arsenic (V) Using Copper Exchange Zeolite-A. Environ. Prog. Sustain. Energy 2014, 33, 1274–1282. [Google Scholar] [CrossRef]
  59. Sanaei, L.; Tahmasebpour, M.; Khatamian, M.; Divband, B. Arsenic Removal from Aqueous Solutions Using Iron Oxide-Modified Zeolite: Experimental and Modeling Investigations. AUT J. Mech. Eng. 2021, 5, 141–152. [Google Scholar] [CrossRef]
  60. Salem Attia, T.M.; Hu, X.L.; Yin, D.Q. Synthesised Magnetic Nanoparticles Coated Zeolite (MNCZ) for the Removal of Arsenic (As) from Aqueous Solution. J. Exp. Nanosci. 2012, 9, 551–560. [Google Scholar] [CrossRef]
  61. Revellame, E.D.; Lord, D.; Sharp, W.; Hernandez, R.; Zappi, M.E. Adsorption Kinetic Modeling Using Pseudo- Fi Rst Order and Pseudo-Second Order Rate Laws: A Review. Clean. Eng. Technol. 2020, 1, 100032. [Google Scholar] [CrossRef]
  62. Tsvetanova, L.; Barbov, B.; Rusew, R. Equilibrium Isotherms and Kinetic Effects during the Adsorption of Pb (II) on Titanosilicates Compared with Natural Zeolite Clinoptilolite. Water 2022, 14, 2152. [Google Scholar] [CrossRef]
  63. Figueroa, D.; Moreno, A.; Hormaza, A. Equilibrium, Thermodynamic and Kinetic Models for the Adsorption of Red 40 onto Corn Cob. Ing. Univ. Medellín 2014, 14, 105–120. [Google Scholar] [CrossRef]
  64. Simonin, J. On the Comparison of Pseudo-First Order and Pseudo-Second Order Rate Laws in the Modeling of Adsorption Kinetics. Chem. Eng. J. 2016, 300, 254–263. [Google Scholar] [CrossRef]
  65. Mamun, O.; Winther, K.T.; Boes, J.R.; Bligaard, T. A Bayesian Framework for Adsorption Energy Prediction on Bimetallic Alloy Catalysts. NPJ Comput. Mater. 2020, 6, 177. [Google Scholar] [CrossRef]
  66. He, K.; Chen, Y.; Tang, Z.; Hu, Y. Removal of Heavy Metal Ions from Aqueous Solution by Zeolite Synthesized from Fly Ash. Environ. Sci. Pollut. Res. 2015, 23, 2778–2788. [Google Scholar] [CrossRef]
  67. Zhang, Y.; Li, Y.; Wang, M.; Chen, B.; Sun, Y.; Chen, K.; Du, Q. Adsorption Capacity of Tetracycline in Solution by Cu-BTC@Carboxyl-Functionalized Carbon Nanotubes@Copper Alginate Composite Aerogel Beads. Coat. Artic. 2022, 12, 1298. [Google Scholar] [CrossRef]
  68. Joseph, I.V.; Tosheva, L.; Doyle, A.M. Simultaneous Removal of Cd (II), Co (II), Cu (II), Pb (II), and Zn (II) Ions from Aqueous Solutions via Adsorption on FAU-Type Zeolites Prepared from Coal Fl y Ash. J. Environ. Chem. Eng. 2020, 8, 103895. [Google Scholar] [CrossRef]
  69. Zamzow, M.J.; Eichbaum, B.R.; Sandgren, K.R.; Shanks, D.E. Removal of Heavy Metals and Other Cations from Wastewater Using Zeolites. Sep. Sci. Technol. 1990, 25, 1555–1569. [Google Scholar] [CrossRef]
  70. Belova, T.P. Heliyon Adsorption of Heavy Metal Ions (Cu2+, Ni2+, Co2+ and Fe2+) from Aqueous Solutions by Natural Zeolite. Heliyon 2019, 5, e02320. [Google Scholar] [CrossRef]
  71. Senila, M.; Neag, E.; Cadar, O.; Kovacs, E.D.; Aschilean, I.; Kovacs, M.H. Simultaneous Removal of Heavy Metals (Cu, Cd, Cr, Ni, Zn and Pb) from Aqueous Solutions Using Thermally Treated Romanian Zeolitic Volcanic Tuff. Molecules 2022, 27, 3938. [Google Scholar] [CrossRef] [PubMed]
  72. Hong, M.; Yu, L.; Wang, Y.; Zhang, J.; Chen, Z.; Dong, L.; Zan, Q.; Li, R. Heavy Metal Adsorption with Zeolites: The Role of Hierarchical Pore Architecture. Chem. Eng. J. 2019, 359, 363–372. [Google Scholar] [CrossRef]
  73. Yuna, Z. Review of the Natural, Modified, and Synthetic Zeolites for Heavy Metals Removal from Wastewater. Environ. Eng. Sci. 2016, 33, 443–454. [Google Scholar] [CrossRef]
  74. Yousefi, T.; Mohsen, M.A.; Mahmudian, H.R.; Torab-mostaedi, M.; Moosavian, M.A.; Aghayan, H. Removal of Pb(II) by Modified Natural Adsorbent; Thermodynamics and Kinetics Studies. J. Water Environ. Nanotechnol. 2018, 3, 265–272. [Google Scholar] [CrossRef]
  75. Irannajad, M.; Haghighi, H.K. Removal of Heavy Metals from Polluted Solutions by Zeolitic Adsorbents: A Review. Environ. Process. 2021, 8, 7–35. [Google Scholar] [CrossRef]
  76. Jha, V.K.; Matsuda, M.; Miyake, M. Sorption Properties of the Activated Carbon-Zeolite Composite Prepared from Coal Fly Ash for Ni2+, Cu2+, Cd2+ and Pb2+. J. Hazard. Mater. 2008, 160, 148–153. [Google Scholar] [CrossRef]
  77. Priyadi; Iskandar; Suwardi; Mukti, R.R. Characteristics of Heavy Metals Adsorption Cu, Pb and Cd Using Synthetics Zeolite Zsm-5. J. Tanah Trop. Kualitas Lingkung. 2015, 20, 77–83. [Google Scholar] [CrossRef]
  78. Xing, P.; Wang, C.; Ma, B.; Chen, Y. Removal of Pb (II) from Aqueous Solution Using a New Zeolite-Type Absorbent: Potassium Ore Leaching Residue. J. Environ. Chem. Eng. 2018, 6, 7138–7143. [Google Scholar] [CrossRef]
  79. Yang, W.; Wang, Y.; Wang, Q.; Wu, J.; Duan, G.; Xu, W.; Jian, S. Magnetically separable and recyclable Fe3O4@ PDA covalent grafted by l-cysteine core-shell nanoparticles toward efficient removal of Pb2+. Vacuum 2021, 189, 110229. [Google Scholar] [CrossRef]
  80. Shevade, S.; Ford, R.G. Use of Synthetic Zeolites for Arsenate Removal from Pollutant Water. Water Res. 2004, 38, 3197–3204. [Google Scholar] [CrossRef] [PubMed]
  81. Cheng, T.H.; Sankaran, R.; Show, P.L.; Ooi, C.W.; Liu, B.L.; Chai, W.S.; Chang, Y.K. Removal of Protein Wastes by Cylinder-Shaped NaY Zeolite Adsorbents Decorated with Heavy Metal Wastes. Int. J. Biol. Macromol. 2021, 185, 761–772. [Google Scholar] [CrossRef] [PubMed]
Figure 1. Rietveld refinement performed to commercial zeolite type 5A (a), synthesized zeolite 11Z5A before (b) and after the As(V) removal (c) samples using the Fullprof Suite software. Experimental diffractogram, red lines (Iobs), calculated diffractogram, black lines (Ical), and the residual lines (Iobs − Ical) are shown in blue, and the Bragg’s reflection positions are given in green lines.
Water 15 01892 g001
Figure 2. XPS spectra of sample 11Z5A, showing the deconvoluted peaks of (a) Al 2p, (b) Si 2p, (c) Na 1s, (d) Ca 2p, and (e) O 1s. Red lines represent experimental data, blue line the fit curve, and black lines represent the fit components.
Water 15 01892 g002
Figure 3. XPS spectra of the sample 11Z5A-As, showing the deconvoluted peaks of (a) Al 2p, (b) Si 2p, (c) As 3p, and (d) O 1s. Red lines represent experimental data, blue line the fit curve, and black lines represent the fit components.
Water 15 01892 g003
Figure 4. (a) 10 µm SEM image of 11Z5A sample, (b) EDS mapping image of 11Z5A, (ce) Elemental EDS mapping for O, Si, and Al, (f) 5 µm SEM image of 11Z5A sample, (g) EDS mapping image of 11Z5A, (hj) Elemental EDS mapping for O, Si, and Al, (k) 10 µm SEM image for 11Z5A after As(V) adsorption, (l) EDS mapping image of 11Z5A, (mp) Elemental EDS mapping for O, Si, and Al, and (q) 5 µm SEM image of 11Z5A sample As(V) adsorption, (r) EDS mapping image of 11Z5A, (sv) Elemental EDS mapping for O, Si, and Al.
Water 15 01892 g004aWater 15 01892 g004b
Figure 5. XPS spectra of sample 18PZ5A, showing the deconvoluted peaks of (a) Al 2p, (b) Si 2p, (c) Na 1s, and (d) O 1s. Red lines represent experimental data, blue line the fit curve, and black lines represent the fit components.
Water 15 01892 g005
Figure 6. XPS spectra of the sample 18PZ5A-Pb, showing the deconvoluted peaks of (a) Al 2p, (b) Si 2p, (c) Pb 4f, (d) O 1s, and (e) F 1s. Red lines represent experimental data, blue line the fit curve, and black lines represent the fit components.
Water 15 01892 g006aWater 15 01892 g006b
Figure 7. (a) 10 µm SEM image of 18PZ5A sample, (b) EDS mapping image of 18PZ5A, (ce) Elemental EDS mapping for O, Si, and Al, (f) 5 µm SEM image of 18PZ5A sample, (g) EDS mapping image of 18PZ5A, (hj) Elemental EDS mapping for O, Si, and Al, (k) 10 µm SEM image for 18PZ5A after Pb(II) adsorption, (l) EDS mapping image of 18PZ5A, (mp) Elemental EDS mapping for O, Si, and Al, (q) 5 µm SEM image of 18PZ5A sample Pb(II) adsorption, (r) EDS mapping image of 18PZ5A, (sv) Elemental EDS mapping for O, Si, and Al.
Water 15 01892 g007
Figure 8. (a) Removal of As(V) from drinking water with 11Z5A as a function of contact time at pH = 6.5, adsorbent dose = 2 g L−1 and C0 = 23.083 mg L−1. (b) Non-linear fitting of As(V) adsorption kinetic models with 11Z5A. (c) Effect of pH on the percentage removal of As(V) using 11Z5A at 9 h and adsorbent dose = 2 g L−1. (d) Adsorbent dose dependence on As(V) removal and adsorption amount. Co = 23.083 mg L−1.
Water 15 01892 g008
Figure 9. Adsorption isotherms of As(V) on 11Z5A. Adsorbent dose of 1 g L−1, pH 5.5 and time of 9 h. Co = 23.083 mg L−1 As(V).
Water 15 01892 g009
Figure 10. (a) Adsorption of As(V) at different adsorbent doses, pH = 6.5, and contact time 18 h. (b) Experimental design at different pH and contact times. C0 = 0.058 mg L−1 As(V). See Table S6 for D01-09 conditions.
Water 15 01892 g010
Figure 11. (a) Removal of Pb(II) and (b) adsorbed amount from irrigation water with 18PZ5A as a function of contact time at pH = 5.5, adsorbent dose = 1 g L−1, and C0 = 56.35 mg L−1 Pb(II).
Water 15 01892 g011
Figure 12. Effect of pH on the percentage of Pb(II) removal at 12 h and adsorbent dose = 1 g L−1 with 18PZ5A in irrigation water, Pb(II) = 56.35 mg L−1.
Water 15 01892 g012
Figure 13. Adsorption isotherms of Pb(II) on 18PZ5A. Adsorbent dose of 1 g L−1, pH 5.5, and a time of 12 h. Co = 56.35 mg L−1 Pb(II).
Water 15 01892 g013
Scheme 1. Adsorption mechanism for As(V) (left) and Pb(II) (right) using zeolite 11Z5A and zeolite 18PZ5A.
Water 15 01892 sch001
Table 1. Rietveld refinement parameters of commercial and synthesized zeolite 5A before and after As(V) adsorption.
Refinement ParametersZ5A
Commercial
11Z5A
Before the Adsorption
11Z5A
After the Adsorption
a (Å)24.6050 (3)24.5883 (3)24.5002 (2)
b (Å)24.6050 (3)24.5883 (3)24.5002 (2)
c (Å)24.6050 (3)24.5883 (3)24.5002 (2)
α (°)909090
β (°)909090
γ (°)909090
V3)14896.05 (3)14865.68 (4)14706.39 (2)
Average max strain6.42 (8)9.98 (2)10.91 (3)
Average size (nm)163.79 (8)99.21 (9)99.76 (2)
R e x p   % 15.357.437.40
R p   % 27.58.5319.1
R w p   % 2711.316.5
χ23.102.314.99
Notes: Parameters refined using the Fullprof Suite program: Cell parameters, cell volume, Cagliotti parameters, and statistical parameters: the factors R p   % , R w p   % , and goodness of fit χ2.
Table 2. XPS results of the fit performed on Zeolites 5A samples.
SampleLevelBE (eV)at.%Bond TypeReference
11Z5AO 1s529.65.1O-Metal[42,43]
O 1s531.933.2OH-Metal[41,44]
O 1s533.312.4OH-Organic[45]
O 1s538.13.8O=C=O[46]
Al 2p74.715.9Al-O-Si[41]
Ca 2p3/2347.21.5M-Ca-O[43]
Si 2p3/2102.721.7Si-O[41]
Si 2p3/2100.23.2Si-O[41]
Na 1s1073.43.2M-Na-O[47]
11Z5A-AsO 1s529.33.5O-Metal[42,43]
O 1s531.118.9OH-Metal[44]
O 1s532.231.4M-O-Si[41]
Al 2p74.422.6Al-O-Si[41]
Si 2p3/299.97.1Si-O[41]
Si 2p3/2101.913.4Si-O[41]
As 3p3/2143.93.1As(V)[48]
18PZ5AO 1s530.937.7O-Metal[41]
O 1s532.510.8M-O-Si[41]
O 1s537.04.2O=C=O[46]
Al 2p73.617.8Al-O[41]
Si 2p3/299.75.6Si-O[41]
Si 2p3/2101.419.7Si-O[41]
Na 1s1072.24.3M-Na-O[41]
18PZ5A-PbO 1s532.153.7M-O-Si[41]
Al 2p74.920.9Al-O-Si[41]
Si 2p3/2100.67.5Si-O[41]
Si 2p3/2102.313.1Si-O[41]
F 1s685.21.0F-M[43]
F 1s689.33.1F-Organic[45]
Pb 4f7/2139.70.7Pb(II)[43,49]
Table 3. Parameters of As(V) adsorption kinetic models with 11Z5A obtained by nonlinear fits.
PFO ModelPSO ModelE ModelIDM
qe (mg g−1)10.670 (2)qe (mg g−1)10.935(2)β (g mg−1)2.528 (6)kp (mg g−1 h−0.5)1.129 (5)
k1 (h−1)3.196 (1)k2 (g mg−1 h−1)0.7779 (4)α (mg h−1)2.627 × 10¹⁰(2)C1 (mg g−1)6.525 (2)
R20.9709R20.9801R20.9896R20.324
RSS2.76462.76460.985564.2019
BIC−8.2516−12.0385−18.566523.1997
Table 4. Parameters obtained from nonlinear fitting of Freundlich, Langmuir, Redlich–Peterson, Sips, and Temkin models to experimental data of As(V) adsorption on 11Z5A.
FreundlichLangmuirRedlich–Peterson
kF ((mg g−1)/(mg L−1)1/n)23.5937 (2)qmax (mg g−1)36.3525 (2)A (L g−1)175.3144 (4)
1/n0.1356 (3)kL (L mg−1)6.1698 (1)B (L mg−1)4.0396 (1)
n7.14 (2)R20.81β1.0656 (6)
R20.55 R20.81
RSS920.1496.4460.2
BIC70.3860.5062.06
SipsTemkin
qms (mg g−1)35.7619 (2)KT (L g−1)604.2939 (7)
ks (L mg−1)ms11.7959 (1)bT (J mol−1)638.089 (1)
ms1.3342 (5)R20.69
R20.79
RSS479.1777.1
BIC62.767.67
Table 6. Kinetic model parameters of Pb(II) adsorption with 18PZ5A.
PFO ModelPSO ModelE ModelIDM
qe (mg g−1)48.991 (4)qe (mg g−1)50.7794 (6)β (g mg−1)2.0203 (2)kp (mg g−1 h−0.5)11.2344 (8)
k1 (h−1)1.2188 (3)k2 (g mg−1 h−1)0.04813 (8)α (mg h−1)2.045 × 1041 (3)C1 (mg g−1)2.7044 × 10⁻⁸ (4)
R20.99R20.94R20.99R20.95
RSS536.0106536.0106157.61334160.0438
BIC44.420943.509832.180864.9121
Table 7. Parameters obtained from fitting Freundlich, Langmuir, Sips, and Temkin adsorption models to the experimental data of Pb(II) adsorption with 18PZ5A.
FreundlichLangmuirSipsTemkin
kF ((mg g−1)/(mg L−1)1/n)35.8754 (2)qmax (mg g−1)46.6739 (6)qms (mg g−1)59.1141 (3)KT (L g−1)170.4298 (1)
1/n0.2959 (5)kL (L mg−1)6.4304 (3)ks (L mg−1)ms1.9252 (3)bT (J mol−1)339.626 (6)
n3.45 (6)R20.69ms0.6421 (4)R20.69
R20.75 R20.73
RSS688.391048.69819.04832.37
BIC56.7362.261.5659.20
Disclaimer/Publisher’s Note: The statements, opinions and data contained in all publications are solely those of the individual author(s) and contributor(s) and not of MDPI and/or the editor(s). MDPI and/or the editor(s) disclaim responsibility for any injury to people or property resulting from any ideas, methods, instructions or products referred to in the content.

