


Using Stormwater in a Sponge City as a New Wing of Urban Water Supply—A Case Study

1
Institute of Sanitary Engineering and Waste Management, Leibniz University Hannover, 30167 Hannover, Germany
2
Institut für Geosysteme und Bioindikation, Technische Universität Braunschweig, 38106 Braunschweig, Germany
*
Author to whom correspondence should be addressed.
Water 2023, 15(10), 1893; https://doi.org/10.3390/w15101893
Submission received: 31 March 2023
/
Revised: 26 April 2023
/
Accepted: 11 May 2023
/
Published: 17 May 2023
(This article belongs to the Special Issue Rainwater Harvesting and Treatment)
Abstract
:Rapid and even disruptive innovations are needed to make cities fit for the future. The particular challenge will be to transform existing urban spaces in order to increase climate resilience. Along these lines, rainwater harvesting has taken place insufficiently to date, even when Sponge City concepts are implemented. Thus, the concept presented here addresses existing urban neighborhoods and proposes to collect rainwater from nearby rooftops and treat it in decentral treatment units called “City Water Hubs” (CWH) equipped with modular coupled low-energy technologies to produce various customized “City Water” qualities, and store it until it can be used or distributed. A feasibility study with a focus on the campus area at the main building of the Leibniz University of Hannover, the determined rainwater qualities, and the results from investigations with two laboratory test plants provided the basis for the technical design of the pursued concept. The feasibility study showed how sufficient rainwater for irrigation purposes can be made available for the listed large university park even under extreme dry and heat wave conditions. If large portions of the roof area (11,737 m2) of the university’s main building were activated, even in a dry year with only 49.8% of the average precipitation, only 19.8% of the harvested stormwater would be needed for irrigation. The rainwater samples showed TSS concentrations of up to 7.54 mg/L, COD of up to 58.5 mg/L, and NH4 of up to 2.21 mg/L, which was in line with data reported in the literature. The treatment technologies used for the two pilot plants are proven approaches for stormwater treatment and were composed as follows: (1) gravity-driven membrane filtration (GDM) and (2) slow sand filter with integrated activated carbon (AC) layer. The treatment with both (1) and (2) clearly improved the rainwater quality. The GDM reduced turbidity by 90.4% and the Sand/AC filter by 20.4%. With regard to COD, the studies for GDM did not show a clear elimination trend; the Sand/AC filter reduced the COD by 77%. Taken together, decentralized low-energy rainwater treatment can reliably provide quality-assured City Water for any specific use. Regarding the treatment design, GDM is preferable and can be better operated with downstream UV disinfection, which might be needed to reduce the pathogenic load, e.g., for local heat control measures. The research steps presented here will pioneer the development of a city-wide rainwater harvesting infrastructure on the way of establishing stormwater as a resource for a new wing of urban water supply. The presented findings will now result in the implementation of a full-scale CHW on the campus to ensure long-term irrigation of the listed park, relieving the public drinking water supply.
1. Introduction
The dramatic Europe-wide drought in 2022 showed that the extreme effects of climate change are occurring faster and sometimes even more drastically than expected. Thus, we will have to adapt to the changing climatic conditions much more quickly than was recently thought. With regard to cities, it is becoming apparent that advancing climate change is increasingly compromising the quality of urban life in general, but also the established quality of urban water management services in particular. This applies to both developed and developing countries [1].
Urban areas are particularly vulnerable in view of the two climatic extremes: flooding and drought/heat waves [2]. Cities will therefore have to change their (sur-)face in order to achieve the necessary resilience to compensate for climatic changes and to ensure livable conditions for their dwellers. To this end, a far-reaching turn away from previous premises in urban planning and design is highly needed. In practice, this means a shift towards unsealed, water-storing, multifunctional, and multi-material structures, including the provision of a lot of urban and building greenery as well as urban water bodies [3]. All of these required blue-green spaces, elements, and associated infrastructures can be brought together in the “Sponge City” concept that is underway and becoming a globally recognized model of future-oriented urban development; refer to References [4,5,6,7,8,9]. The Sponge City is not only a contribution to flood prevention, but explicitly serves to balance the two extreme conditions of too much and too little water in the city [6]. At the same time, many other positive effects are attributed to the Sponge City, including the possibility of urban cooling, particularly to mitigate the Urban Heat Island effect [10].
However, there are many challenges to overcome on the path to implementing a Sponge City. The central hypothesis of this paper is that the Sponge City is described in a conceptually and functionally comprehensive way, but its implementation is hindered by a lack of transformation paths for existing cities and urban neighborhoods developed over a long period of time. In particular, there is a lack of concepts and management approaches on how, in the context of an evolving porous surface and subsurface design in the city,
- (1)
- all elementary features of a Sponge City, such as consistent rainwater harvesting solutions, can actually be implemented;
- (2)
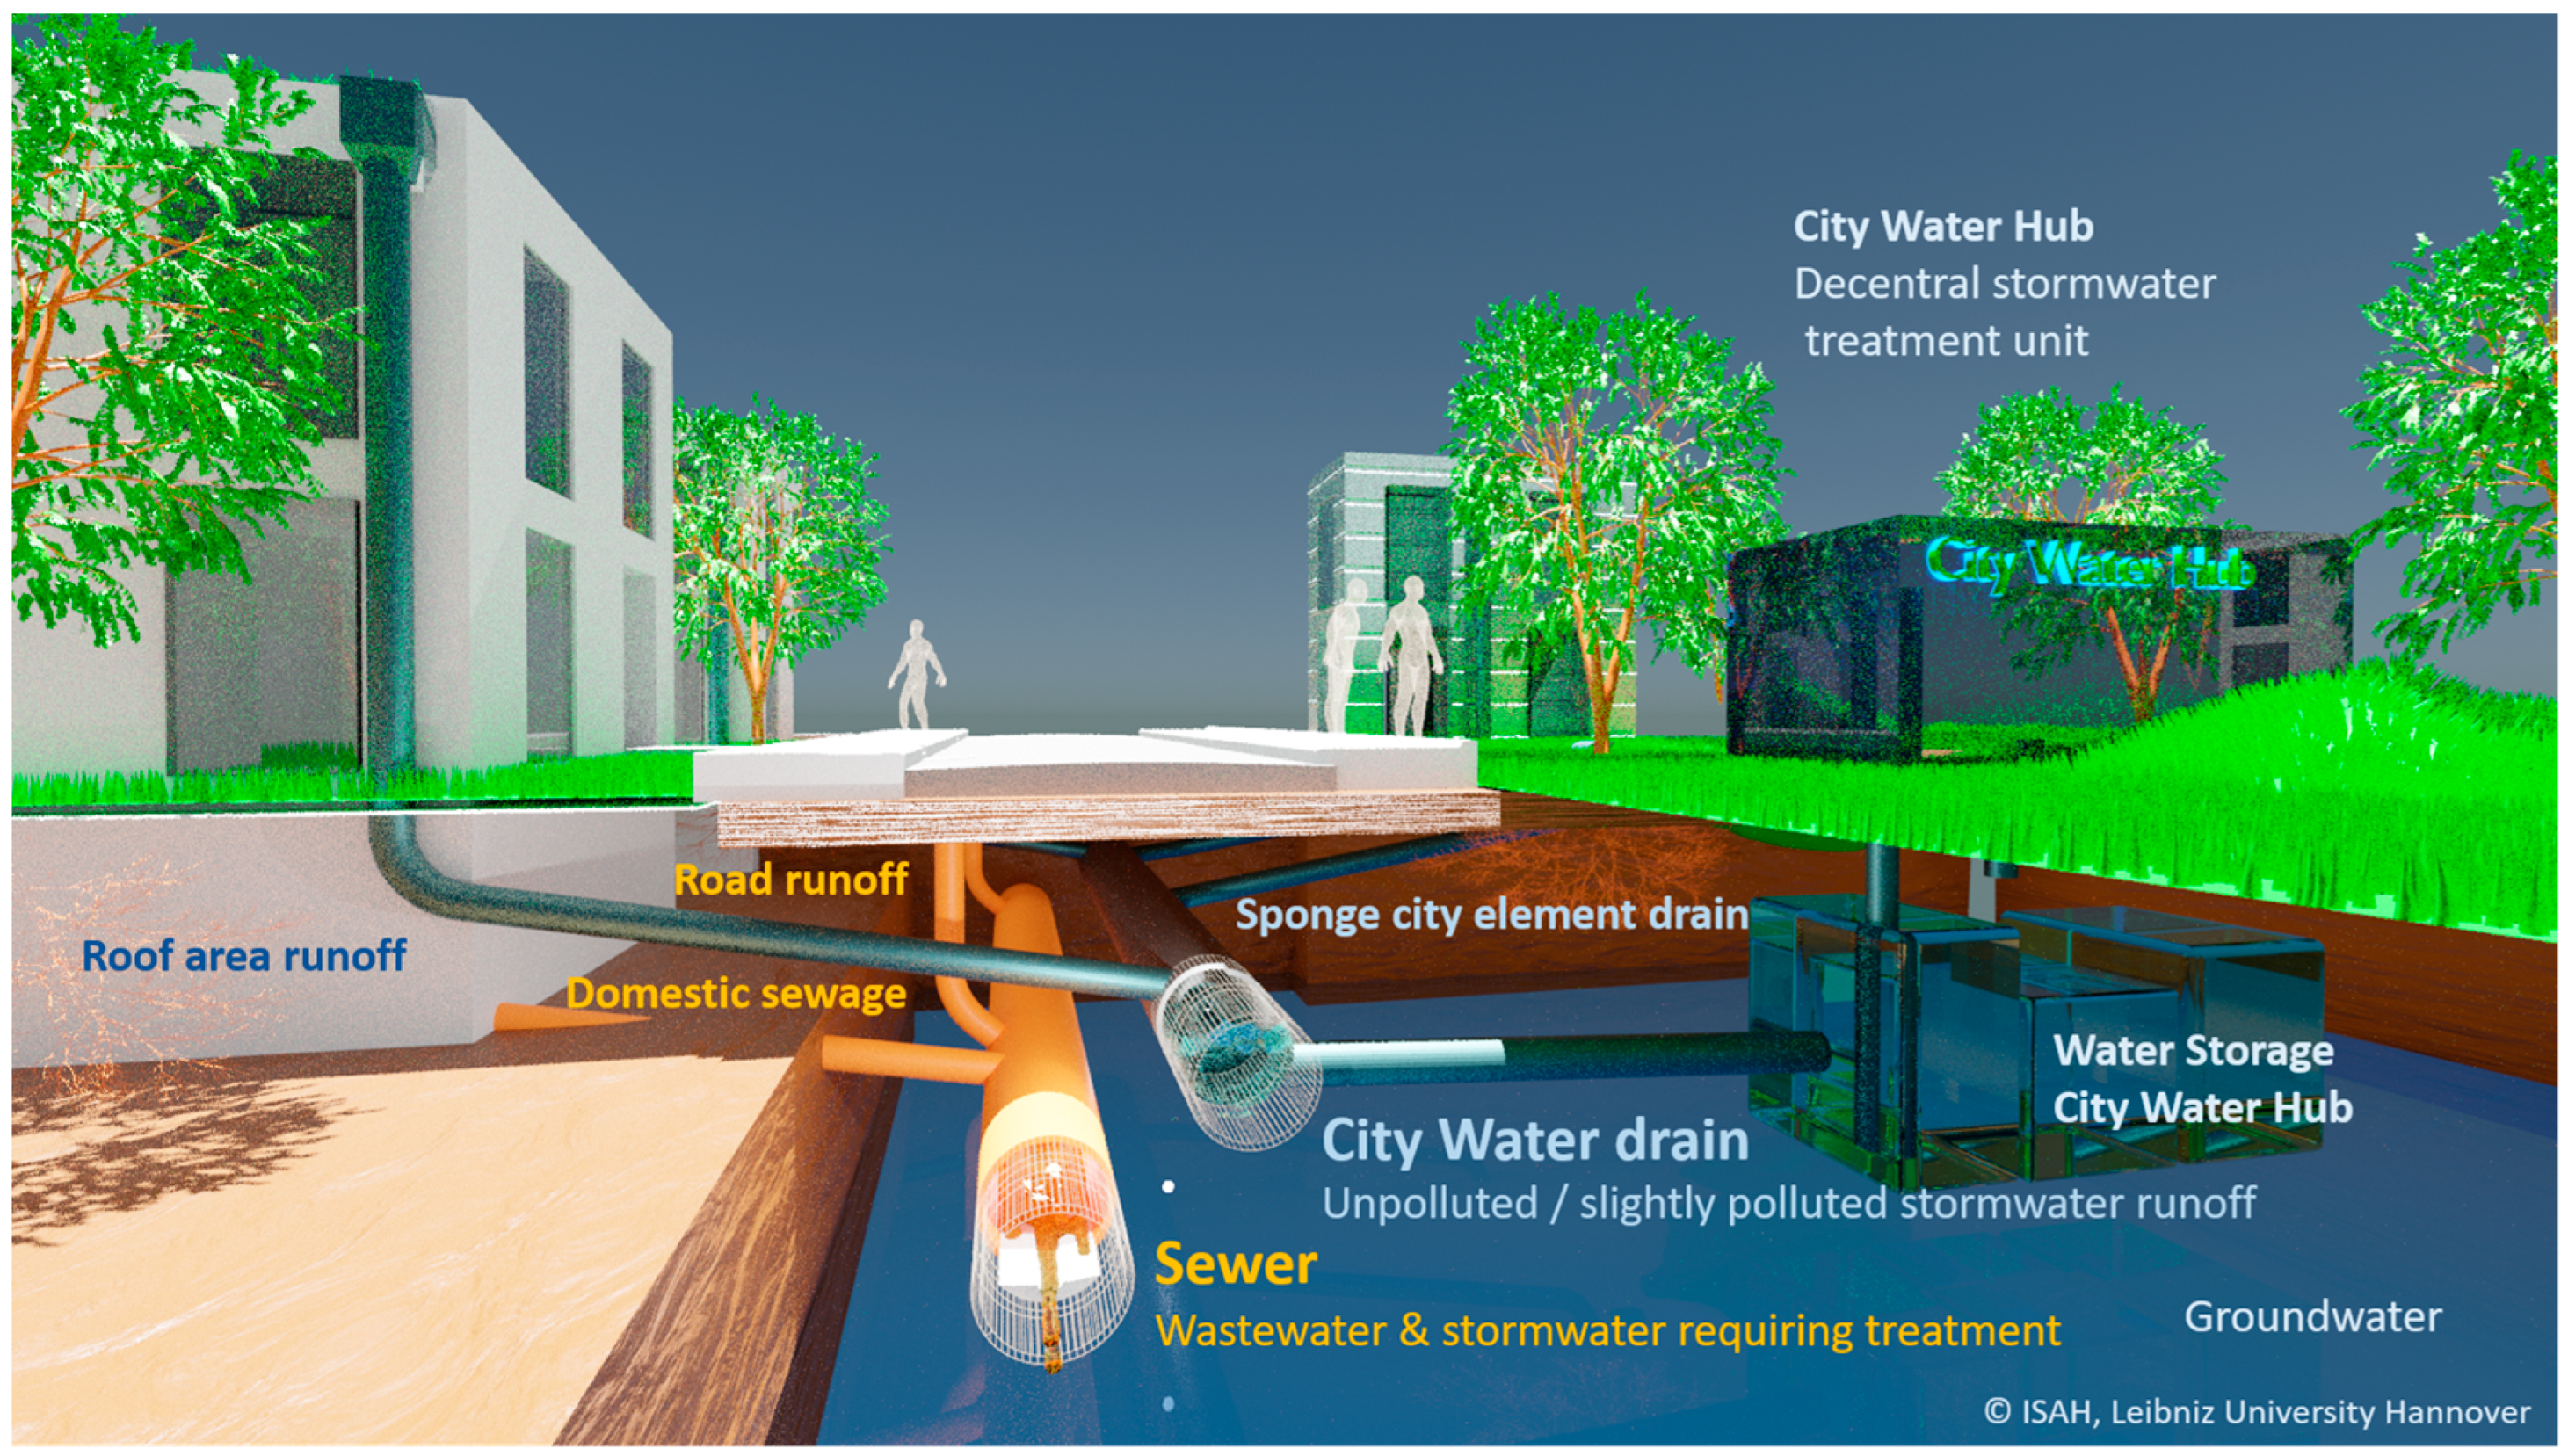
In addition, there are further problems, such as a lack of sustainable investment models and an unclear public perception of the Sponge City, as reported by the Chinese Sponge City program [13]. All of this leads to the question of how to proceed. How can an existing city with its (water management) infrastructures that have grown over decades, if not centuries, be transformed into a sponge city that permanently and reliably fulfills the functions (flood control, stormwater storage and use, and improvement in water qualities) attributed to it? The focus pursued here is how to safely incorporate stormwater into the municipal water supply to relieve pressure on the potable water supply. The innovation presented here provides a new approach to transforming urban drainage. The “City Water” concept is featured, which has emerged from many years of research and development work in numerous national and international Sponge City projects. An innovative starting point is splitting the rainwater collection into polluted and unpolluted stormwater and using a modular approach downstream to decentralized rainwater treatment in “City Water Hubs” in order to produce water qualities geared to different needs. The approach of making rainwater available locally, even with upstream treatment, is not new—refer to References [14,15,16]—but the context in which this treatment takes place is completely new. In concrete terms, polluted rainwater, e.g., from traffic areas, is discharged together with wastewater and is treated downstream at central wastewater treatment plants. In contrast, unpolluted or only slightly polluted stormwater is collected locally, stored, eventually treated, and made available for various uses, as shown in Figure 1. The considerable potential of unpolluted or only slightly polluted stormwater has already been demonstrated in the first case studies [17]. The stormwater treatment should ensure water quality, which makes the rainwater suitable to be used without problems. The produced City Water thus can be used wherever drinking water quality is not required, such as for the irrigation of green spaces, gardens, allotment colonies, facade and roof planting, and also urban food production. UV-disinfected water can also be used for fountains and for misting and cooling streetscapes.
The main target of the presented work is to show by means of a case study how an implementation of the City Water concept can succeed locally and in existing structures, introducing and establishing the Sponge City gradually. Specifically, for the large Welfengarten park, which is part of the Leibniz University campus in Hanover, Germany, it was investigated how City Water can be produced and provided locally, especially for the purpose of irrigation but also for groundwater recharge and water tap station. In a nutshell, the “Campus Water Hub” is the first step for constituting a new wing for urban water supply.
2. Materials and Methods
The authors followed a three-step approach: (1) feasibility study, (2) technical investigations for stormwater treatment, and (3) concrete considerations for upscaling and implementation. The feasibility study served to identify which roof areas of the main building of Leibniz University need to be activated for the collection of uncontaminated rainwater in order to achieve different management goals in the Welfengarten park area. The second step was to investigate appropriate treatment technologies that could be used in a City Water Hub. The findings from steps 1 and 2 subsequently allowed statements to be made about upscaling and the intended large-scale implementation.
2.1. Feasibility Study
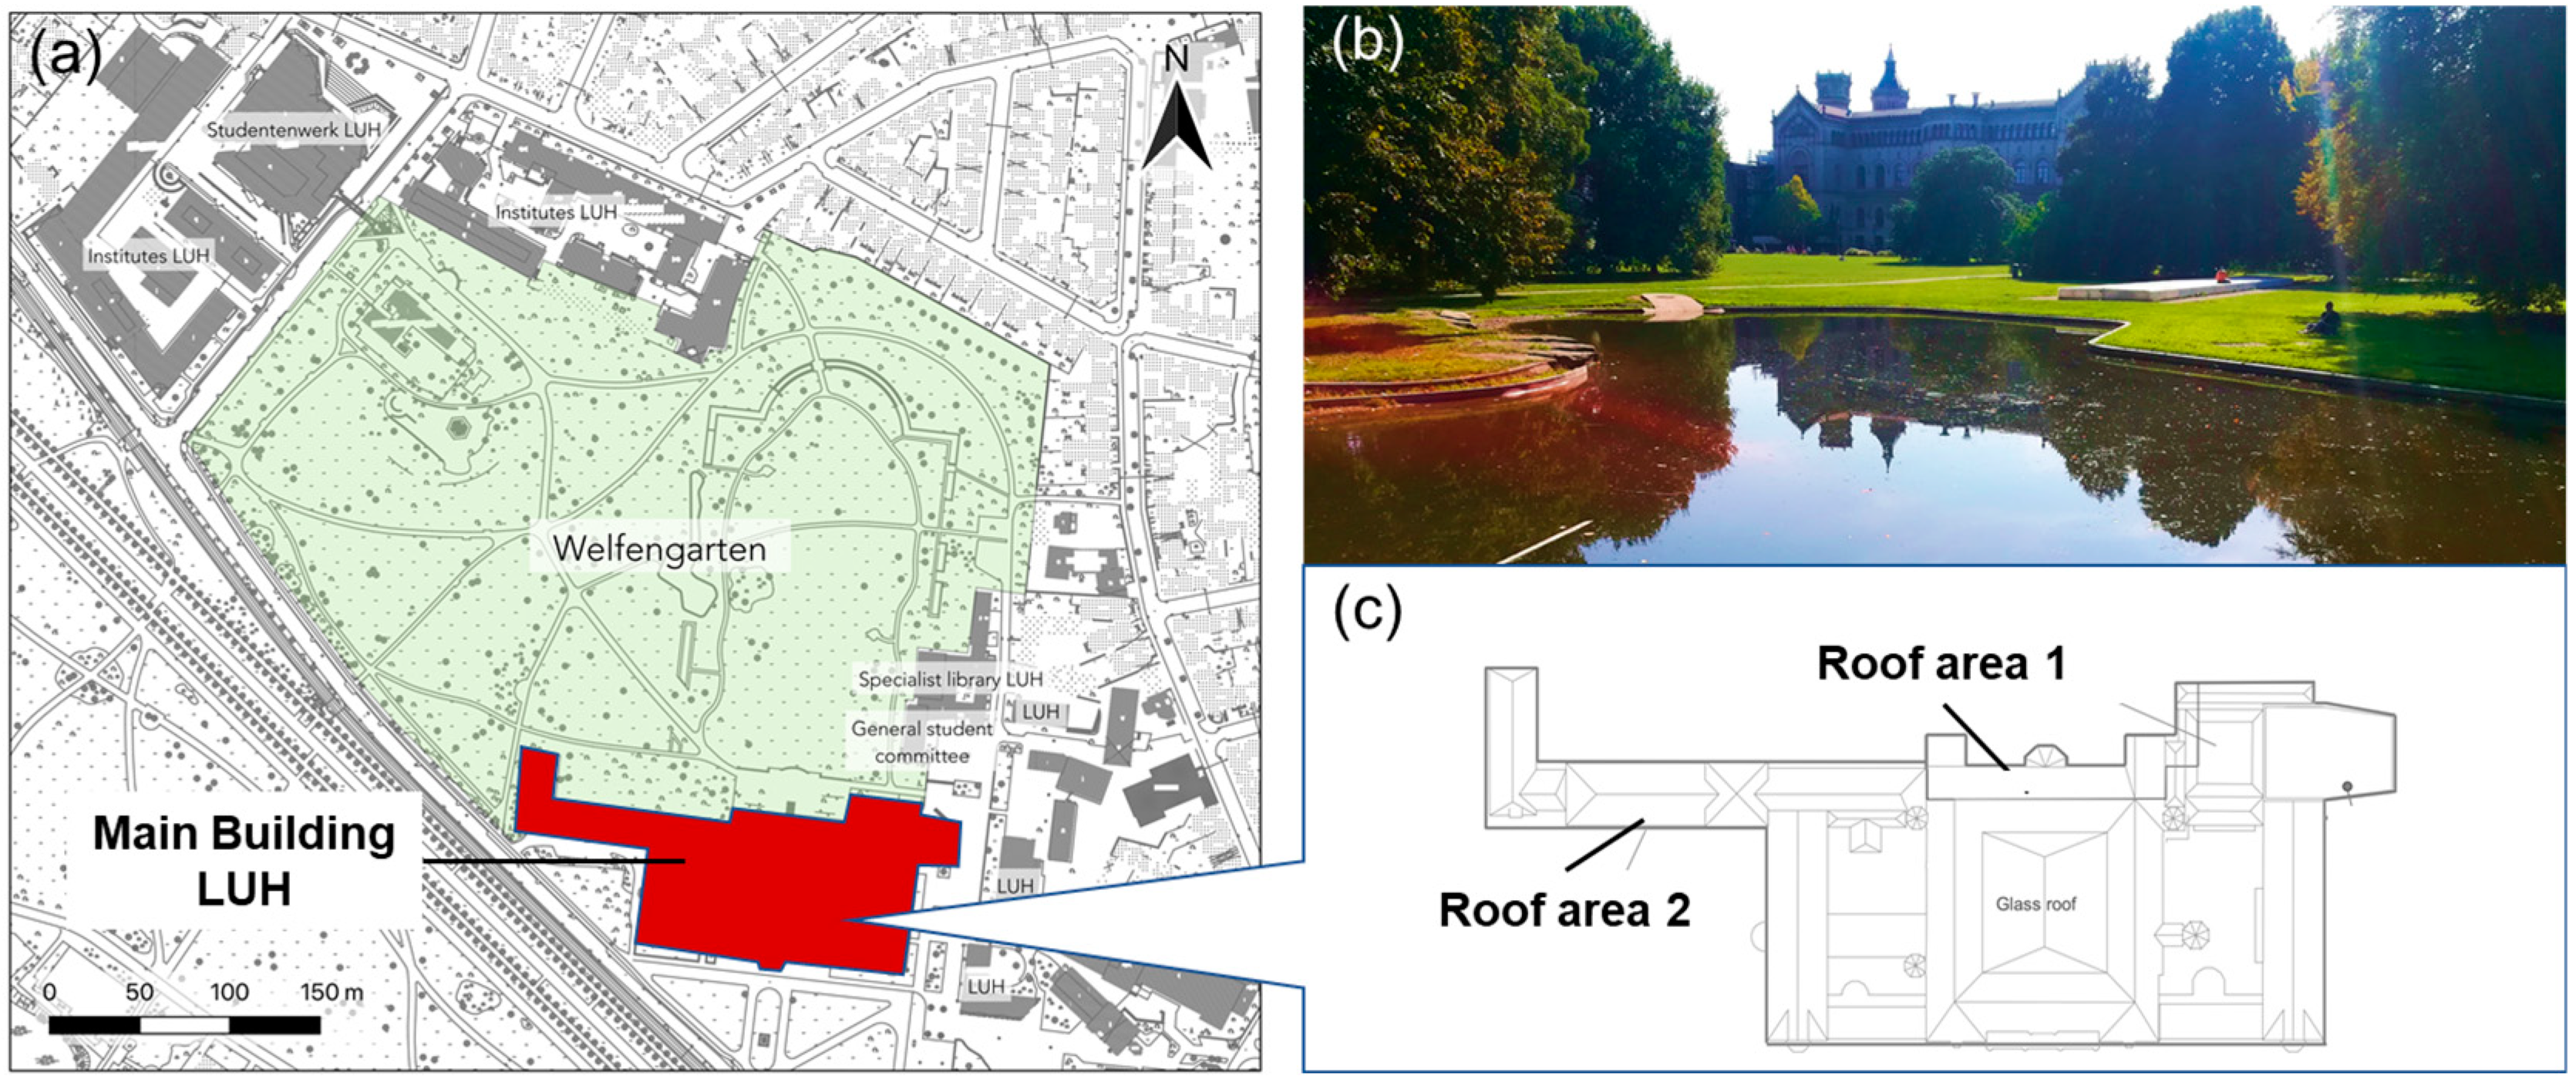
Hanover, with an average precipitation of 661.7 mm/a [18], is located in Germany. In the previous summers, longer periods without rain and higher temperatures confronted the city with new challenges. This affected the Gottfried Wilhelm Leibniz University of Hanover (LUH), located in the northern part of the city, as well. Thus, new ways to face these challenges have to be taken. To improve the sustainability of the LUH is to replace drinking water used for the irrigation of the landmarked university park Welfengarten (approx. 120,000 m2) with stormwater. The feasibility study served to provide and examine a new local stormwater management concept and consider the implementation of a Campus Water Hub as a decentral treatment unit. The first subject of the investigation was identifying possible sources of rainwater and quantifying the amount of water that can be harvested. Due to the low level of pollution compared to other surfaces, roof surfaces are particularly suitable for collecting rainwater [19,20,21]. For this reason, the roof of the main LUH building was chosen as harvesting area. It is suitable due to its size, the central location, and the low-pollutant roofing material (felt) [22]. Its total roof area covers 11,737 m2 (RA2), of which an area of 1053 m2 (RA1) drains directly into an artificial pond with an estimated volume of 360 m3 in the west of the park. The remaining area of 10,684 m2 is connected to the sewage system. An overview of the park, adjacent buildings, and the roof is provided in Figure 2.
The second task was quantifying the actual irrigation needs so that the necessary volume for stormwater storage could be determined. Trees species in the park are beeches, oaks, chestnuts, maples, ashes, and plane trees. At the moment, irrigation takes place every 14 days in the period of April to September. An irrigation phase is defined as time between the irrigations. To specify the stormwater amount, daily data of precipitation depths, daily average temperature, and sunshine hours in the period from 1 January 1952 to 31 December 2021 were used from the weather station of the Institute for Meteorology and Climatology of the LUH, located 1.3 km from the Welfengarten [23]. The driest and wettest year in the period from 1952 to 2022 were examined. The minimum necessary storage capacity in relation to the required irrigation quantity and the prevailing precipitation was determined via a sequence algorithm. Losses due to wetting, swale, infiltration, and evaporation were assumed in the form of the mean runoff coefficient ψm of 0.9 according to DWA M153 [24]. During the irrigation phase, an increase in soil moisture due to precipitation and a correspondingly lower irrigation requirement was considered by reducing the irrigation requirement by the infiltration share of precipitation [25,26]. Dry periods were defined as a period of three days without precipitation, with a sunshine duration of 10 h, and a mean daily temperature of at least 20 °C. If there is a dry period, an increase in the irrigation volume of 1/3 was assumed on the following irrigation date. In terms of time, an analyzed scenario always included an irrigation phase (April to September of Year X) and the preceding non-irrigation phase (September to April Year X-1). Furthermore, the scenarios differentiated between two possible catchment areas: the entire roof area of the main building (RA2) and the smaller roof area (RA1).
2.2. Rainwater Collection
Rainwater was collected from three different catchment areas. Collection area 1 (CA1) and collection area 2 (CA2) are part of the roof of the main building of the university and are located in the inner courtyard of the building. Both roofs consist of bituminous roofing felt. The age of the roofing material is unknown and estimated by those responsible for building maintenance to be 20–30 years old. CA1 is steeper, with an angle of about 30° and around 56 m2 large; CA2 is a flat roof and around 43 m2 large. The main building is located in the inner part of the city at a distance of about 100 m from a frequently used road. The surface area of a steel container serves as third collection area (CA3) with a size of 65 m2. It is approximately 4 km away from the main building, close to a highway and a high-speed railway. The roof was swept, washed, and maintained before the start of the collection of water.
For the collection, rain thieves are installed in the existing downpipes. Subsequently, a typical, commercially available rainwater tank used in residential buildings made out of polypropylene with a volume of 300 L serves as storage. Before entering the storage facility, the water flows through a screen (slot size about 1 mm) which retains coarse impurities. The stored rainwater is analyzed regularly to determine the quality of the collected water. pH, T, and the electrical conductivity (EC) are measured with the multiparameter measuring device MULTI 3630 IDS of WTW®. Turbidity is analyzed with 2100P ISO Turbidimeter®, TSS, according to DIN 38409-2. Therefore, filters with a mesh width of 45 µm were used. The COD of each sample was determined with LCK cuvette test of Hach-Lange. Other parameters (NO3−, PO43−, NH4) were determined with ion chromatography for CA1 and CA2, while these parameters for CA3 were measured by cuvette testing.
2.3. Investigations with Two Pilot Plants
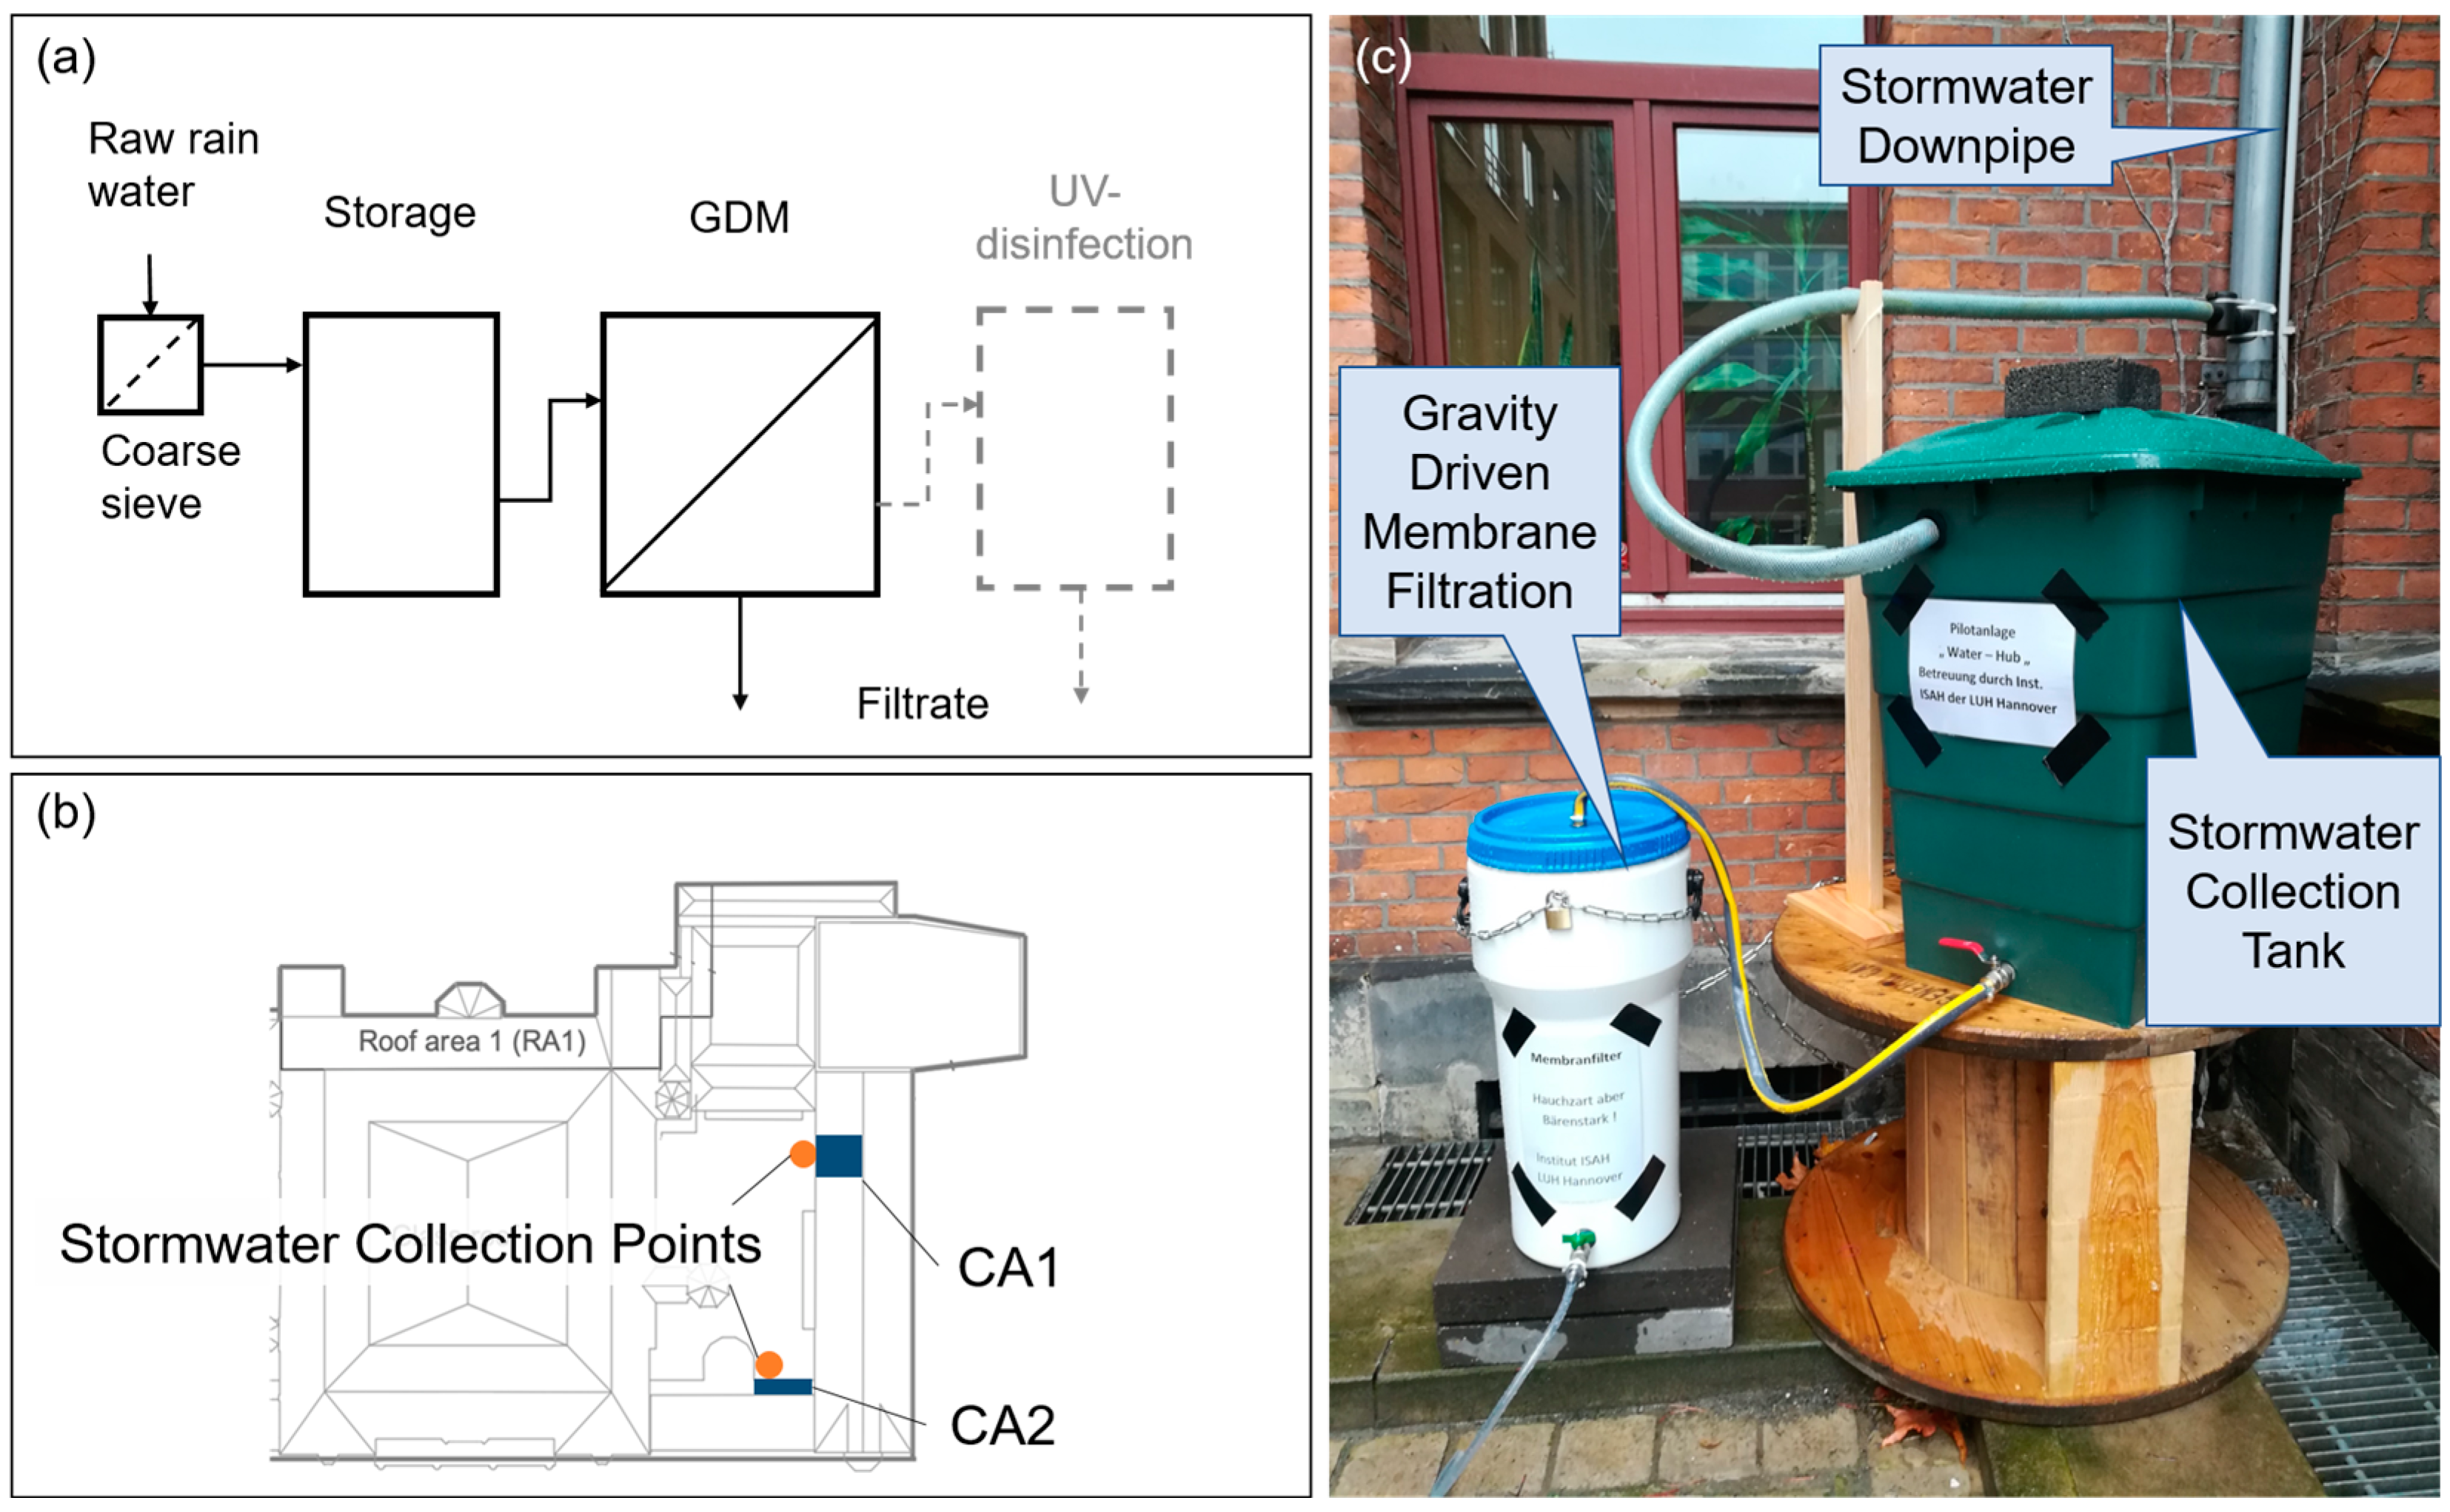
A first pilot plant is installed to investigate the performance of gravity-driven membrane filtration (GDM). Gravity-driven membrane filtration is considered as suitable for a decentralized rainwater treatment due to its low energy demand and efficient treatment effect [14]. The pilot plant is located at the main building of the university in an inner courtyard. The location of the treatment unit, as well as that of CA1 and CA2, are depicted in Figure 3.
An outlet structure is part of the rainwater tank, placed 5 cm above the ground of the tank. As membrane filter, the AQUQLOOP-Tap® of Intewa with an ultrafiltration membrane with a pore diameter of 0.02 µm is used. Further technical parameters given by the manufacturer are listed in Table 1. To monitor the performance of the membrane, the pH, turbidity, EC, and COD were measured with the same methods as monitoring the raw water. The membrane is placed in a tank made out of PE with a volume of about 60 L; the membrane tank is directly connected through a tube with the rainwater tank. Therefore, the rainwater tank is placed elevated above the membrane tank to achieve a flow through the difference in geodetic height. A scheme of the applied procedure is depicted in Figure 3. During experiments, the membrane tank is filled completely, vented, and operated until the tank is empty. During the time of operation, the membrane unit could be used 3 times with the collected volume of stormwater.
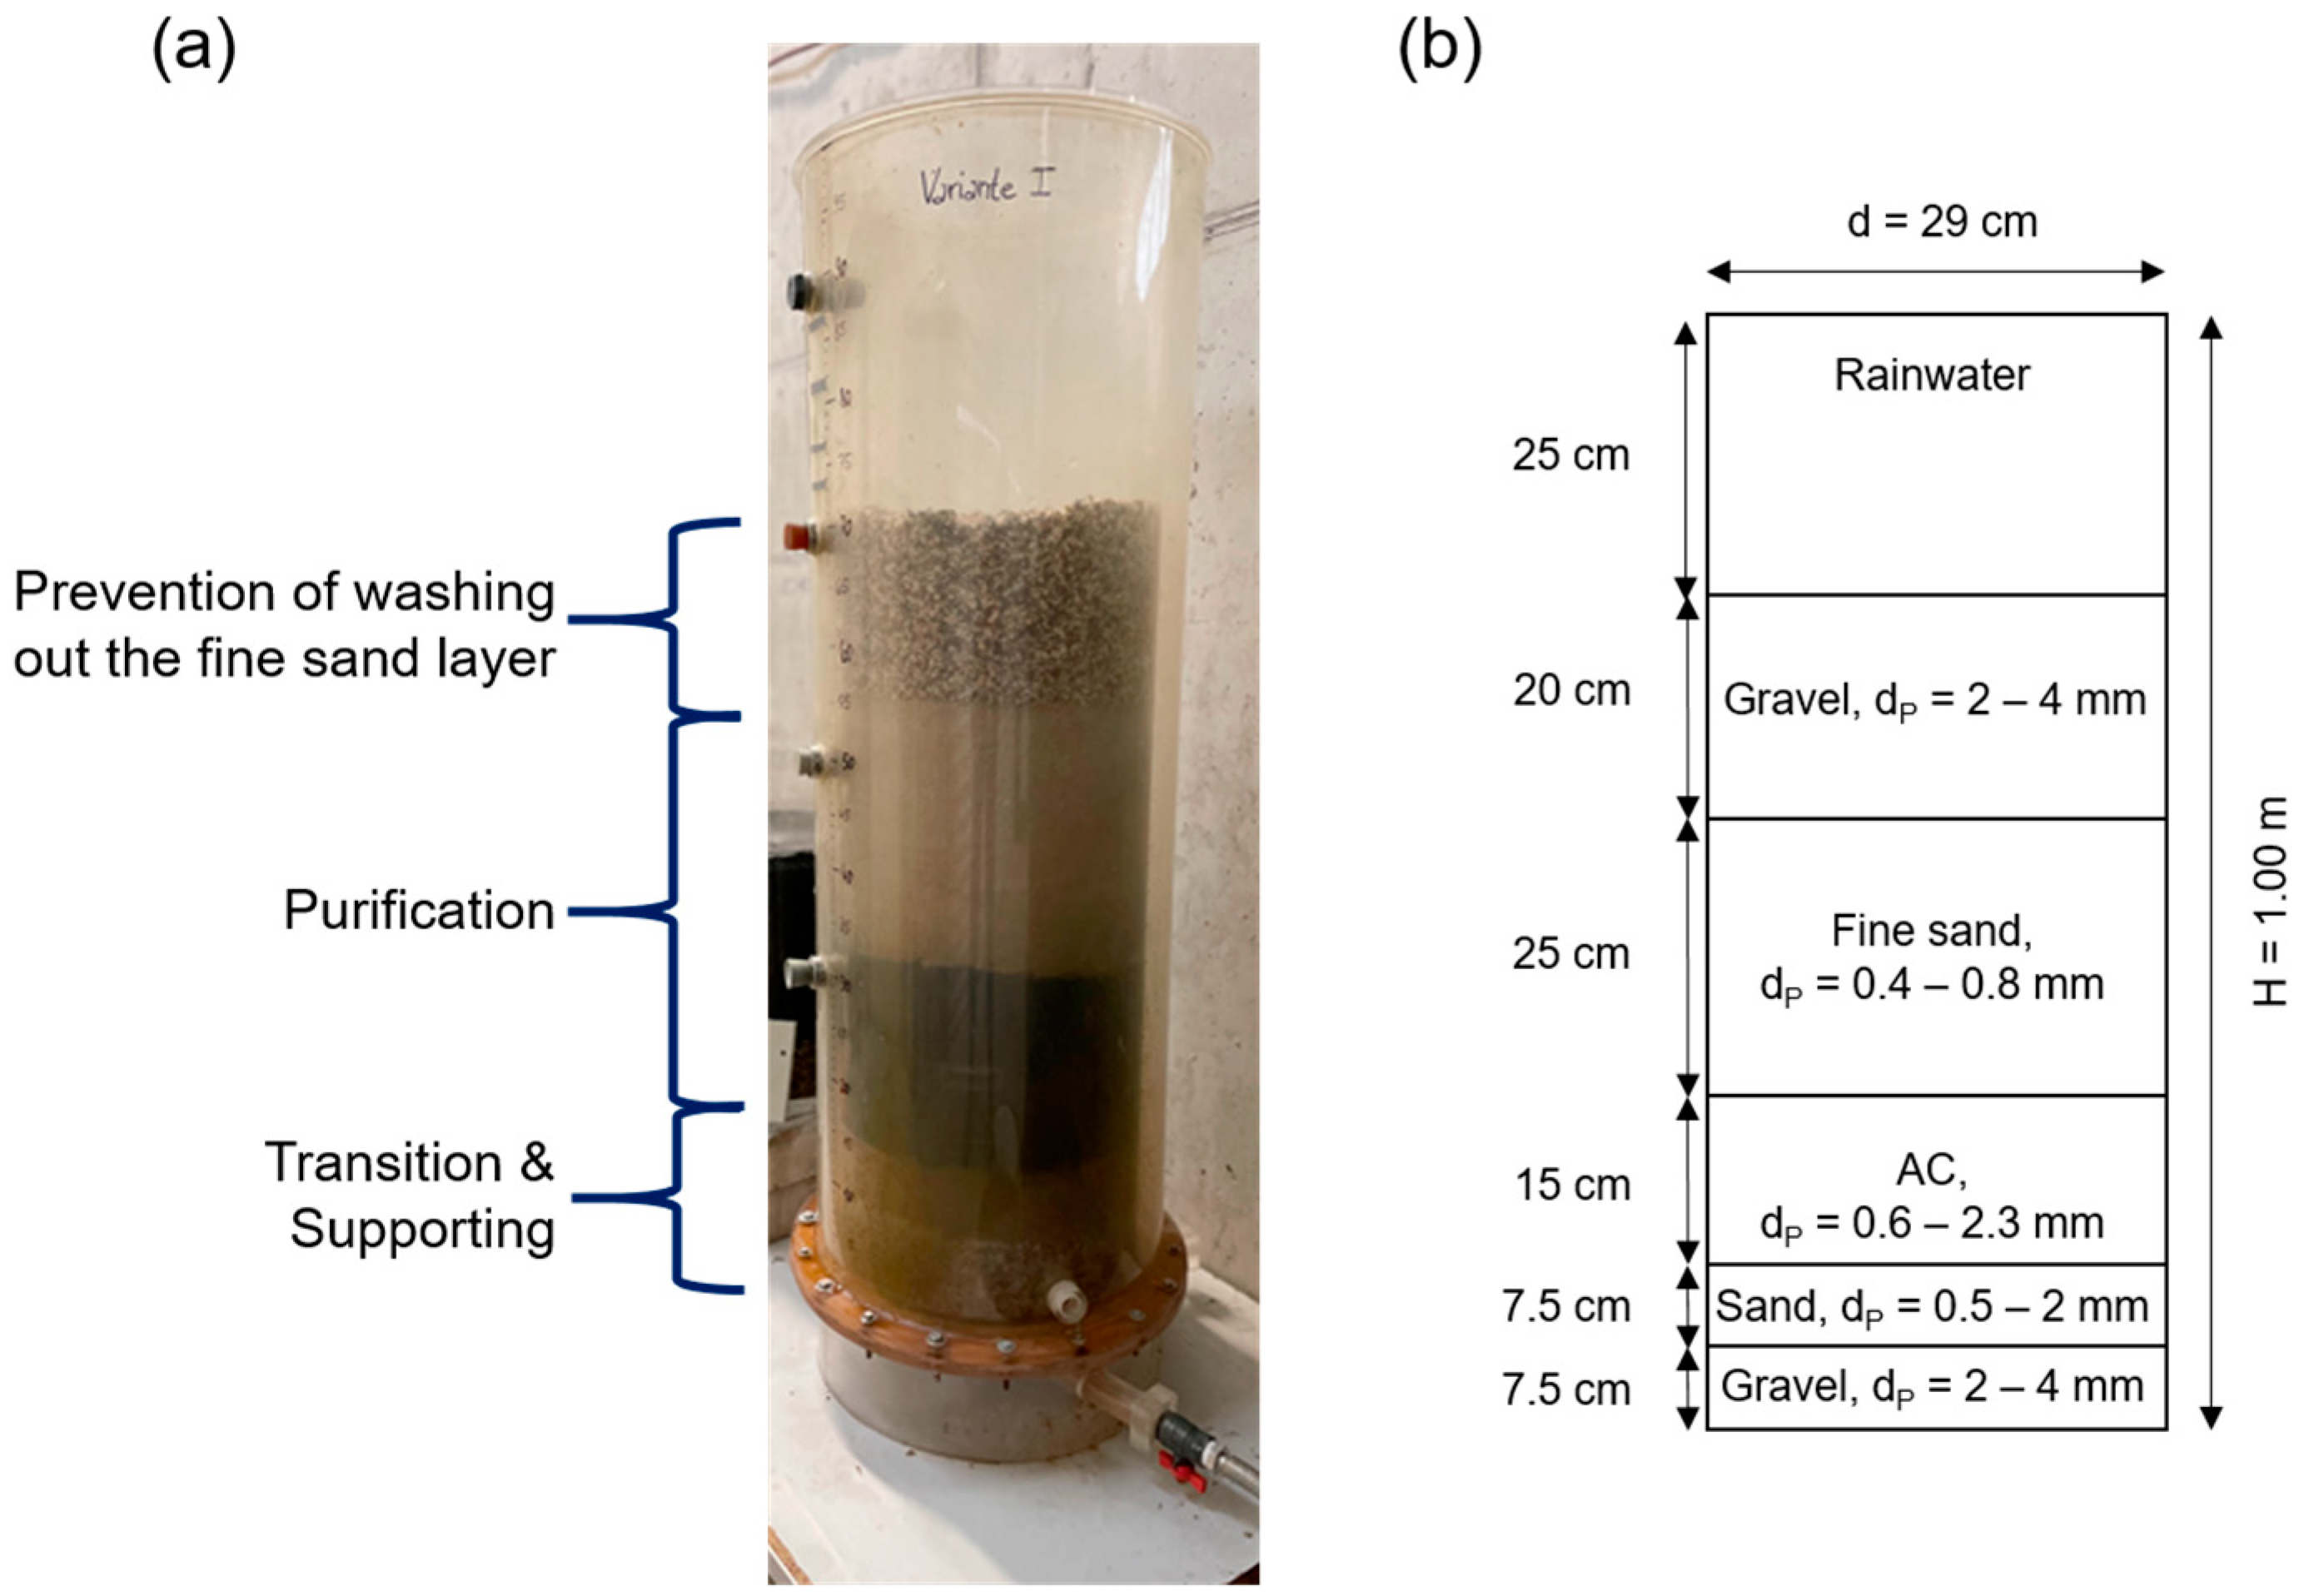
A second pilot plant was designed to investigate a slow filtration system using fine sand and granular activated carbon (Sand/AC filter) as core purifying filter layers. This approach is already comprehensively described, e.g., by Teixeira and Ghisi (2019) and Rhamat et al. (2008), among others, and is also applied worldwide [27,28]. The filtration systems were fed with stormwater collected from CA3. Figure 4 shows filter layer design and the chosen filter materials. Fine sand and a layer of granular activated carbon were chosen to allow holistic purification. Additionally, the filter bed is extended by a supplementary upper layer of gravel to reduce the risk of washing out the fine sand during water inflow. A gravel layer at the bottom stabilizes the filter layers. To avoid unwanted intermixing of the layers and to prevent the filter material from washing out at the outlet, a permeable geotextile was integrated between each layer and at the outlet. The chosen polypropylene geotextile is made by ACO® and has an opening size of 140 µm.
The filter layers were inserted into a PVC reactor with dimensions and characteristics presented in Figure 4. A tamper was used to compact each layer. The filter bed, with a total height of 75 cm, was operated under a max. head of 25 cm above the top of the gravel layer.
The filter velocity of 0.486 m/h exceeded the usual values for slow sand filtration that range between 0.1 and 0.4 m/h [16]. Due to the structure of the filter cake, which is intended to produce an additional filter effect and thus enable the filtration of very fine solid particles, including pathogens, a decrease in the filter velocity is to be expected in longer-term operation. Hijnen et al. (2004) have demonstrated an increase of 1 to 2 log in decimal elimination capacity for bacteria caused by the formation of a filter cake [29].
A discontinuous operation mode was chosen to simulate the varying rainwater, whereby 30 L of rainwater was filtered in each set of experiments. A total of 9 experiments were carried out. The filtrate was analyzed concerning the pH, electric conductivity, turbidity, and COD with the same method as the raw water.
2.4. Upscaling and Realisation
The implementation of the City Water Hub for the irrigation of the Welfengarten park is the next step to be taken. The results of the presented study provide the prerequisite for the full-scale implementation of the City Water Hub concept, which is conceptualized and visualized within the scope of this work.
3. Results
3.1. Feasibility Study
In an average wet year, irrigation of the park is usually carried out from the end of April to the end of September every 14 days with an irrigation volume of 20 to 25 m3. Only young trees, shrubs, and perennial areas are irrigated. For the scenarios (wettest and driest year), 1959 was chosen as the scenario of the driest year with an annual precipitation of 330 mm, and 1981 was chosen as the scenario of the wettest year with a precipitation of 950 mm. The calculated annual irrigation needs according to the precipitation are listed in Table 2. In a dry year such as 1959, at least 707 m3 is needed for irrigation. Not considered in this irrigation need are older trees or lawn irrigation. Taking these additional demands into account, a huge increase in required water is expected. Considering in a first estimation an irrigation need of 150 L [30] per tree and assuming the same frequency for irrigation as for young trees, the water demand doubles to 1462 m3/a.
Roof area 2 is large enough to catch and collect enough rainwater to meet the irrigation needs of every year between 1952 and 2022. Roof area 1 is too small in 2 of the 70 years. The storage of rainwater is needed to be able to provide the collected rainwater for the irrigation of the park over the entire irrigation period. Thereby the size of the storage depends on the size of the collection area and the demand for water. Thus the smallest storage capacity of 6 m3 is necessary for the RA2 in a wet year, and the largest storage capacity of 586 m3 for RA1 in a dry year. In the latter case, the surface area would not be large enough to collect the required amount of rainwater for the irrigation period. Additionally, this large storage volume is more expensive to be built and more difficult to maintain; thus, it is recommended to enable a roof area as large as possible to collect rainwater. RA2 would be sufficient to collect enough water for irrigation. Compared to RA1, the storage volume can be reduced by 65% from 586 m3 to 156 m3 for the driest year.
The remaining water volume after the end of an irrigation phase is referred to as “surplus water”. This water is not required for irrigation and can be used for different purposes such as toilet flushing, street cleaning, and groundwater recharge. For RA 2 in the driest year, 80.2% of the harvested rainwater is not needed for irrigation. It supports the recommendation of using a large roof area to collect rainwater, since a larger number of additional water use options can be realized. On a city scale, this is also confirmed by literature sources [4,31]. Considering the historical dataset, it is not necessary to store the surplus water for the next irrigation period, but that storage can be filled with rainwater from the winter months.
3.2. Rainwater Qualities
As with quantity, the quality of the rainwater has to be considered. Rainwater was collected from three different roofs, and the quality of the stored water was monitored. The measured raw water qualities are given in Table 3. During the period of monitoring, it rained 30.4 mm with three periods of no rain, which lasted 9–11 days each.
The stored raw water shows a typical quality which is observable for rainwater collected from roofs with felt [22,32,33]. NO3, PO4, and NH4 are comparable to values measured in other studies [34]. Notable is the difference in quality comparing CA1 and CA2, although they originate from the same building with similar roof materials. Construction works were going on close to CA1, which can be a reason for the differing qualities. It shows that the quality of the rainwater may also differ in very small spatial distribution and that local activities can have a noticeable influence. The COD concentration is rather high compared to other studies (10–12 mg/L [35]; 1–23 mg/L [33]), especially since the rainwater was collected in our study during colder weeks with temperatures less than 17 °C. It may be caused by the longer periods without rain, leading to higher dry depositions on the roof, which were washed off by rainfall. Additionally, the roofs are estimated to be older than 20 years and are not cleaned regularly, allowing moss and lichen to grow, which can lead to an increase in the COD as well [32]. In line with these assumptions, an entry of unknown substrate into the rain barrel could be observed. Compared to DIN 18035-2 [36], which defines water quality requirements for the irrigation of sports grounds, PO4 exceeds the recommended value of 0.1 mg/L, as well as ammonium and turbidity. The microbiological status of the water in the pond was determined by Carpio (2021) [37], where E. coli concentrations of 5–461 MPN per 100 mL were measured biweekly from June to October 2020. To assess if this contamination is relevant for the rainwater collected directly from the roof, a parallel microbiological examination was conducted for the rainwater of CA1. For one probe, an MPN value of 32.4 per 100 mL for total coliforms and an MPN value of 1 per 100 mL for E. coli were determined; thus, the microbiological parameters have to be taken into account as well.
3.3. Pilot Plants
The collected rainwater was treated with a GDM and a Sand/AC filter. pH, COD, EC, and turbidity were measured to assess the performance of the chosen treatment method and to evaluate if the method leads to an improvement in the water quality so that the minimum requirements are met. The mean values, ranges, and reduction performance are given as an overview in Table 4. The reduction performance was calculated for each set of experiments individually; subsequently, the mean value of the reduction was calculated.
The GDM showed a performance that can be expected of an ultrafiltration membrane. The high reduction in turbidity (90.4%) is an especially distinctive feature of a membrane process [14,27]. With the reduction of the turbidity to 0.05–0.23 NTU, the limit value of the EU regulation 2020/741 on minimum requirements for water reuse (<5 NTU) [38] is met. The pH did not change due to the treatment; a stable pH value of 6.6 was measured after filtration. A reduction of 22.4% in the Electric Conductivity (EC) of the treated water is observable for the GDM unit to values between 38.42 and 42.68 µS/cm. Since an ultrafiltration membrane does not hold back ions, these values are in an acceptable range. The COD does not show a distinctive pattern. A reduction, as well as an increase in the COD, was measured; thus, further investigations are necessary to assess this effect.
The Sand/AC filter was operated for a short period of time; thus, the effects of a Schmutzdecke as well as a developed filter biology, which can be found in a slow sand filter, do not occur [39]. However, the filter shows a stable reduction in COD. The filter reduces the levels of COD by 77% to values from 2.9 to 15.4 mg/L. The pH of the water increases slightly when passing through the Sand/AC filter from 7.1–7.6 to 7.7–8.1. The pH values of the filtered water as well as the raw water are in good accordance with limit values and are suitable to be further used. For the Sand/AC filter, an increase in the EC was observable, especially in the first sets of experiments. Since the filter was constructed newly and was operated for the first time, it is assumed that leaching processes out of the filter material take place. The turbidity of the rainwater is reduced by the Sand/AC filter. The filter reduced the turbidity by 20.4%, to levels from 2.94 to 4.91 NTU. In total, the filter showed a good performance, although it was operated only for a short period of time without developing filter cake.
Comparing both types of treatment methods, the distinct features and advantages of each treatment method become clear. The GDM shows a very good performance in the reduction of turbidity. The Sand/AC filter could not reach the same level of turbidity reduction, but rather had the advantage of a high removal of nutrients (COD). Both systems thus provide water with a specific quality, which is needed for further use. The GDM provides turbidity-free water and, thus, a filtrate, which can be used as the feed for UV disinfection. The sand/AC filter and its usage in a City Water Hub have to be further assessed, especially the influence of the discontinuous operation mode, and its influence on the filter efficiency is important for producing a quality-ensured product.
3.4. Upscaling and Realisation
The results presented so far have confirmed the applicability of low-energy treatment processes. The next step is large-scale on-site implementation to prove the concept. The case study shows that sufficient roof area (at least 10,000 m2) can be tapped for rainwater collection for park irrigation purposes. The installation of, e.g., a photovoltaic system is still possible; negative effects on the harvested rainwater quality are not expected [40]. Tapping the roof areas is easy by accessing the many existing downpipes. The storage of rainwater for a longer period (>1 year) is not necessary. Further infrastructure, such as a pipe to transport the rainwater into the center of the park, already exists, as depicted in Figure 5. With this pipe, the already existing pond can also serve as an intermediate storage with sufficient capacity (approximately 400 m3) to store rainwater before treatment. This approach is easy to implement, reducing possible challenges due to otherwise necessary construction works. Parallel to the construction of cisterns in ongoing construction works, a standard tank shall be established to provide additional storage volume. Thus, the City Water Hub is able to adapt to changing environmental conditions such as rising temperatures. With this, even longer and more severe droughts can be covered or further uses implemented. Excess stormwater shall be infiltrated into the groundwater body, enabling a safe and reliable discharge of the stormwater. Treatment of rainwater is advisable in order to permanently produce a reliable and certifiable water quality as well as to achieve suitability of the water for potentially long-term storage and further uses.
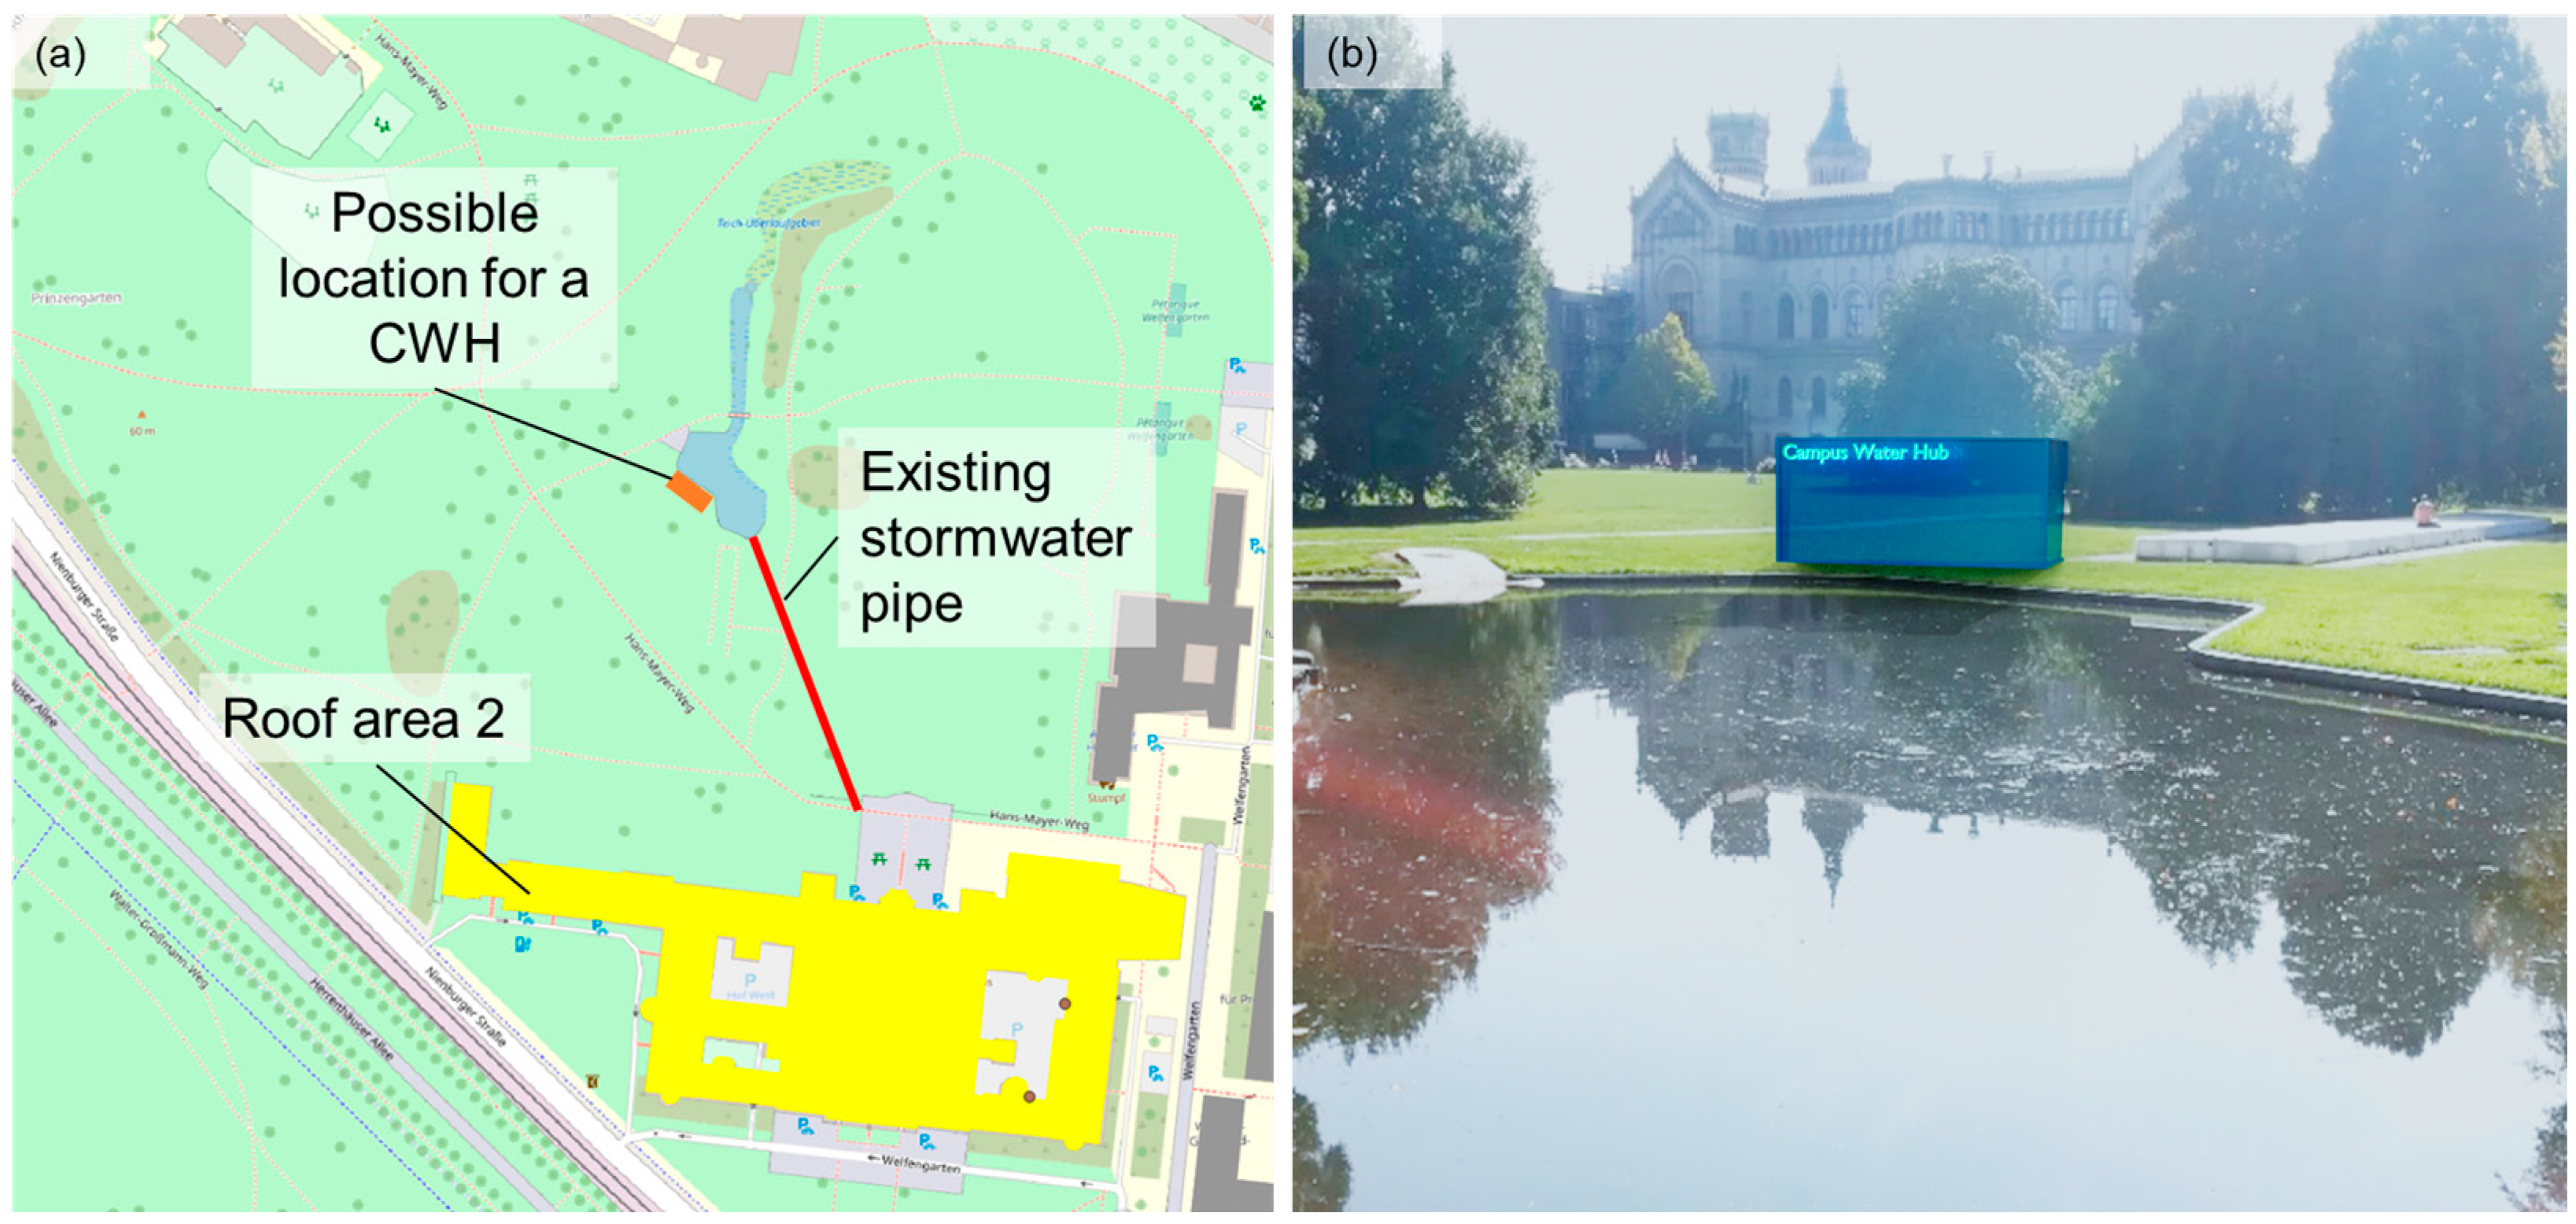
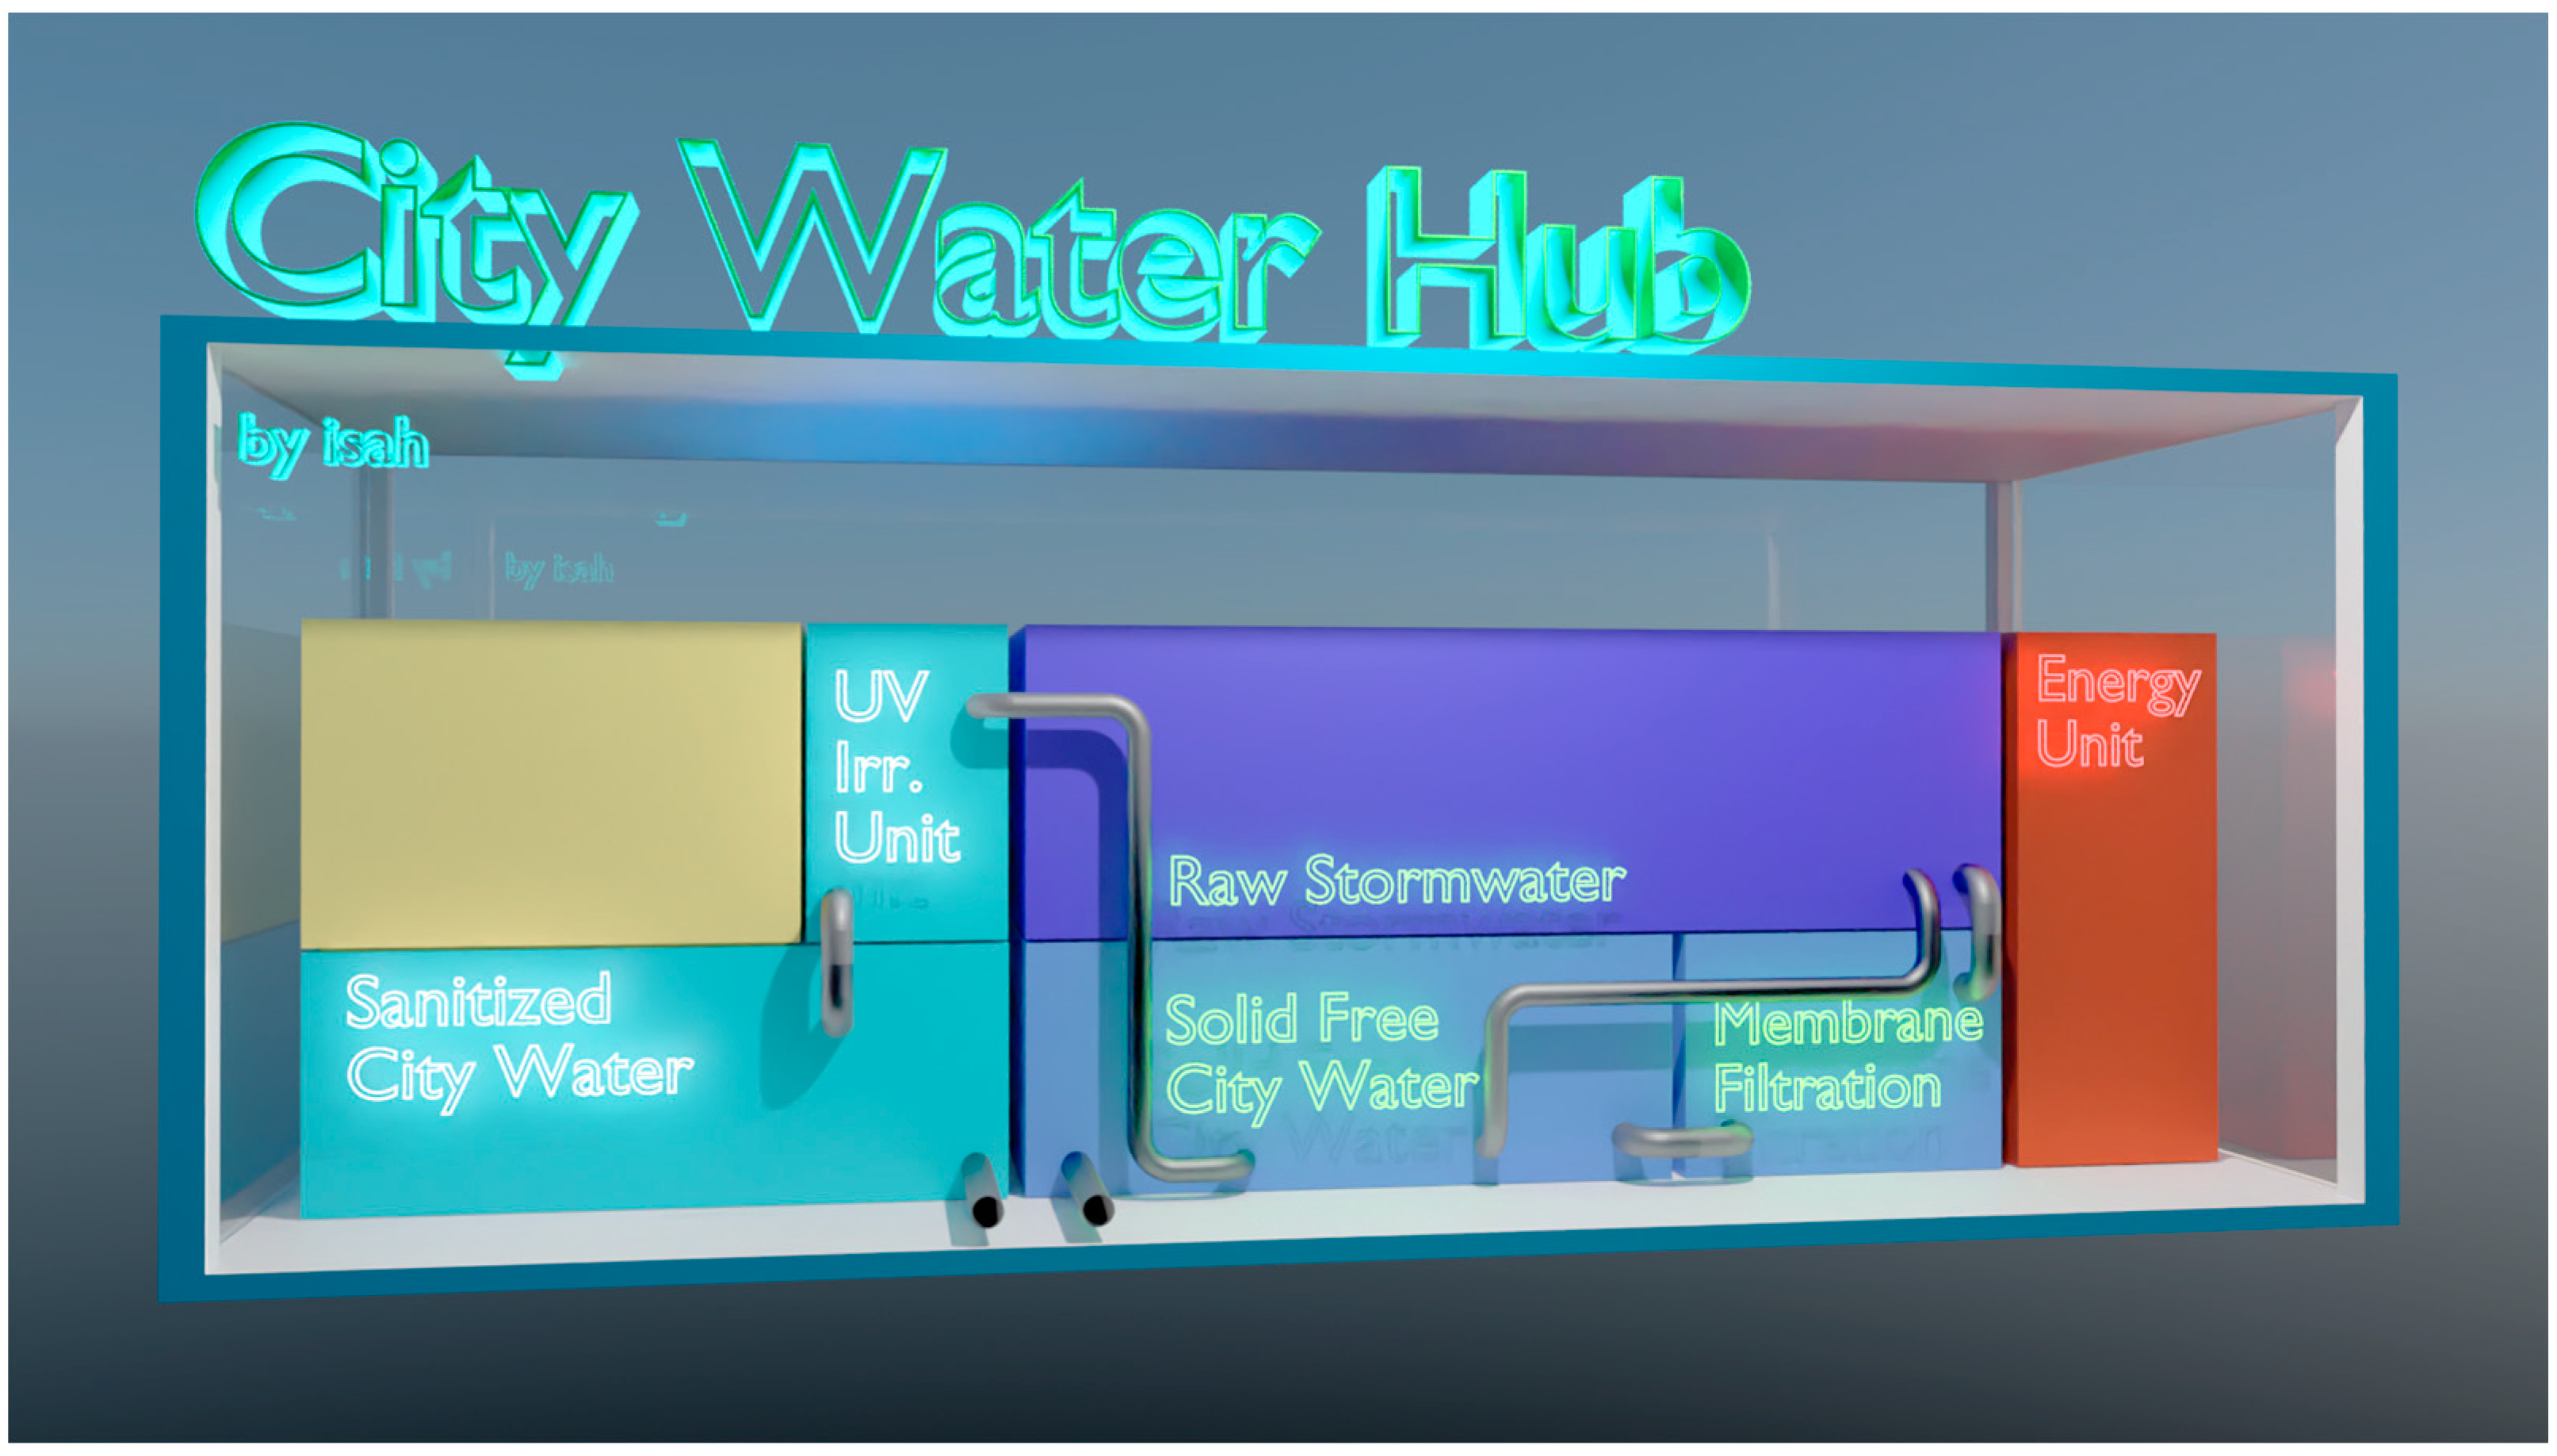
As a treatment, a GDM and a Sand/AC filter were investigated to assess the effort of treatment. The implementation of a GDM in a CWH is thought to be the most beneficial option, whereby even with a small difference in geodetic height (1 m), a membrane area of 33 m2 would be sufficient to ensure the treatment of enough rainwater for irrigation during dry periods in summer according to the specification of the manufacturer. UV disinfection can be installed afterward, allowing the production of quality-assured City Water of different qualities. Storage capacity has to be provided, e.g., as non-natural storage facilities, to store the treated City Water before distribution/usage. Currently, the irrigation in the park is performed by hand using drinking water. When applying downstream UV disinfection in the treatment scheme, further uses of the water can be realized. For instance, spray cooling during hot days or the implementation of fountains would be in the scope of applications. Figure 6 illustrates where a Campus/City Water Hub may be installed in the park, how this installation will be aesthetically embedded in the park, and the process configuration that will be implemented. As such, in the first approach, a visible and technical solution is chosen to raise awareness among the park visitors.
4. Conclusions
The concept of the Sponge City is an essential key to ensuring that cities will continue to be adequately supplied with water in the future, especially under the constraints of climate change. In order to enable rapid implementation of the Sponge City concept even in existing cities, it is particularly appropriate to proceed at the level of urban neighborhoods. In this work, a new approach is presented, showing how non-polluted rainwater can be separately collected and made available by the option of decentralized treatment with guaranteed and use-dependent qualities (City Water). A case study for the listed large park (approx. 120,000 m2), which is located directly at the main building of Leibniz University Hannover, was implemented to demonstrate the feasibility of this proposal. The subjects of the investigations were particular ways of rainwater collection, rainwater quality analysis, treatment technologies, and storage sizing.
According to the evaluation of long-term data files, a rainwater storage volume of 156 m3 is required to meet the water demands for irrigation purposes of a total/maximum of 707 m3 per year. For this purpose, the sufficiently large roof area of the main building is available. The decentral treatment units (City Water Hubs), each with a modular treatment configuration, produce City Water in different qualities, customized for different water uses. Different technologies were investigated to eliminate solids but also to address other parameters such as organic load and nutrients. Regarding the treatment design, GDM is preferable and can be better operated with downstream UV disinfection, which might be needed to reduce the pathogenic load, e.g., for other uses such as lawn sprinkling and water fogging for city cooling.
The investigations and results presented here will now sustain the opportunity to take the next step by installing and operating a full-scale decentralized treatment unit in the park. This measure will contribute to the university’s efforts to create a sustainable campus. In the future, it will be possible to avoid irrigation with potable water even in prolonged periods of drought or heat. It is precisely in this way that it can be demonstrated how the approach pursued can noticeably reduce the burden on the public drinking water supply. The intended large-scale implementation is to be designed in such a way that comprehensive sensor technologies are installed, which will allow online monitoring, remote control, and guidance by a digital twin.
Taking into account all the initial investigations and in view of the current plans for full-scale implementation, it is possible to prove that the City Water concept can be successfully implemented in existing urban neighborhoods. This example is meant to be a model that can be implemented in other existing neighborhoods. The studies that have been started and will be continued in the future are intended, in particular, to configure the treatment technology in such a way that the most optimal and low-energy treatment unit possible is created. It permits the largest possible portfolio of water utilization options (park irrigation, lawn sprinkling or fogging/cooling, feeding of ponds, groundwater recharge, or cleansing activities).
In conclusion, the concept of City Water and the treatment component embedded in it ensure that complementary water supply components can emerge from the Sponge City. It will make a significant contribution to securing the city’s water supply in the future, possibly supplemented by water reuse solutions.
Author Contributions
Conceptualization, S.K.; methodology, S.K., A.T., L.O. and G.H.; investigation, A.T., G.H. and L.O.; resources, G.H.; writing—original draft preparation, S.K., A.T., G.H. and L.O.; writing—review and editing, S.K. and G.H.; visualization, S.K. and G.H.; supervision, S.K.; project administration, S.K.; funding acquisition, S.K. All authors have read and agreed to the published version of the manuscript.
Funding
This research was funded by the Federal Ministry of Education and Research (BMBF), Germany, in the frame of grant numbers 02WCL1459A, 033W105A, and 01DO17031.
Institutional Review Board Statement
Not applicable.
Informed Consent Statement
Not applicable.
Data Availability Statement
The data presented in this study are available in Forschungsdaten-Repositorium of the Leibniz University Hanover at https://doi.org/10.25835/j0s61ng2.
Acknowledgments
The authors would like to thank the responsible persons at Leibniz Universität Hannover for making the investigations described here possible. Thanks are due, in particular, for the provision of planning data, real estate, and building descriptions, and for their support in carrying out the practical investigations described here.
Conflicts of Interest
The authors declare no conflict of interest.
References
- Mohapatra, S.S.; Wu, W.; Tiwari, M.K.; Arora, M. An IUWM incorporated model to improve water supply reliability in intermittent and no service areas. Resour. Conserv. Recycl. 2022, 181, 106248. [Google Scholar] [CrossRef]
- IPCC. Climate Change 2022: Mitigation of Climate Change: Contribution of Working Group III to the Sixth Assessment Report of the Intergovernmental Panel on Climate Change; Shukla, P.R., Skea, J., Slade, R., Al Khourdajie, A., van Diemen, R., McCollum, D., Pathak, M., Some, S., Vyas, P., Fradera, R., et al., Eds.; Cambridge University Press: Cambridge, UK; New York, NY, USA, 2022. [Google Scholar]
- Matos Silva, M.; Costa, J. Flood Adaptation Measures Applicable in the Design of Urban Public Spaces: Proposal for a Conceptual Framework. Water 2016, 8, 284. [Google Scholar] [CrossRef]
- Hou, X.; Guo, H.; Wang, F.; Li, M.; Xue, X.; Liu, X.; Zeng, S. Is the sponge city construction sufficiently adaptable for the future stormwater management under climate change? J. Hydrol. 2020, 588, 125055. [Google Scholar] [CrossRef]
- Nguyen, T.T.; Ngo, H.H.; Guo, W.; Wang, X.C. A new model framework for sponge city implementation: Emerging challenges and future developments. J. Environ. Manag. 2020, 253, 109689. [Google Scholar] [CrossRef]
- Liu, H.; Jia, Y.; Niu, C. “Sponge city” concept helps solve China’s urban water problems. Environ. Earth Sci. 2017, 76, 473. [Google Scholar] [CrossRef]
- Yin, D.; Xu, C.; Jia, H.; Yang, Y.; Sun, C.; Wang, Q.; Liu, S. Sponge City Practices in China: From Pilot Exploration to Systemic Demonstration. Water 2022, 14, 1531. [Google Scholar] [CrossRef]
- Yin, D.; Chen, Y.; Jia, H.; Wang, Q.; Chen, Z.; Xu, C.; Li, Q.; Wang, W.; Yang, Y.; Fu, G.; et al. Sponge city practice in China: A review of construction, assessment, operational and maintenance. J. Clean. Prod. 2021, 280, 124963. [Google Scholar] [CrossRef]
- Kumar, A.; Button, C.; Gupta, S.; Amezaga, J. Water Sensitive Planning for the Cities in the Global South. Water 2023, 15, 235. [Google Scholar] [CrossRef]
- He, B.-J.; Zhu, J.; Zhao, D.-X.; Gou, Z.-H.; Qi, J.-D.; Wang, J. Co-benefits approach: Opportunities for implementing sponge city and urban heat island mitigation. Land Use Policy 2019, 86, 147–157. [Google Scholar] [CrossRef]
- Sun, Y.; Deng, L.; Pan, S.-Y.; Chiang, P.-C.; Sable, S.S.; Shah, K.J. Integration of green and gray infrastructures for sponge city: Water and energy nexus. Water-Energy Nexus 2020, 3, 29–40. [Google Scholar] [CrossRef]
- Lancia, M.; Zheng, C.; He, X.; Lerner, D.N.; Andrews, C.; Tian, Y. Hydrogeological constraints and opportunities for “Sponge City” development: Shenzhen, southern China. J. Hydrol. Reg. Stud. 2020, 28, 100679. [Google Scholar] [CrossRef]
- Li, F.; Zhang, J. A review of the progress in Chinese Sponge City programme: Challenges and opportunities for urban stormwater management. Water Supply 2022, 22, 1638–1651. [Google Scholar] [CrossRef]
- Liu, X.; Ren, Z.; Ngo, H.H.; He, X.; Desmond, P.; Ding, A. Membrane technology for rainwater treatment and reuse: A mini review. Water Cycle 2021, 2, 51–63. [Google Scholar] [CrossRef]
- Richards, S.; Rao, L.; Connelly, S.; Raj, A.; Raveendran, L.; Shirin, S.; Jamwal, P.; Helliwell, R. Sustainable water resources through harvesting rainwater and the effectiveness of a low-cost water treatment. J. Environ. Manag. 2021, 286, 112223. [Google Scholar] [CrossRef]
- Nassar, A.M.; Hajjaj, K. Purification of Stormwater Using Sand Filter. JWARP 2013, 5, 1007–1012. [Google Scholar] [CrossRef]
- Köster, S.; Beier, M.; Kabisch, N.-K. Quality-based drainage of urban rainwater Potential analysis for the catchment of Hildesheim, GER. In Proceedings of the International Conference of Urban Drainage, Melbourne, Australia, Virtual Meeting, 27 October 2021. [Google Scholar]
- Deutscher Wetterdienst. Climate Data Center (CDC): Multi-Year Station Averages for the Climate Reference Period 1981–2010; Version CDC-v2.1.b22.09; Deutscher Wetterdienst: Hannover-Langenhagen, Germany, 2023.
- Younos, T.; Lawson, S. Rainwater harvesting: A holistic approach for sustainable water management in built environments. In Proceedings of the Low Impact Development Symposium, Philadeplphia, PA, USA, 26–28 September 2011. [Google Scholar]
- Chang, M.; McBroom, M.W.; Scott Beasley, R. Roofing as a source of nonpoint water pollution. J. Environ. Manag. 2004, 73, 307–315. [Google Scholar] [CrossRef]
- Abbasi, T.; Abbasi, S.A. Sources of Pollution in Rooftop Rainwater Harvesting Systems and Their Control. Crit. Rev. Environ. Sci. Technol. 2011, 41, 2097–2167. [Google Scholar] [CrossRef]
- Hou, L.; Zhang, X. Comparing urban runoff quality of a felt roof and an asphalt road in Beijing. Hydrol. Res. 2014, 45, 282–291. [Google Scholar] [CrossRef]
- Institut für Meterologie und Klimatologie, Leibniz Universität Hannover. Wetterdaten Herrenhausen. Available online: https://www1.muk.uni-hannover.de/hp-design202/wetter_archiv_frame.html (accessed on 30 March 2023).
- DWA. DWA M 153E - Recommended Actions for Dealing with Stormwater; DWA: Hennef, Germany, 2007. [Google Scholar]
- Harlaß, R. Evapotranspiration in Urban Areas. Ph.D. Thesis, Technische Universität Dresden, Dresden, Germany, 2008. [Google Scholar]
- Kaiser, M. Naturnahe Regenwasserbewirtschaftung als Baustein einer Nachhaltigen Siedlungsentwicklung—Demonstriert mithilfe der Entwicklung und Umsetzung von Modellprojekten. Ph.D. Thesis, Universität Dortmund, Dortmund, Germany, 2004. [Google Scholar]
- Teixeira, C.A.; Ghisi, E. Comparative Analysis of Granular and Membrane Filters for Rainwater Treatment. Water 2019, 11, 1004. [Google Scholar] [CrossRef]
- Rahmat, S.N. Treatment of rainwater quality using sand filter. In Proceedings of the International Conference on Enironment, Penang, Malaysia, 15–17 December 2008. [Google Scholar]
- Hijnen, W.; Schijven, J.F.; Bonné, P.; Visser, A.; Medema, G.J. Elimination of viruses, bacteria and protozoan oocysts by slow sand filtration. Water Sci. Technol. 2004, 50, 147–154. [Google Scholar] [CrossRef] [PubMed]
- DIN Deutsches Institut für Normung e.V. Vegetation Technology in Landscaping—Care of Vegetation during Development and Maintenance in Green Areas; Beuth Verlag GmbH: Berlin, Germany, 2016. [Google Scholar]
- Fuchs, K. Modellbasierte Ermittlung der Wirksamkeit von Schwammstadtansätzen auf die Reduzierung der Überflutung Durch Extreme Starkregen. Master’s Thesis, Leibniz University Hannover, Hanover, Germany, 2021. [Google Scholar]
- Göbel, P.; Dierkes, C.; Coldewey, W.G. Storm water runoff concentration matrix for urban areas. J. Contam. Hydrol. 2007, 91, 26–42. [Google Scholar] [CrossRef] [PubMed]
- Wilbers, G.-J.; Sebesvari, Z.; Rechenburg, A.; Renaud, F.G. Effects of local and spatial conditions on the quality of harvested rainwater in the Mekong Delta, Vietnam. Environ. Pollut. 2013, 182, 225–232. [Google Scholar] [CrossRef] [PubMed]
- De Kwaadsteniet, M.; Dobrowsky, P.H.; van Deventer, A.; Khan, W.; Cloete, T.E. Domestic Rainwater Harvesting: Microbial and Chemical Water Quality and Point-of-Use Treatment Systems. Water Air Soil Pollut. 2013, 224, 1629. [Google Scholar] [CrossRef]
- Ward, S.; Memon, F.A.; Butler, D. Harvested rainwater quality: The importance of appropriate design. Water Sci. Technol. 2010, 61, 1707–1714. [Google Scholar] [CrossRef]
- DIN Deutsches Institut für Normung e.V. Sports Ground—Part 2: Irrigation; Beuth Verlag GmbH: Berlin, Germany, 2020. [Google Scholar]
- Carpio Vallejo, D.E. Health Impact Assessment of Four Water Fountains and One Pond in Hannover City. Master’s Thesis, Leibniz University Hannover, Hanover, Germany, 2021. [Google Scholar]
- European Commission. Regulation (EU) 2020/741 of the European Parliament and of the Council of 25 May 202 on minimum requirements for water reuse. Off. J. Eur. Union 2020, 177, 32–55. [Google Scholar]
- Cao, X.; Liu, J.; Meng, X. Evaluation of a slow sand filter in advanced wastewater treatment. In Proceedings of the 2010 International Conference on Mechanic Automation and Control Engineering (MACE), Wuhan, China, 26–28 June 2010; IEEE: Piscataway, NJ, USA, 2010; pp. 4942–4944, ISBN 978-1-4244-7737-1. [Google Scholar]
- Osayemwenre, G.; Osibote, O.A. A Review of Health Hazards Associated with Rainwater Harvested from Green, Conventional and Photovoltaic Rooftops. IJESD 2021, 12, 289–303. [Google Scholar] [CrossRef]
Figure 1.
The City Water concept (own illustration).

Figure 2.
(a) Map of the Welfengarten (green) and surrounding buildings belonging to the university (labeled, REF); (b) photo of the artificial pond with a view of the main building. (c) Map of the roof of the main building and its different parts (own picture).
Figure 2.
(a) Map of the Welfengarten (green) and surrounding buildings belonging to the university (labeled, REF); (b) photo of the artificial pond with a view of the main building. (c) Map of the roof of the main building and its different parts (own picture).

Figure 3.
(a) Technical scheme of pilot plant 1 equipped with Gravity-driven membrane filtration; (b) location of the stormwater collection point and CA1 and CA2 at the main building of the LUH; and (c) Scheme of 1st pilot plant on LUH Campus equipped with GDM system (own figures).
Figure 3.
(a) Technical scheme of pilot plant 1 equipped with Gravity-driven membrane filtration; (b) location of the stormwater collection point and CA1 and CA2 at the main building of the LUH; and (c) Scheme of 1st pilot plant on LUH Campus equipped with GDM system (own figures).

Figure 4.
Scheme of pilot plant 2 equipped with slow sand filtration (own figure): (a) picture of the built sand filter with indication of the purpose of each layer; (b) schematic drawing of the filter setup with the geometric dimensions.
Figure 4.
Scheme of pilot plant 2 equipped with slow sand filtration (own figure): (a) picture of the built sand filter with indication of the purpose of each layer; (b) schematic drawing of the filter setup with the geometric dimensions.

Figure 5.
(a) Possible location of the CWH in the Welfengarten; (b) visualization of the location in the park (own figures).
Figure 5.
(a) Possible location of the CWH in the Welfengarten; (b) visualization of the location in the park (own figures).

Figure 6.
Technical visualization and configuration of the CWH (own figure).


Table 1.
Overview of the properties of the chosen treatment units and the respective standardized methods carried out.
Table 1.
Overview of the properties of the chosen treatment units and the respective standardized methods carried out.
| Treatment Method | Filter Characteristics | CA | Roof Material | Area | Raw Water Monitoring | Filtrate Monitoring |
|---|---|---|---|---|---|---|
| - | Material: PE | CA1 | Bituminous felting | 56 m2 | pH EC Turbidity COD NO3 NH4 PO4 | pH EC Turbidity COD |
| GDM | dp = 0.02 µm AFilter = 6 m2 | CA2 | Bituminous felting | 43 m2 | ||
| Sand/AC filter | d = 29 cm h = 75 cm dFS = 0.4–0.8 mm dAC = 0.6–2.3 mm | CA3 | Steel | 65 m2 |
Table 2.
Comparison of the results of the two most extreme years of the dataset, 1959 and 1981, differentiated in using the smaller roof area 1 and the bigger roof area 2 as rainwater catchment area.
Table 2.
Comparison of the results of the two most extreme years of the dataset, 1959 and 1981, differentiated in using the smaller roof area 1 and the bigger roof area 2 as rainwater catchment area.
| Criterion | Roof Area 1 | Roof Area 2 | ||
|---|---|---|---|---|
| 1959 | 1981 | 1959 | 1981 | |
| Specified irrigation requirements | 707 m3 | 20 m3 | 707 m3 | 20 m3 |
| Total available rainwater | 352 m3 | 812 m3 | 3576 m3 | 8239 m3 |
| Required storage capacities | 586 m3 | 6 m3 | 156 m3 | 6 m3 |
| Missing and surplus water | −354 m3 | 797 m3 | 3222 m3 | 9036 m3 |
| Feasibility of covering irrigation need | Feasible in 67 out of 69 years | Feasible in 69 out of 69 years | ||
| Discharge of rainwater drainage system | No discharge | 3576 m3 | 8239 m3 | |
Table 3.
Overview of the measured stored raw water quality as mean values and ranges (in brackets) of catchment areas 1–3.
Table 3.
Overview of the measured stored raw water quality as mean values and ranges (in brackets) of catchment areas 1–3.
| CA1 | CA2 | CA3 | |
|---|---|---|---|
| n | 6 | 7 | 9 |
| T [°C] | (4–12.6) | (2.5–16.7) | (3–13.6) |
| pH | (7.3–7.6) | (6.3–7.3) | (7.1–7.4) |
| EC [µS/cm] | 74.2 (60.6–114.1) | 41.1 (31.7–54.1) | 105 (90–132) |
| COD [mg/L] | 30.7 (17.9–53.69) | 34.1 (19.2–58.5 9 | 39.2 (31.8–51.4) |
| TSS [mg/L] | 0.96 (0.25–2.27) | 4.29 2 (2.98–7.54) | 4.8 (0.6–9.4) |
| Turbidity [NTU] | 2.28 1 (1.75–2.95) | 3.12 1 (2.23–4.3) | 4.4 (2.4–7.4) |
| NO3 [mg/L] | 3.64 (2.86–5.12) | 0.87 (0.8–1.11) | 0.82 (0.36–1.64) |
| PO4 [mg/L] | <0.2 | 0.218 (0.17–0.26) | 0.07 (0.01–0.11) |
| NH4 [mg/L] | 0.87 (0.77–1.06) | 1.51 (1.02–2.21) | 0.3 (0.03–0.95) |
Note: 1 Turbidity for CA1 and CA2: n = 5. 2 TSS for CA2: n = 6.
Table 4.
Mean values of the filtrate as well as mean value of the reduction [%] achieved with the GDM and Sand/AC filter.
Table 4.
Mean values of the filtrate as well as mean value of the reduction [%] achieved with the GDM and Sand/AC filter.
| GDM | Sand/AC Filter | |||
|---|---|---|---|---|
| Mean (Range) | Change Raw Water—Filtrate (Range) | Mean (Range) | Change Raw Water—Filtrate (Range) | |
| pH | 6.6 | - | 7.8 | +6% |
| (6.61–6.65) | (7.7–8.1) | (+1.3–+12.8%) | ||
| COD [mg/L] | 25.25 | −0.4% | 9 | −77% |
| (18.65–32.69) | (−30%–+40.6%) | (3.1–14.7) | (−61.7%–−90.2%) | |
| EC [µS/cm] | 40.95 | −22.4% | 191 | +82.7% |
| (38.42–42.68) | (−0.7%–−38.9%) | (77–405) | (−22.8%–+342.1%) | |
| Turbidity [NTU] | 0.16 | 90.4% | 3.5 | −19.7 |
| (0.06–0.23) | (−96.8%–−80.9%) | (2.94–4.91) | (−60.2–+208%) | |
Disclaimer/Publisher’s Note: The statements, opinions and data contained in all publications are solely those of the individual author(s) and contributor(s) and not of MDPI and/or the editor(s). MDPI and/or the editor(s) disclaim responsibility for any injury to people or property resulting from any ideas, methods, instructions or products referred to in the content. |
© 2023 by the authors. Licensee MDPI, Basel, Switzerland. This article is an open access article distributed under the terms and conditions of the Creative Commons Attribution (CC BY) license (https://creativecommons.org/licenses/by/4.0/).
Share and Cite
MDPI and ACS Style
Köster, S.; Hadler, G.; Opitz, L.; Thoms, A. Using Stormwater in a Sponge City as a New Wing of Urban Water Supply—A Case Study. Water 2023, 15, 1893. https://doi.org/10.3390/w15101893
AMA Style
Köster S, Hadler G, Opitz L, Thoms A. Using Stormwater in a Sponge City as a New Wing of Urban Water Supply—A Case Study. Water. 2023; 15(10):1893. https://doi.org/10.3390/w15101893
Chicago/Turabian StyleKöster, Stephan, Greta Hadler, Lea Opitz, and Anna Thoms. 2023. "Using Stormwater in a Sponge City as a New Wing of Urban Water Supply—A Case Study" Water 15, no. 10: 1893. https://doi.org/10.3390/w15101893
Note that from the first issue of 2016, this journal uses article numbers instead of page numbers. See further details here.