
Effect of Biochar on Soil-Water Characteristics of Soils: A Pore-Scale Study
by

Xin Chen
1,
Linfei Li
2,
Xiaofeng Li
3,
Jianyu Kang
1,
Xiang Xiang
4,
Honglian Shi
1,* and
Xingwei Ren
1,* 1
Faculty of Engineering, China University of Geosciences, Wuhan 430074, China
2
China Railway Eryuan Engineering Group Co., Ltd., Chengdu 610031, China
3
China Metallurgical Huaya Construction Group Co., Ltd., Wuhan 430081, China
4
Sinochem Mingda Hubei Geological Survey Co., Ltd., Wuhan 430073, China
*
Authors to whom correspondence should be addressed.
Water 2023, 15(10), 1909; https://doi.org/10.3390/w15101909
Submission received: 5 April 2023
/
Revised: 10 May 2023
/
Accepted: 15 May 2023
/
Published: 17 May 2023
(This article belongs to the Special Issue Water-Related Geoenvironmental Issues)
Abstract
:The mechanical and hydraulic properties of soils are largely governed by their soil-water characteristics, which are influenced by factors such as pore size distribution (PSD). While biochar is commonly used as an additive to alter soil properties, its effect on PSD and the soil water retention curve (SWRC) at the pore scale remains unclear. This study aims to investigate the impact of biochar on PSD and SWRC in soils of different types. The study utilized nuclear magnetic resonance (NMR) and the filter paper method to obtain the particle size distribution (PSD) curve and soil water retention curve (SWRC) of various types of soils, ranging from fine-grained to coarse-grained, with different amounts of biochar. The results and discussion revealed that the impact of biochar on soil PSD and SWRC varied depending on the soil type and biochar content. In fine-grained soils, the addition of 8% biochar resulted in the greatest decrease in mesopore size and percentage, while in medium-grained soils, 6% biochar had the most significant effect, and in coarse-grained soils, the optimum biochar content was 2%. At low suction states, the addition of 8% and 2% biochar improved the water retention of fine-grained and medium-grained soils, respectively, but had little effect on coarse-grained soils. Overall, the effect of biochar on soil-water characteristics was non-monotonic and depended on the relative sizes of biochar and soil particles. Therefore, selecting the optimum biochar-to-soil ratio requires careful consideration of these factors.
1. Introduction
Biochar is the product of biomass after pyrolysis or carbonization (under high temperature and oxygen-restricted conditions) [1], which is viewed as a stable carbon source that can enhance soil quality. Biochar, as a soil ameliorator for soil degradation, with a highly developed pore structure and a large specific surface area [2], has been widely recognized worldwide, which can significantly reduce soil bulk density, improve soil texture, and influence soil structure stability and hydraulic properties [3,4] when applied to the soil and effectively regulate the carbon balance in the natural environment [5,6]. The impact of biochar on soil function depends on both the inherent properties of the biochar itself and the physical and chemical mechanisms by which biochar stabilizes in soil [6].
A developing subfield in geotechnical engineering is bio-geotechnical engineering that offers innovative and sustainable solutions to current engineering problems by drawing inspiration from biology, either directly or indirectly, whose research focus can be categorized into materials, models, and methods [7,8]. As an environmentally friendly amendment material, biochar is widely used in biological environments and engineering systems. Incorporating biochar into soil has proven to be highly effective in enhancing soil fertility and promoting healthier plant growth. This is because biochar has the ability to retain essential nutrients, water, and beneficial microorganisms in the soil. Additionally, adding biochar to soil can help mitigate greenhouse gas emissions and improve the overall quality of soil ecosystems.
Over the years, several relevant studies on biochar-amended soil have been conducted [9,10,11]. Most of these studies can be grouped into:
(i) Agricultural production. Biochar has been shown to have a certain effect on the growth of crops [12,13,14]; alkaline biochar especially can better improve the pH value of tropical soil and acidic soil [15,16], which can reduce the loss of soil nutrient elements and then promote the better development of crops [17].
(ii) Treatment of contaminated soil. Due to its unique surface structure, biochar has a good adsorption effect on many heavy metal inorganic pollutants, such as manganese (Mn), iron (Fe) [18], cadmium (Cd) [19], and lead (Pb), as well as organic pollutants, such as pesticides and herbicides [20,21].
(iii) Effects on soil water retention. Biochar has great potential in the improvement of soil water retention [22,23] in arid and semi-arid regions [24] or in the application of biochar compost [25]. By controlling the type of biochar, pyrolysis temperature, size, content, etc., through multi-scale analysis, Wang et al. [26] found that the intraparticle structure of biochar improved the water retention of soil, and the effect of biochar on soil water conservation is limited when the pore volume of biochar is low or the soil texture is good. Hussain et al. [27] suggested that different particle sizes of biochar also influence the saturated hydraulic conductivity of compacted soil. Additionally, in general, biochar-amended soils at a high suction range have better water retention capacity [24,28]. In sandy soil, biochar, which will be most effective when it has high porosity and an irregular shape [29], can improve physical properties [22] and soil water-holding capacity by changing the distribution of soil pores [30,31]. However, controlling the biochar particle size and application rate, Obour et al. [32] found no significant overall change in the pore structure and function of the sandy loam tropical soil after 36 months of amending corn cob biochar. Jeffery et al. [33] used biochar pyrolysis at 400 °C and 600 °C and mixed it with different proportions and found that the water-holding capacity of sandy soil did not change significantly.
Apart from the factors mentioned previously, there are numerous other variables that can impact the water-holding capacity of soils modified with biochar, such as the surface oxidation degree of the biochar [34] and its porosity [35]. Furthermore, the heterogeneity in biochar properties, experimental conditions (especially in field experiments), and soil properties can make it challenging to compare and infer the results of different studies. Therefore, the mechanisms by which biochar influences soil properties remain complex and multifaceted [5]. Most studies examining the effects of biochar on soils have been conducted using undisturbed soils in laboratory or field experiments. While these studies can provide valuable insights, it is important to note that the presence of organic matter, soil organisms, and plant roots in undisturbed soils may complicate our understanding of how biochar influences soil-water characteristics. Therefore, a more comprehensive assessment of the impact of biochar on soil-water characteristics may require exploration of additional experimental conditions and contexts.
PSD is a key metric for characterizing the pore network of soils [36]. Nuclear magnetic resonance (NMR) is a prospective technique for profiling soil–water interactions [37], proven to be extensively used in geosciences, petroleum extraction, and other fields. The NMR is a non-destructive and efficient method for estimating soil pore size distribution that has advantages over X-ray computed tomography (CT) scanning in terms of speed and simplicity [38]. Researchers have successfully employed NMR to determine soil pore size distribution, such as through the use of T2 distribution analysis and the Young-Laplace equation by Tian et al. [39] and other studies [40,41,42].
To explore the mechanism of how biochar improves soil hydraulic properties, the main purpose of the study was to investigate the effects of biochar on soil pore distribution and SWRC from a pore-scale perspective by combining NMR technique with three different types of remolded soils mixed with varying amounts of biochar. This study aimed to assess the impact of different biochar contents on soil properties, as well as to enhance our comprehension of how biochar affects the pore network and SWRC.
2. Materials and Methods
2.1. Measurements
NMR is used to obtain the pore size distribution of samples. However, the principles of NMR are complex, particularly when working with porous media for testing and data analysis, and require a comprehensive understanding of relaxation processes in NMR. Therefore, a brief introduction to this principle is given as follows.
In the relaxation process, the magnetization M0 has two components in two directions, namely the longitudinal component Mz and the transverse component Mt. Their time derivative is:
Since in the beginning, its longitudinal component Mz is 0 and its transverse component Mt is the maximum Mtmax, the integral of Equations (1) and (2) can be obtained:
where T1 is the spin-lattice relaxation time (the longitudinal relaxation time) and T2 is the spin–spin relaxation time (the transverse relaxation time), which are the dimensions of time [43,44]. Generally, T2 is always less than or equal to T1.
The transverse relaxation time, T2, is controlled by three superposition relaxation processes and can be expressed as:
where Tb is bulk relaxation time, which greatly depends on fluid properties such as ionic type [45], Ts is surface relaxation time, and Td is diffusion relaxation time, which is induced by the diffusion within the magnetic field gradient [46]. Jaeger et al. [41] assumed that the condition for the fast-diffusion regime is satisfied and Td can be neglected. Since bulk relaxation time is much longer than surface relaxation time [47,48], Equation (5) can be expressed as:
where ρ2 is the transverse surface relaxation coefficient, which is related to soil surface properties, S is the pore surface area, V is the pore volume, R is the pore radius, and α is the pore shape factor, corresponding to planar, cylindrical, and spherical pore geometry when a = 1, 2, or 3, respectively [49]. Then, the Carr-Purcell-Meiboom-Gill (CPMG) sequence can be utilized to measure the transverse relaxation time.
The pore radius is proportional to the T2 value, and the intensity of the T2 transverse relaxation signal is directly proportional to the content at the hydrogen core(1H). The higher the content at the hydrogen core (1H), the stronger the signal intensity. Therefore, the porous media sample can be fully saturated initially, and its void is filled with water. The resulting T2 spectrum obtained by inversion can reflect the pore size distribution curve of the porous media.
Equation (6) shows the base form of the relationship between T2 and the pore radius, R, and α is related to the pore shape, which is assumed to be spherical pore in this paper (α = 3). Then, we obtain:
where ρ2 is the transverse surface relaxation coefficient, which is related to soil surface properties, R is the pore radius, T2 is the transverse relaxation time.
The soil sample used in this study is a remolded soil with a specific ratio of kaolin to standard sand, as detailed in Section 2.2. Therefore, the transverse relaxation coefficient ρ2 can be estimated by making reference to the approximate soil type. According to the research by Matteson et al. [50], the ρ2 value of clay mineral kaolin is ρ2 = 1.8 μm/s, while that of quartz sand is ρ2 = 2.4 μm/s. Given the composition of the soil in this test, compared with the above minerals, the value is ρ2 = 2.1 μm/s for the fine-grained remolded soil, ρ2 = 2.2 μm/s for the medium-grained remolded soil, and ρ2 = 2.3 μm/s for the coarse-grained remolded soil.
Tian et al. [39] employed Young-Laplace equation in conjunction with Equation (7) (assumed α = 2 for cylindrical pores) to establish a correlation between pore size and suction. Young-Laplace equation can be described as:
where (mN/m2) is the surface tension of water, α (°) is the contact angle between the water–air interface and soil particle surface, and is the matric suction. Then, the saturation corresponding to different suction can be obtained by accumulating the proportion of pore size distribution.
SWRC described the relationship of water content (or saturation) and suction for the soil, which can be used to obtain some important properties of unsaturated soil, such as shear strength [51], permeability coefficient [52], and so on. Since the 1950s, van Genuchten [53], Fredlund and Xing [54], etc., developed some unimodal SWRC models that are widely used. Ren et al. [55] proposed a method for estimating SWRC with limited experimental data. In the paper, SWRC model derived by Wang et al. [56] (EMFX model, as shown in Equation (9)) would be used, which provides coverage for the suction ranges from saturation to oven dryness.
where is the saturation degree, is the volumetric water content, is the saturation water content, is the matric suction corresponding to the residual water content , 6,300,000 kPa is the matric suction corresponding to a water content value of 0, c is a constant with a value of 0.01, e is Euler’s number, and α, n, m are all fitted parameters.
The root mean square error (RMSE) is used to statistically examine the predictive accuracy of the SWRC model. RMSE is defined as:
where is the number of data pairs indicating soil-water characteristic curves, and are the saturation of the measurement and the fitting, respectively.
The Yang-Laplace equation assumes cylindrical pores and can only accurately describe the suction versus saturation of the capillary section. However, it does not work well for the full suction range. In this paper, the filter paper method is utilized to obtain SWRC for the full suction range.
2.2. Materials
To ensure accurate analysis of experimental results, remolded soil was used in this study. The remolded soil was a mixture of forged kaolin and standard sand in three different proportions, which helped to avoid the influence of impurities in the soil. The forged kaolin (Henan Borun New Materials Technology Co., Ltd., Henan, China) was used in the experiment with a particle size of 325 mesh and 0.045 mm. The standard sand (Xiamen Aisiou Standard sand Co., Ltd., Xiamen, China) is China’s ISO standard sand, with particle sizes ranging from 0.08 mm to 2 mm.
The biochar used in this experiment was rice shell biochar (Engineering Research Center of Biochar of Zhejiang Province, Hangzhou, China), with particle sizes ranging from 0.1 mm to 0.5 mm. The biochar was added to three different remolded soil samples in five different mass ratios, as shown in Table 1. The control groups consisted of soil samples without any biochar addition (0%). A total of 15 groups of NMR tests were conducted as part of this experiment.
2.3. Methods
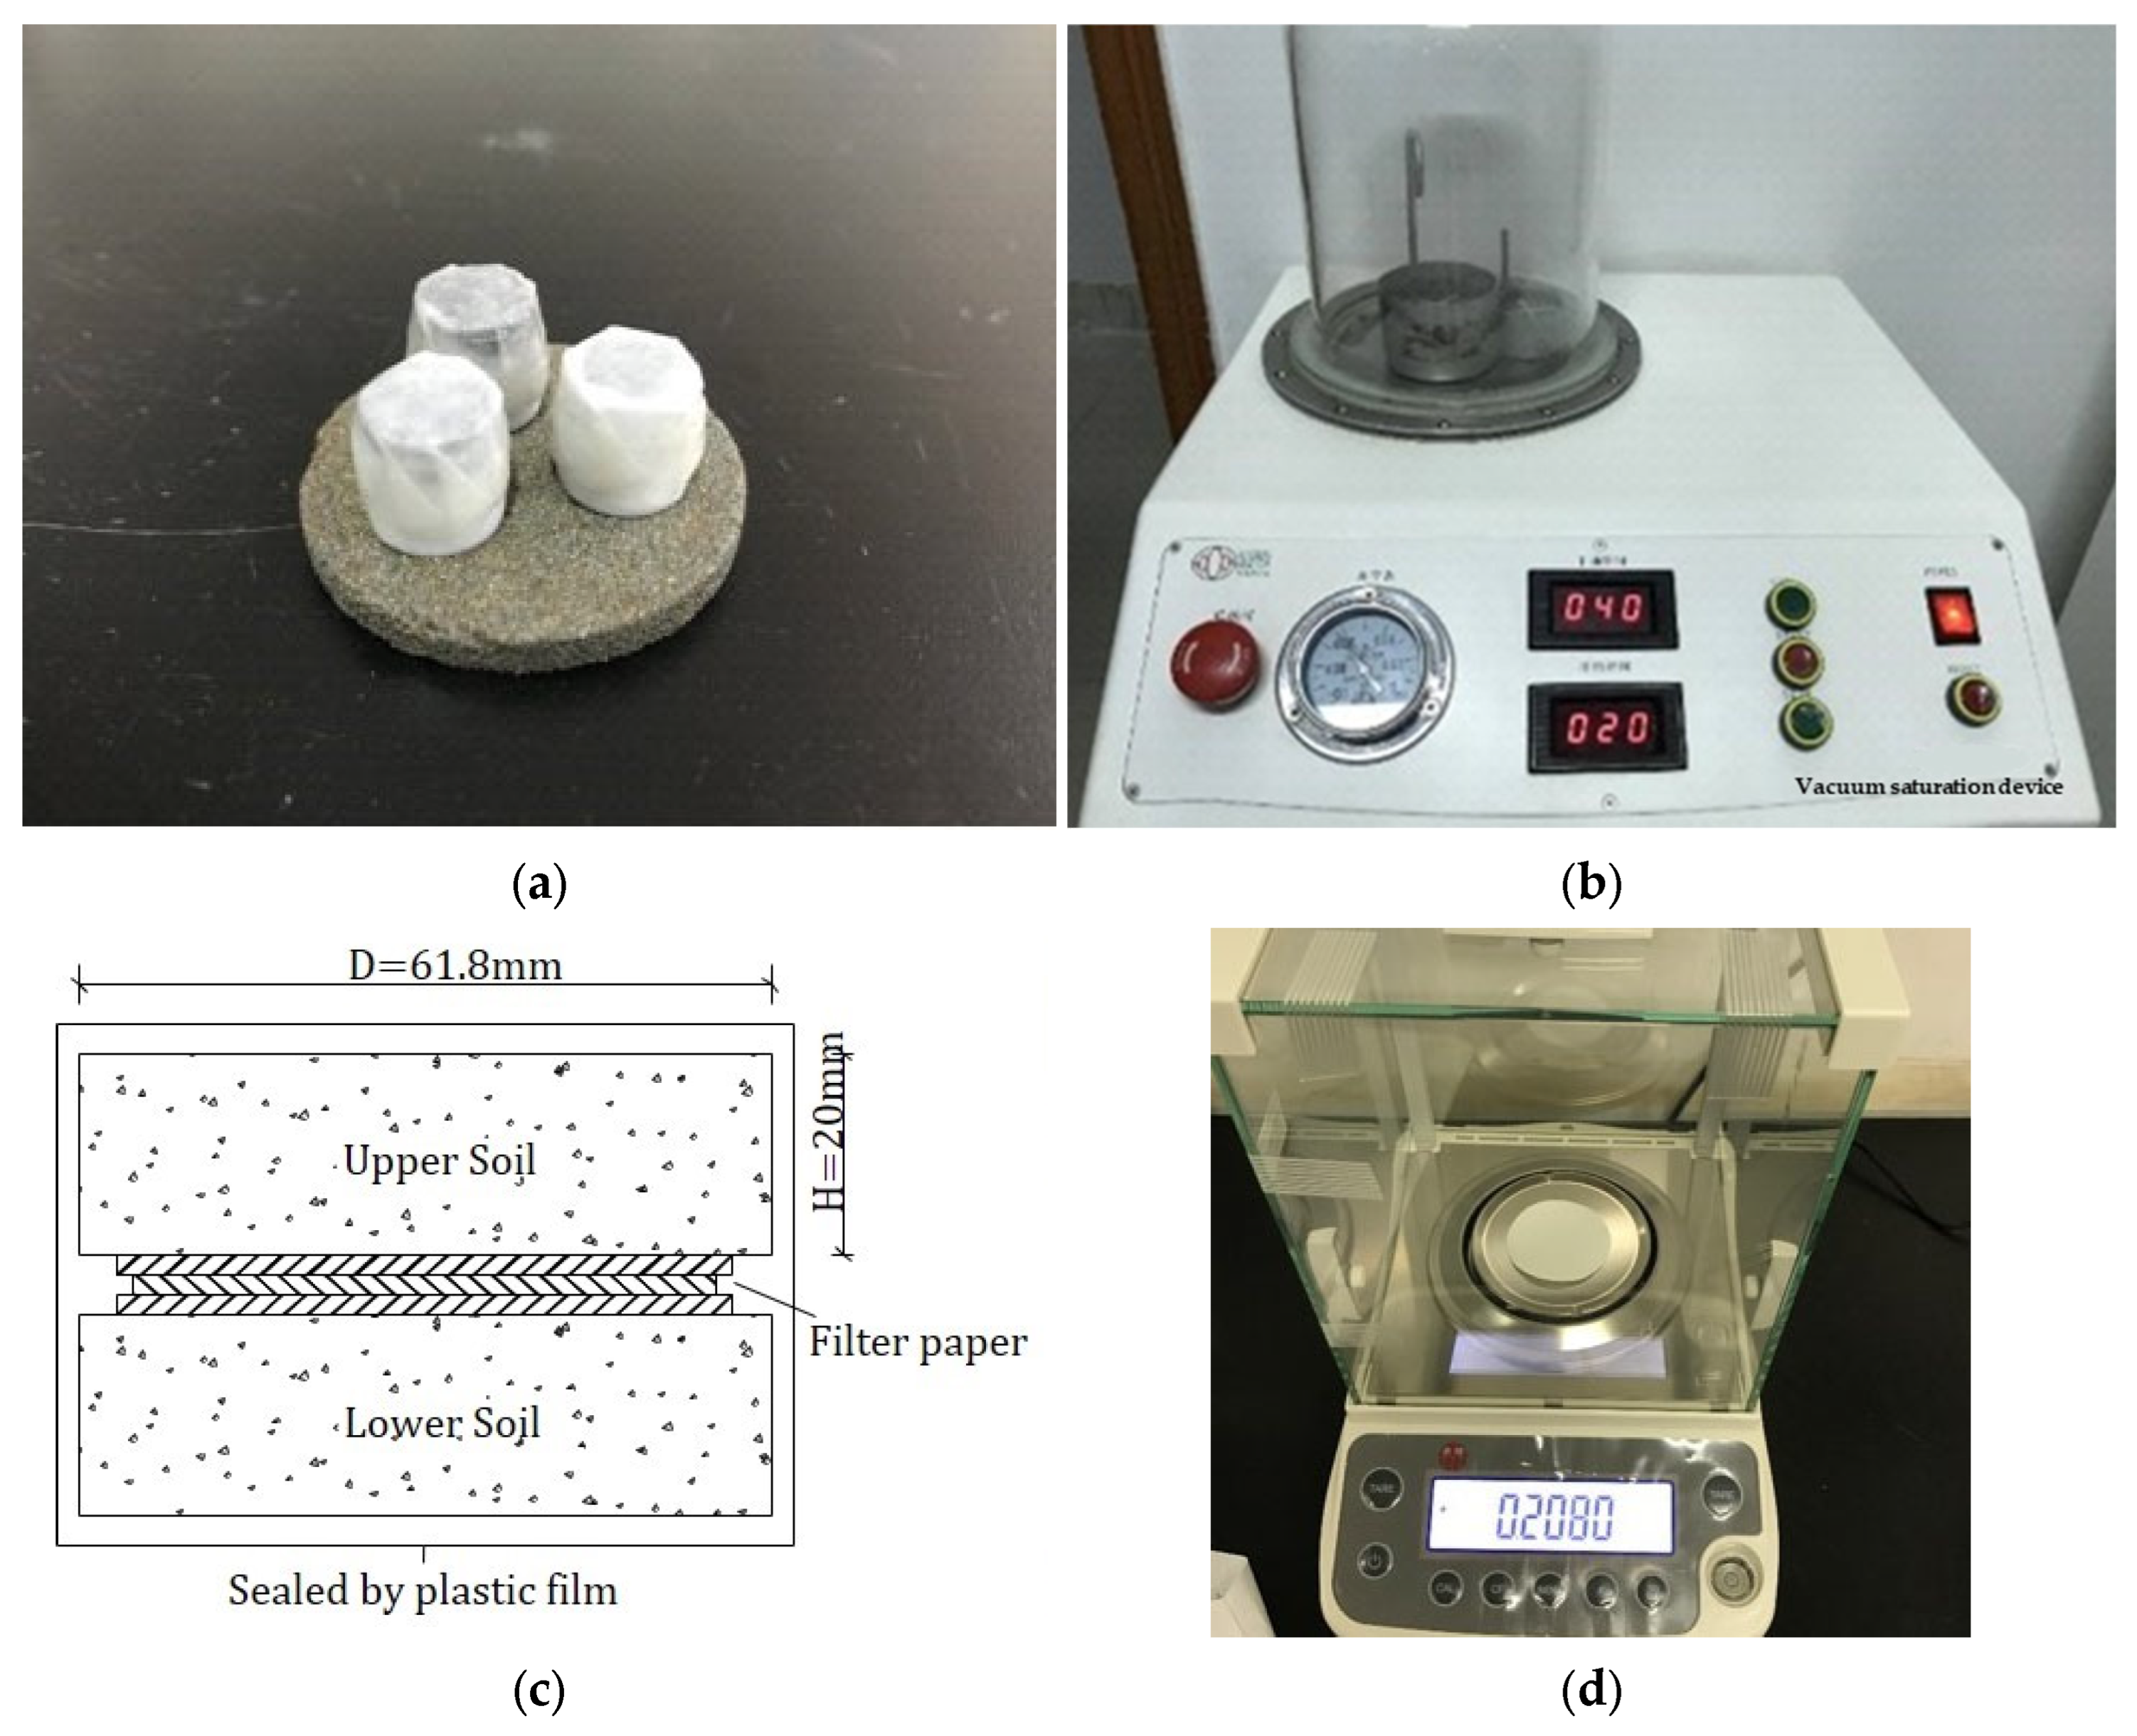
The NMRC12-010V NMR low-temperature pore analyzer (Suzhou Newmark Company, Suzhou, China) is an analytical instrument that can be utilized to test the pore structure of porous materials. The instrument has a magnetic field with a main frequency of 12 MHz and a resonance frequency of 11 MHz. The magnetic field strength of permanent magnet is 0.25 T and the coil diameter is 60 mm. To ensure the uniformity of the main magnetic field in the space where the test sample was located, the temperature of the magnet was set to 32 °C, while the diameter and height of the test sample were 9 mm and 10 mm, respectively. During the experiment, it was important to control the temperature of the test sample. After dehydration and drying, nitrogen was used as the cold medium.
The SWRC experiment of the filter paper method used Whatman No.42 filter paper with a diameter of 55 mm, an aperture of 2.5 μm, a thickness of 200 μm, and an ash powder content of 0.007%. Other test equipment included ➀ electronic balance (accuracy: 0.0001 g), ordinary balance (accuracy: 0.01 g); ➁ oven, with a temperature within 105 ± 5 °C; ➂ several drying aluminum boxes; ➃ thermometer, forceps, rubber gloves, insulating tape, plastic wrap, multi-layer sealing bag, sealing box; ➄ several φ 61.8 mm × 20 mm specifications of the ring knife, scraper.
2.4. Preparation and Procedures
The 15 groups of soil samples were dried in an oven for 24 h with the temperature set to 75 °C. To minimize testing errors resulting from the sample, thirteen samples of each group were created and the experiment was conducted twice on each sample using different groups. After analyzing several experimental results, it was found that maintaining a moisture content of 15% produced the best sample-making effect. Therefore, the dried soil sample was mixed with deionized water to create a sample soil with a 15% moisture content, in accordance with related standard [57]. Additionally, the density of each type of specimen ranged from 1.6 g/cm3 to 1.9 g/cm3.
In the NMR experiment, to ensure the uniform distribution of the constant magnetic field, the RF unit of the NMR machine and the magnet thermostatic system were powered on for 24 h the day before the experiment began. The process of this NMR is shown in Figure 1a,b. The steps include ➀ placing standard samples in the test chamber for a single sampling; ➁ setting the main spectrometer parameters; ➂ using CPMG pulse sequence for data analysis; ➃ inverting the collected signals to obtain the transverse relaxation T2 spectral distribution; ➄ repeating the test of all samples in this experiment. The test procedures of SWRC for the filter paper method refer to ASTM, as shown in Figure 1c,d. The steps include ➀ determining the moisture content gradient; ➁ preparing samples with different moisture content; ➂ estimating the density of soil samples with different moisture content under the saturation to be achieved; ➃ cutting and drying the filter paper; ➄ preparing ring cutter sample and static sample; ➅ measuring the moisture content of the filter paper; ⑦ data processing and matrix suction calculation.
3. Results and Discussions
3.1. NMR Results and Analysis
3.1.1. Test Results of NMR
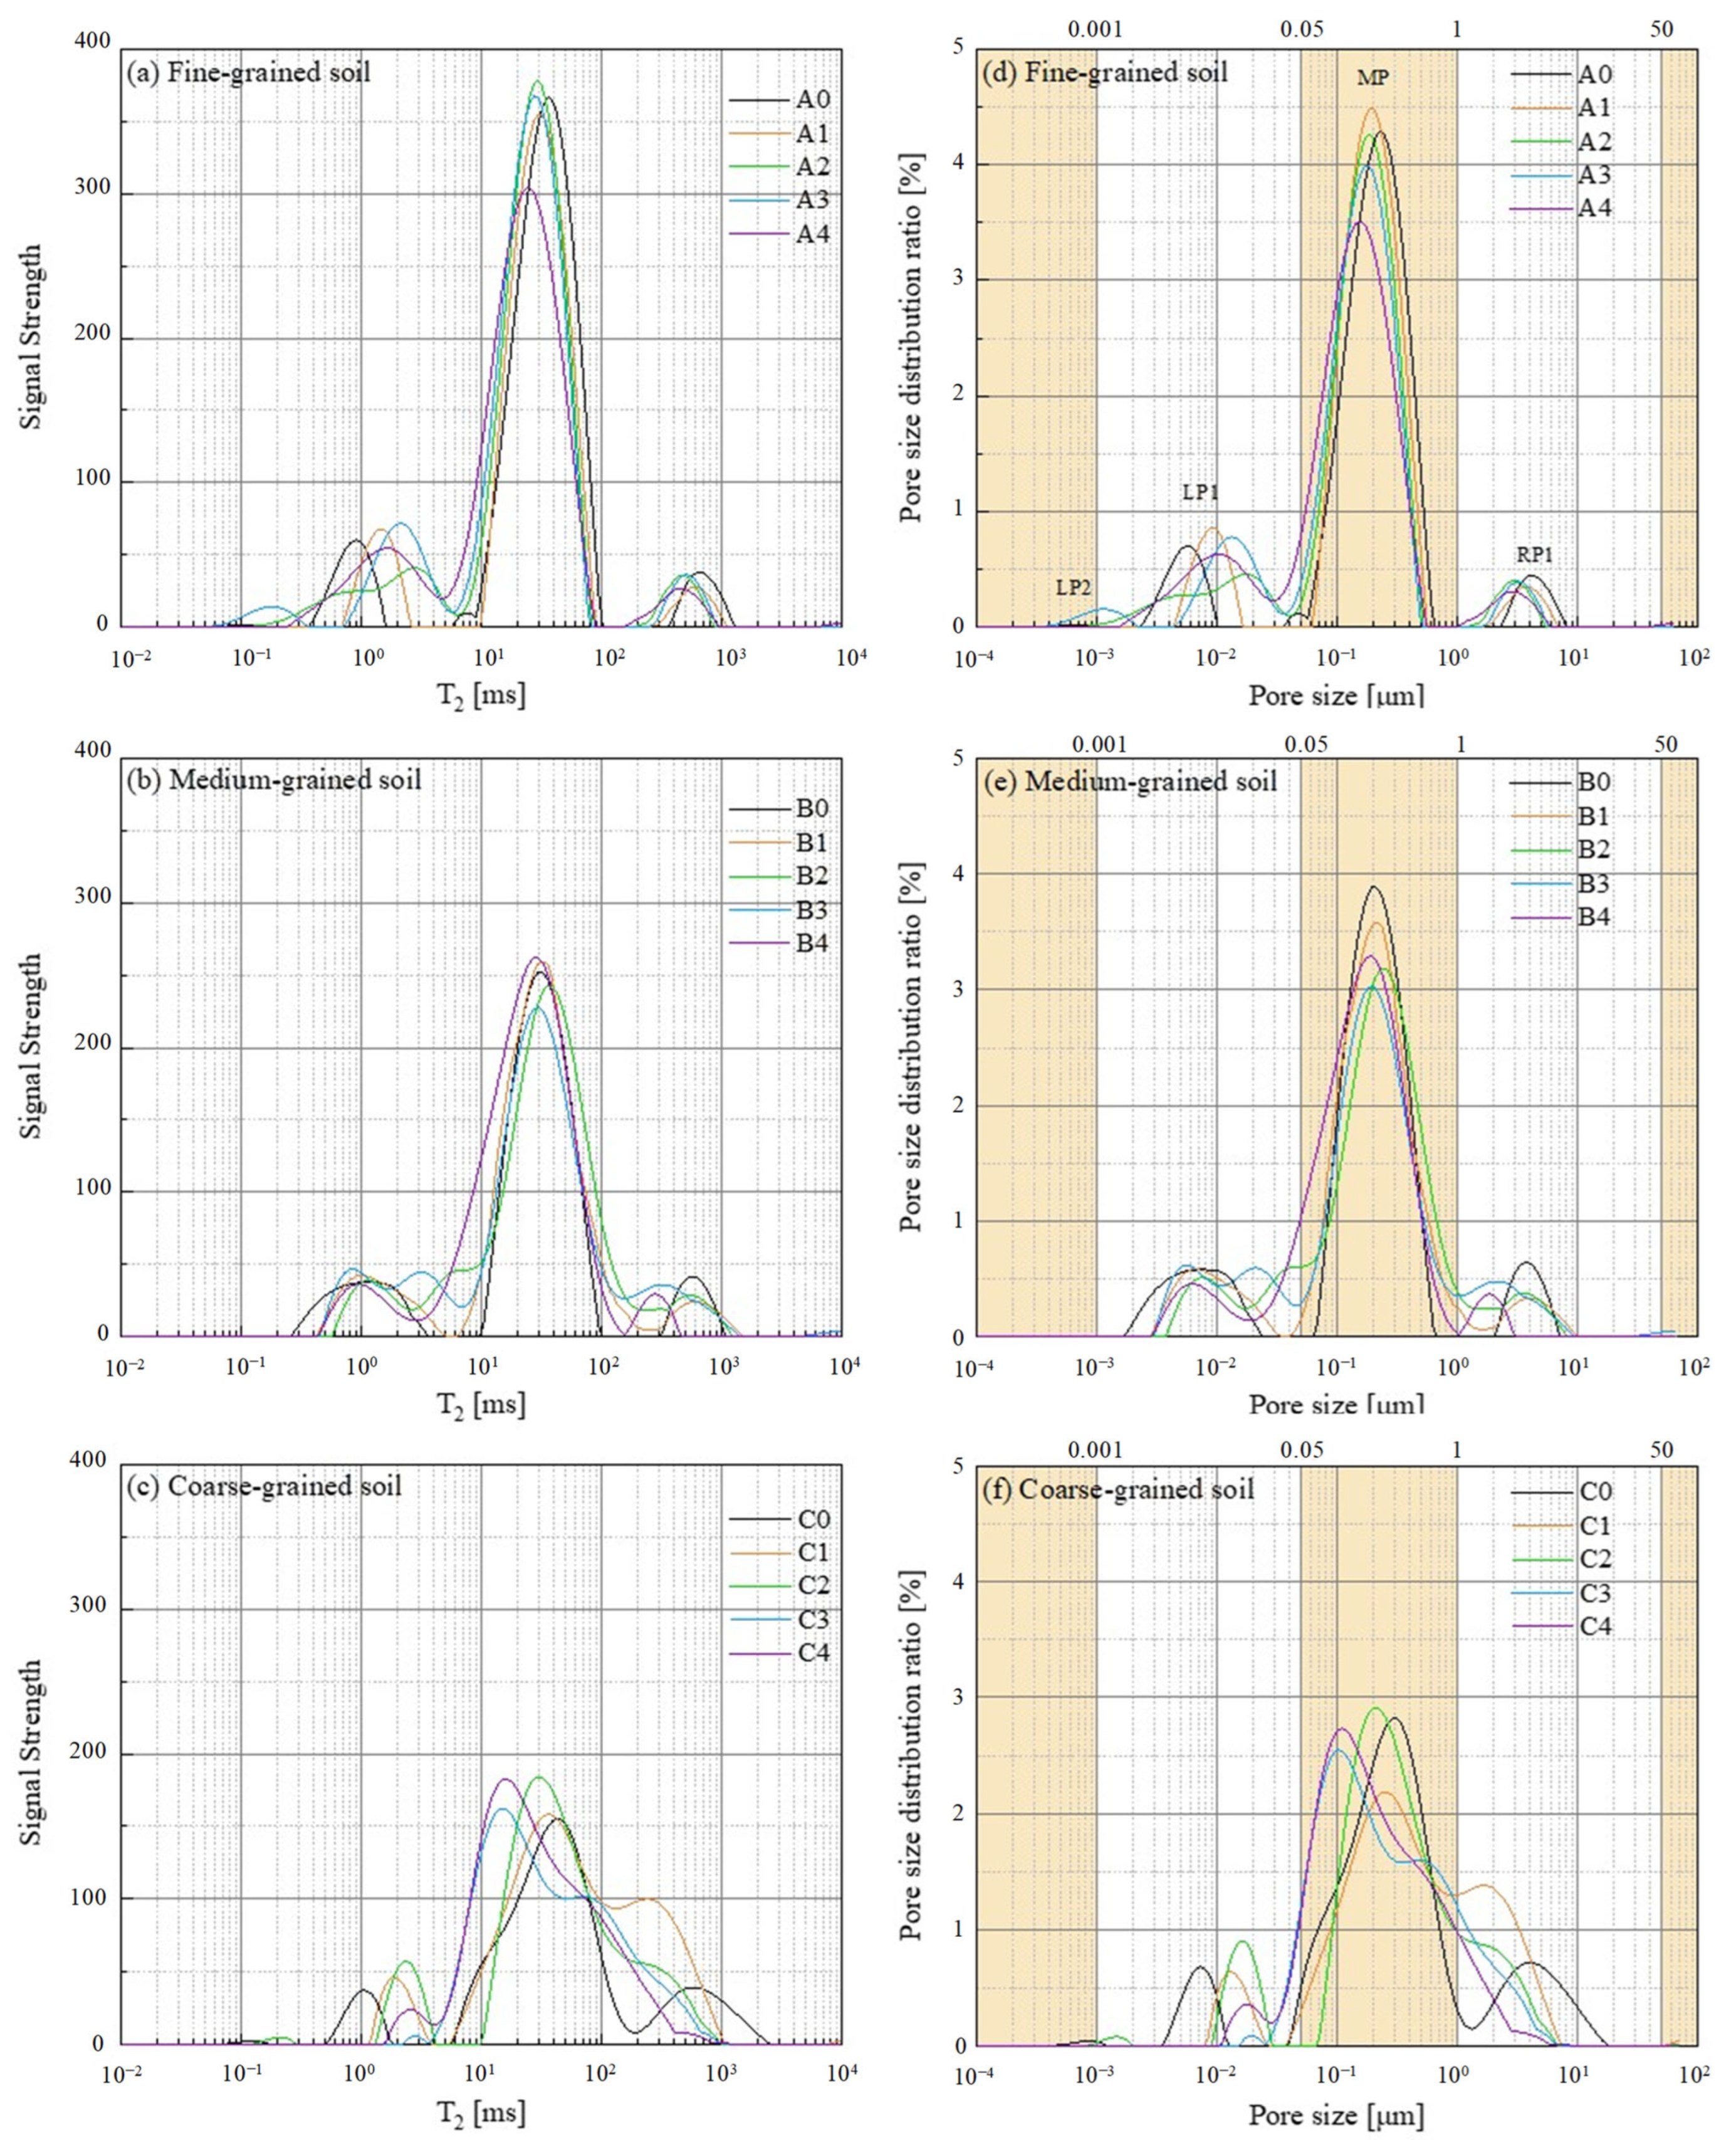
Figure 2a–c shows the NMR T2-signal spectrums of three types of soil with different biochar contents. The x-coordinate T2 represents the pore size and the y-coordinate signal strength represents the pore content corresponding to the pore size. Therefore, NMR T2-signal spectrums of soil samples can be transformed into pore size distribution curves (PSDCs) by Equation (8), as shown in Figure 2d–f.
3.1.2. Pore Size Distribution
The pore size distribution of the fine-grained soils (A0~A4) is depicted in Figure 2d. The following observations can be made: (1) The MP of A1~A4 are slightly shifted to the left compared to MP of A0. While the MP of A1~A3 remains unchanged, the MP of A4 becomes smaller. (2) The LP1 of A1~A4 are slightly shifted to the right compared to the LP1 of A0, and only A3 has LP2. Additionally, the range of LP1 of A4 becomes wider. (3) The RP1 of A1~A4 are shifted to the left compared to RP1 of A0, with the slight range and value changes.
In Figure 2e, the following observations can be made: (1) The MP of B1~B4 shows little difference compared to the MP of B0, but each has a varying degree of decline, with B3 showing the most decrease. (2) The LP1 of B1, B2, and B4 have slightly shifted to the left compared to the LP1 of B0, while the LP of B4 has moved to the right, with LP2 located to the left of the LP1 of B0. (3) The RP1 of B3 and B4 have shifted to the left and decreased in size compared to RP1 of A0. However, RP1 of B1 and B2 decreased almost only vertically.
Furthermore, in Figure 2f, it can be found that: (1) The MP of C1~C4 have shifted to the left compared to MP of C0. Among them, C3 and C4 show large offsets, whereas C2 and C1 have the highest and lowest MP values, respectively. (2) The LP1 of C1~C4 have shifted to the right compared to LP1 of C0. The order of LP1 values is C2 > C1 > C4 > C3, and only C0 and C2 have LP2. (3) The RP1 of C1~C4 have shifted to the left compared to RP1 of C0, but they are connected to their MP with almost no concave.
Although the picture is pretty intuitive, we still aim to quantify as much of this data as possible. Lal and Shukla [58] classified pores with an equivalent cylindrical diameter (ECD) > 50 μm as transmission pores, pores < 0.50 μm as residual + bonding pores, and intermediate pores (0.50~50 μm) as mainly responsible for preventing gravity and water release. On the other hand, Greenland [59] categorized the pores into bonding space (<0.005 μm), residual pores (0.005~0.5 μm), storage pores (0.5~50 μm), transmission pores (50~500 μm), and fissures (>500 μm), which does not seem to align with our results. So here, we reclassify the pores according to the results obtained from PSDCs: ① <0.001 μm; ② 0.001~0.05 μm (micropores); ③ 0.05~1 μm (mesopores); ④ 1~50 μm (macropores); ⑤ >50 μm. The proportion of each type of pores in the total pores is shown in Figure 3.
When biochar is added to fine-grained soil, the proportion of mesopores decreases while micropores increase gradually. Additionally, the addition of biochar causes the porosity of medium-grained soil to change in an S-shape pattern. B1 and B4 have more pores with a diameter of 0.005~0.5 μm, while B2 and B3 have fewer pores than B0. Among them, B3 has the fewest mesopores but the highest number of pores with a diameter of 0.001~0.05 μm and 1~50 μm. Furthermore, macropores of coarse-grained soil appear to be more susceptible to biochar than others. In particular, pores with a diameter of 0.001~0.05 μm and 0.05~1 μm in C1 transform into macropores compared to C0. In contrast to fine-grained soil, the proportion of mesopores in coarse-grained soil is proportional to the biochar content, and the macropores increase gradually.
By combining the results of Figure 2 and Figure 3, it can be seen that the radius and proportion of corresponding mesopores decreased the most when the biochar content reached 8% in the fine-grained soil, 6% in the medium-grained soil, and 2% in the coarse-grained soil. This may be due to the filling effect of small biochar particles on macropores, which reduces the radius of macro and mesopores in coarse-grained soil and macropores in medium-grained soil. Additionally, the use of biochar makes the pore size distribution of soil more uniform and further concentrated to the medium pores. With the increase of biochar content, the micropore radius gradually becomes larger. However, when the biochar content reaches 8% in the fine-grained soil and 6% in the medium-grained soil, the radius of micropores decreases the most. On the other hand, the proportion of micropores with diameters of 0.001~0.05 μm increases significantly.
Biochar can be utilized not only in agricultural soils, but also as an eco-friendly soil conditioner for constructing sponge cities. The permeability of urban soil is critical to achieving soil infiltration, storage, drainage, and other sponge effects. The infiltration characteristics of urban green soil have a direct impact on the seepage process and distribution of seepage fields, which, in turn, affect the process of urban storm-water runoff and its storage mechanism [60]. To address the issue of inadequate water resource management in urban development, altering the pore structure of urban green spaces by increasing their porosity, air permeability, and hydraulic conductivity has been suggested by researchers [61,62,63,64,65]. The presence of hydrophilic clay mineral particles and their relatively small pore radius in urban green soil hinders its sponge effect for infiltration and discharge while increasing its blocking effect on the infiltration of surface water. Biochar, as an inert organic material, has the ability to absorb the viscous mineral cations in the soil. This results in the gathering of small particles in the soil, promoting the formation of soil aggregates, and ultimately increasing the size of small pores in the soil [66,67]. Biochar is produced through the process of pyrolysis, which involves heating organic matter at high temperatures. The process of pyrolysis generates gaseous and liquid substances within biochar, which results in the release of high temperatures, causing the melting of the biochar and the creation of numerous micropores. With an increase in the total biochar content in the soil, the number of small pores in the soil is further augmented, leading to a significant increase in the content of small pores within the soil.
3.2. Soil Water Retention Curve
3.2.1. SWRC from PSD
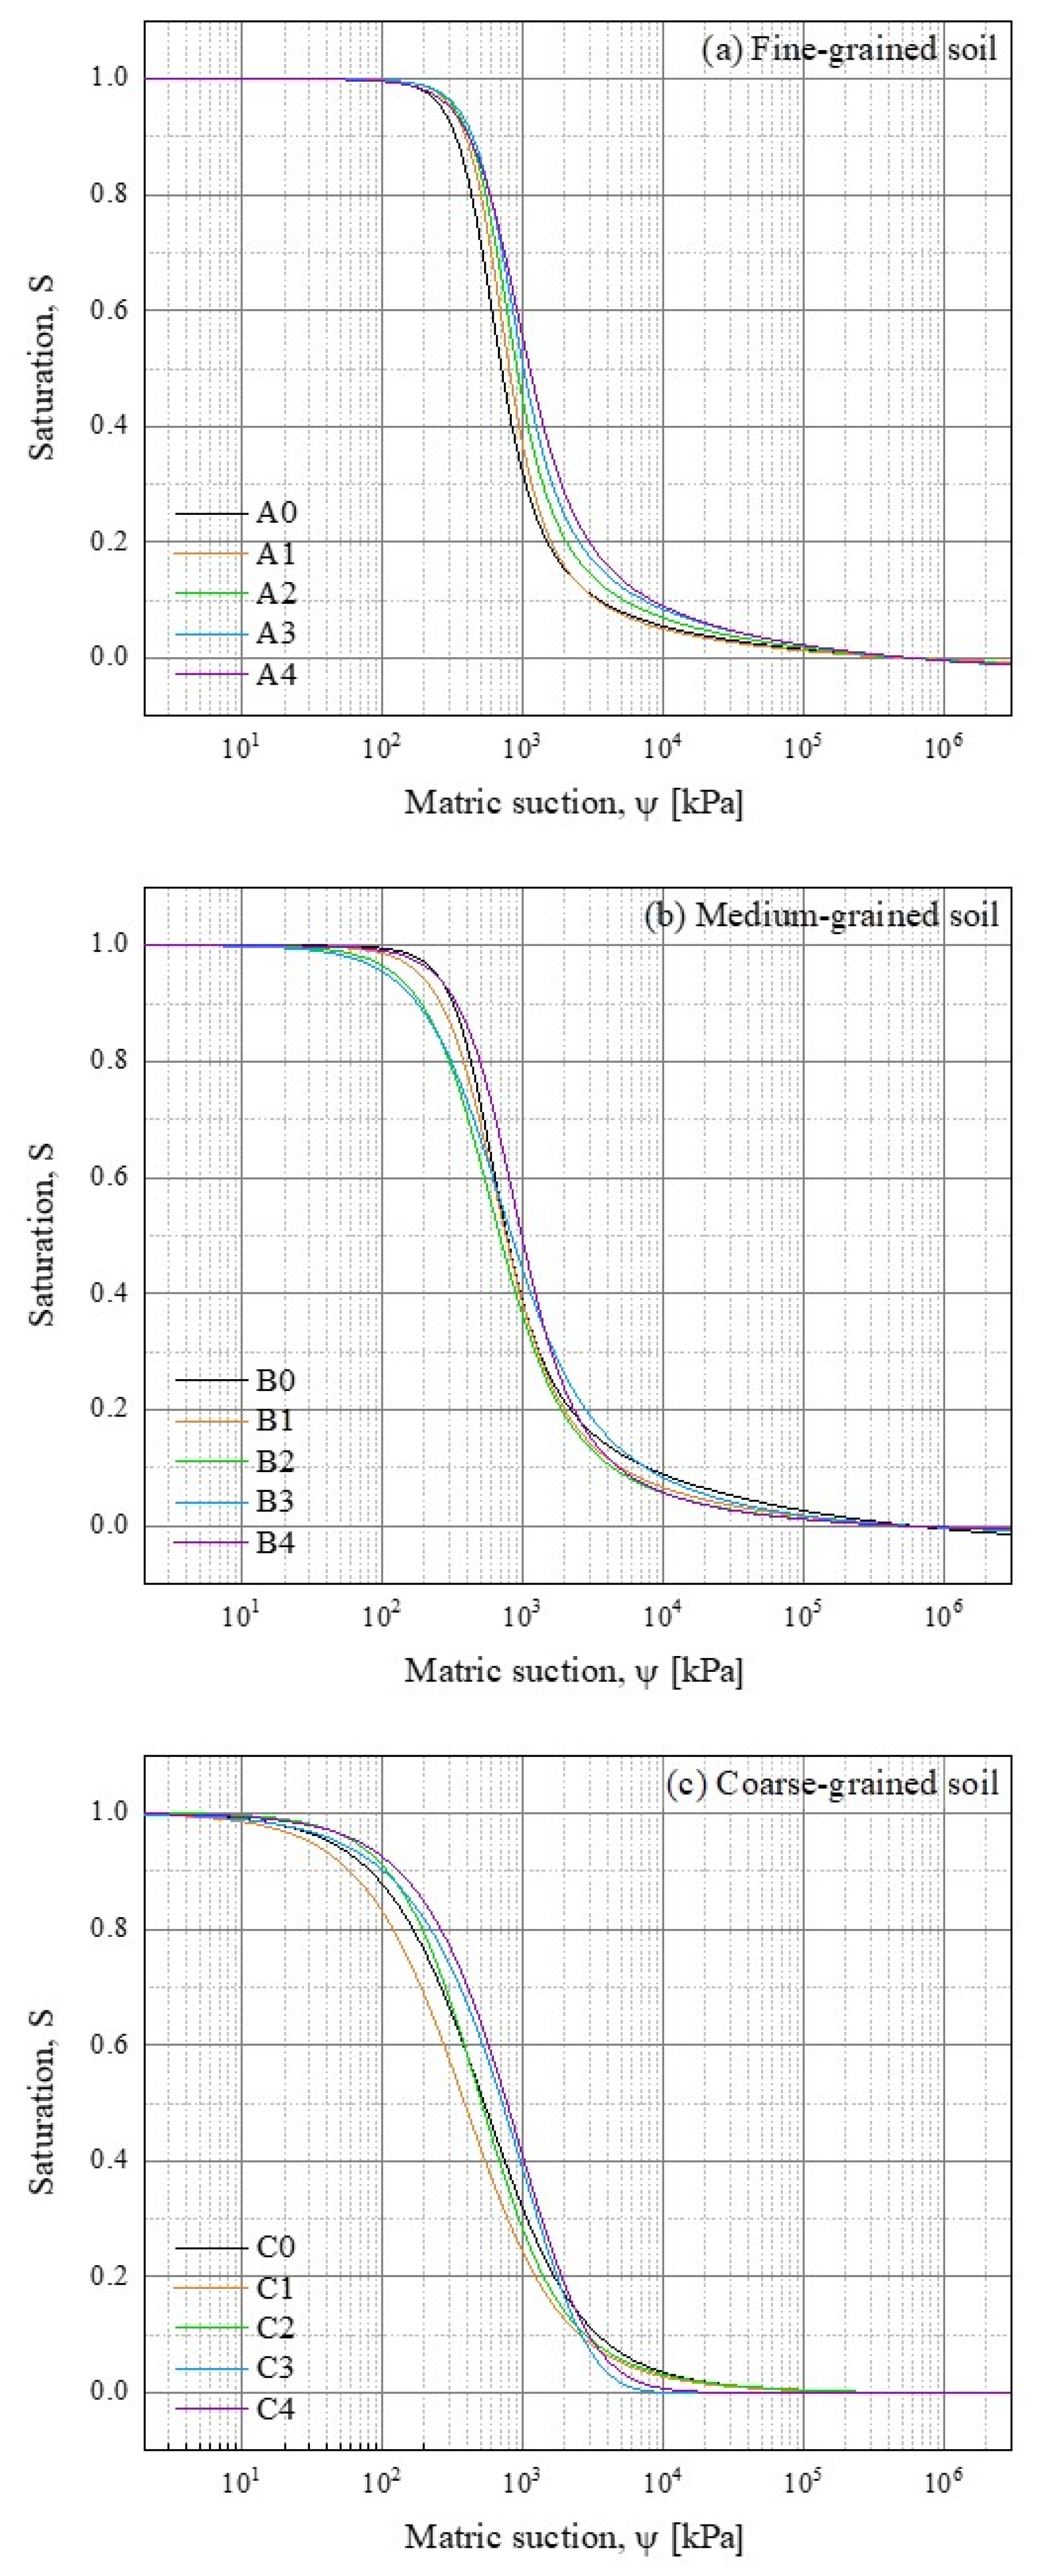
From this study, we have utilized the method proposed by Zhang et al. [68] to obtain the SWRC from PSD data. The Young-Laplace equation (Equation (8)) demonstrates that matric suction can be evaluated based on the pore size of soil, and the water saturation of soil can be used to express the pore distribution within it. Consequently, it is possible to fit the SWRC for each sample based on their pore size distribution using Equation (9), as illustrated in Figure 4. The corresponding fitting parameters are outlined in Table 2.
The impact of an increased biochar content on soil saturation at a specific suction state can be easily observed in Figure 4a, where saturation levels are higher for suction states ranging from 100 kPa to 5 × 10⁵ kPa. In the case of medium-grained remolded soil (Figure 4b), the saturation of B1~B3 is smaller than B0 for suction states where ψ < 600 kPa. Figure 4c shows that the saturation of C3 and C4 is greater than C0 for suctions less than 2000 kPa, displaying lower saturation levels. Furthermore, C4 exhibits higher saturation levels than other samples at the same suction state.
3.2.2. SWRC from Filter Paper Method
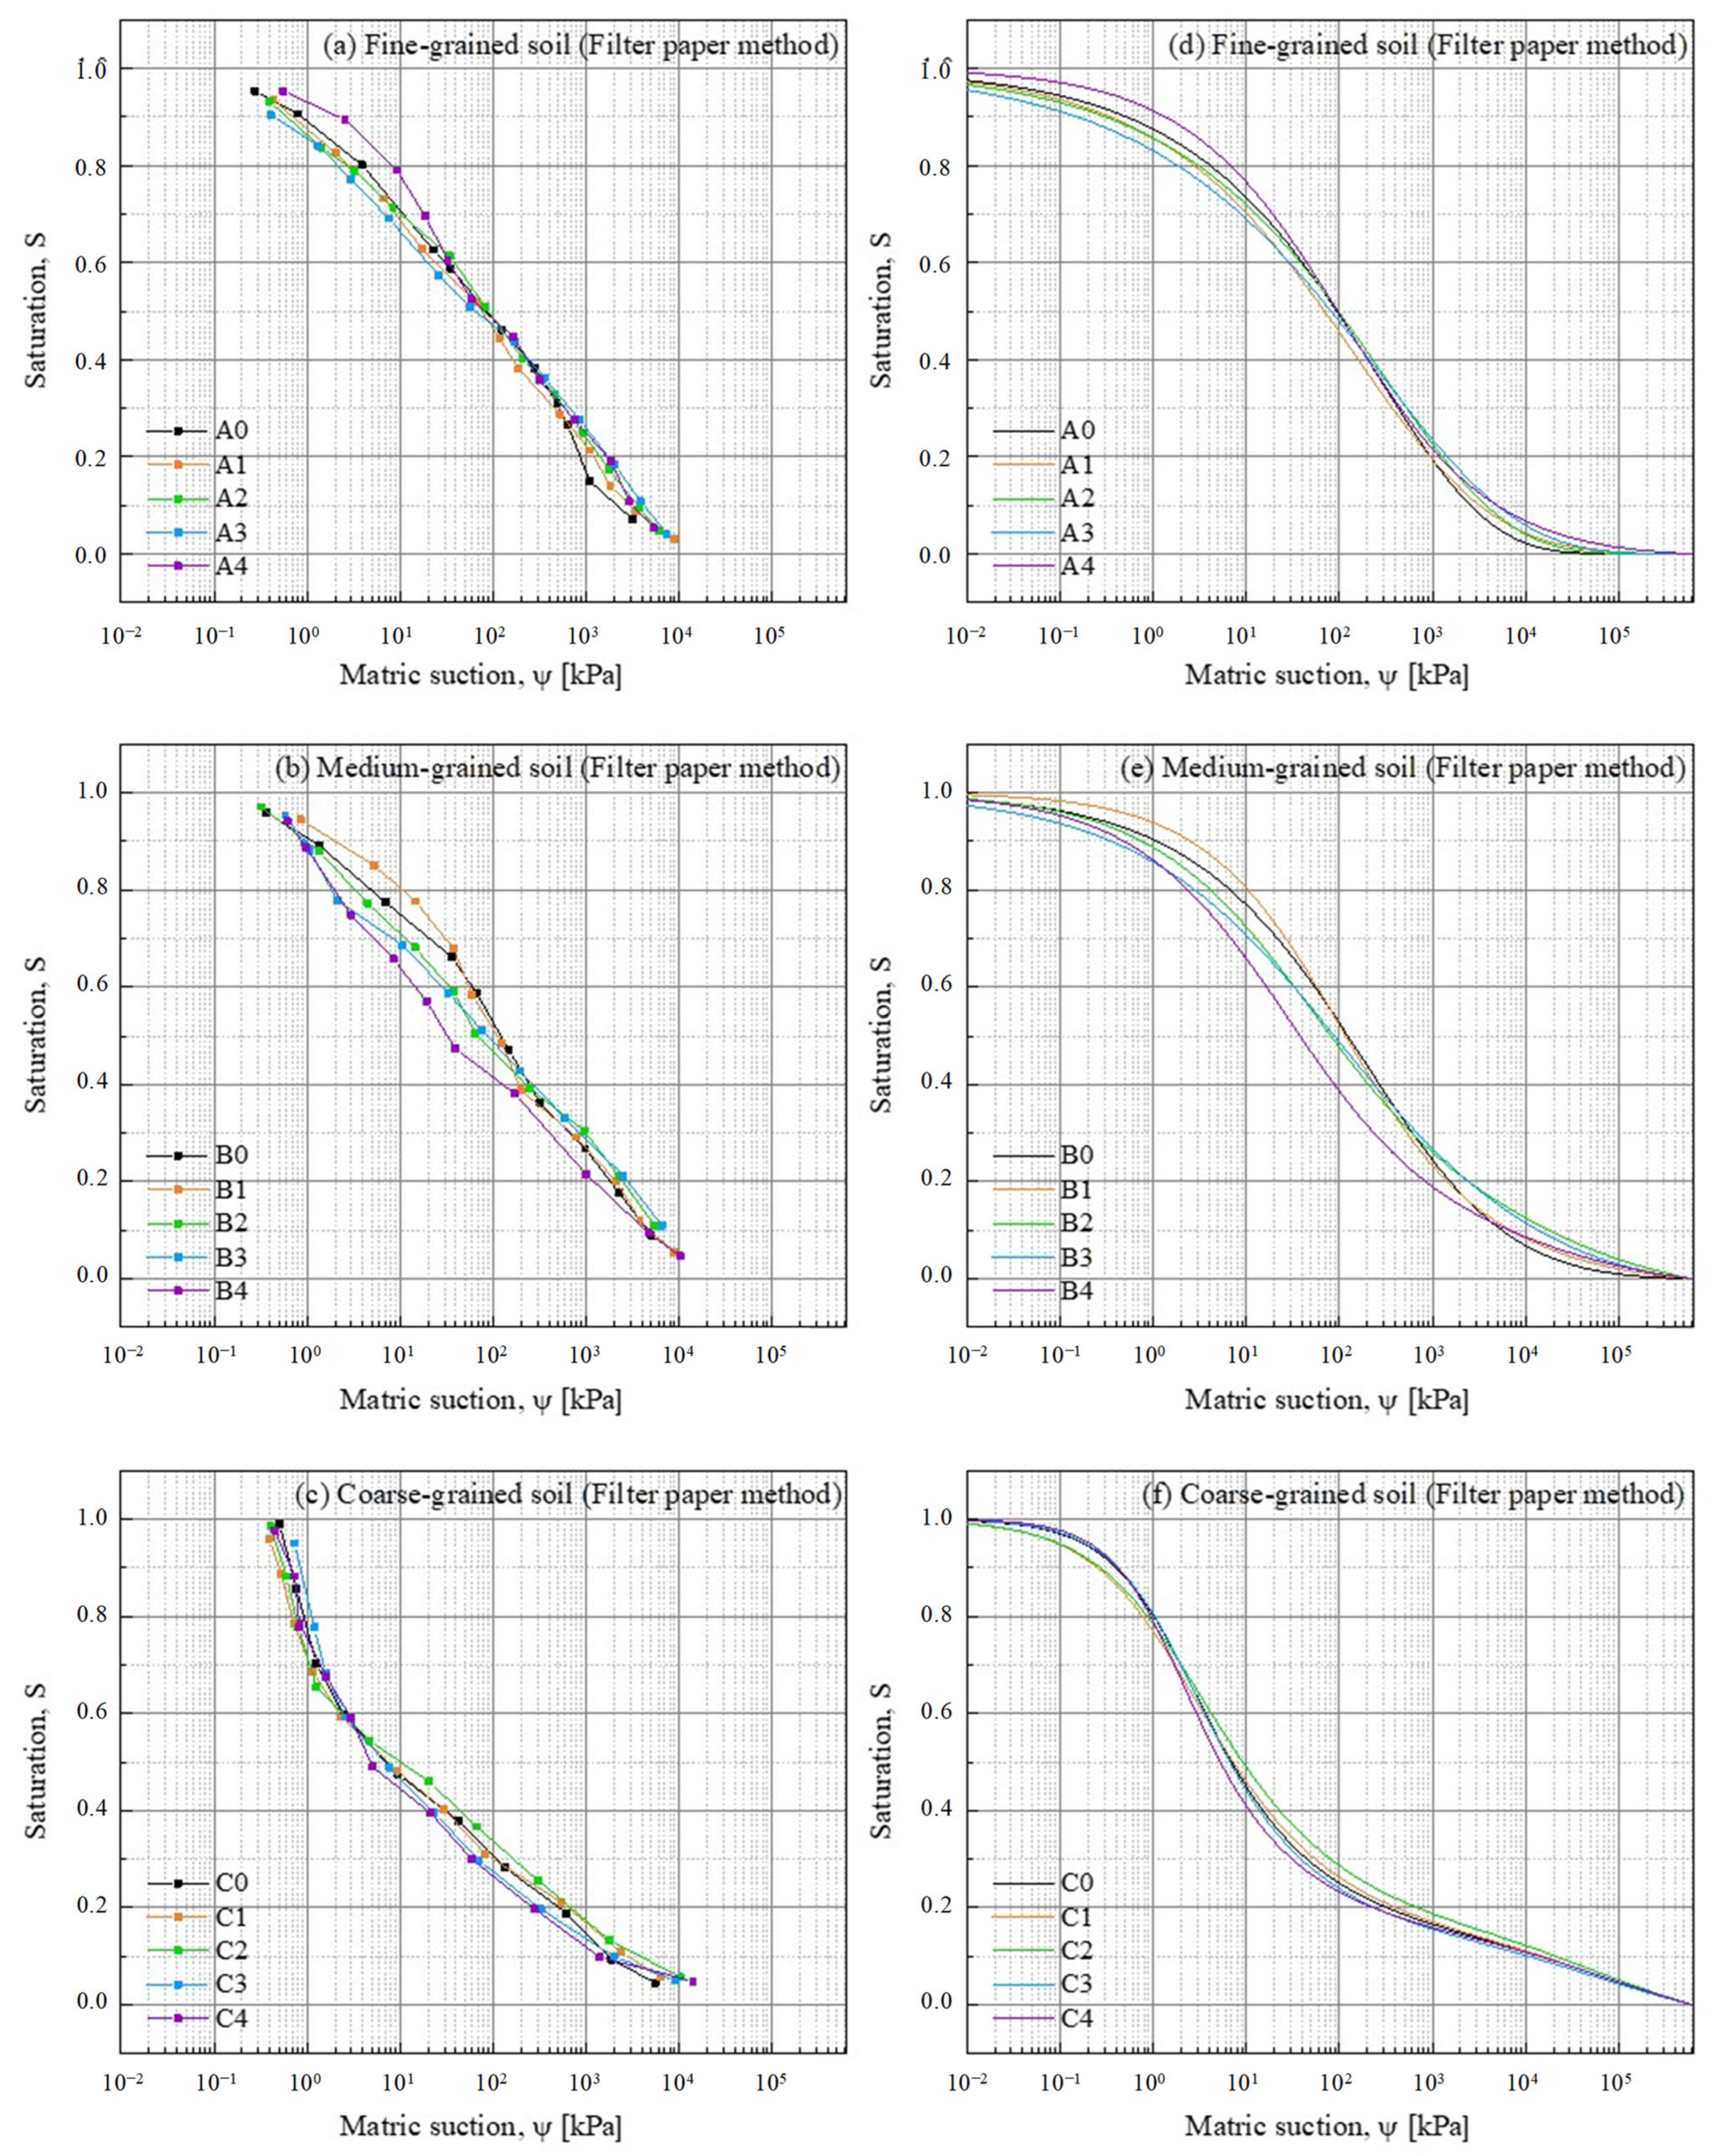
The SWRCs depicted in Figure 4 are indirectly acquired through pore size distribution. To directly obtain SWRCs for the entire suction range, the filter paper method was employed, as depicted in Figure 5, and the corresponding fitting parameters are provided in Table 2.
The results revealed significant differences between soil types. In the case of fine-grained soil, the saturation levels in all biochar-modified soils remained largely consistent when compared to soil without biochar addition for suction states ψ > 50 kPa. However, when ψ > 1000 kPa, the addition of biochar resulted in increased saturation levels. Notably, A4, with the greatest variation in pore size distribution, demonstrated higher saturation levels than A0 across a suction range that spanned from saturation to dryness, as depicted in Figure 5a,d. In Figure 5b,e, when ψ < 100 kPa, the addition of biochar, excluding B1, caused a decrease in saturation medium-grained soil. However, when 8% biochar was added to medium-grained soil, the saturation decreased in the entire suction range while it increased in fine-grained soil. In Figure 5c,f, it was observed that the addition of biochar did not have a significant impact on the saturation of the soil in different suction states. For ψ > 5 kPa, the saturation of C2 is consistently higher than C0. This suggests that applying approximately 4% of biochar to coarse-grained soils could improve their water-holding capacity. It should be noted that the observed trends mentioned above may not be entirely attributed to the addition of biochar, as there is a possibility of errors occurring during the filter paper test due to data fitting or manipulation. Hence, further investigation is necessary to determine the impact of biochar on soil saturation.
3.3. Analysis of Possible Errors in the Test
It is apparent that there are variations between the SWRC obtained through the filter paper method test and the NMR-based calculation, which can be seen in Table 2. The primary cause of these differences stems from certain inaccuracies inherent to both methods.
For the filter paper test, the errors mainly include: ① Uneven distribution of water in soil samples after 2 days of standing, which may occur due to inconsistent spraying of airless water or other objective reasons when using different soils with varying water content; ② Achieving complete sealing of the bag and box can be challenging, thus making it difficult to prevent moisture exchange during the soil and filter paper preparation process. As a result, the moisture content of the soil and filter paper can be subject to change due to air exposure; ③ The middle filter paper with a diameter of 52 mm is susceptible to contamination due to changes in its relative position, which can lead to higher measured moisture content and lower corresponding matric suction levels, particularly in cases of high water content; ④ The filter paper method is an indirect method for determining the suction in soil based on an empirical formula derived from numerous experiments.
In the NMR test, the main errors are: ① the lack of objectivity in determining the value of transverse relaxation coefficient ρ2 for remolded soils in this experiment can be influenced by different mineral types in the samples, leading to variations in ρ2 and some certain errors in the pore size distribution curve calculated by NMR; ② the SWRCs calculated using the NMR technique do not take into account the impact of pore throat and closed pore, resulting in higher water content of samples under low matrix suction conditions.
Furthermore, because the interaction between soil and water is a highly intricate process, variations in the boundary conditions of the same soil result in differences in the distribution of water during both the wetting and drying processes. This ultimately leads to variations in the SWRC curves. However, it is important to note that the SWRC obtained through NMR testing does not consider the impact of this factor, which can also lead to disparities in the results between the two tests.
3.4. Biochar Size, Soil Particle Size, and Soil Texture Classification
The USDA Soil Texture Triangle categorizes soils into 12 groups. When 2.5% and 5% biochar were added, there was a modification of pore size distribution in the sand, resulting in increased moisture retention compared to sandy loam [31]. According to Liu et al. [29], the dominant factor controlling water retention at lower suction in sand (0.251~0.853 mm) was the pores inside the biochar (intra-pores) when biochar with a diameter of 0.251~0.853 mm and 0.853~2.00 mm was added. Conversely, for fine-grained biochar (<0.251 mm) sand mixtures, the pores between biochar and soil particles (inter-pores) played a key role in water retention at higher suction. The number and size of both inter-pore and intra-pore are closely associated with the biochar and soil particle size [69]. Li and Sun [70] added biochar with different particle sizes to soil samples and found that when the biochar particle size was small, an increase in biochar content significantly improved the water-holding properties of soil samples. However, in the case of larger biochar particles, the water-holding properties of soil samples were not significantly affected by the increase in biochar content. It appears that the impact of biochar on soil water retention is linked to soil texture classification. However, the actual correlation lies in the ratio between the size of biochar and soil particles, i.e., the relative size of biochar and soil particles. In this study, biochar particles had a size of 0.1~0.5 mm, which is comparable to sand grain classification. When biochar was added to fine-grained soil with a relatively low sand content (40%), biochar particles created additional water storage pores with the existing soil particles, leading to enhanced water retention capacity in the high-absorption section. However, when biochar was added to coarse-grained soil (80% sand content), the biochar particles functioned more as sand particles rather than performing their intended adsorption function.
To establish the best biochar-to-soil ratio for improving soil quality, it is critical to select biochar size that is compatible with soil particle size and pore size distribution, rather than modifying the biochar content. However, research on this aspect is still lacking in detail.
4. Conclusions
To investigate the effects of biochar on the SWRC, a series of NMR and SWRC experiments were conducted for a wide range of remolded soil, from fine-grained soils to coarse-grained ones, and of different amounts of biochar. The most important observations from the ensuing study are as follows:
(1) Before and after biochar modification, the PSDCs of fine-, medium-, and coarse-grained soil all displayed three peaks. However, with the addition of 6% biochar to the fine- and medium-grained soil, a four-peak distribution pattern emerged in the pore size distribution curve.
(2) Biochar has a large specific surface area and porosity that allows it to adsorb tiny soil particles and form agglomerates. Additionally, its particle size (0.1~0.5 mm) acts similarly to sand particles, resulting in a decrease in mesopores and an increase in micropores in fine-grained soil after application, with fluctuation in the pore size distribution of medium- and coarse-grained soils. Moreover, the radius and percentage of corresponding mesopores decreased significantly when the biochar content reached 8% in fine-grained soils, 6% in medium-grained soils, and 2% in coarse-grained soils.
(3) Under high suction conditions (ψ > 1000 kPa), the addition of biochar had little effect on soil water-holding capacity. Under low suction conditions (ψ < 100 kPa), the addition of 8% biochar to fine-grained soils resulted in greater saturation compared to soils without biochar. However, this promoting effect was limited. The experimental results indicate that biochar had a better water retention amendment effect on medium-grained soils at 2% addition level, whereas, for coarse-grained soils, the effect was not significant.
(4) Biochar has a noticeable impact on soil-water characteristics, which does not follow a simple monotonous increasing or decreasing pattern with the increase of biochar content. Instead, there appears to be an optimal content level. As the effect of biochar content on pore size distribution of three soil types is complicated, it is important to consider the relative size of biochar particles and soil particles. This can be a key factor in determining the optimal biochar-to-soil amendment ratio.
Biochar changes the composition and pore structure of soil, thereby affecting the soil-water characteristics and improving the infiltration, permeability, water-holding, and adsorption of the soil. However, it should be noted that the impact of biochar varies depending on the soil type and the amount of biochar used. This study develops a new insight into expanding applications of biochar in agriculture and forestry, water conservation, and the construction of sponge cities.
Author Contributions
Conceptualization, X.C. and L.L.; methodology, L.L.; software, X.X.; validation, X.C., X.L., H.S. and X.R.; formal analysis, L.L.; investigation, J.K.; resources, X.X.; data curation, X.C.; writing—original draft preparation, X.C.; writing—review and editing, H.S. and X.R. All authors have read and agreed to the published version of the manuscript.
Funding
This research was funded by the National Natural Science Foundation of China, grant number 51708526.
Data Availability Statement
The data presented in this study are available on request from the corresponding author.
Acknowledgments
Support for this research was provided by China University of Geosciences (Wuhan) and the National Natural Science Foundation of China. The Authors are grateful to Qidong Fang for his great discussion, and to the editor and anonymous reviewers for their effort in improving this manuscript.
Conflicts of Interest
The authors declare no conflict of interest.
References
- Lehmann, J.; Joseph, S. Biochar for Environmental Management: Science and Technology; Earthscan: London, UK, 2009. [Google Scholar]
- Busscher, W.J.; Novak, J.M.; Evans, D.E.; Watts, D.W.; Niandou, M.A.S.; Ahmedna, M. Influence of pecan biochar on physical properties of a norfolk loamy sand. Soil Sci. 2010, 175, 10–14. [Google Scholar] [CrossRef]
- Ajayi, A.E.; Holthusen, D.; Horn, R. Changes in microstructural behaviour and hydraulic functions of biochar amended soils. Soil Till. Res. 2016, 155, 166–175. [Google Scholar] [CrossRef]
- Castellini, M.; Giglio, L.; Niedda, M.; Palumbo, A.D.; Ventrella, D. Impact of biochar addition on the physical and hydraulic properties of a clay soil. Soil Till. Res. 2015, 154, 1–13. [Google Scholar] [CrossRef]
- Sohi, S.; Lopez-Capel, E.; Krull, E.; Bol, R. Biochar, Climate Change and Soil: A Review to Guide Future Research; CSIRO Land and Water Science Report 05/09; CSIRO: Marsfield, Australia, 2009; 64p. [Google Scholar]
- Verheijen, F.; Jeffery, S.; Bastos, A.C.; Van Der Velde, M.; Diafas, I. Biochar Application to Soils—A Critical Scientific Review of Effects on Soil Properties, Processes and Functions; European Commission: Luxembourg, 2010. [Google Scholar]
- Assadi-Langroudi, A.; O’Kelly, B.C.; Barreto, D.; Cotecchia, F.; Dicks, H.; Ekinci, A.; Garcia, E.F.; Harbottle, M.; Tagarelli, V.; Jeferson, I.; et al. Recent Advances in Nature-Inspired Solutions for Ground Engineering (NiSE). Int. J. Geosynth. Groun. 2022, 8, 3. [Google Scholar] [CrossRef]
- Martinez, A.; Dejong, J.; Akin, I.; Aleali, A.; Arson, C.; Atkinson, J.; Bandini, P.; Baser, T.; Borela, R.; Boulanger, R.; et al. Bio-inspired geotechnical engineering: Principles, current work, opportunities and challenges. Géotechnique 2022, 72, 687–705. [Google Scholar] [CrossRef]
- Baronti, S.; Alberti, G.; Delle Vedove, G.; Di Gennaro, F.; Fellet, G.; Genesio, L.; Miglietta, F.; Peressotti, A.; Vaccari, F.P. The Biochar option to improve plant yields: First results from some field and pot experiments in Italy. Ital. J. Agron. 2010, 5, 3–12. [Google Scholar] [CrossRef]
- Rondon, M.A.; Lehmann, J.; Ramírez, J.; Hurtado, M. Biological nitrogen fixation by common beans (Phaseolus vulgaris L.) increases with bio-char additions. Biol. Fert. Soils. 2007, 43, 699–708. [Google Scholar] [CrossRef]
- Uzoma, K.C.; Inoue, M.; Andry, H.; Fujimaki, H.; Zahoor, A.; Nishihara, E. Effect of cow manure biochar on maize productivity under sandy soil condition. Soil Use Manag. 2011, 27, 205–212. [Google Scholar] [CrossRef]
- Hossain, M.K.; Strezov, V.; Chan, K.Y.; Nelson, P.F. Agronomic properties of wastewater sludge biochar and bioavailability of metals in production of cherry tomato (Lycopersicon esculentum). Chemosphere 2010, 78, 1167–1171. [Google Scholar] [CrossRef]
- Karhu, K.; Mattila, T.; Bergstrm, I.; Regina, K. Biochar Addition to Agricultural Soil Increased CH4 Uptake and Water Holding Capacity—Results from a Short-Term Pilot Field Study. Agric. Ecosyst. Environ. 2011, 140, 309–313. [Google Scholar] [CrossRef]
- Solaiman, Z.M.; Murphy, D.V.; Abbott, L.K. Biochars influence seed germination and early growth of seedlings. Plant Soil 2012, 353, 273–287. [Google Scholar] [CrossRef]
- Yuan, J.H.; Xu, R.K. The amelioration effects of low temperature biochar generated from nine crop residues on an acidic Ultisol. Soil Use Manag. 2011, 27, 110–115. [Google Scholar] [CrossRef]
- Yuan, J.H.; Xu, R.K.; Wang, N.; Li, J.Y. Amendment of Acid Soils with Crop Residues and Biochars. Pedosphere 2011, 21, 302–308. [Google Scholar] [CrossRef]
- Peng, X.; Ye, L.L.; Wang, C.H.; Zhou, H.; Sun, B. Temperature- and duration-dependent rice straw-derived biochar: Characteristics and its effects on soil properties of an Ultisol in southern China. Soil Till. Res. 2011, 112, 159–166. [Google Scholar] [CrossRef]
- Graber, E.R.; Tsechansky, L.; Lew, B.; Cohen, E. Reducing capacity of water extracts of biochars and their solubilization of soil Mn and Fe. Eur. J. Soil Sci. 2014, 65, 162–172. [Google Scholar] [CrossRef]
- Zhou, J.B.; Deng, C.J.; Chen, J.L.; Zhang, Q.S. The remediation effect of cotton stalk carbon on cadmium polluted soil. Ecol. Environ. 2008, 17, 1857–1860. [Google Scholar]
- Chui, L.Q. Experimental Study on Inhibition of Cd/Pb Uptake by Biochar in Contaminated Soils by Rice and Wheat. Ph.D. Thesis, Nanjing Agricultural University, Nanjing, China.
- Yu, X.Y.; Ying, G.G.; Kookana, R.S. Reduced plant uptake of pesticides with biochar additions to soil. Chemosphere 2009, 76, 665–671. [Google Scholar] [CrossRef]
- Głąb, T.; Palmowska, J.; Zaleski, T.; Gondek, K. Effect of biochar application on soil hydrological properties and physical quality of sandy soil. Geoderma 2016, 281, 11–20. [Google Scholar] [CrossRef]
- Hussain, R.; Ravi, K.; Garg, A. Influence of biochar on the soil water retention characteristics (SWRC): Potential application in geotechnical engineering structures. Soil Till. Res. 2020, 204, 104713. [Google Scholar] [CrossRef]
- Saffari, N.; Hajabbasi, M.A.; Shirani, H.; Mosaddeghi, M.R.; Owens, G. Influence of corn residue biochar on water retention and penetration resistance in a calcareous sandy loam soil. Geoderma 2021, 383, 114734. [Google Scholar] [CrossRef]
- Głąb, T.; Żabiński, A.; Sadowska, U.; Gondek, K.; Kopeć, M.; Mierzwa-Hersztek, M.; Tabor, S.; Stanek-Tarkowska, J. Fertilization effects of compost produced from maize, sewage sludge and biochar on soil water retention and chemical properties. Soil Till. Res. 2020, 197, 104493. [Google Scholar] [CrossRef]
- Wang, Y.; Jin, M.; Deng, Z. A mathematically continuous model for describing the hydraulic properties of unsaturated porous media over the entire range of matric suctions. Water Resour. Res. 2018, 54, 6860–6876. [Google Scholar] [CrossRef]
- Hussain, R.; Ghosh, K.K.; Ravi, K. Influence of biochar particle size on the hydraulic conductivity of two different compacted engineered soils. Biomass Convers. Bior. 2021, 13, 801–811. [Google Scholar] [CrossRef]
- Wong, J.T.F.; Chen, Z.; Chen, X.; Ng, C.W.W.; Wong, M.H. Soil-water retention behavior of compacted biochar-amended clay: A novel landfill final cover material. J. Soil Sediment. 2017, 17, 590–598. [Google Scholar] [CrossRef]
- Liu, Z.; Dugan, B.; Masiello, C.A.; Gonnermann, H.M. Biochar particle size, shape, and porosity act together to influence soil water properties. PLoS ONE 2017, 12, e0179079. [Google Scholar] [CrossRef]
- Carvalho, M.L.; de Moraes, M.T.; Cerri, C.E.P.; Cherubin, M.R. Biochar amendment enhances water retention in a tropical sandy soil. Agriculture 2020, 10, 62. [Google Scholar] [CrossRef]
- Villagra-Mendoza, K.; Horn, R. Effect of biochar addition on hydraulic functions of two textural soils. Geoderma 2018, 326, 88–95. [Google Scholar] [CrossRef]
- Obour, P.B.; Danso, E.O.; Pouladi, N.; Abenney-Mickson, S.; Sabi, E.B.; Monnie, F.; Arthur, E. Soil structure characteristics, functional properties and consistency limits response to corn cob biochar particle size and application rates in a 36-month pot experiment. Soil Res. 2020, 58, 488–497. [Google Scholar] [CrossRef]
- Jeffery, S.; Meinders, M.B.J.; Stoof, C.R.; Bezemer, T.M.; van de Voorde, T.F.J.; Mommer, L.; van Groenigen, J.W. Biochar application does not improve the soil hydrological function of a sandy soil. Geoderma 2015, 251–252, 47–54. [Google Scholar] [CrossRef]
- Suliman, W.; Harsh, J.B.; Abu-Lail, N.I.; Fortuna, A.M.; Dallmeyer, I.; Garcia-Pérez, M. The role of biochar porosity and surface functionality in augmenting hydrologic properties of a sandy soil. Sci. Total Environ. 2017, 574, 139–147. [Google Scholar] [CrossRef]
- Hardie, M.; Clothier, B.; Bound, S.; Oliver, G.; Close, D. Does biochar influence soil physical properties and soil water availability? Plant Soil 2014, 376, 347–361. [Google Scholar] [CrossRef]
- Blume, H.-P.; Brümmer, G.W.; Fleige, H.; Horn, R.; Kandeler, E.; Kögel-Knabner, I.; Kretzschmar, R.; Stahr, K.; Wilke, B.-M. Scheffer/Schachtschabel Soil Science; Springer: Heidelberg, Germany, 2016. [Google Scholar] [CrossRef]
- Schaumann, G.E.; Bertmer, M. Soil-water interactions. In NMR Spectroscopy: A Versatile Tool for Environmental Research; Simpson, M.J., Simpson, A.J., Eds.; John Wiley & Sons, Ltd.: Chichester, UK, 2014; pp. 291–303. [Google Scholar]
- Sleutel, S.; Cnudde, V.; Masschaele, B.; Vlassenbroek, J.; Dierick, M.; Van Hoorebeke, L.; Jacobs, P.; De Neve, S. Comparison of different nano- and micro-focus X-ray computed tomography set-ups for the visualization of the soil microstructure and soil organic matter. Comput. Geosci. 2008, 34, 931–938. [Google Scholar] [CrossRef]
- Tian, H.; Wei, C.; Wei, H.; Yan, R.; Chen, P. An NMR-Based Analysis of Soil-Water Characteristics. Appl. Magn. Reson. 2014, 45, 49–61. [Google Scholar] [CrossRef]
- Bird, N.R.A.; Preston, A.R.; Randall, E.W.; Whalley, W.R.; Whitmore, A.P. Measurement of the size distribution of water-filled pores at different matric potentials by stray field nuclear magnetic resonance. Eur. J. Soil Sci. 2005, 56, 135–143. [Google Scholar] [CrossRef]
- Jaeger, F.; Bowe, S.; Van As, H.; Schaumann, G.E. Evaluation of 1H NMR relaxometry for the assessment of pore-size distribution in soil samples. Eur. J. Soil Sci. 2009, 60, 1052–1064. [Google Scholar] [CrossRef]
- Meyer, M.; Buchmann, C.; Schaumann, G.E. Determination of quantitative pore-size distribution of soils with 1 H NMR relaxometry. Eur. J. Soil Sci. 2018, 69, 393–406. [Google Scholar] [CrossRef]
- Barrie, P.J. Characterization of porous media using NMR methods. Annu. Rep. NMR Spectrosc. 2000, 41, 265–316. [Google Scholar]
- Dunn, K.-J.; Bergman, D.J.; Latorraca, G.A. Handbook of Geographical Exploration-Seismic Exploration: Nuclear Magnetic Resonance-Petrophysical and Logging Applications; Pergamon Press: Oxford, UK, 2002. [Google Scholar]
- Jaeger, F.; Rudolph, N.; Lang, F.; Schaumann, G.E. Effects of soil solution’s constituents on proton NMR relaxometry of soil samples. Soil Sci. Soc. Am. J. 2008, 72, 1694–1707. [Google Scholar] [CrossRef]
- Keating, K.; Knight, R. A laboratory study to determine the effect of iron oxides on proton NMR measurements. Geophysics 2007, 72, 27–32. [Google Scholar] [CrossRef]
- Coates, G.; Xiao, L.; Prammer, M. NMR Logging: Principles and Applications; Haliburton Energy Services 1999; Gulf Professional Publishing: Houston, TX, USA, 2011; p. 234. [Google Scholar]
- Saidian, M.; Prasad, M. Effect of mineralogy on nuclear magnetic resonance surface relativity: A case study of middle Bakken and Three Forks formations. Fuel 2015, 161, 197–206. [Google Scholar] [CrossRef]
- Godefroy, S.; Korb, J.P.; Fleury, M.; Bryant, R.G. Surface nuclear magnetic relaxation and dynamics of water and oil in macroporous media. Phys. Rev. E Stat. Nonlin. Soft Matter Phys. 2001, 64, 021605/01–021605/13. [Google Scholar] [CrossRef] [PubMed]
- Matteson, A.; Tomanic, J.P.; Herron, M.M.; Allen, D.F.; Kenyon, W.E. NMR relaxation of clay/brine mixtures. SPE Reserv. Eval. Eng. 2000, 3, 602–603. [Google Scholar] [CrossRef]
- Fredlund, D.G.; Xing, A.; Fredlund, M.D.; Barbour, S.L. The relationship of the unsaturated soil shear to the soil-water characteristic curve. Can. Geotech. J. 1996, 33, 440–448. [Google Scholar] [CrossRef]
- Mualem, Y. A new model for predicting the hydraulic conductivity of unsaturated porous media. Water Resour. Res. 1976, 12, 513–522. [Google Scholar] [CrossRef]
- Van Genuchten, M.T. A Closed-form Equation for Predicting the Hydraulic Conductivity of Unsaturated Soils. Soil Sci. Soc. Am. J. 1980, 44, 892–898. [Google Scholar] [CrossRef]
- Fredlund, D.G.; Xing, A. Equations for the soil-water characteristic curve. Can. Geotech. J. 1994, 31, 521–532. [Google Scholar] [CrossRef]
- Ren, X.; Hong, N.; Li, L.; Kang, J.; Li, J. Effect of infiltration rate changes in urban soils on stormwater runoff process. Geoderma 2020, 363, 114158. [Google Scholar] [CrossRef]
- Wang, D.Y.; Li, C.Y.; Parikh, S.J.; Scow, K.M. Impact of biochar on water retention of two agricultural soils—A multi-scale analysis. Geoderma 2019, 340, 185–191. [Google Scholar] [CrossRef]
- GB/T 50123-2019; Standard for Geotechnical Testing Method. Ministry of Water Resources of the People’s Republic of China: Beijing, China, 2019; pp. 9–10.
- Lal, R.; Shukla, M.K. Principles of Soil Physics; CRC Press: New York, NY, USA, 2004. [Google Scholar]
- Greenland, D.J. Soil management and soil degradation. Eur. J. Soil Sci. 1981, 32, 301–322. [Google Scholar] [CrossRef]
- Ren, X.; Kang, J.; Ren, J.; Chen, X.; Zhang, M. A method for estimating soil water characteristic curve with limited experimental data. Geoderma 2020, 360, 114013. [Google Scholar] [CrossRef]
- Chen, Q.Y.; Yu, H.J.; Gao, X.R.; An, T.L.; Wang, Y.B.; Sun, M. Attribution analysis and Countermeasures of urban waterlogging in China. J. North China Univ. Water Resour. Electr. Power (Nat. Sci. Ed.) 2019, 40, 59–67. [Google Scholar]
- Li, M.; Sun, W. Water-holding characteristics of clay mixed with biochar and mechanism of its influence. Rock Soil Mech. 2019, 40, 4722–4730. [Google Scholar]
- Ren, X.W.; Zhao, Y.; Deng, Q.L.; Kang, J.Y.; Li, D.X.; Wang, D.B. A relation of hydraulic conductivity—Void ratio for soils based on Kozeny-Carman equation. Eng. Geol. 2016, 213, 89–97. [Google Scholar] [CrossRef]
- Ren, X.W.; Santamarina, J.C. The hydraulic conductivity of sediments: A pore size perspective. Eng. Geol. 2018, 233, 48–54. [Google Scholar] [CrossRef]
- Wu, H.B.; Fang, H.L. Soil infiltration of green space and its importance to urban ecological security. Chin. J. Ecol. 2015, 034, 894–900. [Google Scholar]
- Islam, M.U.; Jiang, F.; Guo, Z.; Peng, X. Does biochar application improve soil aggregation? A meta-analysis. Soil Till. Res. 2021, 209, 104926. [Google Scholar] [CrossRef]
- Pituello, C.; Dal Ferro, N.; Francioso, O.; Simonetti, G.; Berti, A.; Piccoli, I.; Pisi, A.; Morari, F. Effects of biochar on the dynamics of aggregate stability in clay and sandy loam soils. Eur. J. Soil Sci. 2018, 69, 827–842. [Google Scholar] [CrossRef]
- Zhang, L.M.; Li, X. Microporosity Structure of Coarse Granular Soils. J. Geotech. Geoenviron. Eng. 2010, 136, 1425–1436. [Google Scholar] [CrossRef]
- Spokas, K.A.; Novak, J.M.; Masiello, C.A.; Johnson, M.G.; Colosky, E.C.; Ippolito, J.A.; Trigo, C. Physical disintegration of biochar: An overlooked process. Environ. Sci. Tech. Lett. 2014, 1, 326–332. [Google Scholar] [CrossRef]
- Li, F.Z.; Hu, N.; Li, X.; Ge, X.Y. Research on urban green space system planning response under the background of sponge city construction. Urban Dev. Stud. 2016, 7, 39–45. [Google Scholar]
Figure 1.
Process of the NMR test and SWRC test of the filter paper method, including: (a) sample preparation; (b) saturated samples; (c) filter paper method; (d) weighing the filter paper.
Figure 1.
Process of the NMR test and SWRC test of the filter paper method, including: (a) sample preparation; (b) saturated samples; (c) filter paper method; (d) weighing the filter paper.

Figure 2.
NMR T2 signal spectra of the fine- (a), medium- (b), and coarse- (c) grained remolded soil and pore size distribution of the fine- (d), medium- (e), and coarse- (f) grained remolded soil. (Abbreviations: MP, main peak; LP1, the first peak on the left; LP2, the second peak on the left; RP1, the first peak on the right; RP2, the second peak on the right).

Figure 3.
Quantification of pore size distribution of soil samples.

Figure 4.
The SWRC based on pore size distribution.

Figure 5.
The SWRC based on the filter paper method. (a–c) Shows the raw data of the samples and (d–f) shows the SWRC fitted by the EMFX model.
Figure 5.
The SWRC based on the filter paper method. (a–c) Shows the raw data of the samples and (d–f) shows the SWRC fitted by the EMFX model.


Table 1.
Composition ratio of sample preparation.
| Agrotype | Ingredient | No. | ||
|---|---|---|---|---|
| Calcined Kaolin | Standard Sand | Biochar | ||
| Fine-grained remolded soil | 60% | 40% | 0% | A0 |
| 2% | A1 | |||
| 4% | A2 | |||
| 6% | A3 | |||
| 8% | A4 | |||
| Medium-grained remolded soil | 40% | 60% | 0% | B0 |
| 2% | B1 | |||
| 4% | B2 | |||
| 6% | B3 | |||
| 8% | B4 | |||
| Coarse-grained remolded soil | 20% | 80% | 0% | C0 |
| 2% | C1 | |||
| 4% | C2 | |||
| 6% | C3 | |||
| 8% | C4 | |||
Table 2.
The fitting parameters of SWRC of NMR and the filter paper method.
| No. | NMR | Filter Paper Method | |||||
|---|---|---|---|---|---|---|---|
| α (1/cm) | m | n | α (1/cm) | m | n | RMSE | |
| A0 | 0.0020 | 1.1777 | 3.4409 | 2.9 × 10⁻⁷ | 86.7163 | 0.3634 | 0.0242 |
| A1 | 0.0017 | 1.2240 | 3.5792 | 0.0005 | 7.2429 | 0.3720 | 0.0189 |
| A2 | 0.0016 | 1.1269 | 3.3615 | 1.8 × 10⁻⁷ | 69.1308 | 0.3281 | 0.0162 |
| A3 | 0.0015 | 1.0796 | 3.1761 | 6.5 × 10⁻⁶ | 19.3970 | 0.3045 | 0.0241 |
| A4 | 0.0014 | 1.1796 | 2.5773 | 0.0073 | 2.9026 | 0.4937 | 0.0274 |
| B0 | 0.0021 | 1.0195 | 3.0437 | 0.0019 | 4.1706 | 0.4299 | 0.0159 |
| B1 | 0.0020 | 1.3243 | 2.3058 | 0.0120 | 2.1993 | 0.5695 | 0.0222 |
| B2 | 0.0021 | 1.5868 | 1.8142 | 0.0373 | 1.7347 | 0.4893 | 0.0252 |
| B3 | 0.0019 | 1.5481 | 1.5213 | 0.0104 | 2.6010 | 0.3867 | 0.0310 |
| B4 | 0.0014 | 1.5256 | 2.2244 | 0.0590 | 1.8891 | 0.5154 | 0.0321 |
| C0 | 0.0018 | 2.6085 | 1.1413 | 0.7915 | 0.9594 | 0.9559 | 0.0627 |
| C1 | 0.0025 | 2.6031 | 1.1365 | 0.8710 | 1.0438 | 0.7856 | 0.0526 |
| C2 | 0.0022 | 2.2283 | 1.4129 | 0.7886 | 1.0209 | 0.7547 | 0.0632 |
| C3 | 0.0001 | 25.2130 | 0.9797 | 0.7486 | 0.9886 | 0.9726 | 0.0520 |
| C4 | 0.0005 | 6.0681 | 1.1931 | 0.9563 | 0.8931 | 1.1157 | 0.0454 |
Disclaimer/Publisher’s Note: The statements, opinions and data contained in all publications are solely those of the individual author(s) and contributor(s) and not of MDPI and/or the editor(s). MDPI and/or the editor(s) disclaim responsibility for any injury to people or property resulting from any ideas, methods, instructions or products referred to in the content. |
© 2023 by the authors. Licensee MDPI, Basel, Switzerland. This article is an open access article distributed under the terms and conditions of the Creative Commons Attribution (CC BY) license (https://creativecommons.org/licenses/by/4.0/).
Share and Cite
MDPI and ACS Style
Chen, X.; Li, L.; Li, X.; Kang, J.; Xiang, X.; Shi, H.; Ren, X. Effect of Biochar on Soil-Water Characteristics of Soils: A Pore-Scale Study. Water 2023, 15, 1909. https://doi.org/10.3390/w15101909
AMA Style
Chen X, Li L, Li X, Kang J, Xiang X, Shi H, Ren X. Effect of Biochar on Soil-Water Characteristics of Soils: A Pore-Scale Study. Water. 2023; 15(10):1909. https://doi.org/10.3390/w15101909
Chicago/Turabian StyleChen, Xin, Linfei Li, Xiaofeng Li, Jianyu Kang, Xiang Xiang, Honglian Shi, and Xingwei Ren. 2023. "Effect of Biochar on Soil-Water Characteristics of Soils: A Pore-Scale Study" Water 15, no. 10: 1909. https://doi.org/10.3390/w15101909
Note that from the first issue of 2016, this journal uses article numbers instead of page numbers. See further details here.