
Size Effects of Rough Fracture Seepage in Rocks of Different Scales
by
 , ,
, ,
Zhuolin Shi
1,2, 
Qiangling Yao
1,2,*,
Weinan Wang
1,2,
Fengsheng Su
1,2,
Xuehua Li
1,2,
Liu Zhu
1,2 and
Chengle Wu
1,2 1
Key Laboratory of Deep Coal Resource Mining, Ministry of Education, School of Mines, China University of Mining and Technology, Xuzhou 221008, China
2
School of Mines, China University of Mining and Technology, Xuzhou 221116, China
*
Author to whom correspondence should be addressed.
Water 2023, 15(10), 1912; https://doi.org/10.3390/w15101912
Submission received: 13 April 2023
/
Revised: 11 May 2023
/
Accepted: 14 May 2023
/
Published: 18 May 2023
(This article belongs to the Special Issue Mine Water Safety and Environment)
Abstract
:Percolation experiments were conducted on coal samples with various fracture lengths and inclination angles under different stress conditions using a gravity-loaded rock percolation test device. The goals of these experiments are (1) to improve the technology for protecting water resources while mining coal and (2) to enhance the research on how the size effects of fracture affect seepage. A three-dimensional seepage model was constructed using COMSOL numerical simulation software for larger fracture lengths ranging from 1 to 30 m to investigate the seepage pattern under the coupling of fracture roughness, fracture width, and other factors. Multiple regression analysis was used to investigate the effects of different factors on seepage from large and small fractures independently. The results show that, under laboratory conditions, for fracture lengths 10–70 mm (small length), permeability increases non-linearly with an increase in fracture length, and the overall increase is approximately 1.8 times. Whereas, for fracture lengths of 1–30 m (large length) in the simulation, permeability decreases and then increases with an increase in fracture length, and the overall change is approximately 0.03 times. The permeability varies in three stages (1–8 m obvious change, 8–23 m stabilization, 23–30 m stability) under different fracture lengths, widths, and roughness conditions. Acritical size was found to exist. The effect of fracture length on large length fracture seepage and small length fracture seepage was further verified by parameter sensitivity. The results of this study further reveal the mechanism of fracture seepage under coupling of fracture geometry size stress.
1. Introduction
Coal is one of the most common and important sources of energy. Coal reserves are abundant in China’s energy mix, and coal, as a basic energy source, is also relevant to the development of many industries. In recent years, total coal consumption has continued to grow as its demand has increased in various industries. With the gradual depletion of the available coal resources in east-central China, western mining areas currently supply the majority of the coal; however, these areas lie in arid and semi-arid ecologically fragile areas, especially the five provinces of Shanxi, Shaanxi, Inner Mongolia Autonomous Region, Ningxia and Gansu. In these five provinces, whose coal reserves and production account for approximately 70% of the total, local water resources account for only 3.9% of the total. Therefore, water resource issues severely limit coal mining [1], and the contradiction between the two has become increasingly prominent. The coal seams in western mining areas are shallow and the overlying beds are thin. Therefore, large-scale and high-intensity mining activities have a stronger impact on the overlying rocks and the surface. The zones of overburden material formed by coal mining produce hydraulic fractures in the corresponding layers [2], resulting in the infiltration of water from the aquifer into the mining area, which leads to loss of water resources, if not used rationally.
Currently, coal and water extraction is the most effective technical means of solving these problems [3]. Coal and water extraction mainly includes water conservation and construction of underground water reservoirs. Gu et al. [4,5] combined the characteristics of structural destruction of coal mining aquifers and water transport and proposed the idea of using after mining-void areas to build underground water reservoirs for water storage. Yao et al. [3,6,7] discussed the common problems faced by coal mining and water resource protection and utilization from a technical perspective and proposed a coordination center for coal resource development and environmental protection in the ecologically fragile mining areas in the western part of the country. In the above technical recommendations, mastering the fracture pattern and water seepage are particularly important. In general, fractures exist within the coal or rock body, and have a variety of shapes, lengths, and distribution forms [8,9]. Research regarding their permeability is crucial to the construction of groundwater reservoirs [10]. Studies have shown [11] that there are many factors affecting the permeability of coal or rock, such as their nature, fracture roughness, fracture width, and the stress conditions to which they are subjected. The effect of fracture length has also become a focus of research and is referred to as the size effect.
The size effect of fracture seepage is mainly manifested by the corresponding change in seepage velocity and permeability of fractures with a change in coal mass size [12,13,14]. Currently, a consensus on the importance of fracture length has been reached. Many studies on fracture seepage have been conducted by both domestic and foreign researchers. In terms of the characterization of seepage, Rong et al. [15] applied the principle of superposition of seepage energy to derive theoretical formulae for the permeability tensor of fractured rock masses based on three-dimensional nodal network simulation technology and proposed a method for determining the volume of fractured rock mass permeability characterization units. Shang et al. [16] studied the effects of fracture length change on rock fracture extension, damage pattern, and stress distribution under uniaxial compression conditions. Shi et al. [13] experimentally investigated the effects of seepage pressure, porosity, and fractal dimension and established a nonlinear seepage model. They concluded that fractured sandstones have obvious nonlinear characteristics in the seepage process. Jing et al. [17] used CT scanning to reconstruct the three-dimensional pores of coal and investigated the effects of different pore and fracture parameters on the permeability of seepage channels. The results showed that the more connected the pores and the larger the pore size, the higher the percolation capacity. In terms of the influence of fracture roughness and stress conditions, Di et al. [18] derived and proposed an equation for the coupled stress–seepage permeability coefficient of a single fracture considering roughness based on the experimental results on the rock fracture roughness coefficient (JRC), mechanical pore size, and hydraulic pore size proposed by Barton. They concluded through seepage experiments that the permeability coefficient differs for different fracture surfaces of the same JRC; that is, the smaller the grain size, the smaller the permeability coefficient, and the larger the grain size, the larger the permeability coefficient. With an increase in the fracture water pressure, the permeability coefficient increases exponentially.
The mining process alters the overburden structure of the coal seam roof and changes the state of the water-bearing layer, creating numerous water-conducting fractures between layers. The existence of numerous hydraulic fractures has caused changes in groundwater storage, recharge, and circulation patterns, resulting in a drop in the groundwater table, loss of plant nutrients, degradation of water-loving plants, evolution of wet vegetation to dry vegetation, and aggravation of soil salinization and desertification, which has seriously affected the quality of the environment. Currently, the seepage patterns of fractures of different sizes and transport of fracture water have not been sufficiently explored, and relevant influencing factors have not been comprehensively considered.
In line with the above, a gravity-loaded rock seepage test apparatus was used to conduct seepage experiments on the prefabricated coal samples with different fracture lengths and inclination angles under different stress conditions. COMSOL numerical simulation software was used to construct three-dimensional seepage models for fracture lengths ranging from 1 to 30 m to investigate seepage patterns under the coupling of fracture roughness and fracture width. (The “fracture length” used in this article refers to the size of the physical dimensions of the fractures present in the rock. The “fracture roughness” refers to the roughness of fractures in a rock mass. The “fracture width” refers to the degree of fracture opening in a rock mass or the tightness of fractures in the structural face of a rock mass). A multivariate regression analysis was used to investigate the multifactor coupling relationship between fracture geometry and stress.
2. Seepage Experiments with Different Fracture Lengths and Fracture Inclinations
2.1. Experimental Equipment
This experiment can be broadly divided into three parts, which include:
- (1)
- Coal-sample compressive strength experiments. To ensure that the coal sample is subjected to a variety of stresses in the seepage experiment, and to reduce the interference of the anisotropy of the coal sample in the experiment, the seepage loading scheme should be set to ensure that the maximum loading stress is within the elastic range of the coal sample as far as possible. To prevent the coal sample from being damaged during the loading process and changing its seepage path, a compressive strength experiment on the cylindrical coal sample should be conducted first.
- (2)
- Seepage experiments with different fracture lengths. Because of the need to investigate the effect of fracture length and the relationship between fracture length and other factors when coupled with each other, in this part of the experiment, the different lengths of fractures that exist within the coal or rock in a realistic environment were simulated by processing multiple sets of prefabricated fractures of different lengths.
- (3)
- Seepage experiments with different fracture inclination angles. To consider the influence of multiple factors, the fracture geometry, surrounding pressure, axial pressure, and fracture inclination were coupled; therefore, seepage experiments with different fracture inclination angles were required.
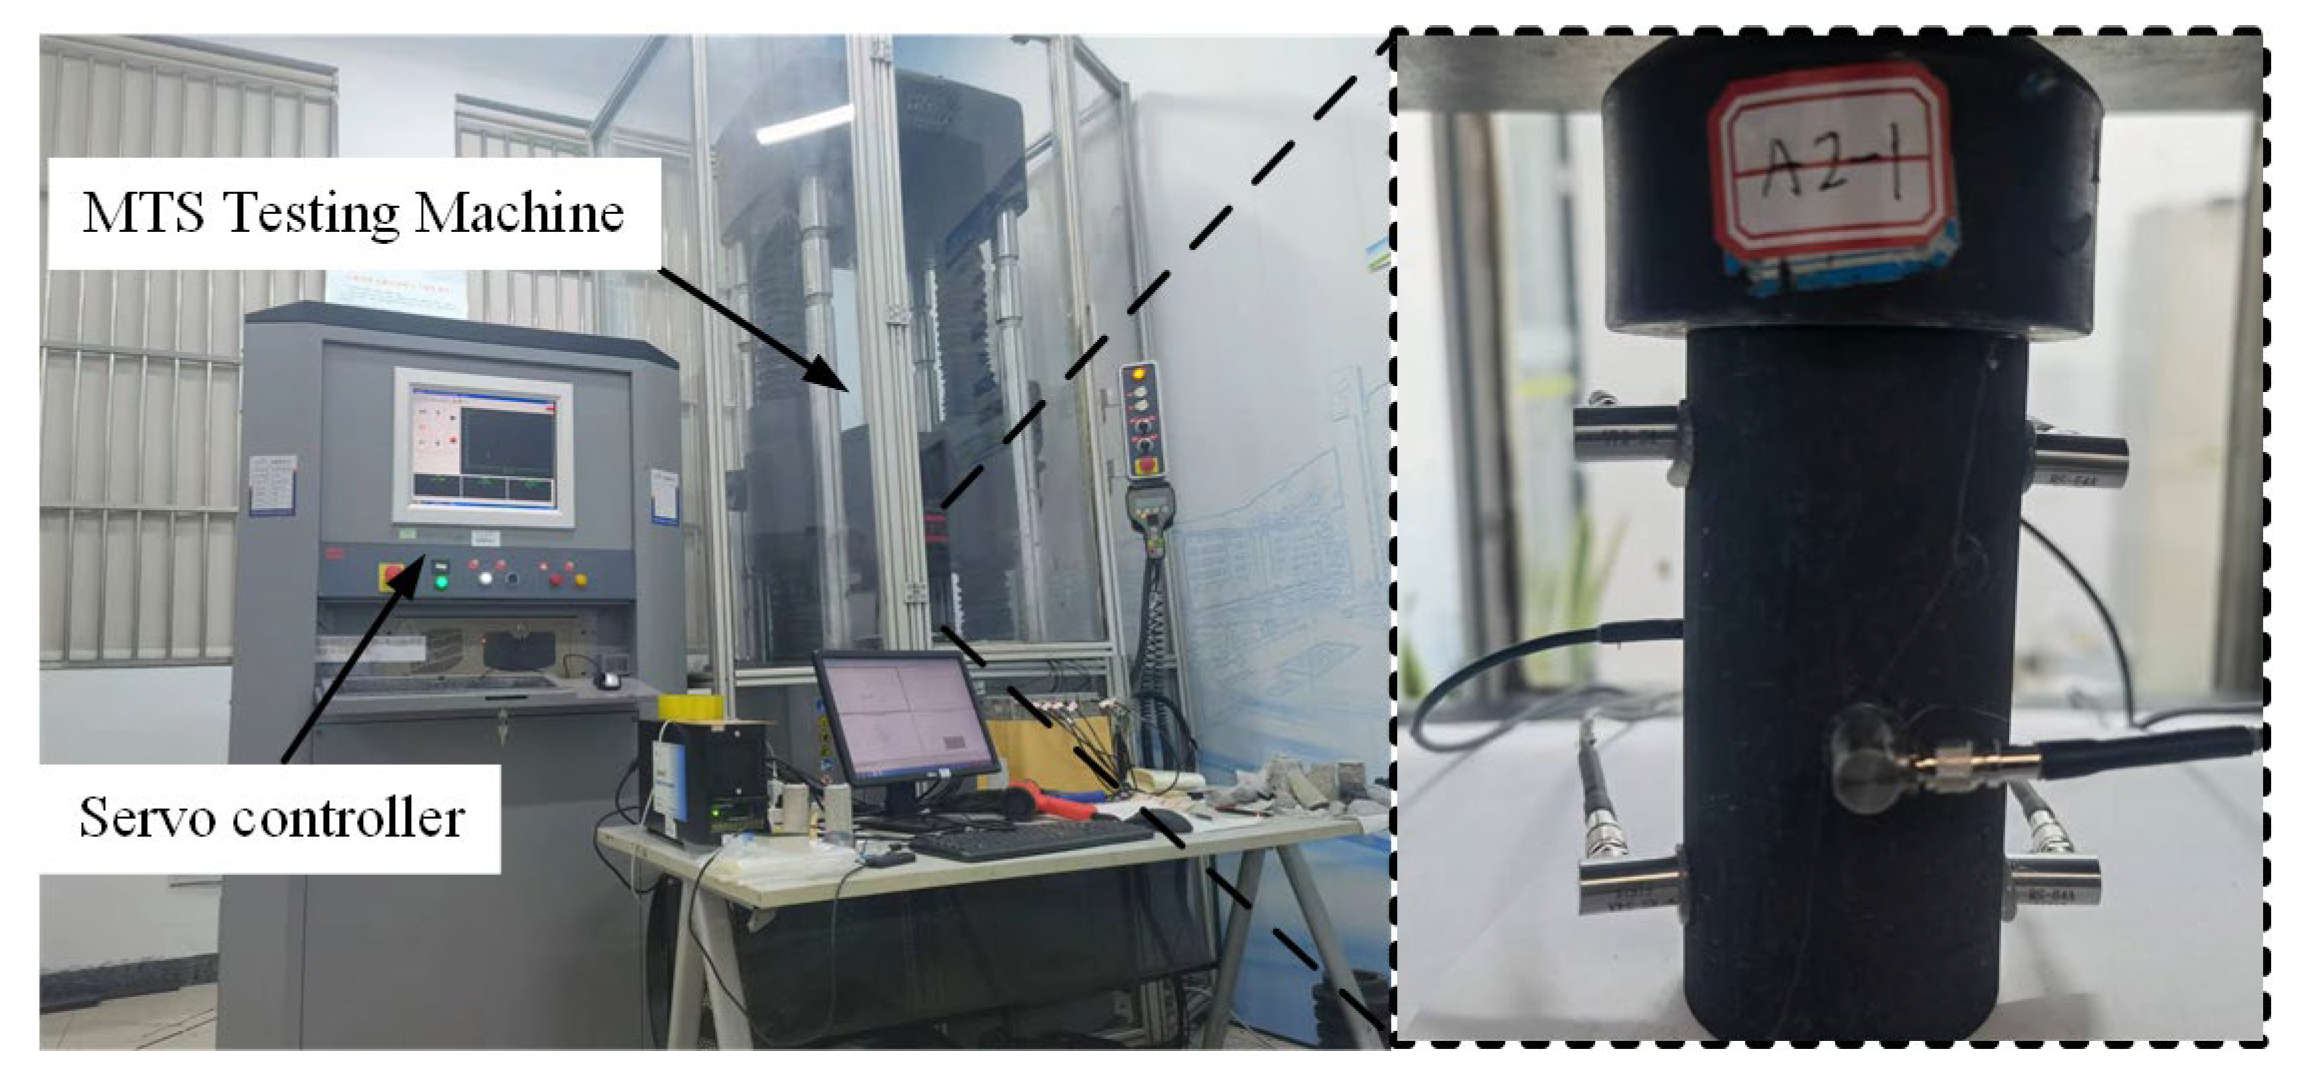
For experiments on the compressive strength of the coal samples, a universal testing machine (MTS) was used for servo loading, as shown in Figure 1.
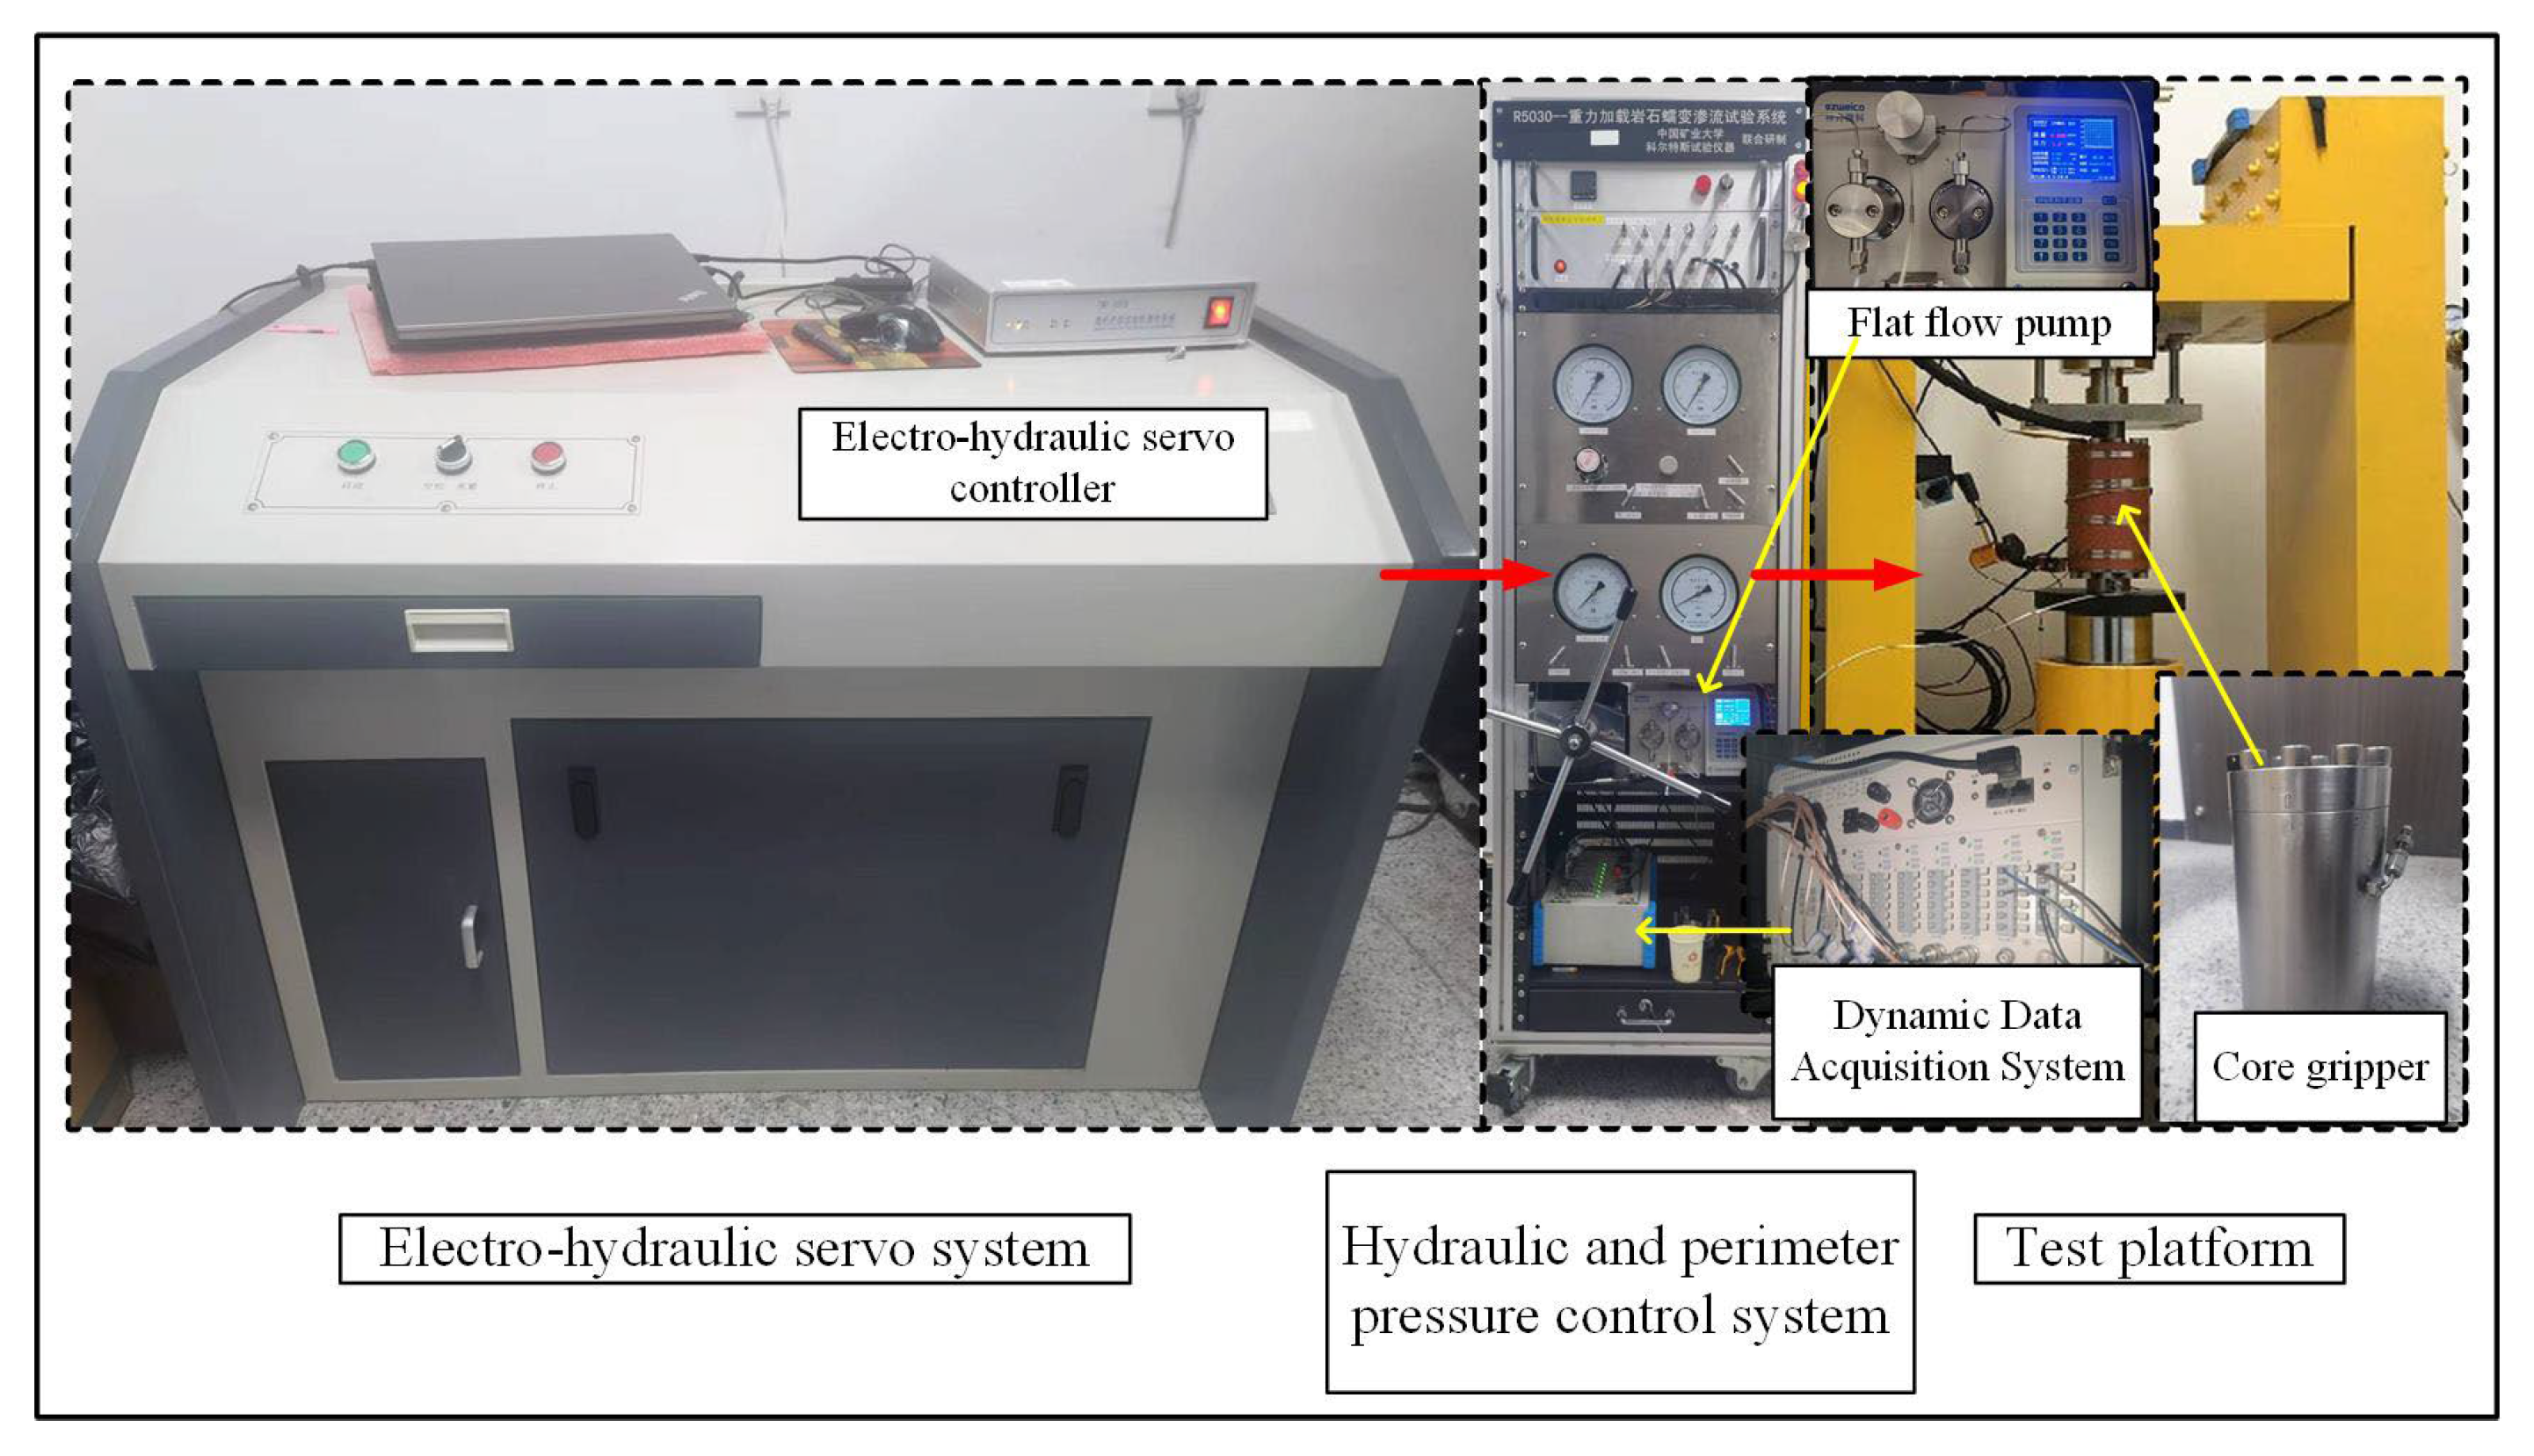
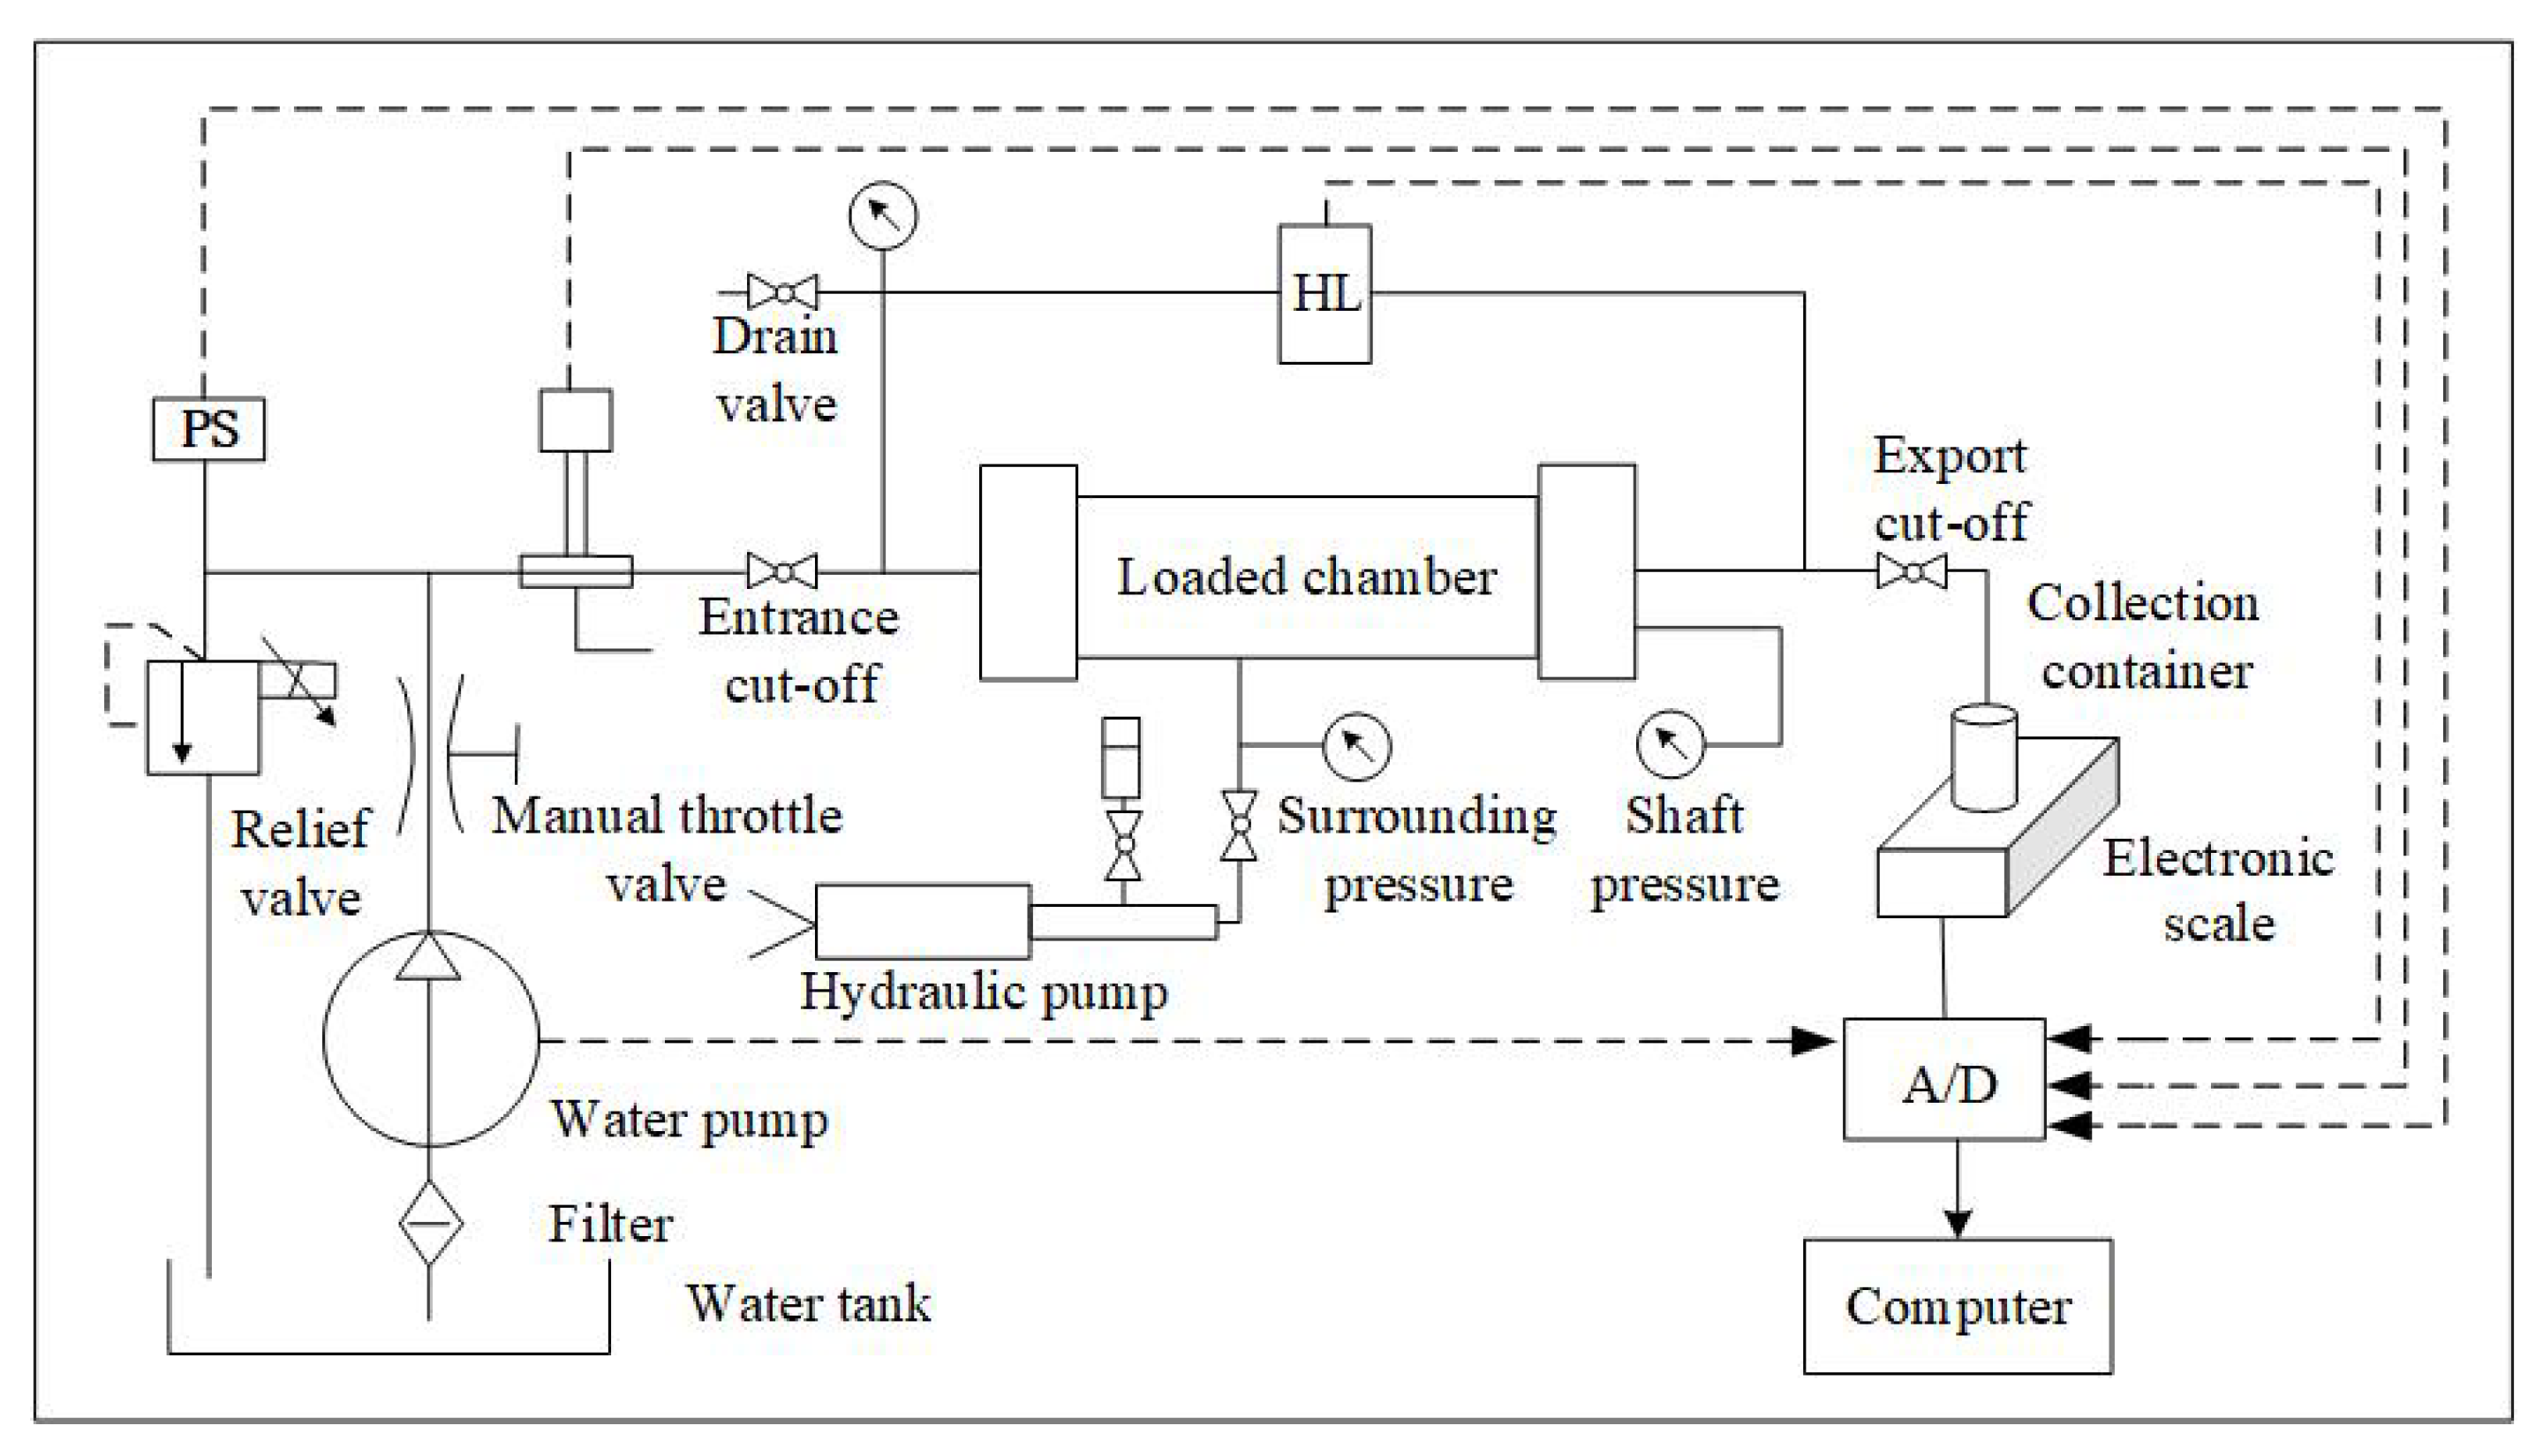
In the triaxial compression percolation experiment on coal samples, a gravity-loaded rock percolation test platform from the China University of Mining and Technology was used, which consists of six systems, namely the load-bearing system, loading system, temperature control system, percolation system, measurement system, and automatic acquisition control system. In the loading system, the axial load σ1,max = 150 MPa, radial load σ2,max = σ3,max = 25 MPa, and pressure upstream of the liquid seepage in the seepage system pw,max = 20 MPa. The equipment can conduct triaxial rock mechanics experiments under different stress paths, seepage experiments, and data acquisition using high-precision sensors and other equipment. The seepage flow experimental equipment is shown in Figure 2, and a schematic of the equipment is shown in Figure 3.
2.2. Sample Preparation
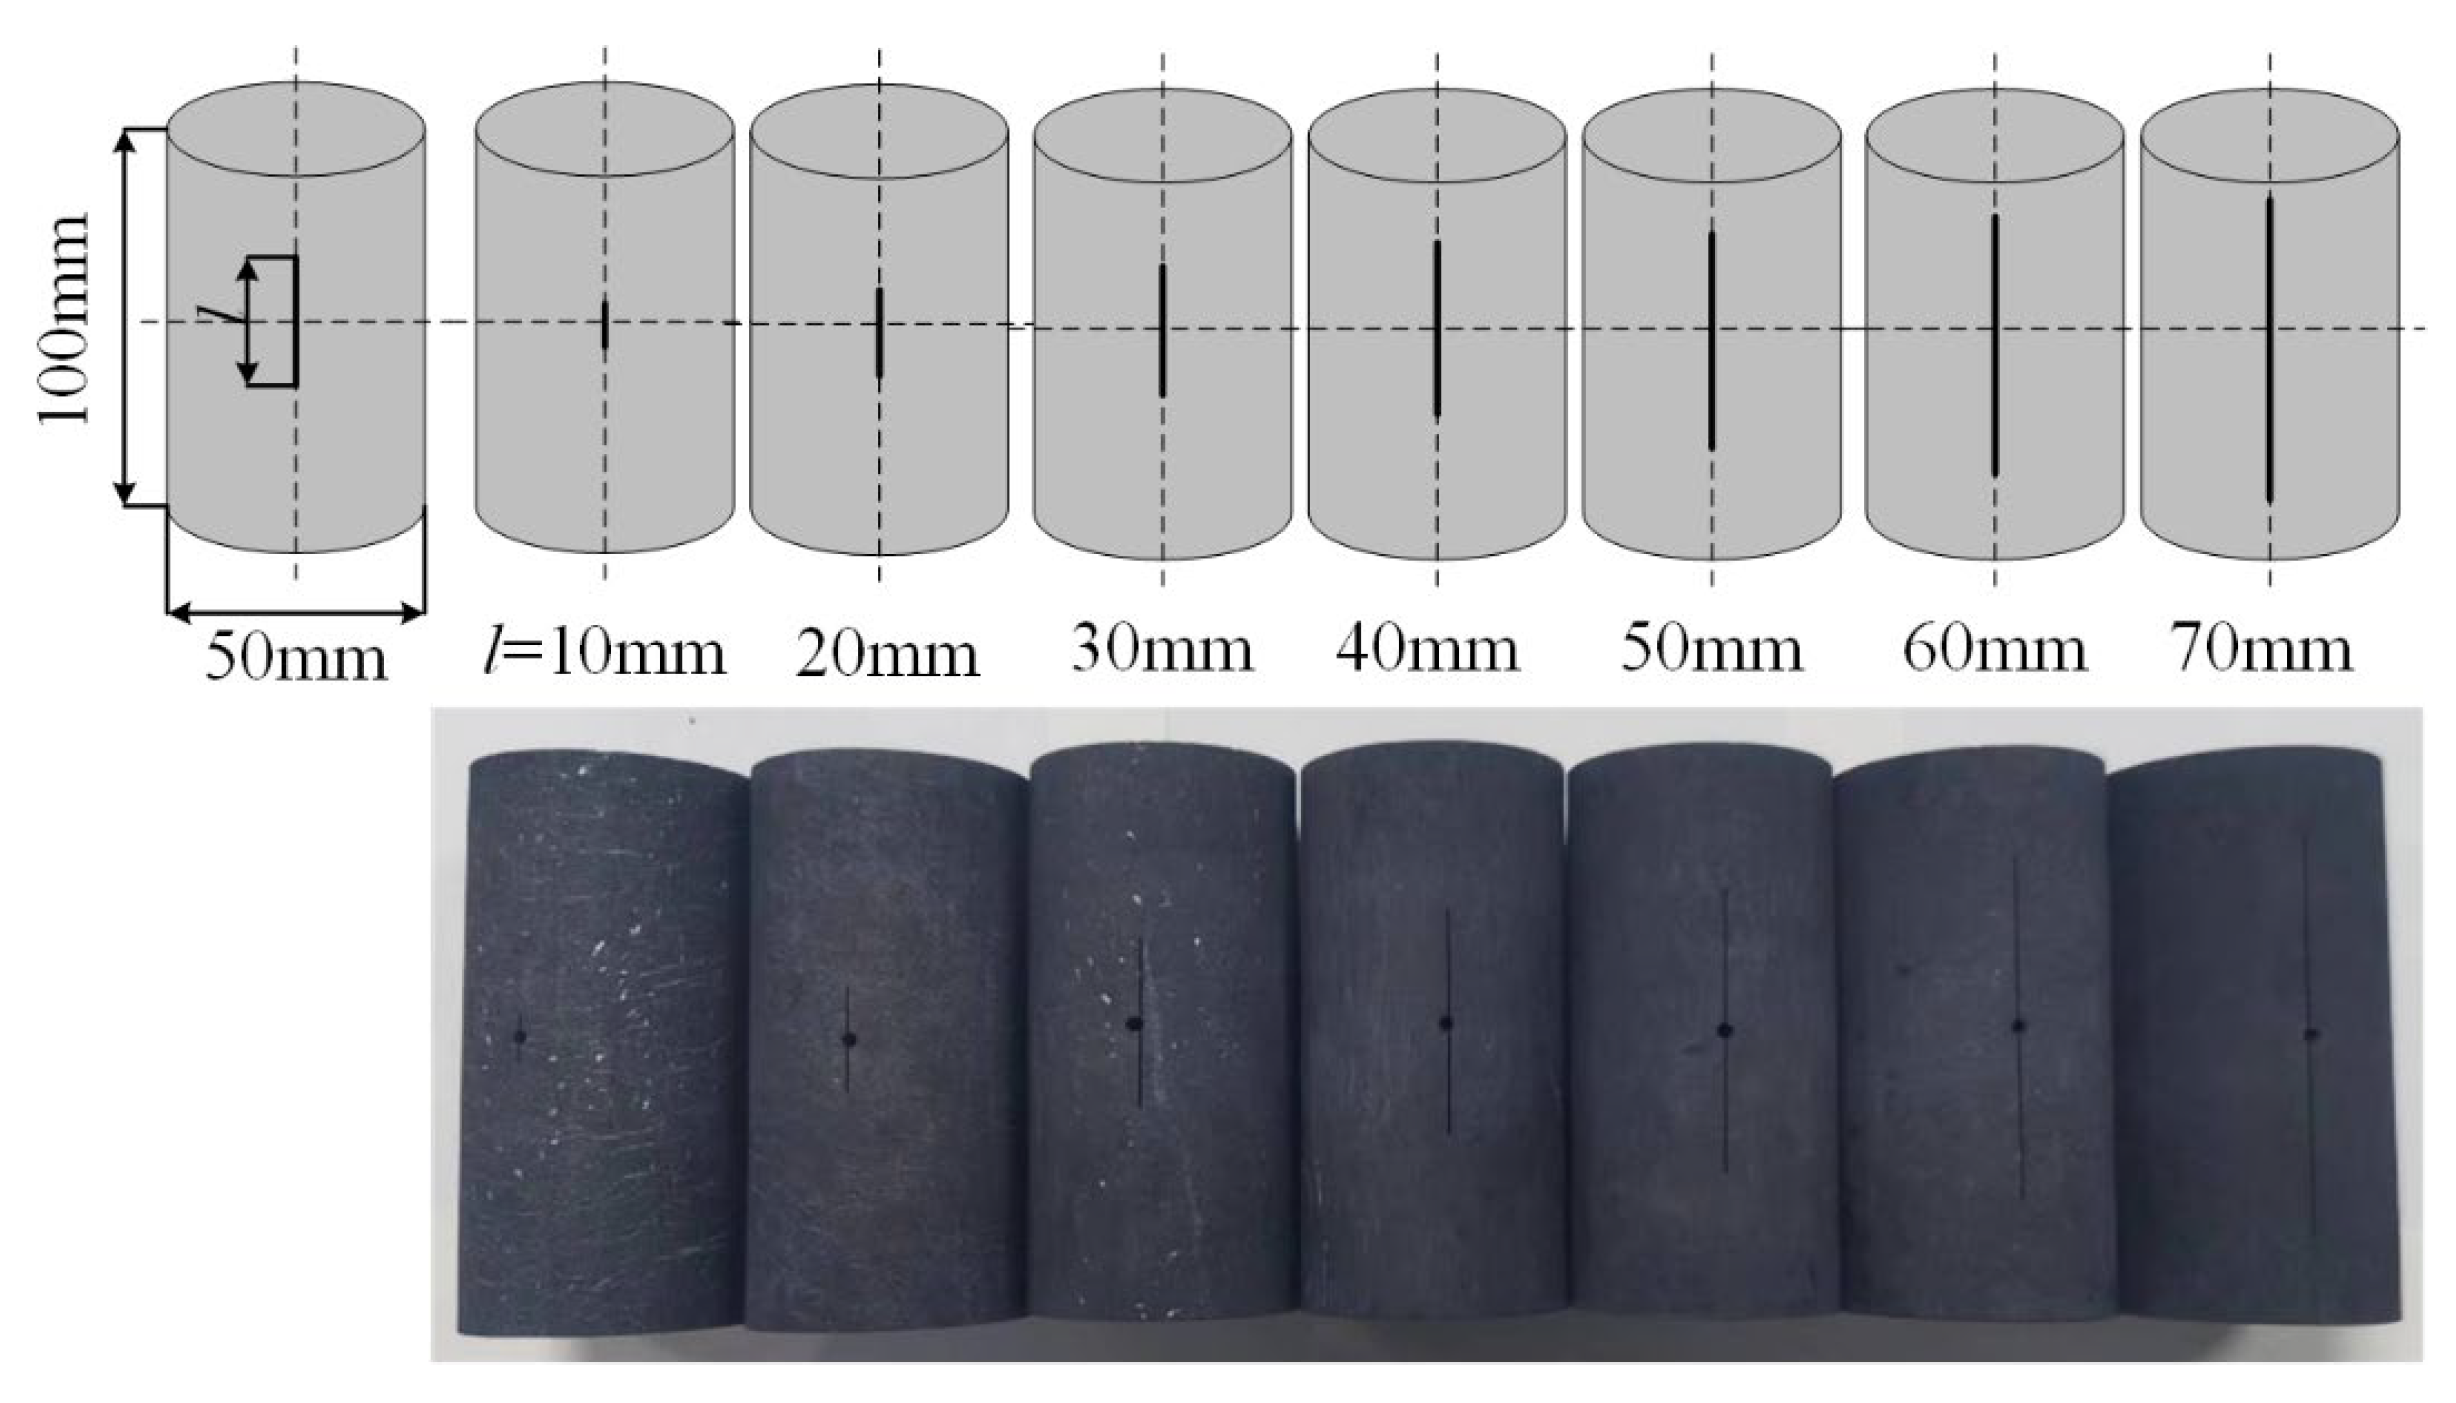
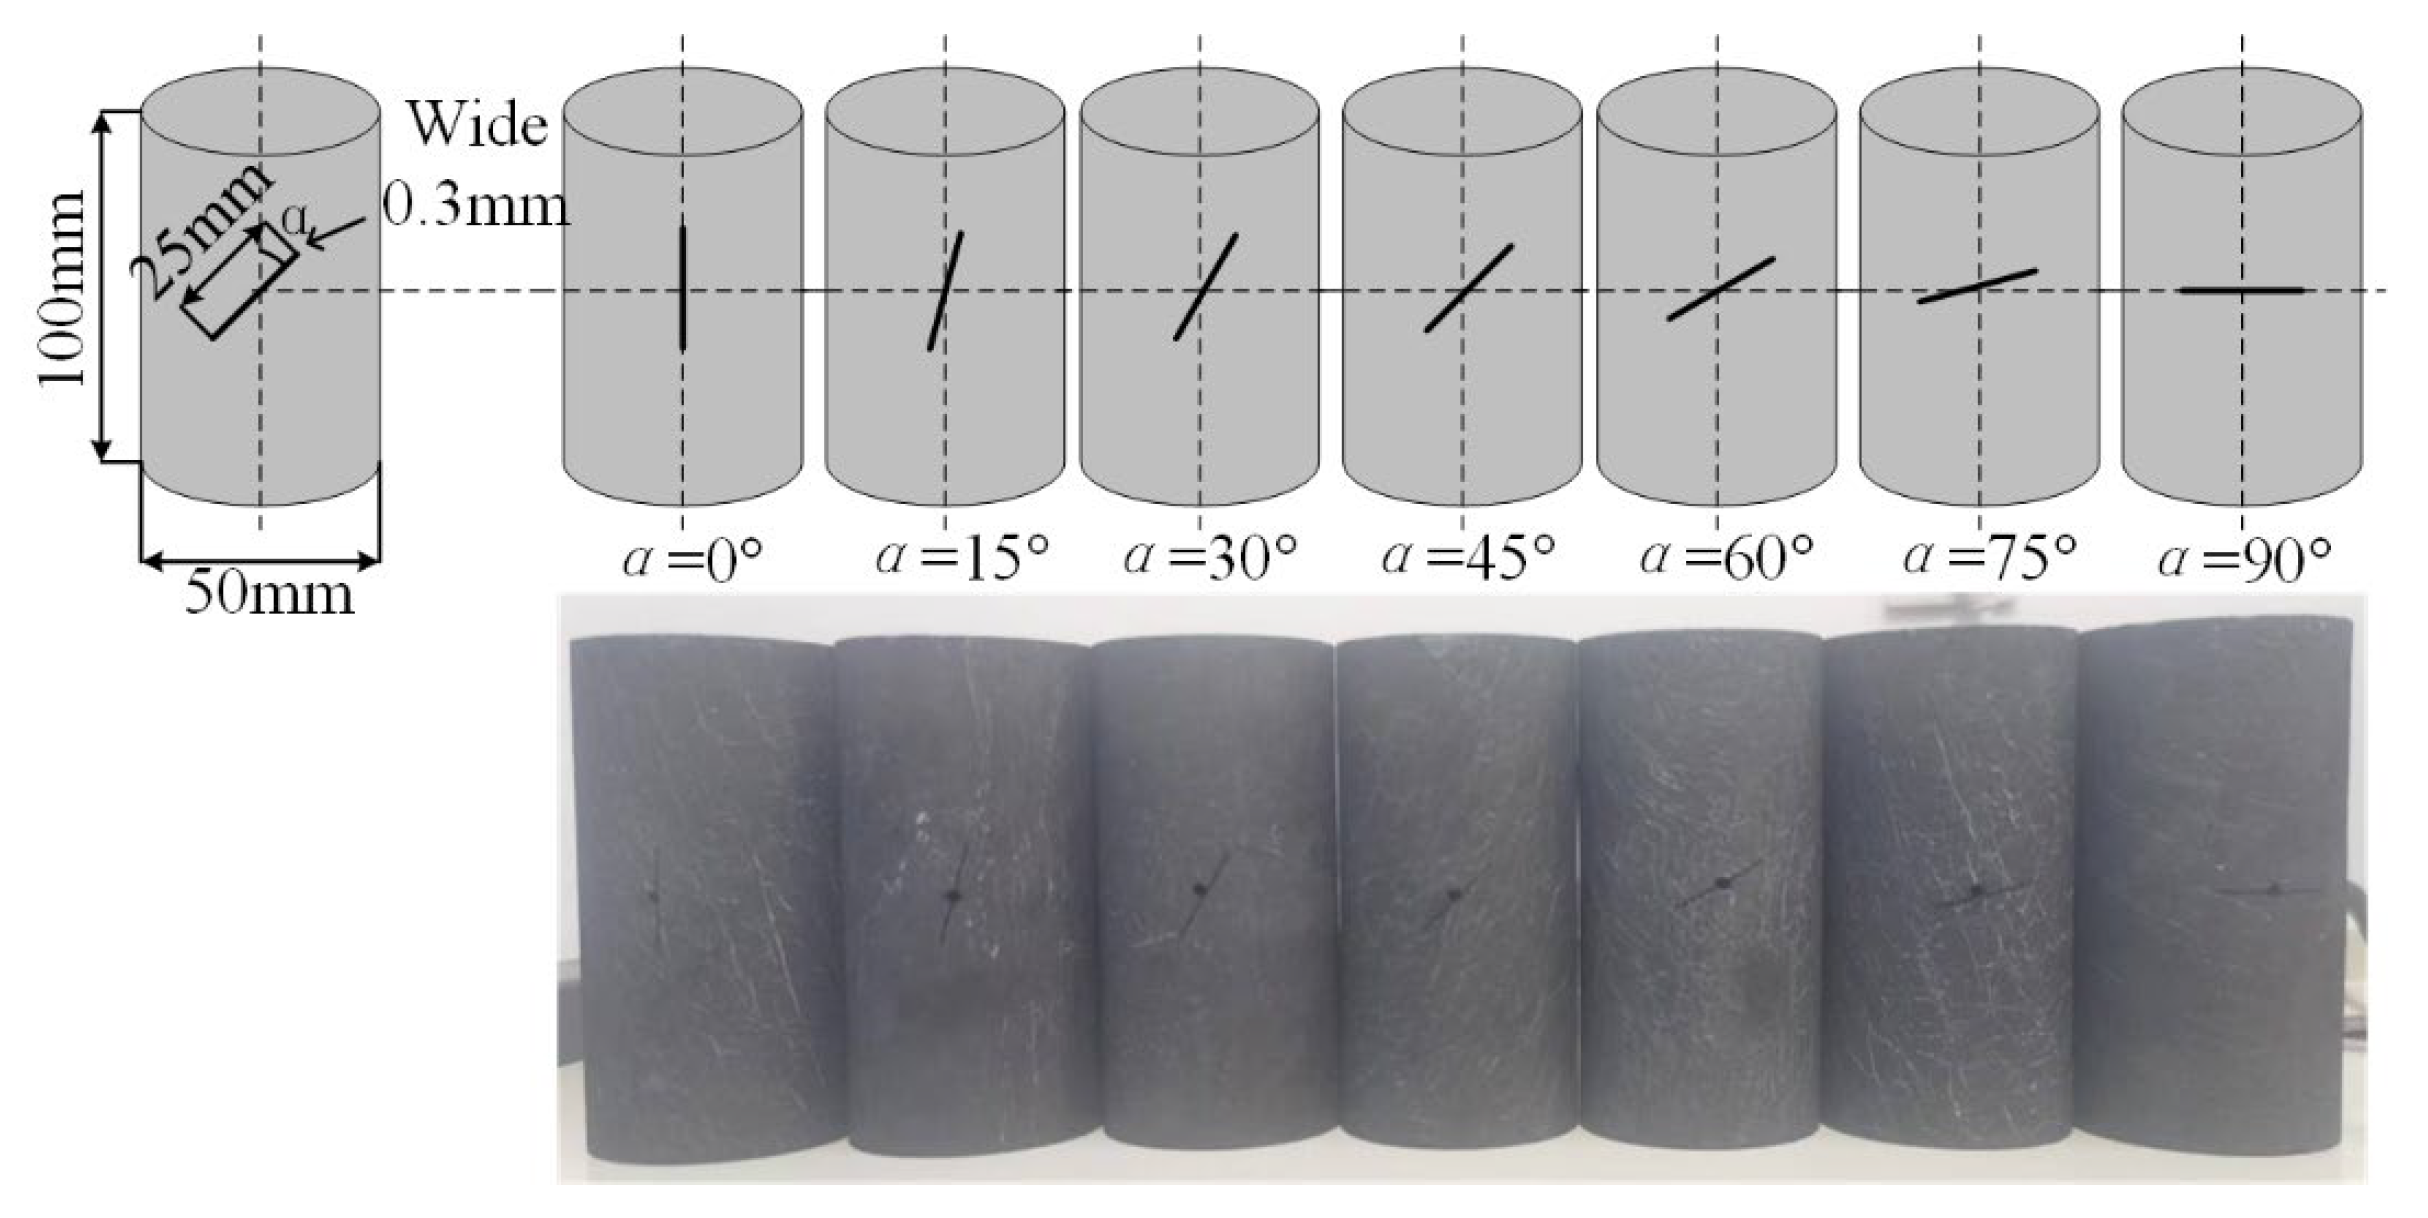
According to the standard cylindrical specimens of ϕ ≤ 50 mm and H ≤ 100 mm recommended by the International Society of Rock Mechanics (ISRM) [19], this experiment processed the coal samples into cylindrical specimens of size ϕ = 50 mm and H = 100 mm along the coal seam joints during processing and polished and sanded the cylindrical coal samples. The surface of the specimen is polished and sanded to achieve the desired flatness and roughness. In case of specimens requiring pre-fracturing, wire-cutting techniques were used to pre-fracture the specimens. Seven different lengths and seven different inclination angles of single fracture were prefabricated with a single fracture width of 0.3 mm, and the rest of the geometry was characterized by the parameters l and α. The values of l were 10 mm, 20 mm, 30 mm, 40 mm, 50 mm, 60 mm, and 70 mm, and the values of α were 0°, 15°, 30°, 45°, 60°, 75°, and 90°, respectively, as shown in Figure 4 and Figure 5.
The geometric parameters for the experimental group of coal samples were set as listed in table below.
2.3. Experimental Programme
For uniaxial compressive strength experiments on coal samples, a universal testing machine from MTS was used to obtain full stress–strain curves for coal samples by displacement-controlled loading with the loading rate chosen to be 0.2 mm/min [20].
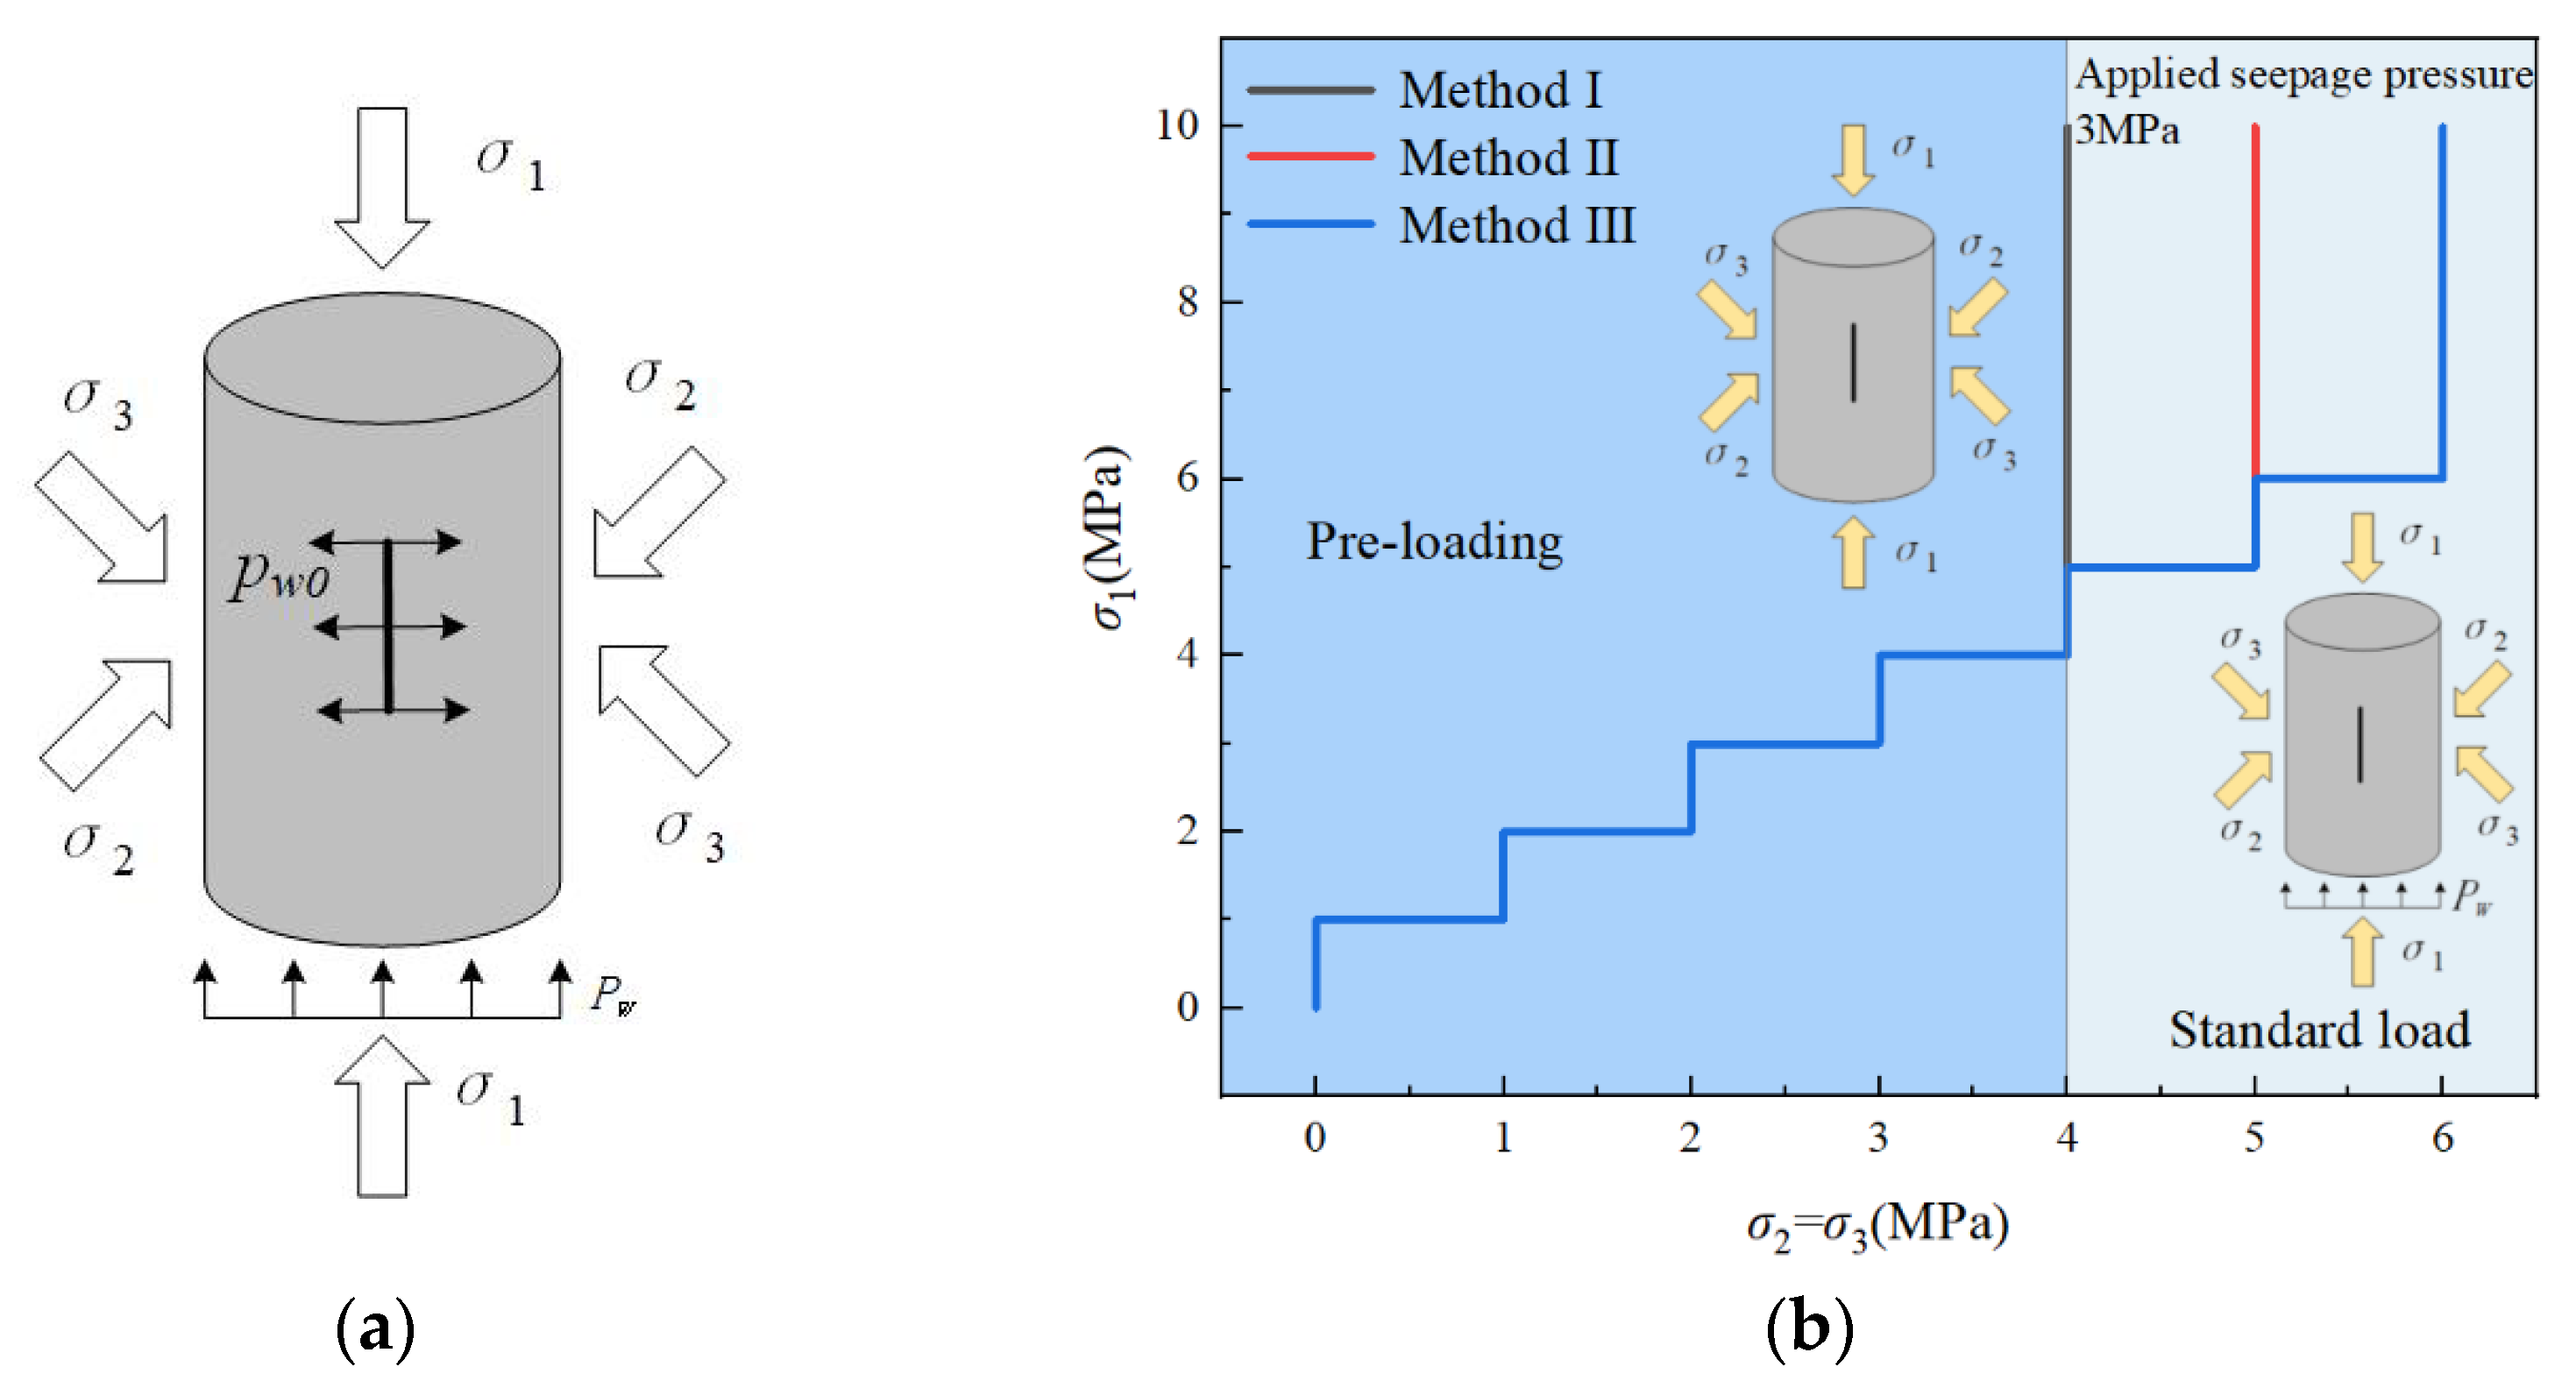
In the laboratory seepage experiments, five independent variables were set up: different fracture lengths, fracture inclinations, axial stress, circumferential pressure, and seepage pressure. The dependent variable was permeability. The coal samples were divided into two groups with different fracture lengths and inclination angles for the experiments, as listed in Table 1. During the experimental phase, the fractured coal samples were subjected to mechanical stresses of axial pressure σ1, surrounding pressures σ2 = σ3, seepage pressure pw, and internal permeation pressure pw0 acting on the fracture surface after water infiltration into the prefabricated fractures through the hydraulic conductivity holes [21], as shown in Figure 6.
The specimens were completely water-saturated using a non-destructive water immersion device. A gravity-loaded rock seepage test rig was used for pre-loading with stress-controlled loading and simultaneous application of axial stress σ1 and radial stress σ2 and σ3 at a rate of 1 MPa/min, followed by displacement-controlled loading with axial stress σ1 applied at a rate of 0.01 mm/min and simultaneous application of radial stress σ2 and σ3 to achieve experimental standard loading conditions. When axial stress σ1 and radial stress σ2 and σ3 are stable, the percolation pressure pw is applied via a level flow pump using a constant flow mode of 5 mL/min controlled by pressure. After all the stresses have stabilized, the seepage experimental data collection is started. The stress paths are shown in Figure 6.
The seepage of coal can be simplified to a cubic model, as shown in Figure 7.
The model assumes that when seepage occurs in a coal sample, it occurs mainly along the cuttings and fractures in the coal sample. The cuttings and fractures divide the coal sample matrix [22], as shown in Figure 1. Ideally, the split widths of the cut and fracture are b1 and b2, respectively. In the cubic law, the flow through the cut or fracture can be expressed as
where q is the flow rate through the cut or fracture (m3/s), b is the cut width (b1) or fracture width (b2) (m), s is the width of seepage through the matrix (m), and is the pressure difference between upstream and downstream seepage (Pa).
When there are n cuts or fractures in the sample, the total flow through the sample is assumed to be the sum of the flows through these n cuts or fractures. The total seepage flow through this sample can be expressed as
where Q is the total flow rate through this coal sample, b is the cut width (m), s is the width of seepage through the matrix (m), and is the pressure difference between the upstream and downstream seepage (Pa).
The permeability of the coal sample can be derived from the above equation.
where , and L is the total length of the cut and fracture per unit cross section (m).
The permeability of the sample can be approximately determined by the simplified cubic model of the sample and analysis of the geometrical parameters, such as length, width, and number of cuttings, compared with the previous method of calculating permeability. The percolation mechanism of the coal sample was revealed to a certain extent.
2.4. Compressive Strength Test of Coal
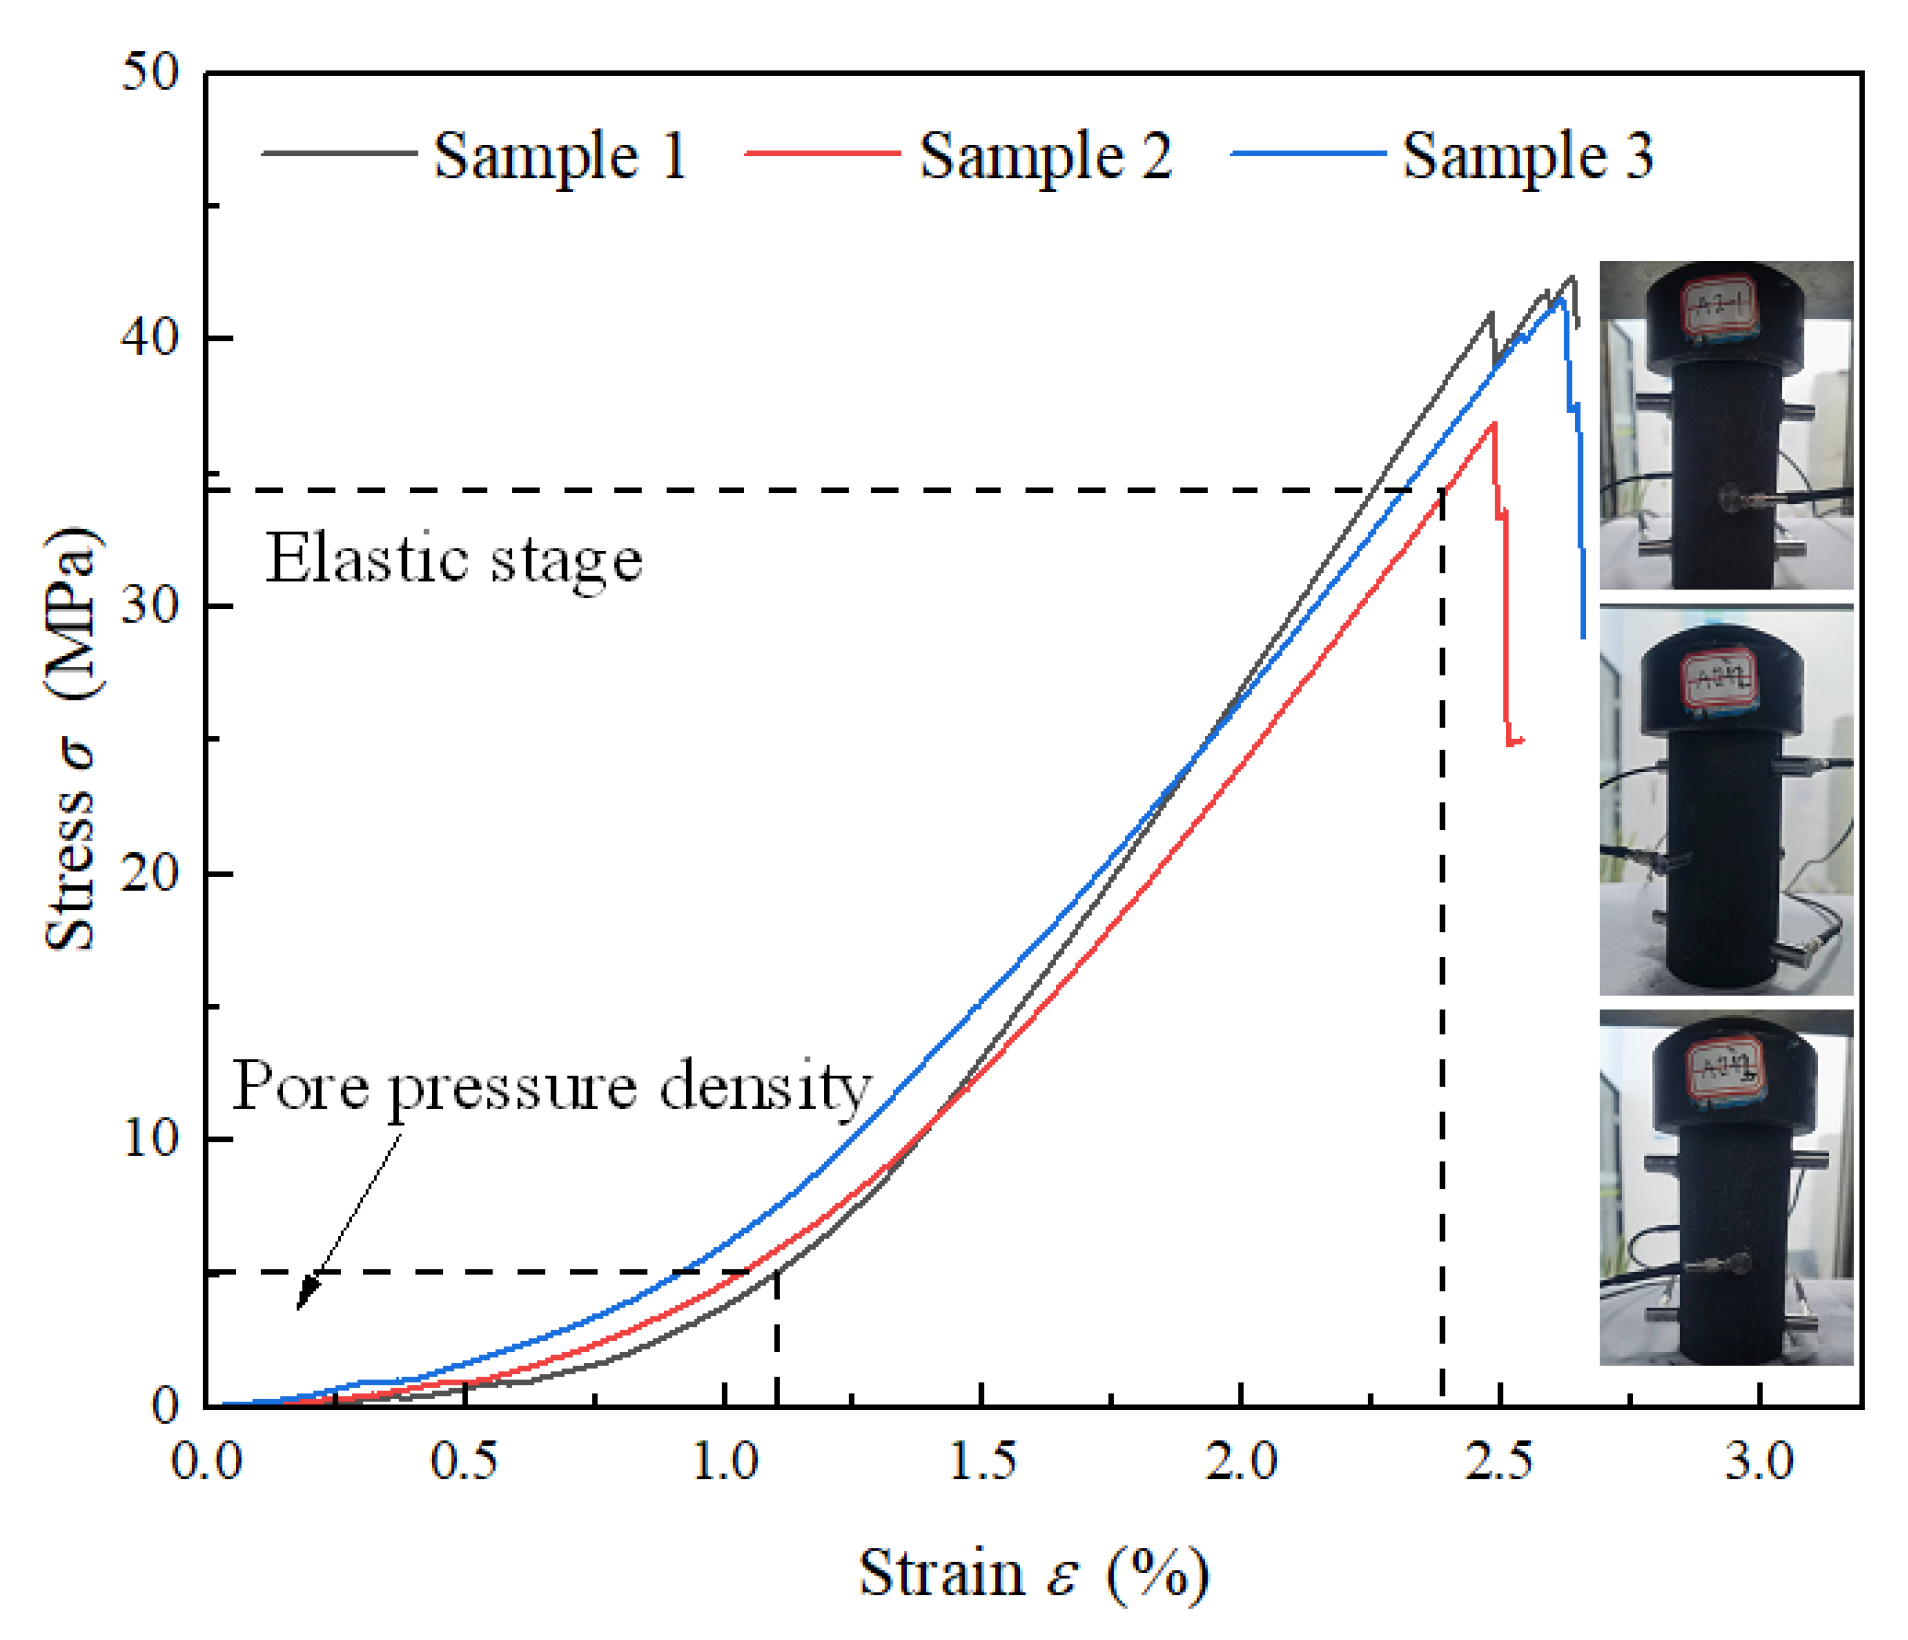
To ensure that the applied load in the percolation experiment leaves the specimen in the elastic phase without damage, it is ensured that the specimen is in the same state as the initial state before all levels of loading are applied. First, the stress–strain curves of standard cylindrical coal samples under uniaxial compression conditions were determined. This is illustrated in Figure 8. According to the stress–strain curves, there are two distinct phases when the experimentally selected coal sample is subjected to external loading, namely the pore compacting phase and the elastic phase. First, in the pore compaction stage, the pores inside the specimen and the matrix of the specimen are stressed to produce strain, but the stress changes are small. As the stress increases, it enters the elastic phase at approximately 5 MPa. During the elastic phase, the stress–strain curve of the coal sample varies linearly. The load values added for the percolation experiments were suitable for selection in this phase. The compressive strength σc of the coal sample selected for this experiment was calculated to be approximately 39.6 MPa. The slope of the curve within the elastic phase reveals that the coal sample is stiffer and less plastic, with more pronounced brittleness [21]. In combination with the above experimental results, the stress loading scheme can be determined, as shown in Table 2.
2.5. Seepage Law of Coal Fracture under Size Effect
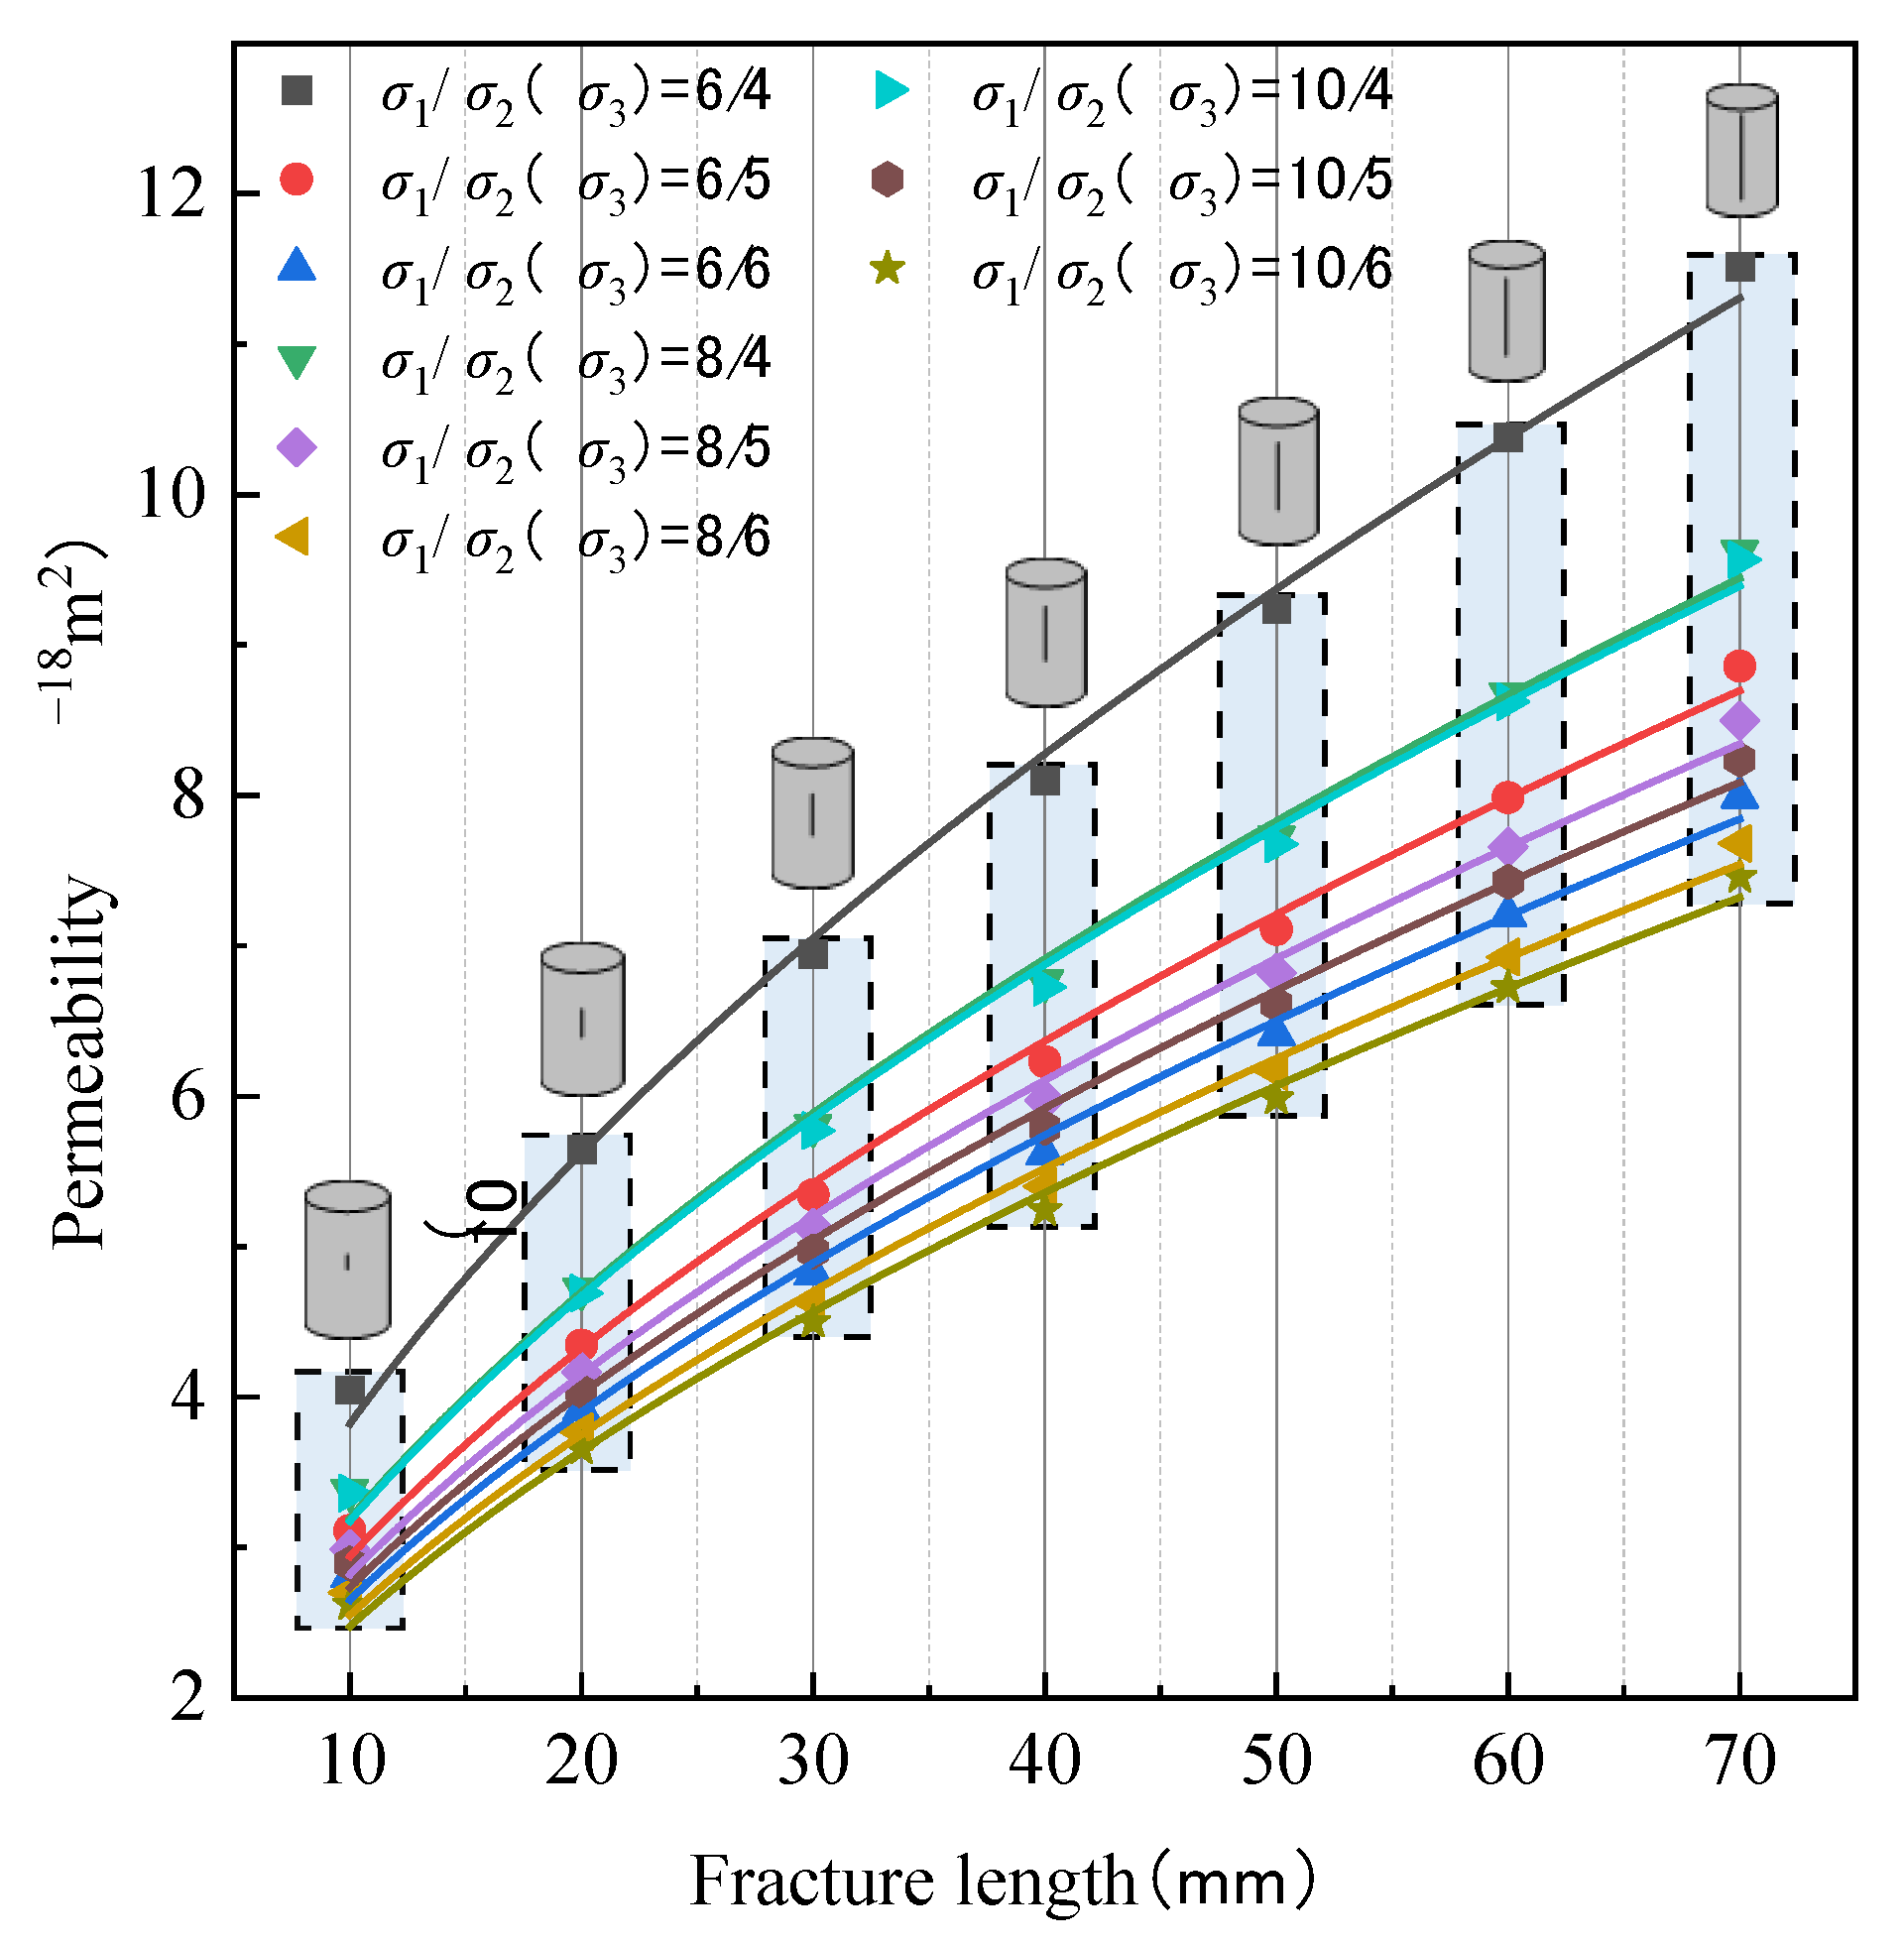
Through further derivation of the cubic model, the permeability of the coal samples with different fracture lengths is shown in Figure 9.
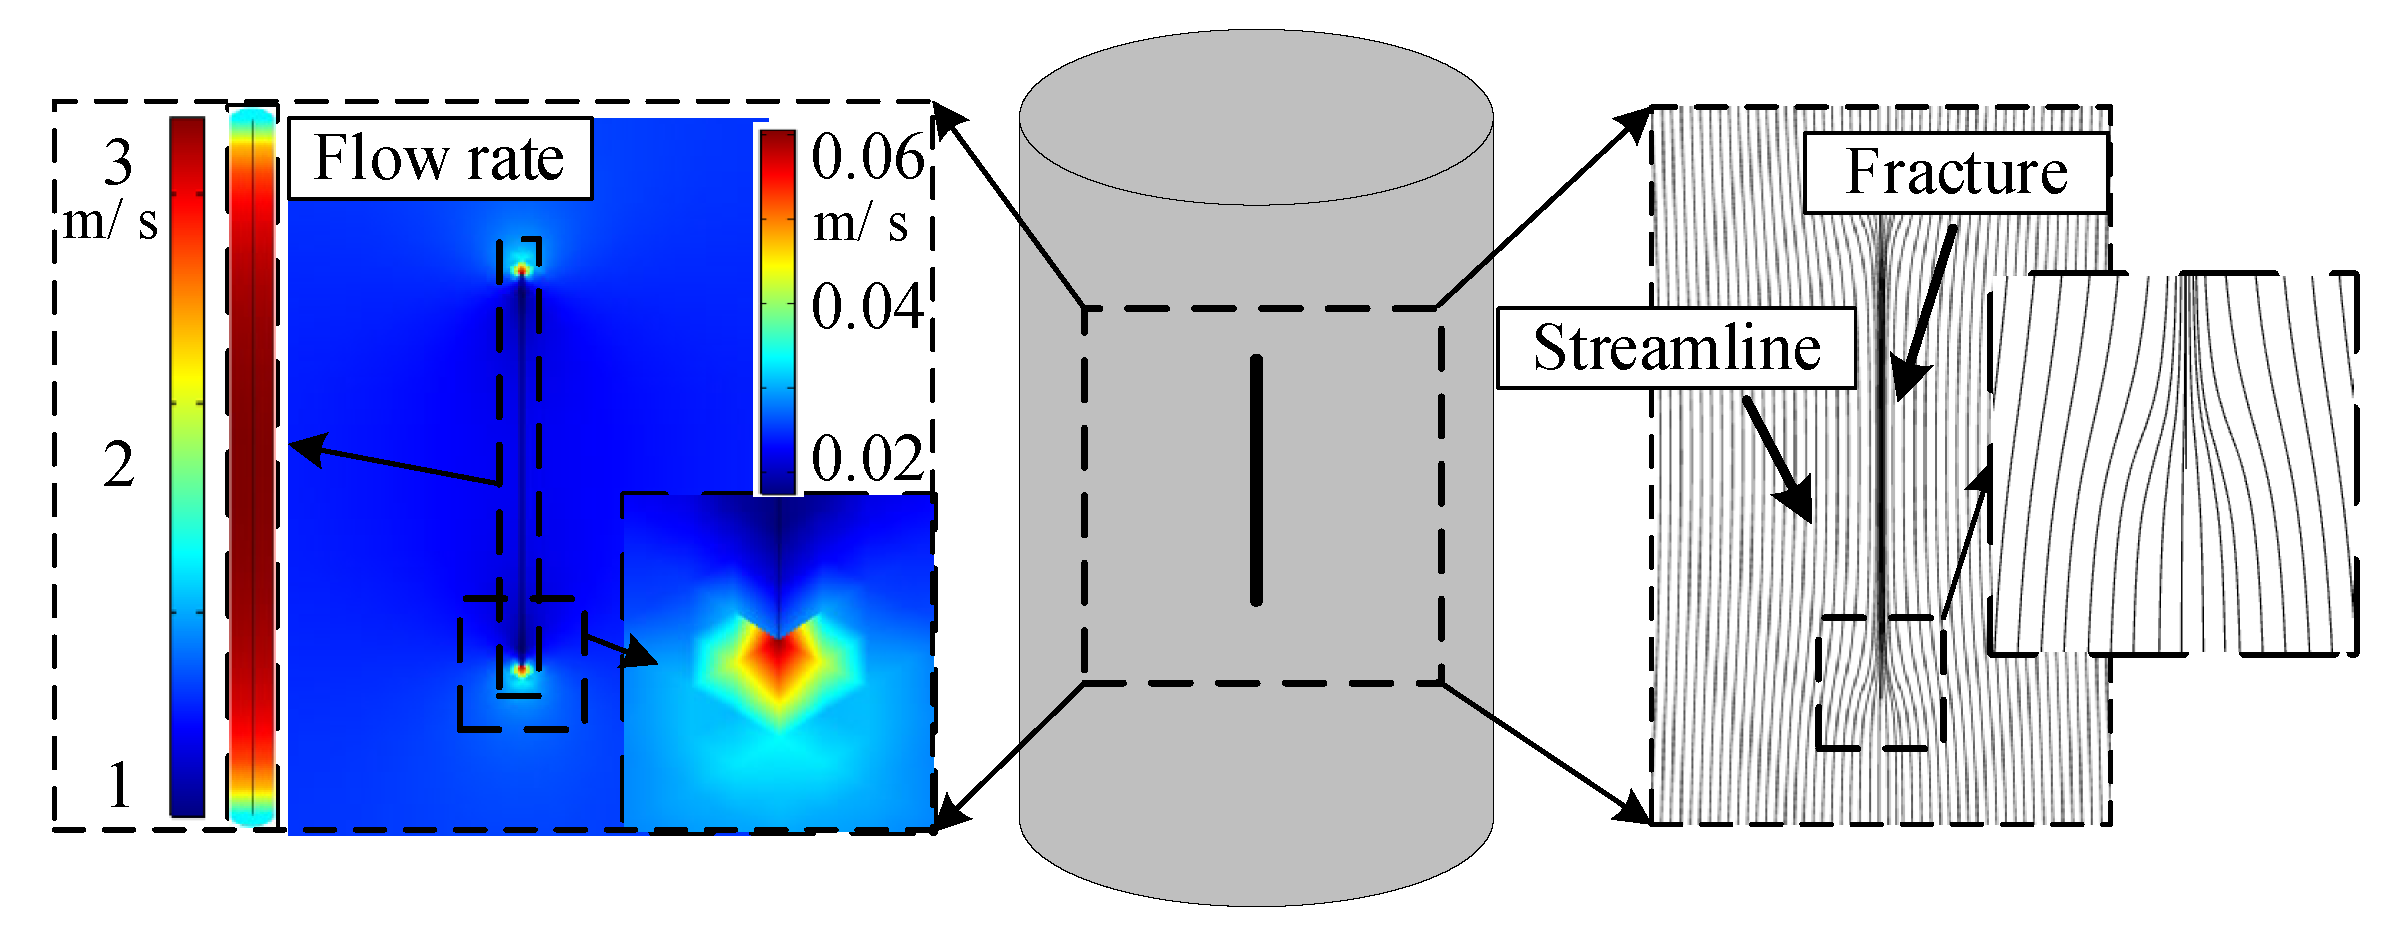
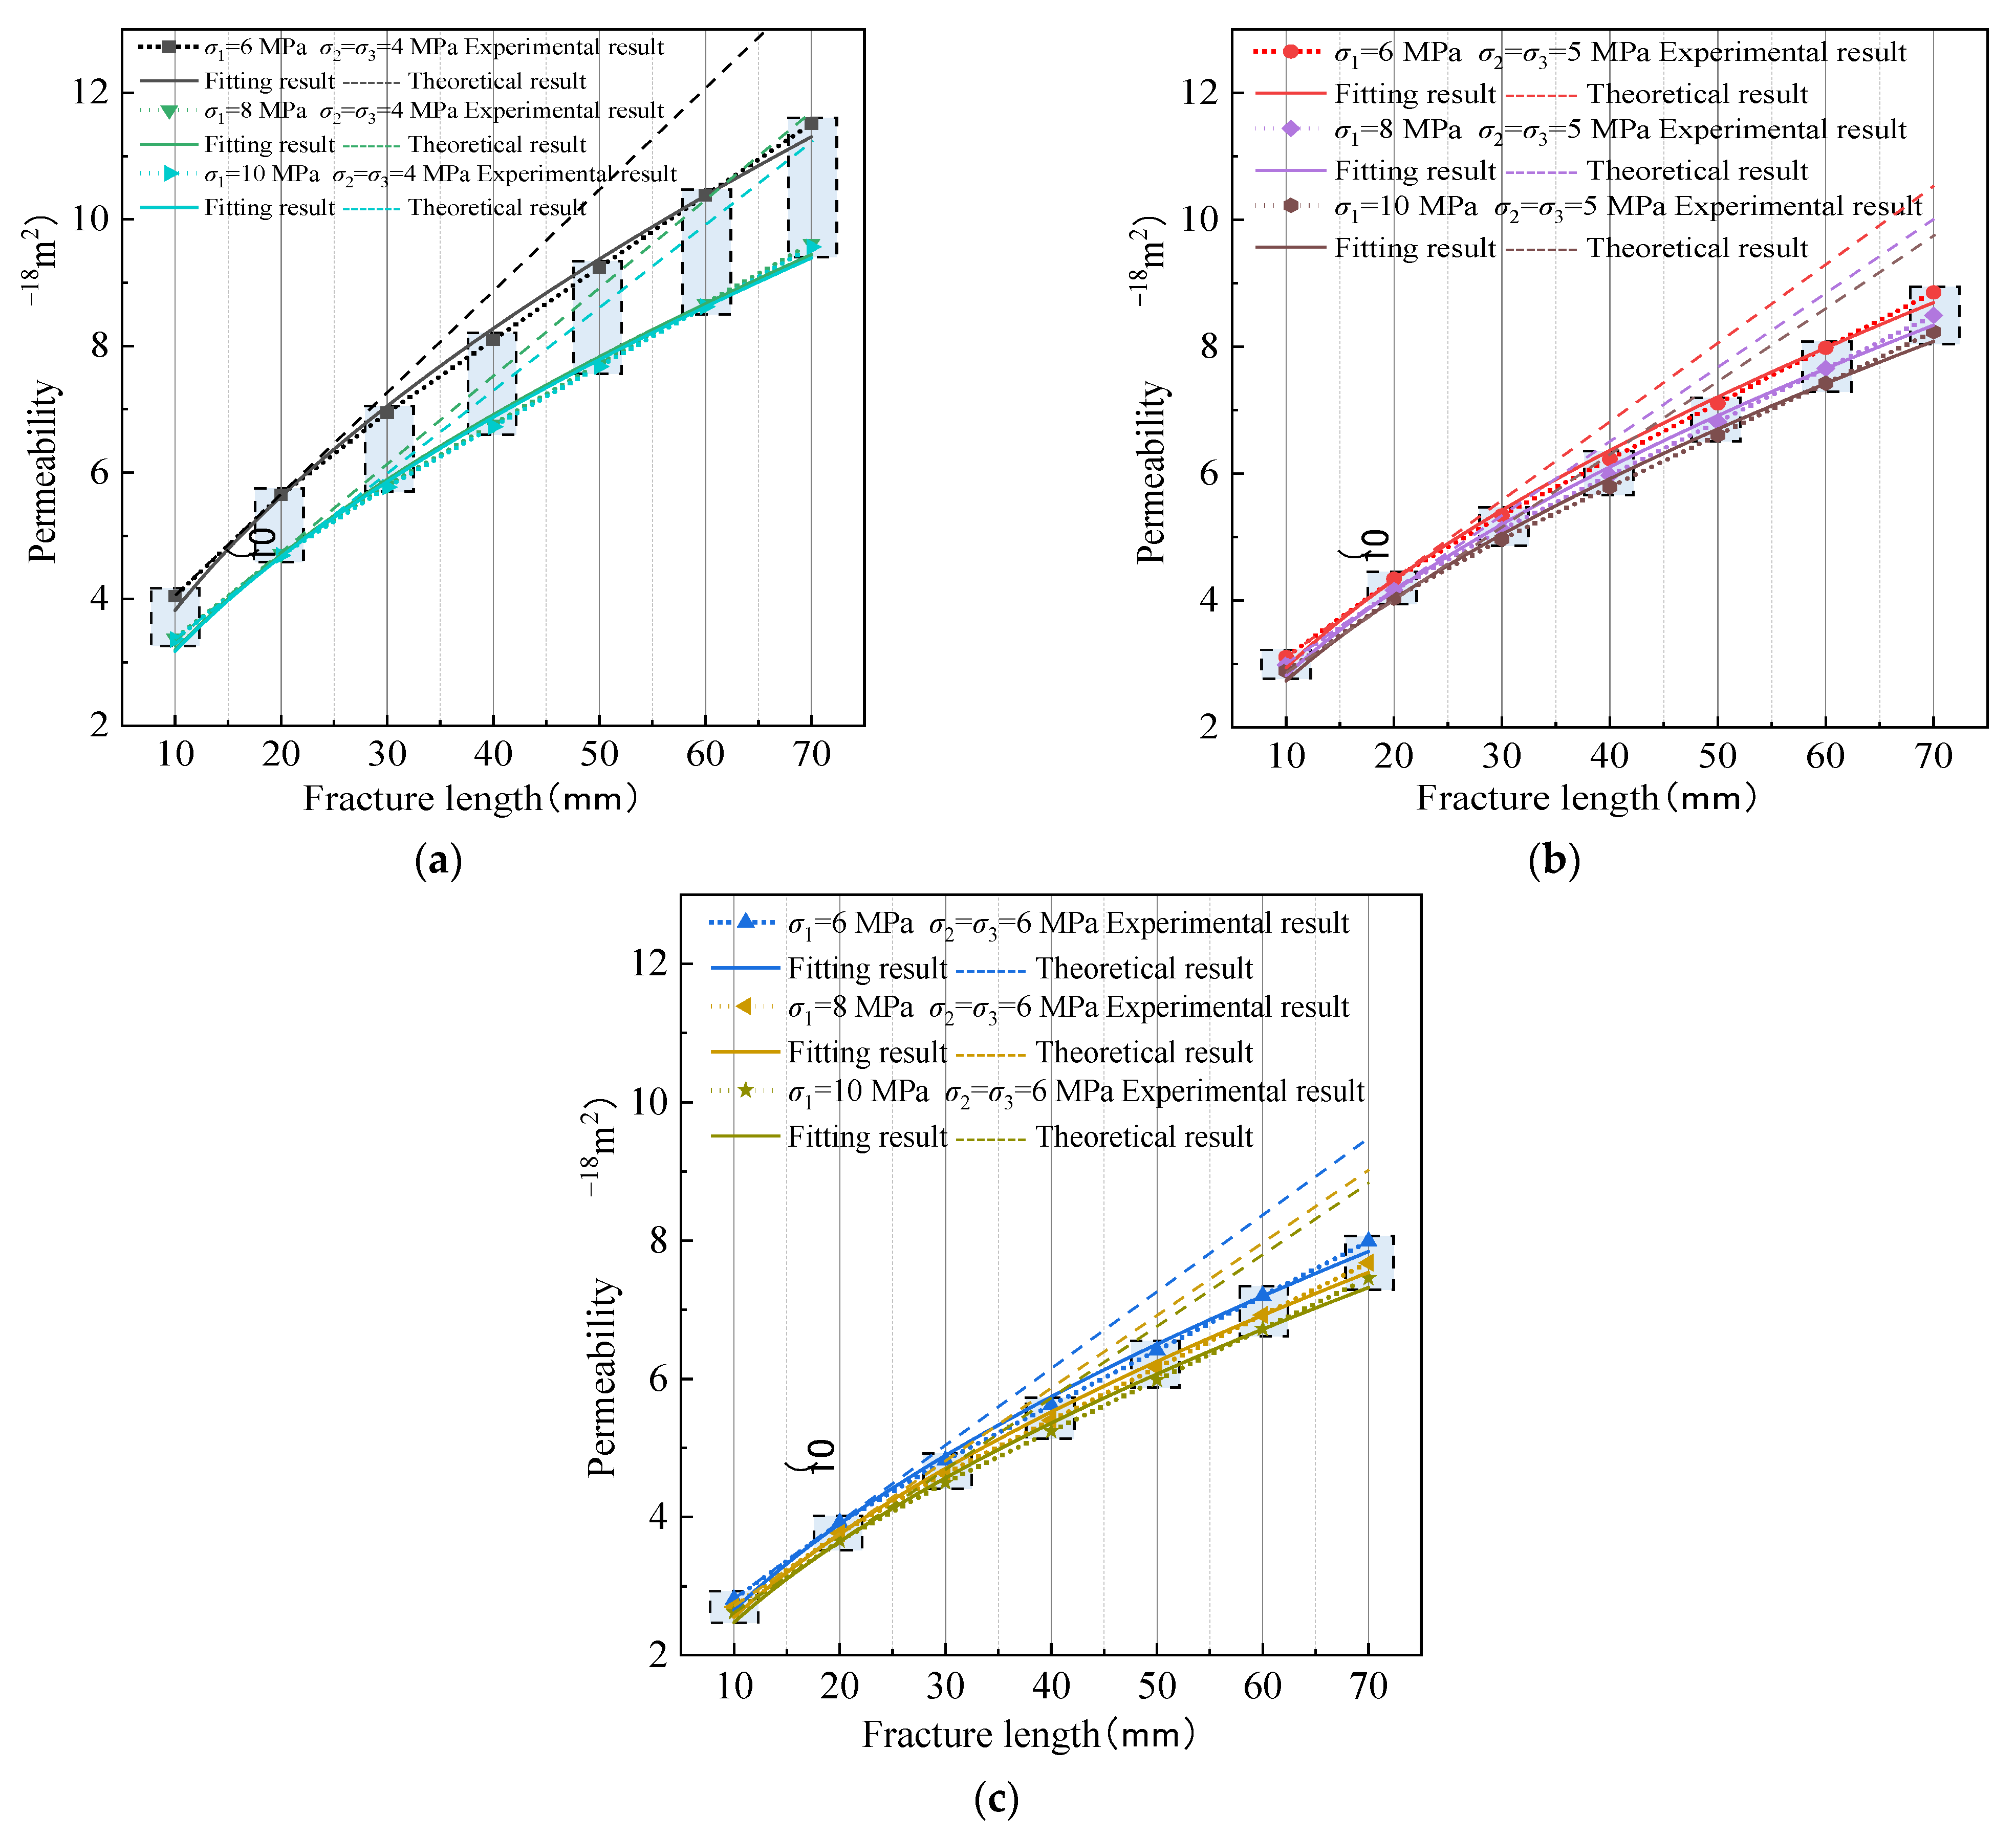
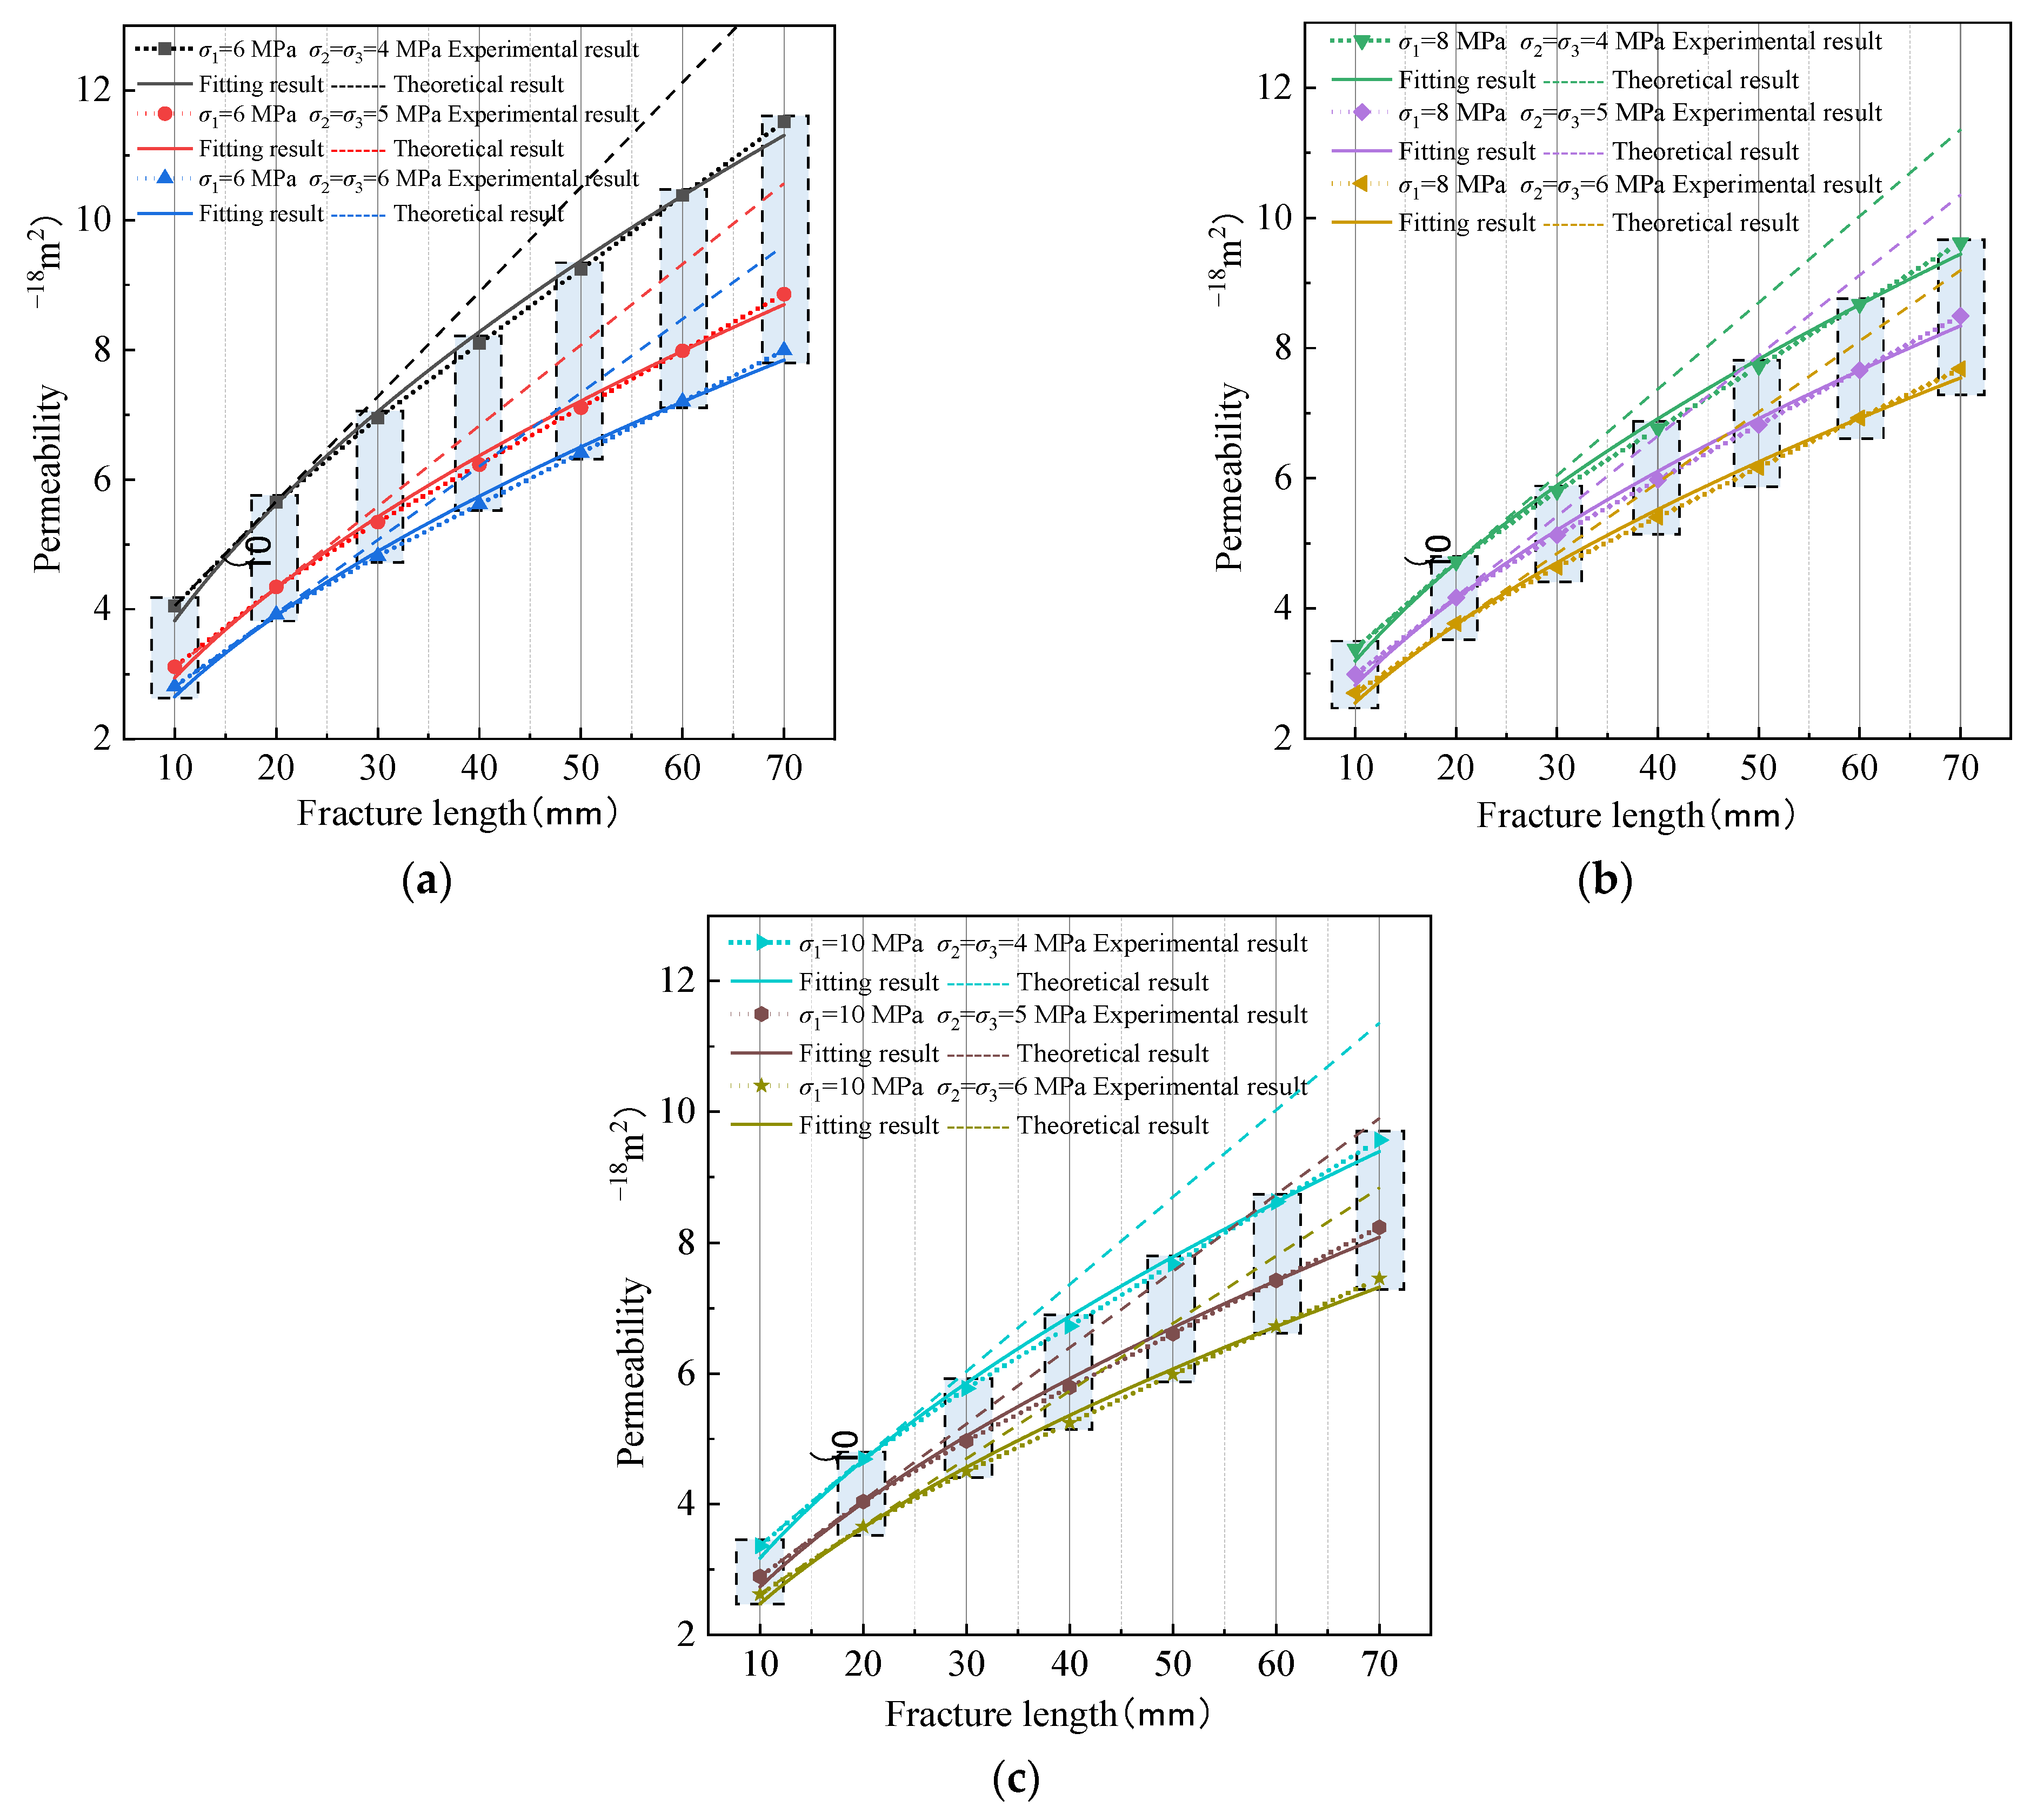
According to the seepage experiment results for different fracture lengths under different stress conditions, a certain relationship exists between the seepage of the coal samples and the size of their own fractures. Under an axial pressure σ1 = 6 MPa, the confining pressure σ2 = σ3 = 4 MPa curve is considered as an example. When the crack length is 10 mm, the coal sample permeability is 4.04 × 10⁻¹⁸ m2, and with an increase in fracture length, when the fracture length is 70 mm, the coal sample permeability increases to 1.15 × 10⁻¹⁷ m2. Under the same stress condition, the coal sample permeability increases with an increase in the fracture length in the coal sample fracture seepage. A planar seepage model was developed using COMSOL software. Add a line segment to the planar model and define it as a fracture. Simulate the seepage of coal by setting parameters and boundary conditions. Water flows in from one end of the planar model and out from the other under a set pressure. The analysis of the seepage velocity of the seepage field leads to the following conclusions. The theoretical analysis and numerical simulation results show that when there are many or large fractures in the coal sample the seepage path will change, and a small part of the water will flow through the pores of the coal sample matrix, but mainly through the fractures, as shown in Figure 10. The existence of fractures can be understood through change in the seepage path length. The pressure gradient of seepage should change accordingly, and the permeability should show a linear change in theory; however, the permeability change results show nonlinear changes in actual experiments. After further analysis, the reason for this phenomenon is that, under the action of axial stress and confining pressure, the internal micropores of the coal body are compressed, resulting in the pores becoming smaller. The water absorbed in the coal body is squeezed and diffused into the fractures and becomes free water, which moves with the fractures under seepage pressure. While the applied stress produces new microcracks that expand and extend, the more obvious role is to close the more obvious cracks. This phenomenon is particularly evident when the crack size is large. This can explain the nonlinear change in coal sample permeability with the increase in fracture length, and also proves that there is a size effect of coal seepage. The seepage results of coal samples having the same fracture length were analysed. When the fracture length was 10 mm, the variation range of coal sample permeability under different stress conditions was 2.62 × 10⁻¹⁸~4.04 × 10⁻¹⁸ m2, variation 1.42 × 10⁻¹⁸ m2; when the crack length was 70 mm, the variation range of the coal sample permeability under different stress conditions was 7.35 × 10⁻¹⁸~1.11 × 10⁻¹⁷ m2, variation 3.75 × 10⁻¹⁸ m2. In the experimental group with a small fracture length, the change in permeability caused by the change in stress condition was small; in the same experimental group with a large fracture length, the change in permeability caused by the change in stress conditions increased significantly.
According to the change trends in each group of experimental fitting curves, when seepage occurs in coal samples and the fracture length reaches a certain value, the permeability of the coal samples tends to be stable, and the fracture length can be termed as the critical seepage size under this time and condition. The critical size will vary under different stress and seepage conditions. From the above analysis, a size effect is observed in which the permeability varies with the fracture length.
2.5.1. Seepage of Coal Samples with Multiple Fracture Lengths under Different Axial Pressures
According to Figure 11, when the confining pressure σ2 = σ3 = 4 MPa, the axial pressure σ1 changes to 6, 8, and 10 MPa. With the increase in fracture length, the permeability of the coal samples changes by 4.04 × 10⁻¹⁸ to 1.11 × 10⁻¹⁷ m2, 3.38 × 10⁻¹⁸~9.57 × 10⁻¹⁸ m2, 3.36 × 10⁻¹⁸~9.51 × 10⁻¹⁸ m2, respectively, and the permeability change is approximately 1.8 times; When confining pressure σ2 = σ3 = 5 MPa, the axial pressure σ1 changes to 6 MPa, 8 MPa, and 10 MPa. With the increase in fracture length, the permeability of the coal sample changes from 3.11 × 10⁻¹⁸ to 8.39 × 10⁻¹⁸ m2, 2.99 × 10⁻¹⁸~8.11 × 10⁻¹⁸ m2, 2.89 × 10⁻¹⁸~7.97 × 10⁻¹⁸ m2, respectively, and the permeability change is approximately 1.7 times. When the confining pressure σ2 = σ3 = 6 MPa, the axial pressure σ1 changes to 6, 8, and 10 MPa. With the increase in fracture length, the permeability of the coal samples changed from 2.81 × 10⁻¹⁸ to 7.62 × 10⁻¹⁸ m2, 2.70 × 10⁻¹⁸~7.42 × 10⁻¹⁸ m2, 2.62 × 10⁻¹⁸~7.42 × 10⁻¹⁸ m2, respectively, and the permeability change was approximately 1.7 times. Further analysis leads to the following conclusions: changing the axial pressure σ1 when the surrounding pressures σ2 and σ3 are small, the overall change in permeability is more obvious; when the surrounding pressures σ2 and σ3 are large, changing the axial pressure σ1 weakens its effect on permeability. Under the same stress conditions, the seepage size effect of the coal samples is more obvious.
2.5.2. Seepage of Coal Samples with Multiple Fracture Lengths under Different Confining Pressures
Figure 12 shows that when the axial pressure σ1 is 6 MPa and the surrounding pressures σ2 and σ3 are 4 MPa, 5 MPa, and 6 MPa, respectively, the permeability variations in the experimental group with fracture lengths of 10 mm and 70 mm range from 2.81 × 10⁻¹⁸ to 4.04 × 10⁻¹⁸ m2 and 7.62 × 10⁻¹⁸ to 1.11 × 10⁻¹⁷ m2, respectively, showing a permeability variation of approximately 2.83 times. When the axial pressure σ1 is 8 MPa and the surrounding pressures σ2 and σ3 are 4 MPa, 5 MPa, and 6 MPa, respectively, the permeability variations within the experimental group of 10 mm and 70 mm fracture lengths range from 2.70 × 10⁻¹⁸ to 3.38 × 10⁻¹⁸ m2 and 7.42 × 10⁻¹⁸ to 9.57 × 10⁻¹⁸ m2, respectively, and the permeability variation is approximately 3.2 times. When the axial pressure σ1 is 10 MPa and the surrounding pressures σ2 and σ3 are 4 MPa, 5 MPa, and 6 MPa, respectively, the permeability variation ranges from 2.62 × 10⁻¹⁸ to 3.36 × 10⁻¹⁸ m2 and 7.35 × 10⁻¹⁸ to 9.51 × 10⁻¹⁸ m2 within the experimental group for fracture lengths of 10 mm and 70 mm, respectively. The permeability variation is approximately 2.9 times. Comparing the dimensional effect of axial stress with the dimensional effect of the envelope pressure, the change in envelope pressure is seen to have a more pronounced effect on the dimensional effect of permeability. When the surrounding pressure increases, the fractures within the coal are squeezed and the fracture width is further reduced, resulting in a more pronounced change in permeability when other conditions remain constant. From the above analysis, a size effect is seen in the seepage of the coal samples and the surrounding pressure σ2 and σ3 has a significant effect on the permeability and exacerbates the size effect of the seepage to a certain extent.
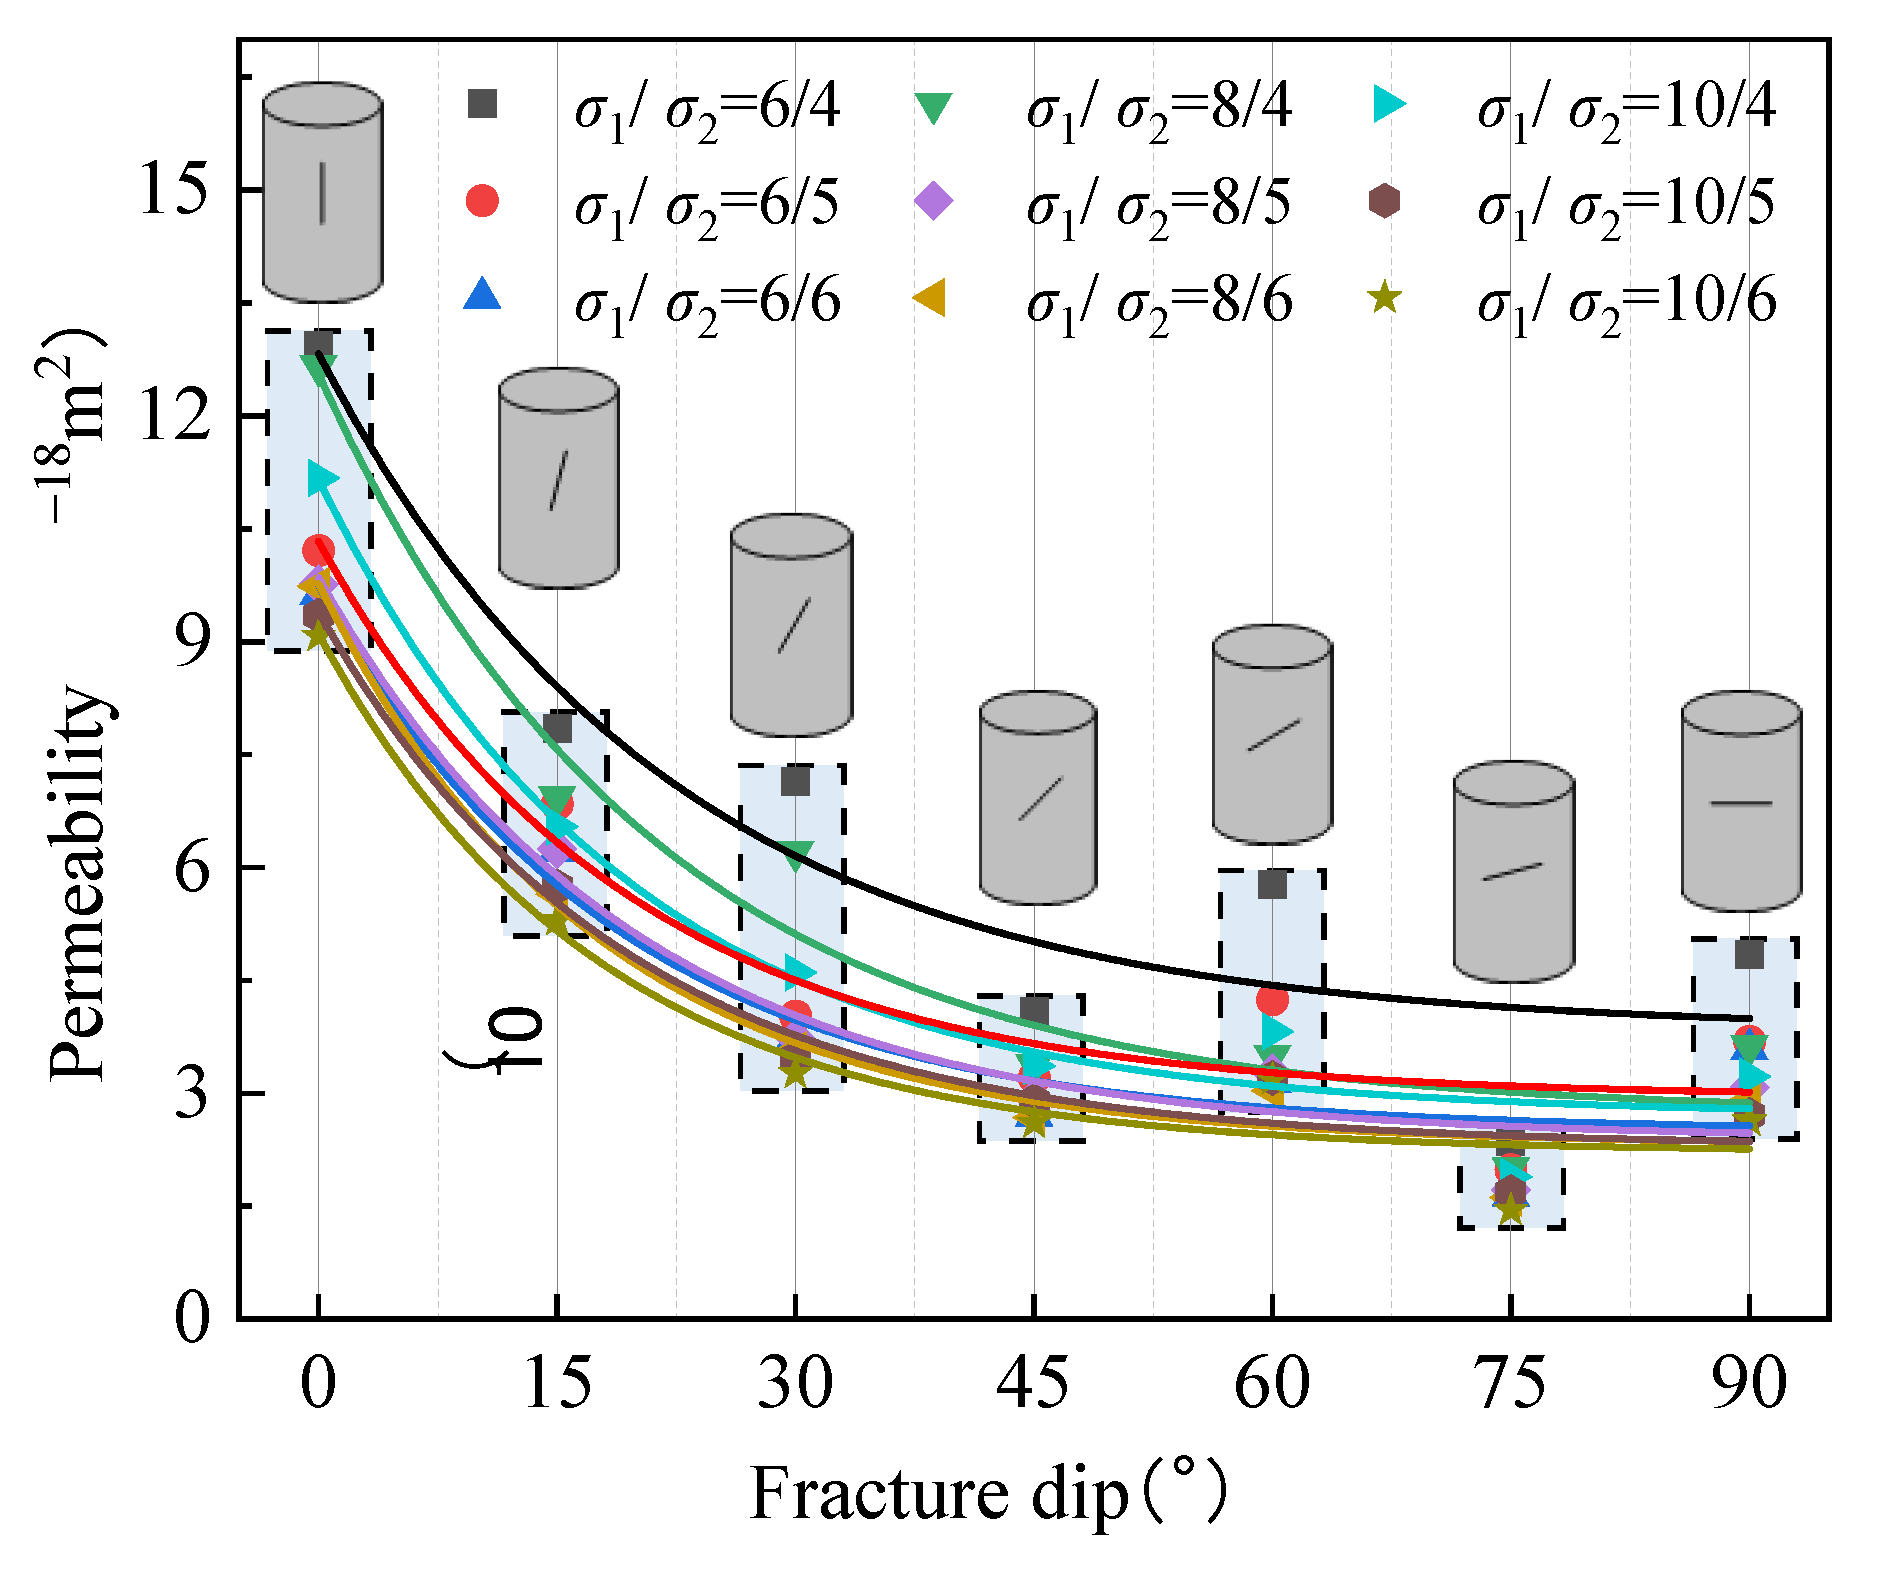
2.6. Fracture Seepage Patterns in Coal at Different Fracture Dips
Researchers have now found that fractures in coal at different dip angles have a significant effect on the mechanical characteristics of the coal. Fractures with different inclination angles can reduce the strength of the coal and accelerate its change in the stressed state. It is now known that fracture seepage is influenced by the mechanical characteristics of the fractures in the coal. It is therefore important to investigate the effect of fractures of different inclination angles on the seepage characteristics of coal as well. To supplement the study of the size effect of the permeability of coal samples under different stress conditions and verify the effect of fracture inclination on permeability, experiments on the percolation of coal samples with different fracture inclinations are now being conducted. The experimental results are shown in Figure 13. Based on the experimental results, it can be seen that, under the assumption that the effect of differences between different blocks of coal samples on permeability is negligible, the permeability of the coal samples gradually decreases as the inclination angle gradually increases from 0° (with the coal sample laminae) to 90° (vertical coal sample laminae) under the same stress conditions, and it reaches a minimum value under this condition at 90°. Using an axial pressure σ1 = 6 MPa and an enclosing pressure σ2 = σ3 = 4 MPa as an example, the permeability of the coal sample was reduced from 1.3 × 10⁻¹⁷ m2 to 4.8 × 10⁻¹⁸ m2, a reduction of approximately 63%. Under the same inclination angle, the permeability of the coal samples was larger when the axial pressures σ1, σ2, and σ3 were smaller. For example, when the inclination angle was 0°, the permeability of the coal sample varied from 9.1 × 10⁻¹⁸ to 1.3 × 10⁻¹⁷ m2 under different stress conditions with a larger range of variation. When the inclination angle was 90°, the permeability of the coal sample varied from 2.6 × 10⁻¹⁸ to 4.8 × 10⁻¹⁸ under different stress conditions, which is a smaller range of variation. When the angle between the fractures and the laminae is small, the effect of different stress conditions on the seepage of coal samples is more pronounced, and the permeability is greater, which can also explain why the majority of seepage of coal samples occurs in the fractures along the laminae of coal samples.
From the above analysis, different fracture inclination angles affect the seepage of coal samples, and permeability tends to decrease when the angle between the fracture and lamina of the coal sample increases and reaches a minimum value when the fracture is perpendicular to the lamina. The results of this experiment can complement the subsequent multi-factor coupling analysis of seepage flow on coal samples by the seepage size effect.
3. Numerical Simulation Study of the Fracture Seepage Field under Size Effects
3.1. Fracture Seepage Simulation
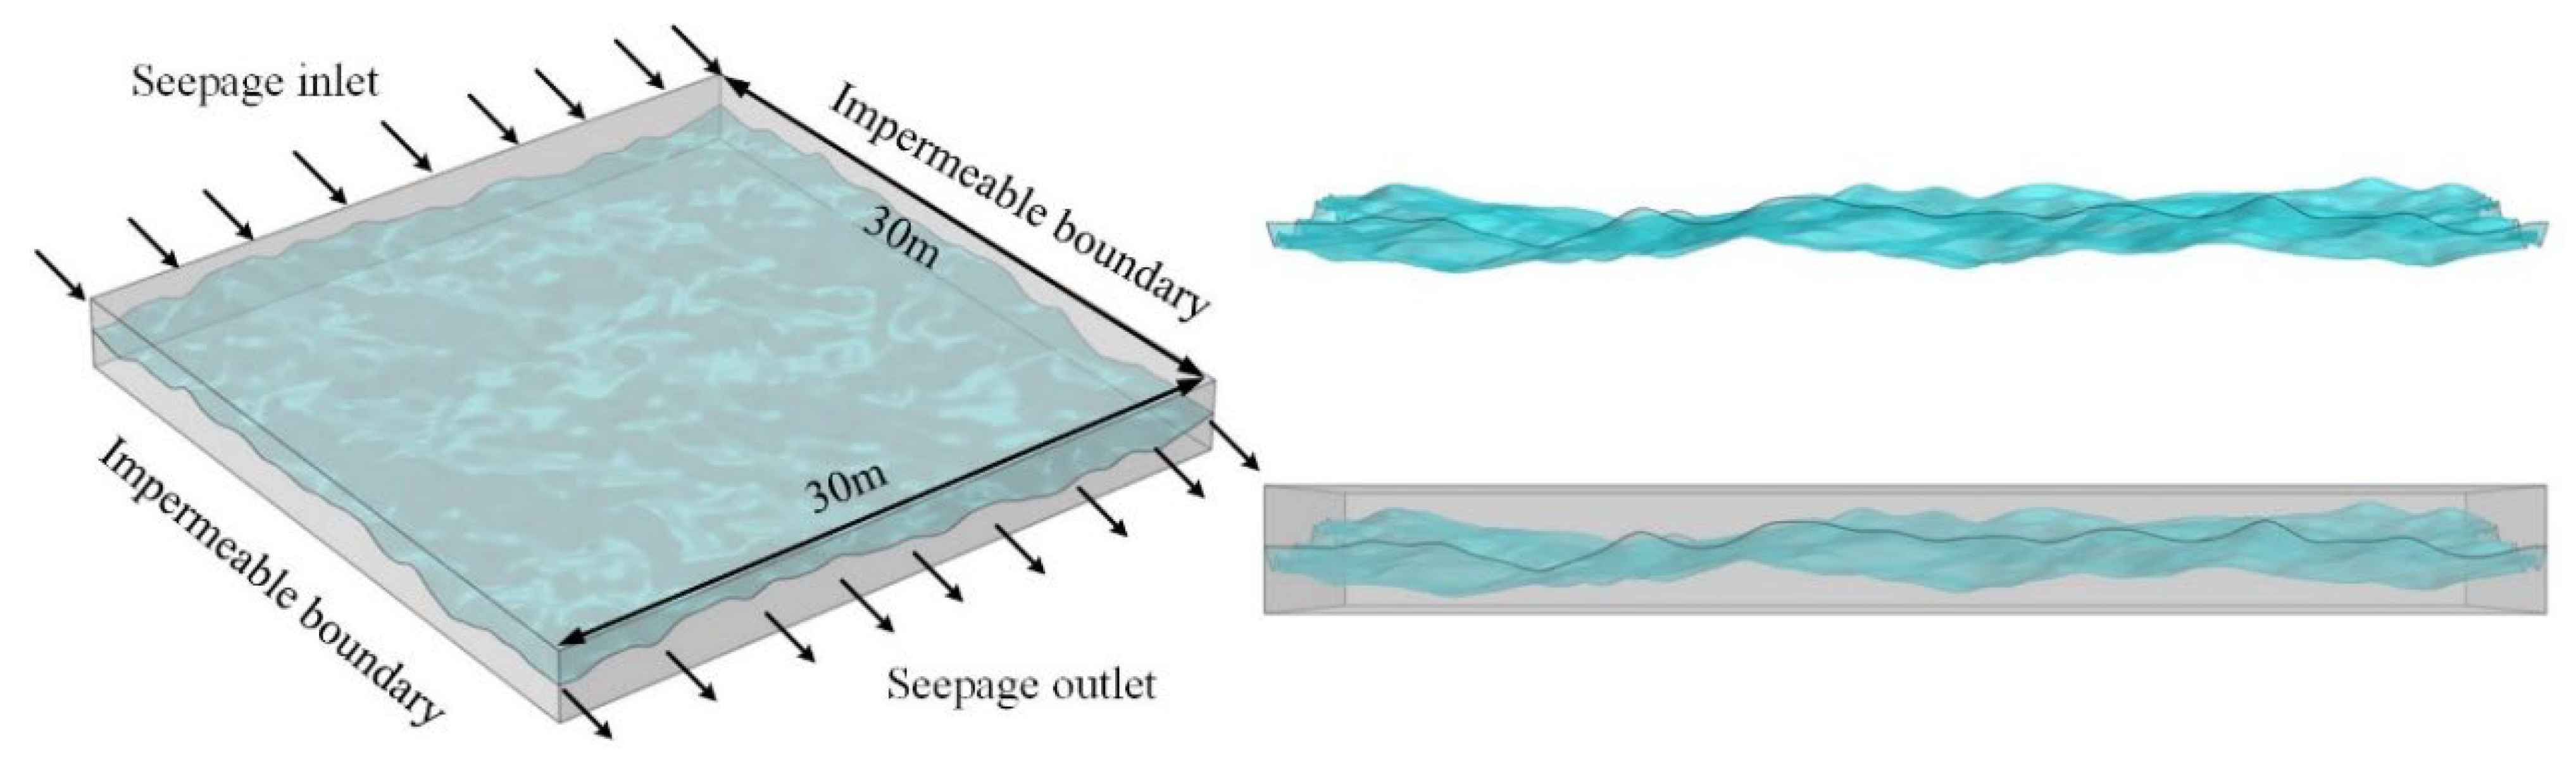
According to relevant data [23,24], the fracture face lengths in rock were mostly randomly distributed, the fracture face undulations were mostly normally distributed, and the fracture widths usually satisfied normal and negative exponential distributions. Three mean values of widths were taken here, namely, 1, 1.5, and 2 mm. After generating random functions using MATLAB, they were imported into COMSOL to establish a 30 m × 30 m fracture model, as shown in Figure 14. To obtain the seepage law of fractures under different specimen sizes, the model sizes were divided into 30 groups with side lengths of 1–30 m. To study the seepage law under the influence of different fracture roughness levels, the rough undulating structural surface morphology with JRC of 0–20 was determined by the JRC modified straight edge method [25] based on the 10 standard contour curves characterizing the JRC proposed by Barton et al. [26,27,28]. The roughness coefficients were selected as fracture roughness coefficients by substituting the distribution pattern of JRC values obtained from multiple sets of random fractures, and 5.5, 10.5, and 15.5 were selected accordingly. Some physical properties of the coal or rock were used as seepage-matrix-related parameters for this simulation. The fracture numerical simulation parameters are listed in Table 3.
3.1.1. Seepage Phenomena under Size Effects
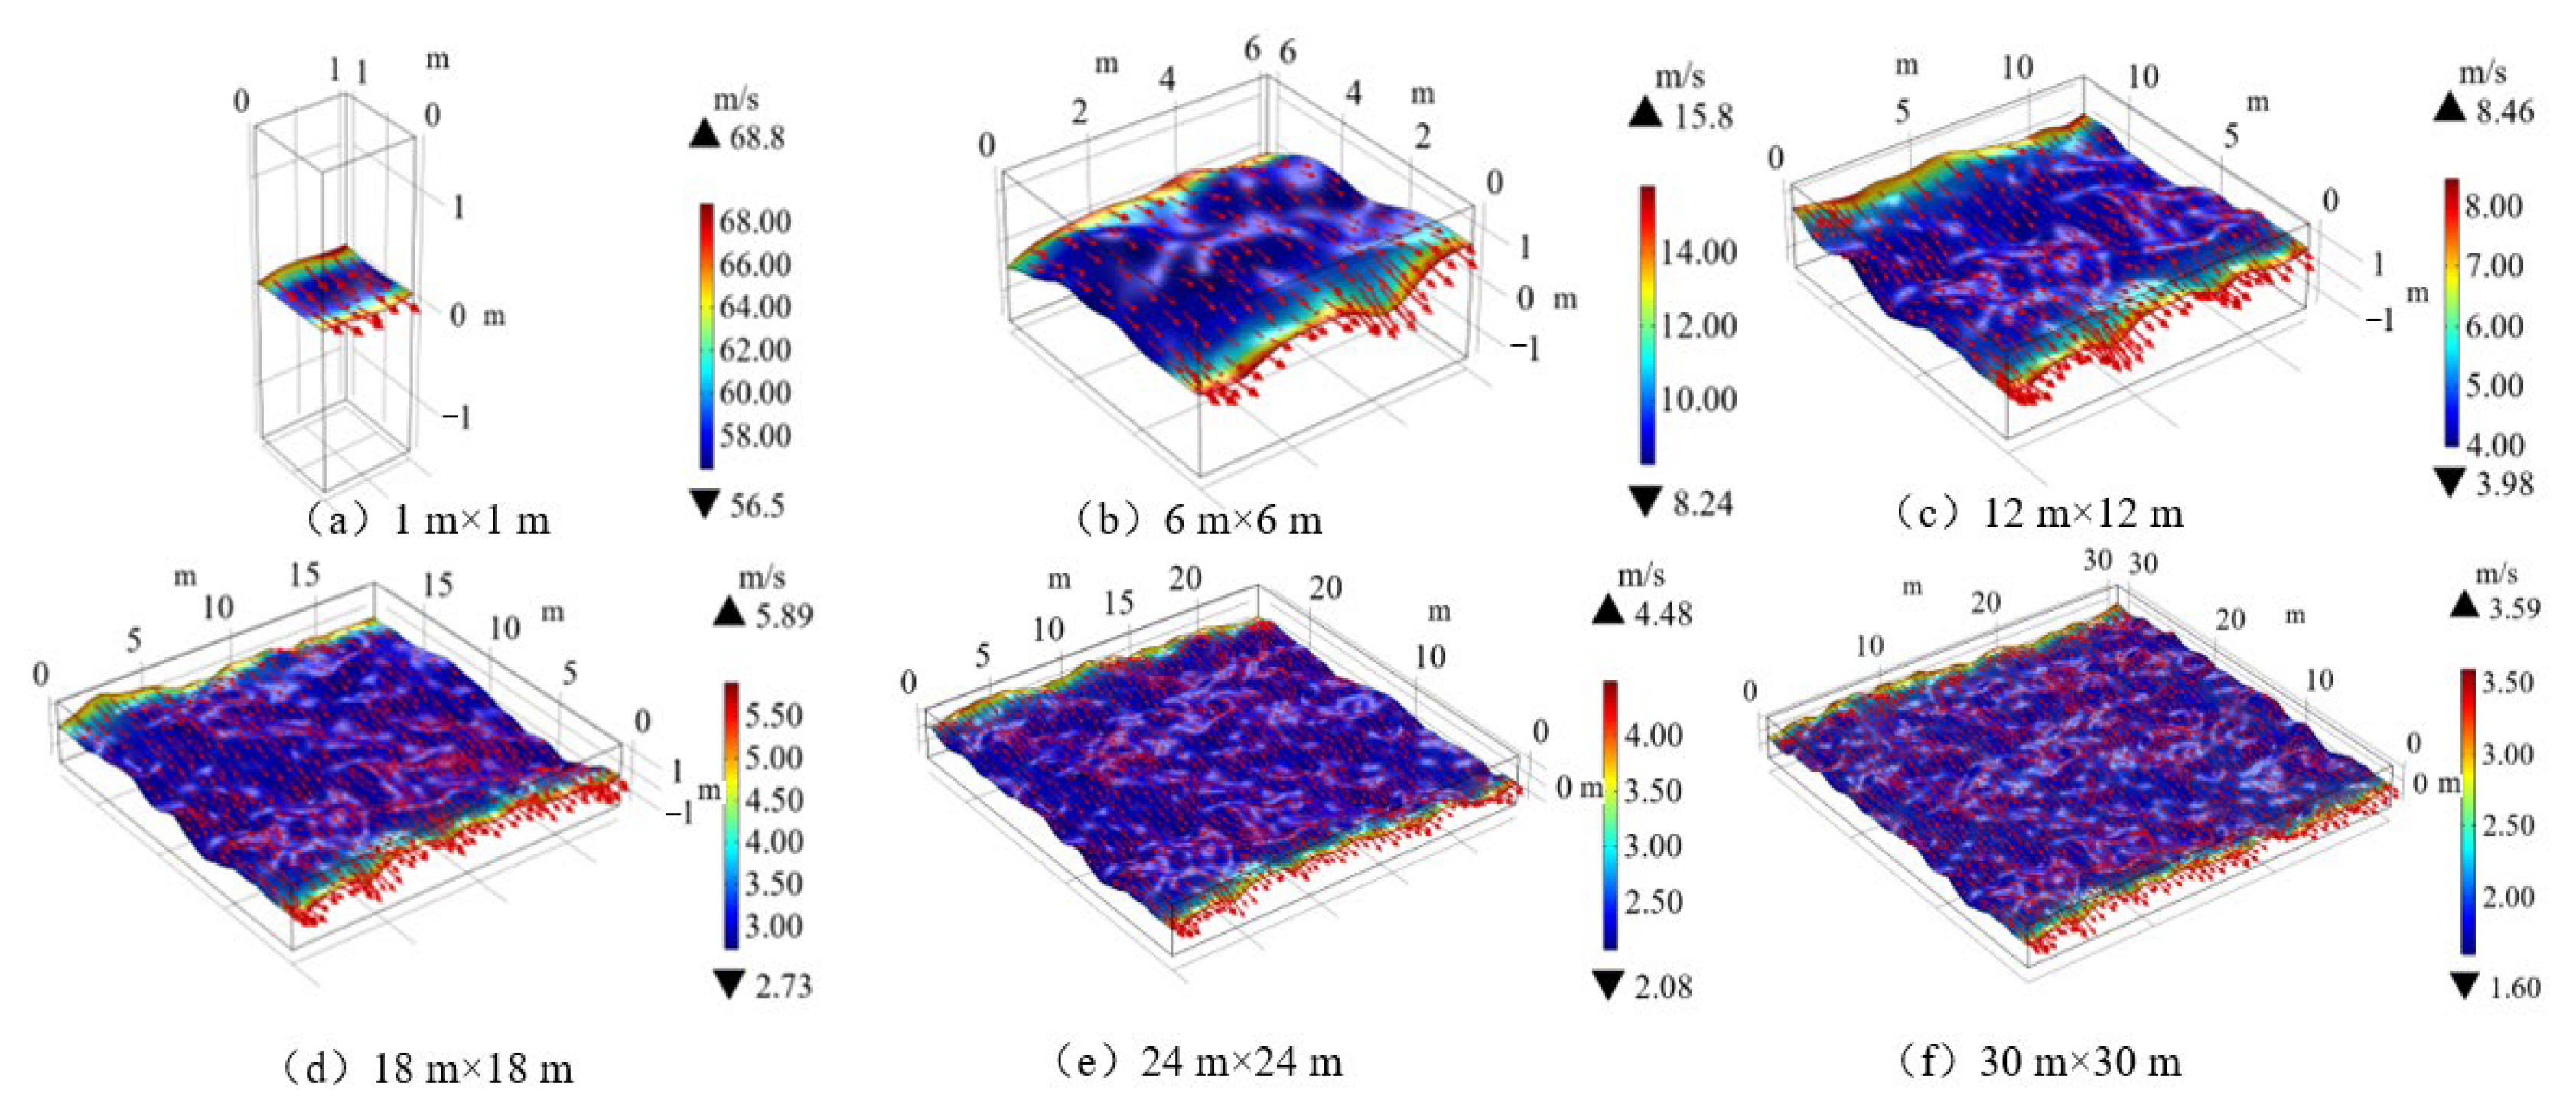
In the constructed 3D fractures, simulations were performed by selecting different fracture lengths from 1 × 1 m to 30 × 30 m when the fracture width was 2 mm, the fracture roughness coefficient (JRC) was 5.5, and the seepage pressure gradient was the same. Some of the simulation results are shown in Figure 15. The legend in Figure 15 indicates the percolation rate.
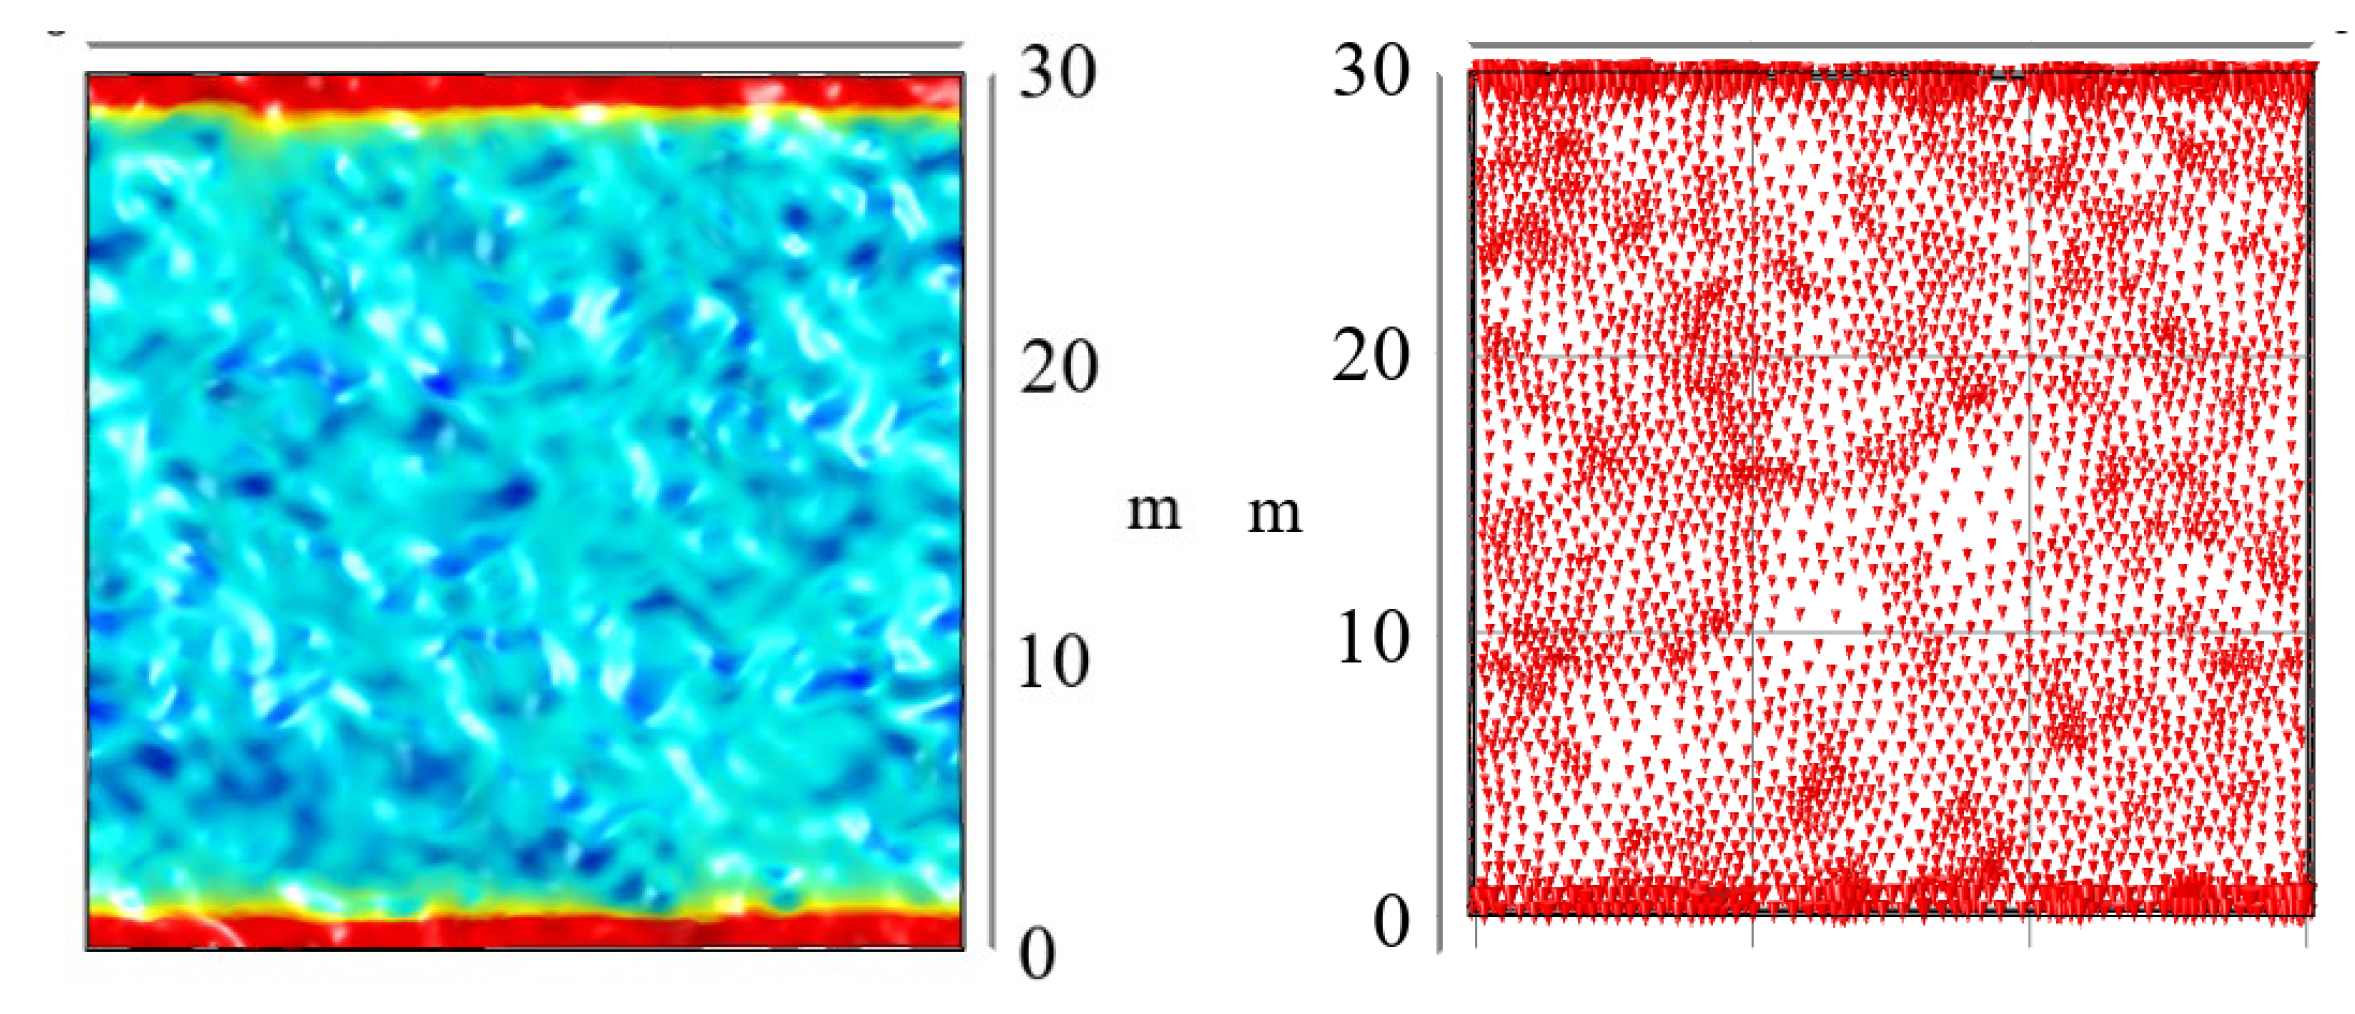
Analysis of the flow velocity distributions for different size models revealed that when water seeps through the fracture face, localized bypassing occurs because of the different degrees of undulation of the fracture face. When the size of the model increases, turbulence-like phenomena occur because of the difference in flow velocities within the fracture. This phenomenon can also occur in some areas owing to fracture width and it becomes more pronounced when the seepage pressure is higher and variation in the flow velocity is more pronounced, as shown in Figure 16.
3.1.2. Seepage Patterns for Different Fracture Widths under Size Effects
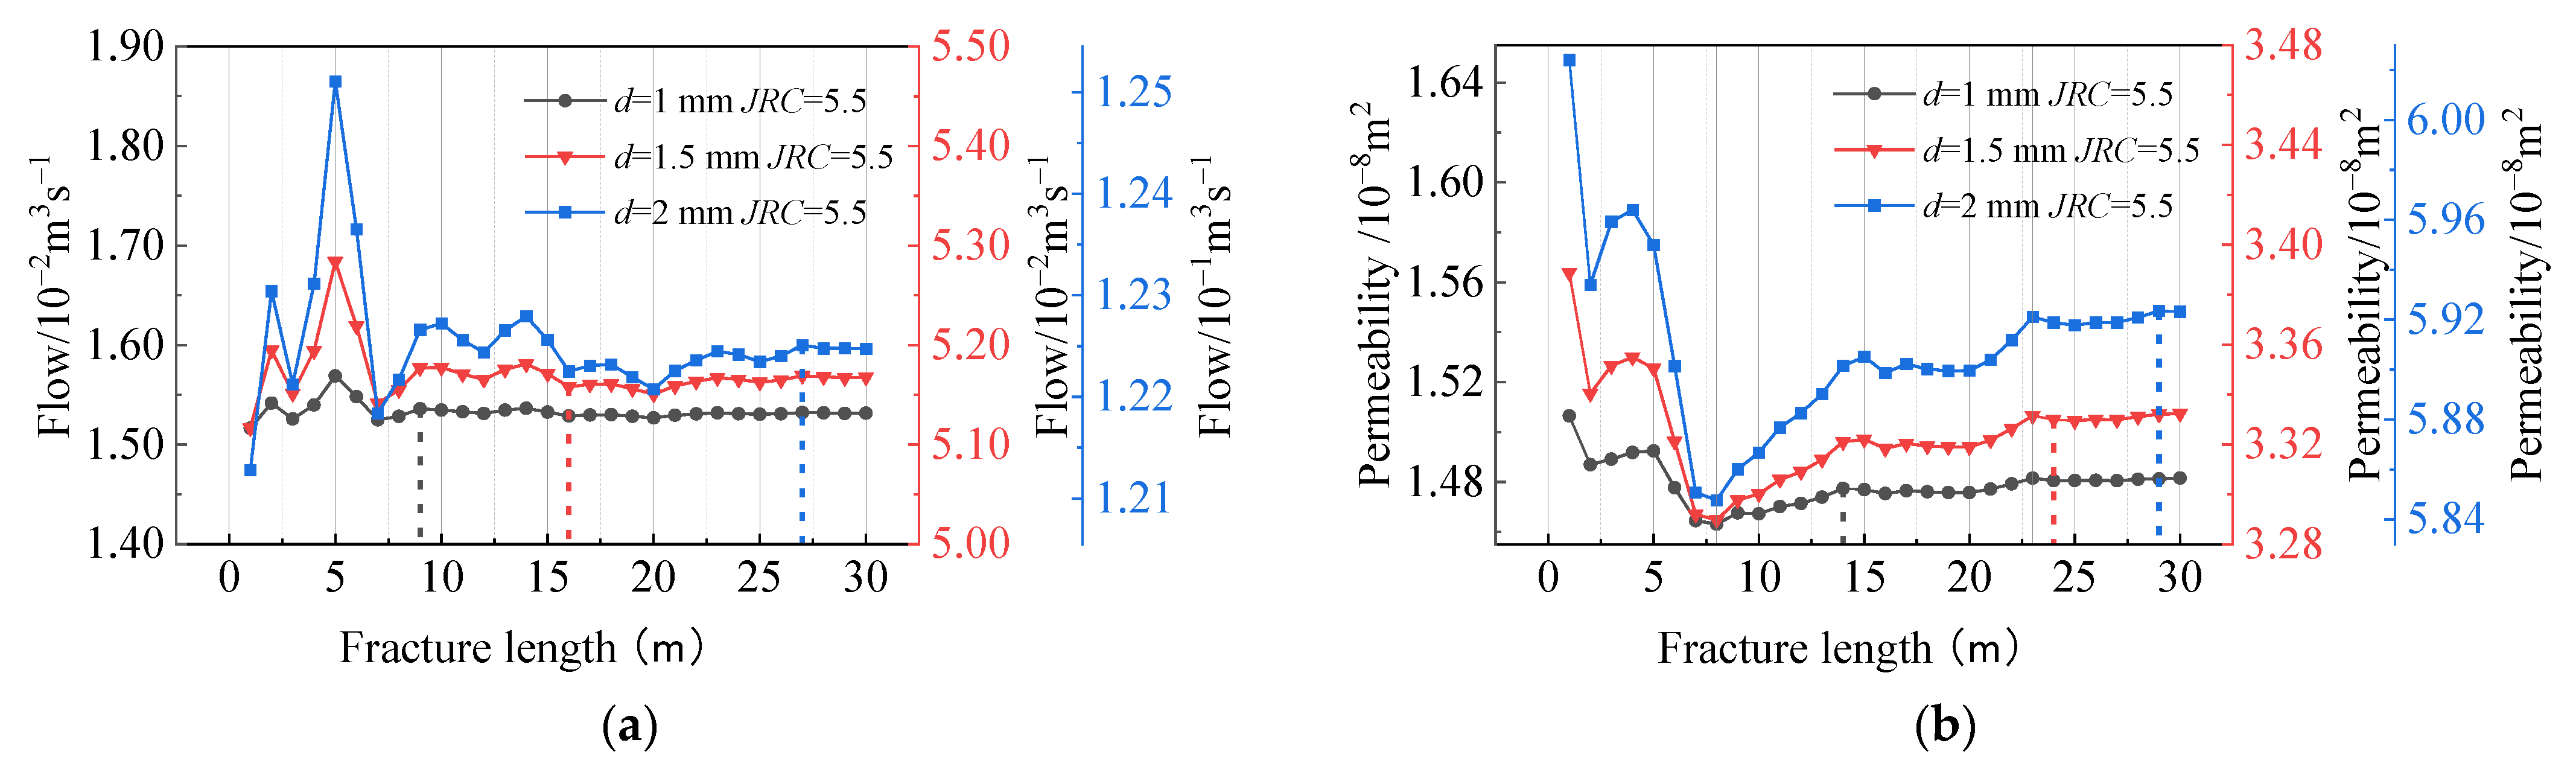
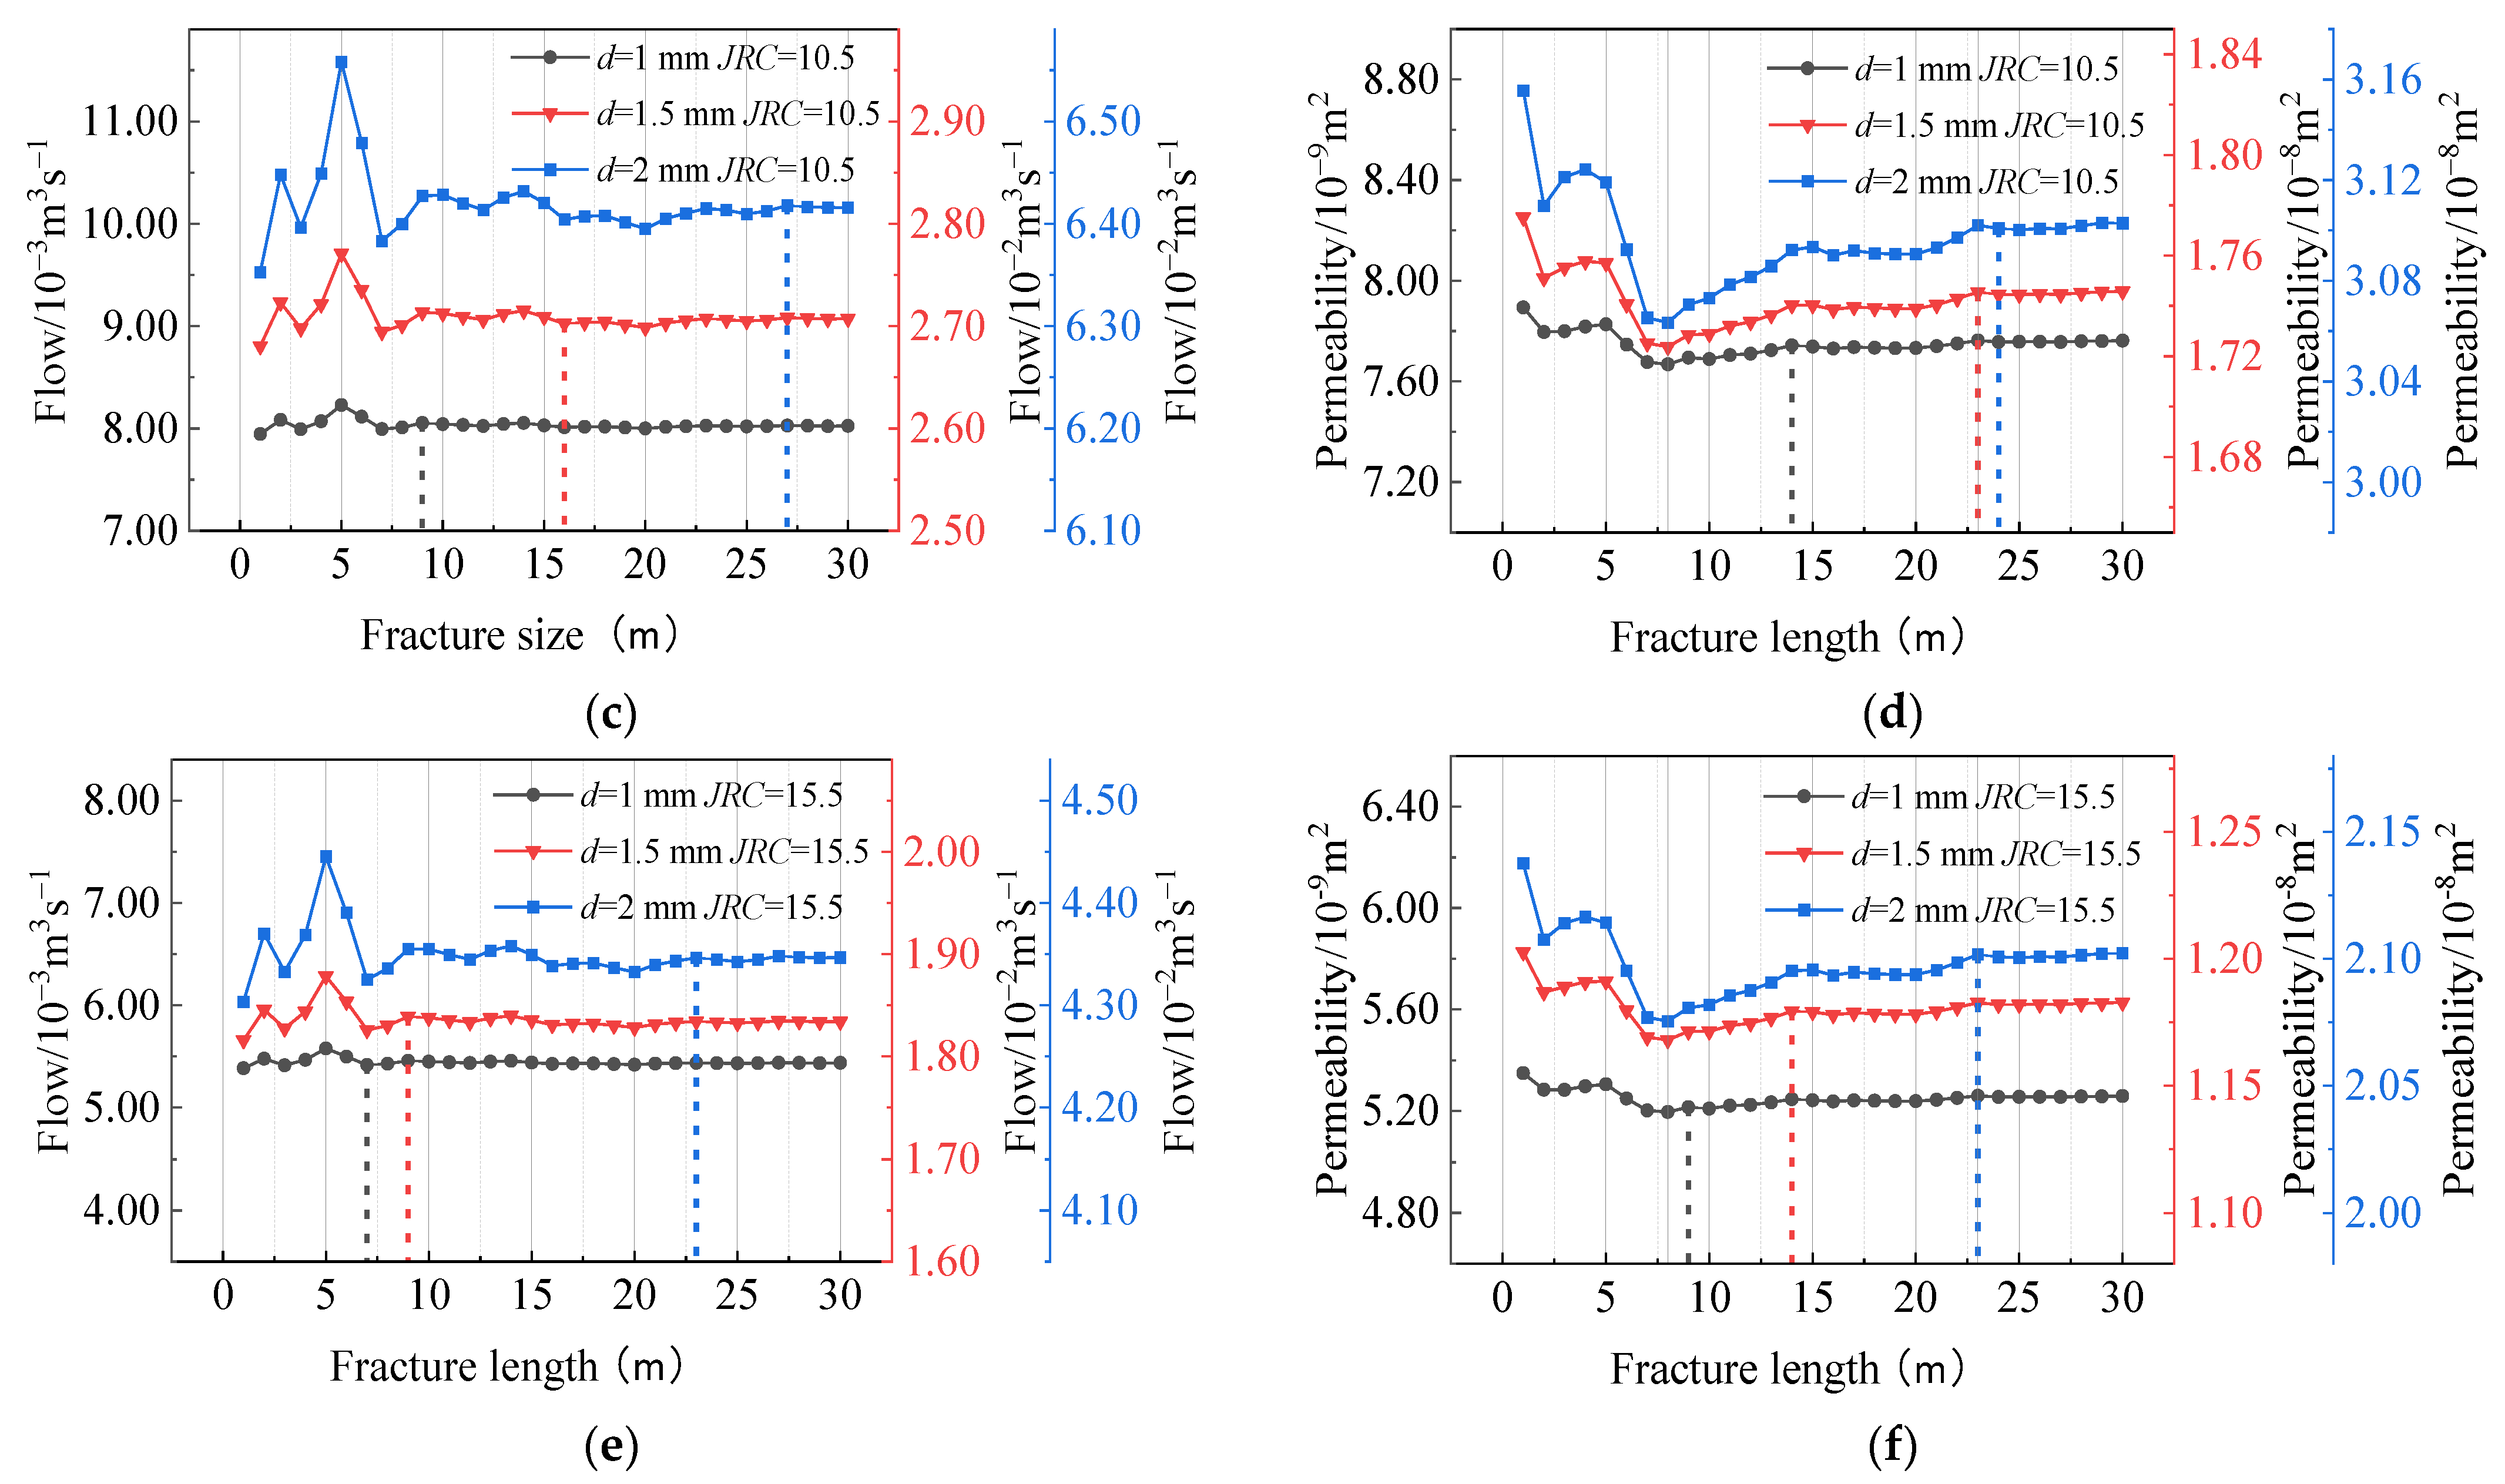
When fracture width is chosen as the variable to study the size effect of seepage, the rock-fracture-seepage-volume-versus-model-size curve and the rock-fracture-permeability-versus-fracture-length curve are shown in Figure 17.
Based on the relationship curves obtained from the above simulations, it can be seen that, under the conditions of the model parameters, the overall flow rate of the model in the length range of 0–30 m is between 10−3m3s−1 and 10−2 m3s−1 orders of magnitude, and the overall permeability is between 10−9m3s−1 and 10−8 m3s−1 orders of magnitude, and this result has a large order of magnitude difference with the presence of non-through fracture seepage flow in coal samples. This indicates that in the presence of through-fractures, seepage occurs mainly within the through fractures. When the fracture width is between 1 and 2 mm and the fracture roughness is 5.5, the permeability variation of the fracture at small lengths ranges from 1.5 × 10⁻⁸ m2 to 6.0 × 10⁻⁸ m2. When the fracture width is between 1 and 2 mm and fracture roughness is 15.5, the permeability variation of the fracture at small lengths ranges from 5.3 × 10⁻⁹ m2 to 2.1 × 10⁻⁸ m2, which shows that the fracture width has a greater influence on the fracture seepage. When the fracture roughness was kept constant and the fracture width increased, the change in the rock fracture permeability became increasingly obvious.
The curve variation pattern in Figure 17 also reveals that, for example, the permeability basically stops changing after the fracture length reaches 14 m and 29 m, respectively, during the increase in the fracture width from 1 mm to 2 mm at a fracture roughness of 5.5. Under different circumstances, when the fracture length changes, the seepage characteristics also change, thus reflecting the existence of the size effect of fracture seepage. When the fracture length reaches a certain value, the seepage characteristics remain unchanged, and the fracture size can be called the critical size under seepage conditions. When the fracture width is small, the internal connectivity of the fracture makes it easier for seepage to achieve stability in seepage in the small-size model; when the fracture width is increased, the internal connectivity of the fracture changes and a larger fracture size is required to achieve stable seepage, so this critical size increases.
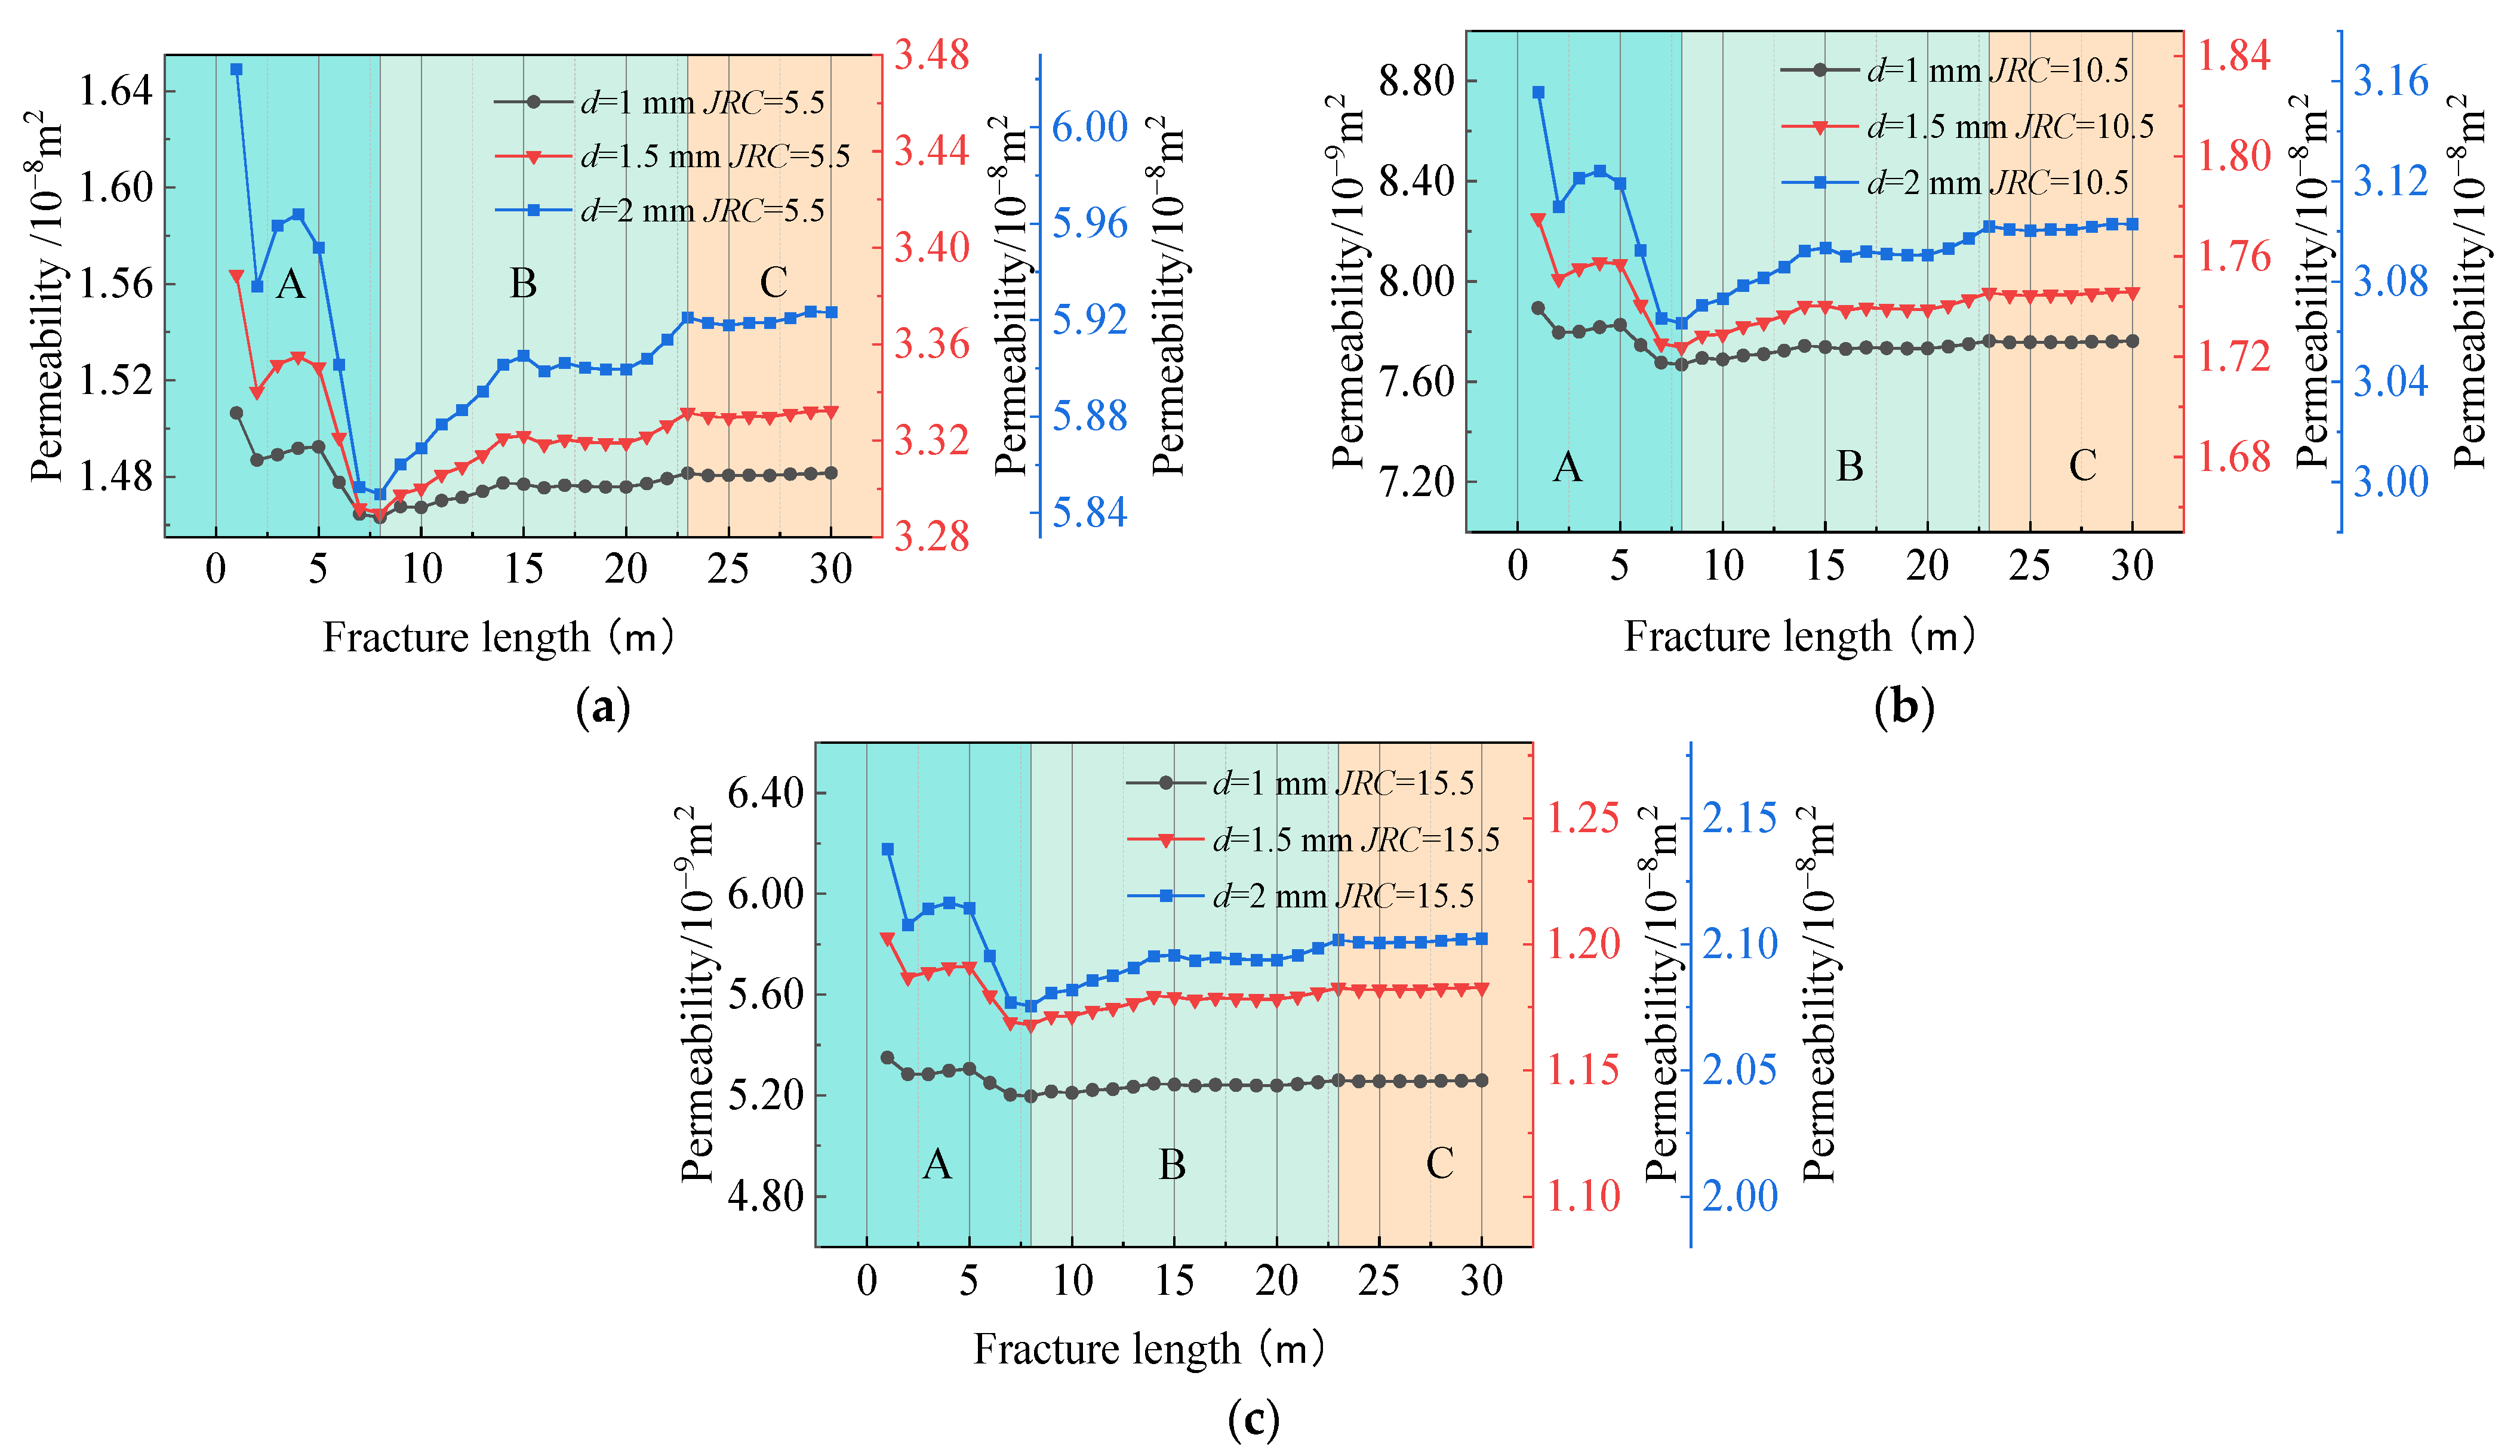
The variation in fracture permeability can be approximately divided into three stages according to the variation curve of permeability with fracture length, as shown in Figure 18. The first stage is the significant change stage, as shown in area A of the figure, where there is a large change in the permeability of the rock fractures within this stage, occurring approximately within the fracture length interval of 0 to 8 m. This also indicates that within this area, the fracture length was small, and the effect of the fracture width and fracture roughness was evident. The second stage is the stabilization stage, as shown in area B of the figure, during which there is a small variation in the permeability of the rock fractures, which occurs in the range of approximately 8 to 23 m of the fracture length, depending on the fracture width. The third stage is the stabilization stage, as shown in area C of the diagram, during which the permeability of the rock fractures remains essentially stable and continues to increase in fracture size, with the seepage characteristics remaining almost constant.
3.1.3. Fracture Seepage for Different Fracture Roughness Values with Size Effect
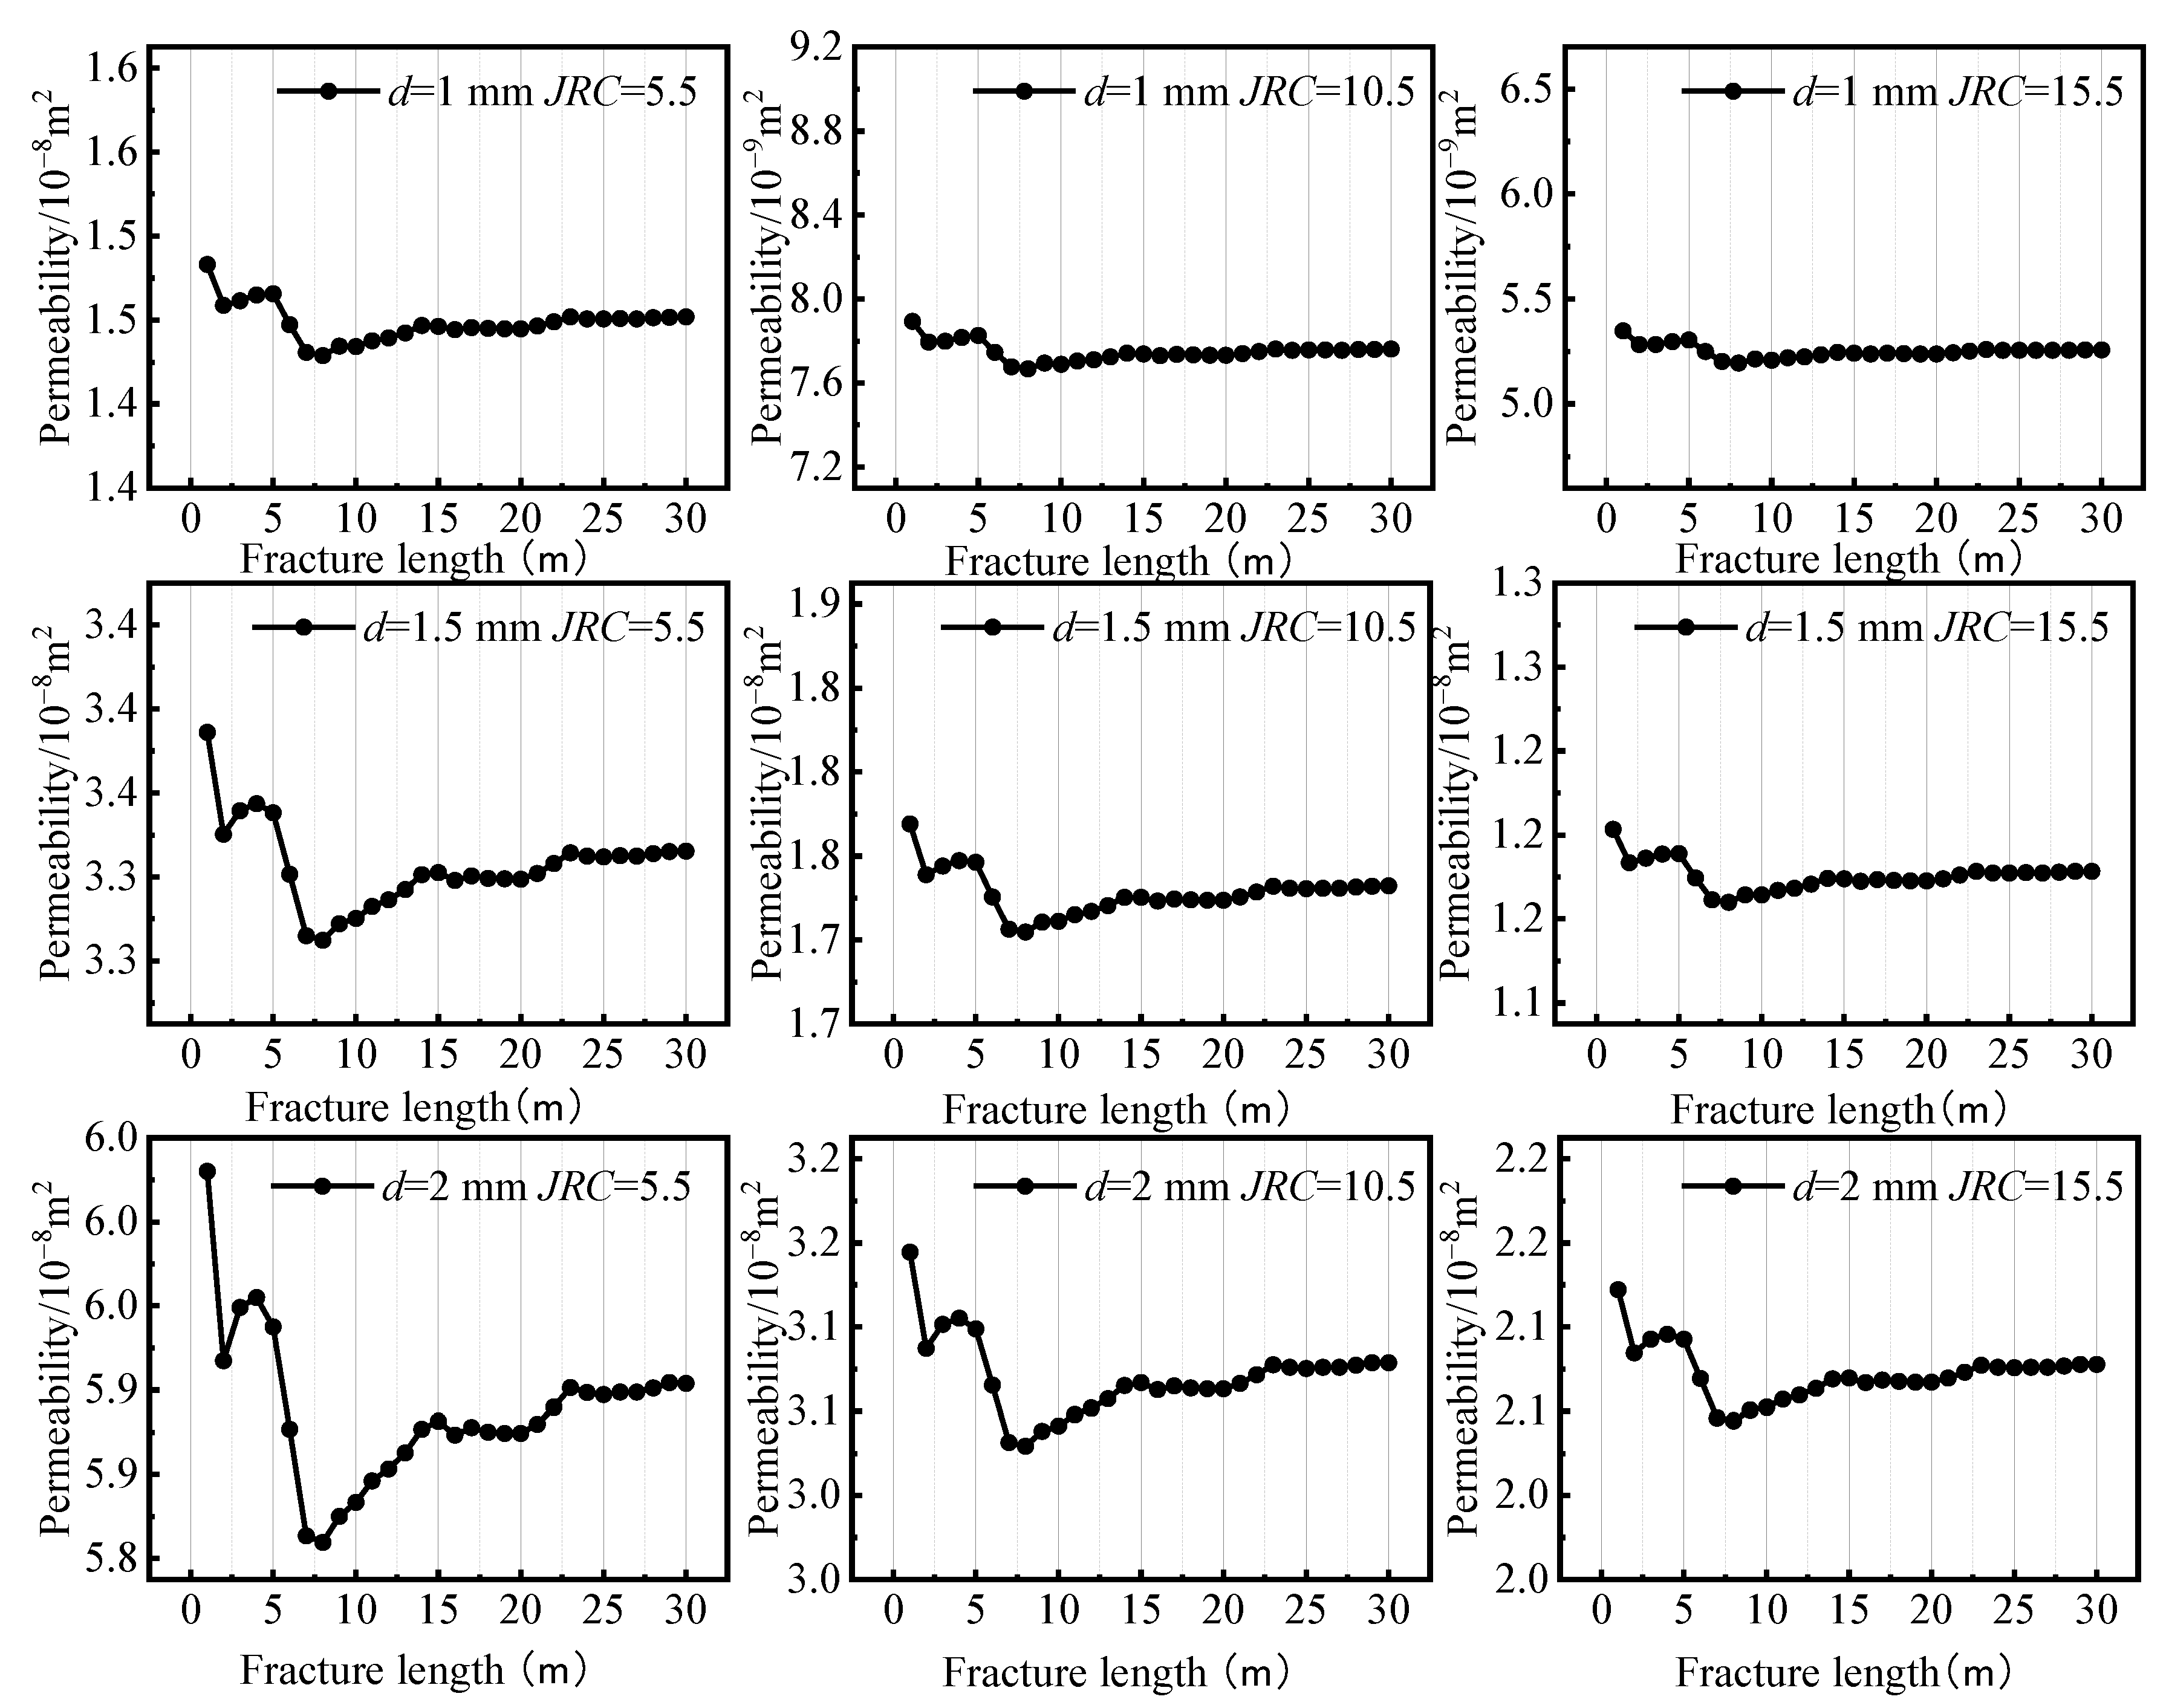
When fracture roughness is chosen as the object of study to investigate the size effect of seepage, seepage simulation can be used to obtain rock-fracture-permeability-versus-fracture-length curves for different fracture roughness cases, as shown in Figure 19.
Analysis of the simulation results shows that when fracture width is d = 2 mm and fracture roughness is 5.5 (less roughness), the range of the permeability variation of the fracture is 5.847 × 10⁻⁸ m2 to 6.024 × 10⁻⁸ m2 at small lengths and 5.919 × 10⁻⁸ m2 to 5.923 × 10⁻⁸ m2 at large lengths. When the fracture roughness is 15.5 (roughness is larger), the fracture permeability varies from 2.076 × 10⁻⁹ m2 to 2.137 × 10⁻⁸ m2 at small lengths and from 2.098 × 10⁻⁸ m2 to 2.102 × 10⁻⁸ m2 at large lengths. This shows that there is a size effect on fracture seepage at different fracture roughnesses.
Further analysis of the results shows that, for example, when the fracture width is 2 mm, the permeability remains same after the fracture length reaches 23 m and 14 m during an increase in the fracture roughness from 5.5 to 15.5. It can be seen that the smaller the fracture roughness, the more obvious the change in fracture permeability, all other conditions being equal. In different cases, when the fracture length changes, the seepage characteristics also change, and when the fracture length reaches a certain value, the seepage characteristics tend to stabilize. When the fracture roughness is small, the critical seepage size is larger. As the fracture roughness increases, the critical size of the fracture seepage gradually decreases and converges to a certain value. This is because when the fracture roughness is small, the resistance to fluid flow within the fracture is small, and less energy is dissipated by the fluid to overcome the resistance to seepage; thus, there is a significant change in fracture permeability. When the fracture roughness is larger, the resistance of the fluid inside the fracture is higher, and, under the same seepage pressure, more energy is dissipated in the seepage to overcome the resistance; thus, the change in seepage characteristics is not obvious.
In summary, in fracture seepage, both fracture width and fracture roughness have corresponding effects on seepage, there exist different critical sizes for seepage under different conditions, and a more obvious size effect is seen for seepage from fractures.
4. Fracture Geometry Stress Multifactor Analysis
4.1. Analysis Method
The data obtained from the experiments and simulations were subjected to multiple regression analysis using the statistical analysis software SPSS (Statistical Product and Service Solutions) independently [29]. The multiple regression equation is as shown below:
where x1, x2, …, xp are the independent variables and β are the coefficients; represents random errors and satisfies the following conditions: obeying a normal distribution, the assumption of unbiasedness (expectation of zero), equal variance of the random error variables, and the random error variables are independent of each other.
If n sets of samples exist, the matrix they form is as follows:
4.2. Results of the Multi-Factor Coupling Analysis
A multiple regression analysis was performed on the laboratory experimental results and numerical simulations independently. We can obtain the following conclusions as shown in Table 4.
According to the analysis, the value of the correlation coefficient R2 for the regression analysis of the laboratory experimental results is 0.628. This indicates that the length of small fractures, surrounding pressure and fracture dip express up to 62.8% of the permeability. This indicates that their correlation is high. The Durbin–Watson test result is 1.931, indicating good independence between the fracture length, surrounding pressure, and fracture dip (the Durbin–Watson test result is between 0 and 4, and the data independence meets the requirement) [30,31,32]. They can be used independently as influencing factors affecting permeability. In the numerical simulation data, the adjusted R2 value for this regression analysis was 0.868, indicating that the independent variables of length of large fractures, fracture width, and fracture roughness explained up to 86.8% of the dependent variable permeability. This correlation is relatively high. The Durbin–Watson test result was 1.198, indicating that the length of the large fractures, fracture width, and fracture roughness were independent of each other [33].
Combining the data in Table 5, the length of large fractures, length of small fractures, surrounding pressure, fracture dip, fracture width, and fracture roughness all affect the permeability of coal. Fracture length and permeability are positively correlated (positive regression coefficient) in the small-length coal samples, while fracture pressure and fracture inclination are negatively correlated (negative regression coefficient). In large-length fracture seepage, fracture length and fracture roughness are negatively correlated with permeability, and fracture width is positively correlated with permeability. The regression equation was obtained as shown below:
where is the permeability of fractures in small-length coal mass (m2), is fracture length (mm), is the surrounding pressure (MPa), is the fracture inclination (°), is the permeability of fractures in large-length coal mass (m2), is the fracture length (m), is the fracture roughness, and is the fracture width (mm).
After standardizing the above independent variables, the influence of the dependent variable and the units taken by the respective variables can be eliminated. We can use the ratios of the normalisation coefficients in the regression equation as the sensitivity coefficients for fracture length, surrounding pressure, and fracture dip in small-length fracture seepage under laboratory conditions. The ratio of sensitivity coefficients for the above factors is 0.93:0.89:1. Study of the seepage characteristics of large-length fractures is difficult to determine by means of laboratory experiments. Therefore it is investigated here using numerical simulations. The results of the analysis show that the ratio of the sensitivity coefficients for fracture length, fracture roughness and fracture openness in large-length fracture seepage is 0.0014:0.83:1. Combined with the results of Section 4, it can be seen that, when the length of the fractures is large, fracture seepage has a size effect. However, when it is compared with fracture openness and fracture roughness, it produces a lesser degree of effect than they do.
5. Main Conclusions and Recommendations
This study may provide a reference for the study of fracture seepage in coal. A gravity-loaded rock percolation test apparatus was used to conduct percolation experiments on prefabricated coal samples with varying fracture lengths and inclination angles under different stress conditions. A large-size fracture model was constructed using COMSOL numerical simulation software. Using multiple regression analysis, the sensitivity of fracture seepage to a number of relevant influences was explored. The main conclusions are as follows:
- (1)
- There was a significant size effect on coal seepage. In small-size fracture seepage from 10 to 70 mm, permeability increases with increasing fracture length, with an overall increase of approximately 1.8 times, with a trend of positive correlation and non-linear variation, which gradually stabilizes. In large fracture seepage from 1 to 30 m, permeability decreases and then increases with increasing fracture length, with an overall variation of approximately 0.03 times, which is non-linear and gradually stabilizes. With the above conclusions, it can be found that there is a significant size effect in the fracture seepage of coal or rock.
- (2)
- The overall change in permeability for different fracture lengths in large-size fracture seepage from 1 to 30 m is divided into three stages: the significant change stage, stabilization stage, and stability stage. These stages were within the ranges of 0–8 m, 8–23 m, and 23–30 m, respectively. There is a certain critical size value, and, when reaching this size, the permeability reaches a steady state. All other things being equal, the critical size of the seepage increases when fracture width increases and decreases when fracture roughness increases.
- (3)
- Permeability decreases with increasing stress under the action of perimeter and axial pressures. When the amount of change in circumferential and axial pressure is the same, the change in permeability due to circumferential pressure is approximately 3.5 times greater than that due to the axial pressure. For fractures, stresses perpendicular to the fracture direction have a greater effect on fracture permeability.
- (4)
- Regression analysis was carried out for some of the influencing factors of seepage from small-sized fractures and some of the influencing factors of seepage from large-sized fractures, respectively. The following conclusions were obtained. The sensitivity ratio of fracture seepage to fracture length, surrounding pressure and fracture dip was 0.93:0.89:1 for the small-size fractures. The influences of these factors were similar. In large-size fractures, the sensitivity factor ratio of fracture seepage to fracture length, fracture roughness, and fracture width is 0.0014:0.83:1. Fracture length has less influence on fracture seepage in large sizes.
- (5)
- There are still a number of unresolved issues regarding the study of fracture seepage in coal [34,35]. The next step is to consider research in terms of structural changes and stress changes in the coal and explore the dynamic changes in permeability at various stages of the seepage process under the influence of anisotropy and other factors. The effect of cyclic loading and unloading on seepage in different fracture geometries can also be investigated in subsequent studies to further explore the fracture seepage characteristics.
Author Contributions
Q.Y., X.L. and Z.S. conceived and designed the experimental programme; Q.Y. and Z.S. derived theoretical equations; Z.S., W.W. and F.S. conducted laboratory experiments; Z.S. and W.W. collated and analysed experimental data; Z.S., L.Z. and C.W. conducted numerical simulations; Z.S. wrote the paper; Q.Y. and X.L. helped Z.S. revise the manuscript. All authors have read and agreed to the published version of the manuscript.
Funding
This research was funded by Science and Technology Innovation Special Fund of Jiangsu Provincial Science and Technology Department, approval No. BK20220024, project No. 2022-12460.
Data Availability Statement
No data were used to support this study.
Conflicts of Interest
The authors declare that they have no conflict of interest.
References
- Yao, Q.L.; Hao, Q.; Chen, X.Y.; Zhou, B.; Fang, J. Design of coal pillar dam widths for underground reservoirs in coal mines. J. China Coal Soc. 2019, 44, 891–899. [Google Scholar] [CrossRef]
- Xu, J.L.; Zhu, W.B.; Wang, X.Z. A method for predicting the height of hydraulic fracture zones based on the location of key layers. J. China Coal Soc. 2012, 37, 762–769. [Google Scholar]
- Yao, Q.L.; Tang, C.J.; Liu, Z.C. Analysis of coal-water co-mining in ecologically fragile mining areas in western China. Coal Sci. Technol. 2021, 49, 225–232. [Google Scholar] [CrossRef]
- Gu, D.Z. Theoretical framework and technical system of underground water reservoirs in coal mines. J. China Coal Soc. 2015, 40, 239–246. [Google Scholar]
- Xie, H.P.; Xu, W.L.; Liu, C. Strategic Concept and Key Technology Perspectives for Underground Hydraulic Engineering. Chin. J. Rock Mech. Eng. 2018, 37, 781–791. [Google Scholar]
- Yao, Q.L.; Zhu, L.; Huang, Q.X.; Yang, P.; Xu, Z. Experimental study on the effect of water content on creep characteristics of fine-grained feldspathic clastic sandstone. J. Min. Saf. Eng. 2019, 36, 1034–1042+1051. [Google Scholar]
- Yao, Q.L.; Tang, C.J.; Xu, Q. A technical framework for the development and utilization of water resources in coal mining. China Sci. Pap. 2020, 15, 973–979. [Google Scholar]
- Zhao, Z.H.; Yan, L.; Gao, X.C.; Li, X.; Yao, Q.; Zheng, C. Study on hydraulic fracture extension and seepage morphology in naturally fractured reservoirs. J. Min. Saf. Eng. 2020, 37, 1263–1273. [Google Scholar]
- Fang, J.; Yao, Q.L.; Wang, W.N. Study on the effect of water content on strength damage and acoustic emission characteristics of muddy siltstone. J. China Coal Soc. 2018, 43, 412–419. [Google Scholar] [CrossRef]
- Wang, F.T.; Liang, N.N.; Li, G. Damage and Failure Evolution Mechanism for Coal Pillar Dams Affected by Water Immersion in Underground Reservoirs. Geofluids 2019, 2019, 2985691. [Google Scholar] [CrossRef]
- Sun, Y.J.; Xu, D.D.; Fan, D.; Wu, T. Study of factors influencing permeability of fractured rock masses. Explor. Eng. (Rock Soil Drill. Tunn.) 2011, 38, 76–80. [Google Scholar]
- Wang, G.; Han, D.; Qin, X.; Liu, Z.; Liu, J. A comprehensive method for studying pore structure and seepage characteristics of coal mass based on 3D CT reconstruction and NMR. Fuel 2020, 281, 118735. [Google Scholar] [CrossRef]
- Shi, X.; Zhou, W.; Cai, Q.; Lu, X. Experimental Study on Nonlinear Seepage Characteristics and Particle Size Gradation Effect of Fractured Sandstones. Adv. Civ. Eng. 2018, 2018, 8640535. [Google Scholar] [CrossRef]
- Chen, J.; Fang, Y.; Gu, R.; Lu, X. Study on pore size effect of low permeability clay seepage. Arab. J. Geosci. 2019, 12, 238. [Google Scholar] [CrossRef]
- Rong, G.; Zhou, C.B.; Wang, E.Z. Preliminary study on the calculation of permeability tensor and its characterization unit volume in fractured rock masses. Chin. J. Rock Mech. Eng. 2007, 4, 740–746. [Google Scholar]
- Shang, L.M.; Li, T.C.; Chen, W.; Li, Y.; Gao, F. Study on the size effect of three-dimensional built-in fractures in rocks. J. Wuhan Univ. Technol. 2015, 37, 72–77. [Google Scholar]
- Jing, D.J.; Meng, X.X.; Ge, S.C.; Zhang, T.; Ma, M.; Tong, L. Reconstruction and seepage simulation of a coal pore-fracture network based on CT technology. PLoS ONE 2021, 16, e0252277. [Google Scholar] [CrossRef]
- Di, S.T.; Jia, C.; Qiao, W.G.; Yu, W.; Li, K. Theoretical and Experimental Investigation of Characteristics of Single Fracture Stress-Seepage Coupling considering Microroughness. Math. Probl. Eng. 2017, 2017, 6431690. [Google Scholar] [CrossRef]
- Hudson, J.A.; Cornet, F.H.; Christiansson, R. ISRM suggested methods for rock stress estimation—Part 1: Strategy for rock stress estimation. Int. J. Rock Mech. Min. Sci. 2003, 40, 991–998. [Google Scholar] [CrossRef]
- Wang, J.; Zhang, Q.; Song, Z.; Zhang, Y.; Liu, X. Mechanical properties and damage constitutive model for uniaxial compression of salt rock at different loading rates. Int. J. Damage Mech. 2021, 30, 739–763. [Google Scholar] [CrossRef]
- Kou, M.M.; Liu, X.R.; Wang, Z.Q.; Tang, S.-D. Laboratory investigations on failure, energy and permeability evolution of fissured rock-like materials under seepage pressures. Eng. Fract. Mech. 2021, 247, 107694. [Google Scholar] [CrossRef]
- Liu, J.S.; Chen, Z.W.; Elsworth, D.; Miao, X.; Mao, X. Linking gas-sorption induced changes in coal permeability to directional strains through a modulus reduction ratio. Int. J. Coal Geol. 2010, 83, 21–30. [Google Scholar] [CrossRef]
- Duan, L.L.; Deng, H.F.; Xiong, Y.; Zhi, Y.; Pan, D.; Qi, Y. Study on the influence of fracture face morphological characteristics on the seepage characteristics of rock bodies. J. Disaster Prev. Mitig. Eng. 2021, 41, 110–117. [Google Scholar] [CrossRef]
- Guo, Z.H. Permeability prediction of rock masses based on fracture geometry features. Coal Eng. 2021, 53, 156–161. [Google Scholar]
- Du, S.G.; Chen, Y.; Fan, L.B. Mathematical expression of the JRC modified straight-edge method. J. Eng. Geol. 1996, 2, 36–43. [Google Scholar]
- Rasouli, V.; Hosseinian, A. Correlations Developed for Estimation of Hydraulic Parameters of Rough Fractures Through the Simulation of JRC Flow Channels. Rock Mech. Rock Eng. 2011, 44, 447–461. [Google Scholar] [CrossRef]
- Chen, J.; Ye, J.; Du, S. Scale Effect and Anisotropy Analyzed for Neutrosophic Numbers of Rock Joint Roughness Coefficient Based on Neutrosophic Statistics. Symmetry 2017, 9, 208. [Google Scholar] [CrossRef]
- Le, H.K.; Huang, W.; Liao, M.; Weng, M.C. Spatial characteristics of rock joint profile roughness and mechanical behavior of a randomly generated rock joint. Eng. Geol. 2018, 245, 97–105. [Google Scholar] [CrossRef]
- Tanner-Smith, E.E.; Tipton, E. Robust variance estimation with dependent effect sizes: Practical considerations including a software tutorial in Stata and SPSS. Res. Synth. Methods 2014, 5, 13–30. [Google Scholar] [CrossRef]
- Yin, Y. Model-free tests for series correlation in multivariate linear regression. J. Stat. Plan. Inference 2020, 206, 179–195. [Google Scholar] [CrossRef]
- Preinerstorfer, D.; Poetscher, B.M. On the power of invariant tests for hypotheses on a covariance matrix. Econom. Theory 2017, 33, 1–68. [Google Scholar] [CrossRef]
- Chen, Y. Spatial Autocorrelation Approaches to Testing Residuals from Least Squares Regression. PLoS ONE 2016, 11, e0146865. [Google Scholar] [CrossRef] [PubMed]
- Kim, J.H. Multicollinearity and misleading statistical results. Korean J. Anesthesiol. 2019, 72, 558–569. [Google Scholar] [CrossRef] [PubMed]
- Menezes, F.F. Anisotropy of volume change and permeability evolution of hard sandstones under triaxial stress conditions. J. Pet. Sci. Eng. 2019, 174, 921–939. [Google Scholar] [CrossRef]
- Zhao, Y.; Lin, B.; Liu, T.; Li, Q.; Kong, J. Gas flow field evolution around hydraulic slotted borehole in anisotropic coal. J. Nat. Gas Sci. Eng. 2018, 58, 189–200. [Google Scholar] [CrossRef]
Figure 1.
Compressive strength testing system for coal samples.

Figure 2.
Gravity-loaded rock seepage test rig.

Figure 3.
Principle of the percolation device.

Figure 4.
Coal samples with different fracture lengths.

Figure 5.
Coal samples with fractures at different dips.

Figure 6.
Experimental programme. (a) Force on coal. (b) Stress loading path.

Figure 7.
Simplified cubic model of coal sample seepage.

Figure 8.
Stress–strain curves of coal samples.

Figure 9.
Change of coal sample seepage characteristics with fracture length under different stress conditions.
Figure 9.
Change of coal sample seepage characteristics with fracture length under different stress conditions.

Figure 10.
Analysis of coal sample fracture seepage.

Figure 11.
Size effect of coal sample seepage under different axial pressures. (a) σ2 = σ3 = 4 MPa. (b) σ2 = σ3 = 5 MPa. (c) σ2 = σ3 = 6 MPa.
Figure 11.
Size effect of coal sample seepage under different axial pressures. (a) σ2 = σ3 = 4 MPa. (b) σ2 = σ3 = 5 MPa. (c) σ2 = σ3 = 6 MPa.

Figure 12.
Effect of seepage sizes of coal samples under different surrounding pressure conditions. (a) σ1 = 6 MPa. (b) σ1 = 8 MPa. (c) σ1 = 10 MPa.
Figure 12.
Effect of seepage sizes of coal samples under different surrounding pressure conditions. (a) σ1 = 6 MPa. (b) σ1 = 8 MPa. (c) σ1 = 10 MPa.

Figure 13.
Seepage experiment with coal samples with different fracture inclinations.

Figure 14.
3D fracture model.

Figure 15.
Distribution of fracture seepage size effect flow rates for different fracture lengths.

Figure 16.
Seepage phenomena in fractures.

Figure 17.
Coal fracture permeability versus fracture length and coal fracture permeability versus fracture length at different widths. (a,b) Flow and permeability for different fracture widths at JRC = 5.5. (c,d) Flow and permeability for different fracture widths at JRC = 10.5. (e,f) Flow and permeability for different fracture widths at JRC = 15.5.


Figure 18.
Trends in permeability under different seepage conditions. (a) Stages of change in permeability for different fracture widths at JRC = 5.5. (b) Stages of change in permeability for different fracture widths at JRC = 10.5. (c) Stages of change in permeability for different fracture widths at JRC = 15.5.

Figure 19.
Coal fracture permeability versus fracture length for different fracture roughness.


Table 1.
Geometric parameters of the coal samples from the experimental group.
| No. | Group | Length of Fracture (mm) | No. | Group | Fracture Dip (°) |
|---|---|---|---|---|---|
| 1 | l-10 | 10 | 8 | a-0 | 0 |
| 2 | l-20 | 20 | 9 | a-15 | 15 |
| 3 | l-30 | 30 | 10 | a-30 | 30 |
| 4 | l-40 | 40 | 11 | a-45 | 45 |
| 5 | l-50 | 50 | 12 | a-60 | 60 |
| 6 | l-60 | 60 | 13 | a-75 | 75 |
| 7 | l-70 | 70 | 14 | a-90 | 90 |
Table 2.
Stress loading scheme.
| No. | Axial Stress σ1 (MPa) | Surrounding Stress σ2, σ3 (MPa) | Seepage Pressure pw (MPa) |
|---|---|---|---|
| 1 | 6 | 4 | 3 |
| 2 | 6 | 5 | 3 |
| 3 | 6 | 6 | 3 |
| 4 | 8 | 4 | 3 |
| 5 | 8 | 5 | 3 |
| 6 | 8 | 6 | 3 |
| 7 | 10 | 4 | 3 |
| 8 | 10 | 5 | 3 |
| 9 | 10 | 6 | 3 |
Table 3.
Numerical simulation parameters for fracture seepage.
| Parameters | Values (in Units) | Parameters | Values (in Units) |
|---|---|---|---|
| Simulated object | Fracture seepage | Young’s modulus of the substrate | 4 GPa |
| Size | 1 × 1~30 × 30 m | Initial porosity of the substrate | 0.25 |
| Roughness factor JRC | 5.5, 10.5, 15.5 | Substrate density | 1250 kg/m3 |
| Fracture width | 1, 1.5, 2 mm | Poisson’s ratio | 0.35 |
| Normal stress | 5~20 MPa | Fluid dynamic viscosity | 0.001 Pa·s |
Table 4.
Summary of models.
| Category | R | R2 | Adjusted R2 | Error in Standard Estimation | Durbin–Watson |
|---|---|---|---|---|---|
| Experiment a | 0.809 | 0.655 | 0.628 | 1.683 × 10⁻¹⁸ | 1.931 |
| Numerical simulation b | 0.932 | 0.869 | 0.868 | 5.751 × 10⁻⁹ | 1.198 |
Notes: a. The independent variables in the experiment are the fracture dip, axial pressure, circumferential pressure, and length of the small fracture. The dependent variable is permeability. b. The independent variables in the simulations are fracture width, fracture roughness, and the length of the large fractures. The dependent variable is permeability.
Table 5.
Coefficients.
| Models | Unstandardised Factor | Standardisation Factor | t | Significance | Covariance Statistics | ||
|---|---|---|---|---|---|---|---|
| B | Standard Error | Beta | Tolerance | ||||
| Experiment | (Constant) | 1.084 × 10⁻¹⁷ | 1.74 × 10⁻¹⁸ | 6.229 | 2.76 × 10⁻⁷ | ||
| Fracture length | 7.088 × 10⁻¹⁷ | 1.726 × 10⁻¹⁷ | 0.416 | 4.108 | 2.05 × 10⁻⁴ | 0.884 | |
| Surrounding pressure | −1.326 × 10⁻¹⁸ | 3.18 × 10⁻¹⁹ | −0.397 | −4.170 | 1.7 × 10⁻⁴ | 1.000 | |
| Fracture dip | −3.918 × 10⁻²⁰ | 8.932 × 10⁻²¹ | −0.445 | −4.386 | 8.8 × 10⁻⁵ | 0.884 | |
| Numerical simulation | (Constant) | 4.956 × 10⁻⁹ | 1.726 × 10⁻⁹ | 2.871 | 0.004 | ||
| Fracture length | −1.817 × 10⁻¹² | 4.043 × 10⁻¹¹ | −0.001 | −0.045 | 0.964 | 1.000 | |
| Fracture roughness | −2.304 × 10⁻⁹ | 8.572 × 10⁻¹¹ | −0.596 | −26.878 | 8.705 × 10−78 | 1.000 | |
| Fracture width | 2.776 × 10⁻⁸ | 8.572 × 10⁻¹⁰ | 0.717 | 32.378 | 2.880 × 10−94 | 1.000 | |
Disclaimer/Publisher’s Note: The statements, opinions and data contained in all publications are solely those of the individual author(s) and contributor(s) and not of MDPI and/or the editor(s). MDPI and/or the editor(s) disclaim responsibility for any injury to people or property resulting from any ideas, methods, instructions or products referred to in the content. |
© 2023 by the authors. Licensee MDPI, Basel, Switzerland. This article is an open access article distributed under the terms and conditions of the Creative Commons Attribution (CC BY) license (https://creativecommons.org/licenses/by/4.0/).
Share and Cite
MDPI and ACS Style
Shi, Z.; Yao, Q.; Wang, W.; Su, F.; Li, X.; Zhu, L.; Wu, C. Size Effects of Rough Fracture Seepage in Rocks of Different Scales. Water 2023, 15, 1912. https://doi.org/10.3390/w15101912
AMA Style
Shi Z, Yao Q, Wang W, Su F, Li X, Zhu L, Wu C. Size Effects of Rough Fracture Seepage in Rocks of Different Scales. Water. 2023; 15(10):1912. https://doi.org/10.3390/w15101912
Chicago/Turabian StyleShi, Zhuolin, Qiangling Yao, Weinan Wang, Fengsheng Su, Xuehua Li, Liu Zhu, and Chengle Wu. 2023. "Size Effects of Rough Fracture Seepage in Rocks of Different Scales" Water 15, no. 10: 1912. https://doi.org/10.3390/w15101912
Note that from the first issue of 2016, this journal uses article numbers instead of page numbers. See further details here.