Article

Relationship between Dynamics of Modern Glaciers of the Mt. Munkhkhairkhan (Mongolian Altai) and Climate

by
Otgonbayar Demberel
1,2,
Bayarmaa Munkhbat
1,3,
Batsuren Dorjsuren
3,4,*,
Terry V. Callaghan
5,6,
Bilguun Tsogoo
3,
Valery A. Zemtsov
4,
Otgontuya Shaarav
3,
Erdenechimeg Gongor
7,
Zolbayar Jargalsaikhan
3,8,
Nemekhbayar Ganhuyag
3,8,
Aldynay O. Khovalyg
9 and
Sergey N. Kirpotin
2,10,*
1
Department of Geography and Geology, Branch School of National University of Mongolia, Khovd 164300, Mongolia
2
Bio-Clim-Land Center of Excellence, Tomsk State University, Lenina Pr., 36, 634050 Tomsk, Russia
3
Department of Environment and Forest Engineering, School of Engineering and Applied Sciences, National University of Mongolia, Ulaanbaatar 210646, Mongolia
4
Department of Hydrology, Geology and Geography Faculty, Tomsk State University, Lenina Pr., 36, 634050 Tomsk, Russia
5
School of Biosciences, University of Sheffield, Western Bank, Sheffield S10 2TN, UK
6
Biology Institute, Tomsk State University (on hold), Lenina Pr., 36, 634050 Tomsk, Russia
7
Department of Medical Chemistry, Mongolian National University of Medical Science, Ulaanbaatar 14210, Mongolia
8
Department of Physic and Engineering, Branch School of National University of Mongolia, Khovd 164300, Mongolia
9
Research Organization Department, Tuvan State University 36, Lenina Street, 667000 Kyzyl, Russia
10
The Institute for Water and Environmental Problems of the Siberian Branch of the Russian Academy of Sciences (IWEP SB RAS), 1, Molodezhnaya Street, 656038 Barnaul, Russia
*
Authors to whom correspondence should be addressed.
Water 2023, 15(10), 1921; https://doi.org/10.3390/w15101921
Submission received: 31 March 2023 / Revised: 11 May 2023 / Accepted: 12 May 2023 / Published: 18 May 2023

Abstract

:
Mt. Munkhkhairkhan is the most crucial region for understanding climate and glaciation changes in Mongolia. This study investigated the relationship between glacial area changes and the climate elements of Mt. Munkhkhairkhan in the Mongolian-Altai Mountains using a remote sensing approach, in-situ observations, the Mann–Kendall (MK) test, Innovative Trend Analysis Method (ITAM), Sen’s slope estimator test, and statistical analysis. The study results showed that for the last 30 years, the annual average air temperature of Mt. Munkhkhairkhan has been slightly increasing. Total annual precipitation (mainly snow) in the mountain area decreased from 1990 to 2000, but since 2000, a significant increase in precipitation levels has appeared. For the last 30 years, the glacial area has decreased by 32% to 11.7 km2. Multiple regression results showed a strong correlation between Temperature, Precipitation, and Glaciers (Multiple R = 0.69, R2 = 0.48). Ruther indicated that Temperature (t = −2.332, p = 0.036) and Precipitation (t = −3.212, p = 0.007) were significant predictors in the model. Air temperature and precipitation explained 48 percent of the change in the glacier area, and R = 0.69 is a strong correlation. The glaciers and snow area in the study area have changed due to climate warming and precipitation changes and are located in arid and semi-arid regions of Central Asia. This study of Mt. Munkhairkhan shows that climate change significantly impacts glaciers and snow.

1. Introduction

Glaciers are an important indicator of climate change and are sensitive to global warming, and provide specific ecosystems with reliable freshwater resources. Glaciers, ice sheets, and freshwater lakes are the largest reservoirs of freshwater on Earth; consequently, studying them is of vital humanitarian, ecological, economical, and ecosystemic importance [1,2]. Many researchers have shown that global warming is the main contributing factor to glacier melting, and changes in glacier-fed rivers are important issues for water management in the context of global climate change [3,4]. The global annual air temperature has increased by 0.85 °C from 1880 to the present and is likely to increase further and rapidly in the future [4,5].
Although climate change has been rapidly increasing globally, its effects differ from region to region depending on geographical and basic patterns of the climate in some regions. In particular, the high-mountain region ecosystems of Central Asia are strongly affected by climate change due to their arid climate [5,6]. The area covered by glaciers is a total of 17,950 km2 in this harsh remote continental climate region [7]. The Mongolian total surface water resource has been estimated to be 599 km³/year, with 83.5% stored in lakes, 3.6% in glaciers, and 5.8% in rivers [8].
The distribution of water resources varies differently for each Mongolian territory. Western Mongolia has a dry climate and inadequate water resources [2]. The glaciers of Western Mongolia provide about 3% of the total freshwater resources and they have a vital role in the hydrographical condition of the Central Asian internal drainage basin [9,10]. Over the last few decades, due to climate change, the number of glaciers, glacial areas, and their accumulation have decreased. Associated with glacial melting, enormous changes in the neighboring hydrographical conditions and ecosystems have appeared [2,11,12]. In particular, because of ongoing glacial melting, there will be a risk of changes to glacial lakes and an increase in the water levels of rivers and lakes. Due to global warming, and the consequent permafrost thaw that has dammed pro-glacial lakes, glacial lakes risk collapsing.
The Mongolian-Altai Mountain regions extend from the northwest to the southeast in the western part of Mongolia [13]. Pan and other researchers (2016) have estimated that there are 627 glaciers covering 334.0  ±  42.3 km2 in the Mongolian Altai Mountains [14]. These glaciers are vitally balanced systems that maintain downstream ecosystems and provide major freshwater resources for people [9]. One of the main representatives of the glaciers is found on the Munkhkhairkhan Mountain at the southeast of the Mongolian Altai range. These glaciers are located from the Doloonnuur (Nuur means the Lake) at the northwest to Ikh Turgen at the southeast of the mountain; the northwest part is called the massif of Doloonnuur, the central part is called the Shuurkhai Massif, and the southeast part is called Khukhnuurs Massif (Figure 1). Among these, at the Shuurkhai Massif, five glaciers occupy 22.39% of the total area, eight glaciers occupy 40.68% of the area of the Massif of Doloonnuur, and four glaciers occupy 36.92% of the total area of the Khukhnuur Massif [15]. By the estimation of Otgonbayar. D, 24 glaciers together had an area of 48.13 km2 in 1970, and in 2008, 17 glaciers covering 26.57 km2 remained [13,15]. This shows that between 1970 and 2008, seven glaciers completely melted. Kamp, Pan estimated a glacial area of 27.4 km2 in 2011 and Ganyushkin, D, estimated 26.86 km2 in 2016 [16,17]. Based on these estimates, the glacier area has decreased by 44.7% from 1970 to 2008. Some small glaciers have melted entirely.
In this mountainous area, where there is continuous permafrost and glaciers are melting, the loss of permafrost and areas of changing and collapsing small glacial lakes indicate that global warming and climate change have been accelerating [18,19,20,21]. Determining the relationship of glacier area change with various climate parameters will play a vital role in evaluating and predicting future climate change effects on mountainous areas, ecosystem stability, and water management [22]. Whether mountain glaciers, particularly glaciers at high altitudes and in arid regions, are particularly vulnerable to climate change needs to be studied further [23,24]. The purpose of our study, therefore, is to identify the effects of climate change on changes in the spatial area of glaciers. Consequently, our aims are (i) to determine the current area of and recent changes in the glaciers between 1991 and 2020 on Mt. Munkhkhairkhan; (ii) to analyze air temperature and precipitation changes in the mountain area; (iii) to determine the relationship between climate and glacier melting, and (iv) to discuss the various implications of these changes—for example, for water use.

2. Materials and Methods
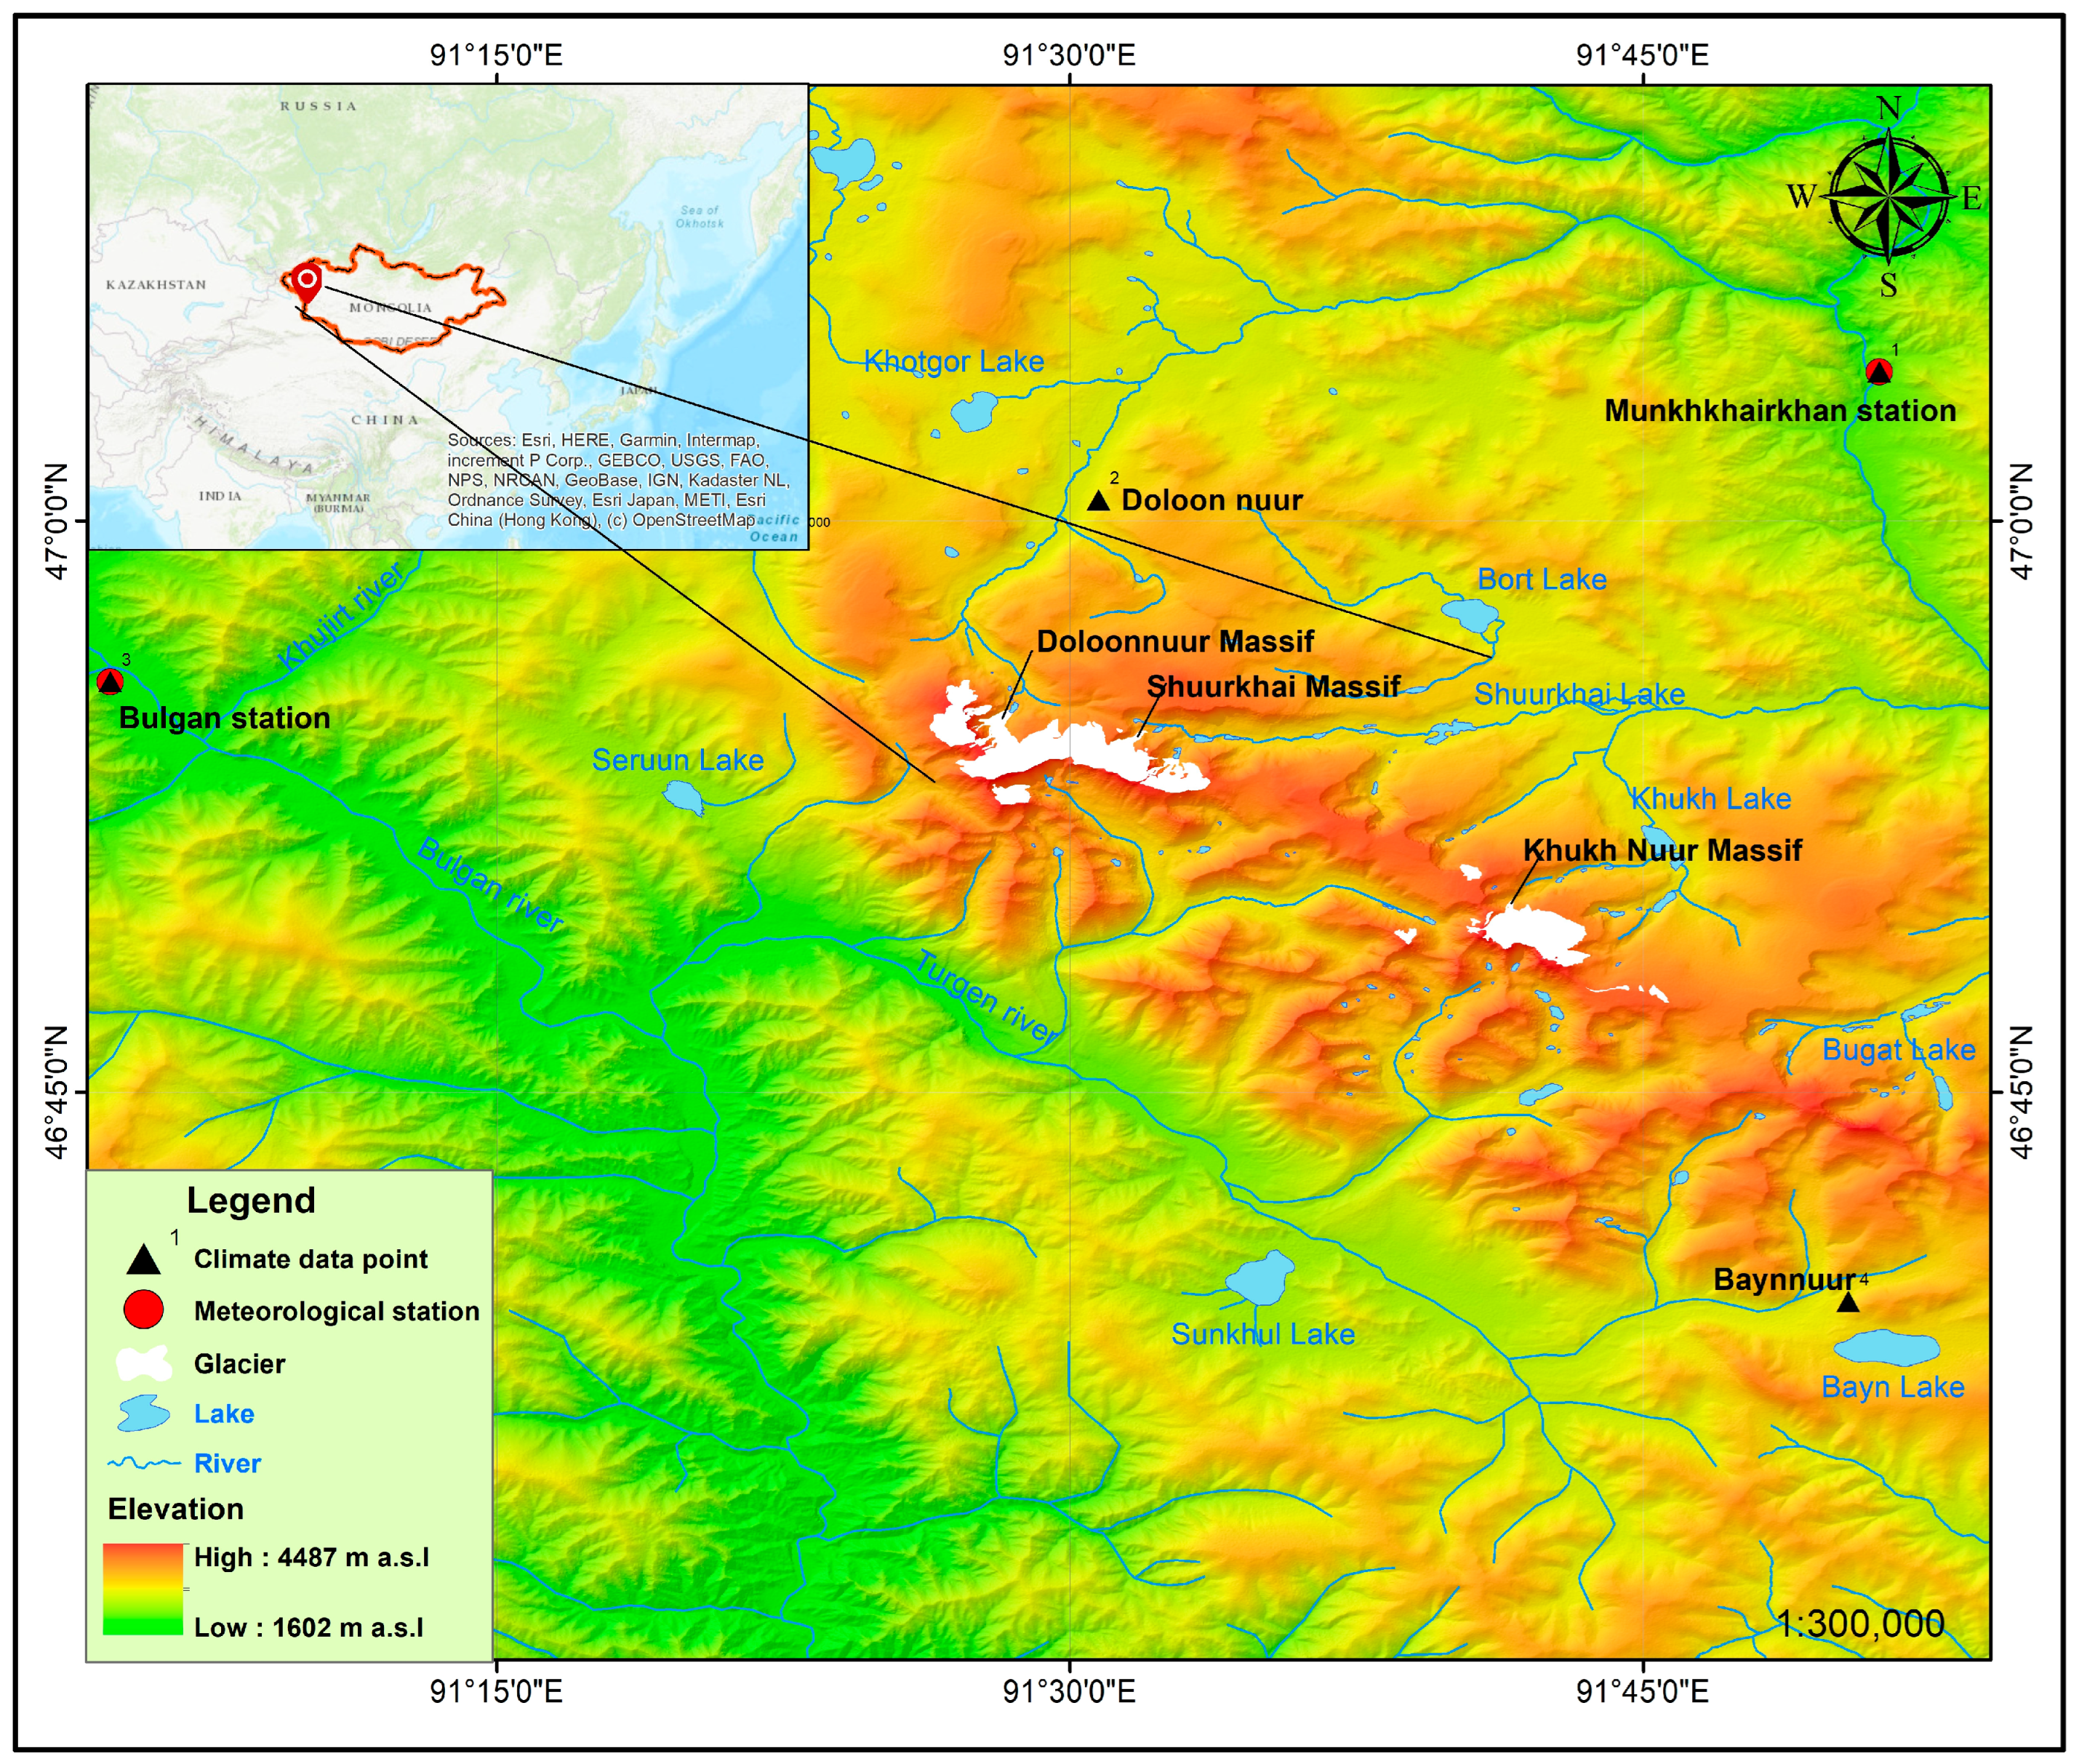
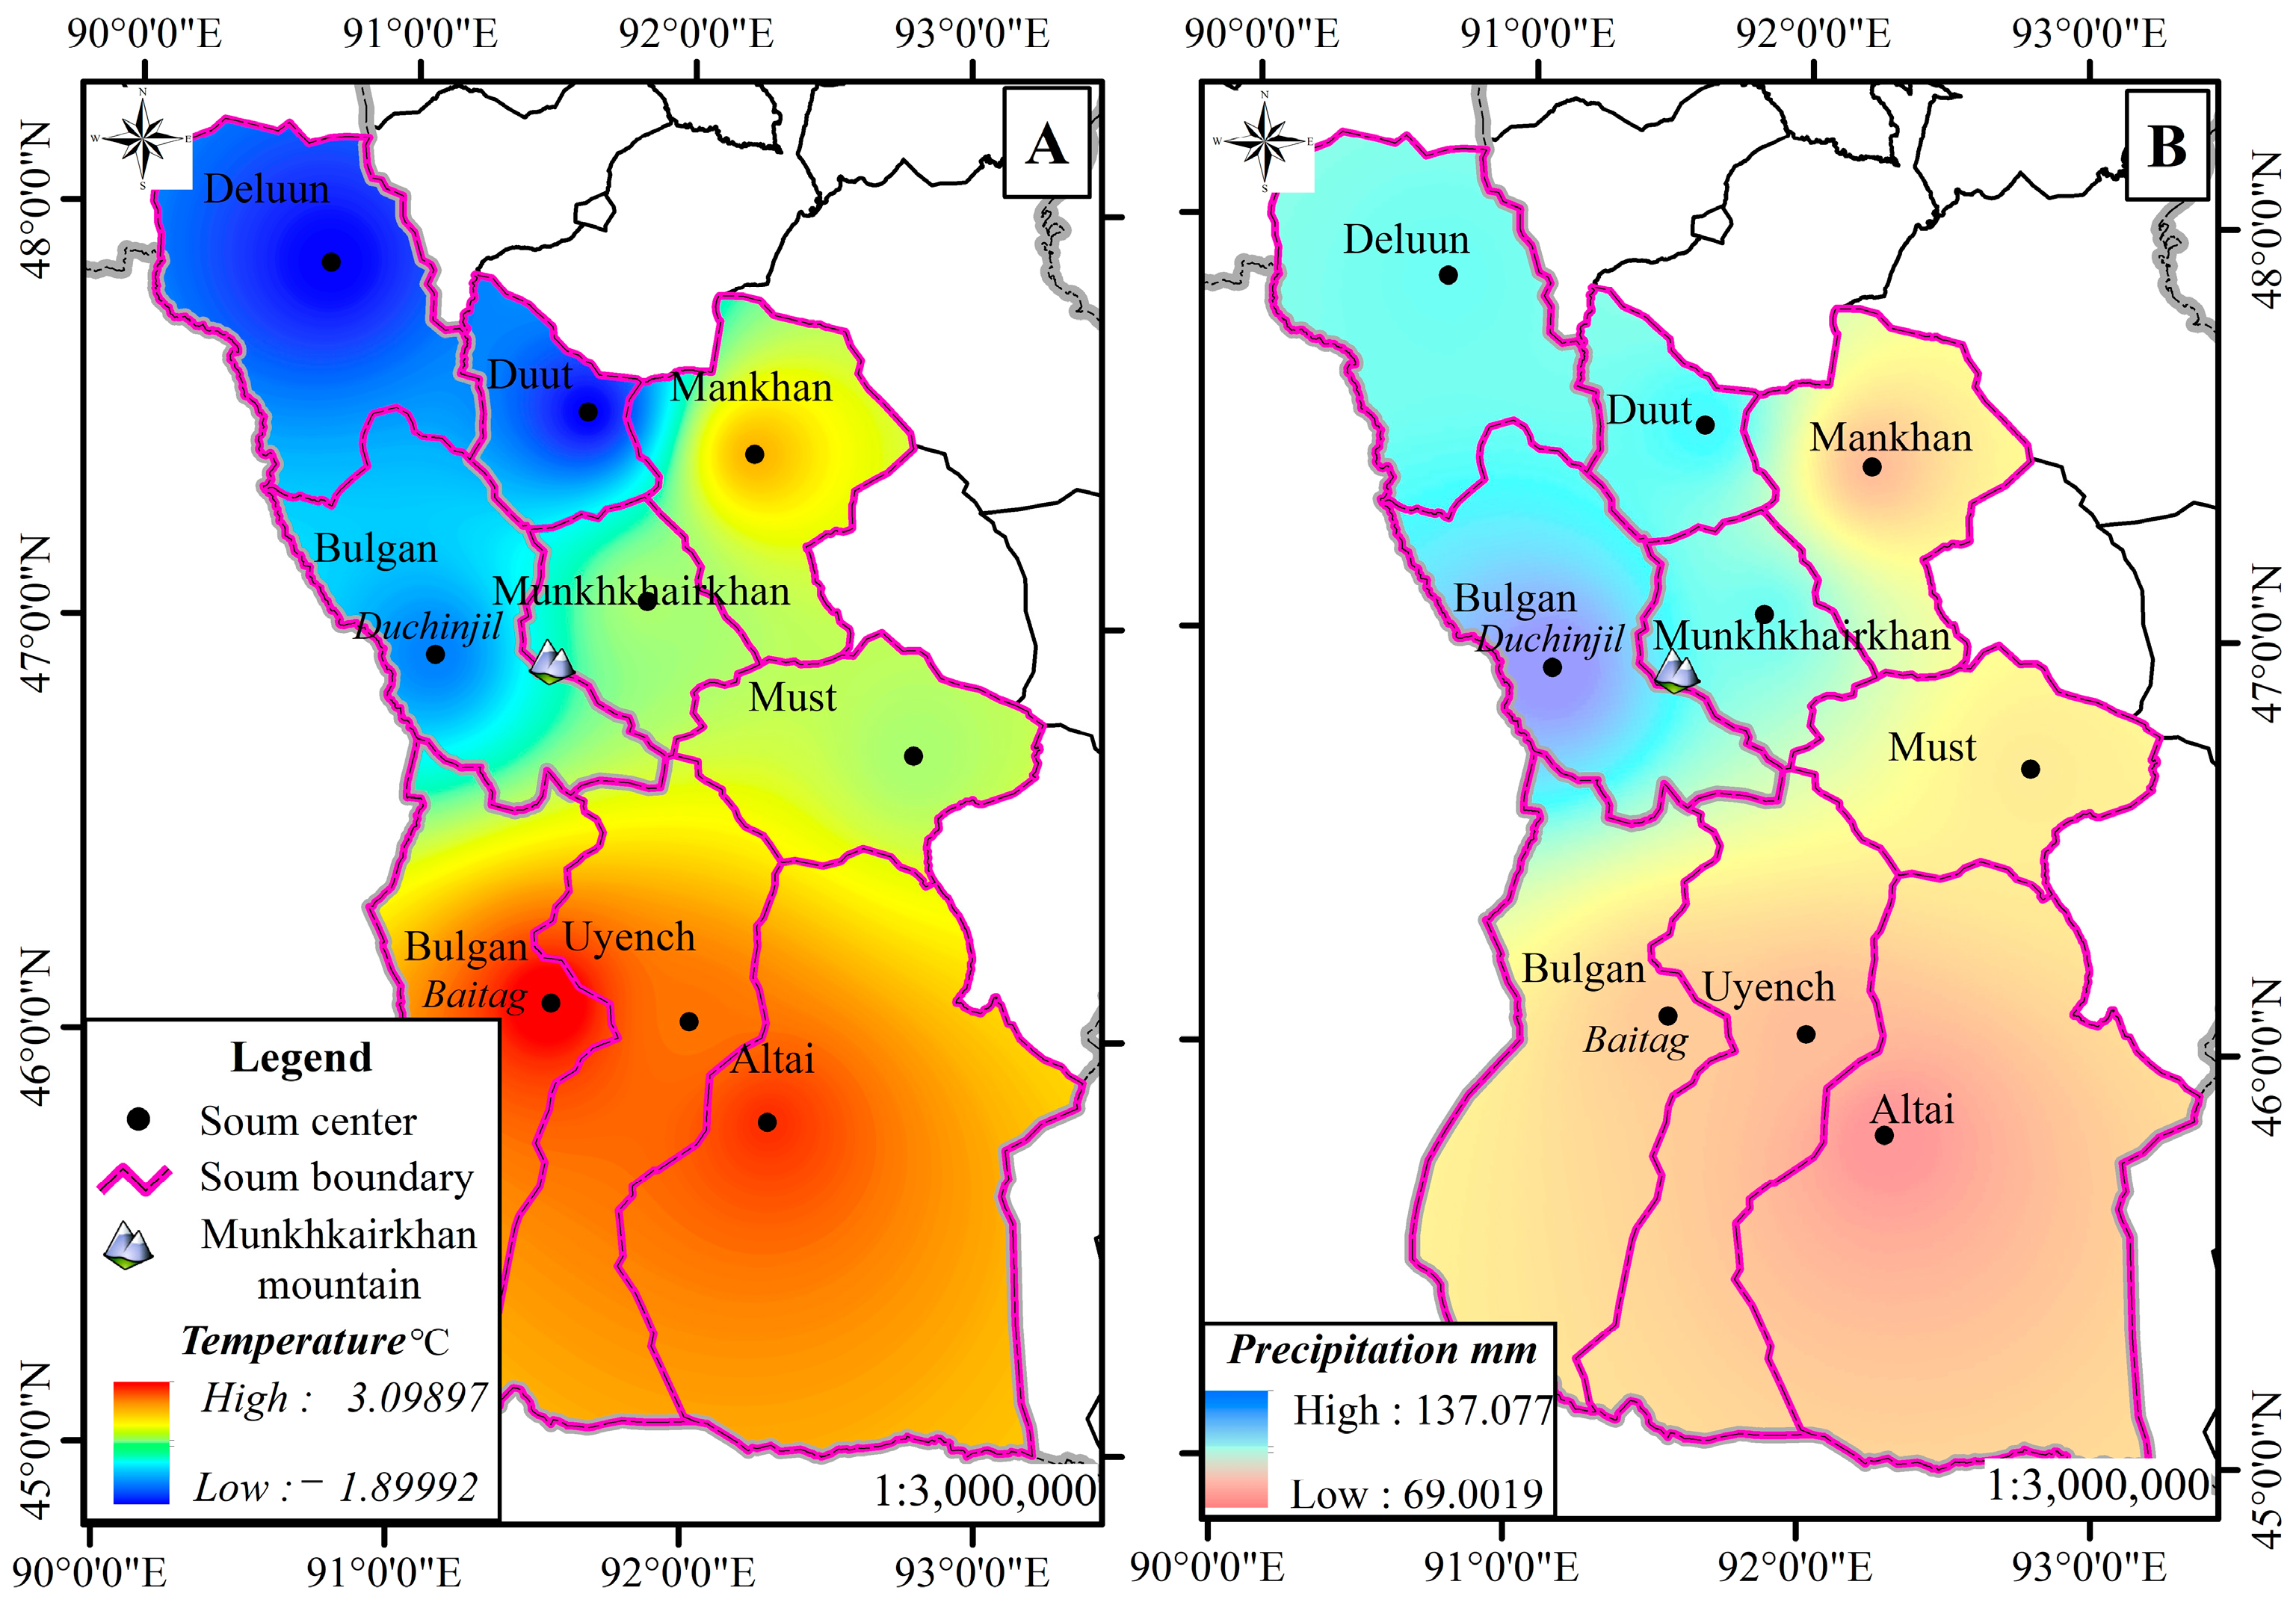
2.1. Study Area

Mt. Munkhkhairkhan stretches from the northwest to the southeast in the Mongolian Altai Mountains, from latitude 46°56′095″ to 46°45′45″ N, and longitude 90°09′04″ to 90°32′48″ E [13]. The mountain range is 3500–4300 m a.s.l, about 150 km long and 50 km wide, and borders the mountain ranges of the Munkhkhairkhan soum (a ‘’sum’’ is an administrative unit) of Khovd Province and the Bulgan soum of Bayan-Ulgii Province (Figure 1).
Mt. Munkhkhairkhan is the second-highest mountain in Mongolia [16,25]. The range ends at the Deluunii River Valley in the northwest and the Baruun Khuurain River Valley in the south. Along a northeast/southwest axis, the range separates a tectonic depression from the mountains of the Mongolian-Altai. Small rivers such as the Doloon Nuur, Shuurkhai, and Bort in the north part, and the Uyench and Bodonch Rivers in the south drain the area [15]. The climate zone includes harsh winters and humid, cold summers.
The cold season (October–April) and the winter are long and cold, whereas summers (May–September) are short and warm. The Mongolian Altai is in an area well known for its extreme continental climate due to its central location on the Eurasian land mass. The winters are dominated by a strong Asian anticyclone (the Siberian High Pressure), while the summers in the mountains are short and cool. Modern climate information has been systematically recorded in Mongolia ever since the early 1940s. However, the national climate station network is sparse, and climate data for the Mongolian Altai are limited to only six meteorological stations that are situated in the valleys between the mountain ranges—thus making it difficult to estimate the climate and weather at higher elevations. In the valleys of the Mongolian Altai, the mean temperature is −30 to −34 °C in January and less than 15 °C in July [26]. The average temperature of the coldest month is −20.8 °C, and the average summer temperature is +18 °C, with the warmest summer temperatures reaching 22.5–25 °C [15,27,28].

2.2. Data Source

2.2.1. Meteorological Data

“Prediction of Worldwide Energy Resource” or “POWER Data Access Viewer” is an open information system based on satellite observations with geo-spatial climate and solar-related data for the evaluation and planning of renewable energy systems. We used these resources for analysing precipitation and air temperature data 2 m above the ground at four locations near Mt. Munkhkhairkhan and total precipitation data from the database of NASA power (https://power.larc.nasa.gov/data-access-viewer/ (accessed on 30 January 2022)).
For verifying this data, the climate data obtained during 1991–2020 at the Munkhkhairkhan Meteorological station (http://irimhe.namem.gov.mn/ (accessed on 22 February 2022) was also used. The values of the above-named data sets are different, but the general trend is consistent [29,30].

2.2.2. Satellite Data
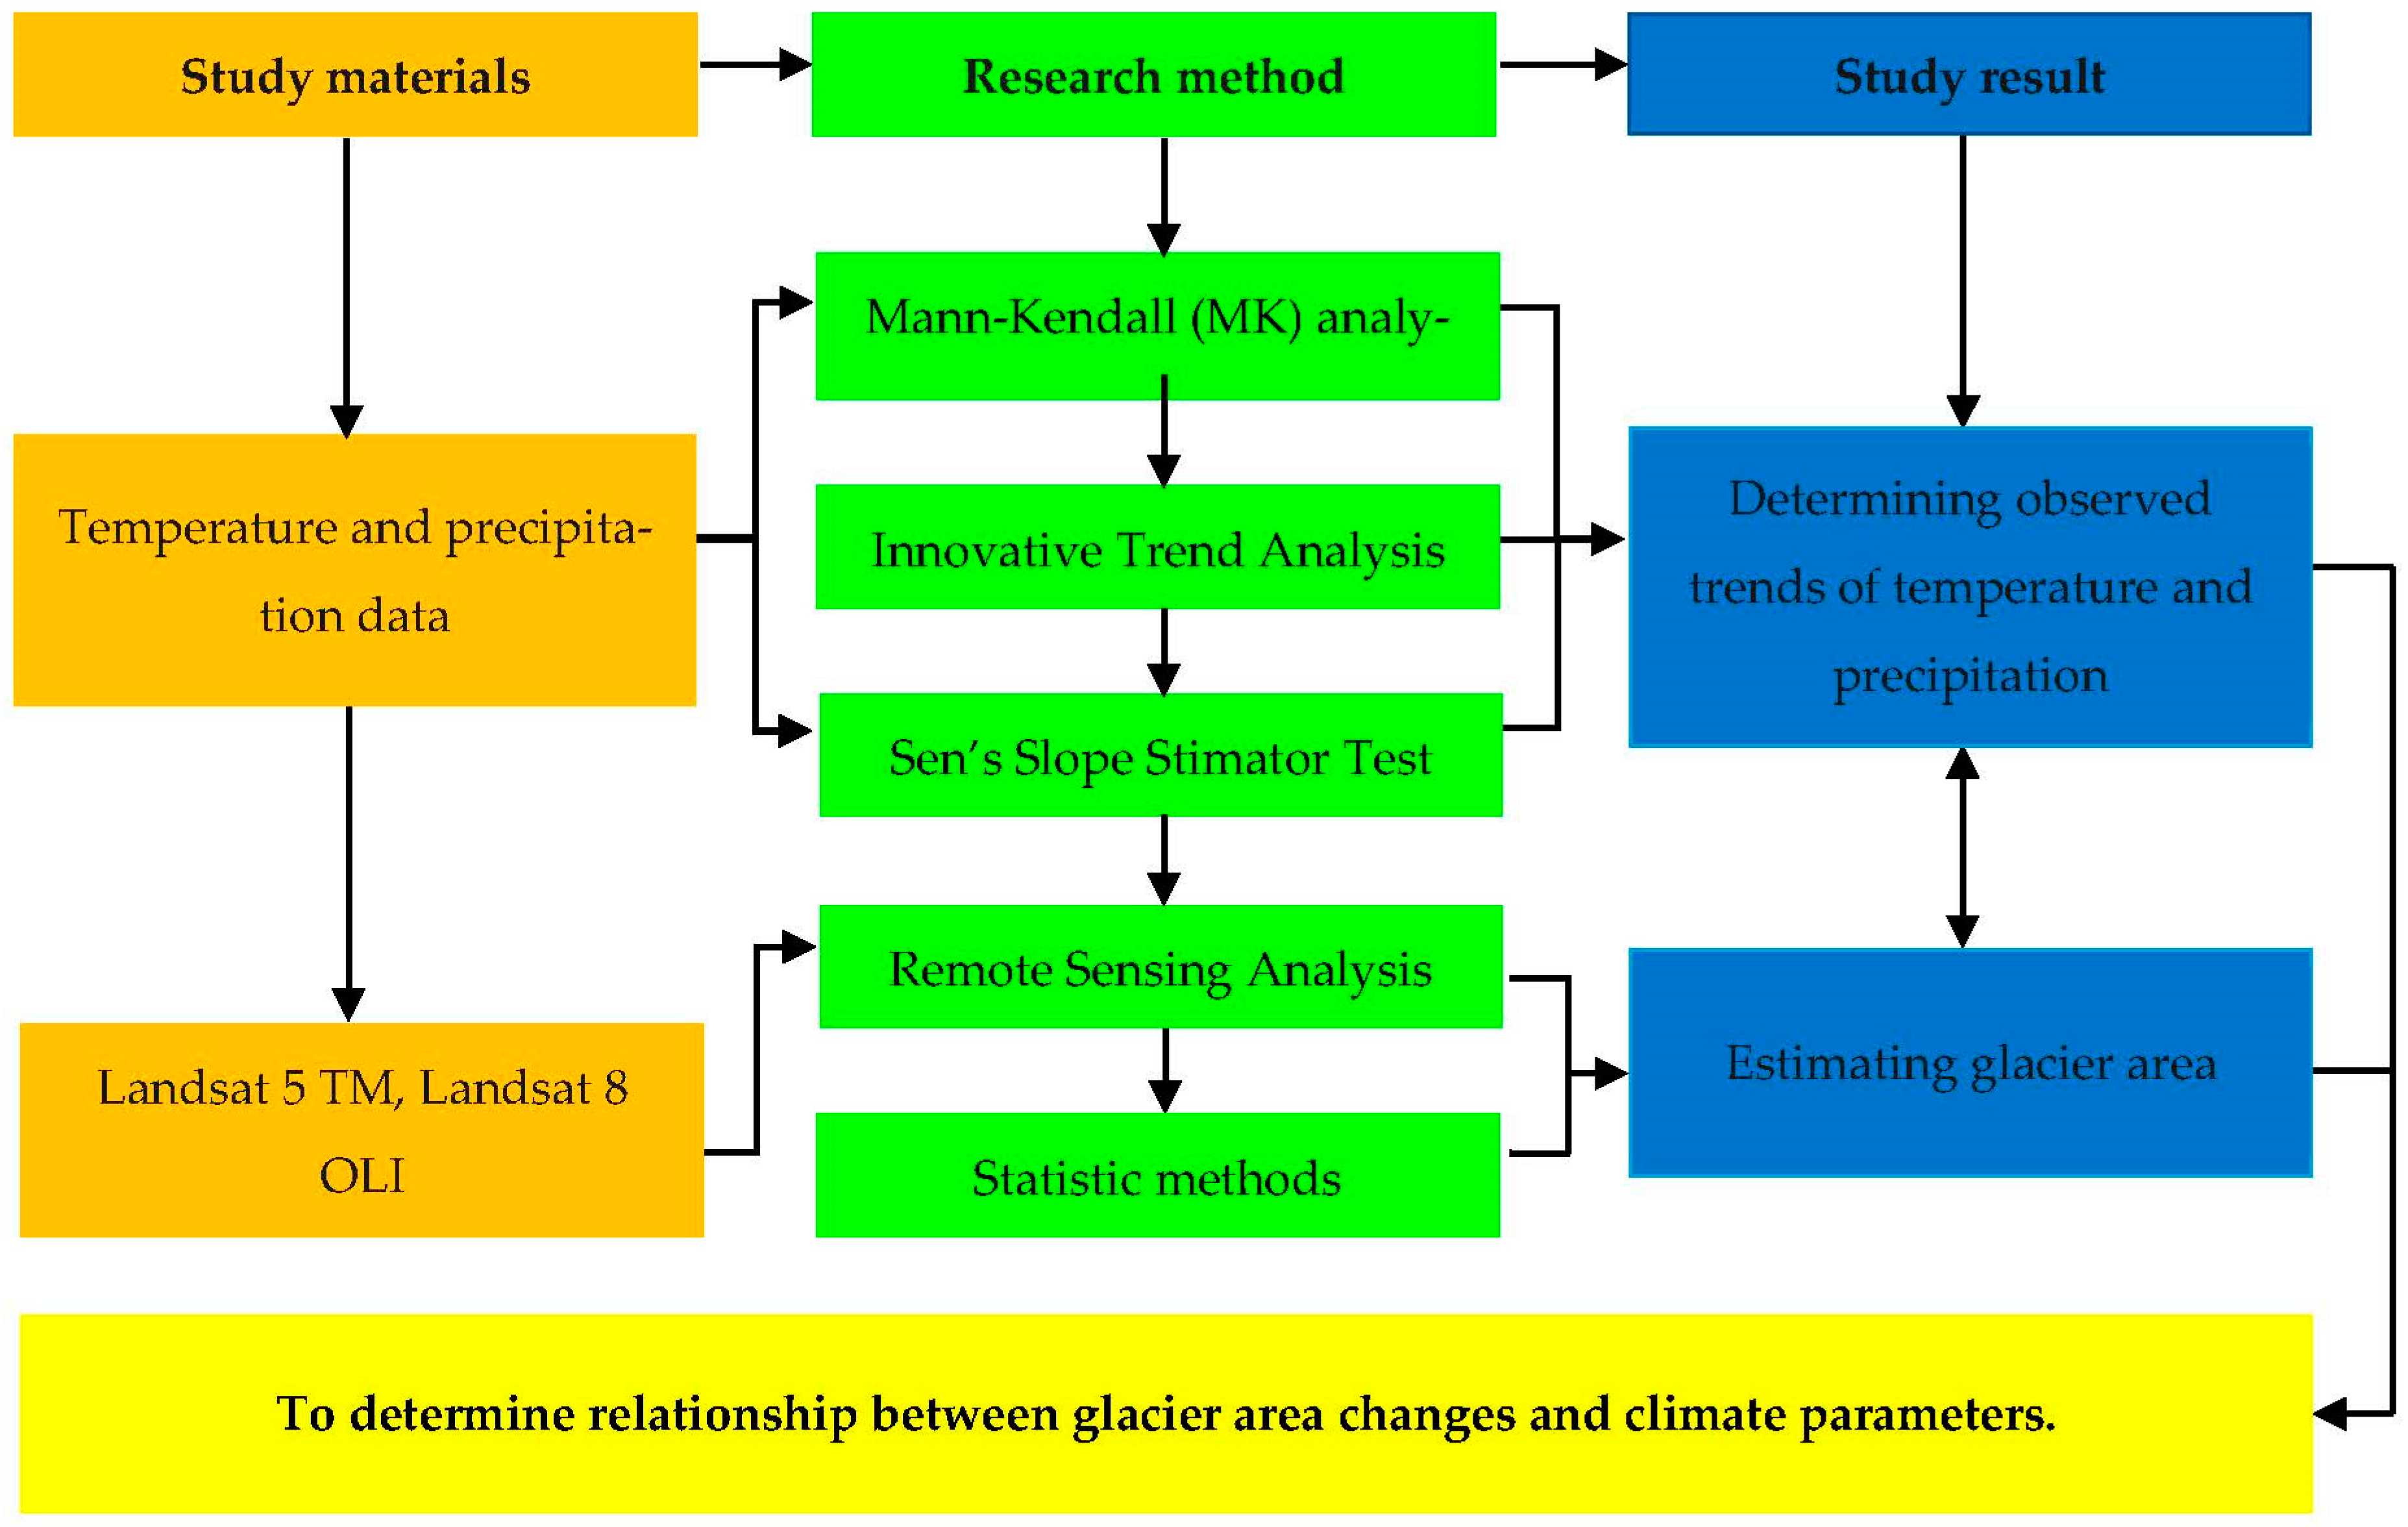
For the estimation of Mt. Munkhkhairkhan’s glacier area change between 1991 and 2020, we used Landsat 5 TM, Landsat 8 OLI, and SRTM with a 30 m accuracy—available at USGS (Global Visualization Viewer; http://glovis.usgs.gov/Table 1).

2.3. Methodology

Changes over the last 30 years in Mt. Munkhkhairhan’s glaciers were calculated using Remote sensing analysis, the Mann–Kendall (MK) test, the Innovative Trend Analysis Method (ITAM), and Sen’s Slope Estimator Test, as well as statistical methods for determining the relationship between climate parameters (precipitation and air temperature changes; Figure 2).

2.3.1. Mann–Kendall (MK) Test

The Mann–Kendall (MK) test was used for detecting the trends of variables in the hydro-meteorological observations [5,31,32,33]:
S = i = 1 n 1     j = i + 1 n s g n   x j x i    
Data on the change in the x i amount of data (i = 1, 2… n−1) and the x j value of the data were compared. The amount of data was estimated as follows using x i :
s g n x j x i = + 1   if   x j x i > 0         0   if   x j x i = 0 1   if   x j x i < 0
where the values x j   and   x i and the number timeseries is greater than or equal to   10   n 10 , the average value is equated as following the normal distribution E S = 0 . Changes in the time series of the data were calculated as V a r ( S ) as follow:
E S = 0
V a r S = n n 1 2 n + 5 k = 1 m t k ( t k 1 ) 2 t k + 5 18
where m is number of relevant groups of time series and t k is the number of ties in relevant groups of kth. The Z statistic test is as follows:
Z = { s 1 δ if     S > 0   0 , if     S = 0   s + 1 δ if     S < 0
If Z is greater than 0, it shows the trend is increasing; if Z is less than 0, it indicates that the trend is decreasing.
A   U F K = d k E d k V a r d k k = 1 ,   2 ,   ,   n
U F K = U F K
K = n + 1 k
where UF is the change curve.

2.3.2. Innovative Trend Analysis Method

The accuracy of the Innovative Trend Analysis Method was compared to the MK test and the indicator was calculated as follows [32,33]:
Φ = 1 n i = 1 n 10 x j x i μ
where Φ is the trend indicator, n is the number of observations, xi is the data series of the first half, xj is the data series of second subseries, and μ is the mean of the data series.

2.3.3. Sen’s Slope Estimator Test

The amount of temperature and precipitation was determined by the slope method. Qi is the slope between 2 datapoints and is determined as follows [34,35]:
Q i = x j x k j k ,   for   i = 1 , 2 , , N
where x j and x k are data points of time, and k(j > k), respectively. If there is only one datum, N is the number of lasting periods: N = n n 1 2 . If there are several data for many years, N is shown as follows: N < n n 1 2 , where “n” is the number of observations. Values of slope calculations were sorted from minimum to maximum. The mean of β was calculated as follows:
β =   Q N + 1 / 2                                                                       w h e n   N   i s   o d d   Q N / 2 + Q N + 2 / 2 / 2         w h e n   N   i s   e v e n
The value of β shows whether the trend is increasing or decreasing.

2.3.4. Methodology to Calculate Glacial Area Changes

Glacial area was estimated by the NDSI (Normalized Difference Snow Index) using Landsat TM, Landsat OLI, and Landsat ETM+ data. According to the NDSI, the calculated value is between −1 and 1, and values above zero are considered glacial. It was necessary to subtract the water area because this is included in values above zero [36]:
N D S I = Green     SWIR Green   +   SWIR

3. Results

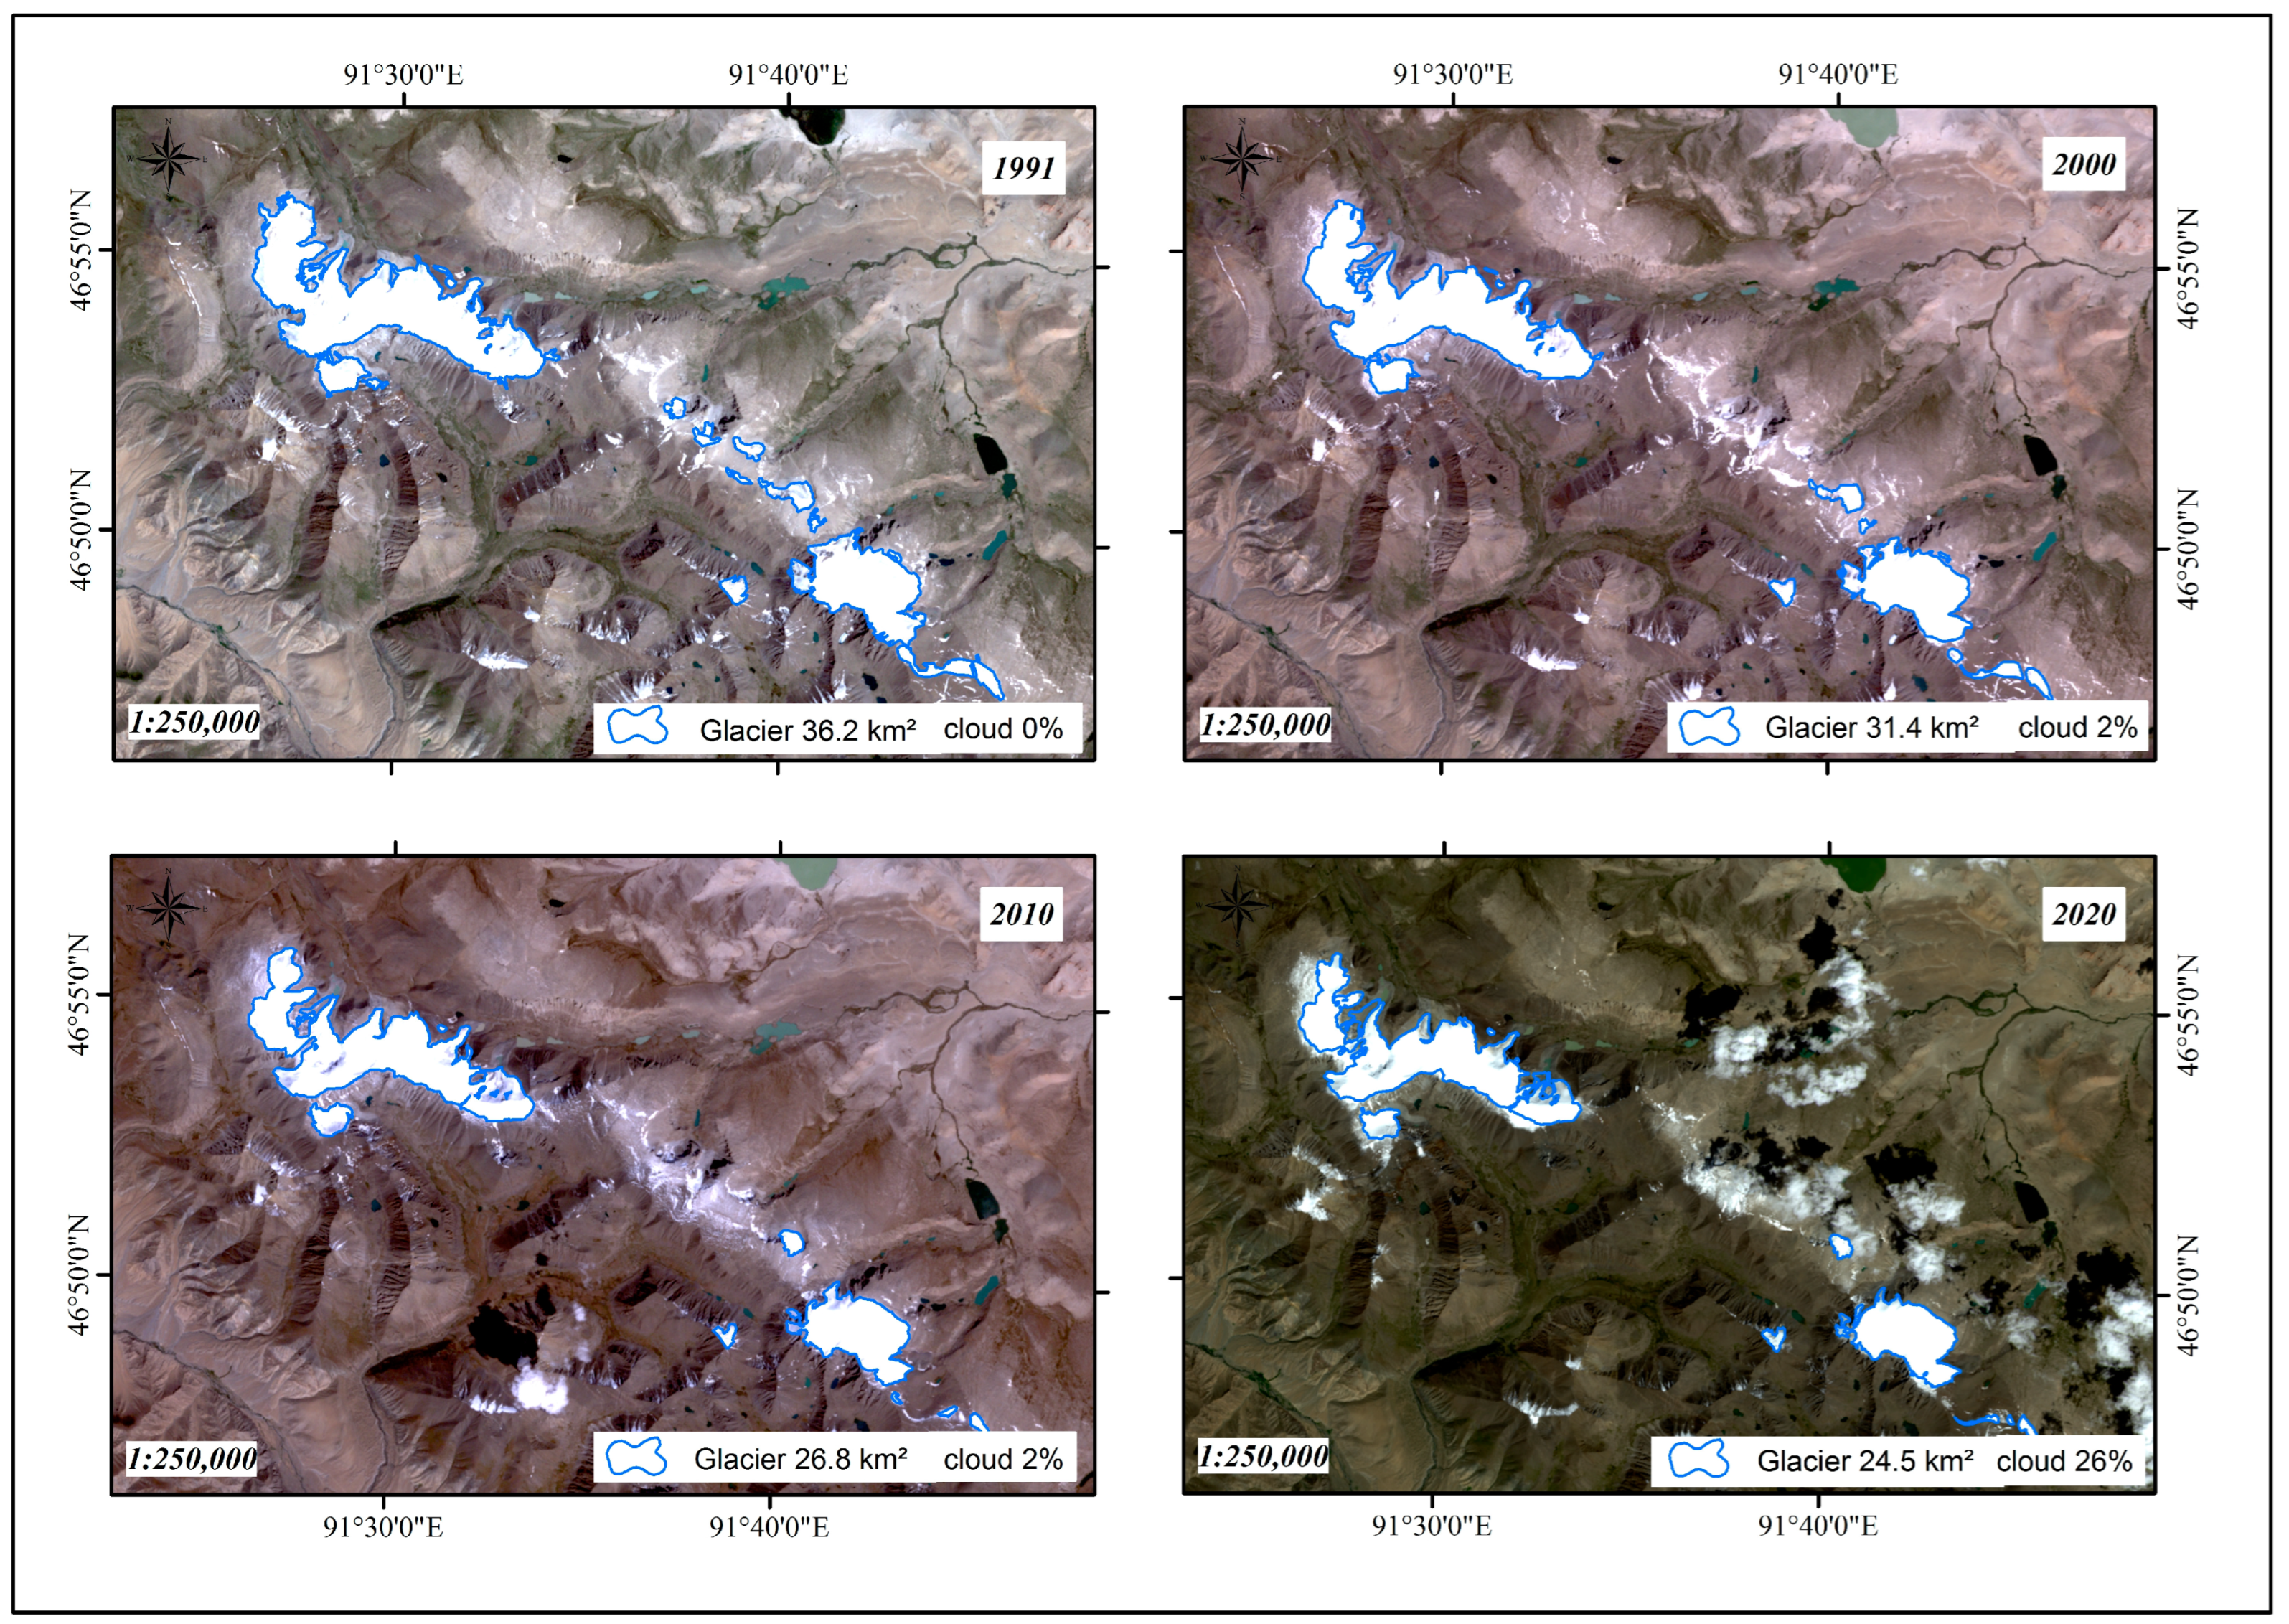
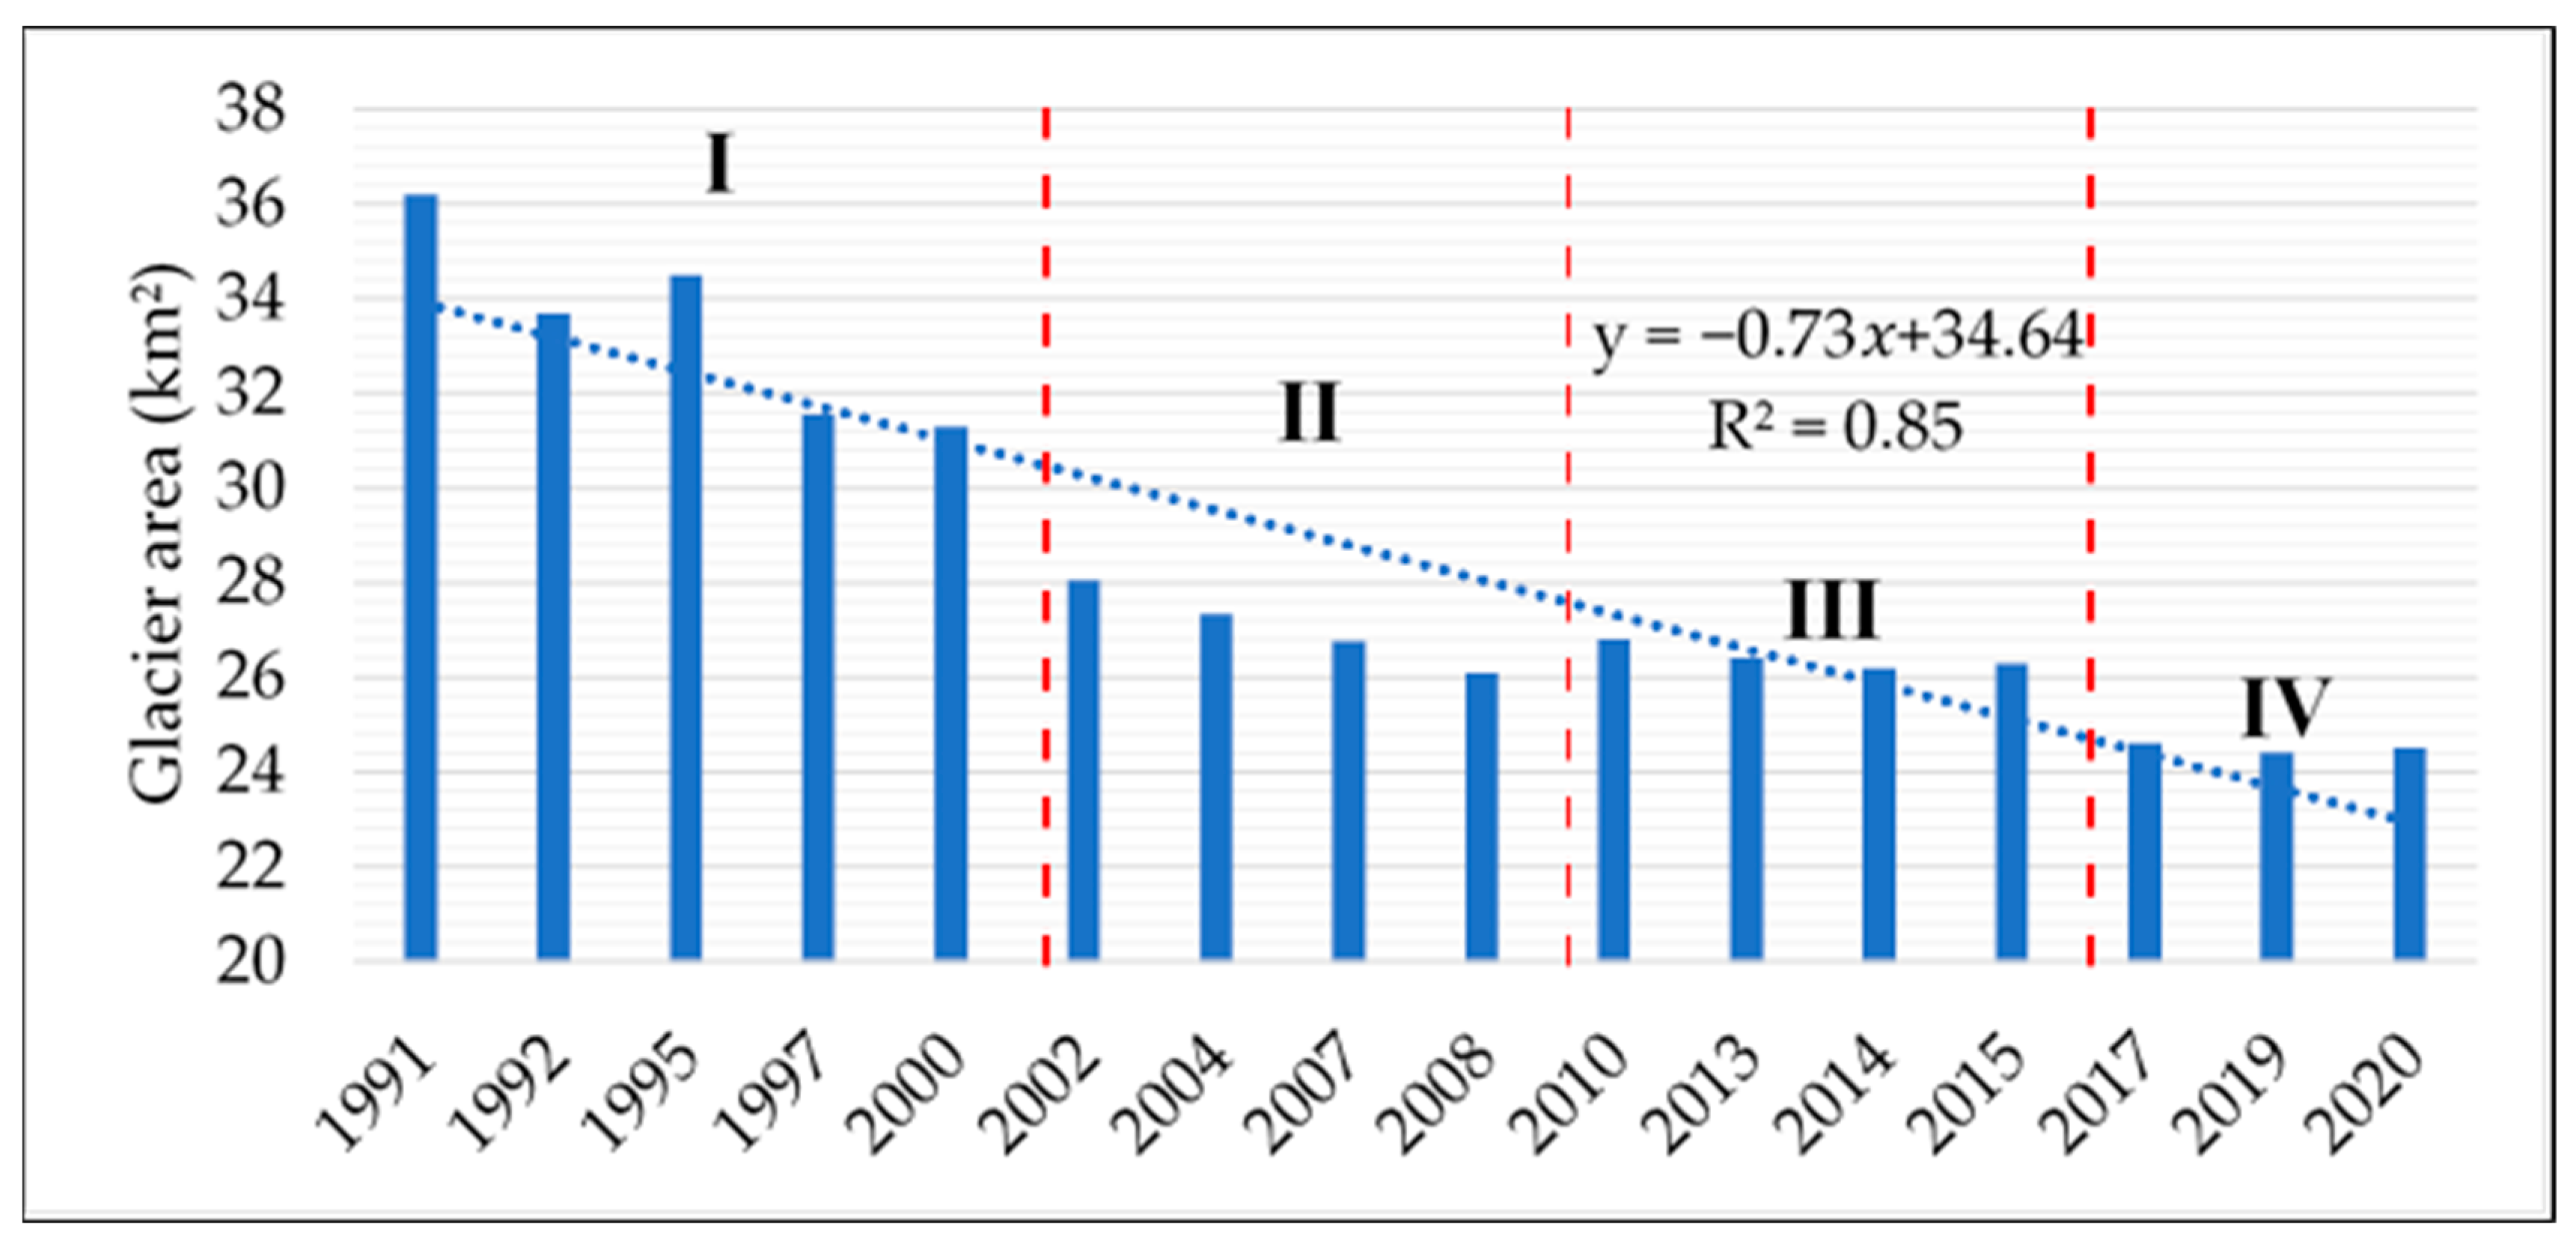
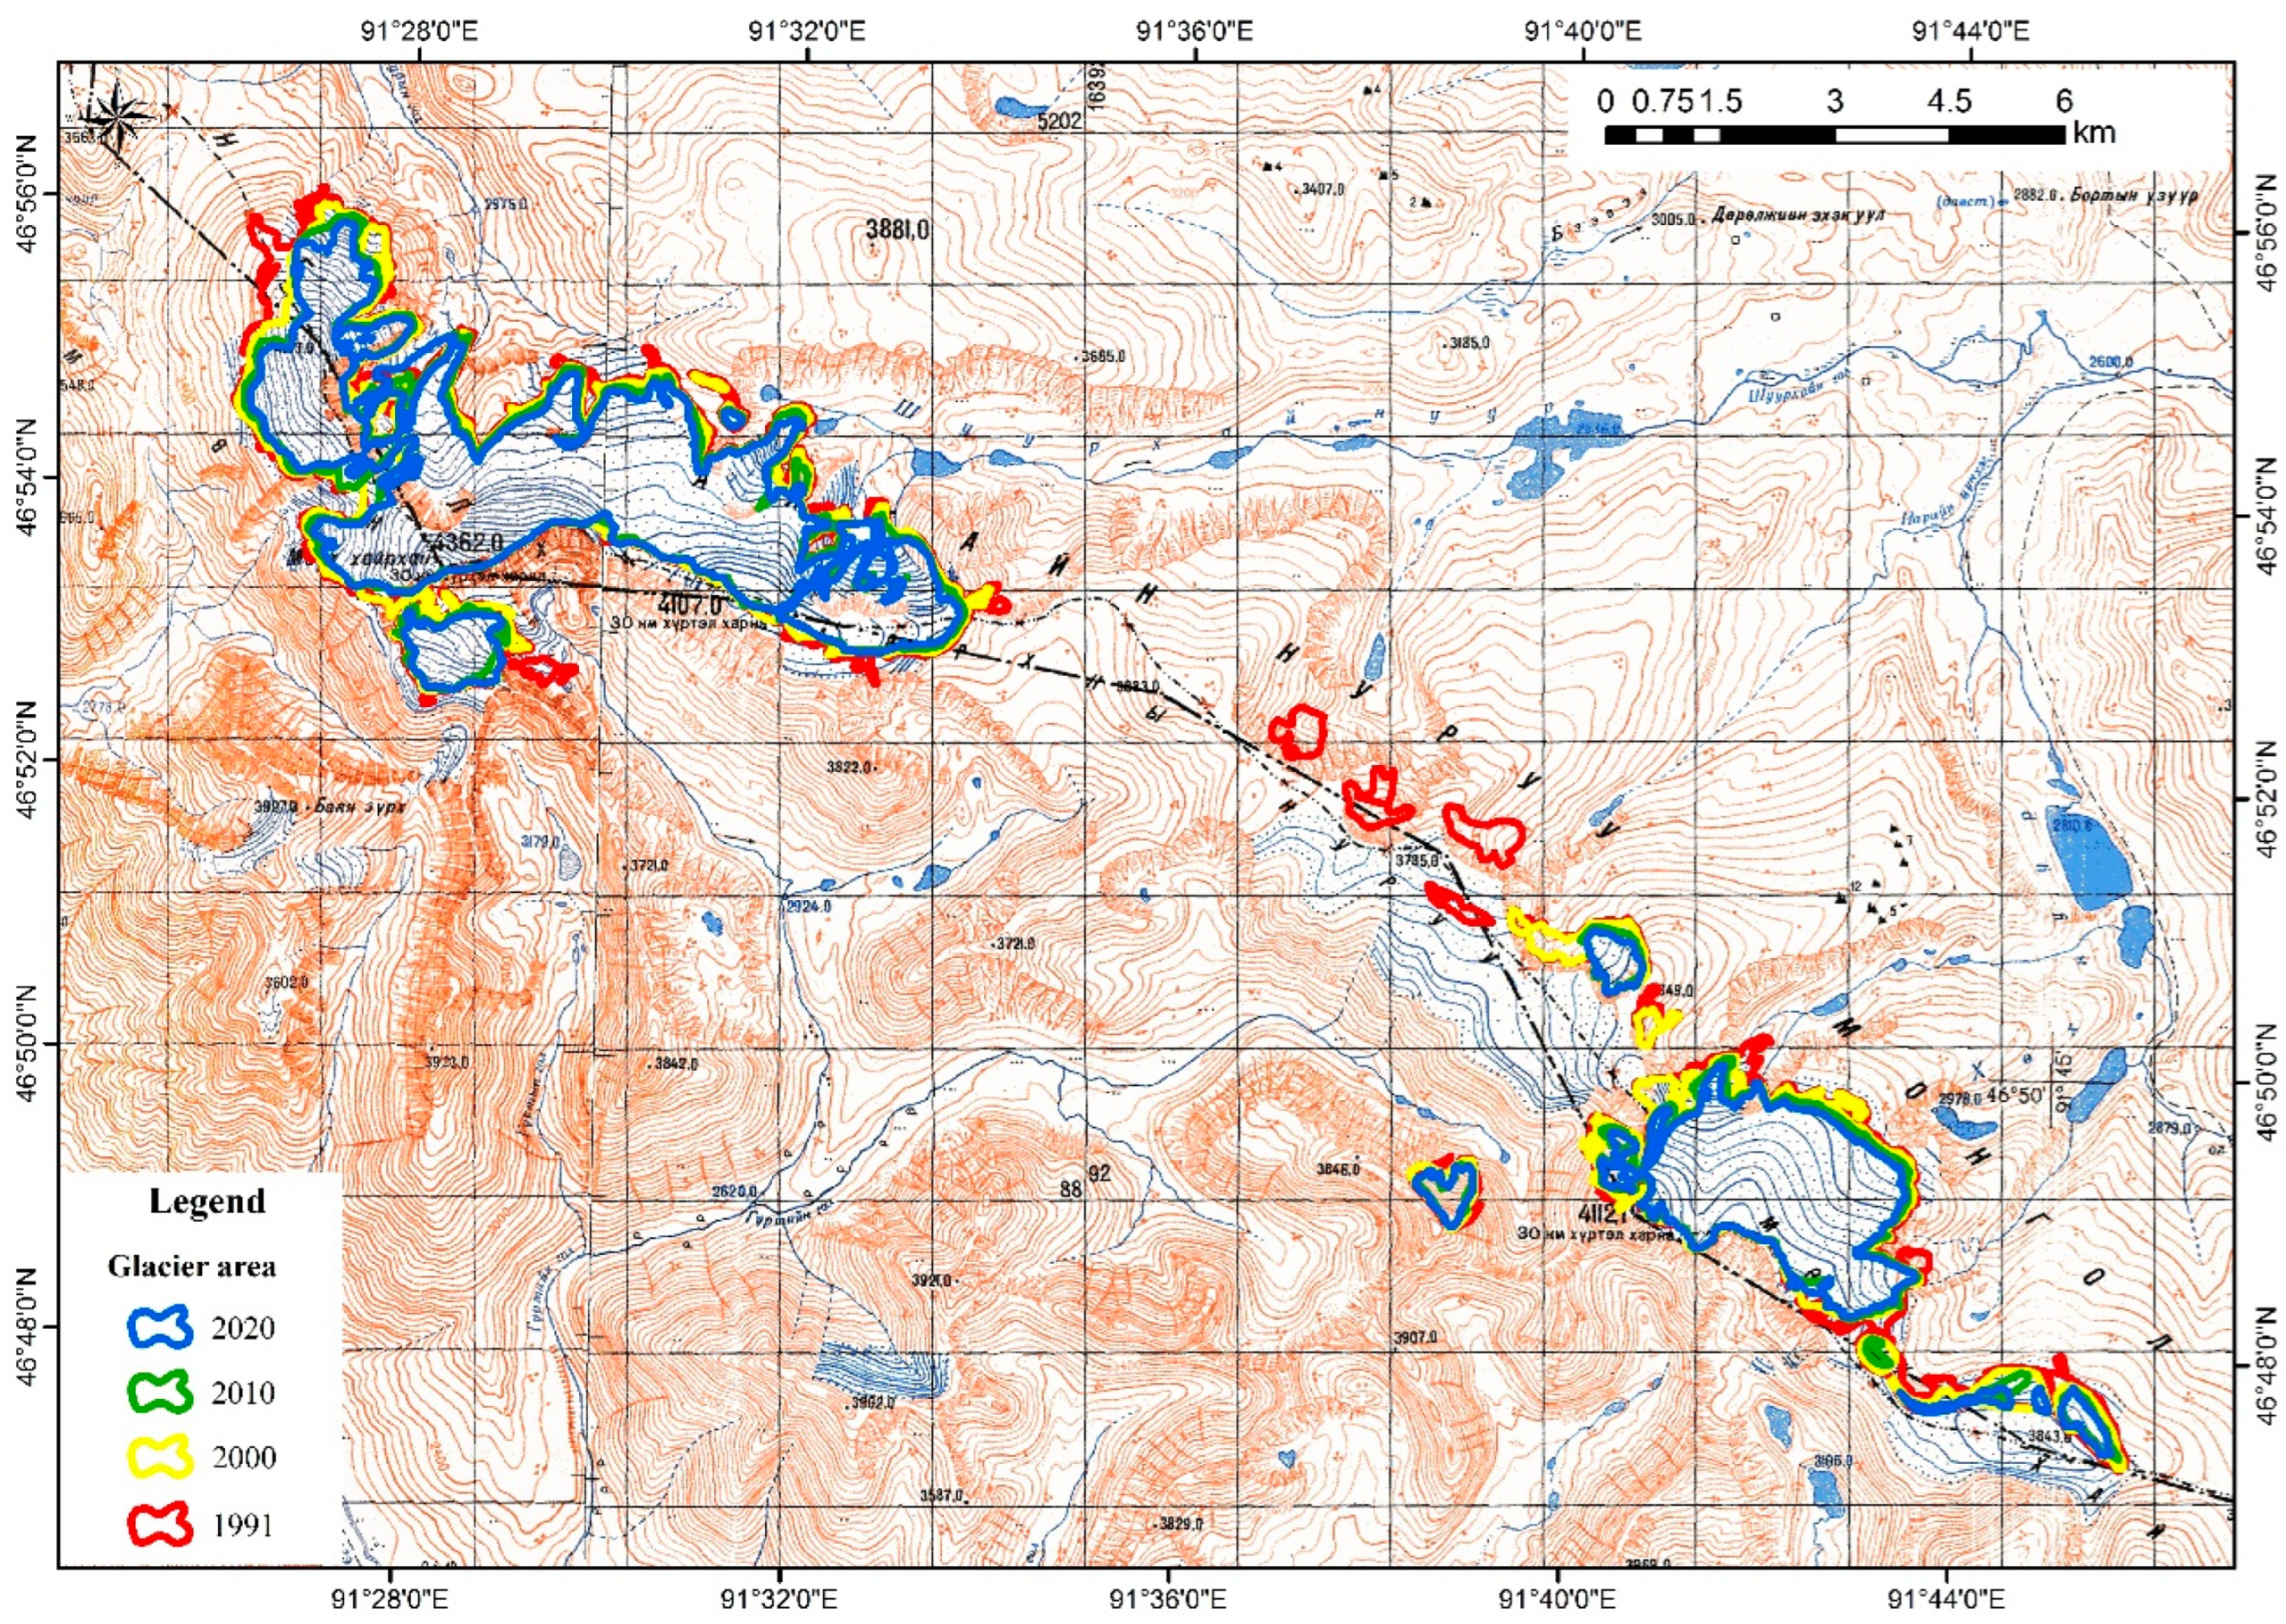
3.1. Glacial Dynamics

The glacier area of Mt. Munkhkhairkhan has decreased by 11.66 km2 between 1991 and 2020 (and has been decreasing since at least 1970). As of 2020, it covers 24.5 km2. A total of 50% of this area is located at the northern parts. For the last three decades, 22% of the glaciers at the northern parts have melted, and in the eastern, south-eastern, southern, and south-western parts where glacier distribution is low, 47% on average have melted. About 80% of the total glacial area exists above 3600 m a.s.l and the remaining 20% is below 3600 m a.s.l. From 1990 to 2020, the glacial area at and below 3600 m a.s.l. has decreased by 70% (Figure 3).
The total glacial area decreased by 13.8% from 1991 to 2000, by 16.02% from 2000 to 2010, and by 6.48%, from 2010 to 2020. For the last 30 years, the area has declined by 11.7 km2 (32.3%), from 1991 to 2020. This result shows that the glacial area has melted at an average rate of 1.07% per year (Figure 4).
Figure 4 shows the four stages of changes in the glacier area. Of these;
I.
1990–2000: The first-decade glacier melting was intense (0.4 km2 per year). The total area of glaciers decreased from 36.2 to 31.3 km2—4.9 km2/10 years.
II.
2000–2010: A period of steadily increasing glacier melting and decreasing glacier area. Compared to 2008, there was a sharp decrease in area in 2010, but there was a period with a steady decrease up to 2002 (31.3–28.5 km2). Over 10 years the glacier area decreased by 4.5 km2 (0.45 km2 per year).
III.
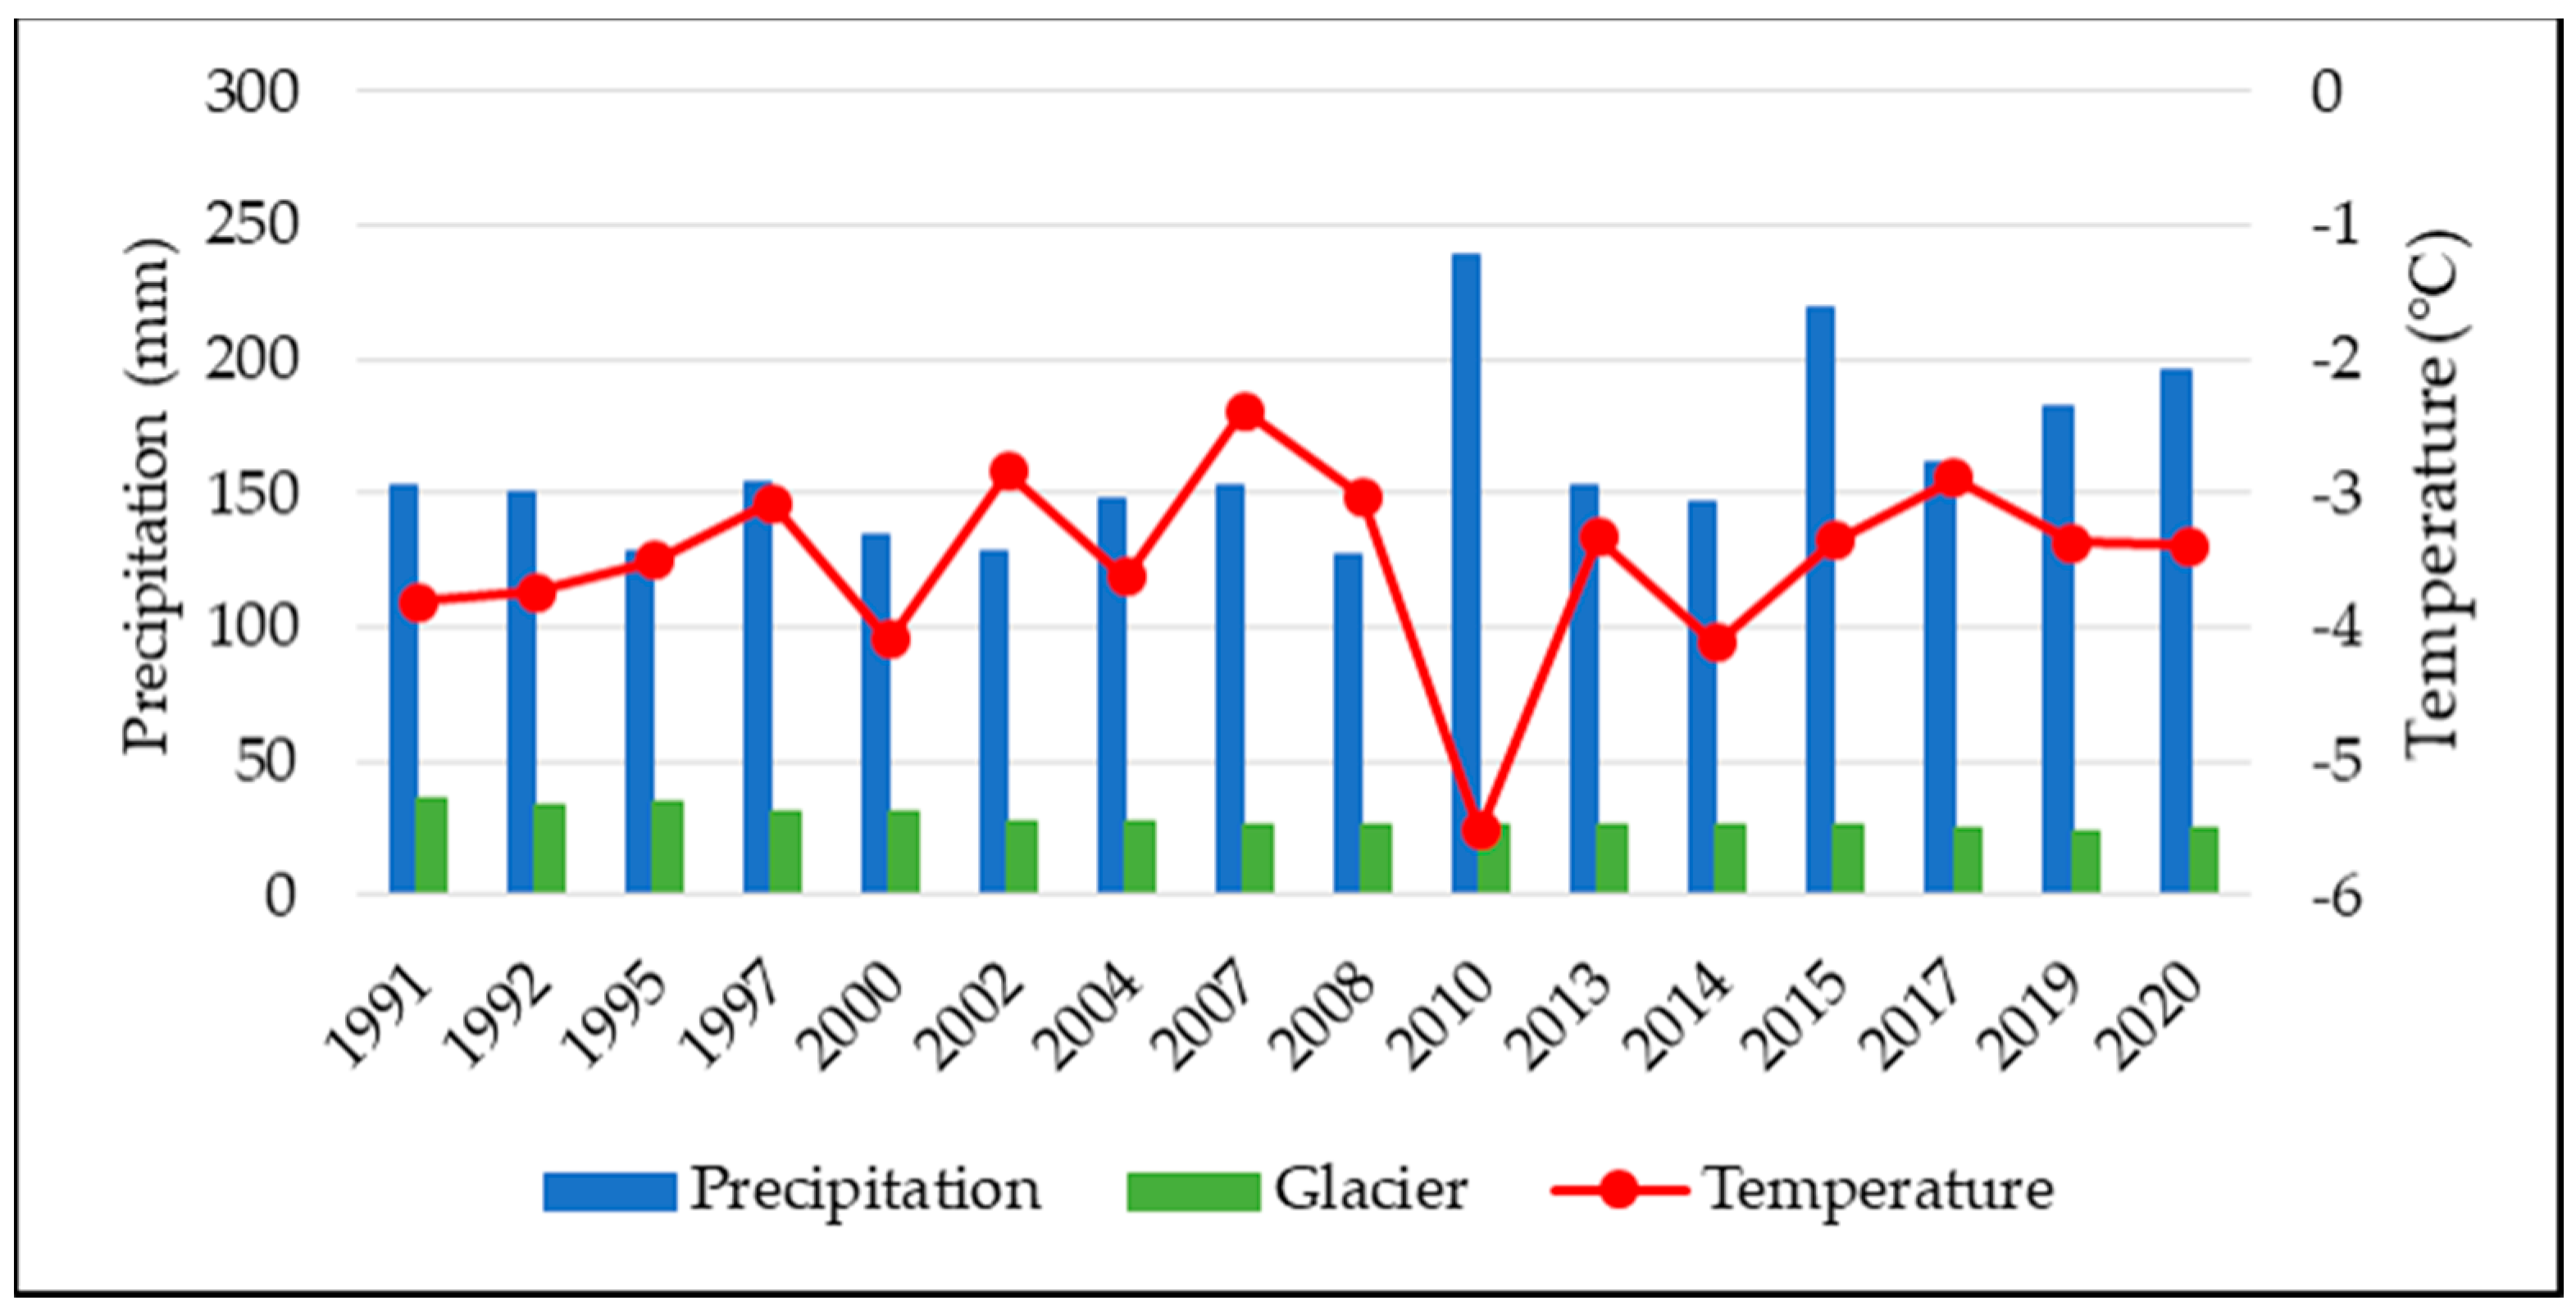
2010–2015: Glacier area changes were relatively stable, with low glacier melting (0.3 km2 per year). The period 2010–2014 corresponds to a period of increased precipitation and the greatest decrease in air temperature (Figure 5). In 2008, the rainfall was 126.8 mm, and in 2010, it almost doubled to 231.9 mm; this situation was maintained until 2015. However, the air temperature dropped sharply from −3.2 °C to −5.52 °C, and the average temperature was −3.3 °C until 2015 (Figure 5).
IV.
2015–2020: Glacier area changes from 2015 to 2017 showed a dramatic reduction (26.3–24.2 km2), but from 2017–2020 was relatively stable (24.6–24.5 km2; 0.1 km2 per year). The period 2010–2014 corresponds to the period of increased precipitation and the greatest decrease in air temperature (Figure 5). In 2008, the rainfall was 126.8 mm, and in 2010, it almost doubled to 231.9 mm; this situation was maintained until 2015. However, the air temperature dropped sharply from −3.2 °C to −5.52 °C, and the average temperature was −3.3 °C until 2015 (Figure 5).
Figure 5. Glacier area change and average climate elements.
Water 15 01921 g005

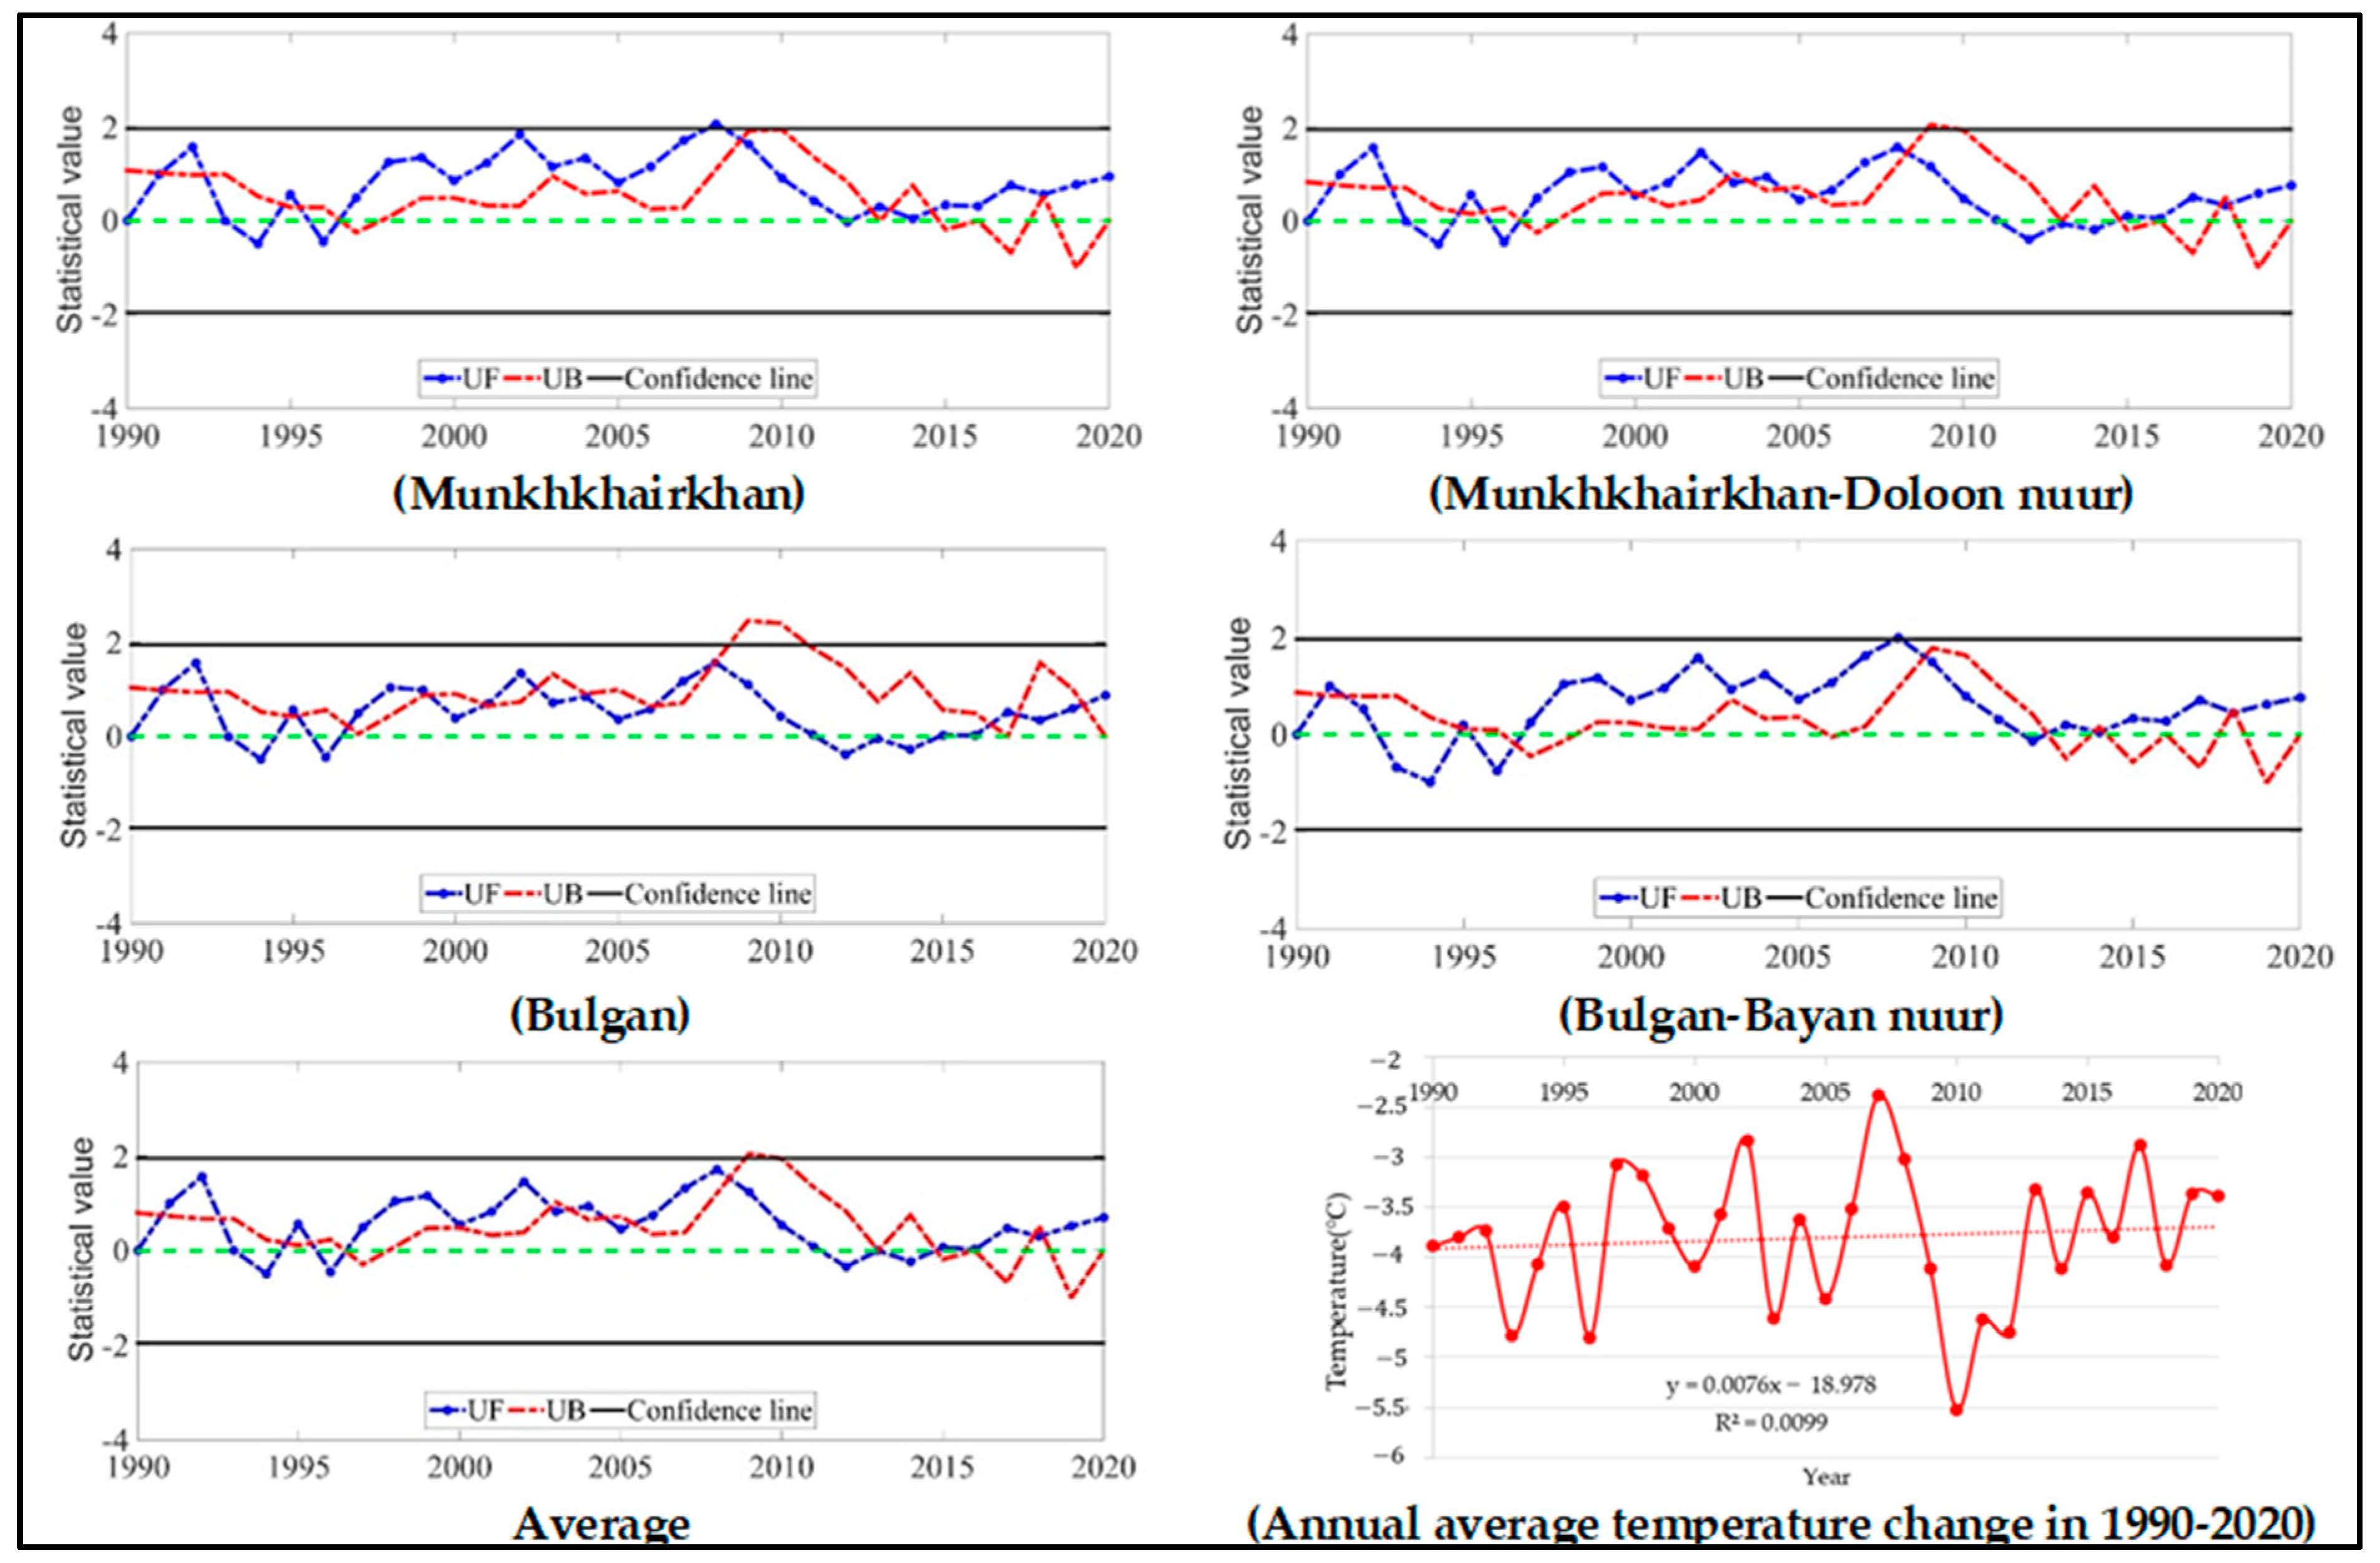
3.2. Air Temperature Analysis

The average air temperature has been increasing due to climate change (Figure 6).
The results of the Mann–Kendall analysis showed that the average air temperature trend rose between 1990 and 2020 (Z = 0.96). The result of the Innovative Trend analysis was φ = −0.18, and the Sen’s Slope Estimator Test showed β = 0.01 (Table 2).
Although short-term decreases have been observed at times, these decreases have stabilized at a high level and temperatures have increased again. Specifically, in 1990–1995, the air temperature had a steady decreasing trend, and in 1995–2008, it increased sharply and approached +2 °C in statistical terms; in 2008–2012, it gradually decreased to a statistically negative value, but from 2015, an increasing trend has been observed (Figure 6).

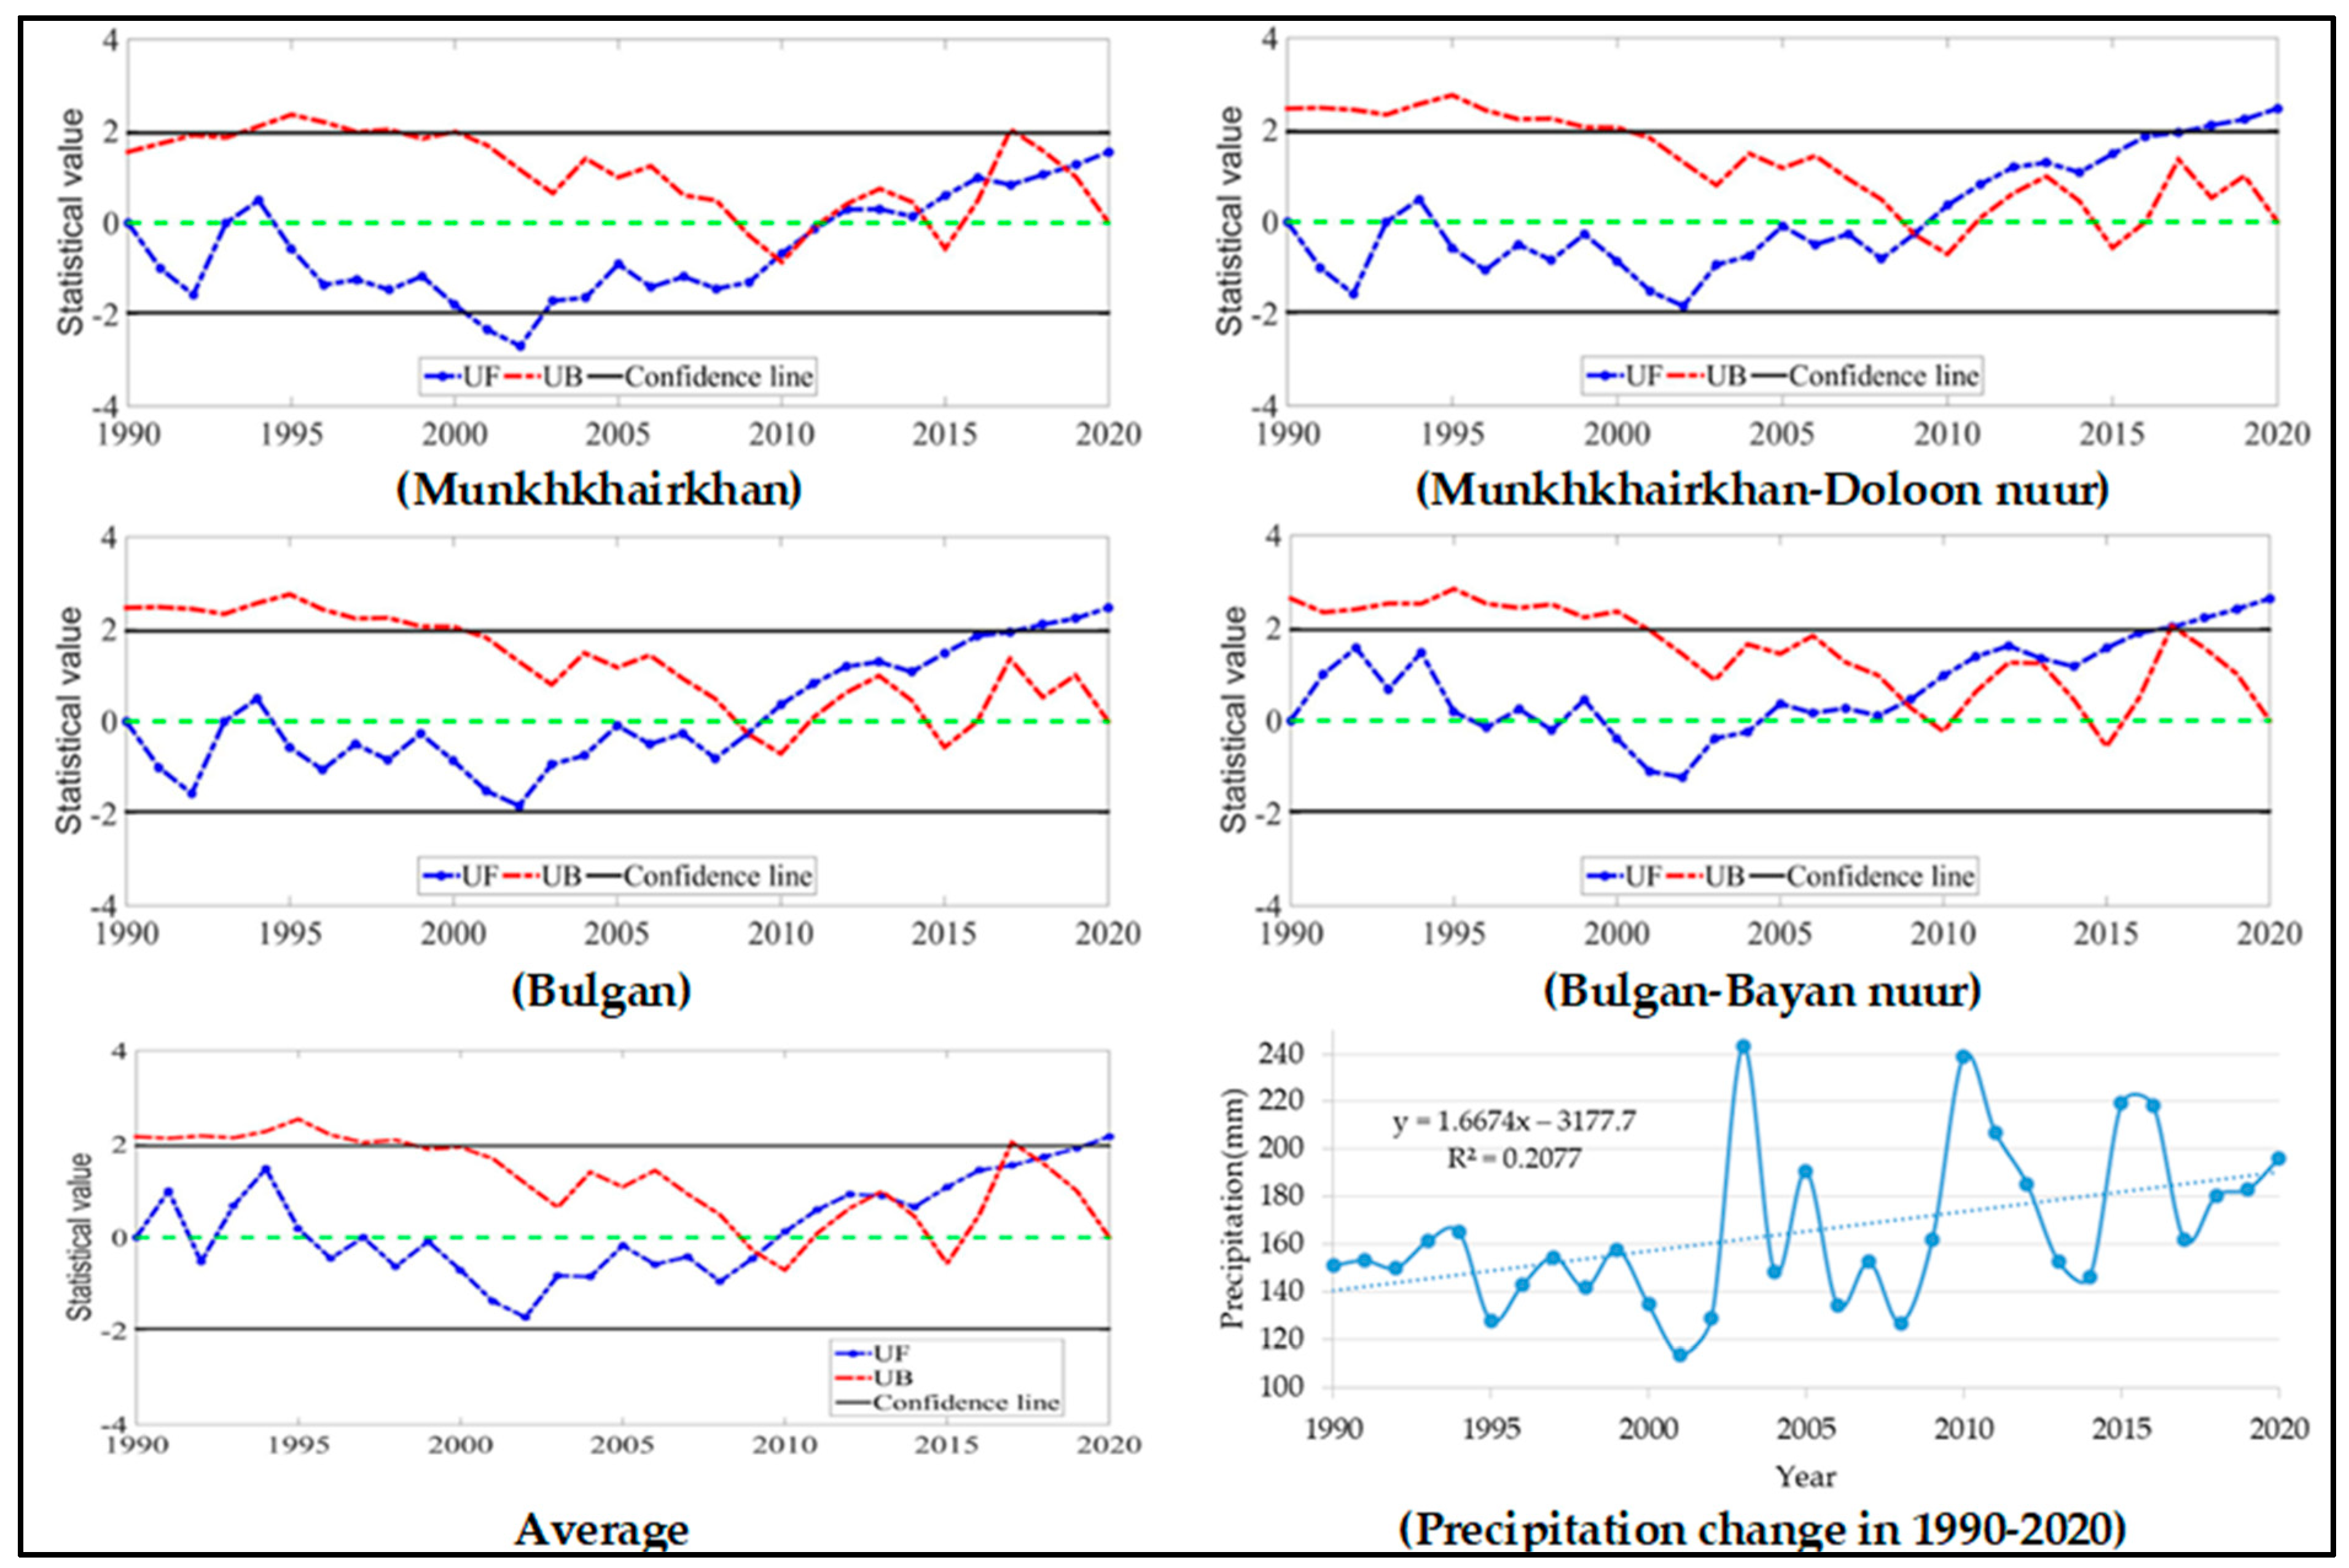
3.3. Precipitation Analysis

Precipitation is the main cause of losses in permafrost, and winter precipitation as snow balances the loss of glacier mass caused by summer temperatures in glaciers in cold regions. In Mongolia, the precipitation volume is low in the winter and higher in the summer and autumn.
According to long-term observations, the average annual precipitation in Western Mongolia ranges from 100 mm in the south to 250 mm in the north; about 80% falls from May to September. According to observations, the amount of precipitation from June to August changes from 50 to 110 mm.
The results of the Mann–Kendall analysis methods showed that precipitation tended to increase from 1990 to 2020 (Z = 2.81). The Innovative Trend Analysis showed φ = 1.72, and the Sen’s Slope Estimator Test result was β = 1.38 (Table 3, Figure 7).
A timeseries analysis of precipitation showed that precipitation tended to increase over cycles of 2–3 years and then decline. Precipitation trends showed an overall decrease from 1990 to 2003 but an increase over the last 20 years, (Figure 7). In summer, thunderstorms and heavy rains occur.
Precipitation gradually increased between 1990 and 1994 and approached +2 in statistical value, but inbetween 1995 and 2002 it decreased sharply and reached a statistical value of −2; it was negative between 2002 and 2009, but between 2009 and 2020 it increased from a 0 to a +2 value—a statistically significant increase over the last 20 years.

3.4. Warming and Glacier Melting

The northwest and northeast parts of Mt. Munkhkhairkhan are cooler and have more rainfall compared to the southwest and south-east, which is one of the reasons for the concentration of glaciers near the northern part of the mountain. In comparison, the annual average temperature and precipitation for the Altai (south-east) are 2.8 °C and 69 mm and for Uyench (south-west) they are 2.4 °C and, 71.8 mm, compared with—in the north-west—Munkhkhairkhan at 0.7 °C and, 110 mm and 1.1 °C, and 137.1 mm in the northwest of the mountain (Table 4 and Figure 8).
The geographical position of Mt. Munkhkhairkhan is in a dry climate from the south of the Trans-Altai Gobi, and according to data from the Baitag station is 5 °C higher than other north, northwest, and north-eastern exposures. Precipitation at the Baitag and Altai stations was 68–70 mm lower than at the other stations. Consequently, glaciers in the southern exposure were absent (Table 4 and Figure 8).
When the air temperature was lower than average, and the precipitation was higher than average, the melting of the glaciers was lower (2002, 2015, 2017)—whereas when the temperature was higher than average, and the precipitation was lower, the melting of the glaciers was higher (2004, 2010; Figure 9).
Due to the glacial melting, there is a high risk of ecosystem change for the surrounding areas. Near the Musun Buurug Lake, Shuurkhain Basin on Mt. Munkhkhairkhan, permafrost thawing is clearly observable. A thermokarst has formed in the lake area due to the melting of permafrost at the lake’s shore (Figure 10A–D). Due to the retreat of the glacier, the area of the Musun Khanatai Lake located near the glacier of the basin of Doloonnuur has increased by 48 percent in the last 30 years (1990–2020).
Starting from 2019, we marked defining points for measuring the retreat of the glaciers of the Shuurhkai and Doloonnuur glaciers and lakes. Observations were made on how ice and snow processes affect the retreat of these glaciers and the morphometry of the lakes. Thus, between 2019 and 2022, the Shuurkhai glaciers had retreated from the front of the tongue of the glaciers by 26.7 m and from the Doloonuur glaciers by 28.8 m. Between 2019 and 2022, Shuurkhai River Valley glacier No.3 retreated by 26.7 m, and Doloonnuur River Valley glacier No.7 by 28.8 m (Figure 10A,B,E,F).

4. Discussion

Important indicators of climate change are air temperature increases and glacial melting. Glacier mass balance is the outcome between temperatures that melt ice and winter precipitation as snow that forms ice. Mass balance is the controlling of both the volume of glaciers and their area. Counter-intuitively, the number of glaciers can increase when mass balance decreases because glacier ‘’branches’’ can be detached from the main body of a glacier [37].
P. Baast made the first attempt to inventory some glaciers of the Mongolian Altai in 1998. In 2012, D. Otgonbayar, inventoried glaciers of Mt. Sutai, Tsambagarav, and Munkhkhairkhan. D. Otgonbayar calculated a total of 24 glaciers covering 48.13 km2 in 1970, and again in 2008 when 17 glaciers covered 26.57 km2 [13,15]. Additionally, Kamp and Pan independently estimated 27.4 km2 glacial area in 2011. By the estimation of Ganyushkin, 26.86 km2 glaciers were present [17]. Ganyushkin and other researchers studied glacial retreat on the Altai ranges of Mongolia and Russia from the Little Ice Age. They estimated that during the Little Ice Age, 78.67 ± 2.82 km2 of Mt. Munkhkhairkhan was covered by glaciers [17].
Pan and other researchers calculated that the glacial area of the Mongolian Altai decreased by 43% between 1990 and 2016, and the maximum glacial retreat occurred during the warmest summer temperatures [14].
Our study demonstrates that Mt. Munkhkhairkhan had a 24.5 km2 glacial area as of 2020. The distribution of glaciers across altitudes shows that 97.86% were located above 3400 m a.s.l and, between 1990 and 2020, the glacier area located below 3600 m a.s.l decreased by 70% on average. The total area of glaciers decreased by 32.3% between 1990 and 2020.
The regression analysis showed that changes in air temperature, precipitation, and glacial area were strongly correlated, and an increase in annual precipitation during the warm season in summer and autumn in recent years may be able to reduce the rate of glacial melting although the overall average temperature increased.
As a result of this study, we have determined different periods of climate and glacier area changes from 1990 to 2020. These periods include:
1990–2000: The first decade was extremely warm, dry, and glacier melting was intense (1.2 km2).
2000–2010: Cooler, wetter mid-decade; less glacier melting compared to the previous decade (0.9 km2).
2010–2020: The last decade has been extremely warm, but with high precipitation and low glacier melting (0.3 km2; Figure 6 and Figure 8).
This pattern is close to the X and XI stages of glacier melting in the Altai Dry region. According to Ganyushkin, stage X (1995–2010) was “Extremely warm and dry, intensive melting of glaciers”, and stage XI was “Cool and humid, so melting of glaciers is low” [38]. The melting of glaciers has many important implications for the landscape and for local people. Glacial melt water increases the water level of glacial lakes, the percolation of lake water into the soil, and the thawing of permafrost. Additionally, due to this warming, the thermokarst processes are activated near the shores of glacial lakes, disturbing ecosystems and ecosystem processes [21]. Thawing permafrost carries the risk of lake dams collapsing in the future.
The long-term trends in temperature and precipitation were negatively related. While the average temperature increased from 1990 to 2003, the volume of precipitation declined. When air temperature decreased, annual precipitation amounts increased (Figure 8).
Multiple regression results showed a strong correlation between Temperature, Precipitation, and Glaciers (Multiple R = 0.69, R2 = 0.48). Ruther indicated that Temperature (t = −2.332, p = 0.036) and Precipitation (t = −3.212, p = 0.007) were significant predictors in the model. Air temperature and precipitation explained 48 percent of the changes in glacier area, and R = 0.69, which is a strong correlation.
R square (R2) equalled 0.48; this means that the predictors (temperature, and precipitation) explained 48.8% of the variance in Y (Glacier). The coefficient of multiple correlations (R) equalled 0.69; this means that there was a strong correlation between the predicted data (ŷ) and the observed data (y). In order to better determine the relationship between glacier climates, we selected 16 samples and used the average values for each period (calculated with 1–3 year intervals of glacier area changes, and 1–3 year average values of air temperature and total precipitation for that period) to calculate correlations. Overall regression: right-tailed, F(2,13) = 6.20, p-value = 0.01. Since p-value < α (0.05), we rejected the H0. All the independent variables (Xi) were significant. The Y-intercept (b): two-tailed, T = 3.97, p-value = 0.001. “b” was significantly different from zero.
Potential glacial outburst floods and changes in glacier run-off are likely to affect local people who camp in the mountains during herding activities and local communities that depend on glacial melt water for drinking. At a global scale, glaciers in remote, arid regions such as Mongolia are relatively under-studied, and yet are probably at the greatest risk of being lost during global warming. Therefore, it is necessary to conduct continuous monitoring studies of glaciers and glacial outburst lakes.

5. Conclusions

In this research, we determined the changes in the modern glaciated area of Mt. Munkhkhairkhan, located in the southern part of the Mongolian Altai Mountains, and the temperature and precipitation mode of 1990–2020. We also determined the impact of glacial melt on the highlands.
The Mann–Kendall (MK) test, Innovative Trend Analysis Method (ITAM), and Sen’s Slope Estimator Test were used for precipitation and temperature analyses of Mt. Munkhkhairkhan’s glaciers, and the remote sensing method was used for estimating glacial area.
Changes in temperature and precipitation over the last 30 years were studied. The average temperature increased by 0.5 °C overall, but there were decreases over a short period of time after which it continued to grow. Precipitation levels tended to decrease between 1990 and 2000, but in the last two decades, they have slightly increased.
According to the observations of the field research, rainfall in recent years has been increasing in the form of storms. Additionally, extreme weather changes (excessive heat, sudden cold, snowfall) have been observed in the summer, while the winter season has been warmer than average for many years.
As of 2020, there was a 24.5 km2 total area of glacier at Mt. Munkhkhairkhan—most of it in the north part and above an altitude of 3400 m a.s.l. The area decreased by 13.8% between 1991 and 2000, by 16.02% between 2000 and 2010, and by 6.48% between 2010 and 2020. From 1991–2020, it decreased by 32.3% or 11.7 km2. The results show that the glacial area melted by an average rate of 1.07% per year.
Glacier melting was intense in 1991–2010, when the air temperature increased and there was more precipitation. The temperature rate is expected to rise, but since 2000, due to increases in annual precipitation—mainly as snow—the rate of glacial melting has decreased.
Glaciers are very important for maintaining the balance of ecosystems in arid and semi-arid regions and are very sensitive to climate change, so it is important to continue glacier monitoring research. The glaciers and snow area in the study area have changed due to climate warming and precipitation changes and are located in arid and semi-arid regions of Central Asia. This study of Mt. Munkhairkhan shows that climate change significantly impacts glaciers and snow.

Author Contributions

Conceptualization, S.N.K., T.V.C., V.A.Z., B.M., O.D. and B.D.; methodology, B.M., B.D. and O.D; software, B.T.; verification, B.D. and O.D.; formal analysis, O.D., B.M., E.G. and A.O.K.; resource, O.D.; data processing, B.M., B.T. and Z.J.; writing—preparing first draft, B.M., B.T. and O.S.; writing—editing, B.D., O.D. and T.V.C.; designing, graphics, B.M., B.T. and N.G.; supervision, O.D. and B.D.; project management, O.D. and B.D. The final manuscript was checked and approved by all the authors before submission. All authors have read and agreed to the published version of the manuscript.

Funding

This work was supported by Ministry of Education and Science of Mongolia and the Mongolian Foundation for Science and Technology (2021/330). Additionally, S.N.K. is grateful to the Tomsk State University Development Programmed («Priority-2030»), and the Advanced Grant from the National University of Mongolia (Grant: P2022-4376), and was supported by “T.V.C.’s the EU Horizon Grant 871120 to INTERACT”. A.O.K. is grateful for support of the Russian Science Foundation (RSF), grant 23-14-20015.

Data Availability Statement

Not applicable.

Acknowledgments

The authors would like to thank the National University of Mongolia and the Khovd branch school of the National University of Mongolia and the members of the research teams who made great contributions to this work.

Conflicts of Interest

The authors declare no conflict of interest.

References

  1. Cantonati, M.; Poikane, S.; Pringle, C.M.; Stevens, L.E.; Turak, E.; Heino, J.; Richardson, J.S.; Bolpagni, R.; Borrini, A.; Cid, N.; et al. Characteristics, Main Impacts, and Stewardship of Natural and Artificial Freshwater Environments: Consequences for Biodiversity Conservation. Water 2020, 12, 260. [Google Scholar] [CrossRef]
  2. Bantcev, D.V.; Ganyushkin, D.A.; Chistyakov, K.V.; Volkov, I.V.; Ekaykin, A.A.; Veres, A.N.; Tokarev, I.V.; Shtykova, N.B.; Andreeva, T.A. The Components of the Glacial Runoff of the Tsambagarav Massif from Stable Water Isotope Data. Geosciences 2019, 9, 297. [Google Scholar] [CrossRef]
  3. Harrison, S.; Kargel, J.S.; Huggel, C.; Reynolds, J.; Shugar, D.H.; Betts, R.A.; Emmer, A.; Glasser, N.; Haritashya, U.K.; Klimeš, J.; et al. Climate change and the global pattern of moraine-dammed glacial lake outburst floods. Cryosphere 2018, 12, 1195–1209. [Google Scholar] [CrossRef]
  4. Li, X.; Zhang, L.; Yang, G.; Li, H.; He, B.; Chen, Y.; Tang, X. Impacts of human activities and climate change on the water environment of Lake Poyang Basin, China. Geoenviron. Disasters 2015, 2, 22. [Google Scholar] [CrossRef]
  5. Dorjsuren, B.; Yan, D.; Wang, H.; Chonokhuu, S.; Enkhbold, A.; Yiran, X.; Girma, A.; Gedefaw, M.; Abiyu, A. Observed Trends of Climate and River Discharge in Mongolia’s Selenga Sub-Basin of the Lake Baikal Basin. Water 2018, 10, 1436. [Google Scholar] [CrossRef]
  6. Xenarios, S.; Gafurov, A.; Schmidt-Vogt, D.; Sehring, J.; Manandhar, S.; Hergarten, C.; Shigaeva, J.; Foggin, M. Climate change and adaptation of mountain societies in Central Asia: Uncertainties, knowledge gaps, and data constraints. Reg. Environ. Chang. 2019, 19, 1339–1352. [Google Scholar] [CrossRef]
  7. Abuduwaili, J.; Issanova, G.; Saparov, G. Water Resources and Impact of Climate Change on Water Resources in Central Asia. In Hydrology and Limnology of Central Asia; Springer: Singapore, 2019; pp. 1–9. [Google Scholar] [CrossRef]
  8. Walther, M.; Dashtseren, A.; Kamp, U.; Temujin, K.; Meixner, F.; Pan, C.G.; Gansukh, Y. Glaciers, Permafrost and Lake Levels at the Tsengel Khairkhan Massif, Mongolian Altai, During the Late Pleistocene and Holocene. Geosciences 2017, 7, 73. [Google Scholar] [CrossRef]
  9. Orkhonselenge, A.; Harbor, J.M. Impacts of modern glacier changes on surface water resources in western and northern Mongolia. J. Water Resour. Prot. 2018, 10, 559. [Google Scholar] [CrossRef]
  10. Kamp, U.; Pan, C.G. Inventory of glaciers in mongolia, derived from landsat imagery from 1989 to 2011. Geogr. Ann. Ser. A Phys. Geogr. 2015, 97, 653–669. [Google Scholar] [CrossRef]
  11. Chen, Y.; Zhang, X.; Fang, G.; Li, Z.; Wang, F.; Qin, J.; Sun, F. Potential risks and challenges of climate change in the arid region of northwestern China. Reg. Sustain. 2020, 1, 20–30. [Google Scholar] [CrossRef]
  12. Hock, R.; Rasul, G.; Adler, C.; Cáceres, B.; Gruber, S.; Hirabayashi, Y.; Jackson, M.; Kääb, A.; Kang, S.; Kutuzov, S. High Mountain areas. In IPCC Special Report on the Ocean and Cryosphere in a Changing Climate; Pörtner, H.-O., Roberts, D.C., Masson-Delmotte, V., Zhai, P., Tignor, M., Poloczanska, E., Mintenbeck, K., Alegría, A., Nicolai, M., Okem, A., et al., Eds.; Cambridge University Press: Cambridge, UK; New York, NY, USA, 2019; pp. 131–202. [Google Scholar]
  13. Plyusnin, V.M.; Kitov, A.D.; Ivanov, E.N.; Sheinkman, V.S. Distinctive characteristics of formation and dynamics of nival-glacial geosystems in the south of East Siberia and on Mongolian Altai. Geogr. Nat. Resour. 2013, 34, 1–13. [Google Scholar] [CrossRef]
  14. Pan, C.G.; Pope, A.; Kamp, U.; Dashtseren, A.; Walther, M.; Syromyatina, M.V. Glacier recession in the Altai Mountains of Mongolia in 1990–2016. Geogr. Ann. Ser. A Phys. Geogr. 2018, 100, 185–203. [Google Scholar] [CrossRef]
  15. Filandysheva, L.B.; Borodavko, P.S.; Demberel, O. Climatogenic Cryomorphogenesis in the Southeastern Altai Mountains. Contemp. Probl. Ecol. 2022, 15, 212–221. [Google Scholar] [CrossRef]
  16. Krumwiede, B.S.; Kamp, U.; Leonard, G.J.; Kargel, J.S.; Dashtseren, A.; Walther, M. Recent Glacier Changes in the Mongolian Altai Mountains: Case Studies from Munkh Khairkhan and Tavan Bogd. In Global Land Ice Measurements from Space; Kargel, J.S., Leonard, G.J., Bishop, M.P., Kääb, A., Raup, B.H., Eds.; Springer: Berlin/Heidelberg, Germany, 2014; pp. 481–508. [Google Scholar] [CrossRef]
  17. Ganyushkin, D.; Chistyakov, K.; Derkach, E.; Bantcev, D.; Kunaeva, E.; Terekhov, A.; Rasputina, V. Glacier Recession in the Altai Mountains after the LIA Maximum. Remote Sens. 2022, 14, 1508. [Google Scholar] [CrossRef]
  18. Coe, J.A. Bellwether sites for evaluating changes in landslide frequency and magnitude in cryospheric mountainous terrain: A call for systematic, long-term observations to decipher the impact of climate change. Landslides 2020, 17, 2483–2501. [Google Scholar] [CrossRef]
  19. Prakash, C.; Nagarajan, R. Glacial Lake changes and outburst flood hazard in Chandra basin, North-Western Indian Himalaya. Geomat. Nat. Hazards Risk 2018, 9, 337–355. [Google Scholar] [CrossRef]
  20. Hock, R.; Huss, M. Glaciers and climate change. In Climate Change, 3rd ed.; Letcher, T.M., Ed.; Elsevier: Amsterdam, The Netherlands, 2021; pp. 157–176. [Google Scholar] [CrossRef]
  21. Ding, Y.; Zhang, S.; Zhao, L.; Li, Z.; Kang, S. Global warming weakening the inherent stability of glaciers and permafrost. Sci. Bull. 2019, 64, 245–253. [Google Scholar] [CrossRef]
  22. Li, J.; Sheng, Y.; Luo, J. Automatic extraction of Himalayan glacial lakes with remote sensing. J. Remote Sens. 2011, 15, 29–43. [Google Scholar]
  23. Davaasambuu, U.; Liu, A.; Oyunbaatar, D.; Peter Bol, G. Impact of Climate Change on Water Resource in Mongolia. Int. J. Sci. Res. Publ. 2019, 9, 6. [Google Scholar] [CrossRef]
  24. Wood, L.R.; Neumann, K.; Nicholson, K.N.; Bird, B.W.; Dowling, C.B.; Sharma, S. Melting Himalayan glaciers threaten domestic water resources in the Mount Everest Region, Nepal. Front. Earth Sci. 2020, 8, 128. [Google Scholar] [CrossRef]
  25. Khenzykhenova, F.; Dorofeyuk, N.; Shchetnikov, A.; Danukalova, G.; Bazarova, V. Palaeoenvironmental and climatic changes during the Late Glacial and Holocene in the Mongolia and Baikal region: A review. Quat. Int. 2021, 605-606, 300–328. [Google Scholar] [CrossRef]
  26. Batima, P.; Natsagdorj, L.; Gombluudev, P.; Erdenetsetseg, B. Observed Climate Change in Mongolia: AIACC Working Paper No. 12; Assessments of Impacts and Adaptations of Climate Change; United Nations: New York, NY, USA, 2005; pp. 1–26. [Google Scholar]
  27. Yue, P.; Zuo, X.; Li, K.; Li, X.; Wang, S.; Misselbrook, T. Precipitation changes regulate the annual methane uptake in a temperate desert steppe. Sci. Total Environ. 2022, 804, 150172. [Google Scholar] [CrossRef] [PubMed]
  28. Borodavko, P.S.; Volkova, E.S.; Mel`nik, M.A.; Litvinov, A.S.; Demberel, O. Climate change impact on high-altitude geomorphological systems. IOP Conf. Ser. Earth Environ. Sci. 2018, 211, 012004. [Google Scholar] [CrossRef]
  29. Ndiaye, P.M.; Bodian, A.; Diop, L.; Deme, A.; Dezetter, A.; Djaman, K.; Ogilvie, A. Trend and Sensitivity Analysis of Reference Evapotranspiration in the Senegal River Basin Using NASA Meteorological Data. Water 2020, 12, 1957. [Google Scholar] [CrossRef]
  30. Marzouk, O.A. Assessment of global warming in Al Buraimi, sultanate of Oman based on statistical analysis of NASA POWER data over 39 years, and testing the reliability of NASA POWER against meteorological measurements. Heliyon 2021, 7, e06625. [Google Scholar] [CrossRef]
  31. Alemu, Z.A.; Dioha, M.O. Climate change and trend analysis of temperature: The case of Addis Ababa, Ethiopia. Environ. Syst. Res. 2020, 9, 27. [Google Scholar] [CrossRef]
  32. Tongal, H. Spatiotemporal analysis of precipitation and extreme indices in the Antalya Basin, Turkey. Theor. Appl. Climatol. 2019, 138, 1735–1754. [Google Scholar] [CrossRef]
  33. Dorjsuren, B.; Batsaikhan, N.; Yan, D.; Yadamjav, O.; Chonokhuu, S.; Enkhbold, A.; Qin, T.; Weng, B.; Bi, W.; Demberel, O.; et al. Study on Relationship of Land Cover Changes and Ecohydrological Processes of the Tuul River Basin. Sustainability 2021, 13, 1153. [Google Scholar] [CrossRef]
  34. Sumiya, E.; Dorjsuren, B.; Yan, D.; Dorligjav, S.; Wang, H.; Enkhbold, A.; Weng, B.; Qin, T.; Wang, K.; Gerelmaa, T.; et al. Changes in Water Surface Area of the Lake in the Steppe Region of Mongolia: A Case Study of Ugii Nuur Lake, Central Mongolia. Water 2020, 12, 1470. [Google Scholar] [CrossRef]
  35. Zhang, M.; Chen, Y.; Shen, Y.; Li, B. Tracking climate change in Central Asia through temperature and precipitation extremes. J. Geogr. Sci. 2019, 29, 3–28. [Google Scholar] [CrossRef]
  36. Girona-Mata, M.; Miles, E.S.; Ragettli, S.; Pellicciotti, F. High-Resolution Snowline Delineation From Landsat Imagery to Infer Snow Cover Controls in a Himalayan Catchment. Water Resour. Res. 2019, 55, 6754–6772. [Google Scholar] [CrossRef]
  37. Volkov, I.V.; Zemtsov, V.A.; Erofeev, A.A.; Babenko, A.S.; Volkova, A.I.; Callaghan, T.V. The dynamic land-cover of the Altai Mountains: Perspectives based on past and current environmental and biodiversity changes. Ambio 2021, 50, 1991–2008. [Google Scholar] [CrossRef] [PubMed]
  38. Ganyushkin, D.A.; Chistyakov, K.V.; Volkov, I.V.; Bantcev, D.V.; Kunaeva, E.P.; Terekhov, A.V. Present Glaciers and Their Dynamics in the Arid Parts of the Altai Mountains. Geosciences 2017, 7, 117. [Google Scholar] [CrossRef]
Figure 1. Geographic location of the Mt. Munkhkhairkhan (the numbers of the climate data points same to Table 2).
Water 15 01921 g001
Figure 2. Scheme of the research methodology.
Water 15 01921 g002
Figure 3. Changes in glacial area over the last 30 years.
Water 15 01921 g003
Figure 4. Overall decease in glacial area over the last 30 years (4 stage of changes glacier area).
Water 15 01921 g004
Figure 6. Trends in the annual average temperature near Mt. Munkhkhairkhan, where UF and UB are parameters of this change. UF is the change trend and UB is the reverse order of the trend.
Water 15 01921 g006
Figure 7. Trends of precipitation near Mt. Munkhkhairkhan.
Water 15 01921 g007
Figure 8. The long-term average temperature (A) and precipitation (B) of the weather stations closest to the mountain.
Water 15 01921 g008
Figure 9. Glacier area Changes over the last 30 years (1991-2020).
Water 15 01921 g009
Figure 10. Glacier degradation and thermokrast along the lake shore. Red and yellow rings and red dots denote field observation markers, 2019–2022 (Bayarmaa.M., 2019, 2020, 2022).
Water 15 01921 g010
Table 1. Satellite data.
DateScene ID SensorResolution
1991LT51410271991198XXX03Landsat 5 TM30 m
1992LT51410271992233BJC01Landsat 5 TM30 m
1995LT51400271995218BJC00Landsat 5 TM30 m
1997LT51410271997246BJC00Landsat 5 TM30 m
2000LT51410272000191BJC00Landsat 5 TM30 m
2002LE71400282002213SGS00Landsat 7 ETM+30 m
2004LT51410272004218BJC00Landsat 5 TM30 m
2007LT51410272007226BJC00Landsat 5 TM30 m
2008LT51410272008229BJC00Landsat 5 TM30 m
2010LT51410272010234IKR02Landsat 5 TM30 m
2013LC81410272013242LGN01Landsat 8 OLI30 m
2014LC81410272014245 LGN01Landsat 8 OLI30 m
2015LC81410272015216LGN01Landsat 8 OLI30 m
2017LC81410272017205LGN01Landsat 8 OLI30 m
2019LC81410272019227LGN00Landsat 8 OLI30 m
2020LC81410272020214LGN00Landsat 8 OLI30 m
Table 2. The results of the air temperature change (1990–2020) Mann–Kendall test (Z), Innovative Trend Analysis (Φ), and Sen’s Slope Estimator test (β).
S/No.Name of StationsZ (MK)Φβ
1Munkhkhairkhan1.29−0.180.01
2Doloonnuur1.03−0.220.01
3Bulgan 1.20−0.170.01
4Bayannuur 1.03−0.220.01
5Average 0.96−0.180.01
Table 3. The results for precipitation change Mann–Kendall test (Z), Innovative Trend analysis (Φ), and Sen’s Slope Estimator test (β).
S/No.Name of StationsZ (MK)Φβ
1Munkhkhairkhan2.011.280.96
2Doloonnuur3.211.791.40
3Bulgan 3.211.791.40
4Bayannuur3.432.091.56
5Average 2.811.721.38
Table 4. The long-term average temperature and precipitation of the weather stations closest to Mt. Munkhkhairkhan (1990–2020).
StationT Average (°C)T Max (°C)T Min (°C)Precipitation (mm)
Bulgan (Baitag)3.139−49.580.7
Munkhkhairkhan0.730.9−36.3110.6
Must0.731.9−38.887.6
Altai2.843.6−42.969
Uyench2.439.6−39.478.1
Duut−1.932.7−41.4113.9
Bulgan (Duchinjil)−1.132.5−40.5137.1
Deluun−1.931.1−42.7110.7
Disclaimer/Publisher’s Note: The statements, opinions and data contained in all publications are solely those of the individual author(s) and contributor(s) and not of MDPI and/or the editor(s). MDPI and/or the editor(s) disclaim responsibility for any injury to people or property resulting from any ideas, methods, instructions or products referred to in the content.

