

Geotechnical Assessment of Rock Slope Stability Using Kinematic and Limit Equilibrium Analysis for Safety Evaluation

 ,
,  , ,
, ,  ,
,  , and
, and
Abstract
:1. Introduction
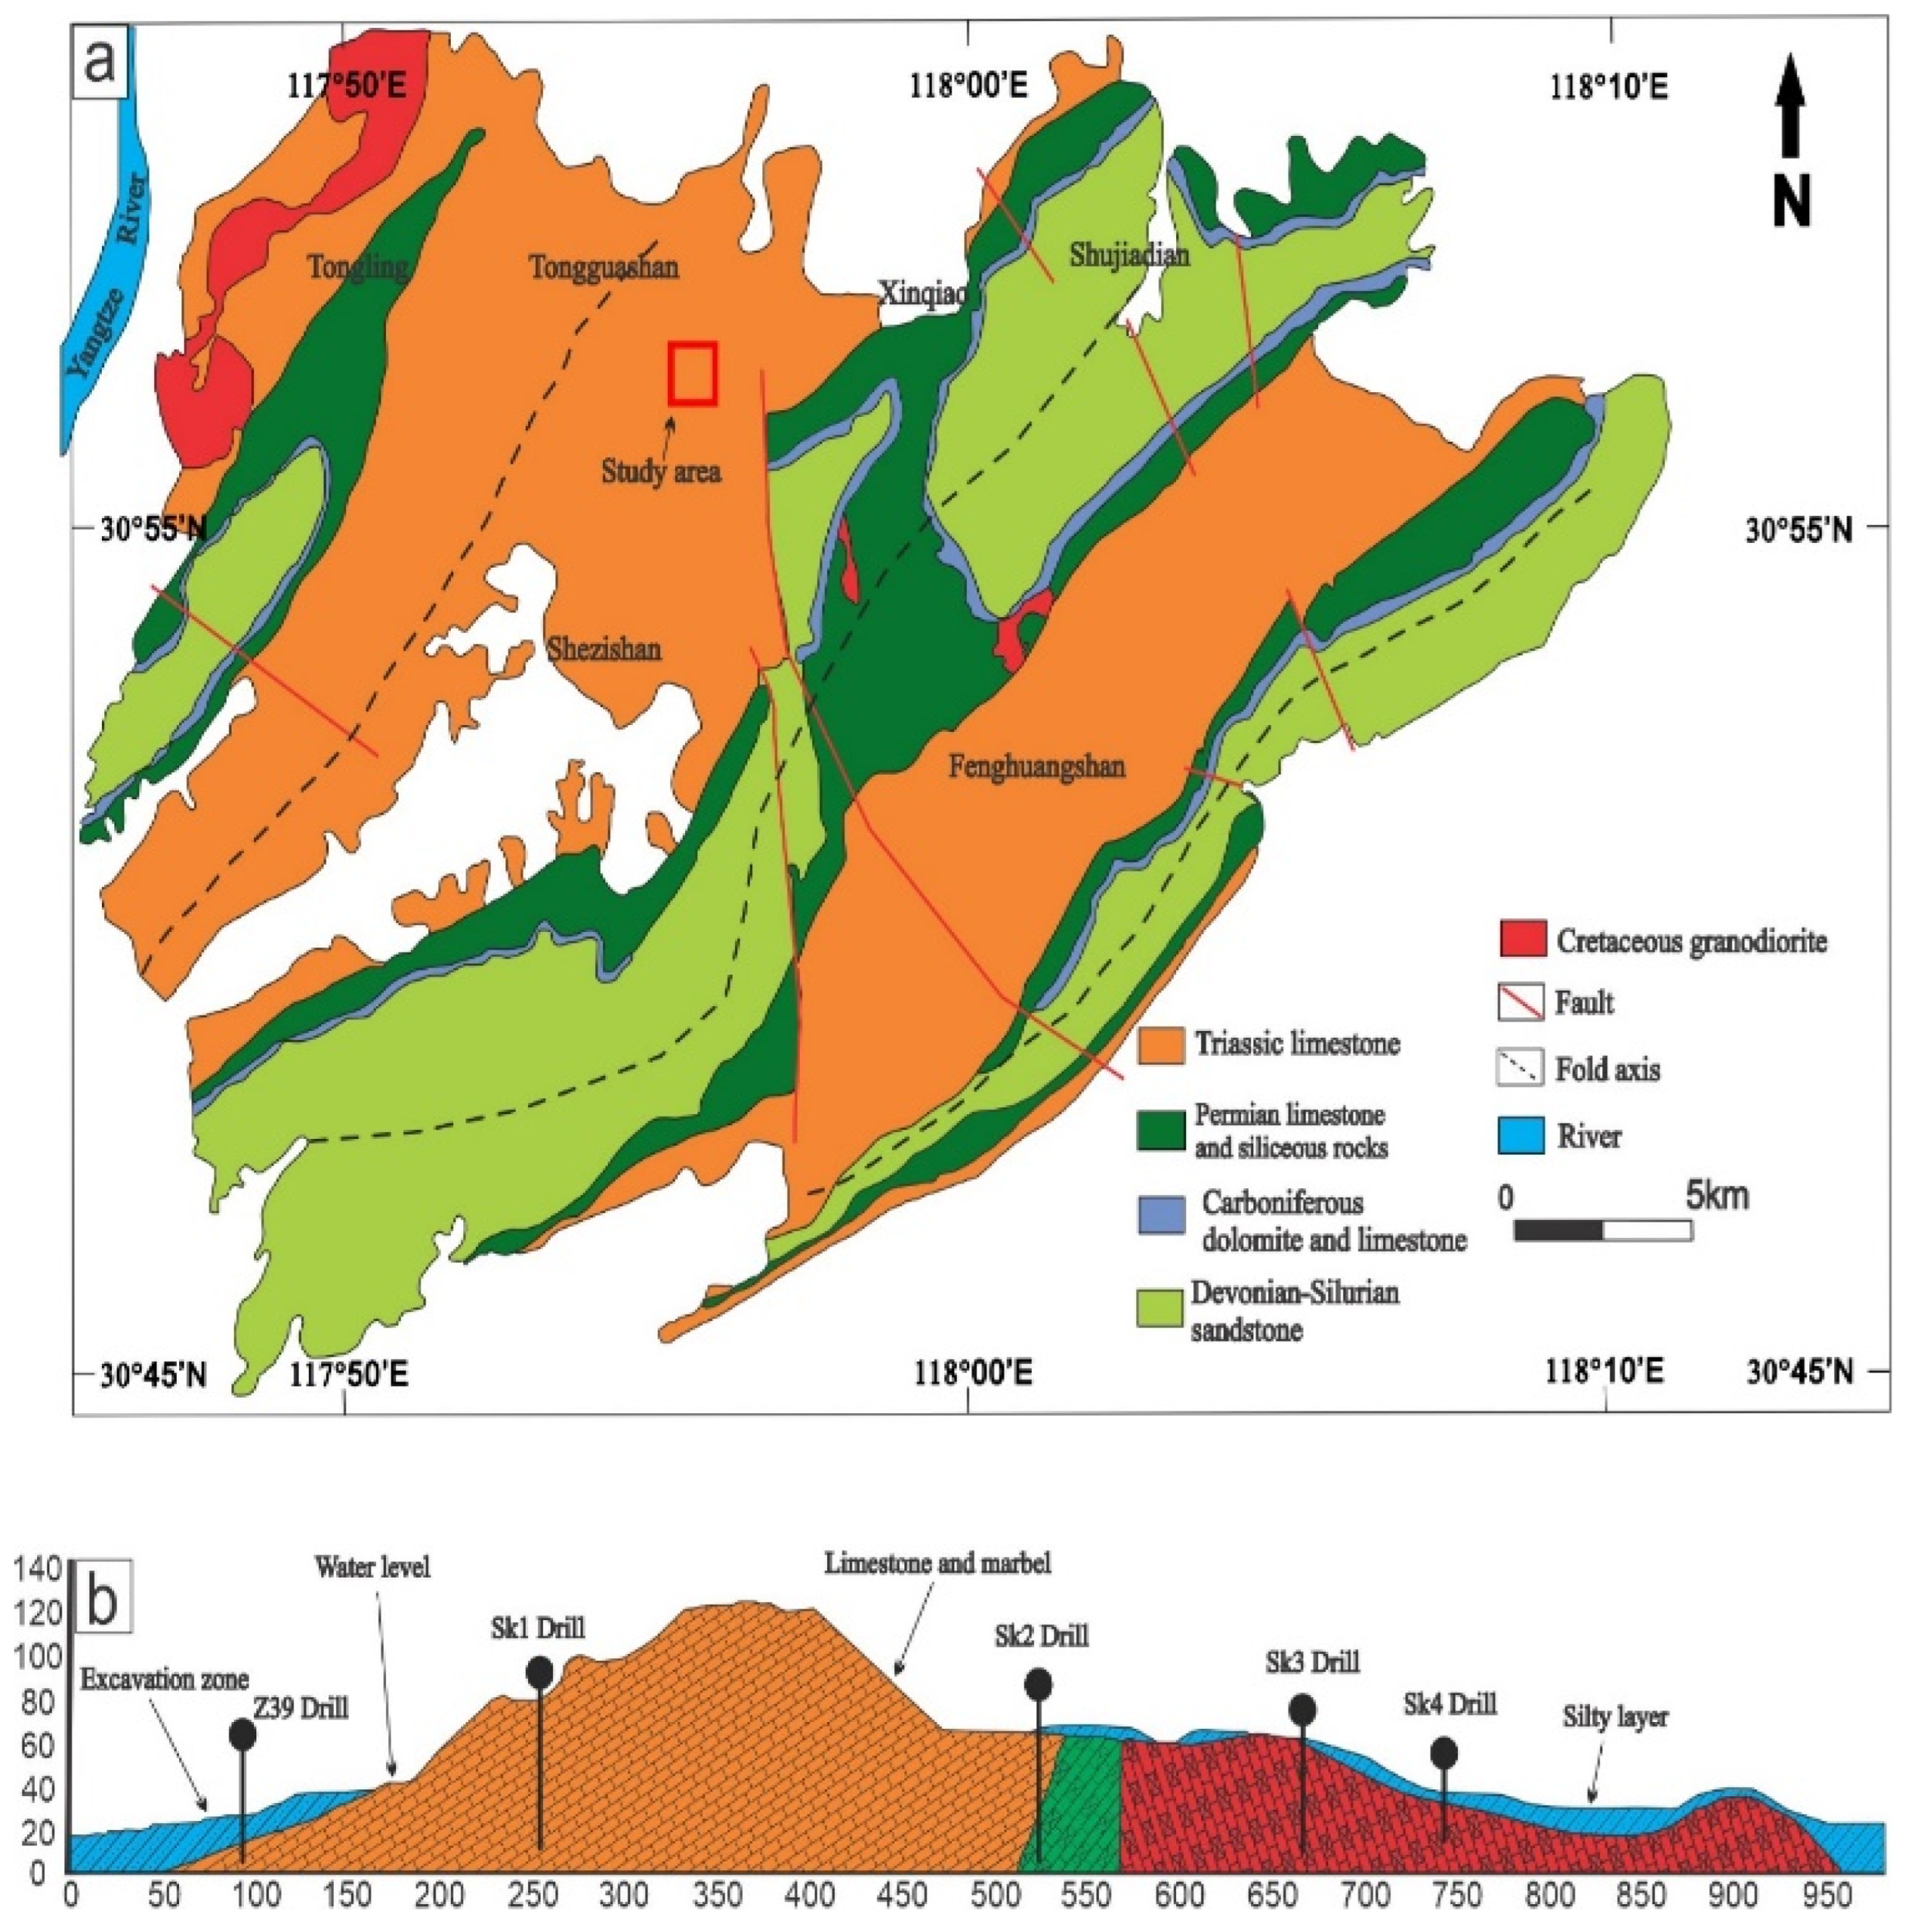
Location and Geology of the Study Area
2. Materials and Methods
2.1. Field Investigation
2.2. Laboratory Testing and Geotechnical Assessment
2.3. Strength Parameters
2.4. Failure Mechanisms and Slope Stability
3. Results
4. Discussion
4.1. Kinematic Analysis
4.1.1. Left Slope
- (a)
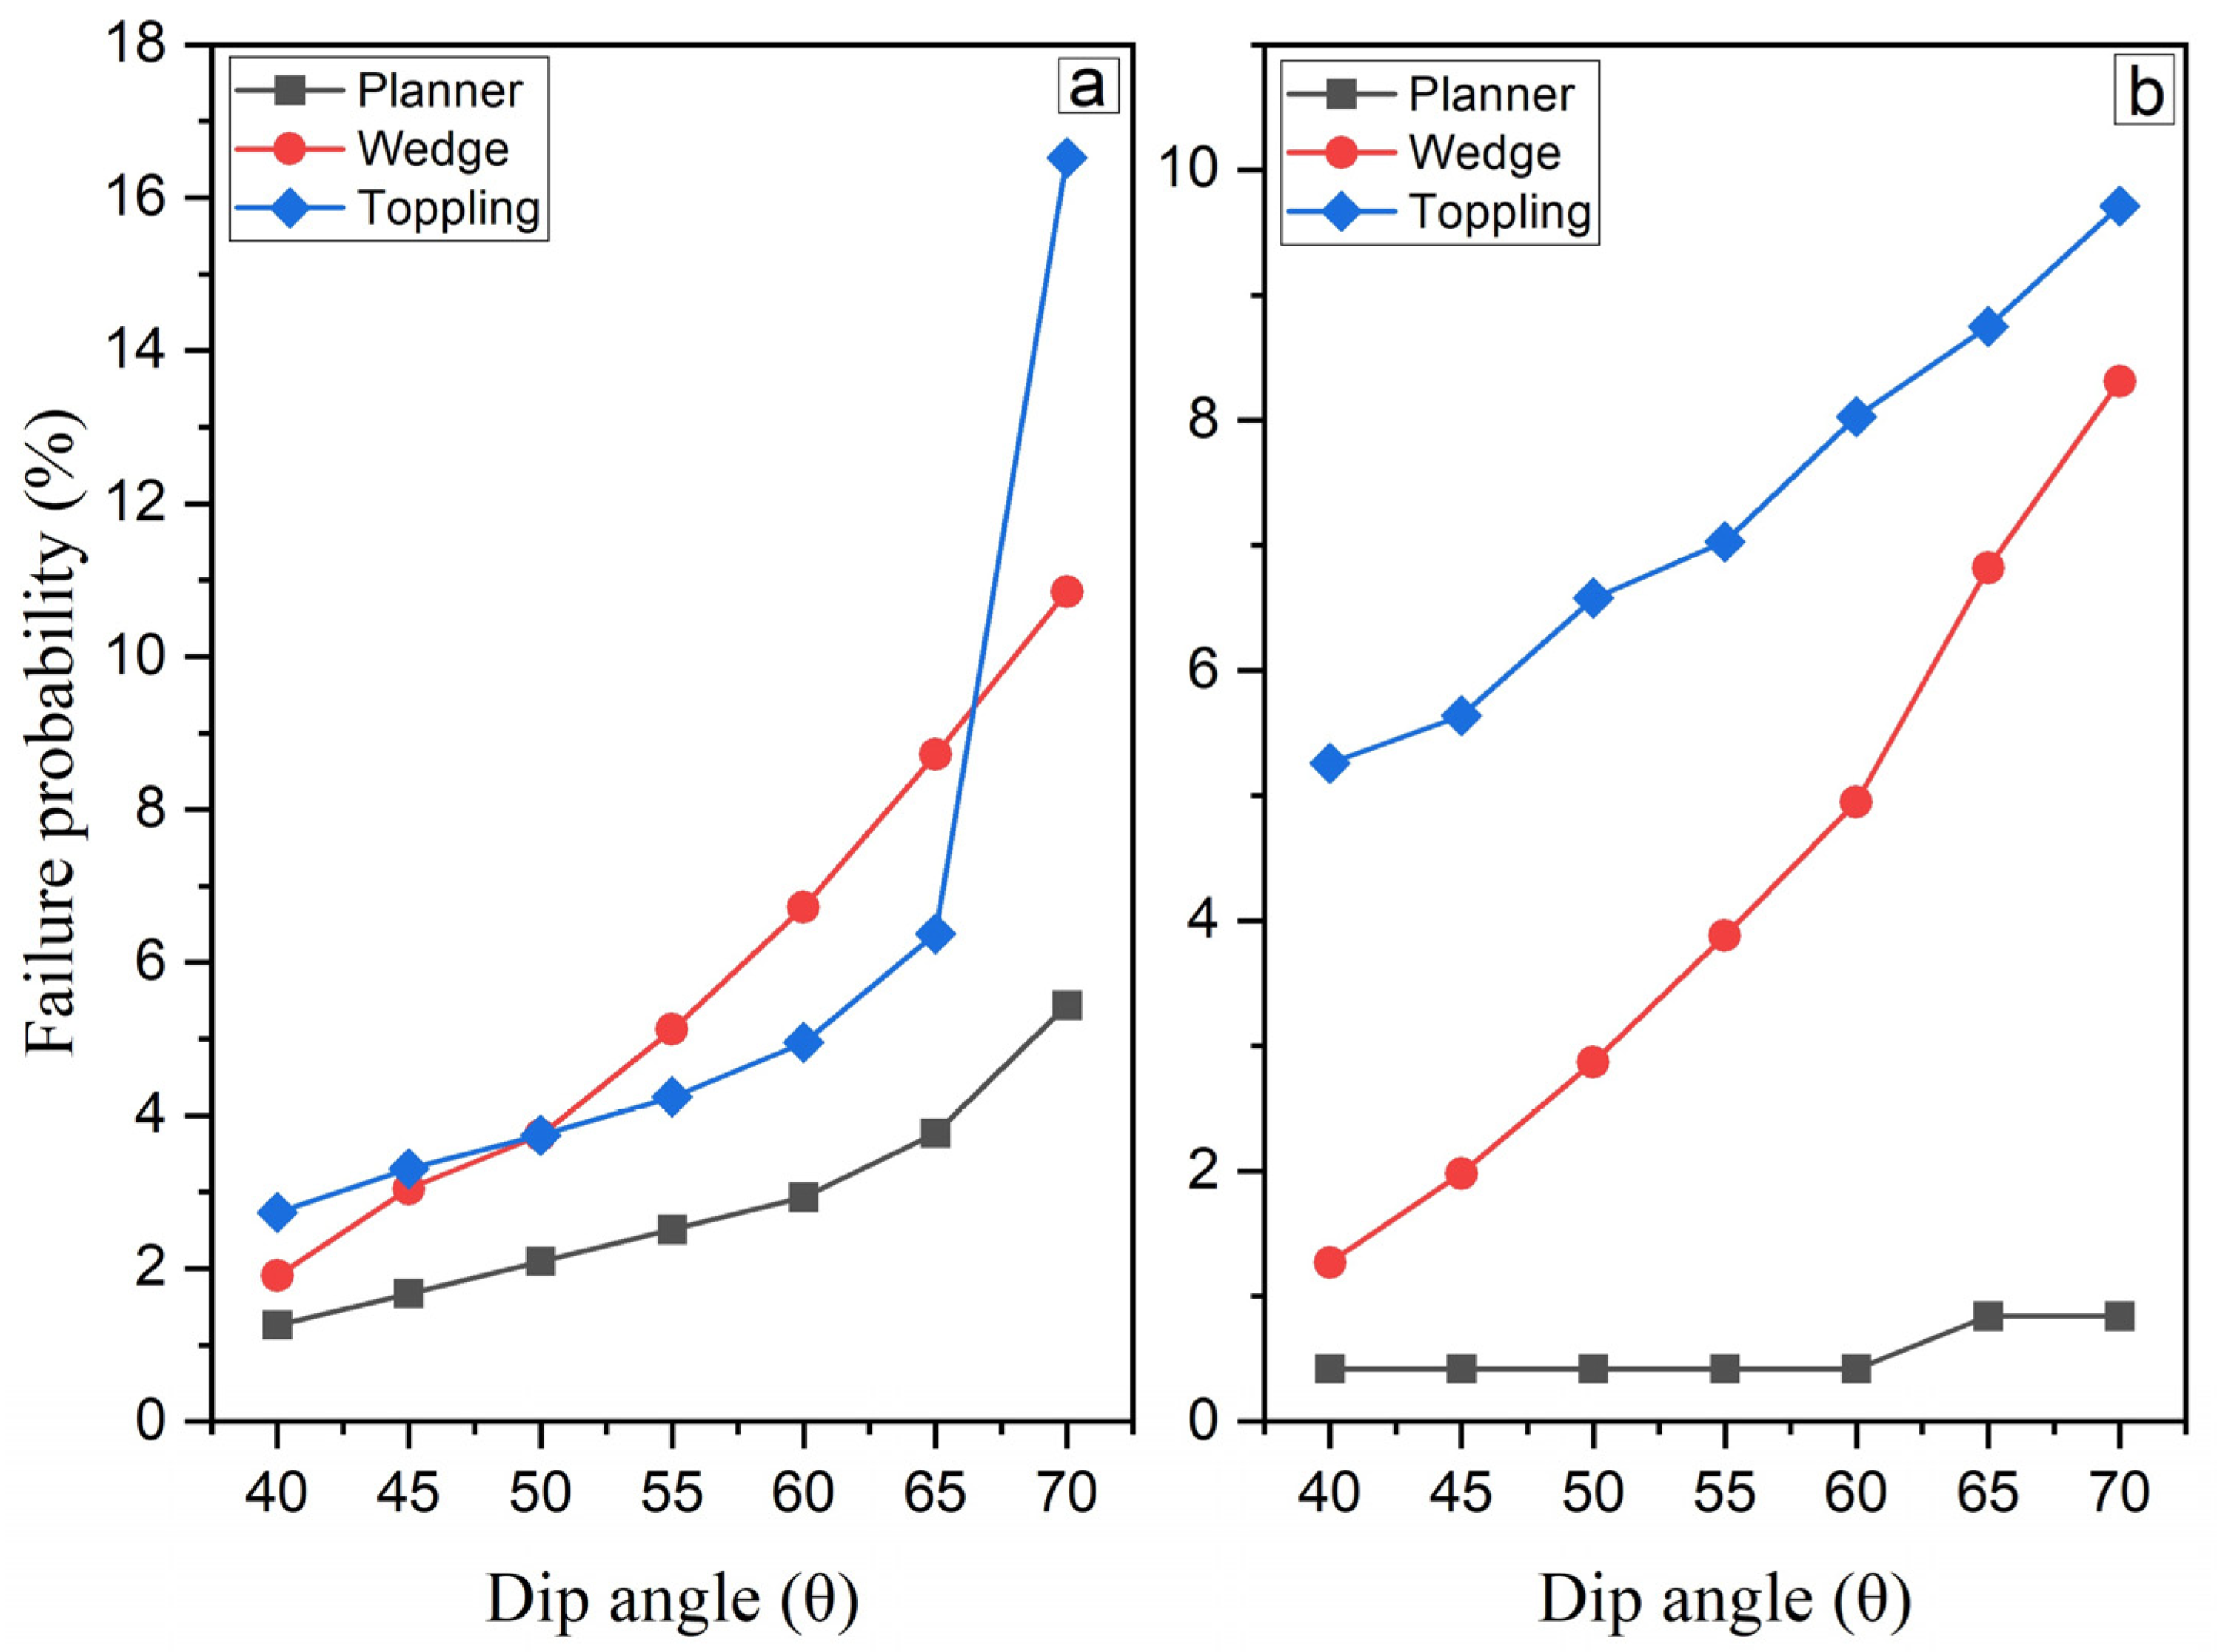
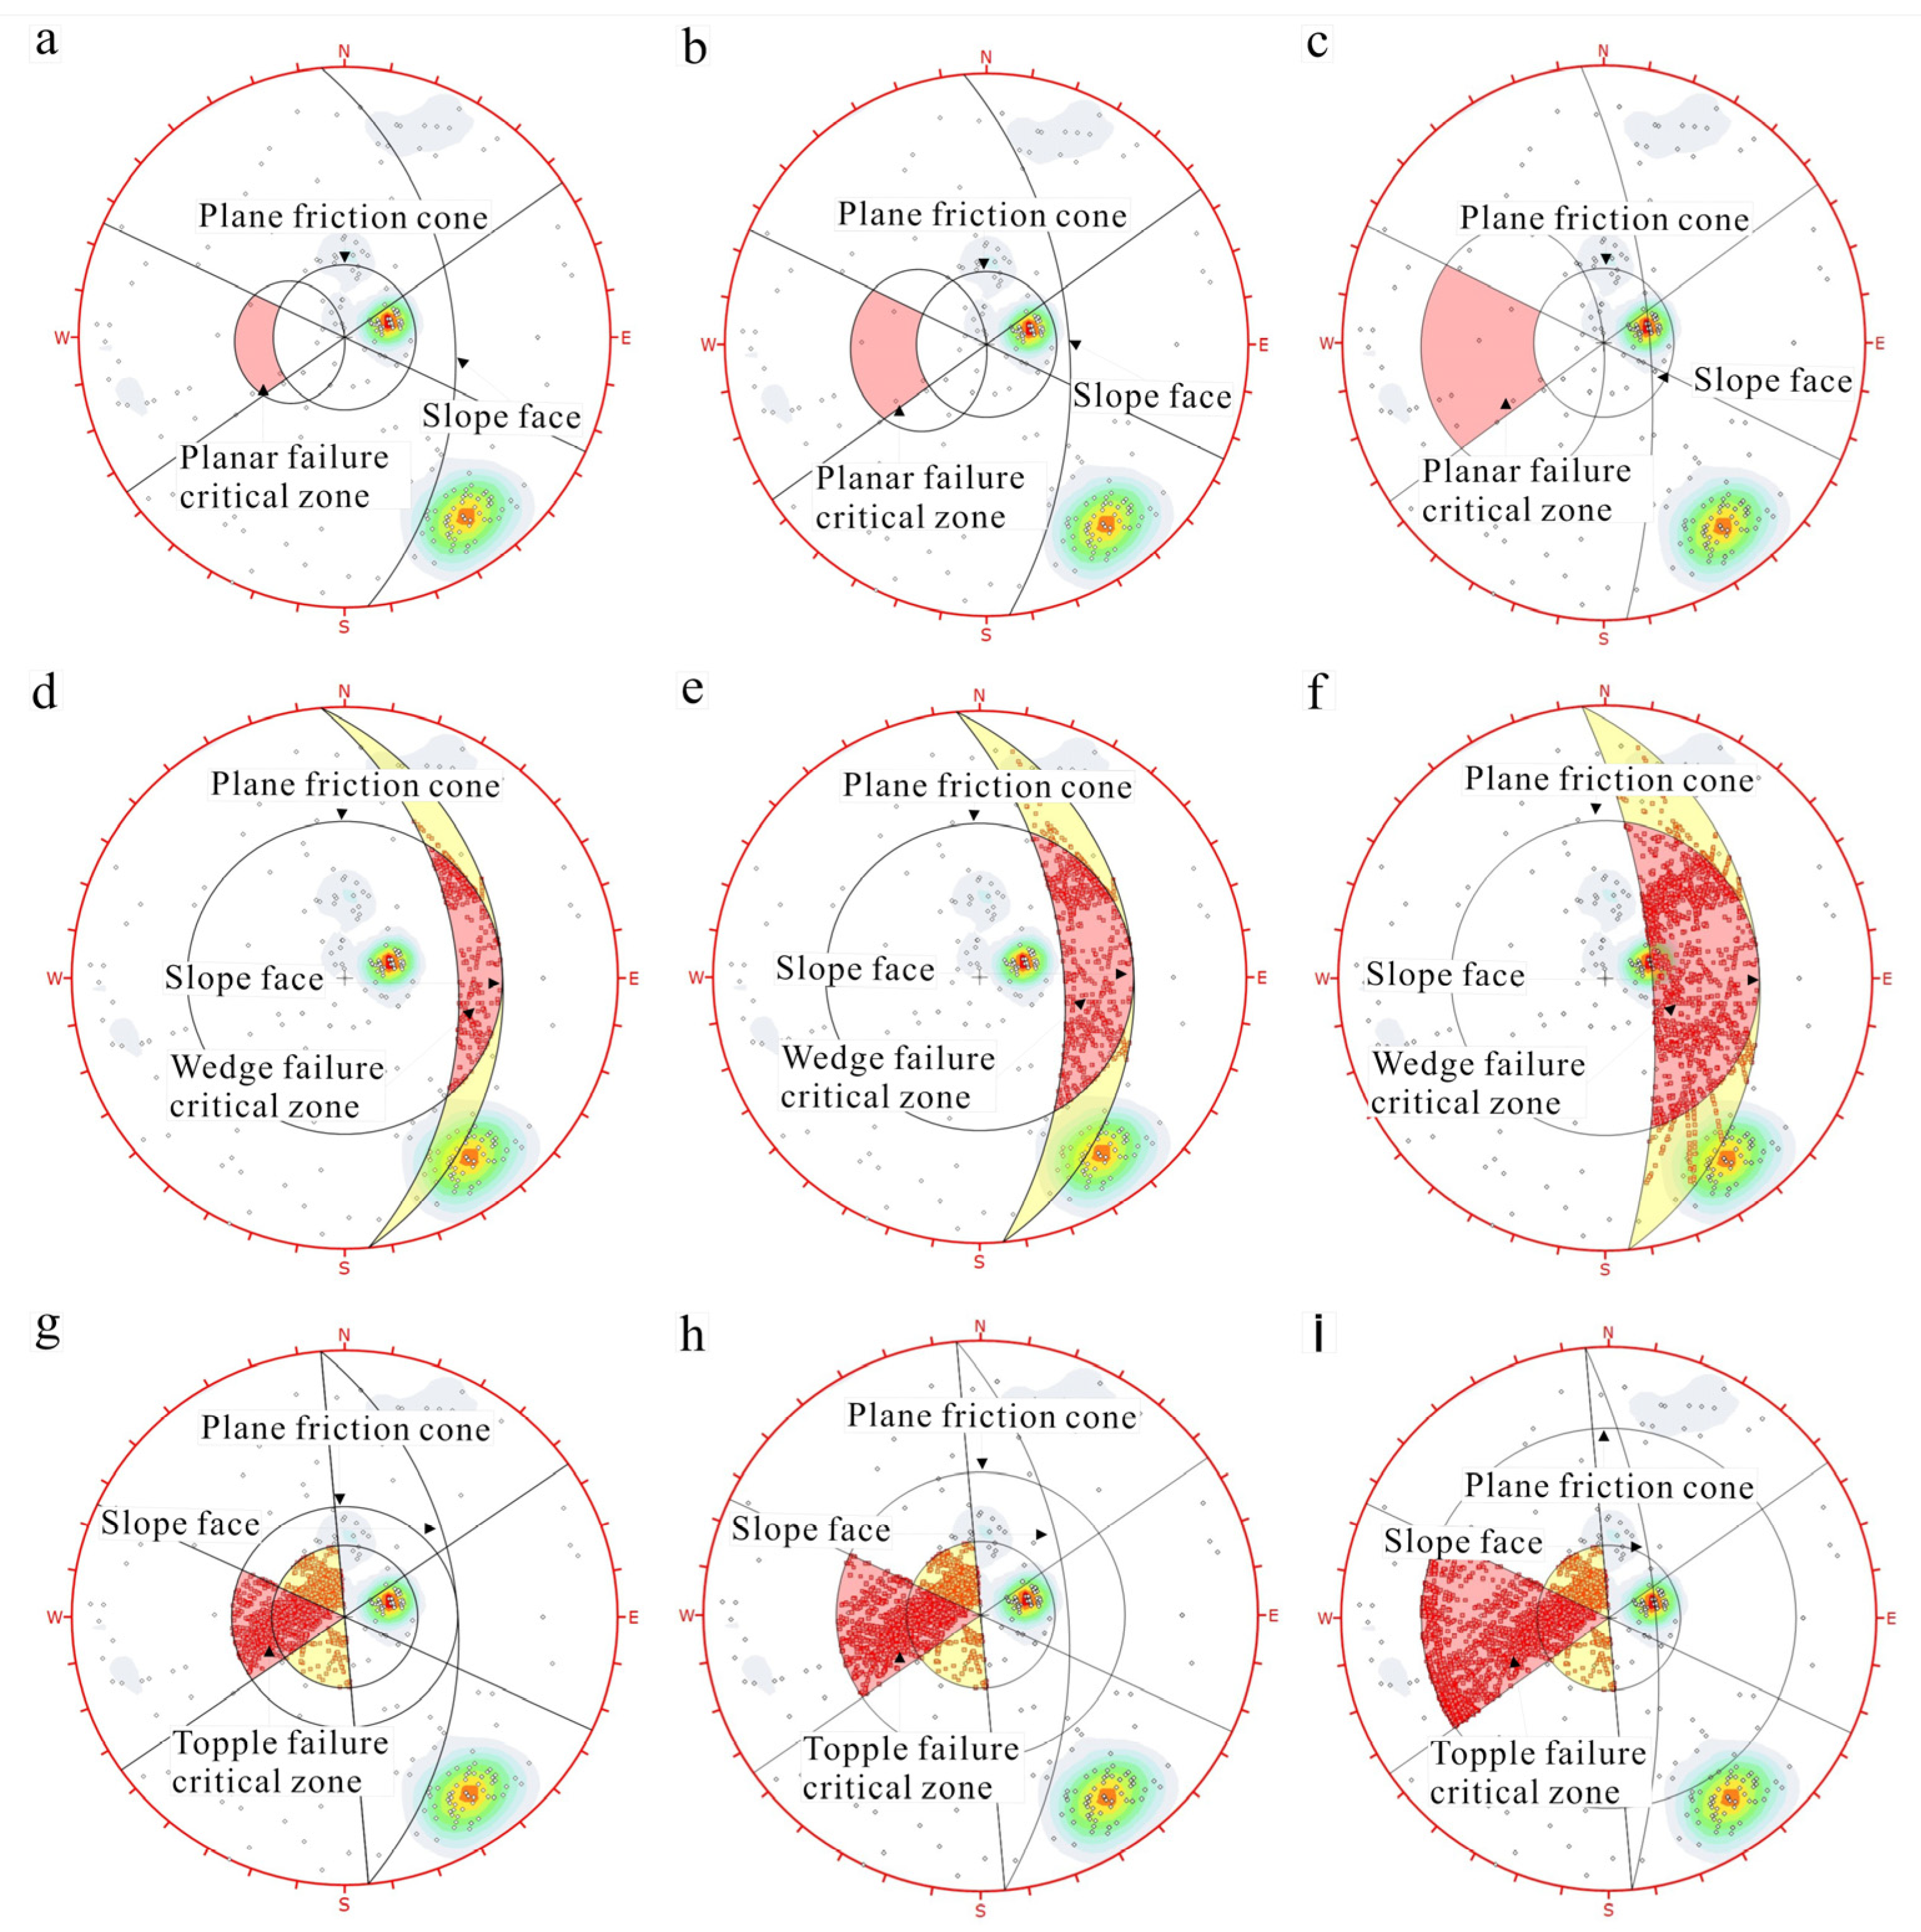
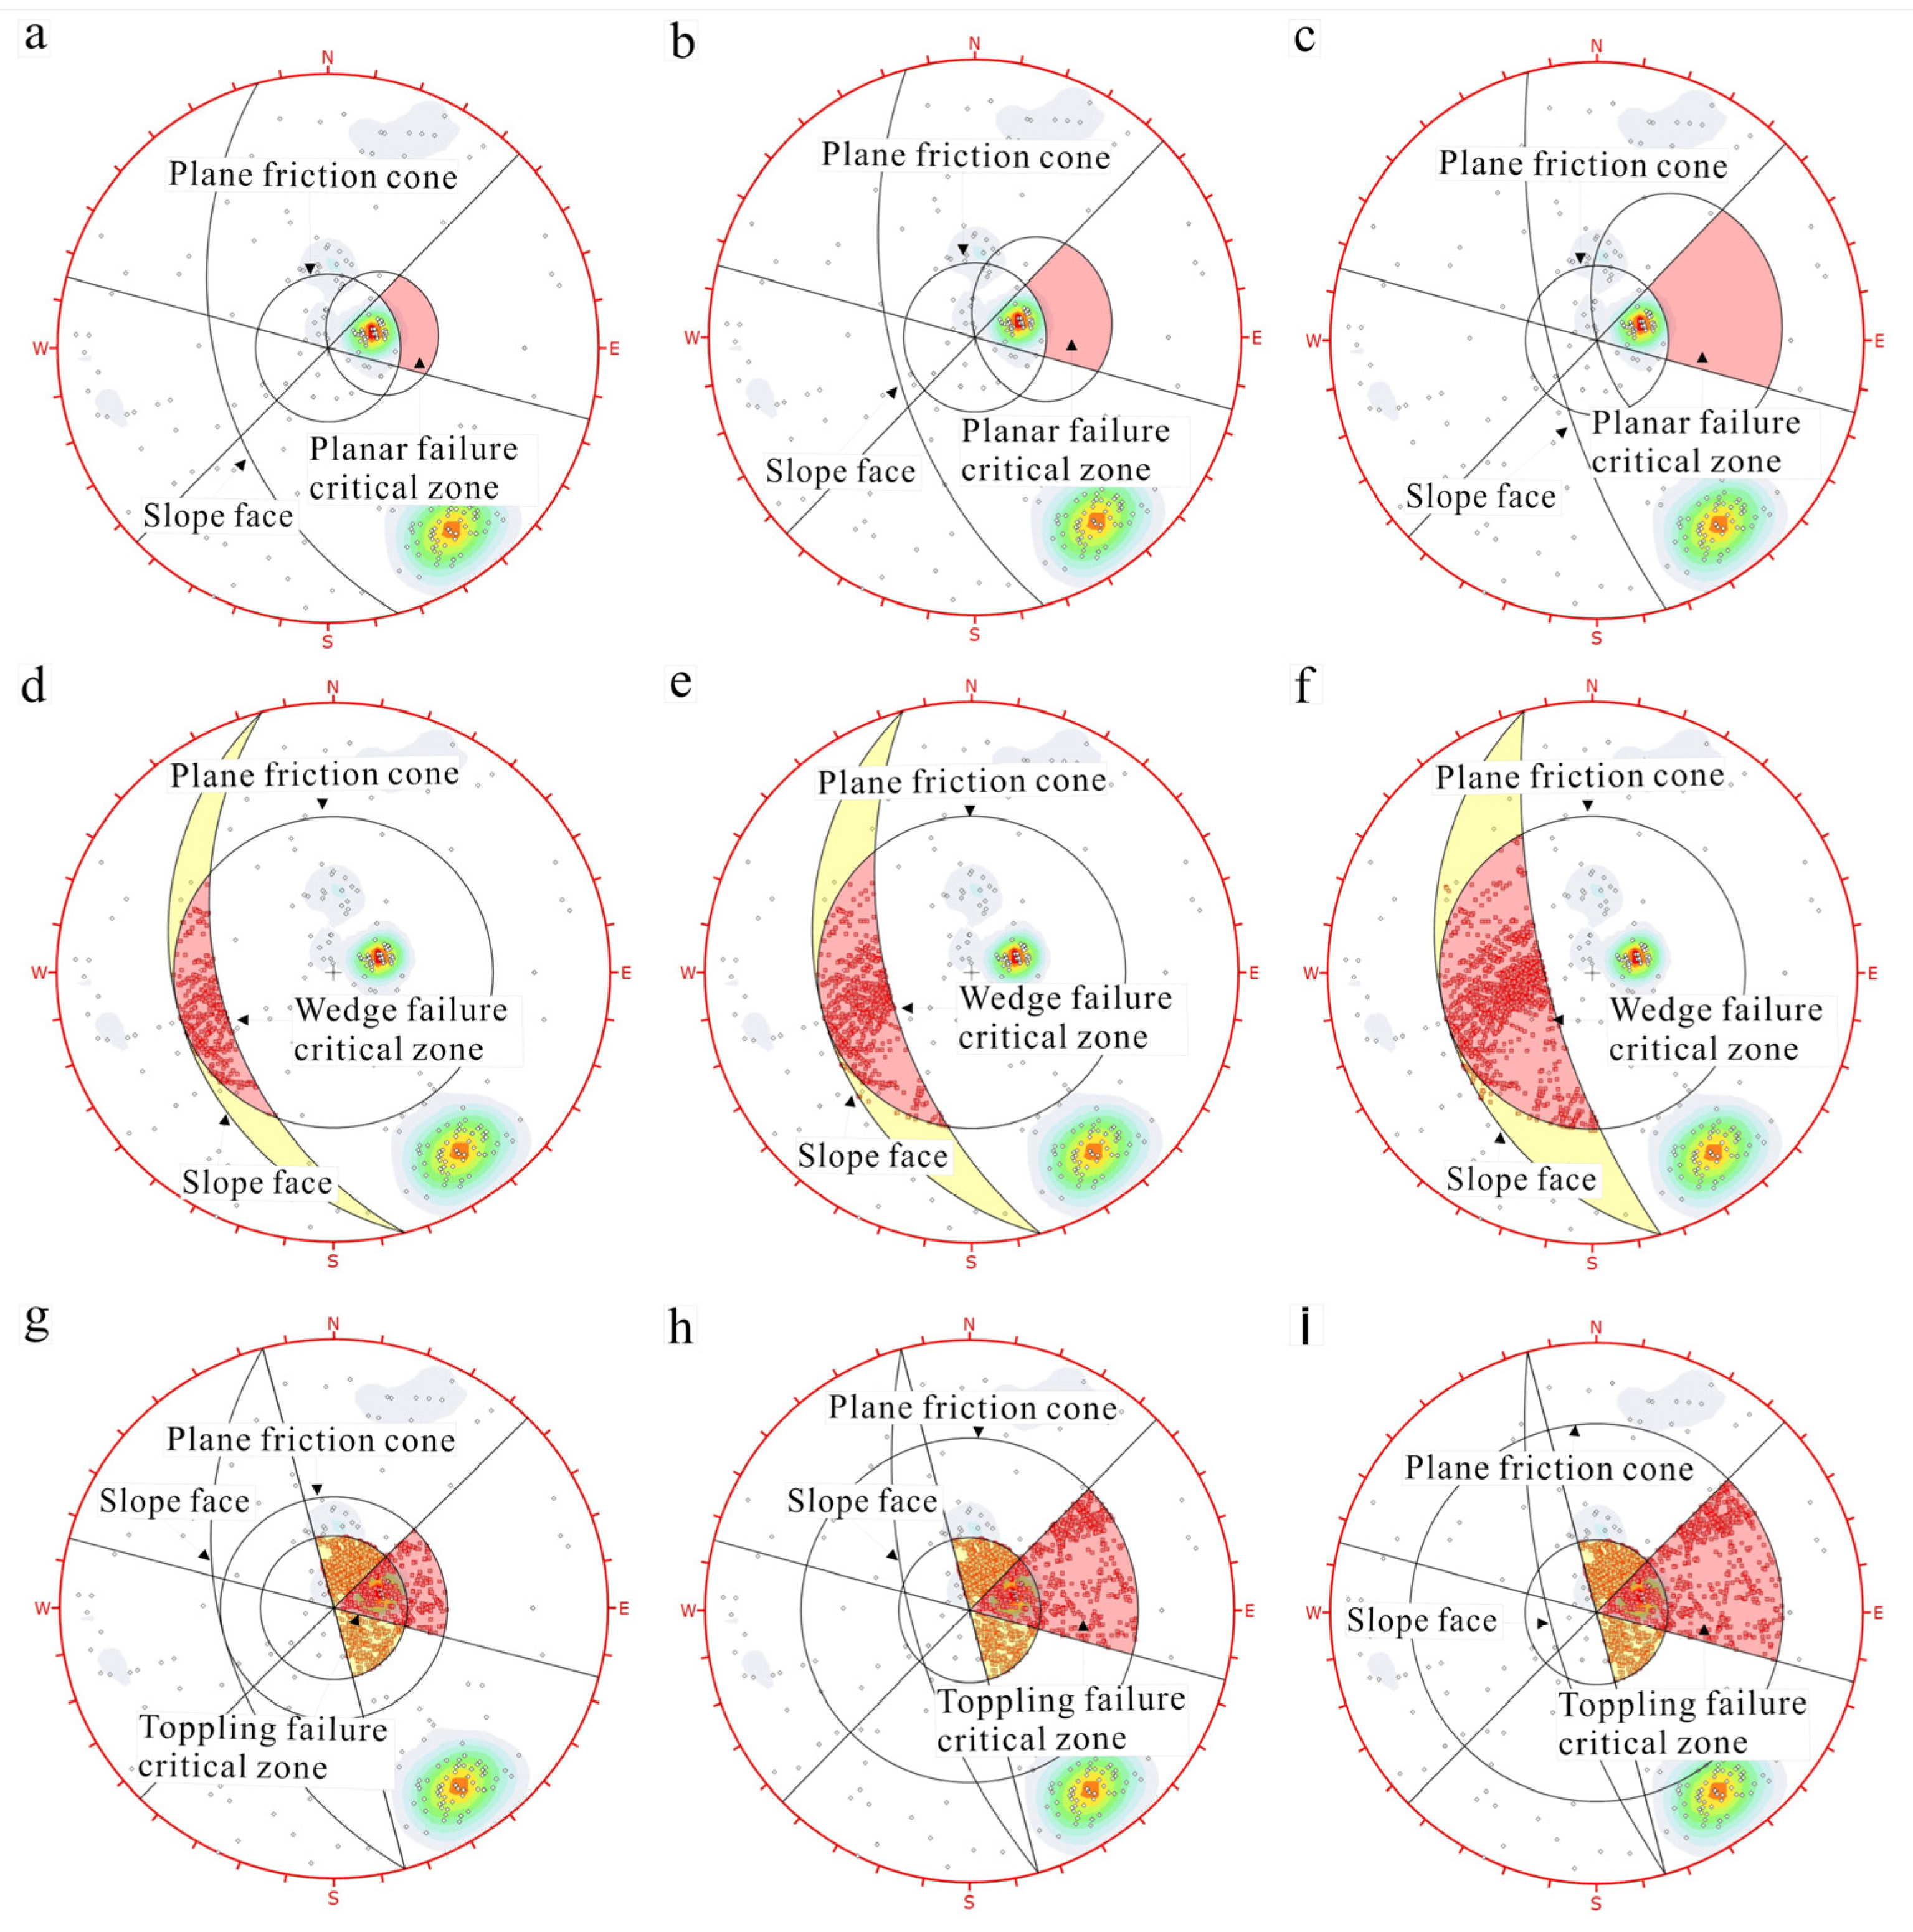
- Planar failure: It is clear from the kinematic analysis of the left bank that the toppling mode tested with a greater failure probability than the planar and wedge failure (Figure 5a). The results shows that when the slope dip angle is 40°, planar failure is slightly more than 1%, but with an increase in 5°, the failure chances reach 1.6%. The number of critical failures is 2 (Figure 5a). Also, when the slope dip angle is 55°, 60°, and 70°, failure probability increases to 2.5%, 2.9%, and 5%, respectively. The key critical zone for planar failure is located on the left slope, as seen in the highlighted red area. The danger of the developing planar slide is represented by intersections in the crucial zone (Figure 5b,c). The condition that must be met for a plane to fail is that the slope-face dip must be larger than the slide-plane dip, and both must be higher than the slide-surface friction angle, i.e., ψf > ψp > ϕ [12]. According to the pole points, none of the major joint sets on the slopes is critical for planar slope failure. As a result of the discontinuities of pole points not being inside the planar daylight envelope, planar failure does not occur on the slopes of the examined area (Figure 5a–c). Because the dip angle of the majority of joints is lower and extremely small, the pole of the junction point of the joints falls within the friction cone or safe region. The number of critical failures likewise rises as the slope dip angle increases (Table 3). Thus, the kinematic analysis indicates that planar failure chances are very low, approaching zero.
- (b)
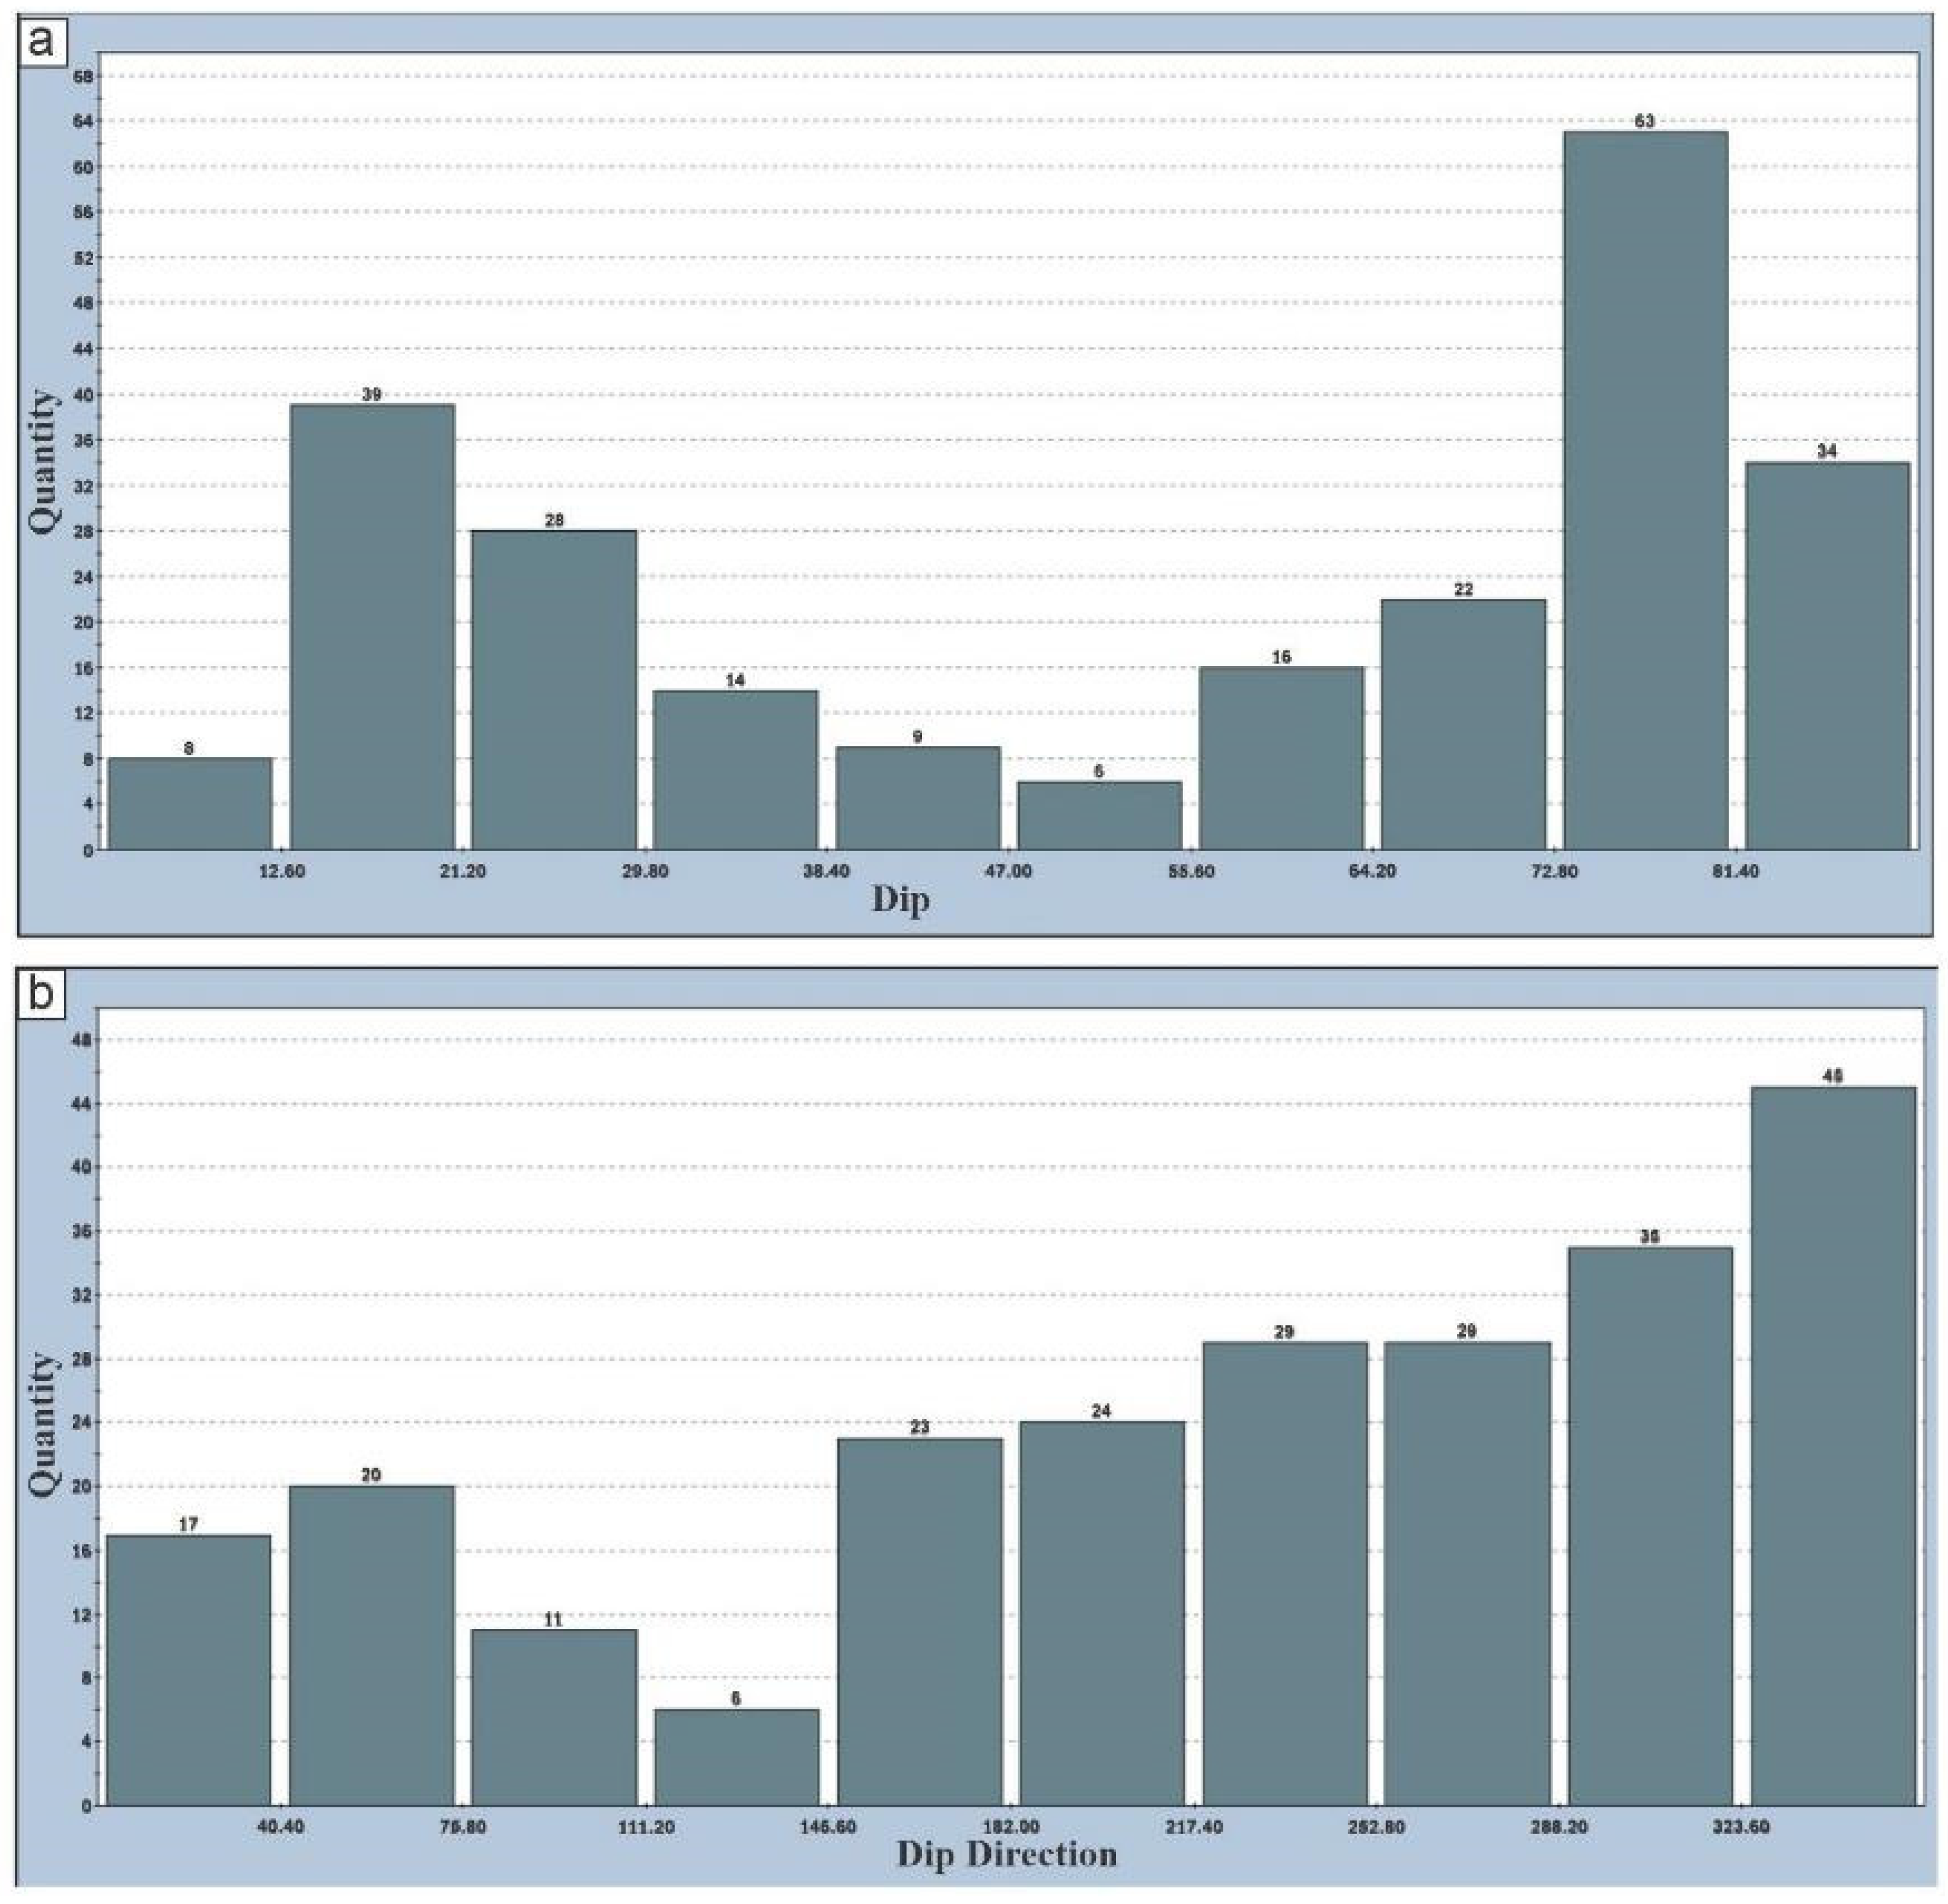
- Wedge failure: The failure probability of a wedge is 5% at a slope angle of 45° as shown in Figure 5d, and increases to 10% at a slope angle of 55° (Figure 5e). The failure probability is highest (17%) when the slope’s peak orientation has a dip angle of 70° (Figure 5f). The majority of the joints have a dip angle of 20° or more, as shown by the data; moreover, 34 joints have a dip angle of 80°, whereas 63 joints dipped with an angle greater than 70° (Figure 2a). This indicates that wedge failure is more likely to occur along the left bank. The number of critical failures also increases as the slope dip angle increases even though more joints are in the unsafe zone, which raises the probability of wedge failure (Table 3). According to [50], the prior landslide in construction is mostly caused by steep slope angles. Additionally, [51] reported that most of the intersection points of the joints fall in the safe zone because of the low dip angle, which decreases the probability of wedge failure. Azimuth-based discontinuities with NE and SE orientations produce intersection points in the critical zone that lead to wedge failure. The number of crucial locations likewise grows as the dip slope angle rises. Therefore, the probability of wedge failure increases and rises up to 11% when the slope dip angle is 70° (Figure 5f).
- (c)
- Toppling failure: The toppling failure is the rotation of a block or stone column located on a sloping surface, around a point [49]. From Figure 4a, it can be seen that toppling failure shows a higher failure probability. When the slope dip angle is 40°, failure chances are slightly less than 3%, while a small increase in slope dip angle increases the failure chances up to 4.5% when the dip angle is 55° (Figure 5g,h). There is a lower chance of a toppling failure than a wedge failure (Figure 4a). Failure probabilities spike dramatically at a slope dip angle of 70°, where they reach 17%, indicating a dangerously high risk for toppling failure (Figure 5i). By observing the pole orientation of joints, one can determine the most vulnerable areas that could topple. Ning et al. [52] found that the change in slope angle and stratum dip angle could impact the stability of the slope. From Figure 5a, it can be seen that 109 discontinuities are oriented in the NW and SW where the joints and slope dip in opposite directions. This suggests that toppling failure shows a higher probability. From Figure 5g, it can be seen that with a slope angle of 45°, critical failure is comparatively lower, but when the slope angle increases, the critical intersection points increase. With slope angles of 60° and 70°, the toppling failure chances are high and more critical. All results of the critical interactions are listed in Table 3.
4.1.2. Right Slope
- (a)
- Planar failure: Results from the right bank show that when the slope angle is 40°–60°, planar failure chances are 0%. When the slope dip angle is 65° and 70°, the failure chances increase slightly to 1%, which is very low (Figure 4b). The failure probability is very low when the slope dip is lower than the joint dip. On the other hand, there will be no chance for planar failure if the pole points of the joints are not in the critical zone [51,53]. The number of critical failures is 0 when the slope dip angle is kept lower or higher. All results are shown in Table 3. The failure plane created by the friction angle circle and the daylight envelope demonstrates that any junction point is susceptible to failure. According to the results of quantitative data on dip direction, several joints are orientated in the same direction as the slope. As a result, no joint is in danger of failing from the right bank (Figure 6a–c). The azimuth of most discontinuities is oriented in NW and NE where the criteria for planar failure are not met. Additionally, when the slope angle is 45°, the failure chance is zero, but with an increase in slope dip angle up to 70°, the critical intersection points and failure chances are zero and 1%, respectively. This indicates that an increase in slope dip angle has no effect on planar failure in this condition (Figure 6a,c).
- (b)
- Wedge failure: The right bank wedge failure study yields nearly identical results as the left bank. A low dip angle has lower odds, but as the slope dip increases, the likelihood of failure increases (Figure 4b). From the result, it can be seen that the slope dip angle of 45° has a failure probability of 2%, which is very low (Figure 6d). Additionally, the number of intersection points in the critical intersection zone is comparatively lower (Table 3). Additionally, the failure probability exhibits a regular increase with increasing slope dip angle. From the quantitative analysis of discontinuities, it can be seen that 67 discontinuities are oriented in a SW direction. In contrast, 94 are oriented NW (Figure 2b). The kinematic measurements show that wedge-type failure is controlled by azimuth and slope dip and dip direction. In the critical zone, azimuth-based discontinuities with NW and SW orientations result in intersection spots that cause wedge failure. The failure probability becomes very high when the slope angle is 65° and 70°; then, failure chances rise to 7% and 8%, respectively (Figure 6e,f). This indicates that as crucial intersection sites rise, they depend on the slope dip angle, which raises the chance of failure.
- (c)
- Toppling failure: From the results, it can be seen that toppling failure is more crucial in the right bank at any dip angle of the slope. When rock masses have a dominating discontinuity set (often bedding or foliation) with a strike almost parallel to the sloping surface and inward dip, rock slopes are more likely to topple [43]. Landslides mainly occur on dip slopes and sporadically happen elsewhere [14]. In addition, it is possible to decrease the slope angle because doing so lowers the weight of the material, enhancing the slopes’ stability [1]. From the kinematic analysis result of the right bank, it can be seen that toppling failure probabilities are slightly more than 5% when the slope dip angle is 40°, but they gradually increase as the slope dip angle increases, obtaining a maximum of 5.5% at a dip angle of 55°. At 65° and 70°, toppling exhibits the greatest values of 8.5% and 9.5%, respectively (Figure 4b). From Figure 3a,b, 54 discontinuities are oriented NE and SE, where the joints and slope dip in the opposing directions. In addition, most of the discontinuities dip with a high dip angle. This implies that toppling failure is a possibility. In comparison, when the slope angle is 45° and the failure chance is 5.5%, then crucial junction locations are relatively lower (Figure 6g). Critical interaction sites and failure probability both rise as the slope dip angle rises (Table 3). When the slope dip angle rises up to high value of 65° and 70°, then failure probability is slightly more than 8.5% and 9%. This result concurs with kinematic analysis, which indicates that NE–SW dipping discontinuities have a high potential for toppling failure. Moreover, the number of critical points also increases with the increase in slope dip angle (Figure 6h,i). Based on the azimuth and slope geometry of the right bank, it is evident that high failure probability of toppling exists with a high dip slope angle. In this condition, the slope is unstable and more likely to fail.
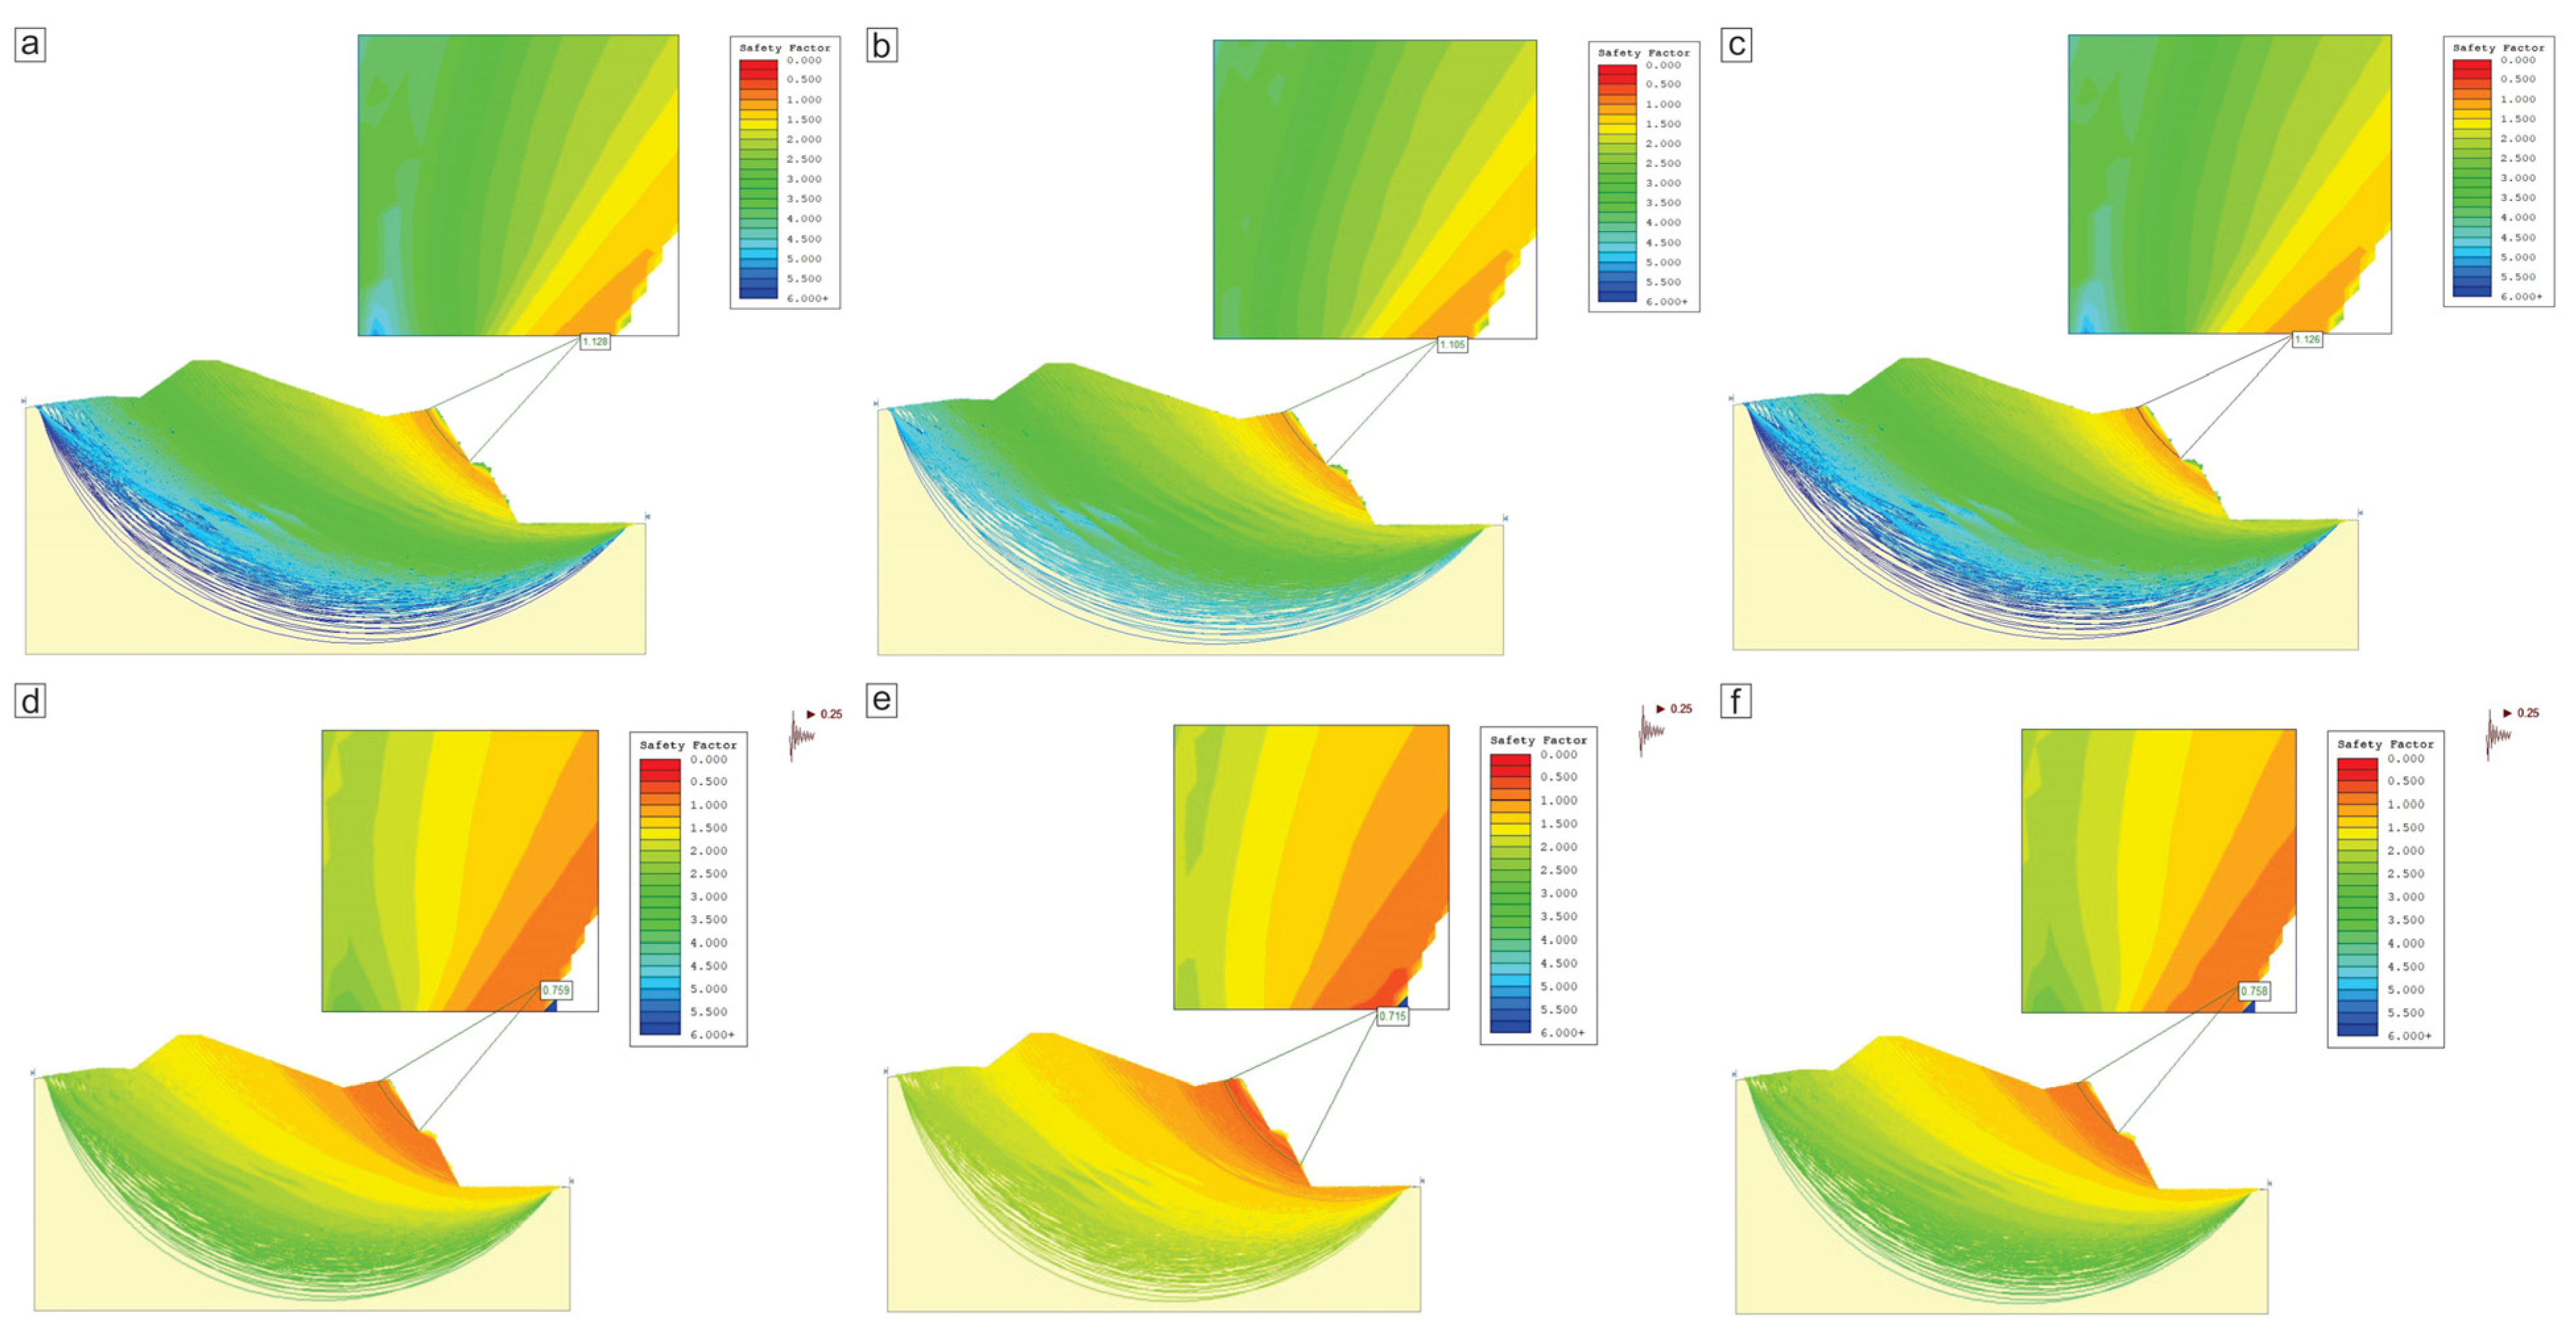
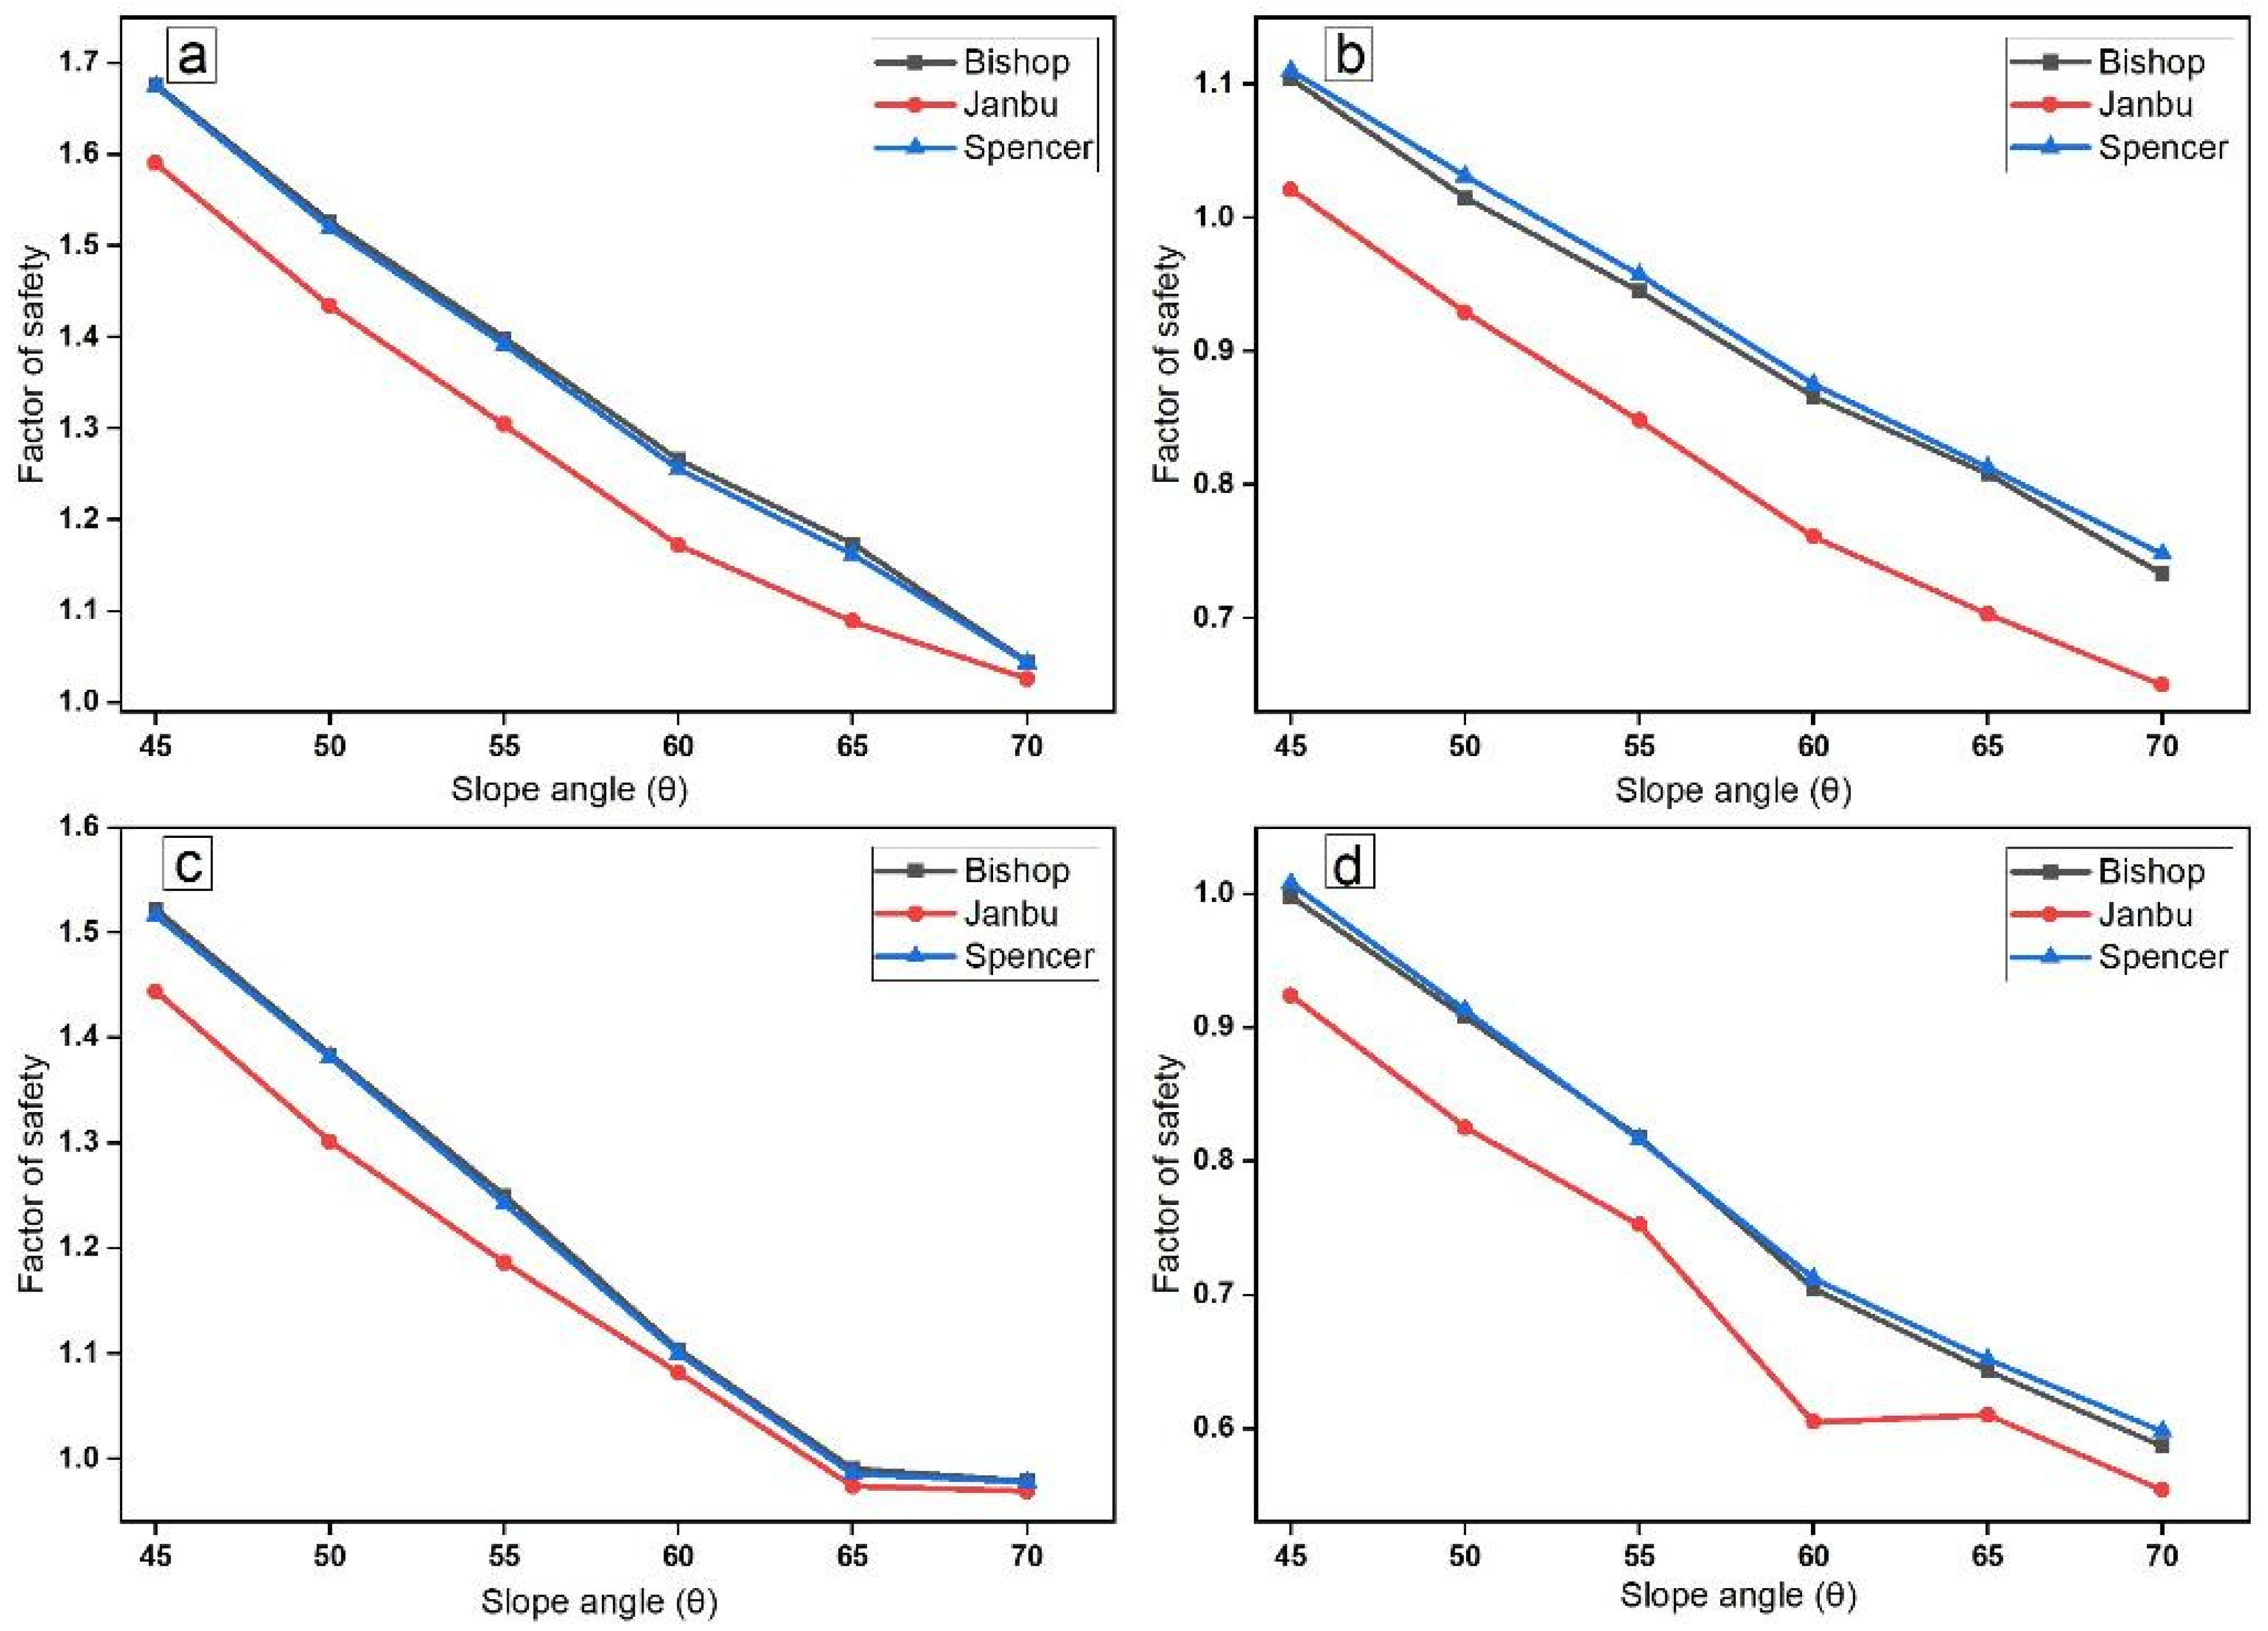
4.2. Limit Equilibrium Analysis
4.2.1. Left Slope
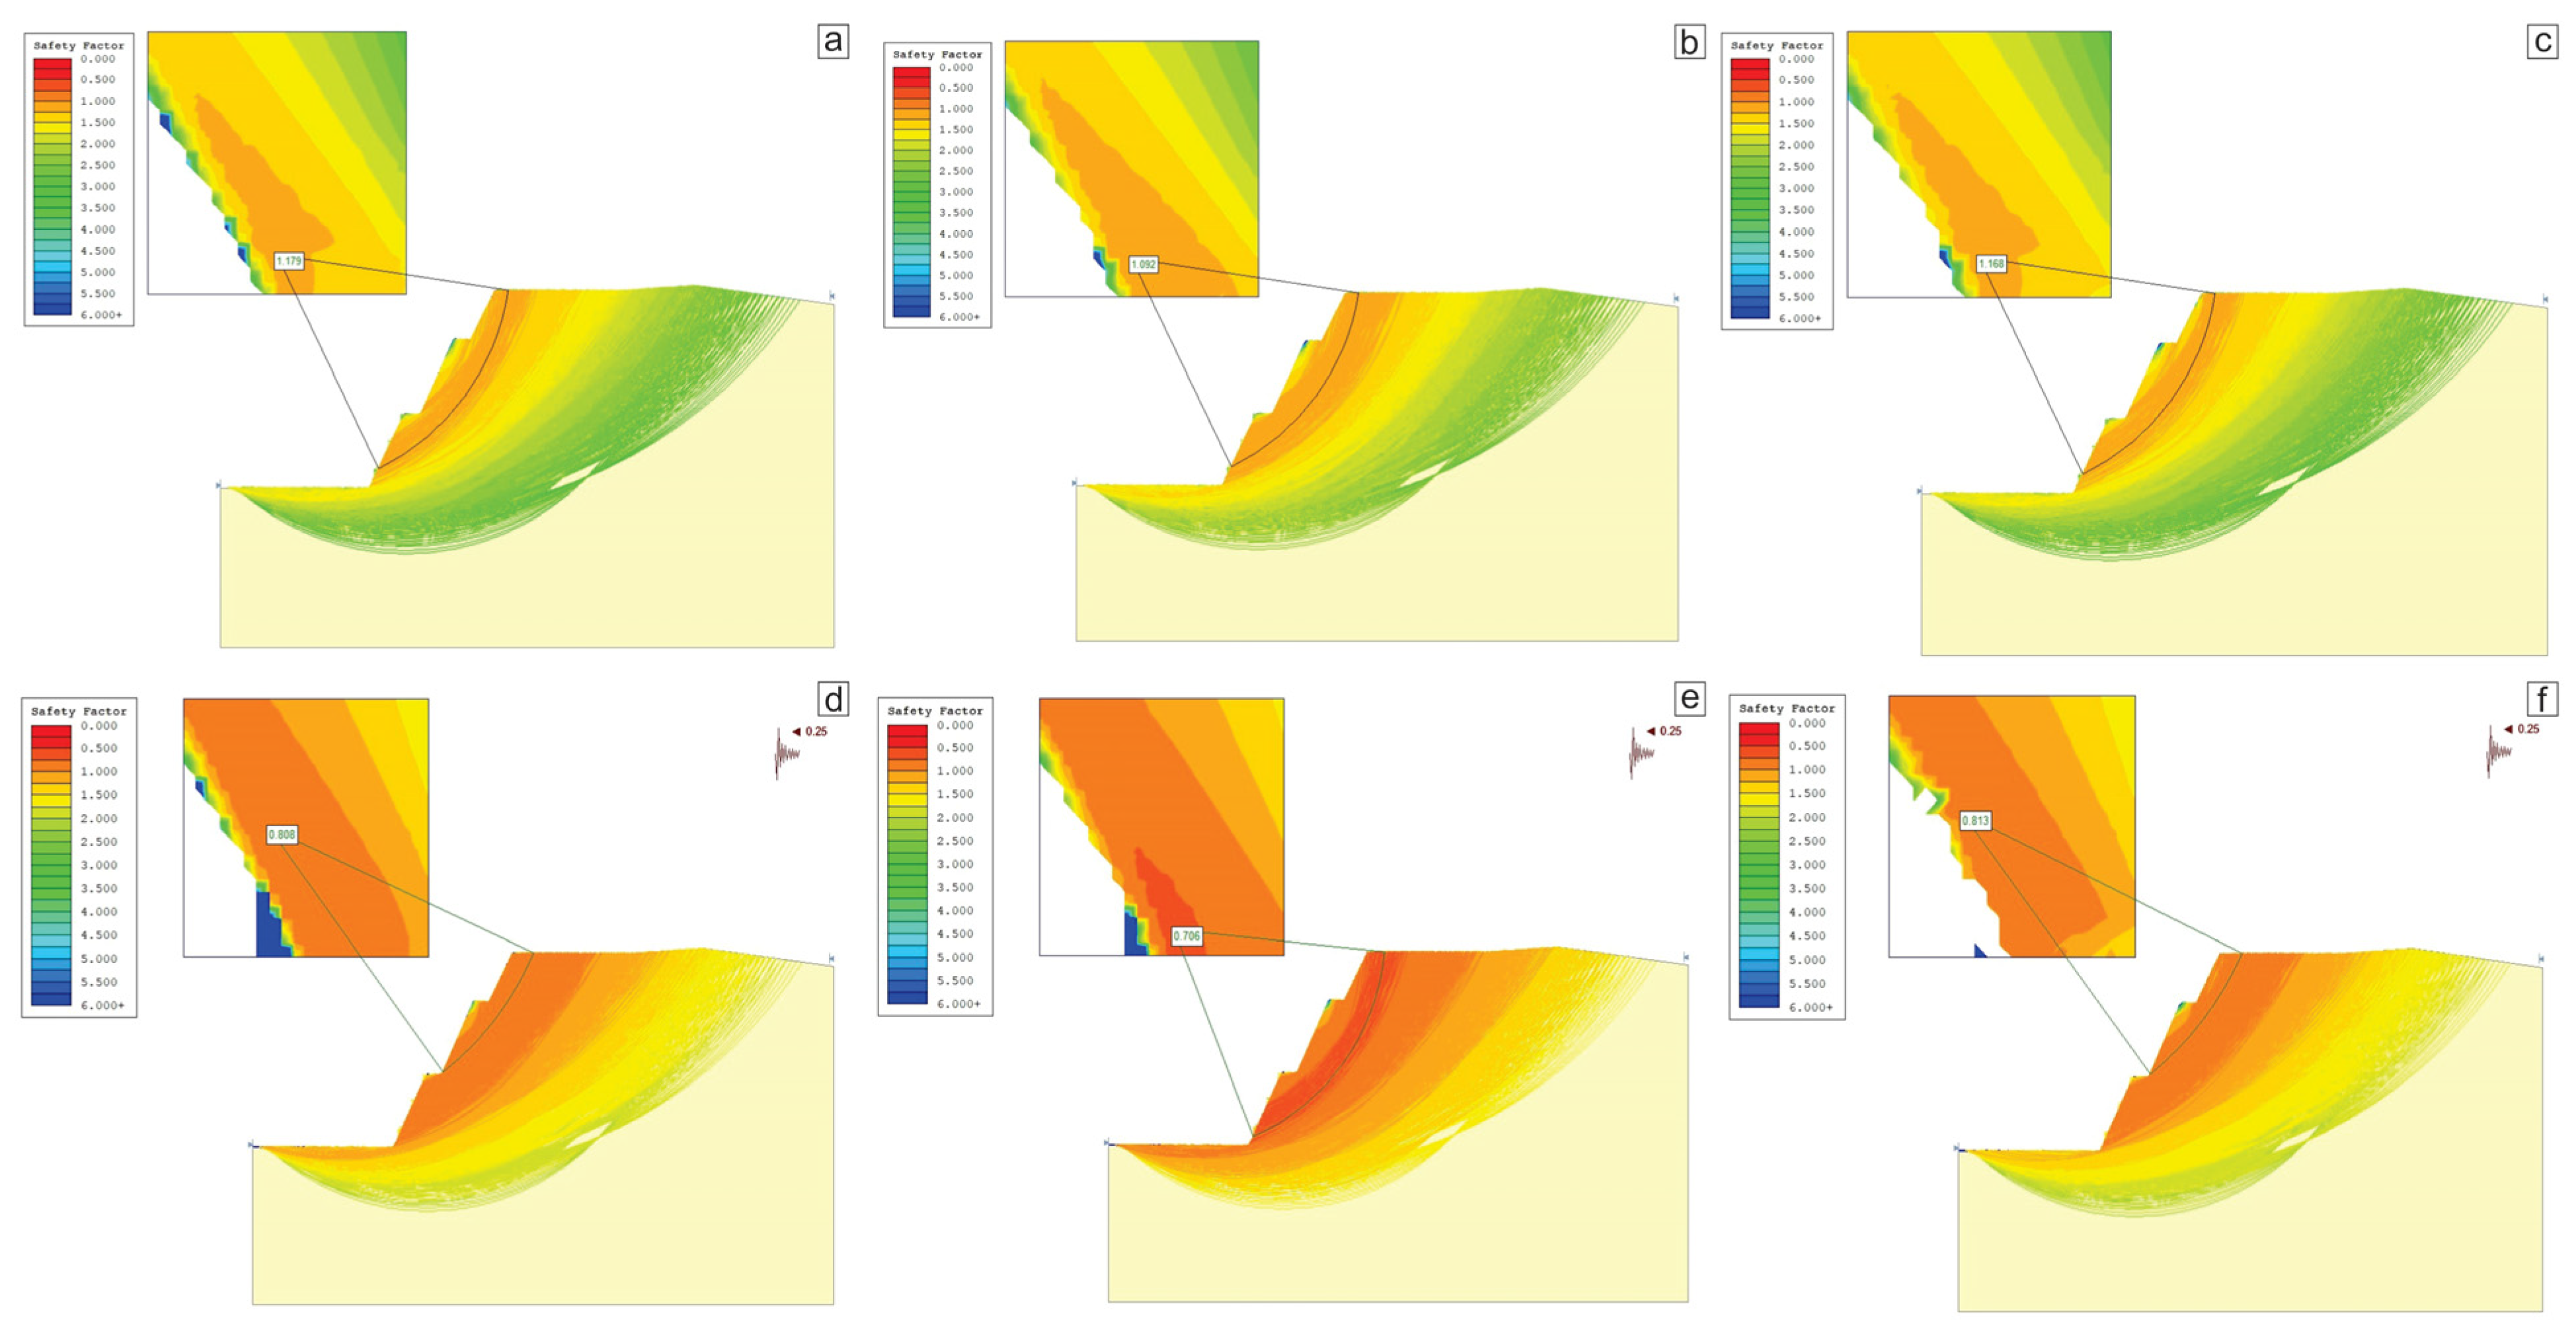
4.2.2. Right Slope
5. Conclusions
Author Contributions
Funding
Data Availability Statement
Conflicts of Interest
References
- Agyei, G.; Osei, J.B.; Adoko, A.C. Slope stability analysis of Nkran Pit at Asanko Gold Mine, Ghana. J. Appl. Sci. Environ. Manag. 2018, 22, 1673. [Google Scholar] [CrossRef]
- Ahmad, I.; Jan, M.Q.; DiPietro, J.A. Age and Tectonic implications of granitoid rocks from the Indian plate of Northern Pakistan. J. Virt. Explor. Electron. Ed. 2003, 11, 21–28. [Google Scholar]
- Akram, M.S.; Ullah, M.F.; Rehman, F.; Ali, M.; Ahmed, L.; Gillani, A.A. Stability Evaluation of Slopes Using Kinematic and Limit Equilibrium Analyses in Seismically Active Balakot, KPK, Pakistan. Open J. Geol. 2019, 9, 795–808. [Google Scholar] [CrossRef]
- Akram, M.S.; Zeeshan, M.; Mirza, K.; Ahmed, L.; Noor, A.; Ali, M. Slope stability analyses using classification systems and numerical methods: Case study from Lower Dir, Khyber Pakhtunkhwa, Pakistan. Himal. Geol. 2019, 40, 67–77. [Google Scholar]
- Aksoy, C.O. Review of rock mass rating classification: Historical developments, applications, and restrictions. J. Min. Sci. 2008, 44, 51–63. [Google Scholar] [CrossRef]
- Alejano, L.R.; Ferrero, A.M.; Ramírez-Oyanguren, P.; Fernández, M.I. Comparison of limit-equilibrium, numerical and physical models of wall slope stability. Int. J. Rock Mech. Min. Sci. 2011, 48, 16–26. [Google Scholar] [CrossRef]
- Bao, Y.; Chen, J.; Su, L.; Zhang, W.; Zhan, J. A novel numerical approach for rock slide blocking river based on the CEFDEM model: A case study from the Samaoding paleolandslide blocking river event. Eng. Geol. 2023, 312, 106949. [Google Scholar] [CrossRef]
- Bao, Y.; Han, X.; Chen, J.; Zhang, W.; Zhan, J.; Sun, X.; Chen, M. Numerical assessment of failure potential of a large mine waste dump in Panzhihua City, China. Eng. Geol. 2019, 253, 171–183. [Google Scholar] [CrossRef]
- Bieniawski, Z.T. Rock Mechanics Design in Mining and Tunneling. Int. J. Rock Mech. Min. Sci. Geomech. Abstr. 1984, 84, 193–194. [Google Scholar] [CrossRef]
- Bieniawski, Z.T. Engineering rock mass classifications: A complete manual for engineers and geologists in mining, civil, and petroleum engineering. In Engineering Rock Mass Classifications: A Complete Manual for Engineers and Geologists in Mining, Civil, and Petroleum Engineering; John Wiley & Sons: Hoboken, NJ, USA, 1989. [Google Scholar]
- Bieniawski, Z.T. The geomechanics classification in rock engineering applications. In Proceedings of the 4th ISRM Congress, Montreux, Switzerland, 2–7 September 1979. [Google Scholar]
- Bowa, V.M.; Xia, Y. Stability Analyses of Jointed Rock Slopes with Counter-tilted Failure Surface Subjected to Block Toppling Failure Mechanisms. Arab. J. Sci. Eng. 2018, 43, 5315–5331. [Google Scholar] [CrossRef]
- Bye, A.R.; Bell, F.G. Stability assessment and slope design at Sandsloot open pit, South Africa. Int. J. Rock Mech. Min. Sci. 2001, 38, 449–466. [Google Scholar] [CrossRef]
- Cerri, R.I.; Reis, F.A.G.V.; Gramani, M.F.; Rosolen, V.; Luvizotto, G.L.; Giordano, L.D.C.; Gabelini, B.M. Assessment of landslide occurrences in Serra do Mar mountain range using kinematic analyses. Environ. Earth Sci. 2018, 77, 1–16. [Google Scholar] [CrossRef]
- Chakraborty, R.; Dey, A. Random Finite Element and Limit Equilibrium Methods-Based Probabilistic Stability Analyses of a Cut Slope. Indian Geotech. J. 2022, 52, 969–978. [Google Scholar] [CrossRef]
- Chang, Y.F.; Liu, X.P.; Wu, Y.-C. The Copper-Iron Belt of the Lower and Middle Reaches of the Changjiang River; Geology Publication House, Beijing: Beijing, China, 1991; pp. 1–239. [Google Scholar]
- Khan, Z.; Khan, F.A.; Khan, A.U.; Hussain, I.; Khan, A.; Shah, L.A.; Khan, J.; Badrashi, Y.I.; Kamiński, P.; Dyczko, A.; et al. Climate-Streamflow Relationship and Consequences of Its Instability in Large Rivers of Pakistan: An Elasticity Perspective. Water 2022, 14, 2033. [Google Scholar] [CrossRef]
- Chowdhury, R.; Rao, B.N. Probabilistic stability assessment of slopes using high dimensional model representation. Comput. Geotech. 2010, 37, 876–884. [Google Scholar] [CrossRef]
- Deng, J. Experimental remolding on the caprock’s 3D strain field of the Indosinian-Yanshanian epoch in Tongling deposit concentrating area. Sci. China Ser. D Earth Sci. 2005, 48, 863–874. [Google Scholar] [CrossRef]
- Deng, J.; Wang, Q.; Xiao, C.; Yang, L.; Liu, H.; Gong, Q.; Zhang, J. Tectonic-magmatic-metallogenic system, Tongling ore cluster region, Anhui Province, China. Int. Geol. Rev. 2011, 53, 449–476. [Google Scholar] [CrossRef]
- Fereidooni, D.; Khanlari, G.R.; Heidari, M. Evaluación del sistema Q modificado de clasificación del macizo rocoso para el análisis de estabilidad de pendiente de roca. Earth Sci. Res. J. 2015, 19, 147–152. [Google Scholar] [CrossRef]
- Goodman, R.E. Introduction to Rock Mechanics; Wiley: New York, NY, USA, 1989; Volume 2. [Google Scholar]
- Gurocak, Z.; Alemdag, S.; Zaman, M.M. Rock slope stability and excavatability assessment of rocks at the Kapikaya dam site, Turkey. Eng. Geol. 2008, 96, 17–27. [Google Scholar] [CrossRef]
- Hoek, E. Practical Rock Engineering 2007 (2007 ed.) Retrieved June 30, 2010, 2007 from Rocscience. PracticalRockEngineering. Asp. Available online: http://www.rocscience.com/hoek (accessed on 1 January 2023).
- Hoek, E.; Bray, J.D. Rock Slope Engineering; Wyllie, D.C., Mah, C.W., Eds.; Taylor and Francis: London, UK, 2004. [Google Scholar]
- Hoek, E.; Bray, J.D. Rock Slope Engineering; CRC Press: Boca Raton, FL, USA, 1981. [Google Scholar]
- Karaman, K.; Ercikdi, B.; Kesimal, A. The assessment of slope stability and rock excavatability in a limestone quarry. Earth Sci. Res. J. 2013, 17, 169–181. [Google Scholar]
- Kesimal, A.; Ercikdi, B.; Cihangir, F. Environmental impacts of blast-induced acceleration on slope instability at a limestone quarry. Environ. Geol. 2008, 54, 381–389. [Google Scholar] [CrossRef]
- Kumar, N.; Ismail, M.A.M. 3D limit equilibrium method for rock slope stability analysis using generalised anisotropic material model. In Proceedings of the 2020 International Symposium on Slope Stability in Open Pit Mining and Civil Engineering, Australian Centre for Geomechanics, Perth, WA, USA, 12–14 May 2020; pp. 715–730. [Google Scholar] [CrossRef]
- Lee, S.-H.; Kim, H.-B. A study to incorporate engineering probability techniques into deterministic slope stability methods. KSCE J. Civ. Eng. 2000, 4, 153–160. [Google Scholar] [CrossRef]
- Meybodi, E.E.; Golestani, M.; Hussain, S.K. Kinematic Analysis of Rock Falls (Case Study: Southeast Wall of Sadat Siriz Iron Ore Mine). Researchgate.Net, March. 2022. Available online: https://www.researchgate.net/profile/Khaliq-Hussain/publication/358982221_Kinematic_analysis_of_rock_falls_Case_study_Southeast_wall_of_Sadat_Siriz_iron_ore_mine/links/6220cd2019d1945aced2e174/Kinematic-analysis-of-rock-falls-Case-study-Southeast-wall-of-Sadat-Siriz-iron-ore-mine.pdf (accessed on 1 December 2022).
- Nagendran, S.K.; Ismail, M.A.M. Probabilistic and Sensitivity Analysis of Rock Slope Using Anisotropic Material Models for Planar Failures. Geotech. Geol. Eng. 2021, 39, 1979–1995. [Google Scholar] [CrossRef]
- Yang, Y.; Sun, G.; Zheng, H.; Qi, Y. Investigation of the sequential excavation of a soil-rock-mixture slope using the numerical manifold method. Eng. Geol. 2022, 256, 93–109. [Google Scholar] [CrossRef]
- Naghadehi, M.Z.; Jimenez, R.; KhaloKakaie, R.; Jalali, S.-M.E. A probabilistic systems methodology to analyze the importance of factors affecting the stability of rock slopes. Eng. Geol. 2011, 118, 82–92. [Google Scholar] [CrossRef]
- Ing, Y.; Zhang, G.; Tang, H.; Shen, W.; Shen, P. Process Analysis of Toppling Failure on Anti-dip Rock Slopes under Seismic Load in Southwest China. Rock Mech. Rock Eng. 2019, 52, 4439–4455. [Google Scholar] [CrossRef]
- Pantelidis, L. Rock slope stability assessment through rock mass classification systems. Int. J. Rock Mech. Min. Sci. 2009, 46, 315–325. [Google Scholar] [CrossRef]
- Pantelidis, L. An alternative rock mass classification system for rock slopes. Bull. Eng. Geol. Environ. 2010, 69, 29–39. [Google Scholar] [CrossRef]
- Park, H.-J.; Lee, J.-H.; Kim, K.-M.; Um, J.-G. Assessment of rock slope stability using GIS-based probabilistic kinematic analysis. Eng. Geol. 2016, 203, 56–69. [Google Scholar] [CrossRef]
- Phillips, F.C. The Use of Stereographic Projection in Structural Geology; Taylor & Francis Group: London, UK, 1972. [Google Scholar]
- Rahman, A.U.; Guangcheng, Z.; Khan, A.; Puniya, K.; Rahman, S.U.; Xin, Z.; Kumar Puniya, M. Rock mass classification systems and kinematic analysis of slates from dir group, nw, himalaya, pakistan; implication for slope stability. Geol. Behav. 2022, 6, 39–45. [Google Scholar] [CrossRef]
- Rahman, A.U.; Zhang, G.; Khan, A.; Muhammad, J.; Sohail, A.; Rehman, H.U.; Puniya, M.K.; Ashraf, B. The Effect of Mineral Composition, Microstructure on Physical Properties of Aggregate from River Punjkora and Kunai, Dir (Lower), Khyber Pakhtunkhwa, Pakistan. J. Geosci. Environ. Prot. 2022, 10, 127–144. [Google Scholar] [CrossRef]
- Robani, A. Analysis of Slope Failure at Maran Highway Using Slope/W Software. Ph.D. Thesis, Universiti Malaysia Pahang, Kuantan, Malaysia, November 2009. [Google Scholar]
- Sagaseta, C.; Sánchez, J.; Cañizal, J. A general analytical solution for the required anchor force in rock slopes with toppling failure. Int. J. Rock Mech. Min. Sci. 2001, 38, 421–435. [Google Scholar] [CrossRef]
- Sharma, R.K.; Mehta, B.S.; Jamwal, C.S. Cut slope stability evaluation of NH-21 along Nalayan-Gambhrola section, Bilaspur district, Himachal Pradesh, India. Nat. Hazards 2013, 66, 249–270. [Google Scholar] [CrossRef]
- Sharma, S.; Raghuvanshi, T.K.; Anbalagan, R. Plane failure analysis of rock slopes. Geotech. Geol. Eng. 1995, 13, 105–111. [Google Scholar] [CrossRef]
- Turner, A.K.; Schuster, R.L. Landslides: Investigation and Mitigation; Special Report 247; Transportation Research Board, National Academy Press: Washington, DC, USA, 1996. [Google Scholar]
- Ukritchon, B.; Ouch, R.; Pipatpongsa, T.; Khosravi, M.H. Investigation of Stability and Failure Mechanism of Undercut Slopes by Three-Dimensional Finite Element Analysis. KSCE J. Civ. Eng. 2018, 22, 1730–1741. [Google Scholar] [CrossRef]
- Vatanpour, N.; Ghafoori, M.; Talouki, H.H. Probabilistic and sensitivity analyses of effective geotechnical parameters on rock slope stability: A case study of an urban area in northeast Iran. Nat. Hazards 2014, 71, 1659–1678. [Google Scholar] [CrossRef]
- Wang, Q.; Deng, J.; Huang, D.; Xiao, C.; Yang, L.; Wang, Y. Deformation model for the Tongling ore cluster region, east-central China. Int. Geol. Rev. 2011, 53, 562–579. [Google Scholar] [CrossRef]
- Wu, F.Y. Collapsed Himalayan-Tibetan orogen and the rising Tibetan Plateau. Acta Petrol. Sin. 2008, 24, 1–30. [Google Scholar]
- Wyllie, D.C.; Mah, C.W. Rock Slope Engineering—Civil and Mining, 4th ed.; Taylor and Francis: London, UK, 2005. [Google Scholar]
- Xiao, X.; Zhou, T.; White, N.C.; Zhang, L.; Fan, Y.; Chen, X. Multiple generations of titanites and their geochemical characteristics record the magmatic-hydrothermal processes and timing of the Dongguashan porphyry-skarn Cu-Au system, Tongling district, Eastern China. Miner. Depos. 2021, 56, 363–380. [Google Scholar] [CrossRef]
- Yoon, W.; Jeong, U.; Kim, J. Kinematic analysis for sliding failure of multi-faced rock slopes. Eng. Geol. 2002, 67, 51–61. [Google Scholar] [CrossRef]


| Sample | Water Absorption (%) | Error (±) | Porosity (%) | Error (±) | Unit Weight (γ) | Error (±) |
|---|---|---|---|---|---|---|
| Limestone dry | 0.12 | 0.042 | 0.36 | 0.112 | 2.71 | 0.010 |
| Dolomite wet | 0.23 | 0.020 | 0.66 | 0.055 | 2.82 | 0.011 |
| Serial No: | Unit Weight (kN/m3) | Cohesion (kPa) | Internal Friction Angle (°) | Deformation Modulus (MPa) | Poisson Ratio (MPa) | |
|---|---|---|---|---|---|---|
| Strong, weathered limestone | Natural | 26.8 | 350 | 38 | 25,000 | 0.28 |
| Saturated | 27.1 | 300 | 35 | 23,000 | 0.31 | |
| Site | Failure Type | 45° | 50° | 55° | 60° | 65° | 70° | TCI |
|---|---|---|---|---|---|---|---|---|
| LB | P | 2 | 3 | 4 | 5 | 6 | 8 | 239 |
| W | 593 | 907 | 1267 | 1571 | 1967 | 2488 | 28,426 | |
| T | 2190 | 2366 | 2500 | 2667 | 2989 | 5773 | 28,426 | |
| RB | P | 0 | 0 | 0 | 0 | 0 | 0 | 239 |
| W | 599 | 780 | 1113 | 1509 | 1915 | 28,426 | 28,426 | |
| T | 484 | 628 | 725 | 915 | 1059 | 1247 | 28,426 |
Disclaimer/Publisher’s Note: The statements, opinions and data contained in all publications are solely those of the individual author(s) and contributor(s) and not of MDPI and/or the editor(s). MDPI and/or the editor(s) disclaim responsibility for any injury to people or property resulting from any ideas, methods, instructions or products referred to in the content. |
© 2023 by the authors. Licensee MDPI, Basel, Switzerland. This article is an open access article distributed under the terms and conditions of the Creative Commons Attribution (CC BY) license (https://creativecommons.org/licenses/by/4.0/).
Share and Cite
Rahman, A.U.; Zhang, G.; A. AlQahtani, S.; Janjuhah, H.T.; Hussain, I.; Rehman, H.U.; Shah, L.A. Geotechnical Assessment of Rock Slope Stability Using Kinematic and Limit Equilibrium Analysis for Safety Evaluation. Water 2023, 15, 1924. https://doi.org/10.3390/w15101924
Rahman AU, Zhang G, A. AlQahtani S, Janjuhah HT, Hussain I, Rehman HU, Shah LA. Geotechnical Assessment of Rock Slope Stability Using Kinematic and Limit Equilibrium Analysis for Safety Evaluation. Water. 2023; 15(10):1924. https://doi.org/10.3390/w15101924
Chicago/Turabian StyleRahman, Aftab Ur, Guangcheng Zhang, Salman A. AlQahtani, Hammad Tariq Janjuhah, Irshad Hussain, Habib Ur Rehman, and Liaqat Ali Shah. 2023. "Geotechnical Assessment of Rock Slope Stability Using Kinematic and Limit Equilibrium Analysis for Safety Evaluation" Water 15, no. 10: 1924. https://doi.org/10.3390/w15101924