Article

Improving Wheat Grain Yield and Nitrogen Use Efficiency by Optimizing the Fertigation Frequency Using Center Pivot Irrigation System

1
College of Resources and Environmental Sciences, China Agricultural University, Beijing 100193, China
2
National Academy of Agriculture Green Development, China Agricultural University, Beijing 100193, China
3
College of Water Resources and Civil Engineering, China Agricultural University, Beijing 100083, China
4
Hebei Science and Technology Innovation Service Center, Shijiazhuang 050051, China
5
Beijing Agricultural Machinery Experiment Appraisal Extension Station, Beijing 100079, China
6
Engineering Resources Center of Agricultural Water-Saving and Water Resources, Ministry of Education, Beijing 100083, China
*
Author to whom correspondence should be addressed.
Water 2023, 15(10), 1932; https://doi.org/10.3390/w15101932
Submission received: 9 April 2023 / Revised: 8 May 2023 / Accepted: 16 May 2023 / Published: 19 May 2023
(This article belongs to the Special Issue Advances in Sprinkler Irrigation Systems and Water Saving Volume II)

Abstract

:
High efficient nitrogen (N) application method and proper N management strategies can further reduce the losses and enhance N use efficiency. Field experiments were conducted in the 2015–2016 and 2016–2017 growing seasons to evaluate the effects of four fertigation frequencies treatments (FT-1: all the topdressing N was applied at the jointing stage; FT-2: 67% and 33% of the topdressing N was applied at the jointing and filling stages; FT-3: 33%, 50% and 17% of the topdressing N was applied at the regreening, jointing and filling stages; FT-4: 33%, 33%, 17% and 17% of the topdressing N were applied at the regreening, jointing, anthesis and filling stages) on wheat yield, water use efficiency (WUE), partial productivity of N fertilizer (PFPN) and N harvest index (NHI). In addition, one-time topdressing by surface broadcasting at the jointing stage was set up as a control (BC-1). The results showed that FT-3 and FT-4 supplied sufficient NO3-N in the 0–40 cm soil layer, which reduced the risk of soil NO3-N leaching to the deeper layers. FT-4 had the highest grain yield, WUE, PFPN and NHI, with average values of 9153.4 kg ha−1, 2.1 kg m−3, 0.74 kg kg−1 and 31.3 kg kg−1, respectively, followed by these values corresponding to the FT-3 in two years. These findings suggest that topdressing N split with 3–4 times, that is to say applying approximately 16.7% of topdressing N in anthesis and filling stages, respectively by the center pivot fertigation method can significantly improve yield, WUE, PFPN and NHI.

1. Introduction

As one of China’s main agricultural production areas, the North China Plain (NCP) covers about 51% of the winter wheat (Triticum aestivum L.) sown area and provides 59% of the country’s winter wheat [1]. In the NCP, the continuous increase in wheat production inevitably requires continuous fertilizer input [2]. However, excessive and improper nitrogen (N) application rate leads to waste resources and environmental pollution and is contrary to sustainable agricultural production [3,4]. Inappropriate N application methods and time are the predominant reasons for the low efficiency of fertilizer utilization [5]. Thus, new highly efficient N application methods and schedules need to be further studied to improve nitrogen use efficiency (NUE) and develop environmentally friendly agriculture.
The use of an appropriate N topdressing can ensure the reproductive growth stage of winter wheat and enhance N uptake. While the most conventional N topdressing application method is manual broadcasting for small farmland and fertilization with fertilizer applicator for larger farmland in the NCP region [6]. In addition, a conventional practice of only one-time fertilization is performed at the jointing stage of wheat, which greatly reduces the efficiency of N utilization [7]. Compared with the N application method of broadcasting, fertigation is a higher efficient fertilization method as it improves the yield and crop quality with reduced N and water supplies [8,9]. Research indicated that N uptake and use efficiency were higher with fertigation technology compared with traditional farmers’ practice under similar rates of fertilizers [10]. For given seasonal water and N supply, the fertigation frequency affects the rhizosphere’s soil moisture and nutrient concentration. Split N application can further reduce the N losses, especially when N management is coordinated with irrigation. High fertigation frequency can provide a vital N concentration and soil water during the growing period and increase the uptake efficiency of N in crop growth [11]. The spilt application of water and N fertilizer according to crop requirements increases the NUE and reduces N loss to the environment [12]. However, too-frequent fertigation might be unnecessary and ineffective, especially in clay and low inherent fertility level soils. Thus, the optimal fertigation frequency should be investigated according to the main growth stages of crops and soil properties.
Depending on the crops and production regions, fertigation can be conducted through different irrigation methods such as drip irrigation, sprinkler irrigation, or surface irrigation [13]. In recent years, various advanced water-saving techniques combined with fertigation technology have been used in field crops [14]. For example, Li et al. [15] showed that the recommended N amounts with optimum split applications under drip fertigation can be reduced to 46% of farmer practice for wheat, without negatively affecting grain yield, thereby increasing NUE. Li et al. [16] found that the highest N fertilizer use efficiency was achieved by a small amount of water with optimized N application using micro-sprinkling irrigation in the NCP. In addition, Zhao et al. [17] reported that more frequent fertigation could be recommended for soil with low inherent N availability. Nevertheless, there is insufficient research on the optimal fertigation frequency of winter wheat, especially for fertigation splits on yield, water use efficiency (WUE) and NUE with low pressure sprinkler irrigation system. It is unclear whether fertigation splits can further improve the NUE under the same N application rate. More research is needed to explore the effects of highly efficient fertilization methods in improving NUE and to meet demands of future sustainable development of agriculture in the NCP.
We hypothesized that the optimum fertigation frequencies, especially proper N fertilization in the late growth stages of wheat could improve yield and NUE. To verify this hypothesis, a two-year field experiment was conducted to evaluate the effects of different fertigation frequencies with the center pivot irrigation system on grain yield, ET, WUE, soil NO3-N accumulation, NUtE, PFPN and NHI under the same topdressing N application rate in the NCP.

2. Material and Methods
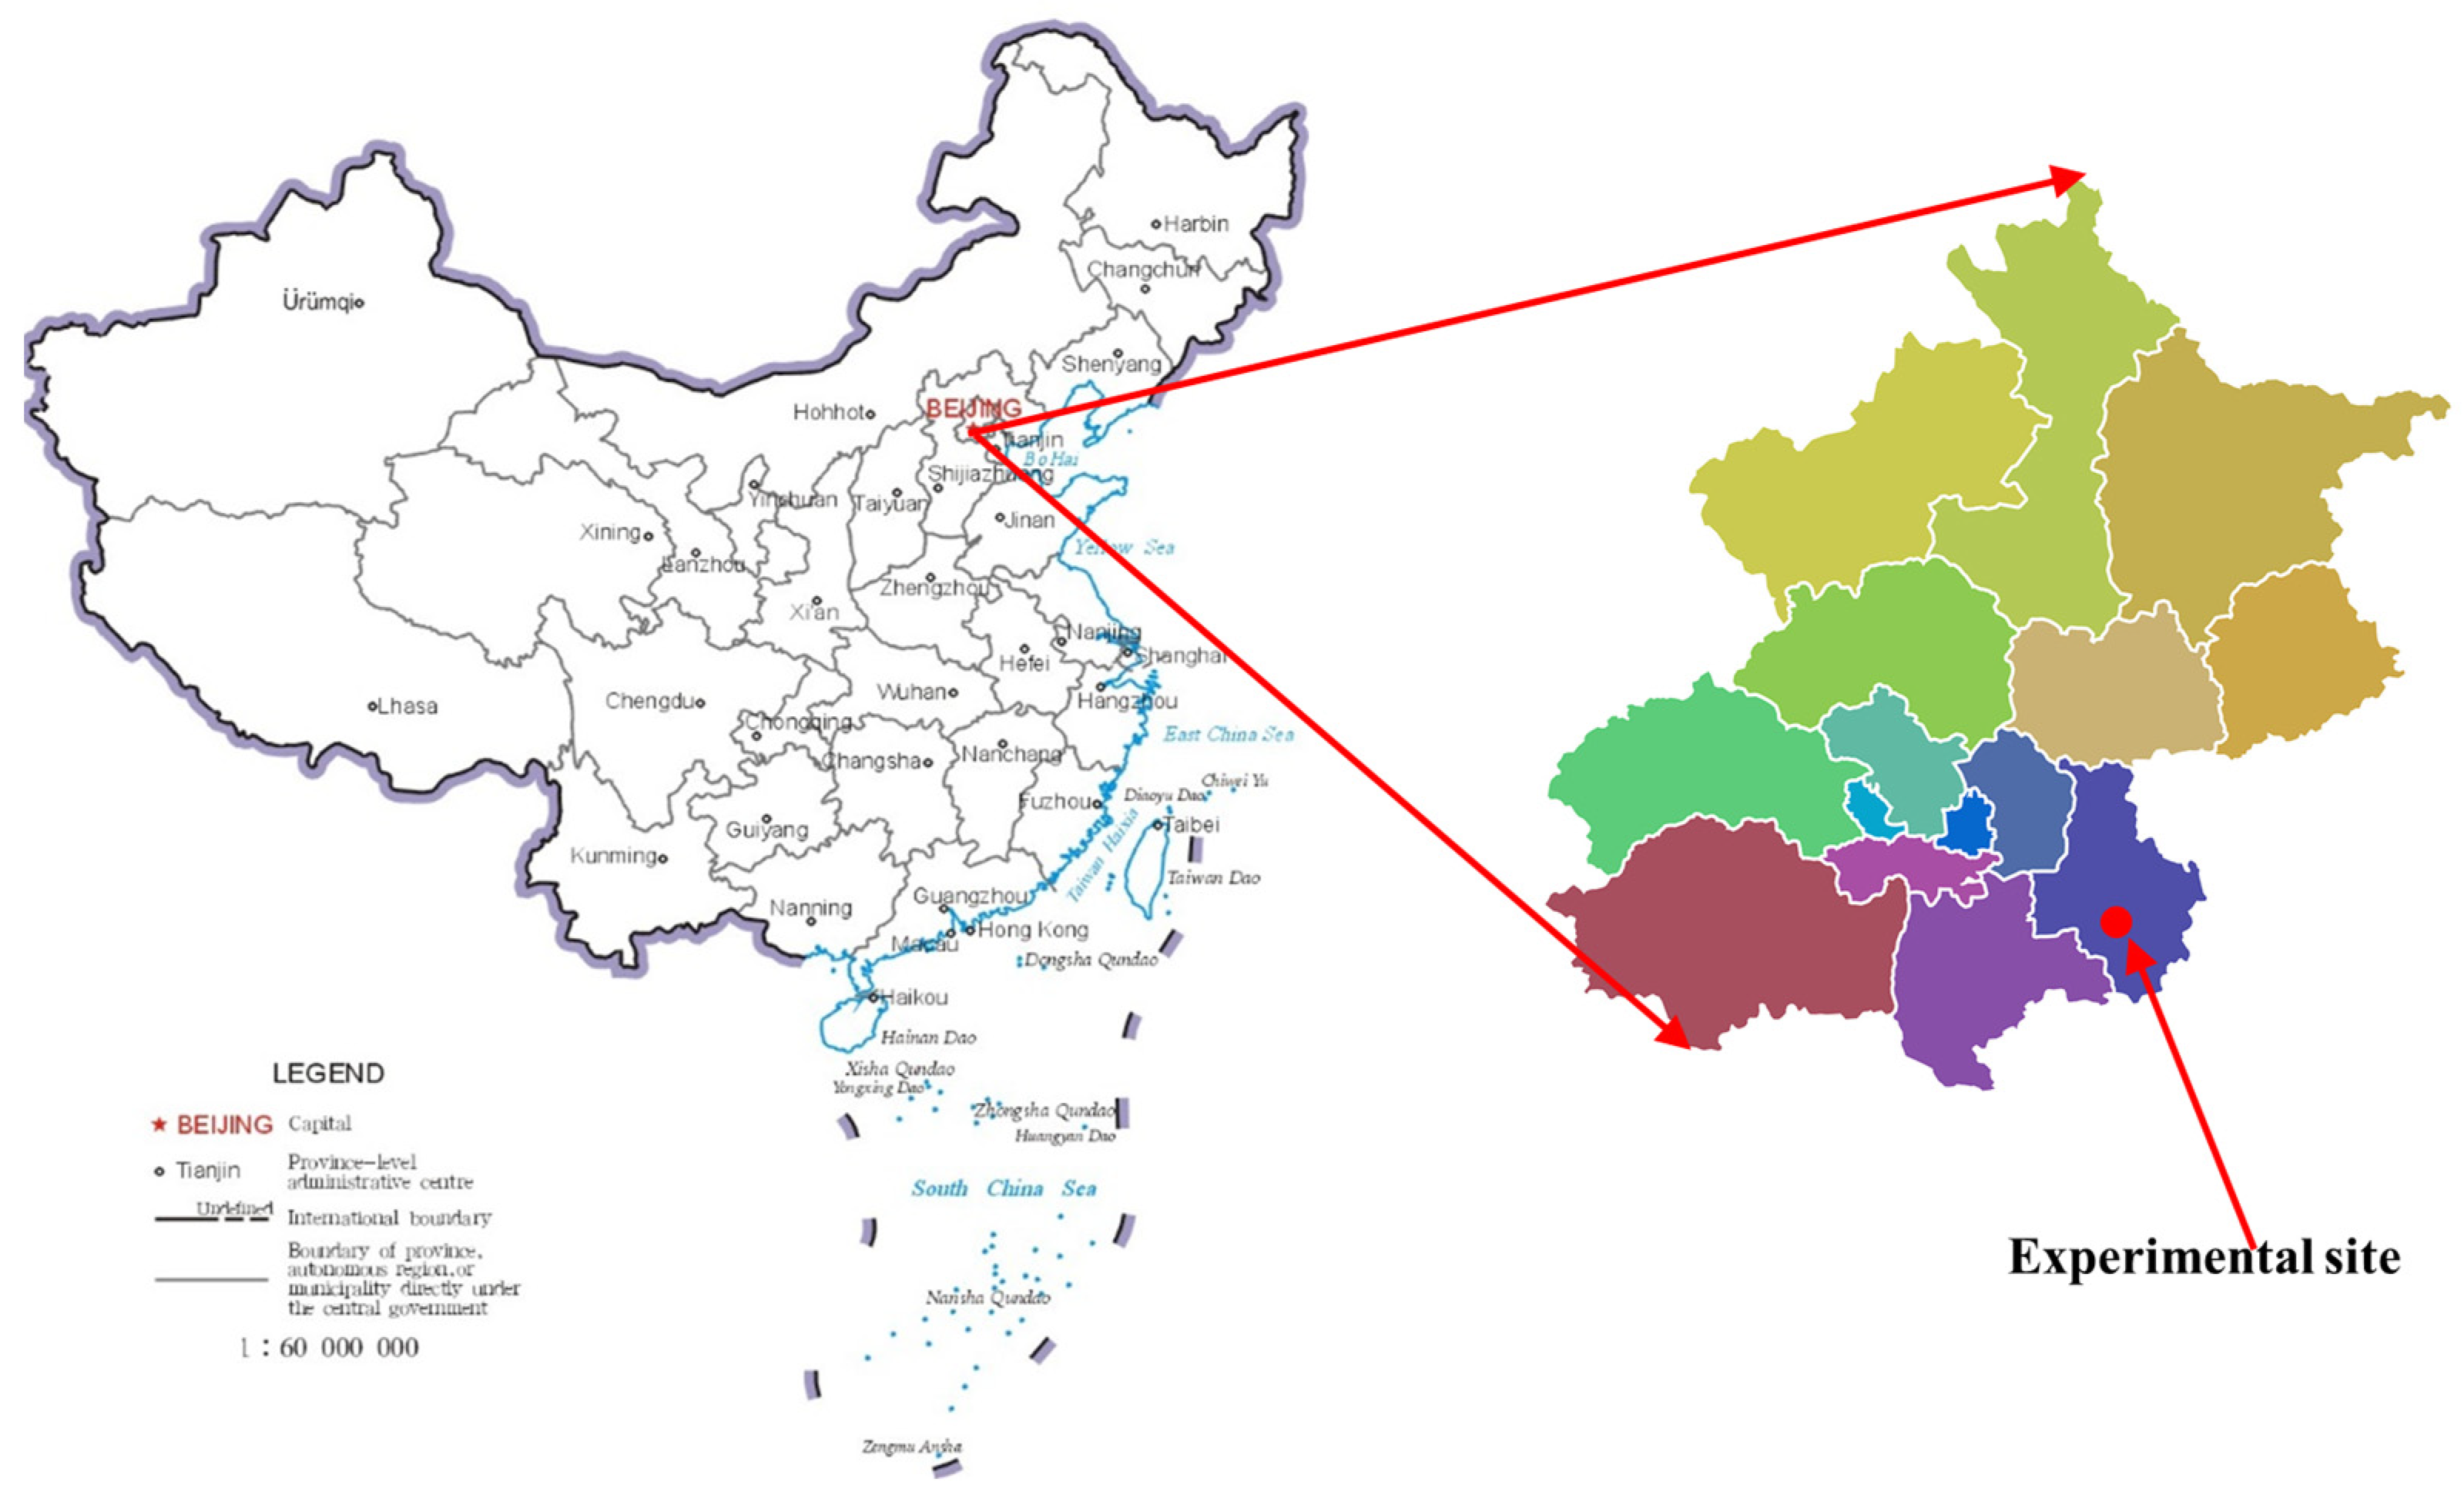
2.1. Research Site

Field experiments were carried out during two growing seasons from 2015 to 2017 at Tongzhou Experimental Station of China Agricultural University (Beijing, China; 39°41′59″ N, 116°41′01″ E; elevation 21 m). The experimental site is in the NCP (Figure 1) and the mean annual temperature is 11.3 °C, and the mean annual precipitation is 620 mm, mainly distributed from June to September. The organic matter content in the 0–40 cm was 12.3 g kg−1 and the soil type was sandy loam. The main physicochemical properties of root zone soil (0–100 cm) are listed in Table 1.

2.2. Experimental Design

Winter wheat (Nongda 211) was sown on 9 October 2015 and 3 October 2016 using a wheat seeder machine with a row spacing of 15 cm. The sowing rate was 300 kg ha−1 in both two years and the harvest dates were 13 June 2016 and 15 June 2017. Other field management practices, including controls of pests, crop diseases and weeds, were conducted using the same standards as those used in this region.
A center pivot irrigation system (Debont Irrigation Equipment Co., Ltd., Tianjin, China), which consisted of two spans of 43.3 and 37.5 m for the first and second spans, respectively and an overhang with a length of 8.4 m, was used in this study. A Nelson P85A impact sprinkler (Nelson Irrigation Corp., Walla Walla, Washington, DC, USA) with a nozzle diameter of 8.7 mm was installed at the end of the overhang without a booster pump. All Nelson D3000 sprinklers (Nelson Irrigation Corp., Walla Walla, Washington, DC, USA) were positioned 1.6 m above the ground using polythene flexible drop pipes. A 15 psi (103 kPa) pressure regulator was deployed upstream of each sprinkler. During the experiment, the inlet pressure at the pivot point was 240 kPa, and the inlet flow rate of the whole system was 24.7 m3 h−1.
Crop phenology was classified using the Zadoks scale [18]. Considering that the demand for N fertilizer of winter wheat is mainly in the regreening stage (Z25), jointing stage (Z35), anthesis stage (Z60) and filling stage (Z70). Four N topdressing timing treatments were imposed by fertigation: (i) non-traditional-1 in which all the topdressing N was applied at the jointing stage (FT-1), (ii) non-traditional-2 in which 67% and 33% of the topdressing N was applied at the jointing and filling stages (FT-2), (iii) non-traditional-3 in which 33%, 50% and 17% of the topdressing N was applied at the regreening, jointing and filling stages (FT-3) and (iiii) non-traditional-4 in which 33%, 33%, 17% and 17% of the topdressing N was applied at the regreening, jointing, anthesis and filling stages (FT-4), respectively. In addition, traditional one-time topdressing by surface broadcasting (BC-1) at the jointing stage was set up with the same N application rate of the four fertigation frequencies as a control (Table 2). To better compare farmers’ traditional yield and N fertilizer use efficiency, the total N rate was 315 kg ha−1 and base fertilizer was 108 kg N ha−1 referred to the local farmer’s practice in the same location in 2015–2016. The total N rate was 275 kg ha−1 and base fertilizer was 68 kg N ha−1 in 2016–2017 to further improve NUE. Before sowing, 150 kg P2O5 ha−1 and 90 kg K2O ha−1 were applied as base fertilizer in two years. The base fertilizer was applied to the soil at sowing time using a modified tractor-mounted seeding device. Urea (46% N) was used as topdressing N fertilizer. Topdresssing dates for 2015–2016 season were 20 March, 25 April, 15 May and 20 May, while topdresssing dates were 15 March, 22 April, 13 May and 22 May for 2016–2017 season. Topdressing was applied using a center pivot fertigation system with a piston pump (Intelirri (Beijing) Technology Co., Ltd., Beijing, China) and a 2000 L fertilizer storage tank. The urea solution was injected into the center pivot irrigation system at a flow rate of 285 L h−1, mixed with irrigation water and finally, applied to the field by the sprinklers. Each experimental plot size was 6 m × 10 m, with three replicates in a randomized complete block design.
For four fertigation treatments in season, 30, 45, 30 and 30 mm of irrigation water were applied by center pivot at the regreening, jointing, anthesis and filling stages, respectively. Due to sufficient rainfall in November 2015, overwintering irrigation was not applied. While 30 mm of irrigation water was applied on 28 November 2016 for overwintering irrigation. All the plots of BC-1 treatment were boarded to form a basin for border irrigation. Meanwhile, the irrigation amount and stage of BC-1 were consistent with other treatments. For BC-1 treatment, the irrigation water was applied to the soil by connecting a plastic tube to a pumping well and a water meter was used to record the irrigation applied for each plot.

2.3. Measurements

2.3.1. Meteorological Data

During the two seasons, an automatic weather station (HOBO U30, Onset Computer Co., Bourne, MA, USA) was installed 200 m from the experimental plots to measure mean precipitation, air temperature, relative air humidity, wind speed, wind direction and solar radiation.

2.3.2. Field Measurements

At the maturity stage, the plant samples from two 50 cm inner rows in each subplot with three samples for a plot were selected. They were oven dried at 75 °C to a constant weight so as to obtain the dry matter (DM) accumulation. The spike number from 60 randomly selected plants was recorded. The 1000-grain weight was measured using the average of three samples of 1000 grains. In each plot, wheat plants from a 1 m2 area were harvested at maturity and threshed to determine grain yield (13% water contents). The harvest index (HI) was calculated as the ratio of grain yield to the above-ground DM accumulation at maturity.

2.3.3. Soil Samples and Analysis

Soil samples were collected from 20 cm increments to a depth of 140 cm using a soil corer in all experimental plots during wheat growing season. The soil water content of 0–140 cm soil layer was analyzed before and after irrigation and precipitation. Soil water content was monitored by gravimetric method. Soil volumetric water content was determined from gravimetric water content and bulk density. Crop evapotranspiration (ET) was calculated using the soil water balance equation [19]:
ET = P + I + ΔSWE − R − D + CR,
where ET (mm) is the crop evapotranspiration, P (mm) is precipitation, I (mm) is actual irrigation amount and ΔSWE (mm) is the change in stored soil water in the 140 cm of the soil between the sowing and maturity phases. R (mm) is surface runoff. D (mm) was drainage from the root zone and CR (mm) was capillary rise to the root zone. Surface runoff, drainage and capillary rise to the root zone were taken as zero due to the less rainfall, small irrigation amount and the deep groundwater table (25 m below soil surface).
WUE was calculated using the following equation:
WUE = 0.1 × Y ET
where WUE (kg m−3) is the water use efficiency of winter wheat and Y (kg ha−1) is the grain yield.

2.3.4. Nitrogen Accumulation and Nitrogen Use Efficiency

The nitrate-nitrogen (NO3-N) in the 0–100 cm soil layers was examined with air-dried soil samples using an Autoanalyzer III (Bran + Luebbe, Norderstedt, Germany). Total nitrogen contents in plants and grains were determined using the Kjeldahl method [20]. N accumulation and NUE were calculated as follows according to Ruisi et al. [21]:
Total N accumulation (NT) = DM × NC%
Grain N accumulation (NG) = Y × NC%
NUtE = Y/NT,
PFPN = Y/NF,
NHI = NG/NT,
where NC is the N concentration of plants or grain, NUtE (kg kg−1) is N utilization efficiency, PFPN (kg kg−1) is the partial productivity of N fertilizer and NF (kg ha−1) is the total N application rate. NHI is the N harvest index, NG (kg ha−1) is the N accumulation in mature kernels and NT (kg ha−1) is the sum of straw and grain N accumulation at harvest.

2.3.5. Data Analysis

Data was recorded and sorted by excel 2016, and the variance analysis (ANOVA) was performed by SPSS statistical software. The graphical work was carried out with Origin 9.1 graphical software. Differences among mean values were calculated using the least significant differences at the 5% level.

3. Results

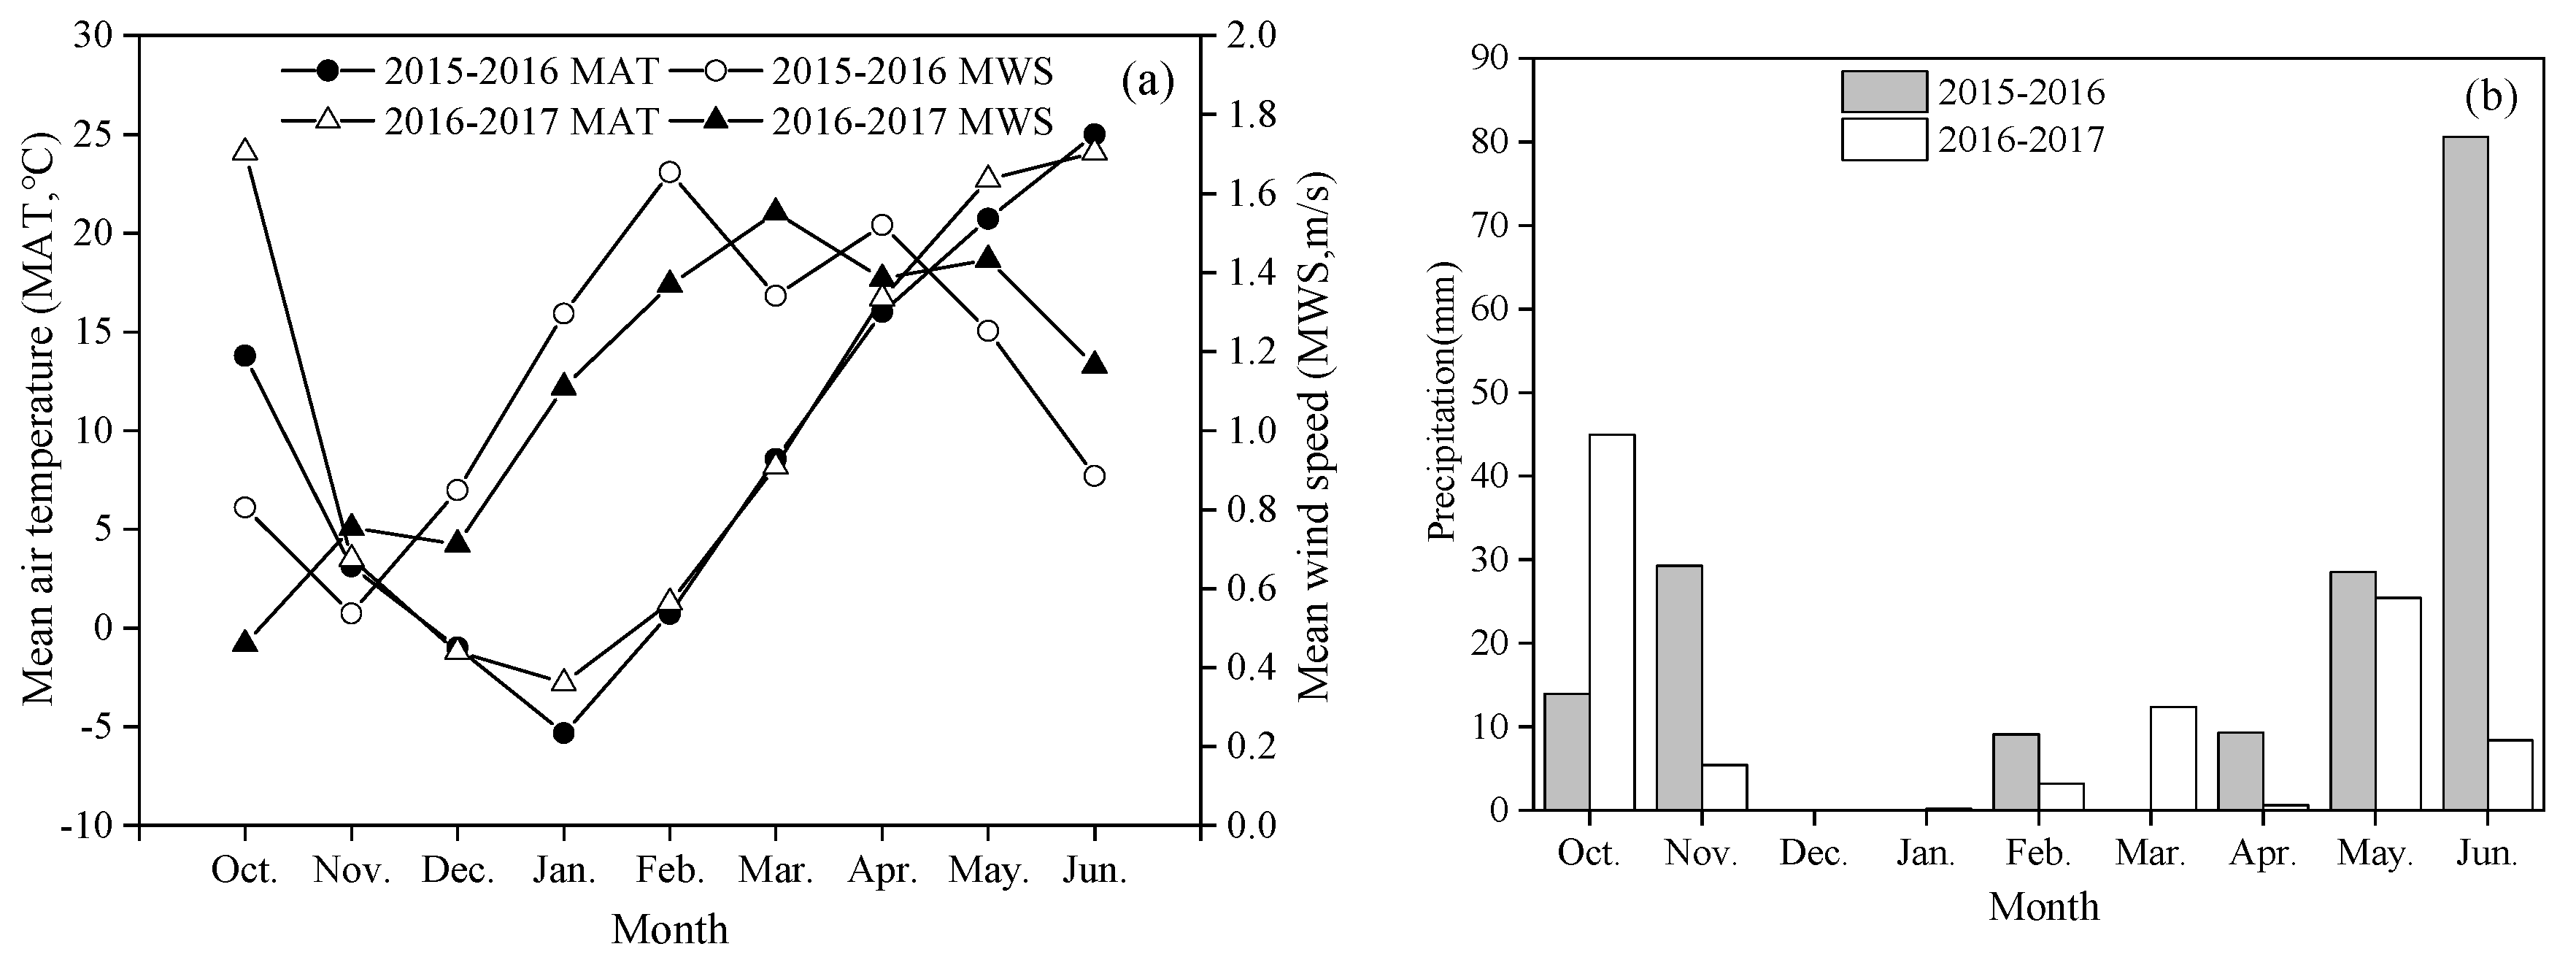
3.1. Climatic Conditions

Meteorological parameters, especially wind speed, have a significant impact on sprinkler hydraulic performance and irrigation water use efficiency. The monthly mean air temperature, wind speed and precipitation from October 2015 to June 2017 was illustrated in Figure 1. The tendency of air temperature and wind speed during the two growing seasons were similar (Figure 2a). The mean air temperature ranged from −5.3 to 25.0 °C in 2015–2016 and −2.8 to 24.1 °C in 2016–2017. After mid-March, the average daily temperature was above 10 °C, which contributed to rapid wheat growth. During the growing season, the mean wind speed was below 3 m s−1, which provided favorable meteorological conditions for sprinkler irrigation (Figure 2a). The total precipitation during the wheat growing season was 170.7 mm in 2015–2016 and 100.6 mm in 2016–2017. Precipitation events mainly occurred from May to June, accounting for 69.4% in 2015–2016 and 34.2% in 2016–2017, respectively (Figure 2b). This means that a significant amount of irrigation water is needed during the wheat growth period.

3.2. ET, Grain Yield, HI and WUE

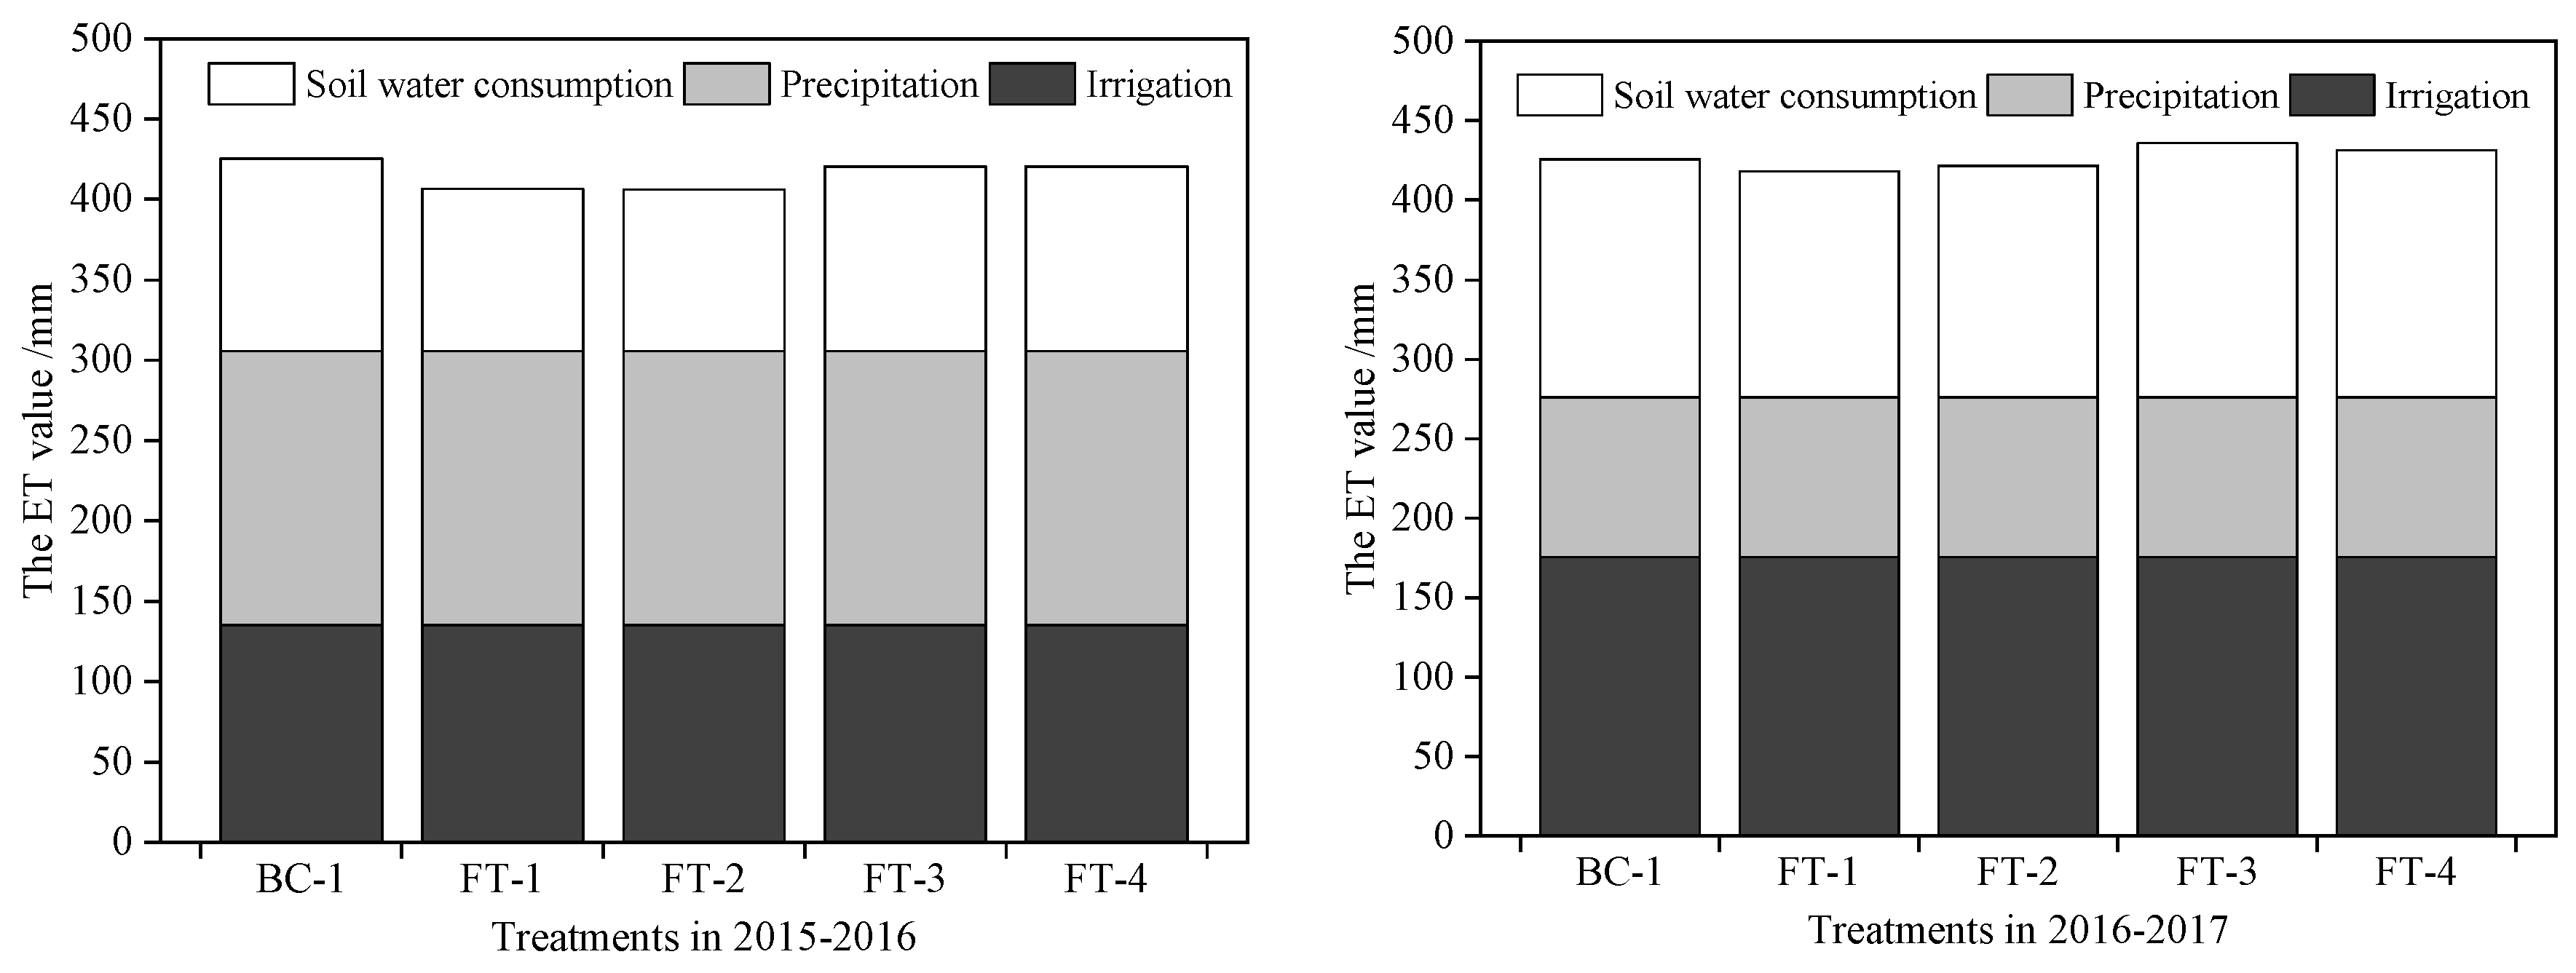
3.2.1. Crop Evapotranspiration

The cumulative seasonal irrigation, precipitation and soil water consumption for each treatment during the wheat growing in 2015–2017 were shown in Figure 3. As a whole, the corresponding ET values of winter wheat in the two growth periods were not significantly different, which were between 400 and 450 mm. In the two years, the ET values did not differ significantly among different treatments, with the BC-1 treatment having slightly higher ΔSWE values than the other treatments in the same year. Compared to the 2015–2016 growing season, the total precipitation and irrigation decreased by 40.1 mm in 2016–2017 but significantly increased the consumption of soil water. This indicates that lower precipitation and irrigation will increase the consumption of soil water by wheat.

3.2.2. Grain Yield, HI and WUE
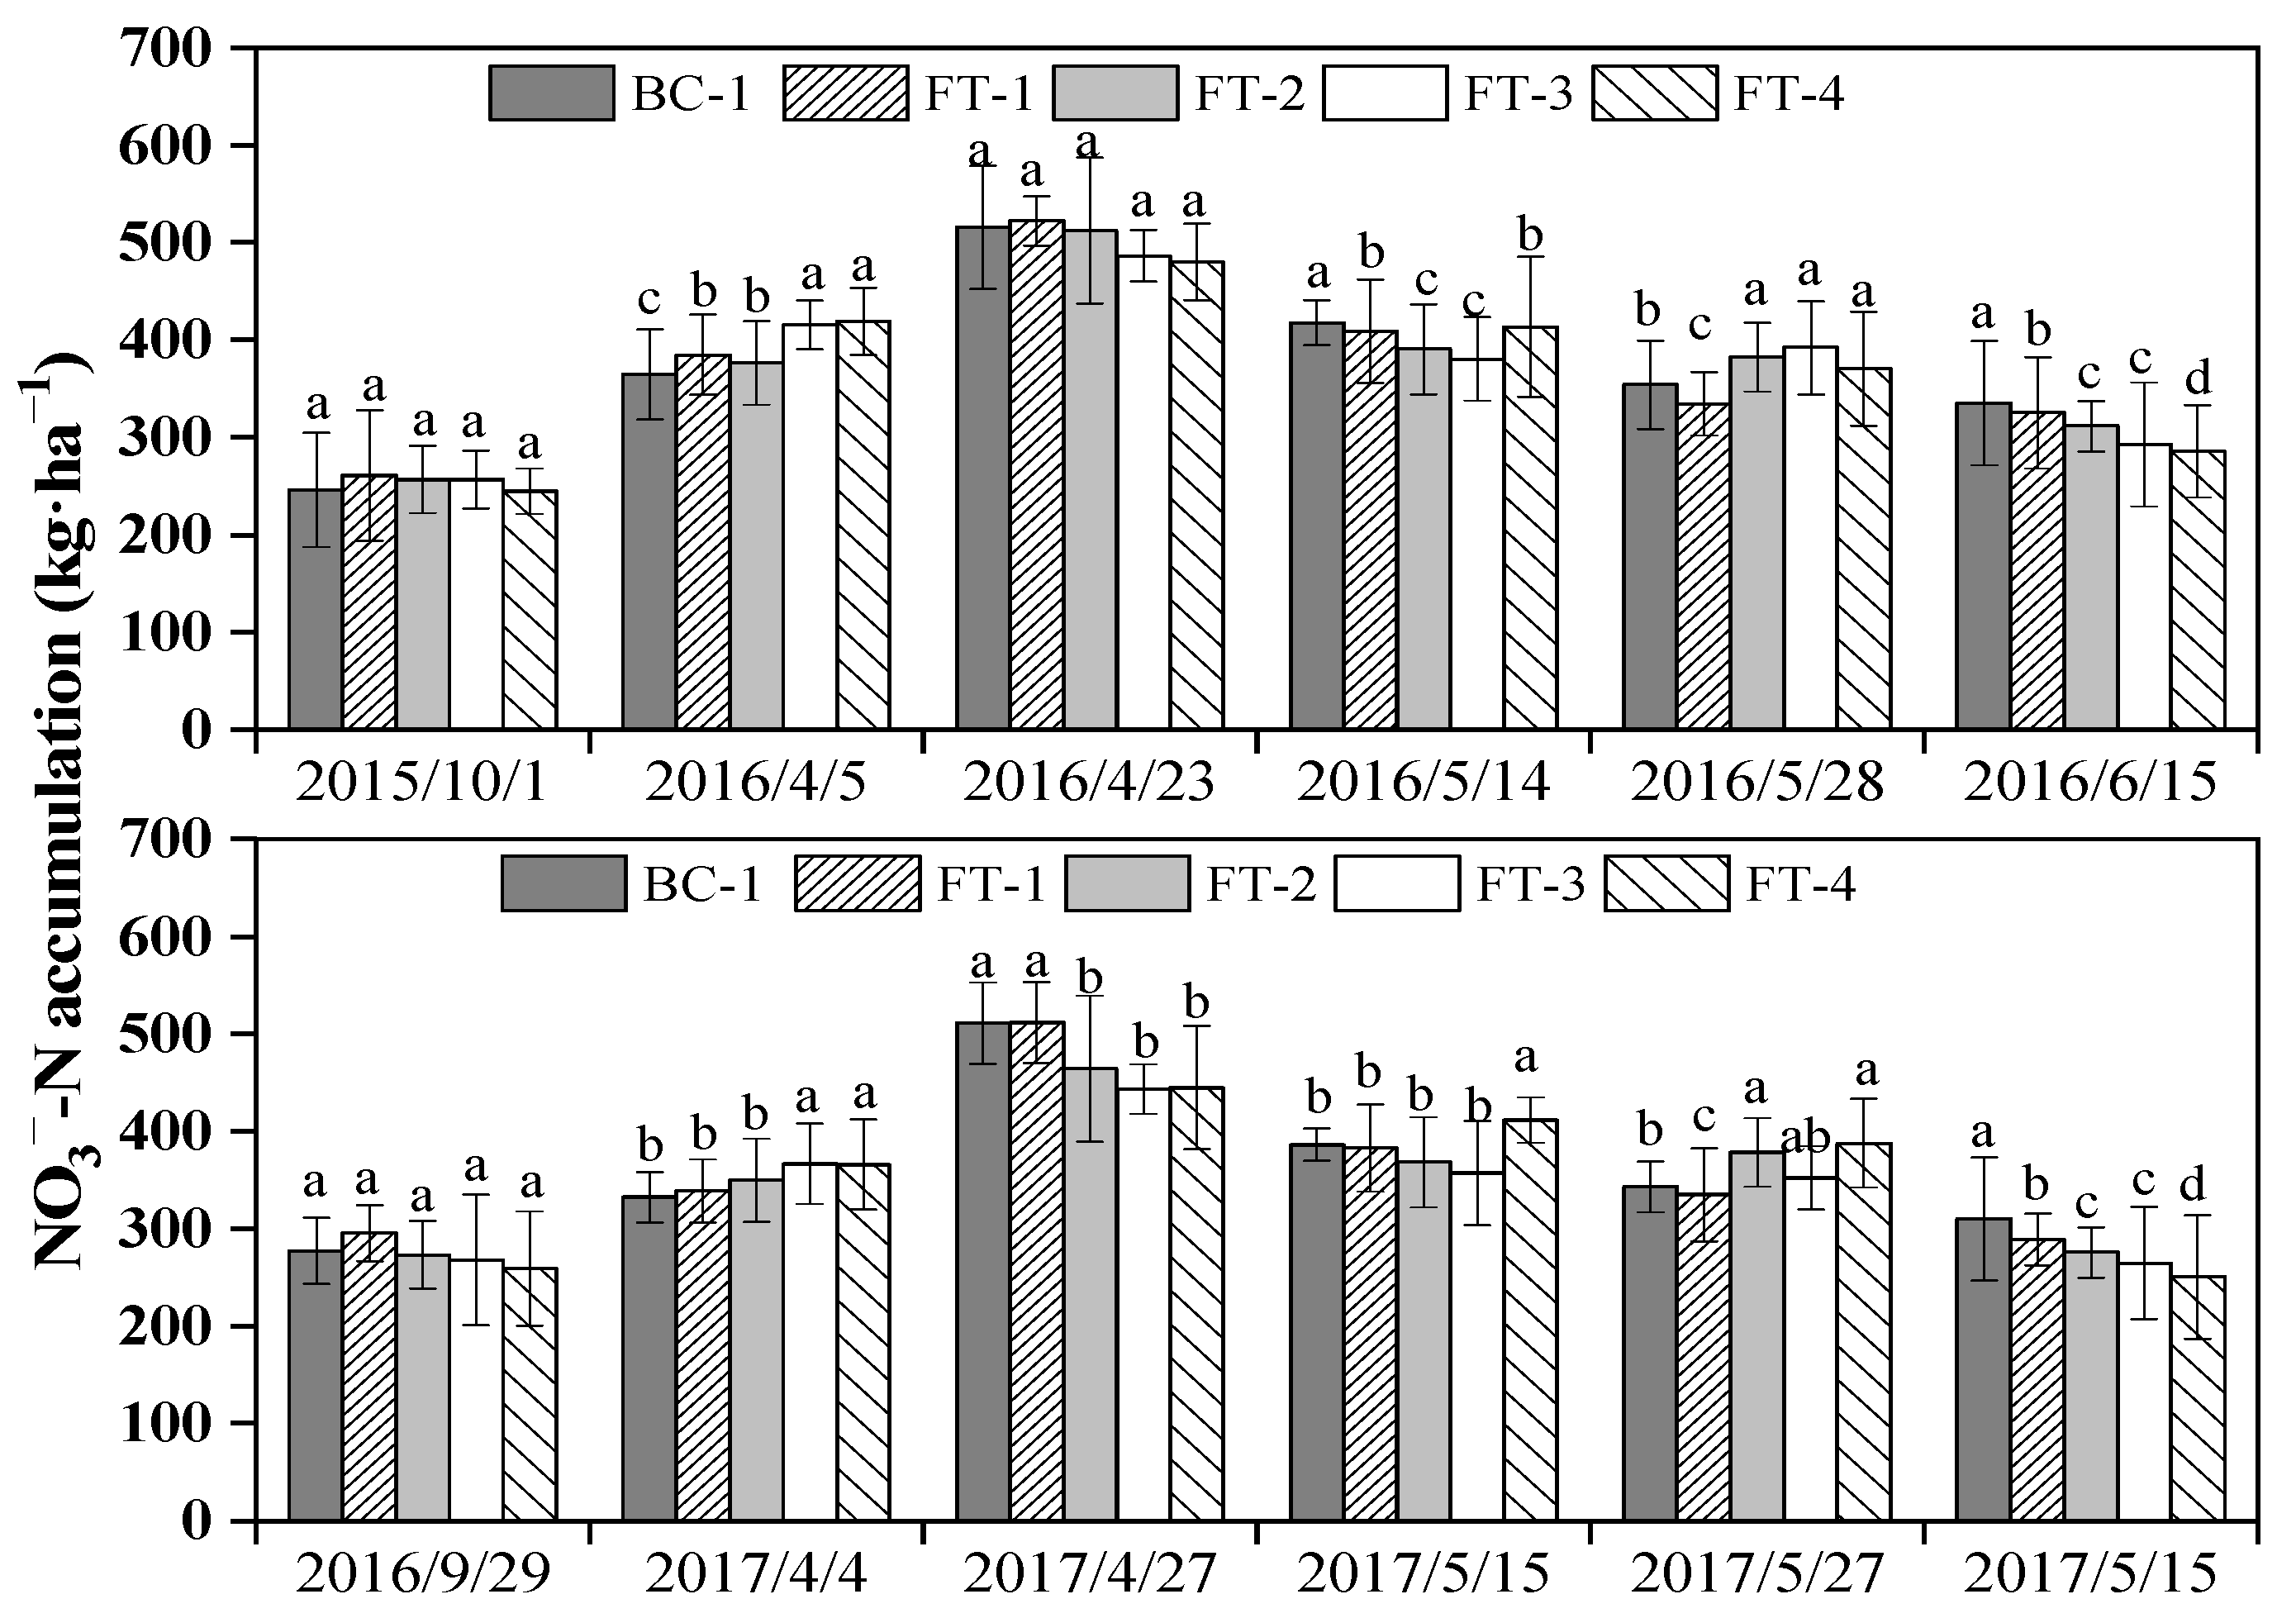
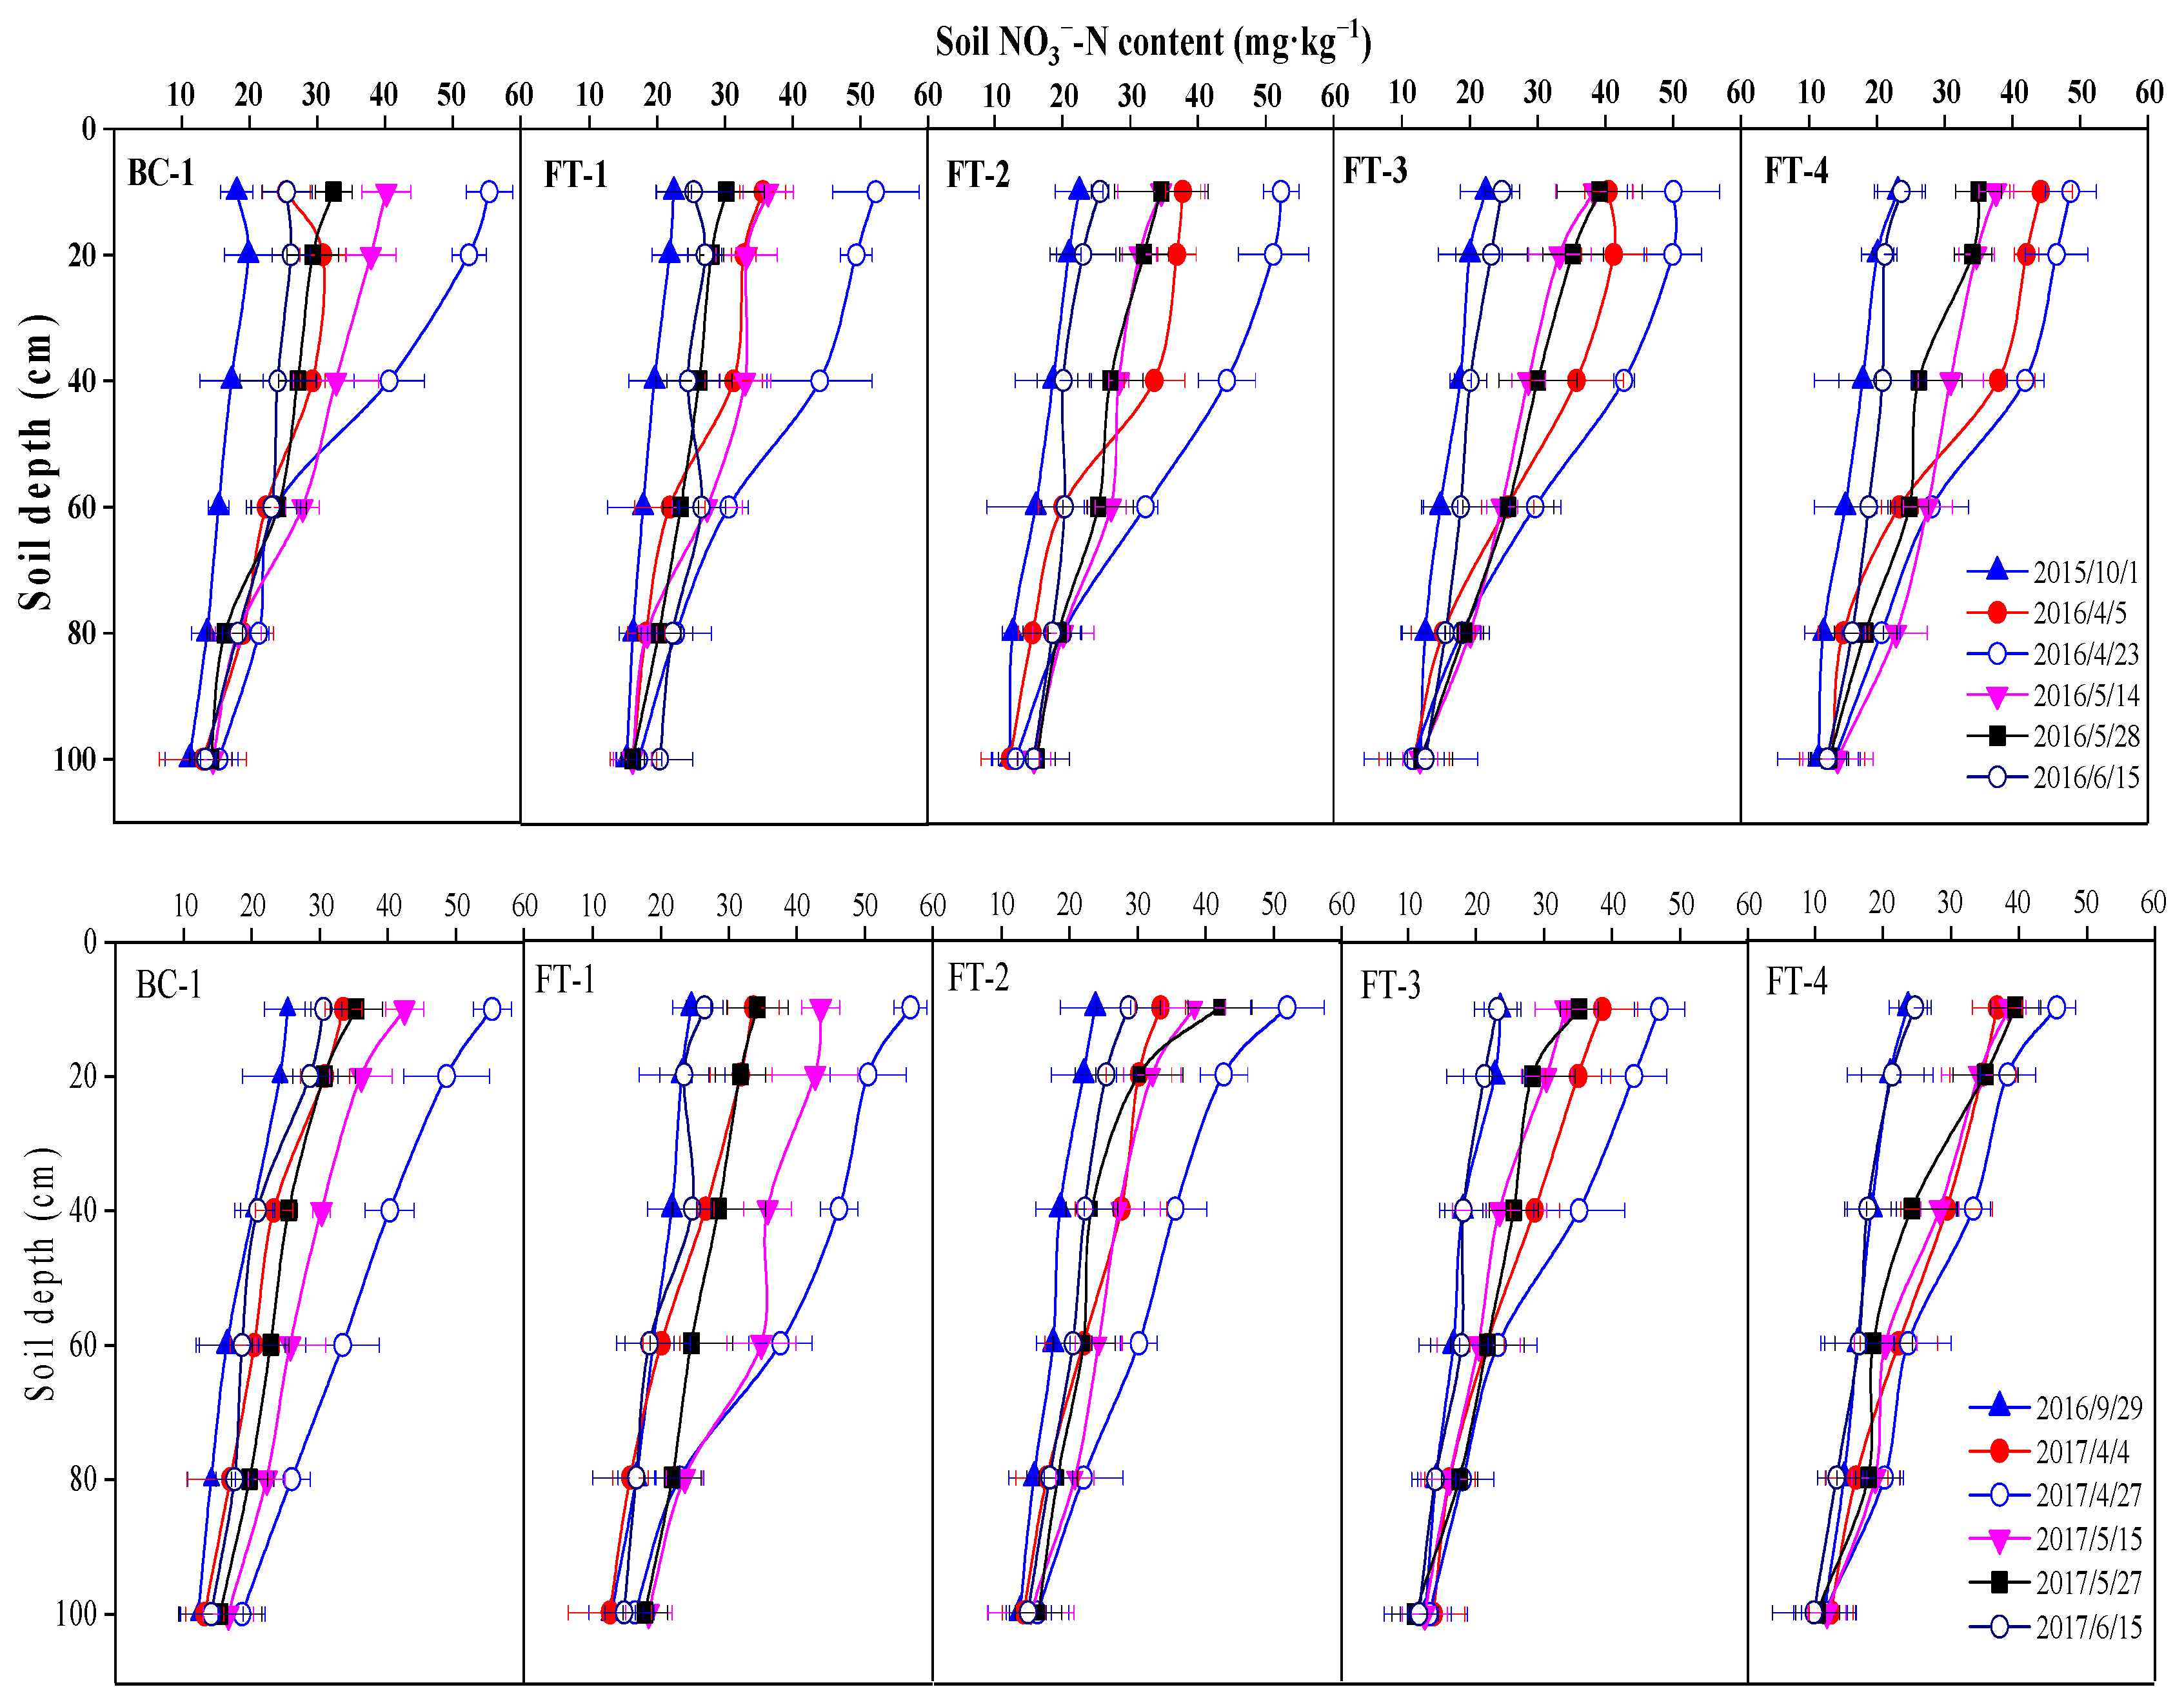
It can be seen that the N fertigation frequencies showed a significant impact on yields in two seasons (Table 3). Compared with the BC-1 treatment, the grain yields of FT-1 treatment increased by 4.7% in the 2015–2016 season. Meanwhile, the grain yields of the FT-1 treatment increased by 8.0% compared with BC-1 treatment in the 2016–2017 season. FT-4 treatment obtained the highest grain yield among fertigation frequency treatments, with average values of 9092.3 and 9214.5 kg ha−1 in the 2015–2016 and 2016–2017 growing seasons, respectively. However, no significant differences were observed between FT-4 and FT-3 treatments in 2016–2017, but the grain yield of FT-4 was 4.6% higher than FT-3. The average grain yield of FT-4 was 17.3% and 17.4% higher than FT-2 and FT-1 in 2015–2016, and FT-4 was 9.8% and 11.7% higher than FT-2 and FT-1 in 2016–2017, respectively. It can be seen that the corresponding HI of the FT-4 was significantly higher than the FT-2 and FT-1 treatments in 2015–2016, but there was no significant difference among treatments in 2016–2017. The WUE was significantly affected by fertigation frequencies in two years. Compared with BC-1, the WUE of FT-1 increased by 9.2% in 2015–2016 and 10.1% in 2016–2017, respectively. The WUE value increased as the fertigation frequency increased, while FT-4 obtained the highest WUE, followed by FT-3, FT-2 and FT-1 in two years of the experiment. The WUE of both FT-3 and FT-4 exceeded 2.0 kg m−3, higher than the average WUE value of 4.1%, 9.3% in 2015–2016 and 2.0%, 7.6% in 2016–2017, respectively. These findings indicated that the FT-1 treatment can improve grain yield, HI and WUE compared with BC-1 treatment in two growing seasons. The grain yield and WUE both increased with increasing topdressing frequency from one to four applications at the same two applications of N.

3.3. Soil NO3N Accumulation and Spatial Distribution

The pattern of variation in soil NO3N accumulation was similar in the 2015–2016 and 2016–2017 growing seasons (Figure 4). During the same growth stage, the soil NO3N accumulation in 2015–2016 was higher than in 2016–2017 for its higher total N application. However, no significant difference was found in the soil NO3N accumulation values before sowing among different treatments in two years. The FT-4 and FT-3 treatments obtained significantly higher soil NO3N accumulation at the regreening stage, which was due to 69 kg ha−1 of N topdressing applied in this growth period in 2015–2016 and 2016–2017. The soil NO3N accumulation reached its maximum at the jointing stage, and all treatments were higher than 400 kg ha−1 in the two growing seasons. In addition, the soil NO3N accumulation of the FT-4 and FT-3 treatments was significantly lower than other treatments in the jointing stage. Compared with those in the jointing stage, the soil NO3N accumulation among all treatments decreased significantly during the anthesis stage, while BC-1 and FT-4 obtained the most considerable accumulation amount. The soil NO3N accumulation of BC-1 treatment at the filling stage was lower than FT-2, FT-3 and FT-4 treatments in the two growing seasons. However, the soil NO3N accumulation of BC-1 treatment was significantly highest at the harvest stage, followed by FT-1, FT-2, FT-3 and FT-4 treatments. The results indicated that FT-4 treatment exerted a beneficial effect on the soil NO3N absorption of wheat in improving the soil NO3N accumulation to match the N requirements during crop growth stages. Additionally, the BC-1 treatment resulted in higher soil NO3N accumulation at the harvest stage in two growing seasons.
Significant differences were found in the soil NO3-N content in the 0–100 cm soil layer at the different wheat growing stages among various treatments in the 2015–2016 and 2016–2017 growing seasons (Figure 5). The initial soil NO3-N content corresponding to different treatments was the same before sowing in the same year, while the initial NO3-N content in 2016–2017 was higher than that in 2015–2016 due to higher soil NO3-N accumulation in the previous year, with an average increase of 4.7 mg kg−1. Soil NO3-N content increased gradually after sowing but was mainly concentrated in the 0–60 cm soil layer. The BC-1 and FT-1 treatments in two years had significantly higher soil NO3-N content in the maturity stage than the sowing stage, indicating that soil NO3-N content produced a larger surplus in the soil. In 2015–2016, all treatments had higher soil NO3-N content at the maturity stage than at the sowing stage; however, the difference in soil NO3-N content at the maturity stage compared to the sowing stage differed among different treatments in 2016–2017. The soil NO3-N contents in each layer of FT-3 and FT-4 treatments at the maturity stage were basically equal to that at the sowing stage, and the average soil NO3-N content in the 0–40 cm soil layer was reduced by 1.7 and 1.3 mg kg−1, respectively in 2016–2017. The results showed that three to four times fertigation can reduce soil NO3-N content at the maturity stage, and the N application rates in 2016–2017 can maintain the balance of soil NO3-N under this soil condition.

3.4. Nitrogen Use Efficiency

There were no significant differences in NUtE among different treatments in two years (Table 4). Compared with BC-1, the NUtE of FT-1 increased by 3.0% in 2015–2016 and decreased by 1.4% in 2016–2017. The NUtE of FT-4 was greater than other fertigation treatments, with 4.3% higher than average values in 2015–2016. While in 2016–2017, the NUtE of FT-4 was equal to that of FT-1, 2.3% higher than that of FT-2 and FT-3. The PFPN was significantly affected by the N fertigation frequency in two years (Table 4). The PFPN of FT-1 increased by 4.7% in 2015–2016 and 8.3% in 2016–2017 when compared with that of BC-1 treatment. The highest PFPN was achieved in FT-4 among fertigation treatments, with average values of 28.9 kg kg−1 in 2015–2016 and 33.6 kg kg−1 in 2016–2017, respectively. The NHI under BC-1 and FT-1 treatments were similar in two years. Compared with BC-1, the NHI of FT-1 increased by 3.2% in 2015–2016 and was equal in 2016–2017. The FT-4 treatment obtained the highest NHI values in the two-year field study, with average values of 0.77 kg kg−1 in 2015–2016 and 0.71 kg kg−1 in 2016–2017, respectively. These results indicated that FT-1 can improve PFPN compared with BC-1. In general, four times fertigation obtained the highest PFPN and NHI in this study.

4. Discussion

In the NCP, farmers often applied excessive fertilizers to achieve high yields, which results in serious resource waste and environmental risk [22]. However, manual surface broadcasting makes it difficult to ensure the uniformity of fertilization in the field and also makes the cost of fertilizer application high [23]. At the same time, one-time topdressing cannot ensure the nutrient needs of wheat during the late growing stages. Many researchers have reported that split N application according to the nutrient requirements of crop growth stages can further increase yield and reduce the N losses than traditional pre-plant N application [6,24,25]. In this study, two years of experimental results showed that topdressing with 69, 69, 34 and 34 kg/ha of N under the fertigation conditions at the regreening, jointing, anthesis and filling stages (i.e., treatment FT-4) can increase the grain yield, WUE and NUE. There were some differences in the grain yield, WUE, PFPN and NHI of FT-4 between the two growing seasons, but overall, this treatment showed the best results of all treatments in the two years. Compared with the FT-1, FT-4 treatment exceeded 9092 kg ha−1, and the yield increased by 11.7–17.4%, the WUE increased by 8.1–11.1% and the PFPN increased by 11.6–17.5%.

4.1. Grain Yield and WUE in Response to N Fertigation Frequency

Compared with the farmer’s practice (BC-1), the average grain yield was increased by 6.4%, and WUE was increased by 9.7% when using the center pivot fertigation method (FT-1) in two years. The higher grain yield of the fertigation method achieved in this study might be the N applied in solution form and immediately available to the crop roots compared with the farmer’s practice [10,26]. In addition, the high fertigation uniformity might promote the hydrolysis speed of urea [6]. Li et al. (2021) found that the wheat yield of 9435 kg ha−1 could be achieved with 150 mm of irrigation and 240 kg ha−1 under fertigation using micro-sprinkling which was consistent with this study [7]. The results in this study showed that optimizing the fertilizer method can further increase the grain yield and WUE, which is in agreement with previous studies that the combined application of irrigation and N through fertigation was an effective method to maintain higher crop yield while reducing environmental risks [13]. Studies have confirmed that the proper amount of fertilization can effectively regulate the water use process and improve WUE [27,28]. Fertilizer not only promotes increasing yield but more importantly, interacts with soil moisture. In addition, suitable soil moisture can promote the transformation and absorption of fertilizer and improve the utilization rate of fertilizer [29,30]. In this study, the yield and WUE did not increase significantly when the fertigation frequency increased from one to two times, but when the frequencies were increased to three or four times, the yield and WUE increased substantially. The reason might be that three to four times of topdressing meets the absorption of N according to wheat requirements at the main growth stage, and the integration of water and fertilizer promotes the mutual absorption of water and fertilizer [12,31]. It is worth noting that the yield increased with the increase of N splits may also be related to low soil fertility, which agrees with the previous research in the same region [17].

4.2. Soil NO3-N Accumulation and Distribution in Response to N Fertigation Frequency

Research has shown that fertigation can decrease N losses and reduce transformable N to N2O or NO [32,33]. Research showed that micro-irrigation ensured the supply of nitrogen in the upper soil at the critical growth stages, and increased absorption and utilization of stored nitrogen in the soil [34]. In this study, the apparent seasonal surplus of soil NO3-N of BC-1 was 2.8% higher than that of FT-1 in 2015–2016 and was 2.7% in 2016–2017 (Figure 4), which was in agreement with previous findings that fertigation method can promote N absorption compared with surface broadcasting method [34,35]. In addition, the average soil NO3-N content of BC-1 in deep soil (60–100 cm) was higher than in other treatments in two years, which may have been due to the non-uniformity application of fertilizer reducing the absorption of N by surface roots [6]. This also means that part of soil NO3-N might risk serious leakage by surface broadcasting and border irrigation methods [36]. The soil NO3-N accumulation of FT-4 at the maturity stage was significantly lower than that of other fertigation applications, especially that in FT-1 treatment in two years (Figure 4). Meanwhile, the soil NO3-N content of FT-4 was slightly higher than that at the sowing stage in 2015–2016 and the soil NO3-N content of FT-4 was slightly lower than that at the sowing stage in 2016–2017 (Figure 5). This showed that the N application rates in 2016–2017 can achieve more efficient NO3-N utilization. In this study, the soil NO3-N accumulation amount and the distribution of soil NO3-N in FT-4 showed that a more frequent application of dilute N can significantly improve soil N distribution and promote crop nitrogen absorption, which was consistent with previous research [16,37].

4.3. N Utilization in Response to N Fertigation Frequency

Traditional fertilizer management often uses a one-time application of excessive fertilizer, which increases the volatilization, leaching and decomposition of N, thereby leading to a lower NUE [34,36]. Li et al. (2018) found that micro-irrigation improved NUE by 7.1–16.5% compared with traditional flood irrigation [34]. Fertigation by center pivot can realize the application of smaller amounts of water and fertilizer with more frequent topdressing, and N fertilizer can be applied at critical growth periods [14]. Thus, N application rates may be significantly reduced in wheat fields and the fertilizer leaching and residual can be much less, compared to common farmers’ practice [5,38]. The present study showed that the grain yield significantly increased with the increase of N fertigation frequency. However, there was no significant difference in NUtE among N fertigation frequencies, which was due to NT decreasing with the increase of N application frequency. Grain yield was a significant contributing factor in determining the PFPN, so the FFPN increased with the increase in N application frequency in this study. Besides N frequency, the N application rate was 40 kg ha−1 higher in the 2015–2016 growing season than in 2016–2017, resulting in higher soil NO3-N content in 2015–2016 among all treatments throughout the growing period. However, the average grain yield in 2016–2017 was higher than that in 2015–2016, making a lower NUE in 2015–2016. In our two-year study, the N application rate was reduced from 315 to 275 kg ha−1, the average yield increased by 4.6%, and the PFPN increased by 19.8%. This result showed that the N application rate could be further optimized under the condition that the yield exceeded 9000 kg ha−1, which was corresponding to the results of other studies [7].
Overall, the results of the two-year experiment indicated that N application by fertigation method using center pivot more frequently and appropriate N application (i.e., treatments FT-3 and FT-4) can realize high grain yield and high resource use efficiency. However, further studies are required to optimize the N application threshold under more frequent fertigation for winter wheat in this region.

5. Conclusions

The air temperature, precipitation and wind speed after regreening stage in the NCP provided favorable meteorological conditions for the application of fertigation technology using center-pivot irrigation system. Optimal fertigation frequencies (FT-4) significantly increased the grain yield, WUE, PFPN and NHI of winter wheat by 11.7–17.4%, 8.1–11.1%, 11.6–17.5% and 7.6–20.3%, respectively, compared with one-time topdressing (FT-1) in two years. Meanwhile, the grain yield, WUE and NHI were significantly improved by the fertigation method (FT-1) under the same N application rate, compared with the farmer’s practice (BC-1). Three to four times fertigation made more soil NO3-N concentrated in the upper soil layer (0–40 cm) at the anthesis and filling stages. The results from the two growing seasons indicated that topdressing N split 3–4 times, which means that approximately 16.7% of topdressing N applied in anthesis and filling stages, respectively by center pivot fertigation method was recommended for the winter wheat in the NCP especially for large-scale farms.

Author Contributions

Conceptualization, D.C., M.R.S. and H.Y.; Methodology, Y.Z. and H.T.; Software, M.S.; Formal analysis, H.Y.; Investigation, D.C., Y.Z. and M.S.; Writing—original draft, D.C.; Writing—review & editing, D.C., M.R.S. and Y.Z.; Project administration, H.Y.; Funding acquisition, H.T. and H.Y. All authors have read and agreed to the published version of the manuscript.

Funding

This research was funded by the Key Research and Development Program of Hebei Province (Grant No. 21327002D, 20327003D), the National Key Research and Development Program of China (Grant No. 2017YFD0201502) and the National Natural Science Foundation of China (Grant No. 51939005).

Data Availability Statement

The dataset for this study are available from the corresponding author upon reasonable request.

Acknowledgments

The authors are greatly indebted to the Key Research and Development Program of Hebei Province (Grant No. 21327002D, 20327003D), the National Key Research and Development Program of China (Grant No. 2017YFD0201502) and the National Natural Science Foundation of China (Grant No. 51939005).

Conflicts of Interest

The authors declare no conflict of interest.

References

  1. China Statistical Yearbook; China Statistics Press: Beijing, China, 2020. (In Chinese)
  2. Zhu, Z.; Chen, D. Nitrogen fertilizer use in China-Contributions to food production, impacts on the environment and best management strategies. Nutr. Cycl. Agroecosystems 2002, 63, 117–127. [Google Scholar] [CrossRef]
  3. Ma, Q.; Yu, W.-T.; Jiang, C.-M.; Zhou, H.; Xu, Y.-G. The influences of mineral fertilization and crop sequence on sustainability of corn production in northeastern China. Agric. Ecosyst. Environ. 2012, 158, 110–117. [Google Scholar] [CrossRef]
  4. Wang, H.; Zhang, Y.; Chen, A.; Liu, H.; Zhai, L.; Lei, B.; Ren, T. An optimal regional nitrogen application threshold for wheat in the North China Plain considering yield and environmental effects. Field Crops Res. 2017, 207, 52–61. [Google Scholar] [CrossRef]
  5. Hartmann, T.E.; Yue, S.; Schulz, R.; He, X.; Chen, X.; Zhang, F.; Müller, T. Yield and N use efficiency of a maize-wheat cropping system as affected by different fertilizer management strategies in a farmer’s field of the North China Plain. Field Crops Res. 2015, 174, 30–39. [Google Scholar] [CrossRef]
  6. Li, M.; Wang, Y.; Adeli, A.; Yan, H. Effects of application methods and urea rates on ammonia volatilization, yields and fine root biomass of alfalfa. Field Crops Res. 2018, 218, 115–125. [Google Scholar] [CrossRef]
  7. Li, J.-P.; Zhang, Z.; Yao, C.-S.; Liu, Y.; Wang, Z.-M.; Fang, B.-T.; Zhang, Y.-H. Improving winter wheat grain yield and water-/nitrogen-use efficiency by optimizing the micro-sprinkling irrigation amount and nitrogen application rate. J. Integr. Agric. 2021, 20, 606–621. [Google Scholar] [CrossRef]
  8. Hartz, T.; Hochmuth, G. Fertility Management of Drip-irrigated Vegetables. Horttechnology 1996, 6, 168–172. [Google Scholar] [CrossRef]
  9. Zhang, Y.; Wang, J.; Gong, S.; Xu, D.; Sui, J. Nitrogen fertigation effect on photosynthesis, grain yield and water use efficiency of winter wheat. Agric. Water Manag. 2017, 179, 277–287. [Google Scholar] [CrossRef]
  10. Sayed, M.A.; Bedaiwy, M.A.N. Effect of controlled sprinkler chemigation on wheat crop in a sandy soil. Soil Water Res. 2011, 6, 61–72. [Google Scholar] [CrossRef]
  11. Farneselli, M.; Benincasa, P.; Tosti, G.; Simonne, E.; Guiducci, M.; Tei, F. High fertigation frequency improves nitrogen uptake and crop performance in processing tomato grown with high nitrogen and water supply. Agric. Water Manag. 2015, 154, 52–58. [Google Scholar] [CrossRef]
  12. Kennedy, T.L.; Suddick, E.C.; Six, J. Reduced nitrous oxide emissions and increased yields in California tomato cropping systems under drip irrigation and fertigation. Agric. Ecosyst. Environ. 2013, 170, 16–27. [Google Scholar] [CrossRef]
  13. Alva, A.K.; Mattos, D.; Quaggio, J.A. Advances in Nitrogen Fertigation of Citrus. J. Crop. Improv. 2008, 22, 121–146. [Google Scholar] [CrossRef]
  14. Yan, H.; Hui, X.; Li, M.; Xu, Y. Development in sprinkler irrigation technology in China. Irrig. Drain. 2020, 69, 75–87. [Google Scholar] [CrossRef]
  15. Li, H.; Hao, W.; Liu, Q.; Mao, L.; Nangia, V.; Guo, R.; Mei, X. Developing nitrogen management strategies under drip fertigation for wheat and maize production in the North China Plain based on a 3-year field experiment. J. Plant Nutr. Soil Sci. 2019, 182, 335–346. [Google Scholar] [CrossRef]
  16. Li, J.; Wang, Y.; Zhang, M.; Liu, Y.; Xu, X.; Lin, G.; Wang, Z.; Yang, Y.; Zhang, Y. Optimized micro-sprinkling irrigation scheduling improves grain yield by increasing the uptake and utilization of water and nitrogen during grain filling in winter wheat. Agric. Water Manag. 2019, 211, 59–69. [Google Scholar] [CrossRef]
  17. Zhao, W.; Shan, Z.; Li, J.; Li, Y. Effects of fertigation splits through center pivot on the nitrogen uptake, yield, and nitrogen use efficiency of winter wheat grown in the North China Plain. Agric. Water Manag. 2020, 240, 106291. [Google Scholar] [CrossRef]
  18. Zadoks, J.C.; Chang, T.T.; Konzak, C.F. A decimal code for the growth stages of cereals. Weed Res. 1974, 14, 415–421. [Google Scholar] [CrossRef]
  19. Zhang, X.; Wang, Y.; Sun, H.; Chen, S.; Shao, L. Optimizing the yield of winter wheat by regulating water consumption during vegetative and reproductive stages under limited water supply. Irrig. Sci. 2013, 31, 1103–1112. [Google Scholar] [CrossRef]
  20. Dordas, C.A.; Sioulas, C. Dry matter and nitrogen accumulation, partitioning, and retranslocation in safflower (Carthamus tinctorius L.) as affected by nitrogen fertilization. Field Crops Res. 2009, 110, 35–43. [Google Scholar] [CrossRef]
  21. Ruisi, P.; Saia, S.; Badagliacca, G.; Amato, G.; Frenda, A.S.; Giambalvo, D.; Di Miceli, G. Long-term effects of no tillage treatment on soil N availability, N uptake, and 15N-fertilizer recovery of durum wheat differ in relation to crop sequence. Field Crops Res. 2016, 189, 51–58. [Google Scholar] [CrossRef]
  22. Ju, X.-T.; Xing, G.-X.; Chen, X.-P.; Zhang, S.-L.; Zhang, L.-J.; Liu, X.-J.; Cui, Z.-L.; Yin, B.; Christie, P.; Zhu, Z.-L.; et al. Reducing environmental risk by improving N management in intensive Chinese agricultural systems. Proc. Natl. Acad. Sci. USA 2009, 106, 3041–3046. [Google Scholar] [CrossRef]
  23. Zhang, Y.; Wang, H.; Lei, Q.; Luo, J.; Lindsey, S.; Zhang, J.; Zhai, L.; Wu, S.; Zhang, J.; Liu, X.; et al. Optimizing the nitrogen application rate for maize and wheat based on yield and environment on the Northern China Plain. Sci. Total. Environ. 2018, 618, 1173–1183. [Google Scholar] [CrossRef] [PubMed]
  24. Raun, W.R.; Solie, J.B.; Stone, M.L. Independence of yield potential and crop nitrogen response. Precis. Agric. 2011, 12, 508–518. [Google Scholar] [CrossRef]
  25. Mahama, G.Y.; Prasad, P.V.V.; Roozeboom, K.L.; Nippert, J.B.; Rice, C.W. Response of maize to cover crops, fertilizer nitrogen rates, and economic return. Agron. J. 2016, 108, 17–31. [Google Scholar] [CrossRef]
  26. Stevens, W.B.; Evans, R.G.; Jabro, J.D.; Iversen, W.M. Nitrogen availability for sugar beet affected by tillage system and sprinkler irrigation method. Agron. J. 2010, 102, 1745–1752. [Google Scholar] [CrossRef]
  27. Xie, Y.; Li, L.; Hong, J.; Wang, H.; Zhang, L. Effects of nitrogen application and irrigation on grain yield, water and nitrogen utilizations of summer maize. Plant Nutr. Fertil. Sci. 2012, 18, 1354–1361. (In Chinese) [Google Scholar] [CrossRef]
  28. Wei, T.; Chai, Q.; Wang, W.; Wang, J. Effects of coupling of irrigation and nitrogen application as well as planting density on photosynthesis and dry matter accumulation characteristics of maize in oasis irrigated areas. Sci. Agric. Sin. 2019, 52, 428–444. (In Chinese) [Google Scholar] [CrossRef]
  29. Cao, C.; Xiu, L. Effect of water stress and nitrogen deficiency on some physiological characteristics and wheat yield at the jointing stage. Chin. J. Soil Sci. 2003, 36, 505–509. (In Chinese) [Google Scholar] [CrossRef]
  30. Ning, D.; Qin, A.; Liu, Z.; Zhang, J.; Liu, Z.; Zhao, B.; Xiao, J. Effects of irrigation and fertilization levels on grain yield and water and N use efficiency of drip-fertigation summer maize in the North China Plain. J. Irrig. Drain. 2019, 38, 28–35. (In Chinese) [Google Scholar]
  31. Zhai, L.-C.; Lü, L.-H.; Dong, Z.-Q.; Zhang, L.-H.; Zhang, J.-T.; Jia, X.-L.; Zhang, Z.-B. The water-saving potential of using micro-sprinkling irrigation for winter wheat production on the North China Plain. J. Integr. Agric. 2021, 20, 1687–1700. [Google Scholar] [CrossRef]
  32. Badr, M.A.; El-Tohamy, W.A.; Zaghloul, A.M. Yield and water use efficiency of potato grown under different irrigation and nitrogen levels in an arid region. Agric. Water Manag. 2012, 110, 9–15. [Google Scholar] [CrossRef]
  33. Koocheki, A.; Mahallati, M.N.; Moradi, R.; Mansouri, H. Optimizing water, nitrogen and crop density in canola cultivation using response surface methodology and central composite design. Soil Sci. Plant Nutr. 2014, 60, 286–298. [Google Scholar] [CrossRef]
  34. Li, J.; Xu, X.; Lin, G.; Wang, Y.; Liu, Y.; Zhang, M.; Zhou, J.; Wang, Z.; Zhang, Y. Micro-irrigation improves grain yield and resource use efficiency by co-locating the roots and N-fertilizer distribution of winter wheat in the North China Plain. Sci. Total Environ. 2018, 643, 367–377. [Google Scholar] [CrossRef] [PubMed]
  35. Tian, D.; Zhang, Y.; Mu, Y.; Zhou, Y.; Zhang, C.; Liu, J. The effect of drip irrigation and drip fertigation on N2O and NO emissions, water saving and grain yields in a maize field in the North China Plain. Sci. Total Environ. 2017, 575, 1034–1040. [Google Scholar] [CrossRef] [PubMed]
  36. Gheysari, M.; Mirlatifi, S.M.; Homaee, M.; Asadi, M.E.; Hoogenboom, G. Nitrate leaching in a silage maize field under different irrigation and nitrogen fertilizer rates. Agric. Water Manag. 2009, 96, 946–954. [Google Scholar] [CrossRef]
  37. Scholberg, J.M.S.; Parsons, L.R.; Wheaton, T.A.; McNeal, B.L.; Morgan, K.T. Soil temperature, nitrogen concentration, and residence time affect nitrogen uptake efficiency in citrus. J. Environ. Qual. 2002, 31, 759–768. [Google Scholar] [CrossRef]
  38. Sui, J.; Wang, J.; Gong, S.; Xu, D.; Zhang, Y. Effect of nitrogen and irrigation application on water movement and nitrogen transport for a wheat crop under drip irrigation in the North China Plain. Water 2015, 7, 6651–6672. [Google Scholar] [CrossRef]
Figure 1. The location map of the experimental site.
Water 15 01932 g001
Figure 2. Air temperature, wind speed (a) and precipitation (b) during the wheat-growing seasons in 2015–2017.
Water 15 01932 g002
Figure 3. Irrigation, precipitation and soil water consumption during the wheat growing seasons in 2015–2017.
Water 15 01932 g003
Figure 4. Effects of different N applications on NO3-N accumulation amount at various growth stages during the wheat-growing seasons in 2015–2017. The values are the mean ± standard error (n = 3). The treatments with different lowercase letters indicate statistical significance among treatments in each year at p < 0.05 according to the LSD test.
Water 15 01932 g004
Figure 5. Effect of different treatments on soil NO3-N content at critical growth stages during the wheat-growing seasons in 2015–2017.
Water 15 01932 g005
Table 1. Soil physicochemical properties at experimental site.
Depth
(cm)
Bulk
Density
(g cm−3)
Field
Capacity
(cm3 cm−3)
NH4+-N
Content
(mg kg−1)
NO3-N
Content
(mg kg−1)
Available Phosphorus (mg kg−1)Available Potassium
(mg kg−1)
pH
0–101.450.315.7216.1835.50169.318.13
10–201.450.314.3917.9945.58168.488.17
20–401.640.303.257.9428.64164.848.25
40–601.640.302.805.6316.14151.548.29
60–801.570.322.266.4616.54127.968.35
80–1001.460.262.166.3514.52116.838.32
Table 2. N rates and fertigation frequencies during the wheat growing seasons in 2015–2017.
YearsTreatmentsN FrequencyN Rate of Different Growing Stages/kg ha−1
Base
Fertilizer
RegreeningJointingAnthesisFilling
2015–2016BC-11108/207//
FT-11108/207//
FT-22108/138/69
FT-3310869103.5/34.5
FT-44108696934.534.5
2016–2017BC-1168/207//
FT-1168/207//
FT-2268/138/69
FT-336869103.5/34.5
FT-4468696934.534.5
Note: BC-1, border irrigation and surface broadcasting; FT-1, FT-2, FT-3 and FT-4, irrigation and fertigation by the center pivot irrigation system.
Table 3. Effects of different treatments on the average grain yield, HI and WUE during the wheat-growing seasons in 2015–2017.
YearsTreatmentsYield
(kg ha−1)
HIWUE
(kg m−3)
2015–2016BC-17401.6 ± 150.6 d0.38 ± 0.01 b1.74 ± 0.31 e
FT-17746.7 ± 151.4 cd0.39 ± 0.01 b1.90 ± 0.31 cd
FT-27748.1 ± 238.5 cd0.38 ± 0.02 b1.91 ± 0.68 cd
FT-38446.1 ± 449.3 b0.42 ± 0.03 ab2.01 ± 1.51 ab
FT-49092.3 ± 450.8 a0.45 ± 0.02 a2.11 ± 0.92 ab
2016–2017BC-17639.7 ± 198.1 d0.39 ± 0.01 b1.79 ± 0.03 de
FT-18249.1 ± 58.3 bc0.40 ± 0.01 b1.97 ± 0.01 bc
FT-28389.6 ± 308.3 b0.40 ± 0.02 b1.99 ± 0.09 bc
FT-38811.0 ± 251.4 ab0.40 ± 0.01 b2.02 ± 0.04 ab
FT-49214.5 ± 70.1 a0.41 ± 0.00 b2.13 ± 0.01 a
2015–2017ANOVA*NS*
Notes: The values are the mean ± standard error (n = 3). The treatments with different lowercase letters indicate statistical significance among treatments in each year at p < 0.05 according to the LSD test. NS = not significant at a probability level of p < 0.05, * = significant at a probability level of p < 0.05.
Table 4. Effects of different treatments on NUtE, PFPN and NHI during the wheat growing seasons in 2015–2017.
YearsTreatmentsNUtE
(kg kg−1)
PFPN
(kg kg−1)
NHI
(kg kg−1)
2015–2016BC-127.0 ± 0.3 a23.5 ± 0.5 f0.62 ± 0.05 b
FT-127.8 ± 1.0 a24.6 ± 0.5 f0.64 ± 0.05 b
FT-227.6 ± 2.3 a24.6 ± 0.8 f0.63 ± 0.04 b
FT-328.4 ± 2.1 a26.8 ± 1.4 e0.71 ± 0.06 ab
FT-429.2 ± 0.9 a28.9 ± 1.4 cd0.77 ± 0.01 a
2016–2017BC-127.6 ± 1.4 a27.8 ± 0.7 de0.66 ± 0.01 ab
FT-127.2 ± 1.6 a30.1 ± 0.2 c0.66 ± 0.02 ab
FT-226.6 ± 1.2 a30.6 ± 1.1 bc0.67 ± 0.02 ab
FT-326.6 ± 0.3 a32.1 ± 0.9 ab0.67 ± 0.02 ab
FT-427.2 ± 1.1 a33.6 ± 0.3 a0.71 ± 0.01 ab
2015–2017ANOVANS*NS
Notes: The values are the mean ± standard error (n = 3). The treatments with different lowercase letters indicate statistical significance among treatments in each year at p < 0.05 according to the LSD test. NS = not significant at a probability level of p < 0.05, * = significant at a probability level of p < 0.05.
Disclaimer/Publisher’s Note: The statements, opinions and data contained in all publications are solely those of the individual author(s) and contributor(s) and not of MDPI and/or the editor(s). MDPI and/or the editor(s) disclaim responsibility for any injury to people or property resulting from any ideas, methods, instructions or products referred to in the content.

