
Evolution of Drought Trends under Climate Change Scenarios in Karst Basin
by
 ,
,
Chongxun Mo
1,2,3,4,
Peiyu Tang
1,2,3,4,
Keke Huang
1,2,3,4,*,
Xingbi Lei
1,2,3,4,
Shufeng Lai
1,2,3,4,
Juan Deng
1,2,3,4,
Mengxiang Bao
1,2,3,4,
Guikai Sun
1,2,3,4 and
Zhenxiang Xing
5 1
Key Laboratory of Disaster Prevention and Structural Safety of the Ministry of Education, Guangxi University, Nanning 530000, China
2
College of Architecture and Civil Engineering, Guangxi University, Nanning 530000, China
3
Guangxi Provincial Engineering Research Center of Water Security and Intelligent Control for Karst Region, Guangxi University, Nanning 530000, China
4
Guangxi Key Laboratory of Disaster Prevention and Engineering Safety, Guangxi University, Nanning 530000, China
5
School of Water Conservancy and Civil Engineering, Northeast Agricultural University, Harbin 150000, China
*
Author to whom correspondence should be addressed.
Water 2023, 15(10), 1934; https://doi.org/10.3390/w15101934
Submission received: 4 April 2023
/
Revised: 12 May 2023
/
Accepted: 17 May 2023
/
Published: 20 May 2023
Abstract
:Karst basins have a relatively low capacity for water retention, rendering them very vulnerable to drought hazards. However, karst geo-climatic features are highly spatially heterogeneous, making reliable drought assessment challenging. To account for geo-climatic heterogeneous features and to enhance the reliability of drought assessment, a framework methodology is proposed. Firstly, based on the history of climate (1963–2019) from the Global Climate Model (GCM) and station observations within the Chengbi River karst basin, a multi-station calibration-based automated statistical downscaling (ASD) model is developed, and the Kling–Gupta efficiency (KGE) and Nash–Sutcliffe efficiency (NSE) are selected as performance metrics. After that, future climate (2023–2100) under three GCM scenarios (SSP1-2.6, SSP2-4.5, and SSP5-8.5) are obtained by using the ASD model. Finally, the Standardized Precipitation Evapotranspiration Index (SPEI), calculated by future climate is applied to assess drought conditions. The results indicate that the multi-station calibration-based ASD model has good performance and thus can be used for climate data downscaling in karst areas. Precipitation mainly shows a significant upward trend under all scenarios with the maximum variation (128.22%), while the temperature shows a slow upward trend with the maximum variation (3.44%). The drought condition in the 2040s is still relatively severe. In the 2060s and 2080s, the basin is wetter compared with the historical period. The percentage of drought duration decreases in most areas from the 2040s to the 2080s, demonstrating that the future drought condition is alleviated. From the SSP1-2.6 scenario to the SSP5-8.5 scenario, the trend of drought may also increase.
1. Introduction
Climate change can bring fluctuations in precipitation and temperature, which affect the hydrological cycle and runoff evolution processes [1]. Insufficient precipitation or high temperature may lead to droughts, which are natural disasters with a high frequency, long duration, and wide coverage [2]. For instance, Africa suffered a severe drought in 2019, which caused serious damage to food and water security [3]. The frequency and severity of droughts has increased annually in northern China in recent years, affecting millions of people and causing tens of billions of dollars in economic losses each year [4]. According to data from the U.S. Drought Monitoring Center, since 2000 there have been frequent drought hazards caused by extreme climate change in the southwestern United States, with 68% of the western United States suffering extreme or exceptional drought conditions from July to October 2021 [5]. Therefore, to reduce the risk of severe drought events from climate change, it is of great practical significance to conduct drought assessment [6].
The change projections of climate factors such as precipitation and temperature are prerequisites for drought assessment. The Global Climate Model (GCM) is the main tool for projecting climate factor changes. However, the horizontal resolution of the GCM model is mostly in the range of 100~300 km, which results in an undesirable performance when characterizing complex climatic heterogeneous features. Therefore, it cannot be directly used for the projection of small-scale climate change [7]. To overcome this drawback, downscaling methods have been gradually proposed. These downscaling methods essentially comprise a technology by which information on largescale climate change with regional geographic factors is combined to obtain highly accurate spatial climate information. At present, the main downscaling methods are dynamic downscaling and statistical downscaling [8]. Dynamic downscaling can embed the Regional Climate Model (RCM) into the GCM to obtain accurate regional meteorological information; however, this method is labor intensive and computationally complex. However, the statistical downscaling model is simple and convenient to apply and can correct the large-scale GCM results by establishing statistical relationships through actual observations, thus reducing errors and biases and allowing the relatively accurate acquisition of future climate change in small- and medium-sized regions. Owing to its simplicity and reliability, this study adopted a typical statistical method, the automated statistical downscaling (ASD) model, as a tool for downscaling.
The GCM climate data after downscaling can be used to calculate drought indexes for assessing drought. Some common drought indicators are the self-calibrating Palmer Drought Severity Index (scPDSI) [9], the Standardized Precipitation Index (SPI) [10], the Standardized Precipitation Evapotranspiration Index (SPEI) [11], and the New Drought Index (NDI) [12]. In drought assessment, the scPDSI is sensitive to temperature, but only at time scales of weeks and months. the SPI can reflect multi-temporal and multi-spatial regional drought conditions, but it ignores the influence of temperature on drought trends. In the context of global warming, there will be some errors when using SPI to assess regional drought conditions. However, the SPEI combines the strengths of the two previous indices while considering the effects of both precipitation and temperature, which can better reflect the condition of regional drought. The NDI is calculated using precipitation and temperature and their average and standard deviation. In recent years, scholars have conducted numerous studies in regional drought assessment based on GCM climate data and different drought indexes. For example, Ahmadalipour et al. [13] chose the SPI and SPEI to synthetically assess the drought conditions in the United States from 1950 to 2099, and their results reveal that the frequency and intensity of droughts might increase significantly in the future. Ali et al. [14] projected precipitation and temperature under two Representative Concentration Pathways (RCP 4.5 and RCP 8.5) in Ankara, and then evaluated Ankara’s meteorological drought using the SPI and SPEI, showing that the future drought situation in Turkey might be alleviated. Li et al. [15] analyzed the severity of drought in northwest China using the PDSI under three Shared Socio-Economic Pathways (SSP1-2.6, SSP2-4.5, and SSP5-8.5) from 2015 to 2099. Among these widely used drought indexes, the SPEI considers the influence of both precipitation and temperature on drought. At different time scales, the SPEI can reflect drought conditions under different stages. The 3-month SPEI can reflect the seasonal wet and dry conditions, which can be used for the analysis of agricultural drought conditions, while the 12-month SPEI can reflect the overall annual drought conditions and the influence of climate change on water resources [16]. Because the SPEI has a promising ability to characterize drought and is easy to use in areas where data are scarce, this study adopted it for drought assessment.
Karst areas account for about 7% to 12% of the Earth’s land area and about a quarter of the world’s population is completely dependent on karst water resources. Karst areas in China are widespread, covering an area of about 2.06 million square km. These are mainly distributed in the southwest. Guangxi, Yunnan, and Guizhou have the highest concentrations of karst areas, comprising a total of 318,600 km2 and representing 39.44% of the total land area of the three regions. Karsts are areas formed by the dissolution of carbonate-based soluble rocks (limestone, dolomite, gypsum and rock salt, etc.). Surface runoff and groundwater flow have a dissolving and mechanically damaging effect on rocks in karst areas, which can generate underground drainage systems with sinkholes and caves [17]. Thus, water from the surface flows more easily into the ground, resulting in a weaker water storage capacity in the basin. Compared with non-karst areas, karst areas are more vulnerable to drought hazards, so the study on drought assessment is more urgent. However, the terrain and geomorphology of karst areas are more complex, and karst geo-climatic features are highly spatially heterogeneous, making reliable drought assessment still highly challenging.
In summary, although some concrete results have been achieved in drought assessment studies under climate change, there are still some shortcomings. It is challenging to obtain reliable information on climate change and to analyze the evolution of drought under climate change in karst regions. To address these problems, this study mainly explores the following elements. Firstly, the Chengbi River karst basin in China is selected as the study area. Then, under the SSP1-2.6, SSP2-4.5 and SSP5-8.5 scenario, the ASD model is used to project the precipitation- and temperature-based GCM data for the 2040s (2023–2050), 2060s (2051–2070) and 2080s (2071–2100). The GCM climate data are exported from the fifth generation of the Canadian Earth System Model (CanESM5) in Phase VI of the Coupled Model Intercomparison Project (CMPI6). Finally, the 12-month SPEI values are chosen to assess the drought conditions. The novel contributions of this study can be summarized as follows: (1) the performance assessment of the multi-station calibration-based ASD model in the karst basin; (2) projections of precipitation and temperature under three SSP scenarios using the ASD model; and (3) assessment of the drought conditions under different climate change scenarios. To the best of our knowledge, few previous studies have combined the multi-station calibration-based ASD model and SPEI to conduct drought assessment in karst basins under multiple SSP scenarios. This study is expected to act as a reference for future drought assessment in karst areas.
2. Study Area and Data Sources
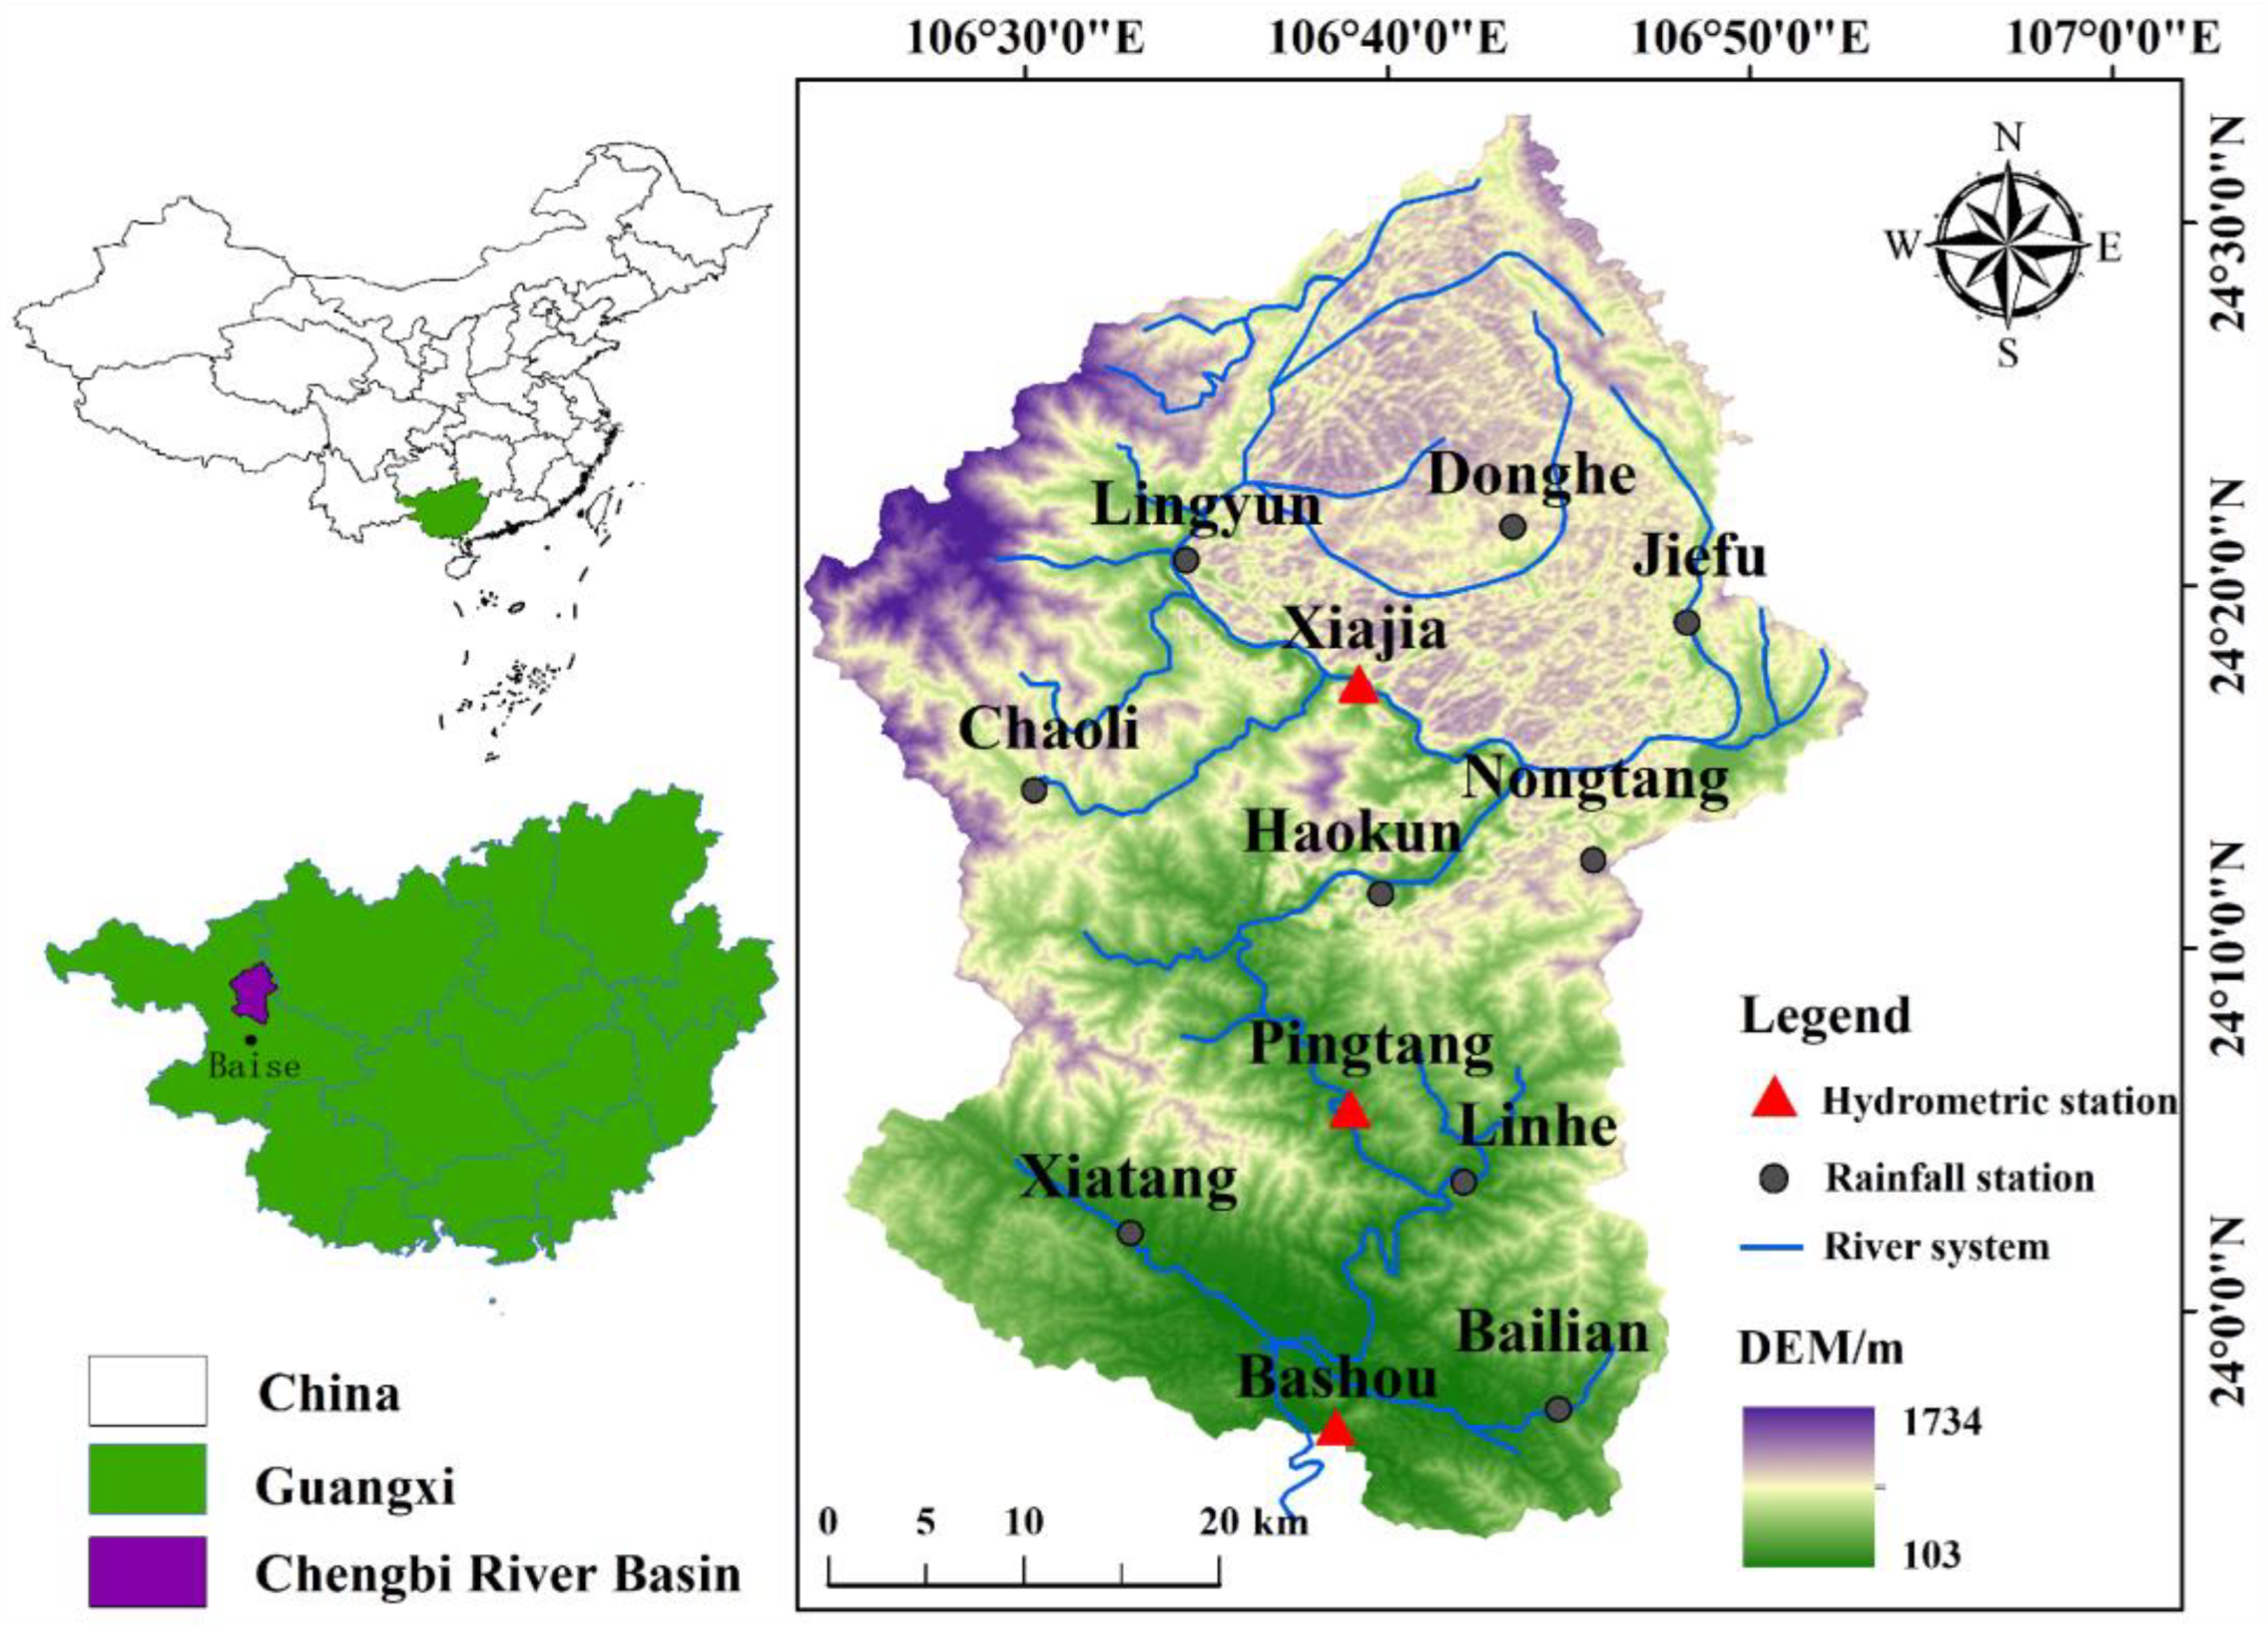
The Chengbi River karst basin is located in Guangxi District, China. The general topography is characterized by low southeast and high northwest. The total basin area is 2087 km2, of which the karst area is about 1121 km2, accounting for 53.7%. A unique geographical feature of this area is that the landform is divided into two parts bounded by the Nongtang station. The part above Haokun station to Nongtang station is a typical karst area where the terrain is largely undulating, with many structures such as sinkholes and skylights. The part below Haokun station to Nongtang station is mostly hilly, and, where the terrain is relatively flat, is lush with vegetation and dense forest. The climate heterogeneity is more obvious due to the influence of terrain and geomorphology. Precipitation in the basin is abundant, but its distribution is highly uneven, with 87% of the precipitation occurring during the flood season. The average annual precipitation is 1341.2 mm, showing a significant upward trend with an increased rate of 3.6 mm/y. The annual average temperature is 21.35 °C, the daily maximum temperature can reach 42.5 °C and the minimum temperature as low as −2 °C. The daily maximum temperature shows a decreasing trend with a decrease rate of 0.02 °C/y, while the daily minimum temperature shows an increasing trend with an increase rate of 0.02 °C/y; thus, the general variation of temperature is not obvious [18]. With limited information with regard to the small latitudinal variation of the basin and its location close to the coastal area, the spatial heterogeneity of temperature is not discussed in detail in this paper. The climate information for each station is shown in Table 1. There are 12 precipitation stations, and Xiajia, Pingtang and Bashou are both precipitation and hydrological stations. A general map of the basin and the distribution of stations are shown in Figure 1 [19].
The Chengbi River basin has been selected as the study area for the following reasons. Firstly, it is of strategic significance to the local water supply, power generation, agricultural irrigation and even the construction of the China–ASEAN-featured tourism belt. Secondly, the Chengbi River basin is a typical karst area with unique hydrogeological background. Its aquifer is highly permeable, resulting in more frequent transformations between surface water and groundwater than in other areas. The special karst landscape of the basin makes its hydrological cycle vulnerable to the influence of climate change, which causes it to become a frequent place of drought and flood disasters [20].
Four main datasets are used in this study: precipitation data from 12 stations in Chengbi River reservoir (1963–2019), maximum and minimum temperature data from Baise station (1963–2019), precipitation and temperature data from NCEP reanalysis information (1963–2014) and GCM climate models (1963–2014 and 2023–2100). Precipitation data for the Chengbi River reservoir are provided by the Chengbi River Reservoir Authority, and temperature data for the Baise station are available from the China Surface Climate Information Daily Value Dataset (V3.0) in the China Meteorological Data Website [http://data.cma.cn/ (accessed on 16 September 2021)], and National Centers for Environmental Prediction (NCEP). Reanalysis data are collected by the National Centers for Environmental Prediction and the National Center for Atmospheric Research [https://www.esrl.noa.gov/ (accessed on 10 October 2021)]. GCM data are obtained from the CanESM5 climate model in CMIP6 proposed by the World Climate Research Program (WCRP) [https://esgf-node.llnl.gov/projects/esgf-llnl/ (accessed on 20 January 2022)].
3. Methodology
The structure chart of this study is shown in Figure 2.
3.1. The Global Climate Model
The Coupled Model Intercomparison Project (CMIP) has been proposed by the World Climate Research Programme (WCRP), which is now in its sixth phase (CMIP6) since its implementation in 1995 [21]. It accumulates a large amount of historical hydro-meteorological data and is currently the most internationally influential source of climate data. The GCM climate data are output from the CanESM5 climate model in CMIP6. The Global Climate Model is typically used for large-scale climate projections, but it can also project regional climate change after downscaling. At present, the two main downscaling methods are dynamic downscaling and statistical downscaling. Dynamic downscaling can embed the Regional Climate Model (RCM) into the GCM to obtain accurate regional meteorological information, but this method is labor-intensive and computationally complex [22]. To facilitate the embedding of RCM into GCM, statistical downscaling establishes the statistical relationship between large-scale meteorological factors and small-scale station-observed meteorological data, which also greatly reduces the amount of computational errors of the GCM’s output [23]. Therefore, statistical downscaling is selected to downscale the GCM climate data. The SSP scenarios are new scenarios of the GCM model. Different from the RCP, the SSP scenarios not only concern climate change in the future but take into account the influence of various factors including population, environment, economic development, and government management [24]. Therefore, it can more comprehensively reflect future change conditions. Three representative climate scenarios are thus chosen for this study: the SSP1-2.6 scenario (low forcing scenario with radiative forcing stabilized at 2.6 W/m2 in 2100); the SSP2-4.5 scenario (medium forcing scenario with radiative forcing stabilized at 4.5 W/m2 in 2100); and the SSP5-8.5 scenario (high forcing scenario with radiative forcing stabilized at 8.5 W/m2 in 2100).
3.2. National Centers for Environmental Prediction (NCEP) Reanalysis Data
NCEP reanalysis data are meteorological information collected by the National Centers for Environmental Prediction (NCEP) and the National Center for Atmospheric Research (NCAR). The dataset contains the spatial and temporal distribution of multiple meteorological and climatic variables (e.g., temperature and precipitation) and provides an objective representation of actual climate change. Retrieval of the data was started in 1948 and it continues to be updated until now, with 26 predictors. In this paper, 15 predictors are selected by combining the predictors contained in both NCEP and GCM models. Then, the predictors and the predictand (precipitation and temperature) are used to establish functional relationships to calibrate and validate the downscaling model, which is undertaken in preparation for the next output of future climate data.
3.3. Automated Statistical Downscaling Model
3.3.1. ASD Model Construction Principle
The ASD model is developed from the Statistical Downscaling Model (SDSM), which runs based on the Matrix Laboratory programming language and environment [25]. The data required for this study are obtained by modeling precipitation events and temperature events in the ASD model. Precipitation events are modeled conditionally, so must first be determined whether the precipitation event occurs or not. In this study, 0.1 mm is taken as the threshold value for whether precipitation occurs on that day. The precipitation events are modeled as follows:
where Oi is the probability of occurrence of daily precipitation for a given day i; Ri is the daily precipitation (mm); Pij are the predictors; j is the serial number of predictors; α and β are the model parameters; and ei is the model error.
Meanwhile, temperature events are modeled unconditionally, considering that temperature is directly influenced by large-scale forecast factors. The temperature events are modeled as follows:
where Ti is the temperature (°C) and γ is the model parameter. Once the deterministic component is obtained, the residual term ei is modeled under the assumption that it follows a Gaussian distribution:
where Zi is the normally distributed random number; Se is the standard error of estimate; VIF is the variance inflation factor and b is the model bias. When using NCEP reanalysis data for calibrating the ASD model, VIF and b are set to 12 and 0, respectively. When using GCM data for scenario generation, the VIF and b can be calculated as:
where Vobs and Vd are respectively the variance of observation and simulation during the calibration period and Mobs and Md are the averages of observation and simulation during the verification period, respectively.
The construction of the ASD model is shown in Figure 3. The main steps of the downscaling process based on the ASD model are as follows. Firstly, the characteristics of the NCEP and GCM models are combined to optimize the 15 predictors that best characterize the predictand, as shown in Table 2. Because each station is located at a different altitude, the influence of atmospheric circulation on climate is variable. Therefore, the predictors are different for each station. Details are shown in Table 3. Secondly, the historical NCEP and GCM data (calibration period: 1963–1998, validation period: 1999–2014) are brought into the constructed statistical function relationship to calibrate and validate the ASD model. Third, the future GCM data (2023–2100) are input into the multi-station calibrated ASD model to obtain future climate data under different SSP scenarios.
3.3.2. The Model Performance Metrics
The Kling–Gupta efficiency (KGE) and Nash–Sutcliffe efficiency (NSE) are often used in the calibration and assessment of the models, and can assess the similarity between the simulation of a model’s output and the observations at the stations [26,27]. The optimal value of two metrics is 1, the closer the value of these two indicators is to 1, the better the model simulation is. If the KGE > 0.3 or NSE > 0.5, the simulations of the model are considered applicable [28]. In this study, the KGE is selected as the performance assessment metric for the ASD model. To increase the rationality of the results, the NSE is used to further assess the accuracy of the ASD model.
where r is the linear correlation between simulation and observation; σx is the standard deviation in the observation (mm); σS the standard deviation in the simulation (mm); is the average of the observations (mm); is the average of the simulations (mm); n is the number of time steps; Si is the observation of the station (mm); and Yi is the simulation of the model’s output (mm).
3.4. Standardized Precipitation Evapotranspiration Index (SPEI)
Different from SPI, the SPEI considers the influence of both precipitation and temperature on drought. Monthly precipitation minus monthly potential evaporation is used to replace monthly precipitation in the SPI calculation. The SPEI on different time scales can reflect drought conditions under different stages. The 3-month SPEI, for example, can reflect the seasonal wet and dry conditions, which can then be used for the analysis of agricultural drought conditions, while the 6-month SPEI can reflect the semi-annual climatic drought conditions, and the 12-month SPEI can reflect the overall annual drought conditions and the influence of climate change on the water resources of the basin. Therefore, the 12-month SPEI is chosen to systematically analyze the drought conditions in the Chengbi River basin. The specific calculation process is divided into four steps [29]:
(1) Climate water balance calculation
The Thornthwaite formula is used to calculate the monthly potential evapotranspiration (PET) in this study.
where K is the correction coefficient; T is the monthly average temperature (°C); m is a constant; and I is the annual heat index.
The monthly water deficit (Di) is calculated as follows:
where Pi is the monthly precipitation (mm).
(2) Construction of cumulative water deficit
The cumulative water deficit in a month is the sum of the water deficit in the previous month and the current month.
where Xi is the monthly water deficit (mm); k is the time scale; and i is the sample number of the time series.
(3) Calculation of the probability distribution of Xi
The Log-logistic probability distribution function is selected to calculate the probability distribution of Xi. The calculation formula is as follows:
where α is the scale parameter; β is the shape parameter; and γ is the origin parameter. The three parameters are estimated by using 1961–2000 as the reference period.
(4) Calculation of SPEI value
The SPEI is calculated as follows:
where W is the probability weighted moment; P is the probability density of Xi; if P ≤ 0.5, P = 1 − F(x); if P > 0.5, P is replaced by 1 − P and the sign of SPEI is reversed; C0 = 2.515517; C1 = 0.802853; C2 = 0.010328; d1 = 1.432788; d2 = 0.189269; and d3 = 0.001308.
4. Results
4.1. Performance Assessment of the ASD Model
In this study, the KGE and NSE are selected as performance assessment metrics for the model in the calibration period (1963 to 1998) and the validation period (1999 to 2014).
Table 3 displays the accuracy of simulation for the ASD model in the calibration period. According to the metrics results, the ASD model has good downscaling performance, which can accurately simulate precipitation and temperature. With respect to precipitation, both the KGE and NSE of the NCEP reanalysis data are more than 0.942 for all stations, while the KGE of the GCM data is in the range of 0.608~0.962, and the NSE is above 0.813, except for Bailian and Bashang station, with the maximum in Xiajia station. With respect to temperature, both the KGE and NSE of the NCEP reanalysis data are greater than 0.999 for all stations and the metrics values of the GCM data are the same as the NCEP reanalysis data. The results indicate that the multi-station calibration-based ASD model has good performance and thus can be used for climate data downscaling when characterizing karst climatic heterogeneous features. Meanwhile, the ASD model performs better when simulating precipitation than when simulating temperature. This may be related to the physical mechanism of precipitation formation, which has typical randomness and complexity. In summary, it can be inferred that there is a strong correlation between the simulation of the ASD model’s output and the observations of the stations.
Table 4 illustrates the accuracy of simulation for the ASD model in the validation period. Judging from the results, the ASD model is an efficient tool for simulating precipitation and temperature in karst areas. With respect to precipitation, both the KGE and NSE of the NCEP reanalysis data are more than 0.814 for all stations except for Linhe station, the KGE of the GCM data varies between 0.528 and 0.939, and the NSE is above 0.6 except for Bashang station, with the maximum in Lingyun station. With respect to temperature, both the KGE and NSE are greater than 0.96 for all stations, suggesting a strong ability of the ASD model to simulate temperature changes. The results reveal that the trends of the simulation and observation are consistent. Furthermore, the averages of the KGE for precipitation and temperature are 0.866 and 0.989, respectively, showing that the ASD model does not perform as well in the validation period as in the calibration period, but that the values of the overall index are still in a reasonable range. Thus, the ASD model can be used for climate change simulation under future scenarios.
4.2. Trend Analysis of Future Precipitation
In this study, the CanESM5 climate model is selected to generate the SSP1-2.6, SSP2-4.5 and SSP5-8.5 scenarios; then precipitation and temperature are obtained by using a multi-station calibration of the ASD model in the 2040s (2023–2050), 2060s (2051–2070) and 2080s (2071–2100). The historical period is 1963 to 2019 and the whole future period is 2023 to 2100.
4.2.1. Temporal Variation of Monthly-Scale Precipitation
Figure 4 reflects how the precipitation changes in different periods. The data for the historical period comprise the observations of the Chengbi River basin. Regardless of the period, the monthly average precipitation varies significantly under all three scenarios. Precipitation is mainly concentrated from June to August, while the overall distribution shows a high middle and low end with an “asymmetric single peak”, which indicates an extremely uneven interannual distribution of precipitation. Meanwhile, the precipitation increases in most months with a growing trend from the 2040s to the 2080s. In the 2040s, precipitation under the three scenarios shows an increasing trend in February to April and July to August with a range of 4.2% to 89.7%. In the 2060s, precipitation rises mainly in February to April, July, and August to September with a range of 0.9% to 107.7%. In the 2080s, precipitation trends increased in all months except January, May, and November, with variations ranging from 0.4% to 128.2%. Precipitation is increased by over 50%, mainly in March and April. For March, when the increase is most significant, the variability of precipitation for the three periods under the SSP1-2.6 scenario is 69.1%, 86.9%, and 87.0%, respectively. Under the SSP2-4.5 scenario, the variability of precipitation for the three periods is 89.7%, 107.7% and 108.4%, respectively. Under the SS5-8.5 scenario, the variability of precipitation for the three periods is 60.3%, 102.9%, and 128.2%, respectively. However, it is particularly important to notice that the monthly average precipitation in the coming decades may occur insufficiently in May, June and November compared with the historical period. This phenomenon is particularly reflected under all three scenarios. In summary, precipitation primarily tends to increase in the three future periods.
4.2.2. Temporal Variation of Annual-Scale Precipitation
Table 5 reflects the average annual precipitation under different periods for the Chengbi River. The annual average precipitation is 1341.2 mm in historical periods. The precipitation under the three scenarios is in an upward trend from the 2040s to the 2080s, with the maximum precipitation (1873.5 mm) occurring under the SSP5-8.5 scenario in the 2080s. For three periods, the precipitation is higher than the historical period, except for the SSP5-8.5 scenario (1224.5 mm) in the 2040s. Meanwhile, the emission concentration of carbon dioxide (CO2) gradually increases from the SSP1 scenario to the SSP5 scenario. The precipitation in both the 2040s and the 2060s reduces with increasing CO2 emission concentration; however, the precipitation regularity in the 2080s and the whole future period is opposite to the other two periods. Meanwhile, the precipitation shows a significant increase compared with the historical period, with a maximum variation of 39.69%. In short, the amount of precipitation is upward in the future according to these results.
4.2.3. Spatial Variation of Annual-Scale Precipitation
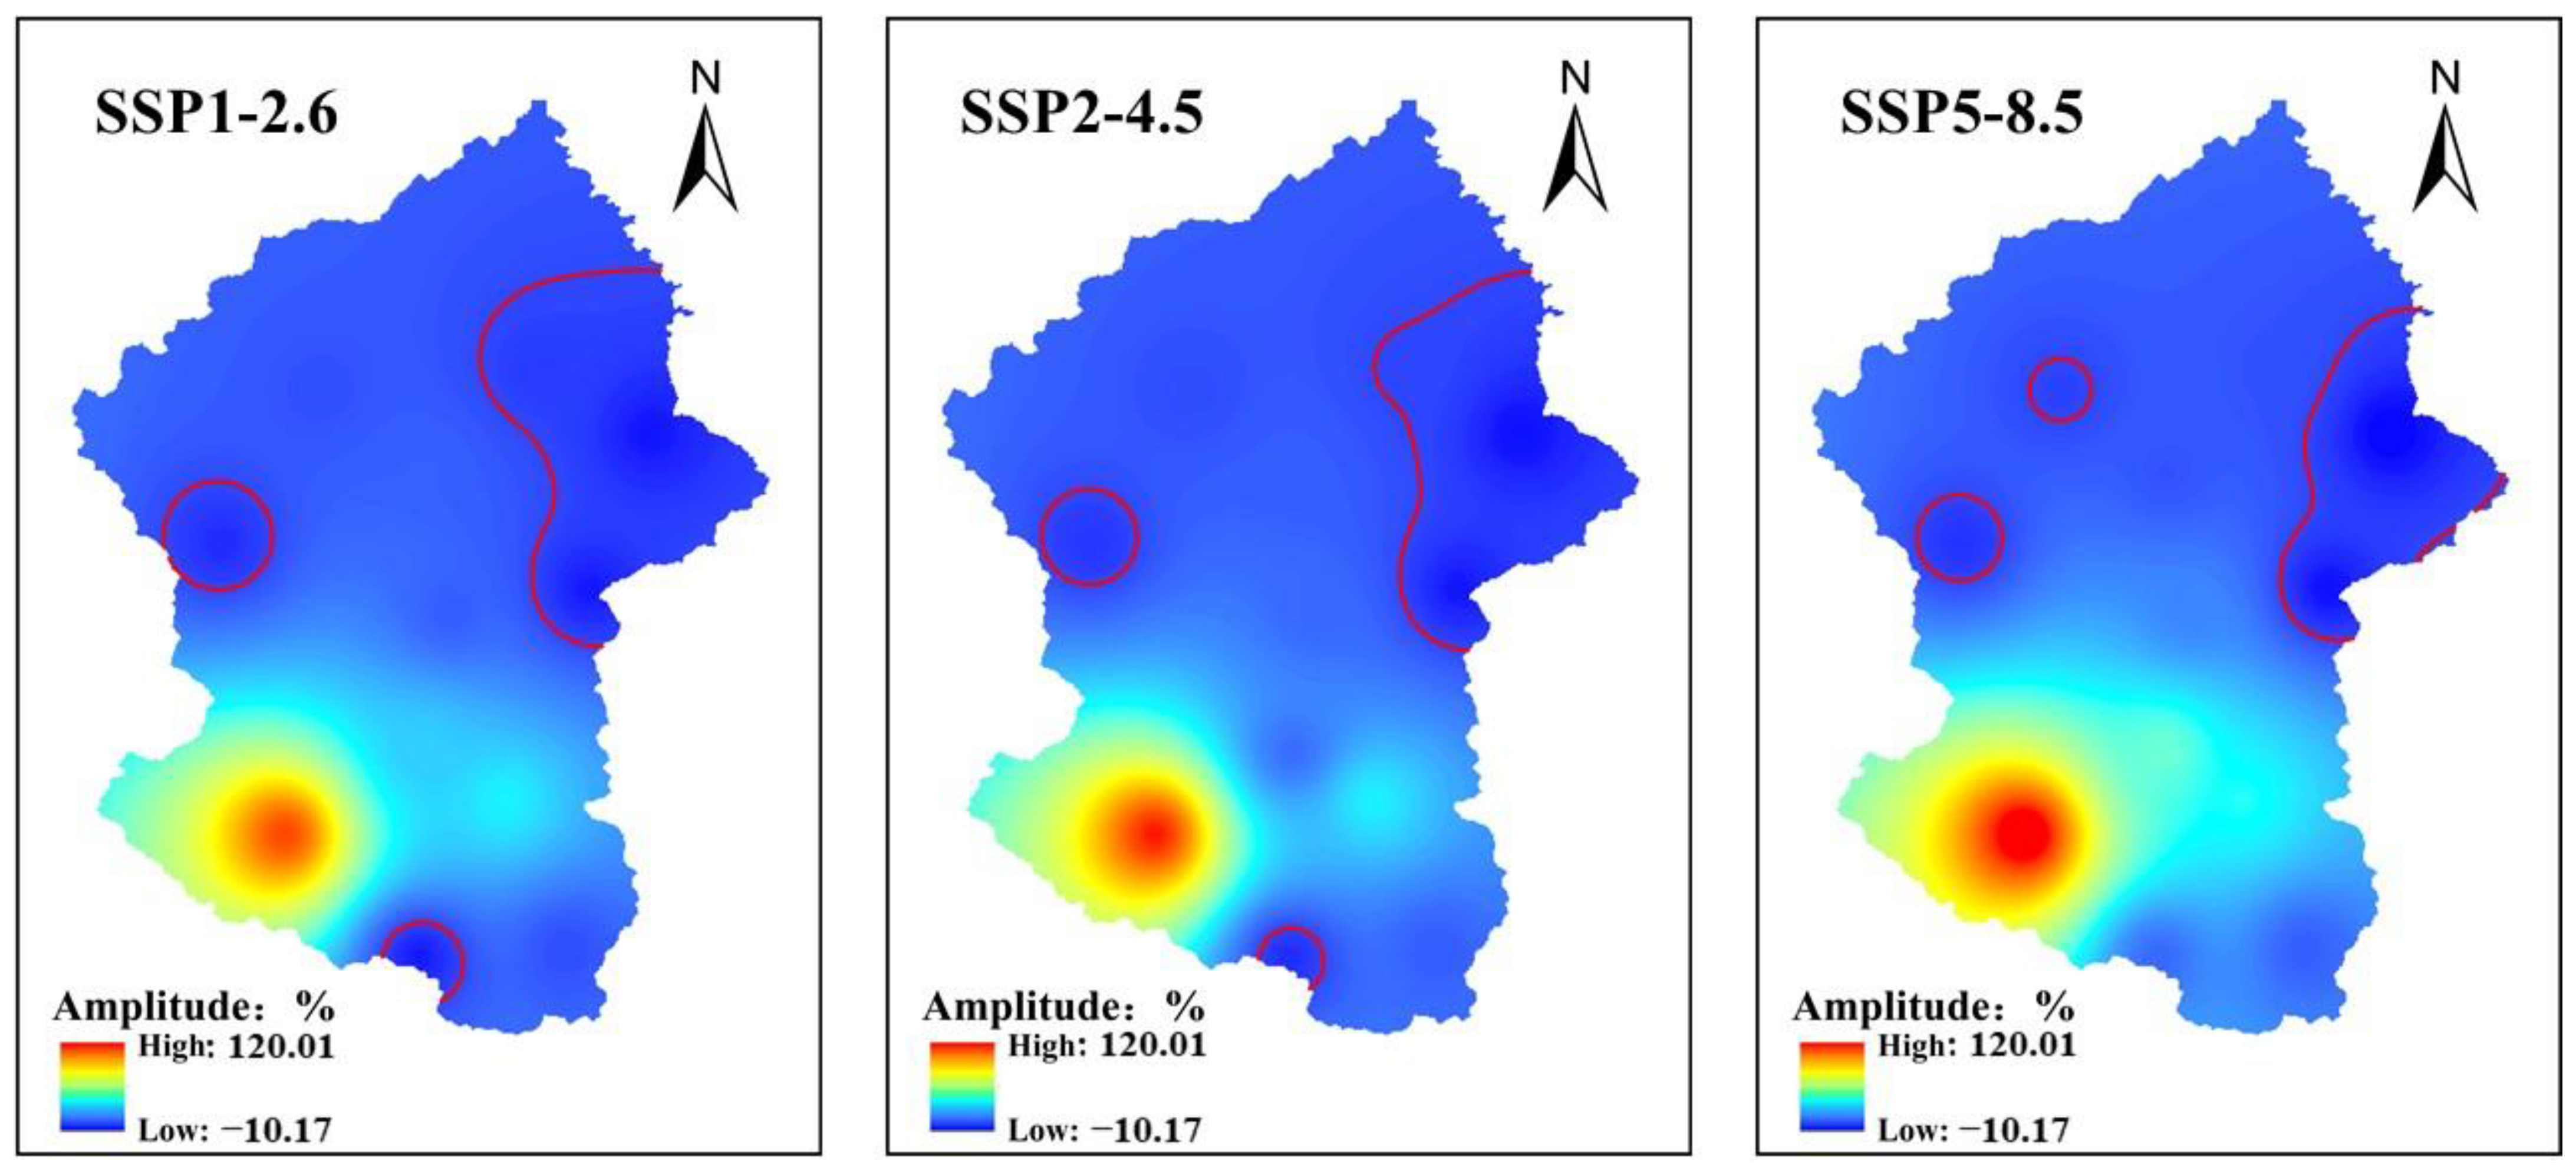
The results in spatial interpolation are generally influenced more by the nearer stations and less by the distant stations. The inverse distance weighting (IDW) method is used to interpolate the spatial distribution of future multi-year average precipitation variability compared with the historical period in the Chengbi River basin under the three scenarios. The interpolation results are shown in Figure 5. The red line in the figure is the zero lines dividing the increasing or decreasing regions. The spatial distribution of precipitation variability is very different. The spatial variation of precipitation under the SSP1-2.6, SSP2-4.5 and SSP5-8.5 scenarios ranges from −8.45% to 112.37%, −9.32% to 118.75% and −10.17% to 120.01%, respectively. Therefore, the maximum and minimum variations of precipitation occur under the SSP5-8.5 scenario. Under all three climate change scenarios, precipitation increases over most of the basin, while the largest increasing trends are concentrated in the southwest region downstream. This may be due to the greater vegetation cover in the southwestern part of the basin, which provides a large amount of water vapor to the atmosphere and increases air humidity. Meanwhile, because of the higher terrain to the north of the Xiajia station forming the windward slope, the topographic lifting effect intensifies the upward movement of water vapor, which leads to more precipitation. The largest decreasing trends are concentrated in the eastern and western parts of the upstream region, and the region of basins with negative variability is gradually decreasing. In general, precipitation primarily demonstrates different degrees of increase under all future scenarios.
4.3. Trend Analysis of Future Temperatures
4.3.1. Temporal Variation of Monthly-Scale Temperature
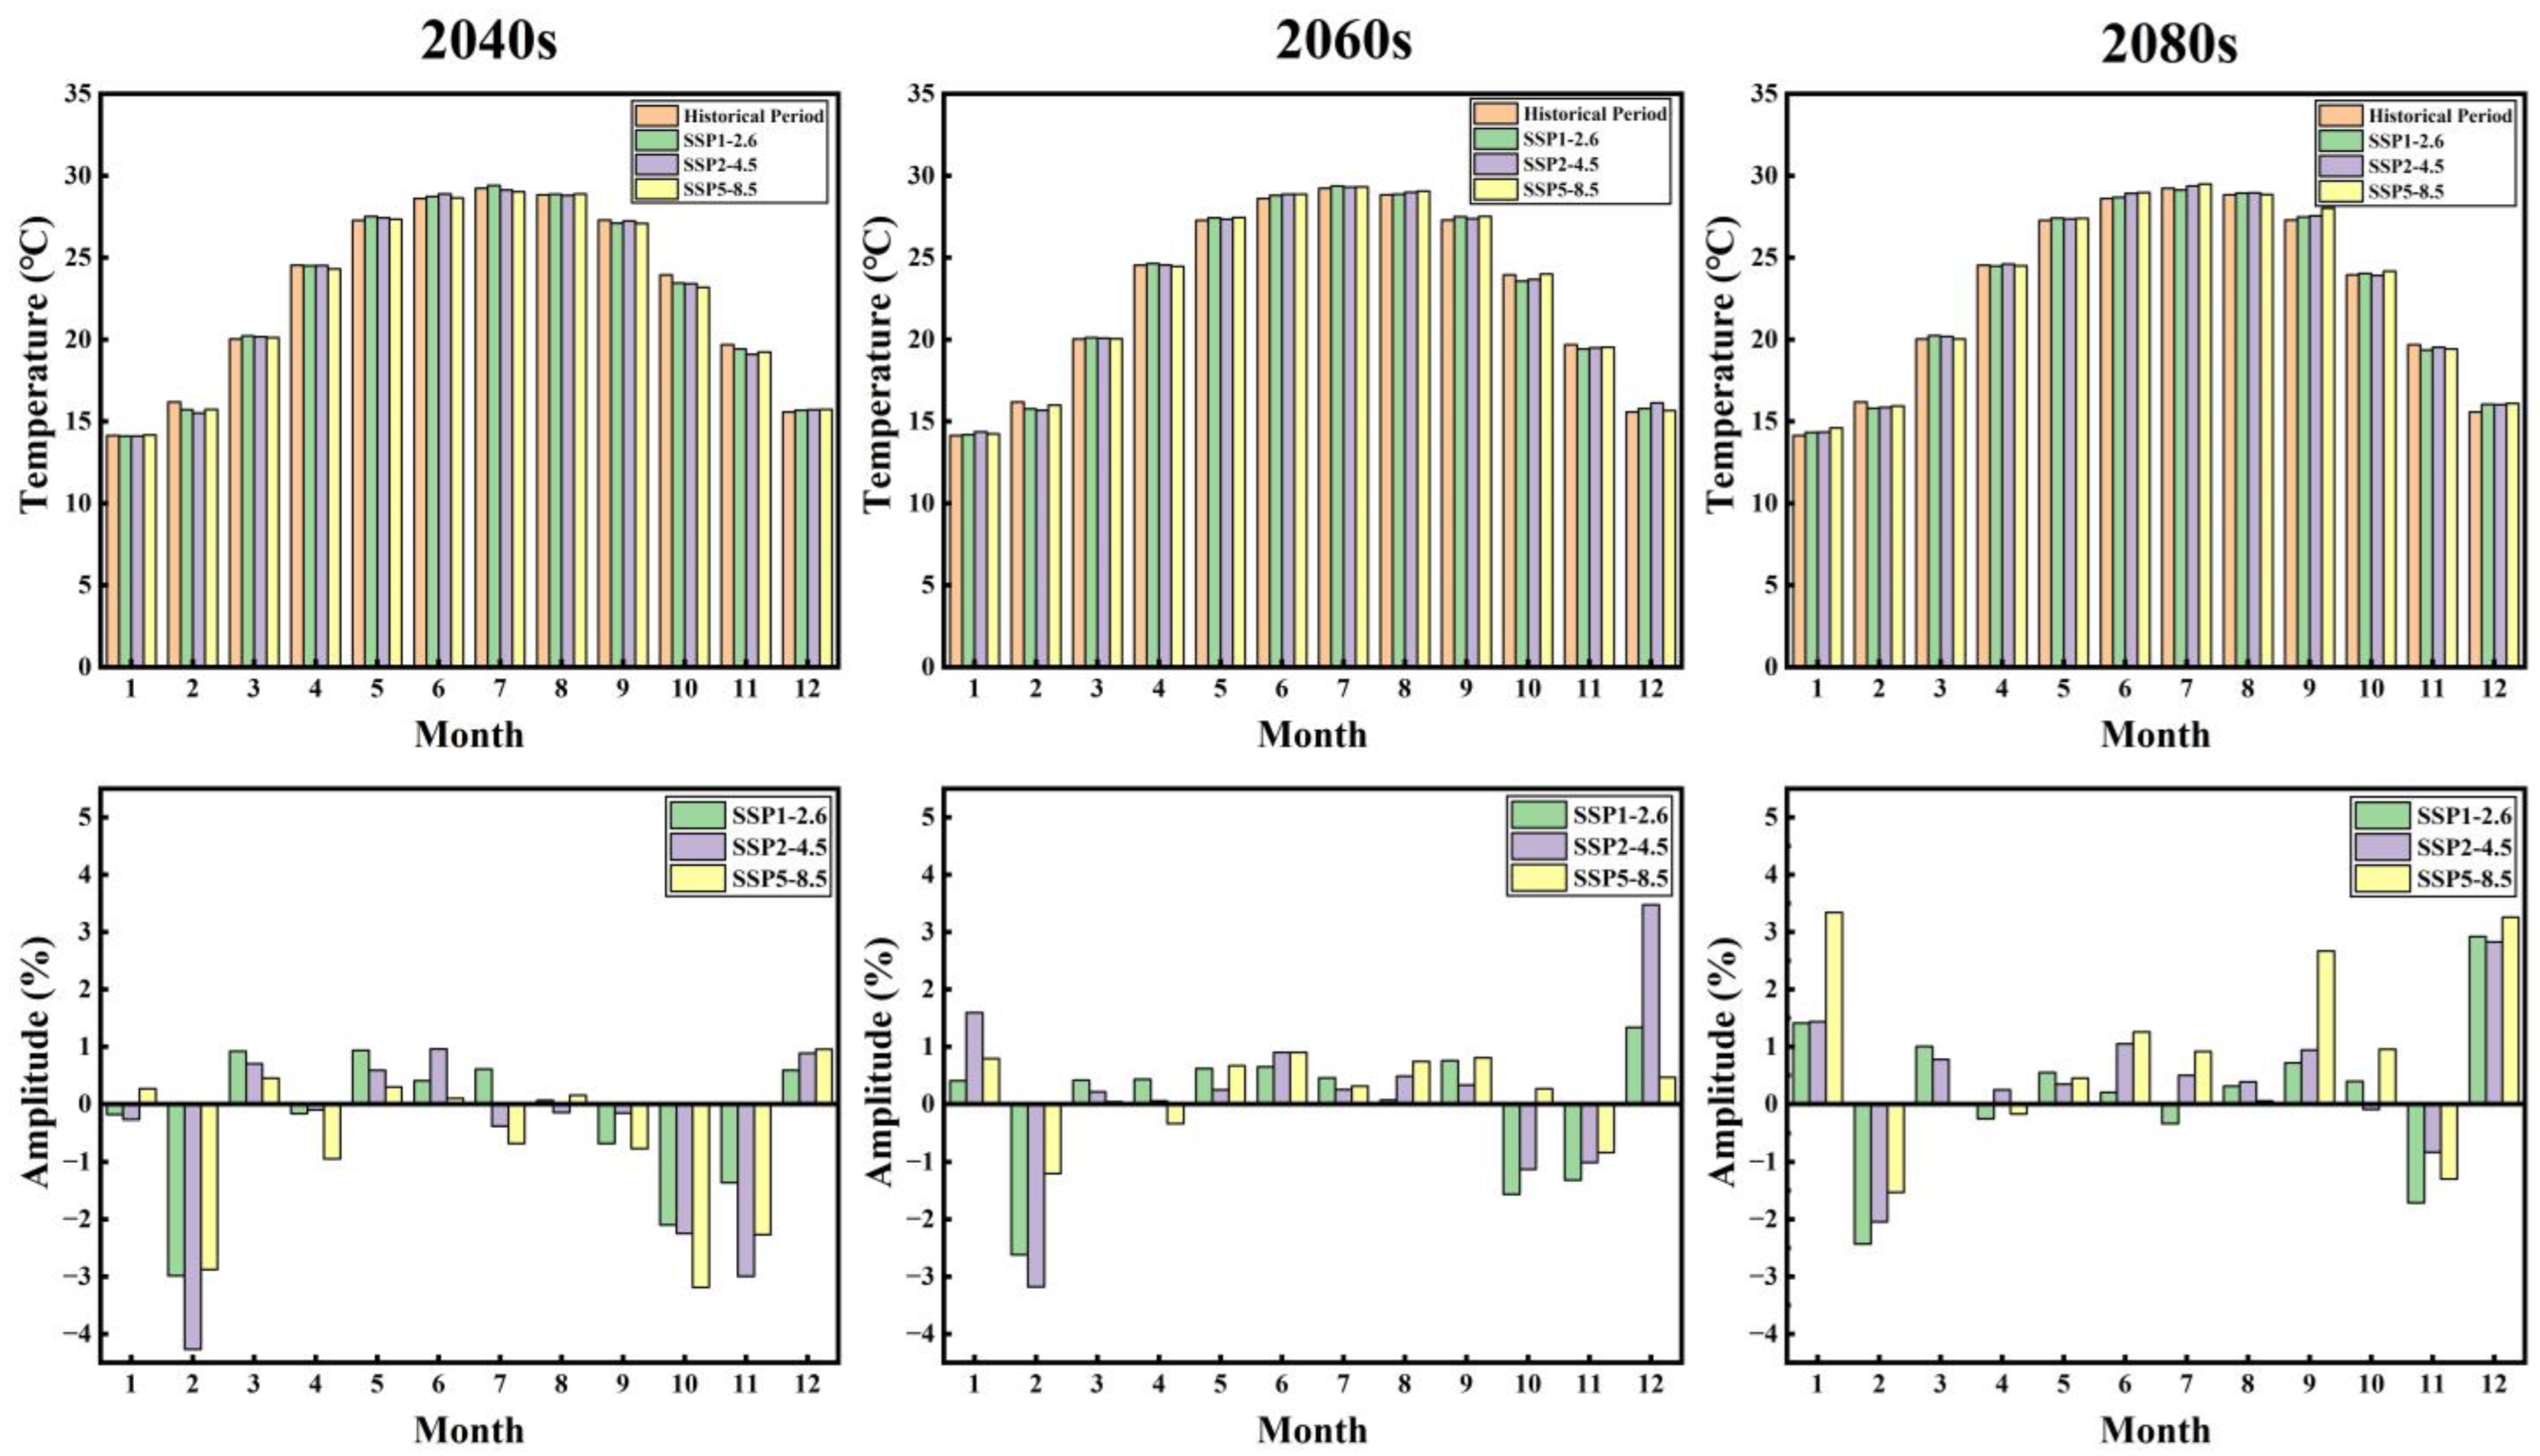
Figure 6 displays the variation of the monthly average temperature in the Chengbi River basin. The data for the historical period is composed of the observations of the Chengbi River basin. The monthly average temperatures under the three scenarios mainly show an increasing trend, but the changes are not very significant compared with the historical period. Meanwhile, the temperature increases in most months from the 2040s to the 2080s. In the 2040s, the temperature mainly shows increases in March, May, June, August and December under the three scenarios, with variations ranging from 0.07% to 0.95%; while the temperature is on the decline in the other months, especially in February, October and November. In the 2060s, the temperature in the other months mainly shows an increase except for February, October and November, with variations ranging from 0.04% to 3.47%. In the 2080s, the temperature in the other months mainly shows an increase, except for February, April, and November, with variations ranging from 0.007% to 3.34%. An over 50% increase in temperature occurs mainly in December of the 2080s. For December, the temperature variation under the three scenarios is 2.9%, 2.8%, and 3.3%, respectively. In addition, the variation of temperature in the 2080s is slightly higher than in the other two periods. However, it is particularly important to note that the monthly average temperature may be lower during the future months of February, October and November compared with the historical period. This phenomenon is reflected under all three scenarios. In general, the temperature in the future three periods compared with the historical period mainly shows an increasing trend.
4.3.2. Temporal Variation of Annual-Scale Temperature
Table 6 reflects the variation of the annual average temperature in the Chengbi River basin. The annual average temperature is 22.97 °C in historical periods. The annual average temperature under all three scenarios shows an increasing trend from the 2040s to the 2080s, with the maximum temperature (23.16 °C) occurring under the SSP5-8.5 scenario in the 2080s. For three periods, the temperature under the three scenarios is higher than the historical period (22.97 °C) except for the 2040s. In addition, the temperature in the 2040s reduces with increasing CO2 emission concentration; however, the temperature regularity in the 2060s, the 2080s and the whole future period shows an opposite trend. Above all, the temperature is shown to be increasing in the future according to these results.
4.4. Trend Analysis of Future Drought
4.4.1. Temporal Variation of Drought
Table 7 shows the internationally recognized criteria for classifying drought levels based on the SPEI, which is used to determine whether a region is suffering from drought and to what level of drought the region is suffering.
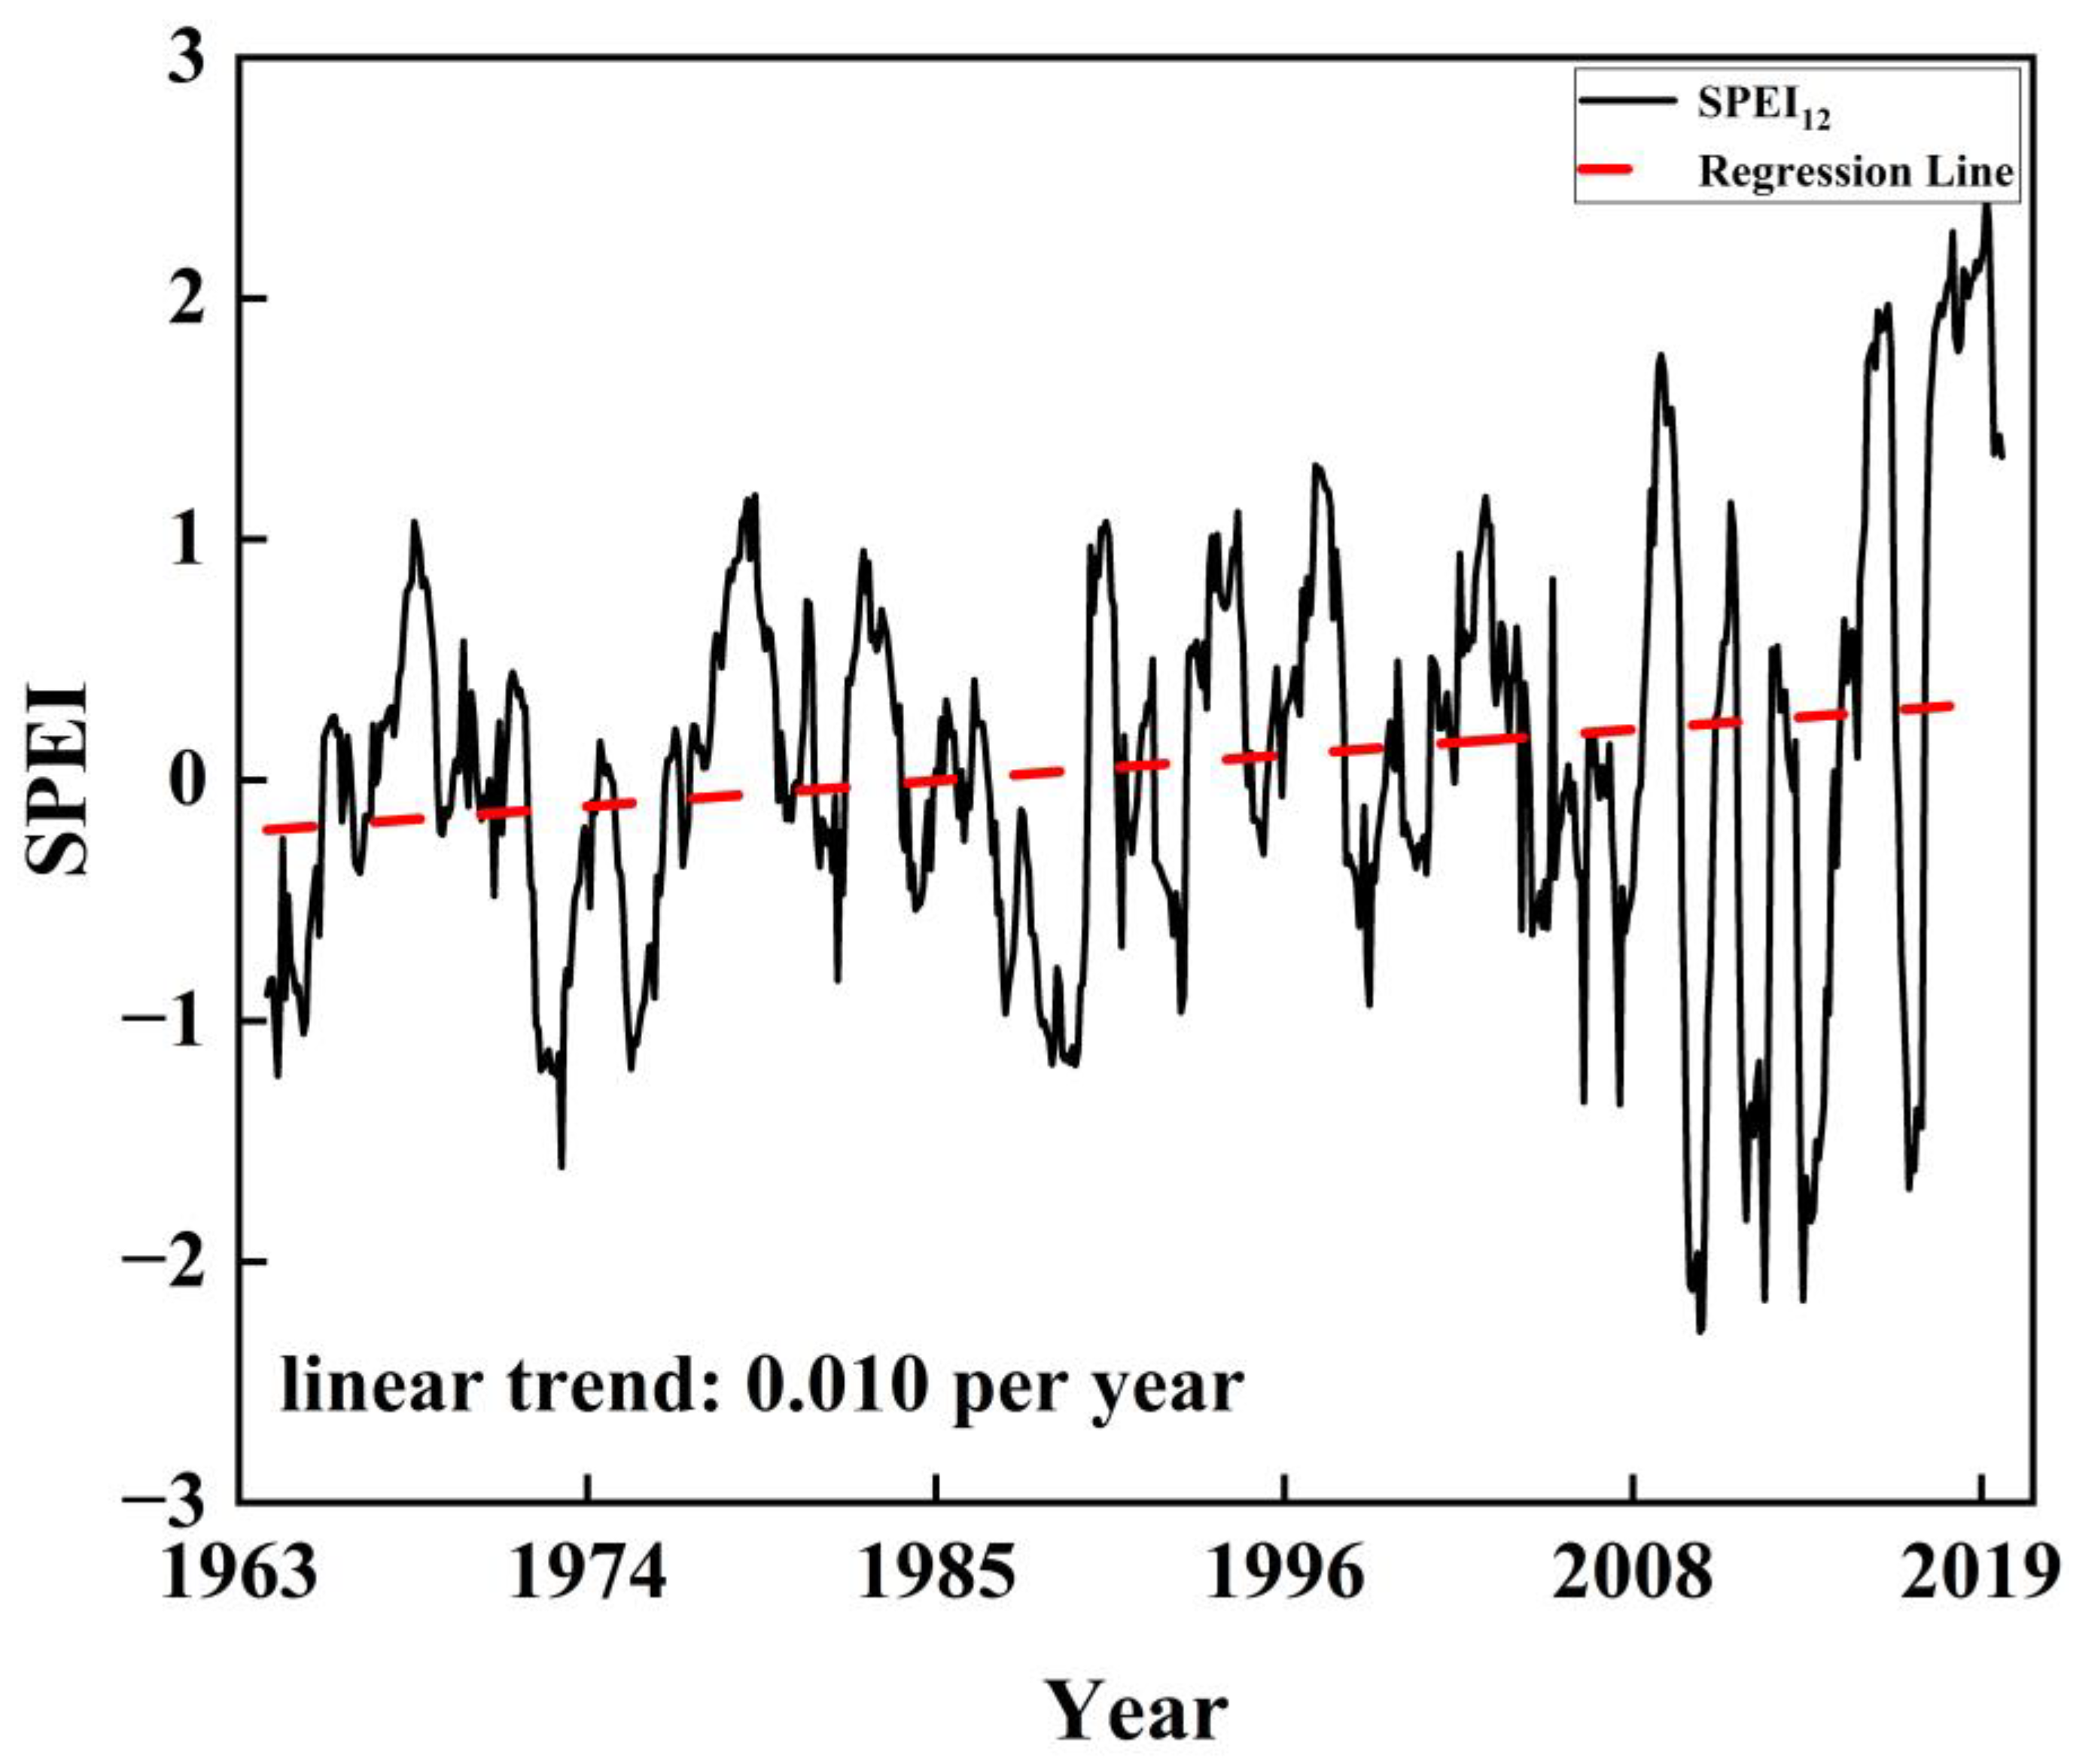
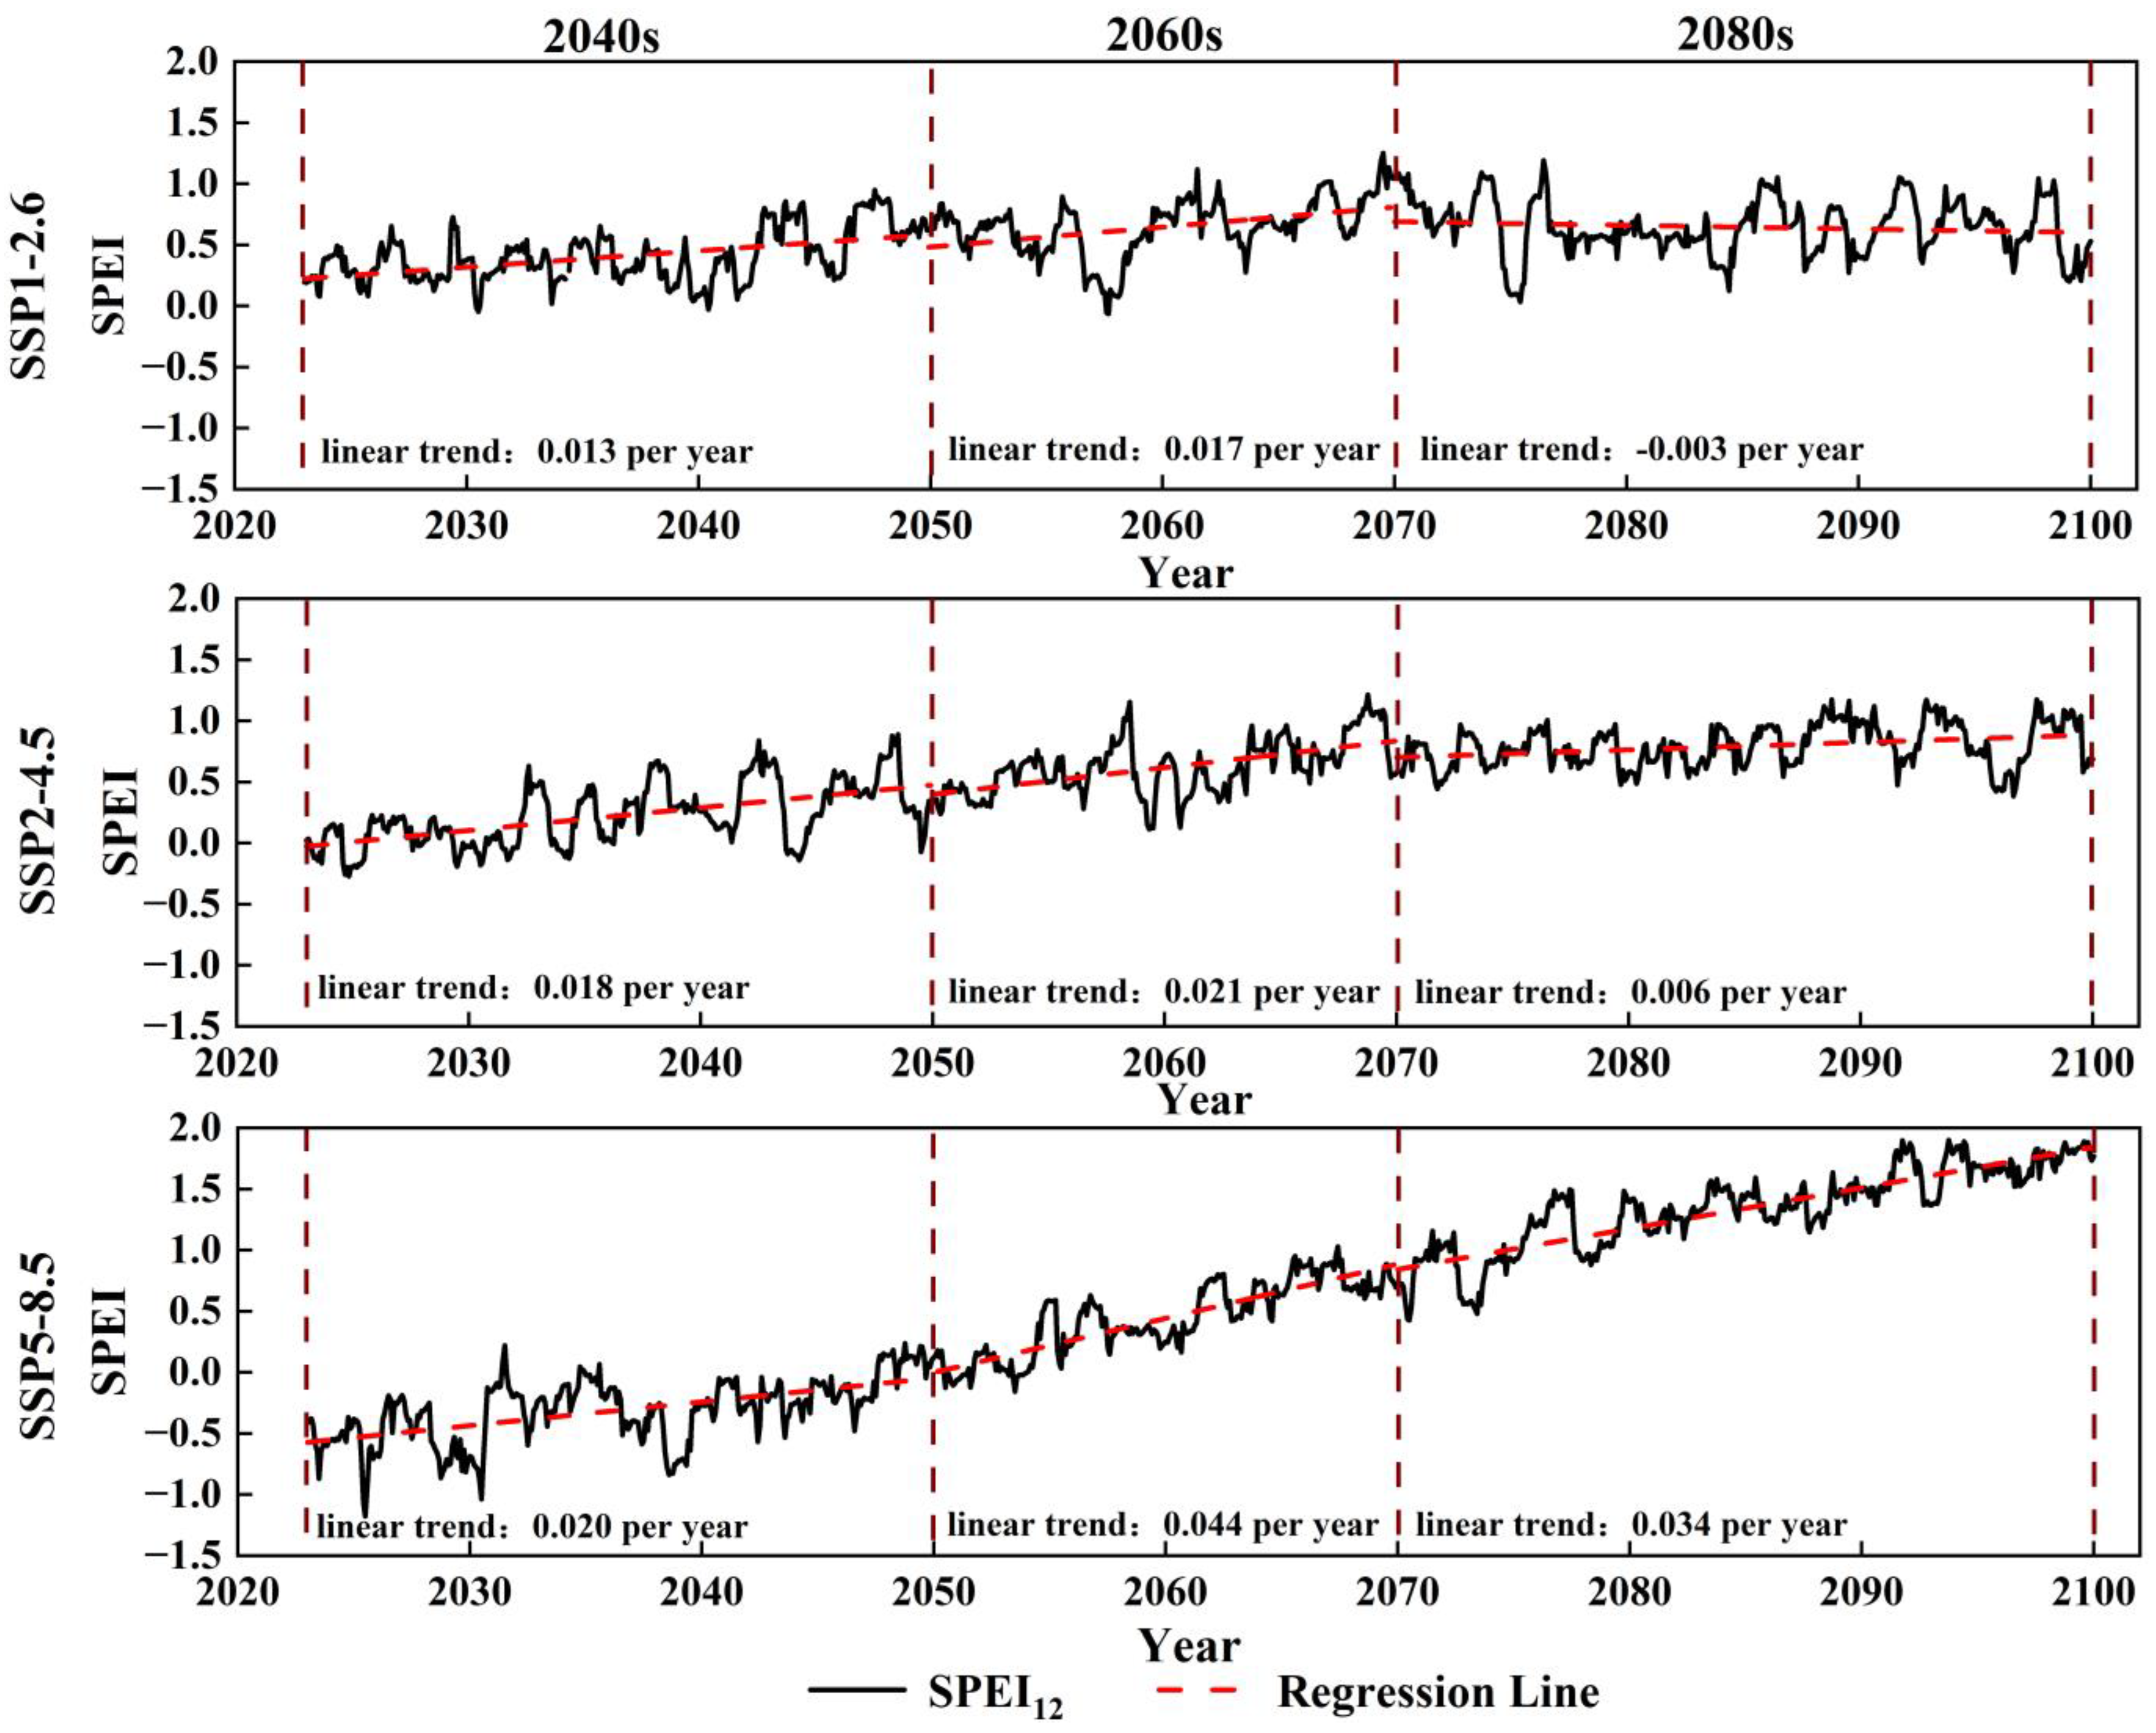
Figure 7 and Figure 8 show the temporal variation of the 12-month SPEI values in the Chengbi River basin for different periods. The variation of SPEI distribution can reflect the drought conditions, and when the SPEI value is less than −0.5, the region is said to be in drought. During the historical period, the value of SPEI fluctuates between −2 and 2, with an annual growth rate of 0.017, indicating that alternating drought and flood events occurred. The SPEI values under the SSP5-8.5 scenario in the 2040s are concentrated between −1 and 0, indicating that drought conditions are more severe in this scenario with alternating droughts and floods. The SPEI values for all other periods are basically above −0.5, indicating a greater probability of wetness throughout the basin. As can be seen from the figure, the SPEI values mainly showed a significant upward trend (L > 0.01/y) in all periods. In the 2060s, the growth rate of the SPEI is faster than in the other two periods, with the maximum growth rate (0.044/y) occurring in the SSP5-8.5 scenario, which may be due to the significant increase in precipitation in the 2060s. During the same period, the growth rate of SPEI increased with the increase in CO2 concentration. In summary, the drought conditions from the 2040s to the 2080s were alleviated when compared with the historical period.
4.4.2. Spatial Variation of Drought
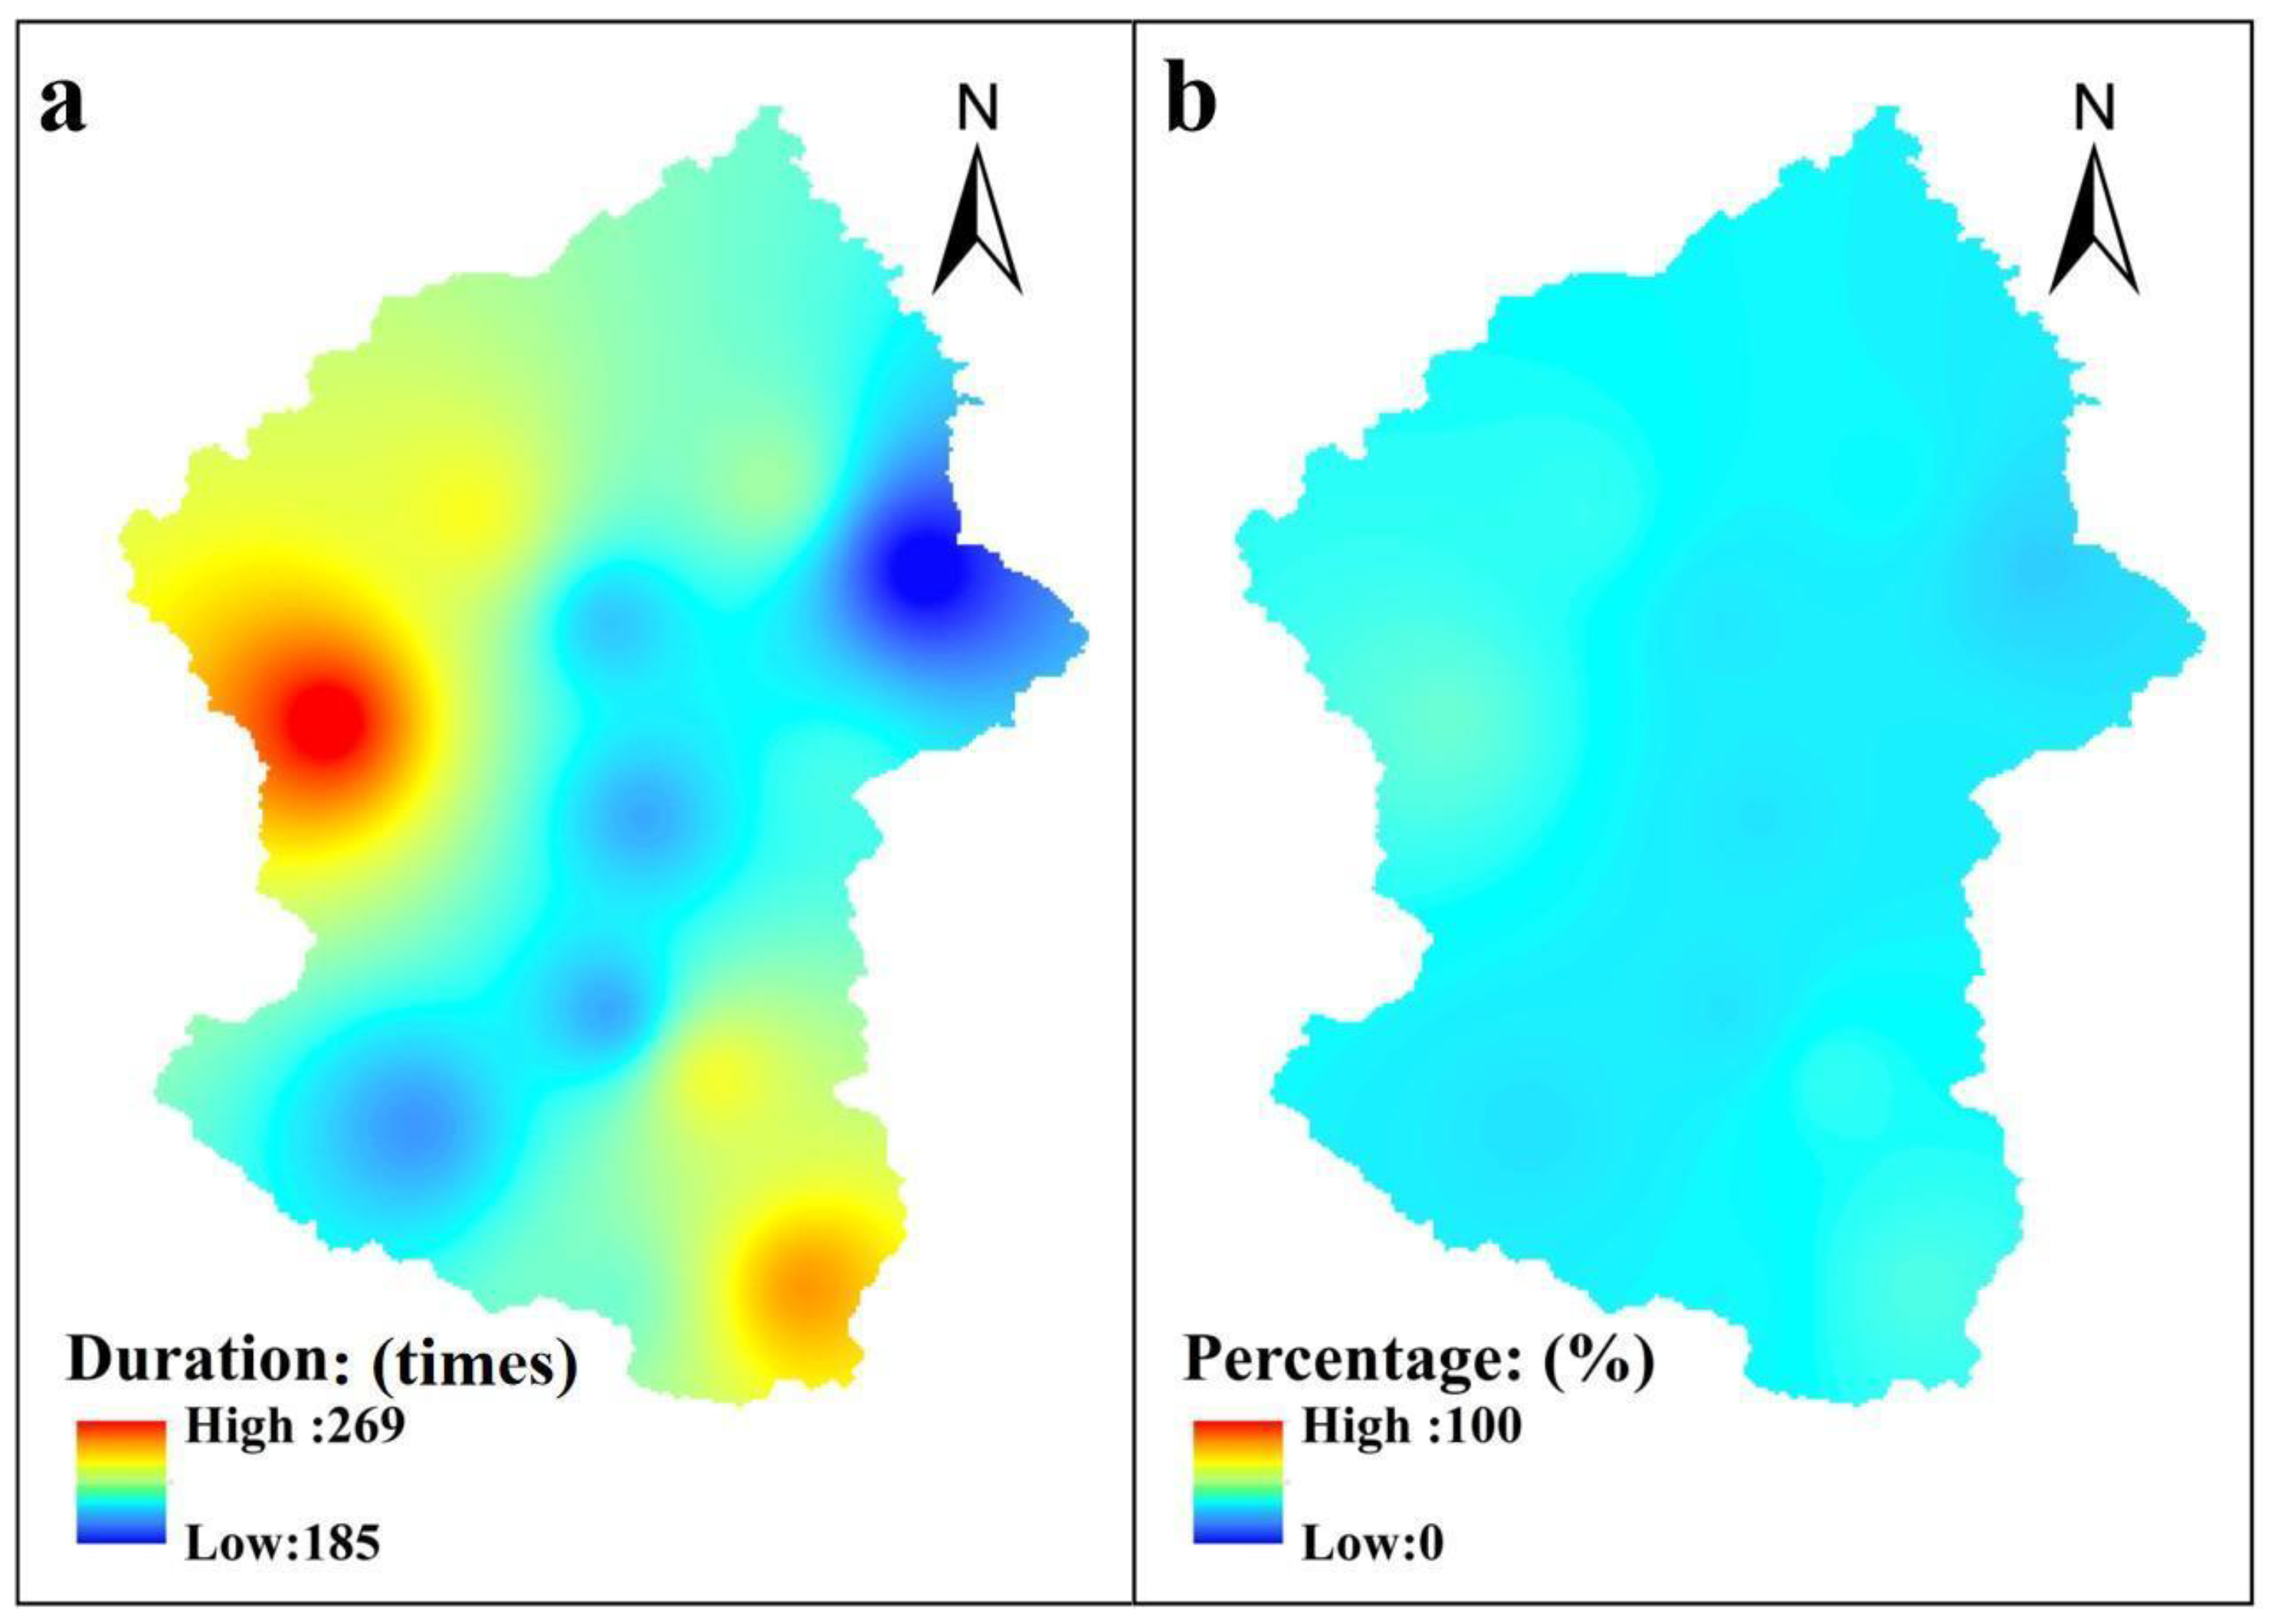
The drought duration is defined by the sum of consecutive drought months (characterized by SPEI12 < −0.5) for all of the drought events. The percentage of drought duration is equal to the drought duration divided by the total number of months in the period. The range of percentages is 0 to 100%. The larger the percentage, the longer the duration of the drought suffered in the basin during this period. As with precipitation, the IDW method is used to interpolate the spatial distribution of the drought duration and the percentage of drought duration for the historical period. The interpolation results are shown in Figure 9. The redder the color in the figure, the greater the percentage of drought duration, and conversely the bluer the color, the smaller the percentage. It can be seen from Figure 9a that the drought duration in the northwest of the basin is longer than those in other regions. The percentage of drought duration does not differ significantly among the stations in the basin. The drought duration percentage of all stations exceeds 27%, among which the drought duration percentage of Bashou station is the largest (39%). This indicates that the Chengbi River basin experienced drought for about 30% of the historical period.
Figure 10 is the spatial distribution of the percentage of drought duration for each period in the Chengbi River basin obtained by using the IDW method under the three scenarios. Under the SSP1-2.6 scenario, the range of variation in the percentage of drought duration is 0 to 67%, 0 to 28% and 0 to 31% for the 2040s, 2060s and 2080s, respectively. Under the SSP2-4.5 scenario, the range of variation in the percentage of drought duration for the three periods is 0 to 81%, 0 to 31% and 0 to 19%, respectively. Under the SSP5-8.5 scenario, the range of variation in the percentage of drought duration is 0 to 97%, 0 to 42% and 0 to 41%. The variation in the percentage of drought duration in the 2040s is more obvious than in the other two periods, which indicates that drought may occur for a longer period in the 2040s. A much smaller percentage of drought duration is found in most regions in the 2060s and 2080s. Meanwhile, the northeast region of the basin is more prone to drought in the 2060s and 2080s. The percentage of drought duration gradually decreases in most areas of the basin from the 2040s to 2080s under the three scenarios, indicating that future drought conditions are alleviated. For the SSP5-8.5 scenario, precipitation and temperature are less in the 2040s period than in the historical period. Insufficient precipitation can easily lead to the occurrence of drought. The southern region of the basin is densely vegetated, and when precipitation is low, the vegetation absorbs a lot of water, which may cause drought. The upstream area is a typical karst region, where the aquifers are highly permeable and have a weak water storage capacity. At the same time, the increased temperature exacerbates transpiration, resulting in more water loss, which may lead to the occurrence of a small-scale drought. From the SSP1 scenario to the SSP5 scenario, the concentration of CO2 increases continuously. The percentage of drought duration increases with increasing CO2 concentration in most of the regions for the three periods. In general, future drought conditions are alleviated compared with the historical period. However, the drought condition is still more severe under the SSP5-8.5 scenario in the 2040s, so more attention should be paid to drought control in 2040s.
5. Discussion
Nine percent of the global population partly or fully relies on karst water resources, making the drought assessment in karst areas of significant engineering and scientific importance [30]. However, karst geo-climatic features are highly spatially heterogeneous, making reliable drought assessment challenging. The successive proposals of climate change scenario data, statistical downscaling models, and drought indexes have provided new opportunities to enhance the reliability of drought assessment in karst areas but these have only been partially explored. This study helps to bridge this gap by combing the multi-station calibration-based automated statistical downscaling (ASD) model and Standardized Precipitation Evapotranspiration Index (SPEI) to conduct drought assessment in karst basins under a Shared Socio-Economic Pathway (SSP).
5.1. Explanation of Some Phenomena
The accuracy of the ASD model in the calibration period (1963–1998) is higher than that in the validation period (1999–2014). The reason may be that the precipitation in the calibration period shows a slowly decreasing trend, while the precipitation in the validation period shows a significantly increasing trend, with large fluctuations. Although the ASD model does not perform as well in the validation period as in the calibration period, the values of the overall index are still in the reasonable range, consistent with the results of Aida et al. [31]. The spatial distribution of annual average precipitation variability under all three scenarios produces a maximum in the southwestern region of the basin. The reason for this may be the larger vegetation cover in the southwestern part of the basin, which provides a large amount of water vapor to the atmosphere and increases air humidity. Meanwhile, because of the way that the higher terrain to the north of the Xiajia station forms the windward slope, the topographic lifting effect intensifies the upward movement of water vapor, which leads to more precipitation. Furthermore, the northeast region of the basin is more prone to drought in the 2060s and 2080s. This may be caused by the fact that the upstream region is a typical karst area, where the aquifers are highly permeable and have a weak water storage capacity. When precipitation is low, most of the surface water flows deep into the ground. Karst areas are more vulnerable to severe soil erosion, and have thus become some of the most critically vulnerable areas in China [32]. Therefore, upstream areas are more vulnerable to drought. From the 2040s to the 2080s, the drought conditions in the basin are alleviated when compared with the historical period, which may be due to the significant increase in the CO2 emissions that can cause extremely high-temperature weather or precipitation events. In the 2060s and 2080s, precipitation begins to increase significantly. While temperature also increases, the amplitude is smaller, with a maximum increase of only 0.04 °C in 2023–2100. The drought alleviation effect of increased precipitation far exceeds the aggravation effect of increased temperature, resulting in the reduction of drought conditions [33].
5.2. Comparison with Previous Results
Numerous previous studies have demonstrated that the ASD model has good downscaling performance, one which can accurately simulate precipitation and temperature. Liu et al. [34] assessed the applicability of the ASD model in different temperate regions of eastern China and illustrated that the model was able to simulate precipitation and temperature and that their simulations had a strong spatial correlation. Guo et al. [35] compared the performance of the SDSM model and the ASD model, which showed that both models could project the variations of precipitation and temperature, and that the overall performance of the ASD model was slightly better than the SDSM model. Therefore, it is reasonable to choose the ASD model for the downscaling projection in this study. From this study, we can see that precipitation in the Chengbi River basin mainly shows an upward trend in the context of climate change and that temperature shows a slow upward trend, which is consistent with the findings of Ruan et al. [20]. The United Nations Intergovernmental Panel on Climate Change (IPCC) has published the Synthesis Report of the Sixth Assessment Report, which mentions that climate change may intensify in all regions in the future. Continued greenhouse gas emissions may lead to a further increase in global temperature. Among the scenarios and model pathways considered, global temperature increases by 1.5 °C from 2021 to 2040. Average precipitation may also increase. The IPCC AR6 WG-I summary is global, however, the Chengbi River basin is small. The temperature increase in the basin is not as large in this study, but the overall trend is consistent with the conclusions of the IPCC report. Wu et al. [36] applied the regional climate model RegCM 4.0 to study the projected changes in extreme climate events in the Zhujiang River basin in China based on the RCP scenarios, and found that the variation of the average minimum temperature in the future (2021–2099) ranges from 0.04 to 2.5 °C. Touseef et al. [37] predicted the impact of climate change on long-term precipitation trends in the Xijiang River basin in China, indicating that an 11.5% increase in precipitation would occur there until 2050. The results of this paper indicate a maximum increase in average annual precipitation of 7.8% from 2023–2050. Meanwhile, the Chengbi River basin is a part of the Zhujiang River basin and the Xijiang River basin, meaning that, on a small scale, the results of this paper are consistent with the previous study. Meanwhile, large studies in recent years have been undertaken on drought assessment in China. For example, Yao et al. [38] assessed future drought conditions in China using the SPEI under several scenarios from 2011 to 2100, showing that future drought conditions in the northwest might be wetter in the southeast than elsewhere. The Chengbi River basin is located in southern China, and the results of this study indicate that future drought conditions may be alleviated, consistent with the findings of Yao et al. Meng et al. [19] assessed the drought in the Chengbi River basin from 2002–2018 based on observed data and on IMERGE satellite data and showed that the basin was in a cyclical drought with a spatial trend of drought conditions in the northeast and wet conditions in the southwest. The results are the same as the drought characteristics of this study for the 2040s. It is worth noting that some studies have also found the opposite of our results. Dai et al. [39] analyzed global drought using the PDSI based on CMIP5 data and concluded that the future drought form in Asia was more severe. The reasons for this contradiction may be that, firstly, there are many factors affecting future climate change which makes the projection highly uncertain and, secondly, that the PDSI can only assess drought at a fixed time scale, causing it to be suitable for the assessment of agricultural droughts even as it holds a certain degree of error in the assessment of meteorological droughts [40].
5.3. Strengths and Limitations
In this study, the ASD model is selected to project future climate change under the SSP scenarios, which together comprise the new scenario of the CMIP6 model. The SSP scenarios comprehensively consider the influence of population, environment and economy on climate change, which makes it possible to project global climate change more accurately [41]. The unique feature of this study is that the observed data from 12 stations were used to calibrate the ASD model to solve the disadvantage wherein the GCM model has low accuracy for regional climate change projection. Multi-site calibration reduces time series non-smooth bias and parameter uncertainty, so that the downscaling method with multi-station calibration in small- and medium-sized basins can largely improve the accuracy of simulations [42,43]. The index used to assess drought in this study is the SPEI, which combines the advantages of PDSI and SPI, and considers simultaneously the influence of precipitation and temperature on climate change. Meanwhile, the calculation of SPEI does not require much meteorological information. The NDI is calculated by subtracting the standardized temperature value from the standardized precipitation value. The standardized value is calculated by subtracting the average value for each period from each measured value and dividing the obtained value by the standard deviation of the sample. However, the temperature and station latitude are used to calculate the potential evapotranspiration during the SPEI calculation. In this paper, the data of the historical period are selected to calculate SPEI12, SPI12, NDIann and ΣNDIi (i = 1, 2⋯57), respectively. The variation of each index in the historical period is shown in Figure 11. When the overall trend of ΣNDIi decreases, it is determined that drought will occur during this period. From Figure 11D, drought occurred in the Chengbi River basin from 1971 to 1975, from 1986 to 1993 and from 1999 to 2016. This is generally consistent with the drought conditions reflected by the SPEI and SPI. Since the SPEI integrates several factors, it reflects a more reasonable drought condition. Therefore, the SPEI is more suitable for regional drought assessment in the context of global warming [44]. Combining the disadvantages of this study, future research can be continued in the following areas. Firstly, due to limited data, this study can only be conducted in the Chengbi River basin, China. If more generalized results are to be obtained, future studies may be combined with multiple karst basins. Secondly, the projection of climate change has great uncertainty, and the applicability of downscaling methods is inconsistent in different regions. There are many meteorological factors affecting drought, and future studies can integrate the effects of various factors, such as wind speed, relative humidity and radiation, to further improve the accuracy of drought assessment [45].
5.4. Suggestions
According to the results of the drought assessment, the drought in the Chengbi River basin is still relatively severe in the 2040s. Therefore, for this period, the water agencies need to pay more attention to drought prevention and should adjust drought mitigation strategies in time to reduce local water shortages during the dry season. Meanwhile, most of the basin experiences a substantial increase in precipitation during the 2080s, so the agencies involved should be alert to flooding. From the 2040s to the 2080s, the drought conditions in the Chengbi River basin are alleviated, but the water agencies should nevertheless take appropriate drought and flood prevention measures. Because projecting climate change is uncertain and the future climate may not evolve in that direction, appropriate preventive measures can reduce ecological, agricultural, and economic losses.
5.5. Uncertainty Analysis
Drought is a complex phenomenon caused by the interaction of hydrological and atmospheric processes, and thus there is some uncertainty in assessing future drought. Despite the series of quality controls adopted in this study to obtain objective and reasonable assessment conclusions, some uncertainties are still inevitable. First, the ASD model is used as a downscaling tool to predict precipitation and temperature, however, the complex topographic features of the Chengbi River karst area bring considerable challenges for the model when simulating climate change with high accuracy. Meanwhile, the differences in climate scenarios, interpolation methods and the length of the climate data series used to calculate the SPEI lead to some hard-to-eliminate uncertainties. For the special topography of the Chengbi River basin, different predictors are selected at each station to maintain the stability of the simulation series, and then the model is calibrated by multiple stations to make it more accurate in characterizing the climate heterogeneity of the karst area. The influence of anthropogenic greenhouse gases (CO2) and radiative forcing on regional climate change has increased significantly in recent years. Three SSP scenarios are applied in this study, which not only consider climate change in the future but consider the influence of various factors including population, environment, economic development and government management. Therefore, it can more comprehensively reflect future change conditions. The results obtained by different spatial interpolation methods are different. In this study, the classical IDW method is chosen to interpolate the spatial variation of precipitation and drought, which can reduce some uncertainty effects. If the length of the climate data series is too short, it may bring more uncertainty to the calculation results [46]. In this study, 57a (1963–2019) precipitation and temperature data series are used for the historical period in the calculation of the SPEI, and the total length of future climate change data is 78a (2023–2100), which reduces the impact of uncertainty caused by data length. Despite the existence of these uncertainties, this paper underwent strict quality control to minimize the impact of regional variability on drought assessment results.
6. Conclusions
Drought has devastating influences on agricultural production, the hydrological cycle, economic development and ecological construction. Therefore, scientific projections of future drought conditions are important for karst drought disaster mitigation and water resources management. The following conclusions have been obtained from this study:
(1) According to the performance metrics of the ASD model, the average value of KGE and NSE for precipitation is 0.866 and 0.889, respectively; and the average value of both KGE and NSE for temperature is 0.989, which proves that the ASD model has good downscaling performance when characterizing karst climatic heterogeneous features areas.
(2) In terms of time, precipitation is mainly on the rise on both monthly and annual scales. In terms of space, annual precipitation is decreasing in the upstream areas and increased significantly in the southwestern areas. Although temperature also shows an upward trend, its amplitude of increase is very small, with a maximum increase of 0.04 °C over the next 70 years.
(3) According to drought assessment results, the drought conditions are alleviated from the 2040s to the 2080s compared with the historical period. However, the drought condition in the 2040s is still relatively severe. From the SSP1-2.6 scenario to the SSP5-8.5 scenario, the trend of drought may also increase.
Author Contributions
Conceptualization, C.M. and K.H.; data curation, formal analysis, methodology, software and visualization, P.T., K.H. and J.D.; funding acquisition, C.M.; project administration, C.M. and X.L.; supervision, G.S.; validation, S.L. and M.B.; writing—original draft, P.T.; writing—review and editing, Z.X. All authors have read and agreed to the published version of the manuscript.
Funding
This work was supported by the National Natural Science Foundation of China (Grant Nos. 52269002, 51969004), the Interdisciplinary Scientific Research Foundation of Guangxi University (Grant No. 2022JCC028), the Science and Technology Award Incubation Project of Guangxi University (Grant No. 2022BZJL023), the Guangxi Water Resource Technology Promotion Foundation (SK2021-3-23), and the science.
Institutional Review Board Statement
Not applicable. This study did not involve humans or animals.
Informed Consent Statement
Not applicable. The study did not involve humans.
Data Availability Statement
Some or all data that support the findings of this study are available from the corresponding author upon reasonable request.
Conflicts of Interest
The authors declare no conflict of interest.
References
- Cook, B.I.; Mankin, J.S.; Anchukaitis, K.J. Climate Change and Drought: From Past to Future. Curr. Clim. Change Rep. 2018, 4, 164–179. [Google Scholar] [CrossRef]
- Liu, C.; Yang, C.; Yang, Q.; Wang, J. Spatiotemporal drought analysis by the standardized precipitation index (SPI) and standardized precipitation evapotranspiration index (SPEI) in Sichuan Province, China. Sci. Rep. 2021, 11, 1280–1294. [Google Scholar] [CrossRef] [PubMed]
- Funk, C.; Shukla, S.; Thiaw, W.M.; Rowland, J.; Hoell, A.; McNally, A.; Husak, G.; Novella, N.; Budde, M.; Peters-Lidard, C.; et al. Recognizing the Famine Early Warning Systems Network: Over 30 Years of Drought Early Warning Science Advances and Partnerships Promoting Global Food Security. Bull. Am. Meteorol. Soc. 2019, 100, 1011–1027. [Google Scholar] [CrossRef]
- Song, Z.; Xia, J.; She, D.; Li, L.; Hu, C.; Hong, S. Assessment of meteorological drought change in the 21st century based on CMIP6 multi-model ensemble projections over mainland China. J. Hydrol. 2021, 601, 126643. [Google Scholar] [CrossRef]
- Williams, A.P.; Cook, B.I.; Smerdon, J.E. Rapid intensification of the emerging southwestern North American megadrought in 2020–2021. Nat. Clim. Change 2022, 12, 232–234. [Google Scholar] [CrossRef]
- Gong, X.; Du, S.; Li, F.; Ding, Y. Study on the Spatial and Temporal Characteristics of Mesoscale Drought in China under Future Climate Change Scenarios. Water 2021, 13, 2761. [Google Scholar] [CrossRef]
- Karamouz, M.; Nazif, S.; Zahmatkesh, Z. Self-Organizing Gaussian-Based Downscaling of ClimateData for Simulation of Urban Drainage Systems. J. Irrig. Drain. Eng. 2013, 139, 98–112. [Google Scholar] [CrossRef]
- Rummukainen, M. State-of-the-art with regional climate models. WIREs Clim. Change 2010, 1, 82–96. [Google Scholar] [CrossRef]
- Wells, N.; Goddard, S.; Hayes, M.J. A Self-calibrating Palmer Drought Severity Index. J. Clim. 2004, 17, 2335–2351. [Google Scholar] [CrossRef]
- McKee, T.B.; Doesken, N.J.; Kleist, J. The relationship of drought frequency and duration to time scales. In Proceedings of the 8th Conference on Applied Climatology, Anaheim, CA, USA, 17–22 January 1993; pp. 179–183. [Google Scholar]
- Vicente-Serrano, S.M.; Beguería, S.; López-Moreno, J.I. A Multiscalar Drought Index Sensitive to Global Warming: The Standardized Precipitation Evapotranspiration Index. J. Clim. 2010, 23, 1696–1718. [Google Scholar] [CrossRef]
- Bonacci, O.; Bonacci, D.; Roje-Bonacci, T.; Vrsalović, A. Proposal of a new method for drought analysis. J. Hydrol. Hydromech. 2023, 71, 100–110. [Google Scholar] [CrossRef]
- Ahmadalipour, A.; Moradkhani, H.; Svoboda, M. Centennial drought outlook over the CONUS using NASA-NEX downscaled climate ensemble. Int. J. Climatol. 2017, 37, 2477–2491. [Google Scholar] [CrossRef]
- Danandeh Mehr, A.; Sorman, A.U.; Kahya, E.; Hesami Afshar, M. Climate change impacts on meteorological drought using SPI and SPEI: Case study of Ankara, Turkey. Hydrol. Sci. J. 2019, 65, 254–268. [Google Scholar] [CrossRef]
- Li, S.-Y.; Miao, L.-J.; Jiang, Z.-H.; Wang, G.-J.; Gnyawali, K.R.; Zhang, J.; Zhang, H.; Fang, K.; He, Y.; Li, C. Projected drought conditions in Northwest China with CMIP6 models under combined SSPs and RCPs for 2015–2099. Adv. Clim. Change Res. 2020, 11, 210–217. [Google Scholar] [CrossRef]
- Li, L.; She, D.; Zheng, H.; Lin, P.; Yang, Z.-L. Elucidating Diverse Drought Characteristics from Two Meteorological Drought Indices (SPI and SPEI) in China. J. Hydrometeorol. 2020, 21, 1513–1530. [Google Scholar] [CrossRef]
- Zhou, Q.; Chen, L.; Singh, V.P.; Zhou, J.; Chen, X.; Xiong, L. Rainfall-runoff simulation in karst dominated areas based on a coupled conceptual hydrological model. J. Hydrol. 2019, 573, 524–533. [Google Scholar] [CrossRef]
- Mo, C.; Ruan, Y.; He, J.; Jin, J.; Liu, P.; Sun, G. Frequency analysis of precipitation extremes under climate change. Int. J. Climatol. 2019, 39, 1373–1387. [Google Scholar] [CrossRef]
- Mo, C.; Meng, X.; Ruan, Y.; Wang, Y.; Lei, X.; Xing, Z.; Lai, S. Drought Assessment Based on Fused Satellite and Station Precipitation Data: An Example from the Chengbi River Basin, China. ISPRS Int. J. Geo-Inf. 2022, 11, 48. [Google Scholar] [CrossRef]
- Mo, C.; Ruan, Y.; Xiao, X.; Lan, H.; Jin, J. Impact of climate change and human activities on the baseflow in a typical karst basin, Southwest China. Ecol. Indic. 2021, 126, 107628. [Google Scholar] [CrossRef]
- Eyring, V.; Bony, S.; Meehl, G.A.; Senior, C.A.; Stevens, B.; Stouffer, R.J.; Taylor, K.E. Overview of the Coupled Model Intercomparison Project Phase 6 (CMIP6) experimental design and organization. Geosci. Model Dev. 2016, 9, 1937–1958. [Google Scholar] [CrossRef]
- Phuong, D.N.D.; Duong, T.Q.; Liem, N.D.; Tram, V.N.Q.; Cuong, D.K.; Loi, N.K. Projections of Future Climate Change in the Vu Gia Thu Bon River Basin, Vietnam by Using Statistical DownScaling Model (SDSM). Water 2020, 12, 755. [Google Scholar] [CrossRef]
- Drobinski, P.; Silva, N.D.; Panthou, G.; Bastin, S.; Muller, C.; Ahrens, B.; Borga, M.; Conte, D.; Fosser, G.; Giorgi, F.; et al. Scaling precipitation extremes with temperature in the Mediterranean: Past climate assessment and projection in anthropogenic scenarios. Clim. Dyn. 2016, 51, 1237–1257. [Google Scholar] [CrossRef]
- O’Neill, B.C.; Kriegler, E.; Riahi, K.; Ebi, K.L.; Hallegatte, S.; Carter, T.R.; Mathur, R.; van Vuuren, D.P. A new scenario framework for climate change research: The concept of shared socioeconomic pathways. Clim. Change 2013, 122, 387–400. [Google Scholar] [CrossRef]
- Hessami, M.; Gachon, P.; Ouarda, T.B.M.J.; St-Hilaire, A. Automated regression-based statistical downscaling tool. Environ. Model. Softw. 2008, 23, 813–834. [Google Scholar] [CrossRef]
- Gupta, H.V.; Kling, H.; Yilmaz, K.K.; Martinez, G.F. Decomposition of the mean squared error and NSE performance criteria: Implications for improving hydrological modelling. J. Hydrol. 2009, 377, 80–91. [Google Scholar] [CrossRef]
- Nash, J.E.; Sutcliffe, J.V. River flow forecasting through conceptual models part I—A discusssion of principles. J. Hydrol. 1970, 10, 282–290. [Google Scholar] [CrossRef]
- Knoben, W.J.M.; Freer, J.E.; Woods, R.A. Technical note: Inherent benchmark or not? Comparing Nash–Sutcliffe and Kling–Gupta efficiency scores. Hydrol. Earth Syst. Sci. 2019, 23, 4323–4331. [Google Scholar] [CrossRef]
- Yu, M.; Li, Q.; Hayes, M.J.; Svoboda, M.D.; Heim, R.R. Are droughts becoming more frequent or severe in China based on the Standardized Precipitation Evapotranspiration Index: 1951-2010? Int. J. Climatol. 2014, 34, 545–558. [Google Scholar] [CrossRef]
- Stevanović, Z. Karst waters in potable water supply: A global scale overview. Environ. Earth Sci. 2019, 78, 662–674. [Google Scholar] [CrossRef]
- Baghanam, A.H.; Eslahi, M.; Sheikhbabaei, A.; Seifi, A.J. Assessing the impact of climate change over the northwest of Iran: An overview of statistical downscaling methods. Theor. Appl. Climatol. 2020, 141, 1135–1150. [Google Scholar] [CrossRef]
- Liu, C.; Li, Z.; Berhe, A.A.; Zeng, G.; Xiao, H.; Liu, L.; Wang, D.; Peng, H. Chemical characterization and source identification of organic matter in eroded sediments: Role of land use and erosion intensity. Chem. Geol. 2019, 506, 97–112. [Google Scholar] [CrossRef]
- Zhang, Q.; Yao, Y.; Li, Y.; Huang, J.; Ma, Z.; Wang, Z.; Wang, S.; Wang, Y.; Zhang, Y. Causes and Changes of Drought in China: Research Progress and Prospects. J. Meteorol. Res. 2020, 34, 460–481. [Google Scholar] [CrossRef]
- Liu, P.; Xu, Z.; Li, X. Projection of Climate Change Scenarios in Different Temperature Zones in the Eastern Monsoon Region, China. Water 2017, 9, 305. [Google Scholar] [CrossRef]
- Guo, B.; Zhang, J.; Xu, T. Comparison of two statistical climate downscaling models: A case study in the Beijing region, China. Int. J. Water 2018, 12, 22–38. [Google Scholar] [CrossRef]
- Wu, C.; Huang, G. Projection of climate extremes in the Zhujiang River basin using a regional climate model. Int. J. Climatol. 2016, 36, 1184–1196. [Google Scholar] [CrossRef]
- Touseef, M.; Chen, L.; Yang, K.; Chen, Y. Long-Term Rainfall Trends and Future Projections over Xijiang River Basin, China. Adv. Meteorol. 2020, 2020, 6852148. [Google Scholar] [CrossRef]
- Yao, N.; Li, L.; Feng, P.; Feng, H.; Li, L.; Liu, Y.; Jiang, K.; Hu, X.; Li, Y. Projections of drought characteristics in China based on a standardized precipitation and evapotranspiration index and multiple GCMs. Sci. Total Environ. 2020, 704, 135245. [Google Scholar] [CrossRef]
- Dai, A.; Zhao, T.; Chen, J. Climate Change and Drought: A Precipitation and Evaporation Perspective. Curr. Clim. Change Rep. 2018, 4, 301–312. [Google Scholar] [CrossRef]
- Vogel, M.M.; Hauser, M.; Seneviratne, S.I. Projected changes in hot, dry and wet extreme events’ clusters in CMIP6 multi-model ensemble. Environ. Res. Lett. 2020, 15, 094021. [Google Scholar] [CrossRef]
- Zhu, H.; Jiang, Z.; Li, L. Projection of climate extremes in China, an incremental exercise from CMIP5 to CMIP6. Sci. Bull. 2021, 66, 2528–2537. [Google Scholar] [CrossRef]
- Nkiaka, E.; Nawaz, N.R.; Lovett, J.C. Effect of single and multi-site calibration techniques on hydrological model performance, parameter estimation and predictive uncertainty: A case study in the Logone catchment, Lake Chad basin. Stoch. Environ. Res. Risk Assess. 2018, 32, 1665–1682. [Google Scholar] [CrossRef]
- Mo, C.; Chen, X.; Lei, X.; Wang, Y.; Ruan, Y.; Lai, S.; Xing, Z. Evaluation of Hydrological Simulation in a Karst Basin with Different Calibration Methods and Rainfall Inputs. Atmosphere 2022, 13, 844. [Google Scholar] [CrossRef]
- Wang, H.; Chen, Y.; Pan, Y.; Chen, Z.; Ren, Z. Assessment of candidate distributions for SPI/SPEI and sensitivity of drought to climatic variables in China. Int. J. Climatol. 2019, 39, 4392–4412. [Google Scholar] [CrossRef]
- Mukherjee, S.; Mishra, A.; Trenberth, K.E. Climate Change and Drought: A Perspective on Drought Indices. Curr. Clim. Change Rep. 2018, 4, 145–163. [Google Scholar] [CrossRef]
- Carbone, G.J.; Lu, J.; Brunetti, M. Estimating uncertainty associated with the standardized precipitation index. Int. J. Climatol. 2018, 38, e607–e616. [Google Scholar] [CrossRef]
Figure 1.
The location of the Chengbi River basin and the distribution of the stations.

Figure 2.
The structure chart of the study.

Figure 3.
The construction of the ASD model.

Figure 4.
Variation of monthly average precipitation in the Chengbi River basin for different periods.
Figure 4.
Variation of monthly average precipitation in the Chengbi River basin for different periods.

Figure 5.
Spatial distribution of annual average precipitation variability in the Chengbi River basin for the whole future period. Note: The red line in the figure is the zero lines dividing the increasing or decreasing regions.
Figure 5.
Spatial distribution of annual average precipitation variability in the Chengbi River basin for the whole future period. Note: The red line in the figure is the zero lines dividing the increasing or decreasing regions.

Figure 6.
The variations of the monthly average temperatures in the Chengbi River basin for different periods.
Figure 6.
The variations of the monthly average temperatures in the Chengbi River basin for different periods.

Figure 7.
The variation of the 12-month SPEI values in the Chengbi River basin for the historical period.
Figure 7.
The variation of the 12-month SPEI values in the Chengbi River basin for the historical period.

Figure 8.
The variation of the 12-month SPEI values in the Chengbi River basin for different future periods under different scenarios. Note: Each peak position represents the distribution location where SPEI values are concentrated; the peak positions are connected by black lines, and the red color indicates the trend of the SPEI values.

Figure 9.
Comparison of drought durations in the historical period in the Chengbi River basin. Note: (a) is the spatial distribution of drought duration in the historical period. (b) is the spatial distribution of the percentage of drought duration in the historical period.
Figure 9.
Comparison of drought durations in the historical period in the Chengbi River basin. Note: (a) is the spatial distribution of drought duration in the historical period. (b) is the spatial distribution of the percentage of drought duration in the historical period.

Figure 10.
Comparison of drought durations under different scenarios for different future periods in the Chengbi River basin.
Figure 10.
Comparison of drought durations under different scenarios for different future periods in the Chengbi River basin.

Figure 11.
Comparison of three index values for the historical period in the Chengbi River basin. Note: The yellow hollow square frame indicates time of occurrence of drought which are used to compared with the drought time displayed by NDI. The red line indicates the trend of the NDI values. (A) is the variation of the 12-month SPEI values in the historical period. (B) is the variation of the 12-month SPI values in the historical period. (C) is the variation of NDI values on an annual scale in the historical period. (D) is the variation of the cumulative value of NDI on an annual scale in the historical period.


Table 1.
Detailed information on each station in the Chengbi River basin.
| Stations | (mm) | (mm) | (mm) | (°C) | (°C) | (°C) |
|---|---|---|---|---|---|---|
| Bashou | 1422 | 803 | 1113 | / | / | / |
| Pingtang | 1792 | 805 | 1299 | / | / | / |
| Haokun | 2009 | 816 | 1413 | / | / | / |
| Lingyun | 2381 | 995 | 1688 | / | / | / |
| Xiatang | 1682 | 743 | 1213 | / | / | / |
| Bailian | 1536 | 671 | 1104 | / | / | / |
| Linhe | 1476 | 554 | 1015 | / | / | / |
| Chaoli | 2087 | 876 | 1482 | / | / | / |
| Xiajia | 2303 | 905 | 1604 | / | / | / |
| Nongtang | 2123 | 929 | 1526 | / | / | / |
| Jiefu | 2305 | 1068 | 1687 | / | / | / |
| Donghe | 2409 | 956 | 1683 | / | / | / |
| Baise | / | / | / | 39.4 | 3.3 | 21.35 |
Note: is maximum annual precipitation; is minimum annual precipitation; is average annual
precipitation; is maximum annual temperature; is minimum annual temperature; is average annual temperature.
Table 2.
Information regarding the predictors.
| Serial Number | Predictors | Name of Predictor |
|---|---|---|
| 1 | mslpgl | Average sea level pressure |
| 2 | p1_fgl | 1000 hPa wind speed |
| 3 | p1_ugl | 1000 hPa latitudinal wind |
| 4 | p1_vgl | 1000 hPa longitudinal wind |
| 5 | p5_ugl | 500 hPa longitudinal wind |
| 6 | p5_vgl | 500 hPa latitudinal wind |
| 7 | p8_ugl | 850 hPa longitudinal wind |
| 8 | p8_vgl | 850 hPa latitudinal wind |
| 9 | p500gl | 500 hPa geopotential height |
| 10 | p850gl | 850 hPa geopotential height |
| 11 | prcpgl | Precipitation |
| 12 | s500gl | 500 hPa absolute humidity |
| 13 | s850gl | 850 hPa absolute humidity |
| 14 | shumgl | Near-surface humidity |
| 15 | tempgl | Average temperature at 2 m height |
Table 3.
Accuracy assessment of monthly average precipitation and temperature at each station in the Chengbi River basin during the calibration period.
Table 3.
Accuracy assessment of monthly average precipitation and temperature at each station in the Chengbi River basin during the calibration period.
| Predictand | Station | Predictors | KEG | NSE | ||
|---|---|---|---|---|---|---|
| NCEP | GCM | NCEP | GCM | |||
| Precipitation | Bailian | 5, 7, 11, 13 | 0.959 | 0.693 | 0.997 | 0.795 |
| Bashang | 2, 11, 12, 13, 14 | 0.942 | 0.608 | 0.994 | 0.491 | |
| Chaoli | 5, 12, 13, 14 | 0.954 | 0.936 | 0.996 | 0.961 | |
| Donghe | 5, 9, 12, 14, 15 | 0.943 | 0.930 | 0.995 | 0.975 | |
| Haokun | 12, 13, 14, 15 | 0.947 | 0.749 | 0.995 | 0.813 | |
| Jiefu | 1, 5, 9, 12, 15 | 0.946 | 0.935 | 0.993 | 0.965 | |
| Lingyun | 1, 12, 13, 14, 15 | 0.967 | 0.831 | 0.998 | 0.947 | |
| Linhe | 1, 10, 12, 15 | 0.953 | 0.883 | 0.996 | 0.955 | |
| Nongtang | 1, 5, 9, 15 | 0.947 | 0.923 | 0.996 | 0.963 | |
| Pintang | 2, 12, 13, 14 | 0.944 | 0.716 | 0.996 | 0.814 | |
| Xiajia | 1, 4, 5, 10, 14 | 0.957 | 0.962 | 0.997 | 0.983 | |
| Xiatang | 1, 10, 12, 13, 15 | 0.977 | 0.708 | 0.999 | 0.821 | |
| Temperature | Baise | 3, 4, 5, 7, 8, 13, 14 | 0.999 | 0.999 | 0.999 | 0.999 |
Note: The annotated serial numbers of the predictors are shown in Table 2.
Table 4.
Accuracy assessment of precipitation and temperature at each station in the Chengbi River basin during the validation period.
Table 4.
Accuracy assessment of precipitation and temperature at each station in the Chengbi River basin during the validation period.
| Predictand | Station | KEG | NSE | ||
|---|---|---|---|---|---|
| NCEP | GCM | NCEP | GCM | ||
| Precipitation | Bailian | 0.894 | 0.715 | 0.847 | 0.745 |
| Bashang | 0.814 | 0.528 | 0.924 | 0.372 | |
| Chaoli | 0.914 | 0.889 | 0.893 | 0.786 | |
| Donghe | 0.935 | 0.934 | 0.922 | 0.916 | |
| Haokun | 0.905 | 0.796 | 0.952 | 0.808 | |
| Jiefu | 0.945 | 0.919 | 0.903 | 0.882 | |
| Lingyun | 0.918 | 0.939 | 0.940 | 0.926 | |
| Linhe | 0.789 | 0.739 | 0.833 | 0.814 | |
| Nongtang | 0.931 | 0.935 | 0.885 | 0.901 | |
| Pintang | 0.872 | 0.559 | 0.935 | 0.697 | |
| Xiajia | 0.915 | 0.913 | 0.900 | 0.865 | |
| Xiatang | 0.973 | 0.567 | 0.965 | 0.626 | |
| Temperature | Baise | 0.990 | 0.965 | 0.996 | 0.984 |
Table 5.
Summary of the annual average precipitation in the Chengbi River basin for different future periods under different scenarios.
Table 5.
Summary of the annual average precipitation in the Chengbi River basin for different future periods under different scenarios.
| Periods | Annual Average Precipitation (mm) | ||||
|---|---|---|---|---|---|
| Scenario | 2040s | 2060s | 2080s | The Whole Future Period | |
| SSP1-2.6 | 1446.1 | 1519.2 | 1526.6 | 1495.8 | |
| SSP2-4.5 | 1389.4 | 1508.5 | 1588.8 | 1496.6 | |
| SSP5-8.5 | 1224.5 | 1460.7 | 1873.5 | 1534.7 | |
Table 6.
Summary of the annual average temperature in the Chengbi River basin for different future periods under different scenarios.
Table 6.
Summary of the annual average temperature in the Chengbi River basin for different future periods under different scenarios.
| Periods | Annual Average Precipitation (mm) | ||||
|---|---|---|---|---|---|
| Scenario | 2040s | 2060s | 2080s | The Whole Future Period | |
| SSP1-2.6 | 22.92 | 22.98 | 23.02 | 22.98 | |
| SSP2-4.5 | 22.86 | 23.02 | 23.08 | 22.99 | |
| SSP5-8.5 | 22.82 | 23.04 | 23.16 | 23.01 | |
Table 7.
Classification of drought levels based on SPEI.
| Situation | Extreme Drought | Moderate Drought | Light Drought | Normal | Light Wetness | Moderate Wetness | Extreme Wetness |
|---|---|---|---|---|---|---|---|
| SPEI | ≤−2.0 | −2.0 to −1.0 | −1.0 to −0.5 | −0.5 to 0.5 | 0.5 to 1.0 | 1.0 to 2.0 | ≥2.0 |
Disclaimer/Publisher’s Note: The statements, opinions and data contained in all publications are solely those of the individual author(s) and contributor(s) and not of MDPI and/or the editor(s). MDPI and/or the editor(s) disclaim responsibility for any injury to people or property resulting from any ideas, methods, instructions or products referred to in the content. |
© 2023 by the authors. Licensee MDPI, Basel, Switzerland. This article is an open access article distributed under the terms and conditions of the Creative Commons Attribution (CC BY) license (https://creativecommons.org/licenses/by/4.0/).
Share and Cite
MDPI and ACS Style
Mo, C.; Tang, P.; Huang, K.; Lei, X.; Lai, S.; Deng, J.; Bao, M.; Sun, G.; Xing, Z. Evolution of Drought Trends under Climate Change Scenarios in Karst Basin. Water 2023, 15, 1934. https://doi.org/10.3390/w15101934
AMA Style
Mo C, Tang P, Huang K, Lei X, Lai S, Deng J, Bao M, Sun G, Xing Z. Evolution of Drought Trends under Climate Change Scenarios in Karst Basin. Water. 2023; 15(10):1934. https://doi.org/10.3390/w15101934
Chicago/Turabian StyleMo, Chongxun, Peiyu Tang, Keke Huang, Xingbi Lei, Shufeng Lai, Juan Deng, Mengxiang Bao, Guikai Sun, and Zhenxiang Xing. 2023. "Evolution of Drought Trends under Climate Change Scenarios in Karst Basin" Water 15, no. 10: 1934. https://doi.org/10.3390/w15101934
Note that from the first issue of 2016, this journal uses article numbers instead of page numbers. See further details here.