
Sand Spit Morphology at an Inlet on Phu Quoc Island, Vietnam
by
 , , , and
Dinh Van Duy
1,* ,
,
Tran Van Ty
1,
Tran Nhat Thanh
1,
Huynh Vuong Thu Minh
2 ,
,
Cao Van De
3,
Vu Hoang Thai Duong
4,
Trinh Cong Dan
4,
Nguyen Trung Viet
5 and
and
Hitoshi Tanaka
6
1
Water Resource Engineering Faculty, College of Engineering, Can Tho University, Can Tho 94115, Vietnam
2
Water Resources Department, College of Environment and Natural Resources, Can Tho University, Can Tho 94115, Vietnam
3
Institute of Coastal and Offshore Engineering, 658 Vo Van Kiet Street, Ward 1, District 5, Ho Chi Minh City 74900, Vietnam
4
Institute of Water and River Basin Management, Karlsruhe Institute of Technology, Kaiserallee 12, 76131 Karlruhe, Germany
5
Faculty of Civil Engineering, Thuy Loi University, Ha Noi 11515, Vietnam
6
Institute of Liberal Arts and Sciences, Tohoku University, 41 Kawauchi, Aoba-ku, Sendai 980-8576, Japan
*
Author to whom correspondence should be addressed.
Water 2023, 15(10), 1941; https://doi.org/10.3390/w15101941
Submission received: 11 April 2023
/
Revised: 14 May 2023
/
Accepted: 16 May 2023
/
Published: 20 May 2023
(This article belongs to the Special Issue Riverine Inputs into the Ocean—a Sedimentological and Geochemical Approach)
Abstract
:Tidal inlets with attached sand spits are a very common coastal landform. Since the evolution of sand spits along coastlines influence the social-economic development of local coastal areas, sand spits have become the objects of numerous studies. However, previous studies have mainly focused on sand spits that are usually in the scale of hundreds of meters in width, whilst knowledge about the evolution of smaller-scale sand spits still remains limited. Therefore, in this study, the morphological change of a small and unexplored sand spit in front of Song Tranh Inlet on the west coast of Phu Quoc Island, Vietnam is investigated. Satellite images are first used to observe the morphological change of the sand spit and calculate the longshore sediment transport rates (LSTR) along the sand spit. Waves and beach sediments are collected at the study site to calculate the longshore sediment transport rate using the CERC formula. It is found that there is a seasonal variation in the evolution of the sand spit at Song Tranh Inlet. The longshore sediment transport rates along the spit calculated by image analysis are 39,000 m3/year, 66,000 m3/year, and 40,000 m3/year, whilst the longshore sediment transport rate calculated by the CERC formula is 72,000 m3/year. This study aims to contribute to the methodology for investigating the evolutions of small sand spits and, specifically, sustainable coastal management for Phu Quoc Island, which is well-known as the Pearl Island of Vietnam.
1. Introduction
A sand spit (or spit) is a narrow and elongated sediment body attached to land on one side, whilst the other end is free in open waters [1]. The evolution of sand spits is a subject of great interest in coastal engineering since they result from a mixture of complex processes including wave transformation, tidal exchange, longshore sediment transport rates (LSTR), river discharge, and in particular, the river sediment bedload transport process [2,3,4]. Due to the important role of sand spits in the coastal environments around coastal bays, lagoons, and river mouths, sand spits have become the subject of numerous studies to fully understand spit evolution [2,5]. For example, a spit can act as a barrier to protect the mainland from extreme waves during storms [6,7,8]. The unique and beautiful coastal landscapes of sand spits can also create a big tourism attraction [9,10]. Estuaries and lagoons behind the spits are areas of high productivity in supporting human wellbeing and the habitats of many species [5,11]. Beside the numerous advantages, a spit also causes various problems for the management of coastal tidal inlets and river mouths [12]. For example, the development of sand spits can block the waterway, thus affecting the navigability of the channel [7,13,14]. Therefore, jetties are usually constructed to stabilize the inlets or river mouths and prevent siltation by littoral materials [15,16,17]. However, a jetty can significantly alter the longshore sediment transport regime and erode the beach downdrift of the jetty [17,18].
A larger number of publications have attempted to fully understand spit evolution through numerous methods such as field observation, analytical solution, numerical and physical modeling, and image analysis. For instance, Thomas et al. [19] combined the field-observed data with aerial photographs to study the long-term evolution of a sand spit that was dominated by wave direction. Hoan et al. [20] used the concept of the spit growth model proposed by Kraus [21] to model the elongation of sand spits on Fire Inlet Island (USA) and Bedreveln (Sweden) with the assumption that the spit width is constant. Concerning the application of numerical modeling, Tanaka et al. [22] proposed a mathematical model to predict the seasonal migration of a river mouth, whilst Uda et al. [23] used the BG model developed based on Bagnold’s concept [24] to simulate the elongation of a sand spit under the complex effects of seabed slope, waves, and tidal flow. An idealized case of spit growth was investigated using an experimental method by Petersen et al. [25]. Satellite imagery analysis, among other methods, has been used intensively in studying the morphological changes of sand spits at inlets [2,13,26].
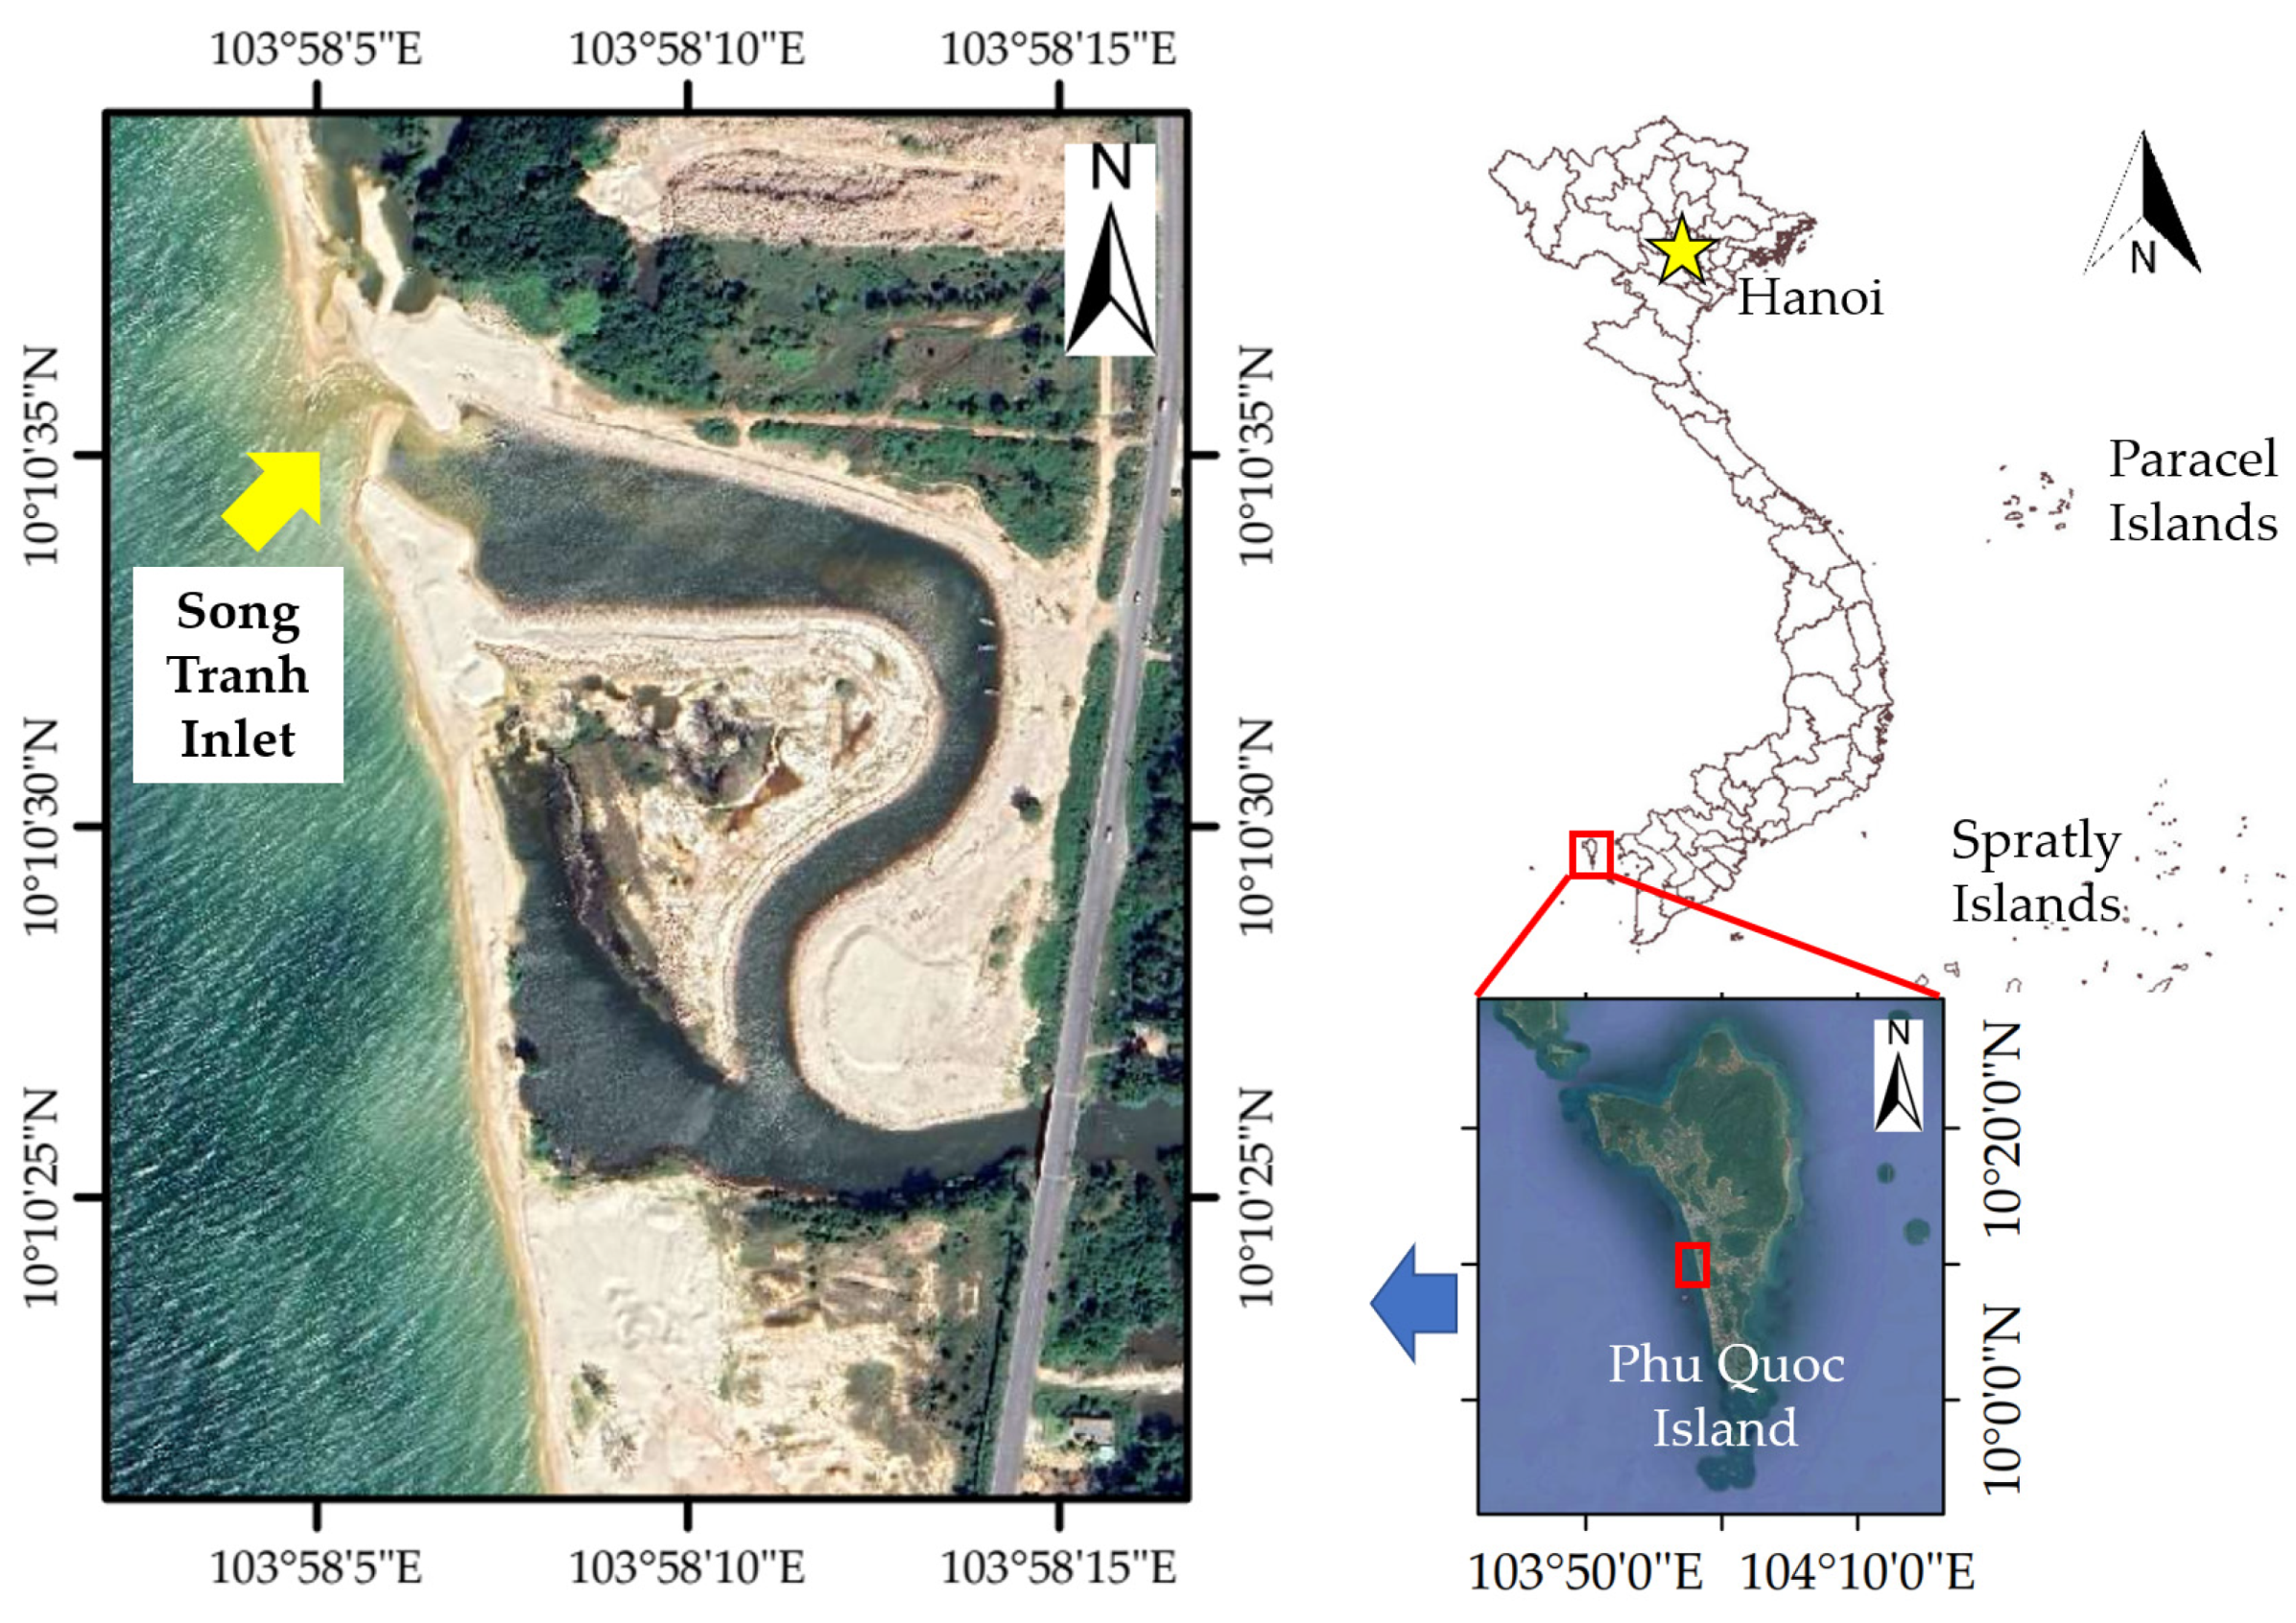
Recently, Lawson et al. [26] reviewed the relationship between sand spit growth rates and sand spit width for various estuaries in the world. Lawson et al. [26] noted that the majority of spits investigated had a width greater than 100 m. Narrow spits have rarely appeared in the literature. Since the width of a sand spit directly relates to its morphological change, this current study focuses on the evolution of a sand spit that is approximately 30 m wide at Song Tranh Inlet, Phu Quoc Island, Vietnam (Figure 1).
Song Tranh Inlet is located on the west coast of Phu Quoc Island, as shown in Figure 1. Phu Quoc Island became a provincial-level city in 2021 [27], with the main income resulting from tourism and related services owing to the beautiful beaches around the island [27]. Although tourism development in the coastal zone environment of the island has been growing at a rapid rate in recent years, studies on the dynamic balance of the coastlines remains limited.
In the last decades, only a few studies, both internationally and domestically, related to the coastal zone of Phu Quoc Island can be found in the literature, such as the study on coastal geomorphology and coastal erosion on Phu Quoc Island [28]. According to Nam et al. [28], erosion is predominant along the west coast of the island with the erosion length being about 35 km and the erosion rate of the beach over 1.5 m/year. They also found that the beach berm height along the west coast was approximately 1 m [28]. In 2016, Landsat imagery was analyzed to study the shoreline change of Phu Quoc Island from 1973 to 2010 using remote sensing and GIS technology [29]. The results showed that beach erosion was dominant from 1973 to 2010 with the maximum erosion rate of 0.82 m/year. Recently, a numerical model was used to assess the impact of infrastructure development on the balance status of the coastline on the east of the island [30]. Based on the results of the computer-based assessment, the constructions of an artificial island on the east coast of Phu Quoc Island has changed the hydrodynamic conditions and led to significant erosion of the surrounding beaches at rates from 6 to 6.5 m/year.
Overall, the previous studies mainly focused on the sand spits that are usually in the scale of 100 m in width. Therefore, the morphological change of an unexplored sand spit located in the west coast of Phu Quoc Island, Vietnam will be investigated in this study.
2. Materials and Methods
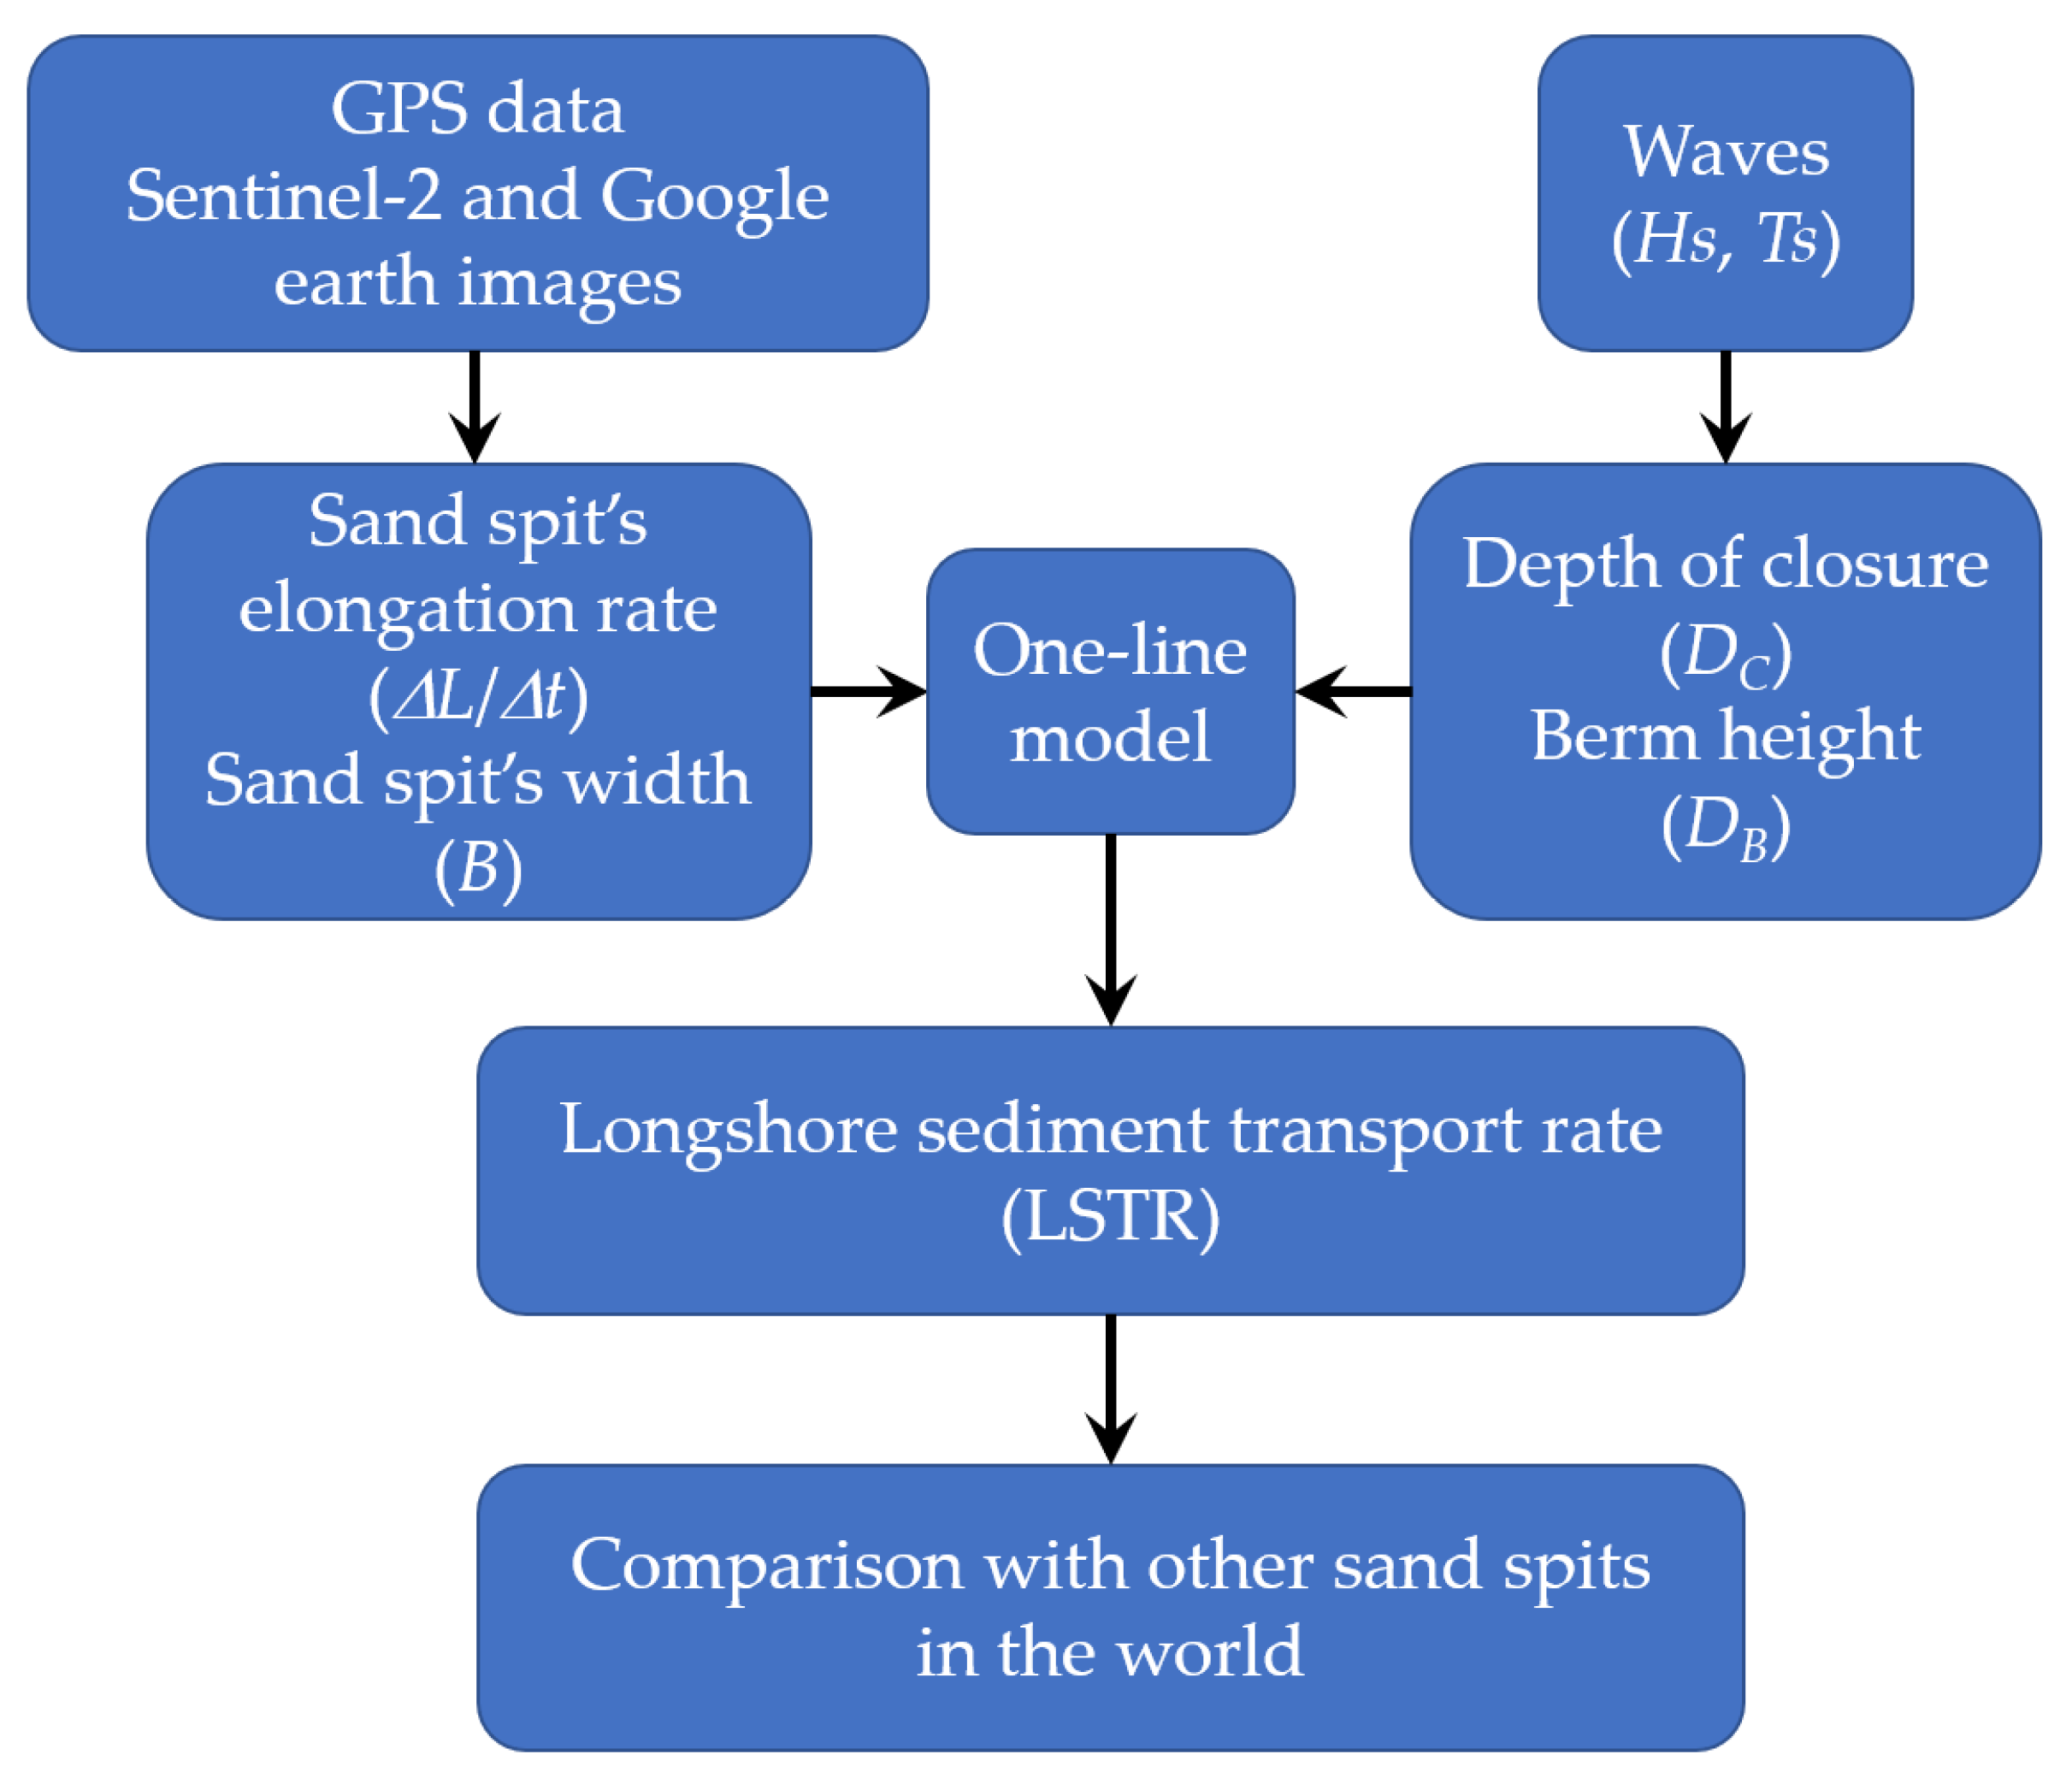
Figure 2 shows the approach used in our study. First, GPS data and satellite images (Sentinel-2 and Google Earth) were collected and used as an integral means [31] for observing the evolution of the sand spit. Wave data were also collected in the first step of the research. The waves were collected from two sources, which were the Wave ERA5 Global Reanalysis and the measured waves provided by the Phu Quoc Oceanography station. Second, the necessary parameters for calculating the LSTR, such as the sand spit’s elongation rate (ΔL/Δt), width (B), depth of closure (DC), and berm height (DB), were calculated. In the third step, the LSTR was calculated based on the idea of the one-line model. Finally, the LSTR at Song Tranh Inlet was compared with other values in the literature.
2.1. GPS Data and Image Analysis
2.1.1. GPS Data
A field trip to Song Tranh Inlet was undertaken in July 2022. During the field trip, the distal end of the sand spit was captured on 22 July 2022 by a smartphone with the GPS on to store the location of the sand spit’s distal end. These distal end coordinates were then used to calculate the length of the sand spit.
2.1.2. Satellite Image Analysis
Sentinel-2 images were collected from the United States Geological Survey (USGS) to monitor the shoreline change of the sand spit on the west coast of Phu Quoc Island. The Sentinel-2 images were collected in 2022. The information about the analysis of the Sentinel-2 imagery is shown in Table 1.
The normalized difference water index (NDWI) was used to delineate the water line from the sand using the following formula [32]:
where Xgreen and Xnir are the GREEN and NIR wavelengths, respectively.
According to [33], the mean shoreline error on natural beaches detected from the Sentinel-2 imagery reaches 3.06 m (±5.79 m).
In addition to the analysis of Sentinel-2 images, high-resolution images downloaded from Google Earth in 2022 are analyzed. Since the images downloaded from Google Earth are not multispectral images, they were processed using the method suggested by Pradjoko and Tanaka [34]. The information on Google Earth images is summarized in Table 1.
2.1.3. Geometric Characteristics of the Sand Spit
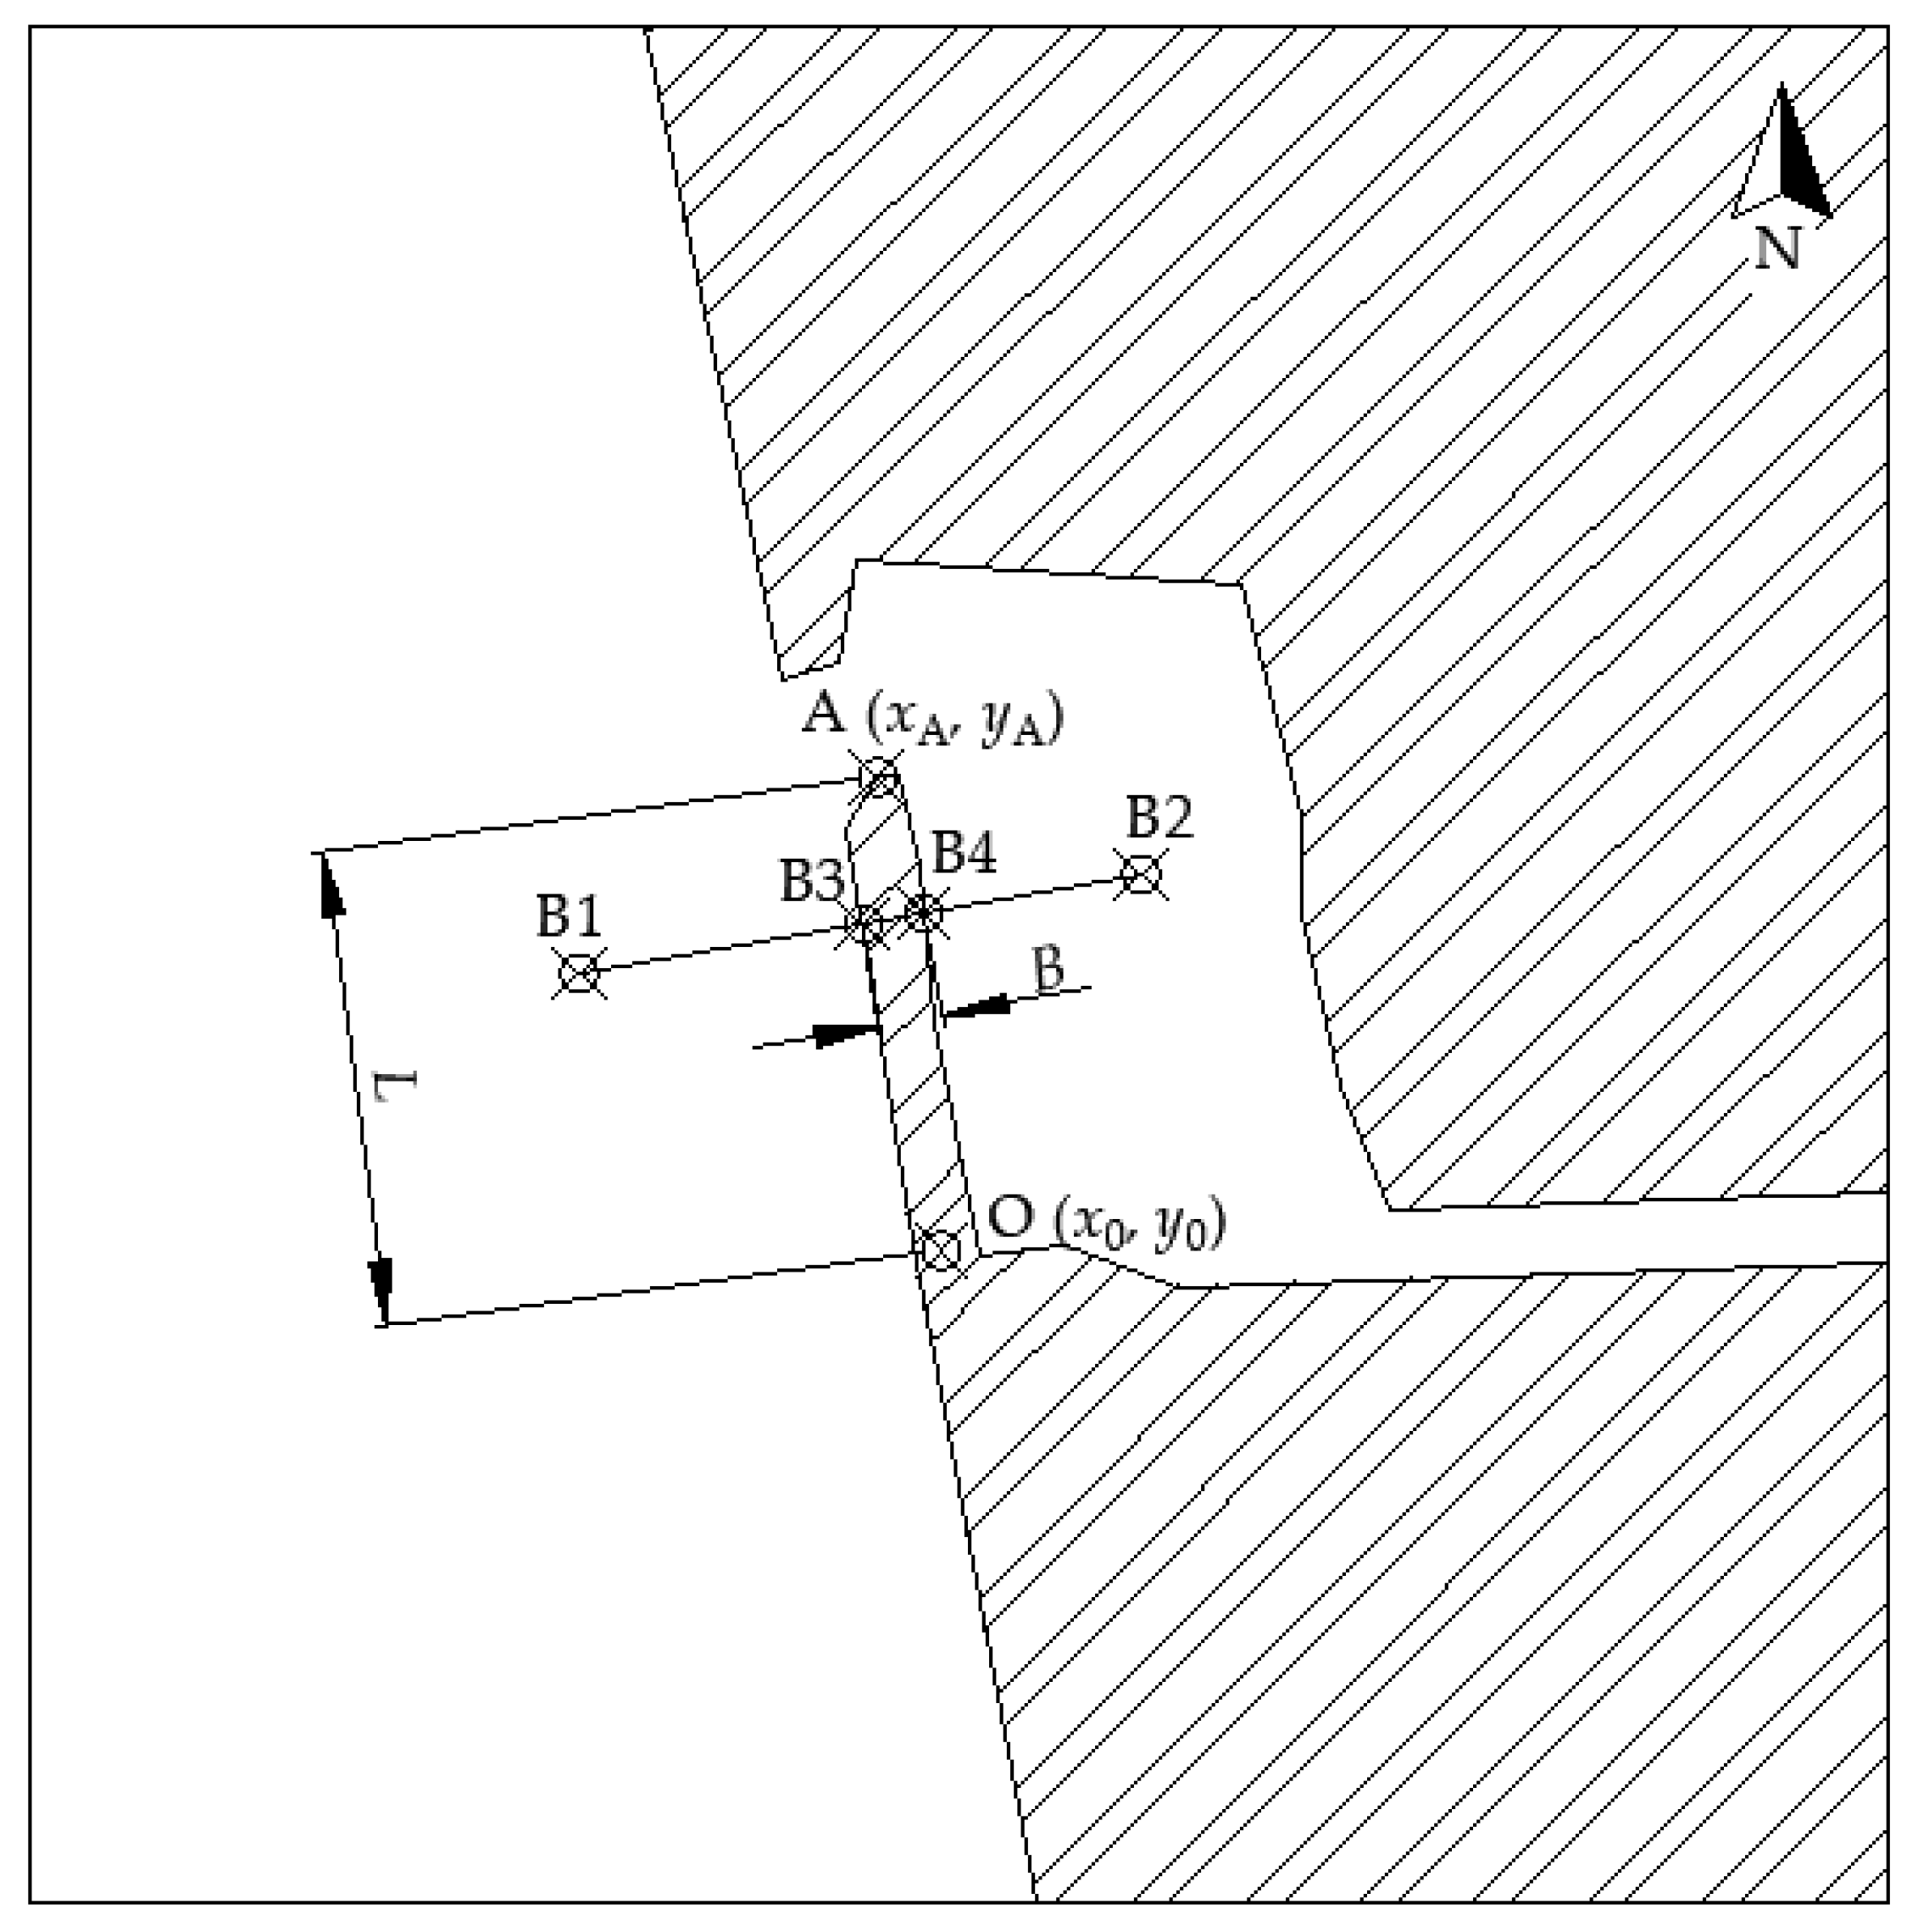
After extracting the shorelines, the length (L) and width (B) of the Song Tranh sand spit were calculated based on the geometry of the sand spit as shown in Figure 3. In addition, the temporal variations of the width (ΔB/Δt) and the length (ΔL/Δt) were quantified statistically using the linear regression rate (LRR) model. It can be seen from Figure 3 that the length of the sand spit is defined as the distance between the proximal end of the sand spit O(x0, y0) and the distal end of the sand spit A(xA, yA), where x0 = 10°10′25.45″ N, y0 = 103°58′7.62″ E, and xA, yA were measured from the extracted shoreline of the sand spit. Hence, the length of the sand spit was calculated as:
To calculate the width of the sand spit (B), a line crossing two points, B1(10°10′28.72″ N, 103°58′6.29″ E) and B2(10°10′29.30″ N, 103°58′8.31″ E), was used. This line cuts the shoreline of the sand spit at two points B3(xB3, yB3) and B4(xB3, yB3). Hence, the distance between B3 and B4 is the width of the sand spit:
2.2. Wave Data, Depth of Closure, and Beach Berm Height
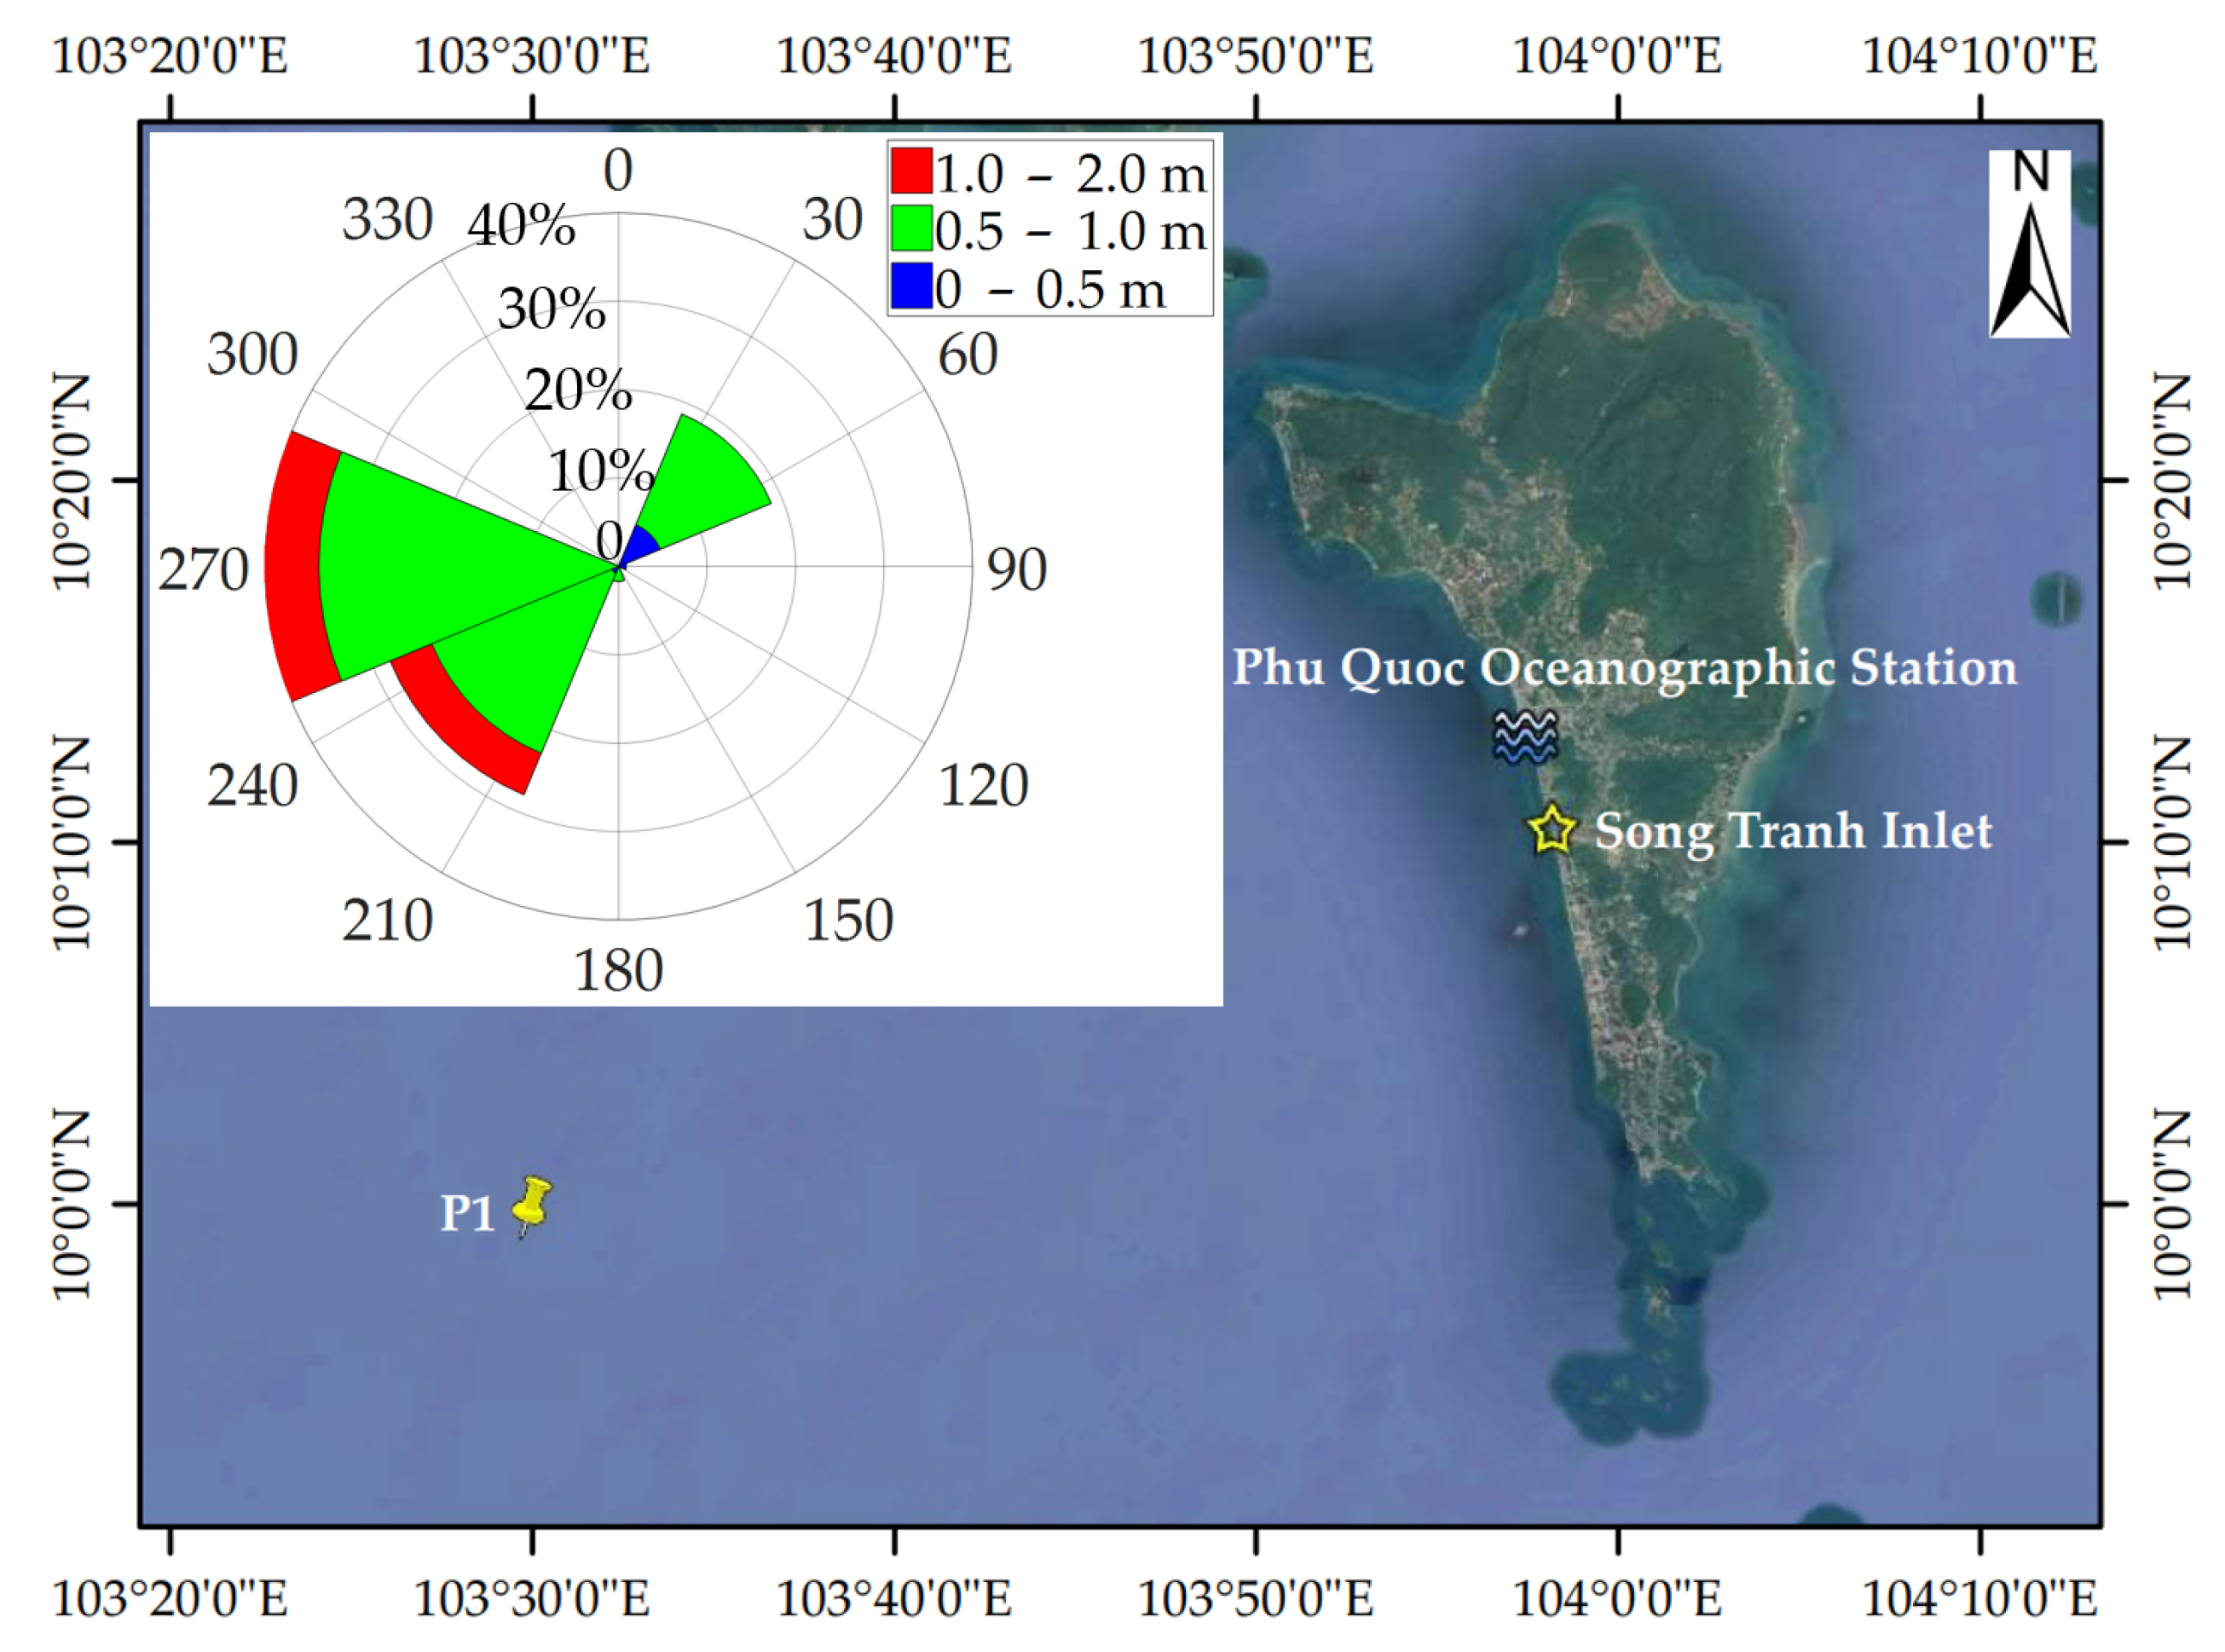
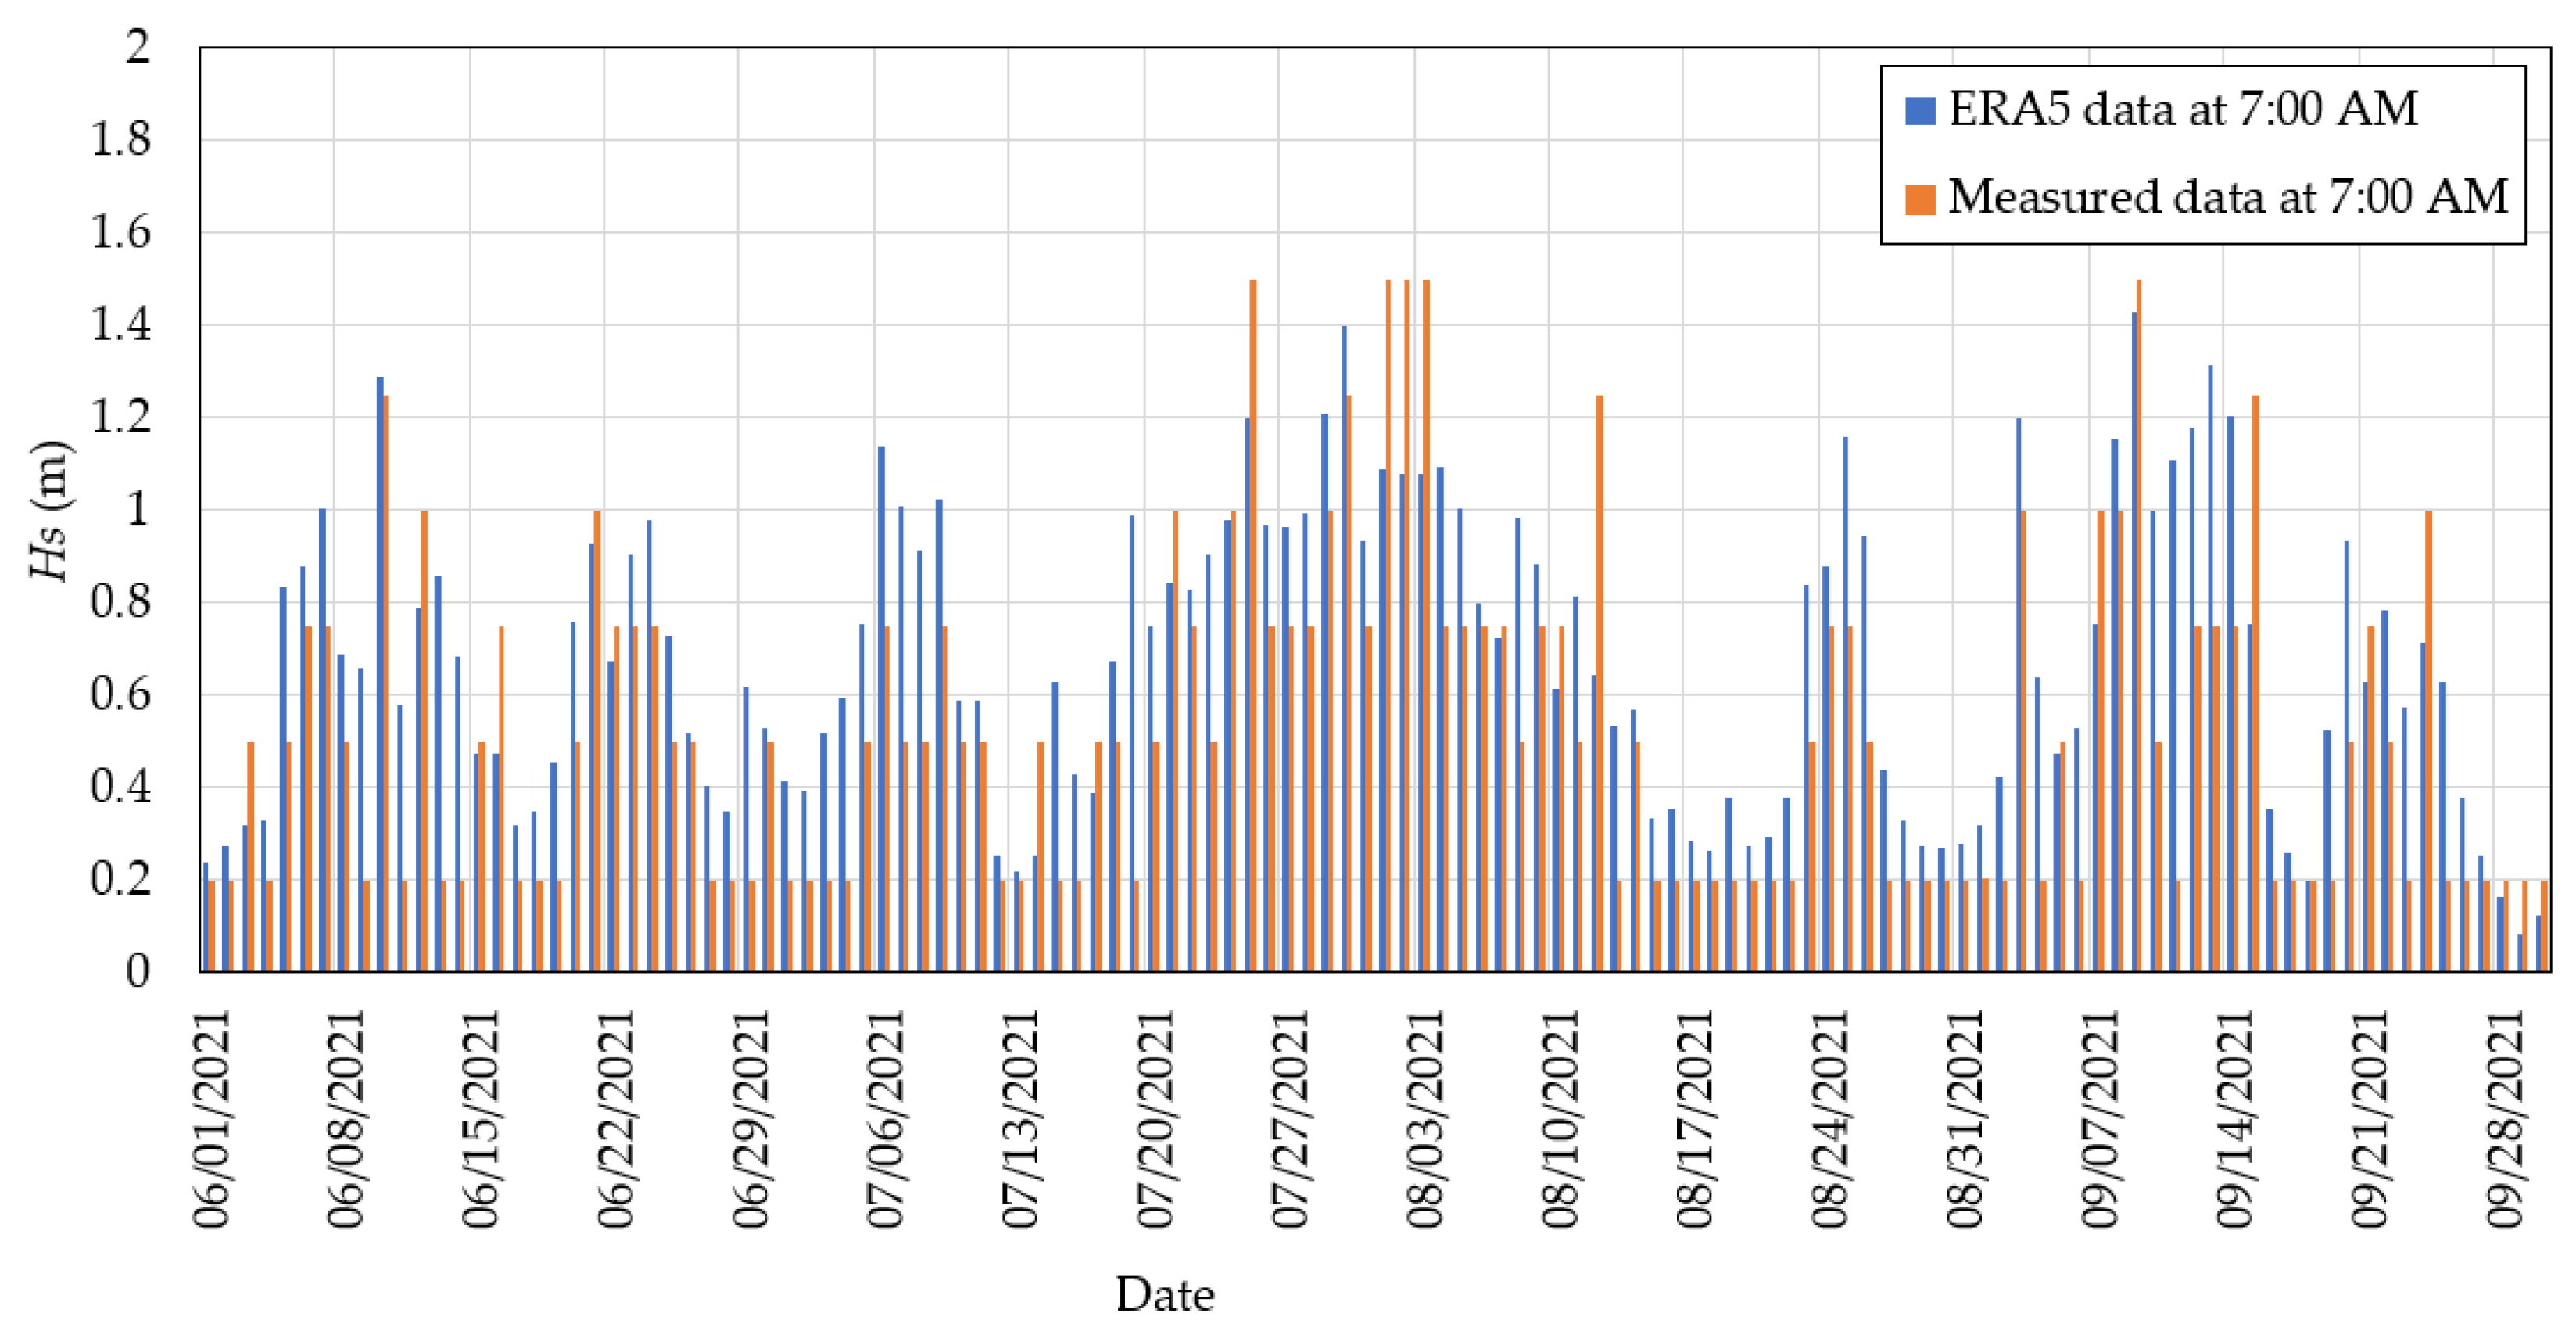
Wave data was extracted from offshore climate reanalysis data (ERA5) at location P1 (103.5°; 10°) and then transferred to Phu Quoc Island (Figure 4). Wave transferring from offshore to Phu Quoc Island was calculated based on the COASTEXCEL tool developed by Sana [35] and calibrated to ocean wave data measured at the Phu Quoc Oceanographic Station (Figure 4). Figure 5 shows the verification of wave transferring data from ERA5 at 7:00 AM (from June to September 2021) in comparison with measured data at Phu Quoc station at 7:00 AM (from June to September 2021). There was a good agreement between the transferred and the measured wave heights (from June to September 2021). Therefore, offshore waves downloaded from ERA5 were used for the analysis.
The transferred waves in 2022 were used for the calculation of the beach berm height (DB) and the depth of closure (DC), which are two important parameters for the estimation of the longshore sediment transport rate. The depth of closure is calculated using the equation of Hallermeier [36], as follows:
where DC is the depth of closure, Hse and Tse are the significant wave height and wave period, respectively, of the extreme wave condition (extremely high waves expected 12 h per year) [36], and g is the gravitational acceleration. According to Thomson and Harris [37], Tse should be taken to be the typical period of the measured wave height, and Hse can be calculated as:
where is the mean wave height defined by a full year of at least daily nearshore wave measurements, and σ is the standard deviation of wave height.
A beach berm is a natural form of beach profile created by sediment transport under wave action in the swash zone. The beach berm is usually obtained by field measurement [28,38]. In the case of no measured data, the berm height can be estimated from the depth of closure using the relationship as follows [39]:
2.3. Sediment Samples
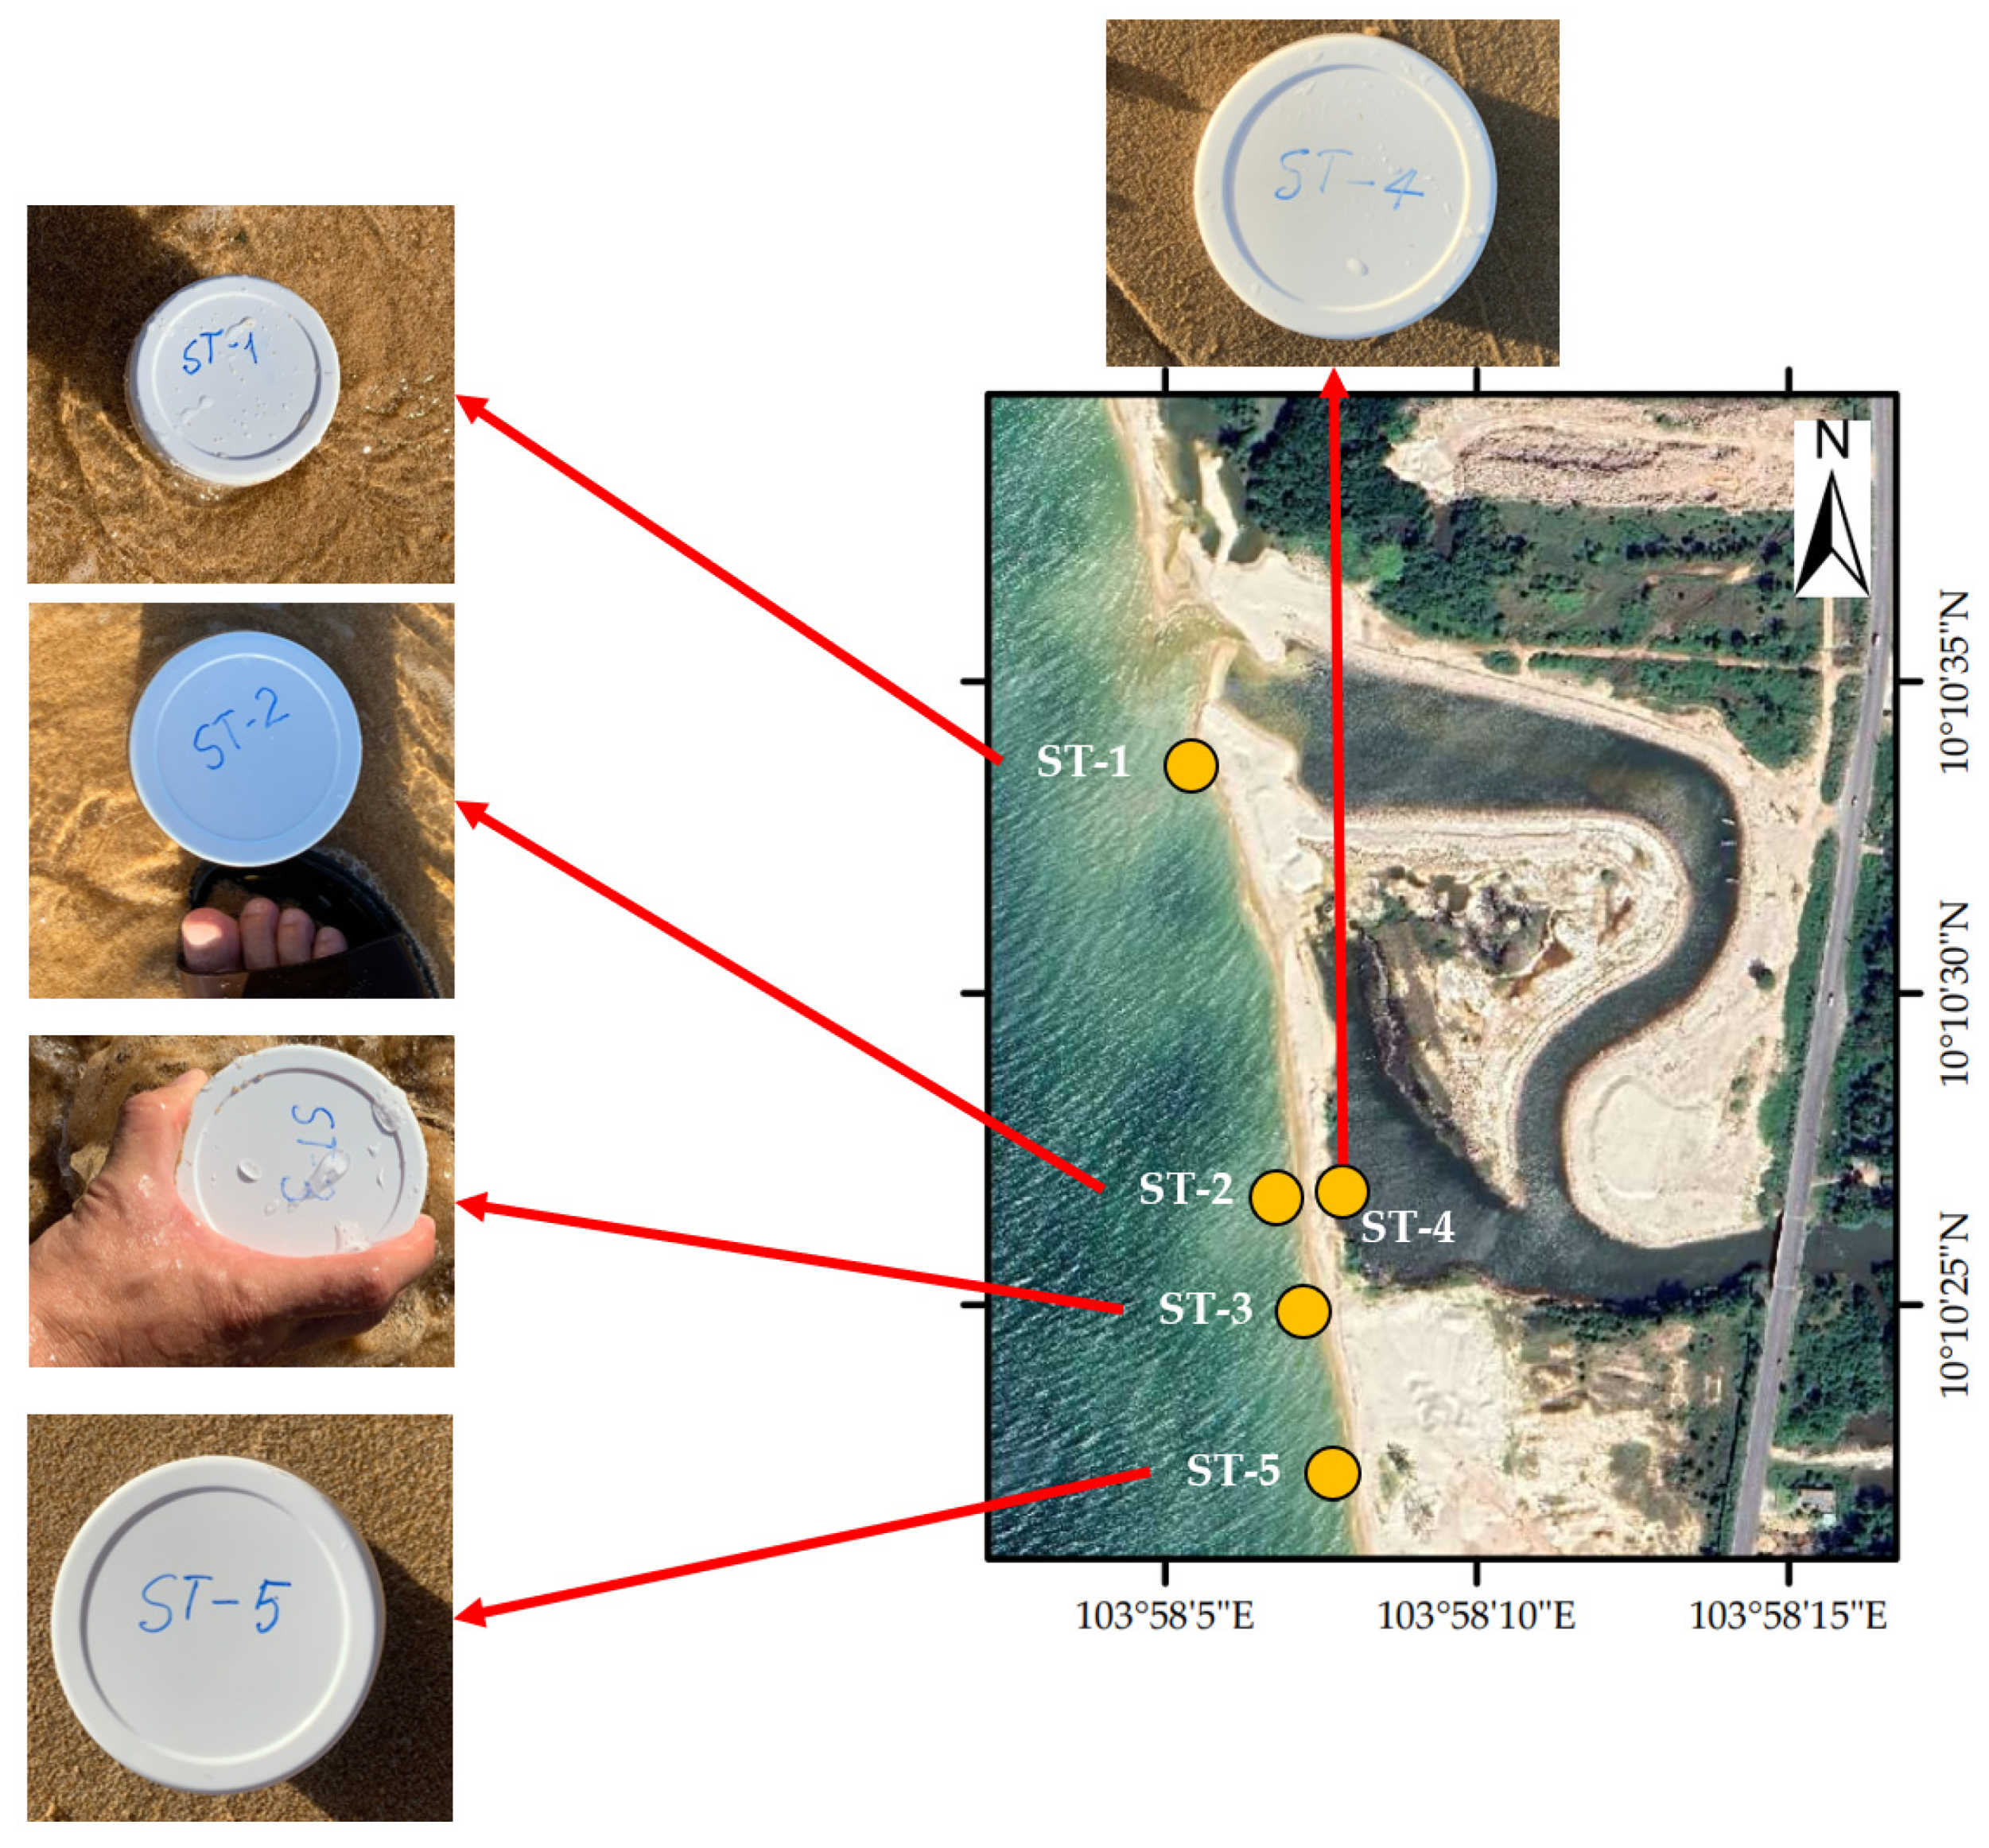
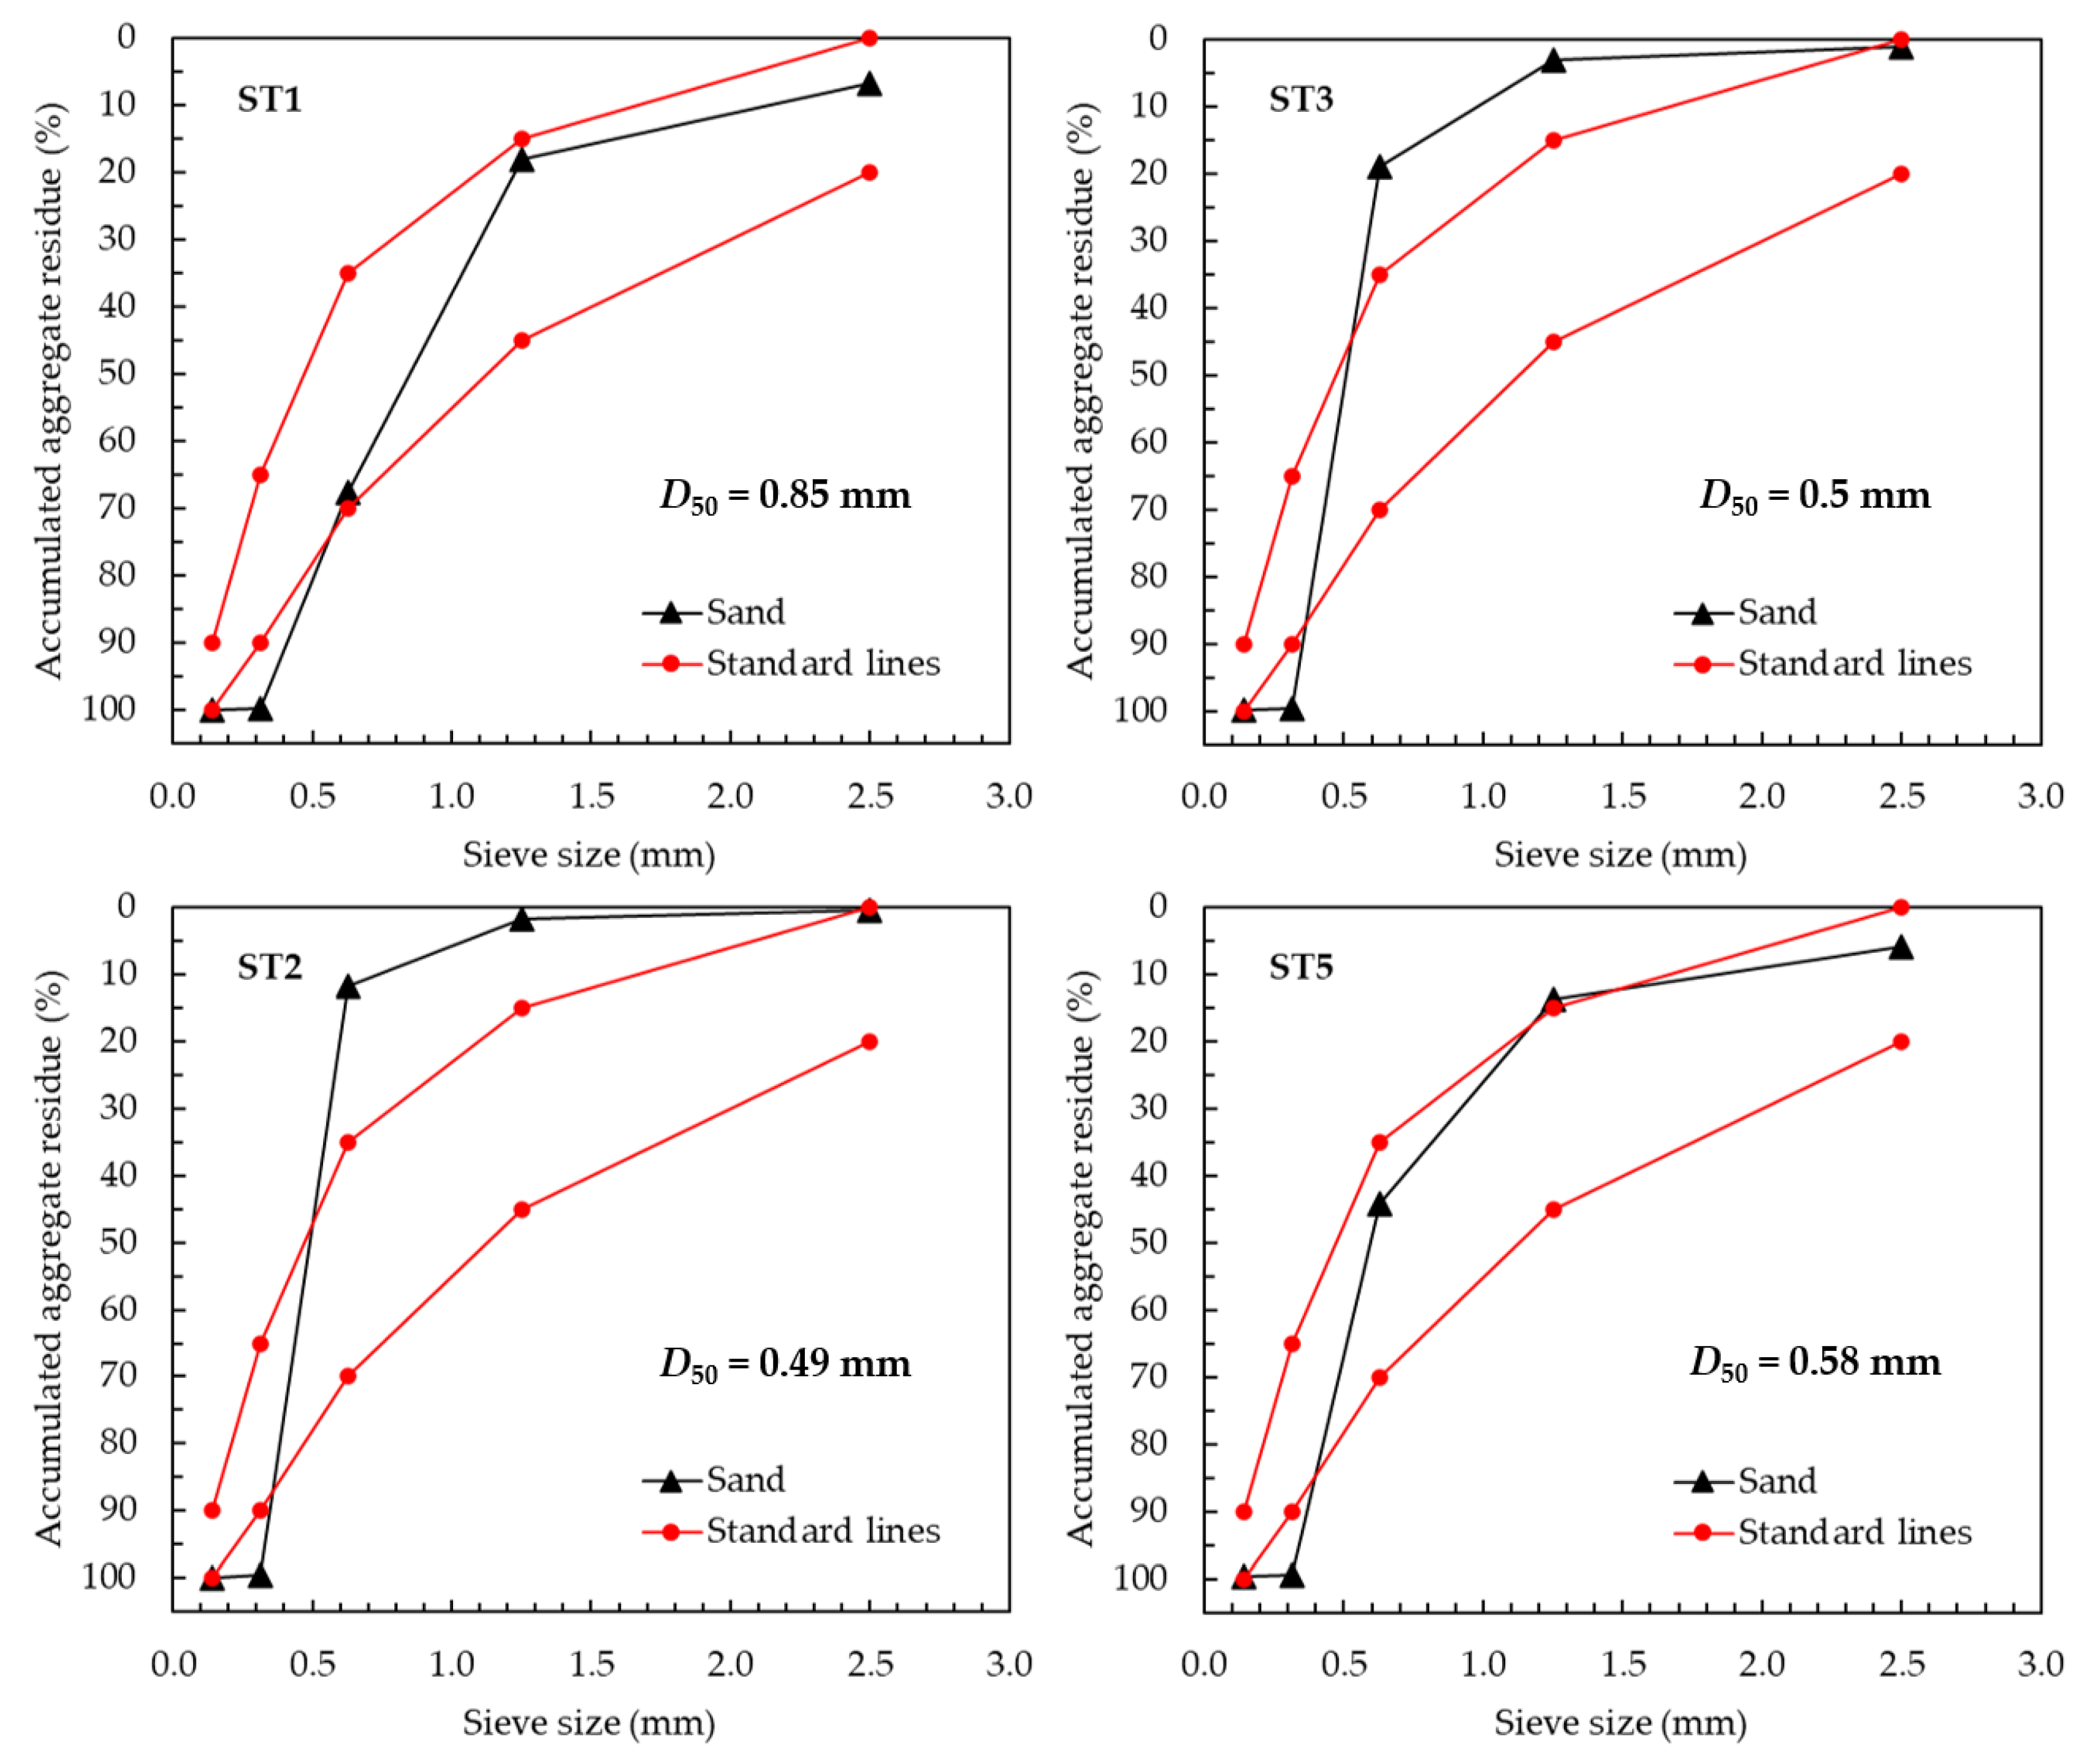
Since the measured waves were available at the study site, the CERC formula (Equation (10)) will be utilized for calculating the LSTR [40]. In the CERC formula, the coefficient K consistently varies with the median grain size of the beach sediment in millimeters (D50). Therefore, five samples of sediments were taken along the sand spit to determine the D50 of the sediment. The locations of the sediment samples are presented in Figure 6. The samples were taken during the field trip to Phu Quoc Island in July 2022. Because the waves at the time of field measurement were high, all sediment samples were taken at a depth of 0.5 to 1.0 m under water. The sediments were stored in plastic cans, as can be seen in Figure 6.
The sediment samples were then processed in the Center of Verifying and Construction Consultant of Can Tho University (https://crat.ctu.edu.vn (accessed on 12 September 2022)) to determine the (D50), as well as the density of the sand (ρs). The test method for defining the median grain size of the beach sediments was conducted in accordance with the Standard Specification for Concrete Aggregates (ASTM C33) [41,42,43].
2.4. Longshore Sediment Transport Rate
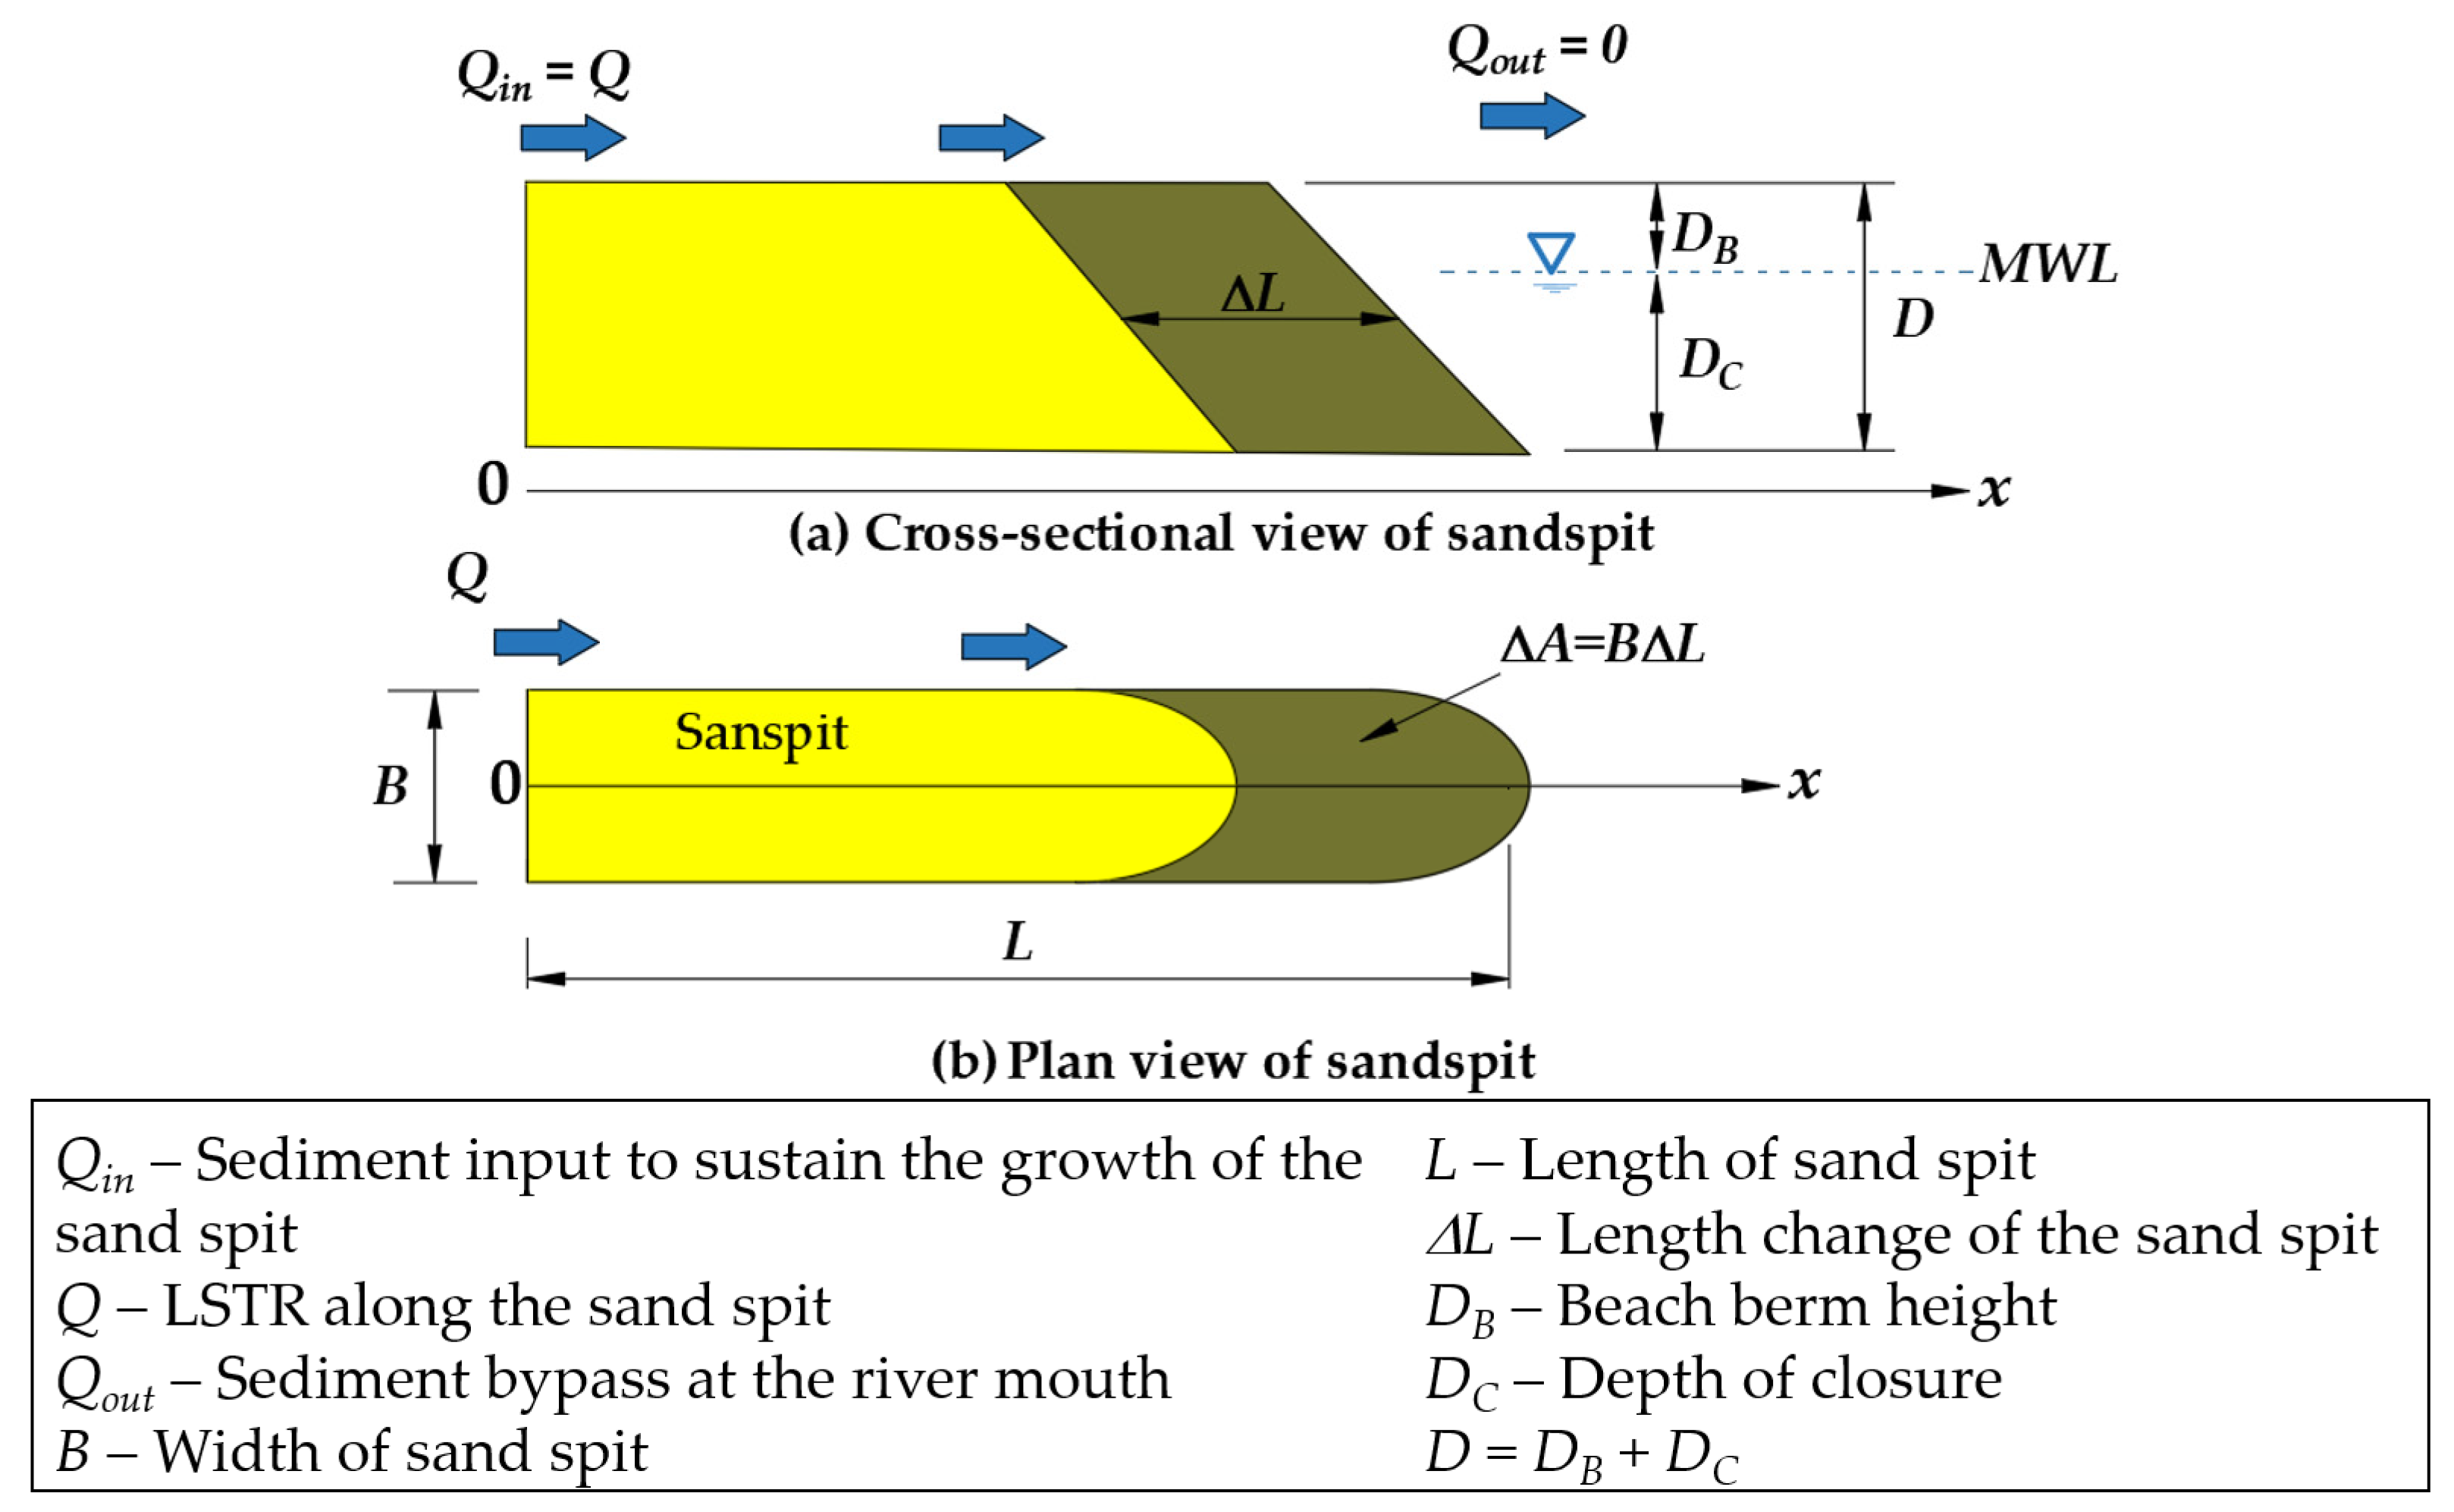
The results from image analysis were utilized to calculate the LSTR along the sand spit based on the theory of the one-line model, which was first introduced by [44] and subsequently modified for the case of sand spits [26] as presented in Figure 7.
The model of Lawson et al. [26] assumes that, on the plan view, longshore sediment transport (Q) directly feeds the growth of the sand spit, and there is no sediment loss at the tip of the sand spit (Qout = 0). Vertically, the movement of the sand is limited at an active depth of the beach that is the total of the berm height (DB) and the depth of closure (DC), as depicted in Figure 7a. Based on the above assumption, the LSTR can be calculated as:
where ΔA is the area change of the sand spit during its elongation period Δt. Hence:
where B is the width of the sand spit, which is assumed to be constant during its elongation period; ΔL/Δt is the elongation rate of the sand spit, which can be easily determined from the image analysis.
Substituting Equation (8) into Equation (7), the LSTR can be determined as:
Since the wave data were available at the study area, it is useful to make a calculation of LSTR based on the wave energy. This calculated value will be used to verify the LSTR calculated using the idea of the one-line model. The so-called “CERC” formula is often used to calculate the energy-based LSTR [40]:
where K is varied with median grain size (D50) of the sediment and can be calculated using the empirical relationship [45]:
where the value of the breaker index, κ, is 0.78 for flat beach and increases because of the beach slope [46]:
where m is the beach slope in the study area; here, m = 0.11 for the west coast of Phu Quoc Island, according to [28]. Hence, κ = 1.35. Other values for use in the LSTR formula are as follows: ρs is the density of beach sediment and determined from the sediment samples taken along the sand spit (ρs = 2775 kg/m3), ρ = 1025 kg/m3 is the density of salt water, g = 9.81 m/s2, and n = 0.4; breaking wave height, Hb, and breaking angle, αb, are taken as 0.6 m and 9°, respectively, based on the transferred wave data from ERA5 in 2022. It should be noted that the breaking wave height used in the CERC formula is the root mean square wave height (Hrms) at the breaker line, which is defined as the square root of the average of the squares of all wave heights and is calculated as follows [47]:
where HS is the significant wave height:
where Hn represents the individual wave heights, sorted into descending order of height as n increases from 1 to N (N is the number of waves). Only the highest one-third is used. The transformed wave heights from ERA5 wave data in 2022 were used for Equations (13) and (14).
2.5. Comparison with Other Study Areas in the World
In this section, an equation proposed by [2] will be utilized to present the sand spit growth rate as a function of the LSTR and the spit width as:
where Rs (m/year) is the sand spit growth rate, B (m) is the spit width, and α (m2/year) is the change rate coefficient.
3. Results
3.1. Temporal Variation of the Sand Spit’s Shorelines through Image Analysis
3.1.1. Elongation and Breaching of the Sand Spit
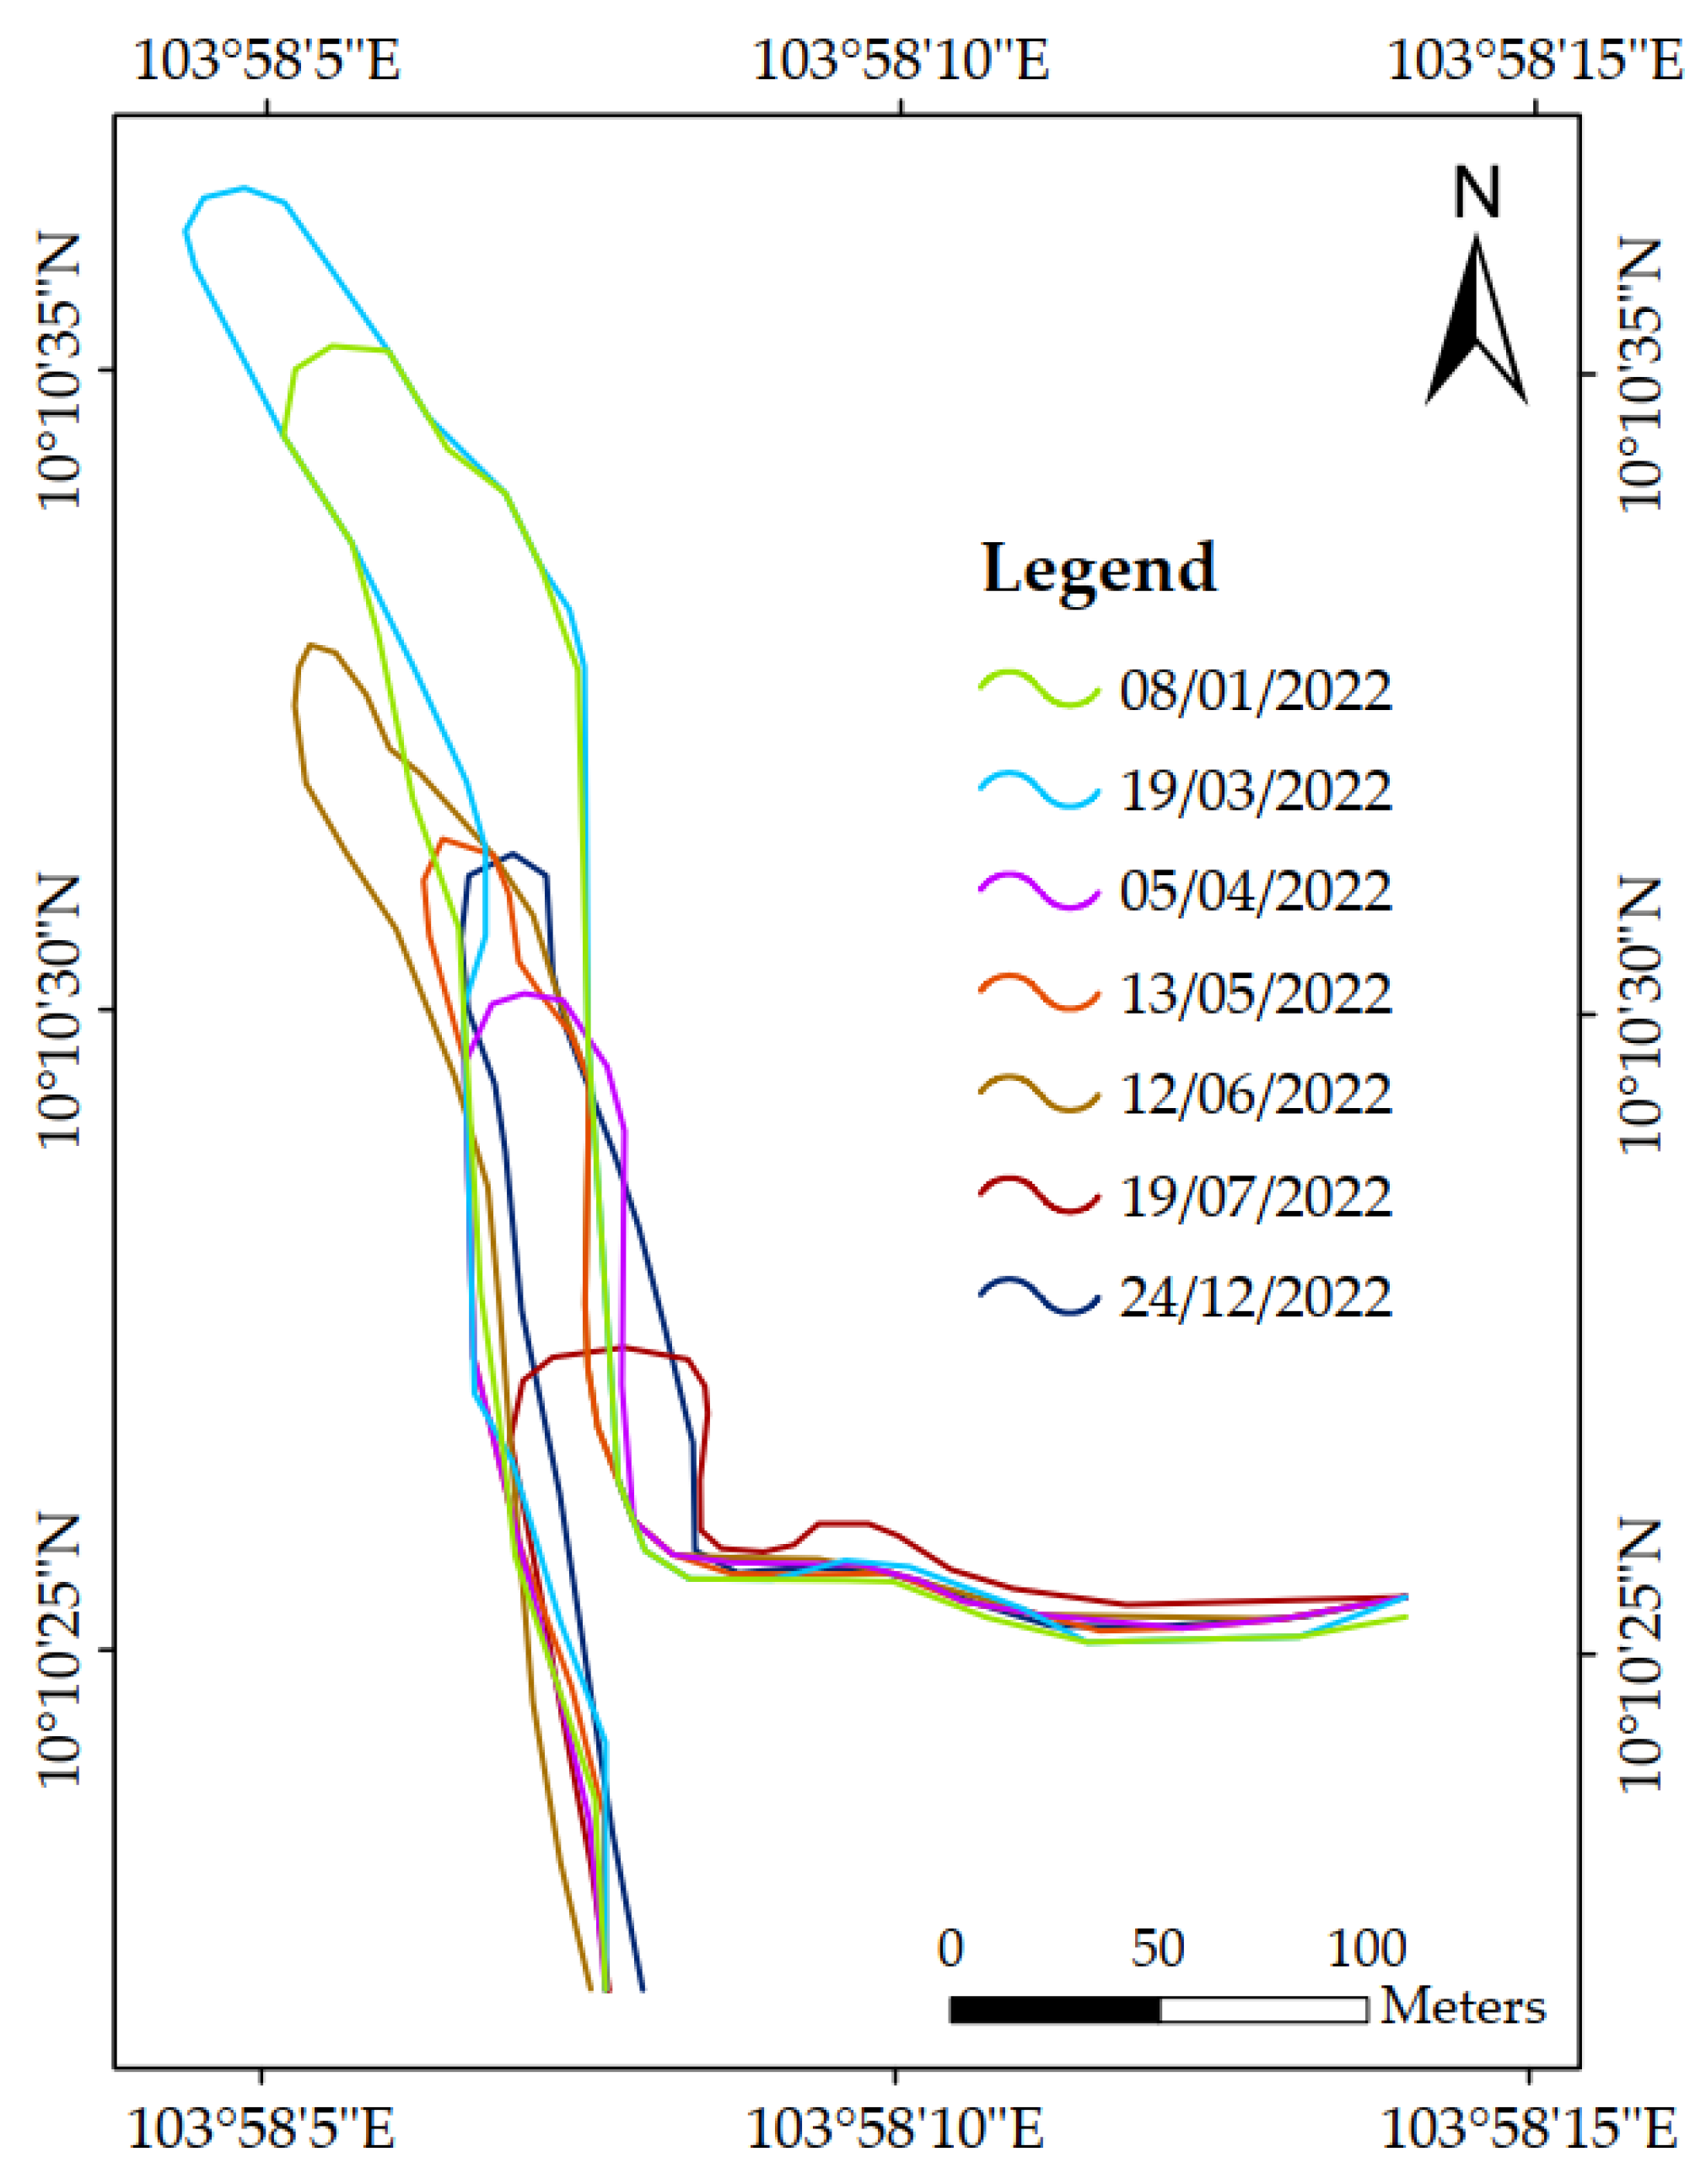
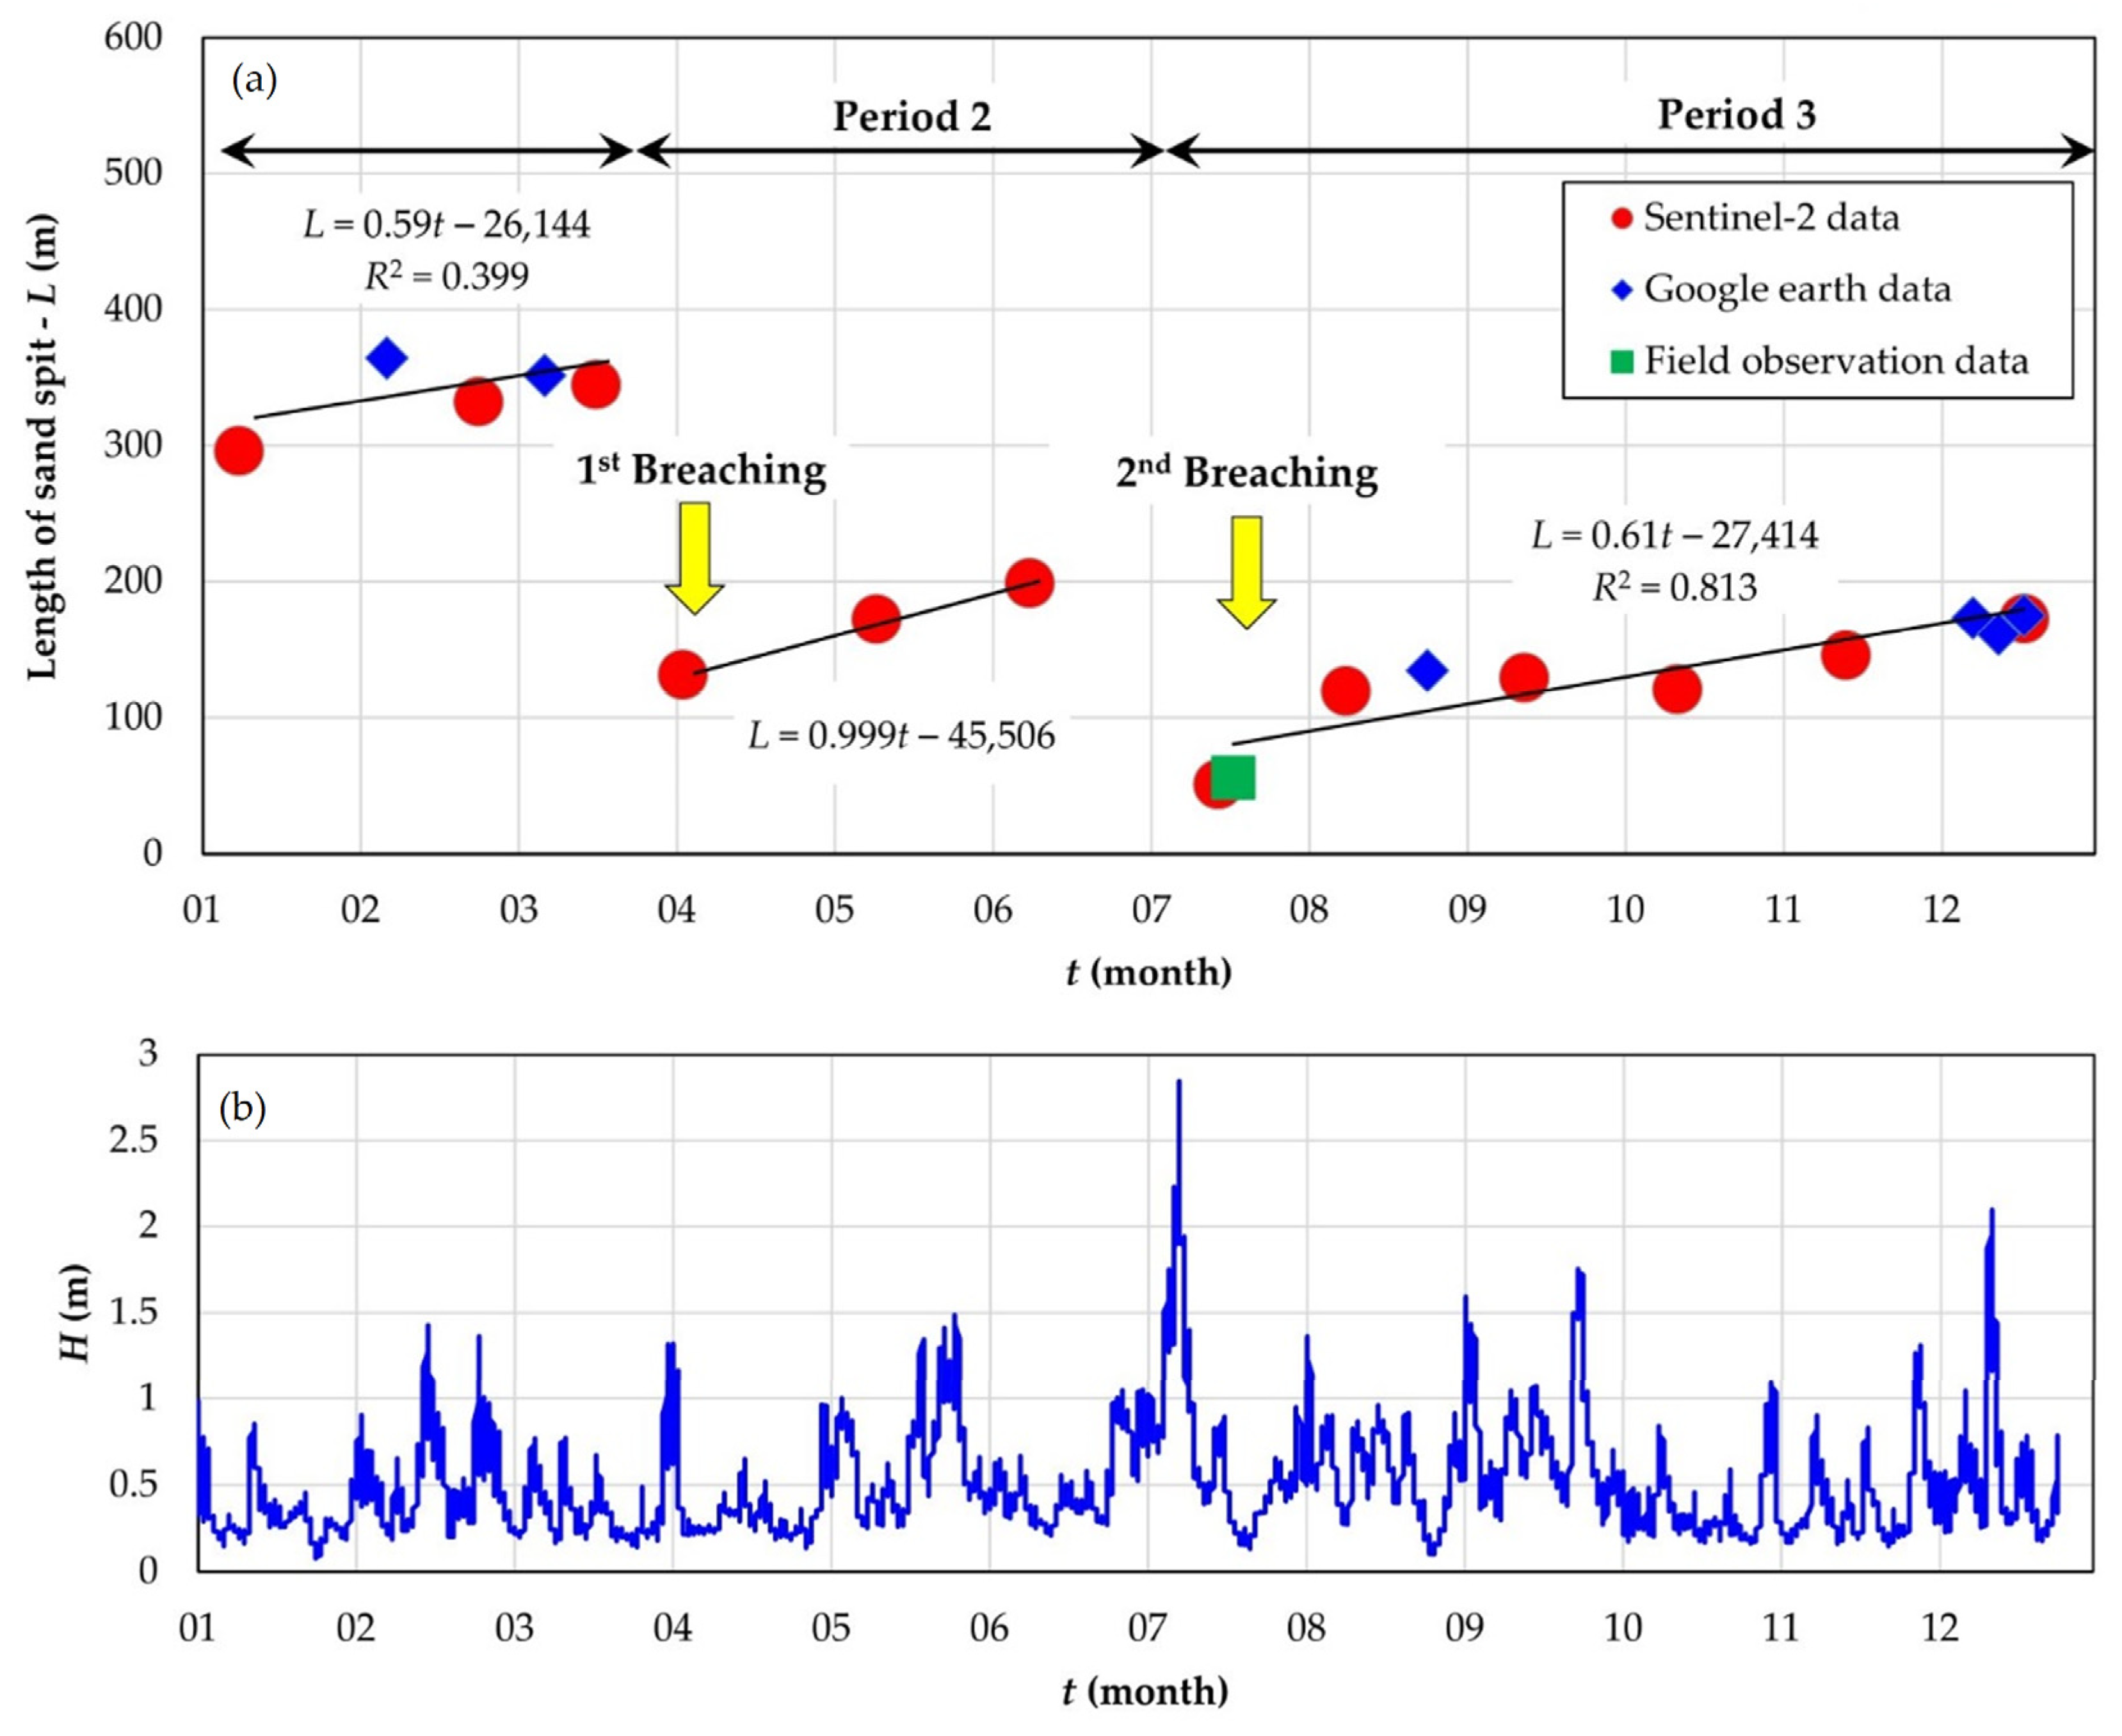
The shoreline change of the sand spit in 2022 is presented in Figure 8. In Figure 8, only shorelines of several months in 2022 are plotted to ensure legibility. As can be seen in the figure, breaching of the sand spit occurred several times in 2022. This seasonal variation was reported as a circular variation of the sand spit by Weidman and Ebert [48]. Specifically, there were three periods of the sand spit’s evolution in 2022.
The first period was from January 2022 to March 2022 with a period of uninterrupted growth. The first breaching can be observed in April 2022, ending the first elongation period of the sand spit. The remnant spit was about 120 m long and 30 m wide.
In the second period, the sand spit grew again, and the distal end was oriented to the west. The elongation in the second period resulted in an extension of about 100 m in the spit’s length. The second breaching occurred in July 2022 when the distal end of the sand spit was very close to the proximal end.
The third period of the sand spit comprised a 6-month elongation period from July 2022 to December 2022. This period was fully in the southwest wave climate. Since the southwest wave is dominant in the study area, the distal end of the sand spit during this period was pushed to the bay side (the east). The elongated length of the sand spit in this period was about 120 m.
The elongation and breaching of the sand spit in 2022 can be observed clearly in Figure 9. As mentioned above, the evolution of the sand spit in 2022 can be divided into three periods. The first period was from January to April with the elongation rate of 0.59 m/day. At the end of the first period, breaching of the sand spit occurred around April, indicated by a sudden decrease in the length (L) of the spit. After the first breaching, the second period started from April to July with a higher elongation rate than the first period of approximately 1.0 m/day. The second period ended with the second breach occurring in July. In the third period, the elongation rate of the sand spit was 0.61 m/day.
It should be noted that the results shown in Figure 9 were calculated from the combination of Sentinel-2 data, Google Earth data, and GPS data from the field observation on 22 July 2022. Although there are differences in the resolutions of the data, good agreement between the three types of data can be observed, especially in period 3.
Wave heights in 2022 transferred from ERA5 wave data are also presented in Figure 9 to observe the relationship between wave action and evolution of the sand spit. It can be observed clearly that wave heights were the triggering event for the breaching of the sand spit in July 2022. The other breaching in April may have been the accumulated results of wave heights from February to April 2022. From the wave height diagram in Figure 9b, it can be seen that period 3 was the “stormiest” [48] period in the evolution of the sand spit in 2022.
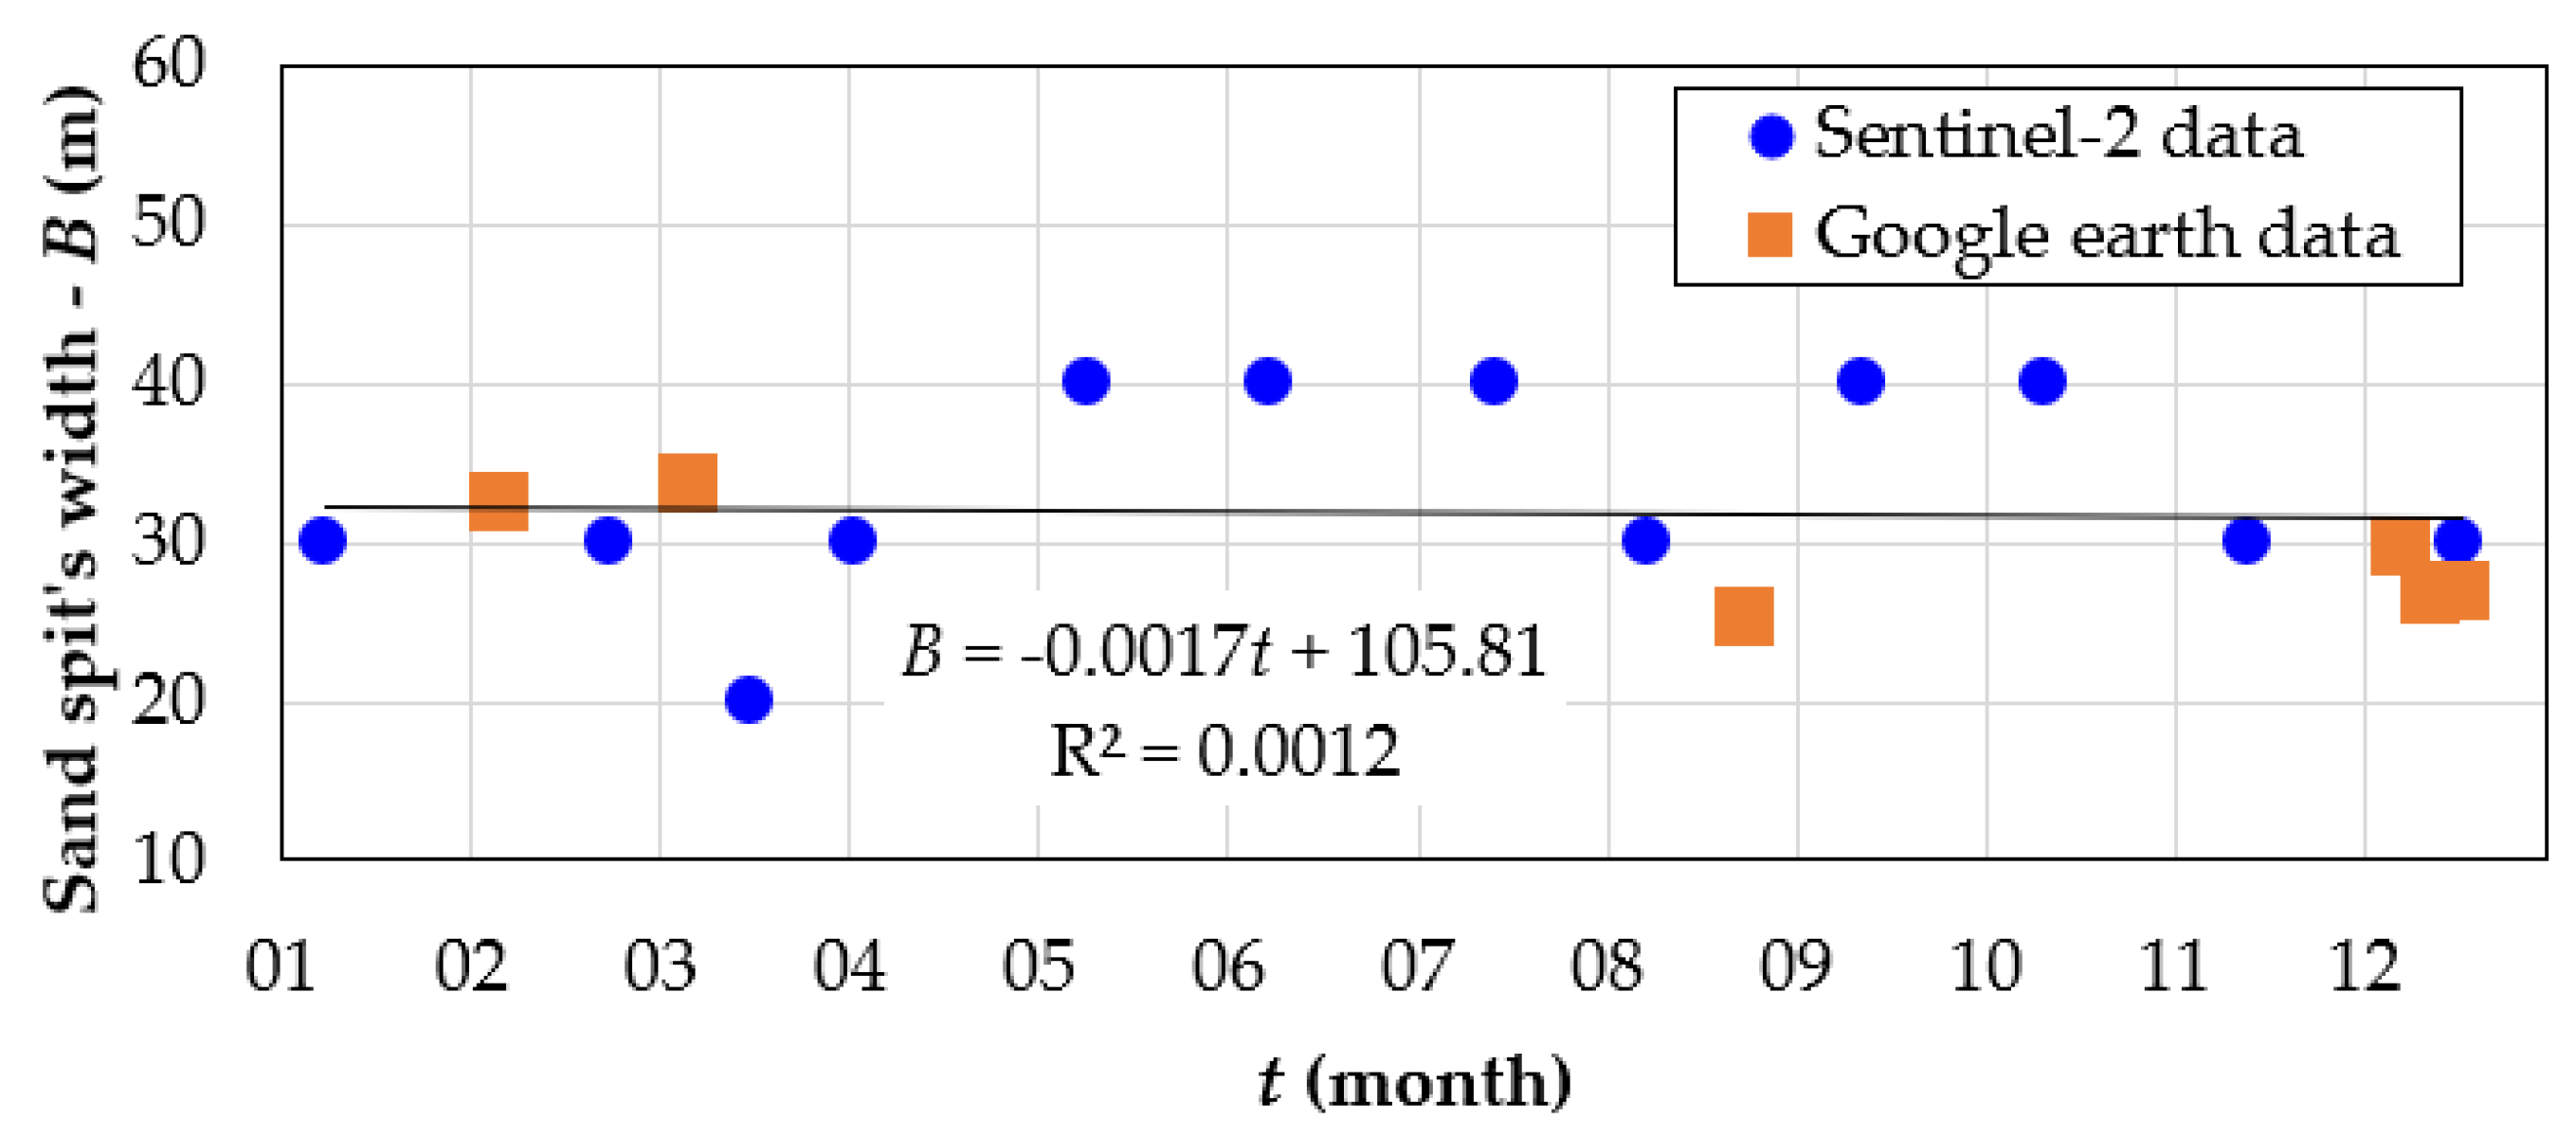
3.1.2. Sand Spit’s Width
Figure 10 shows the temporal variation of the sand spit’s width in 2022. In the figure, the blue circles represent the data obtained from Sentinel-2 images, while the orange squares represent the data obtained from Google Earth images. A higher accuracy of the Google Earth data than that of Sentinel-2 data can be recognized. It can be seen in Figure 10 that the sand spit’s width fluctuates around the value of 30 m. Therefore, it can be considered that the sand spit’s width is constant during its elongation, which satisfies the assumption in the model of Lawson et al. [26]. The pixel size limitation of the Sentinel-2 images could cause the scatter of the sand spit’s width.
3.2. Depth of Closure and Beach Berm Height
Based on the values of significant wave height and the wave period transferred from ERA5 waves, the values of Dc and DB were obtained as 4.5 m and 1.5 m using Equations (4) and (6), respectively.
3.3. Sediment Grain Size and Sediment Density
3.4. Long Shore Sediment Transport Rate
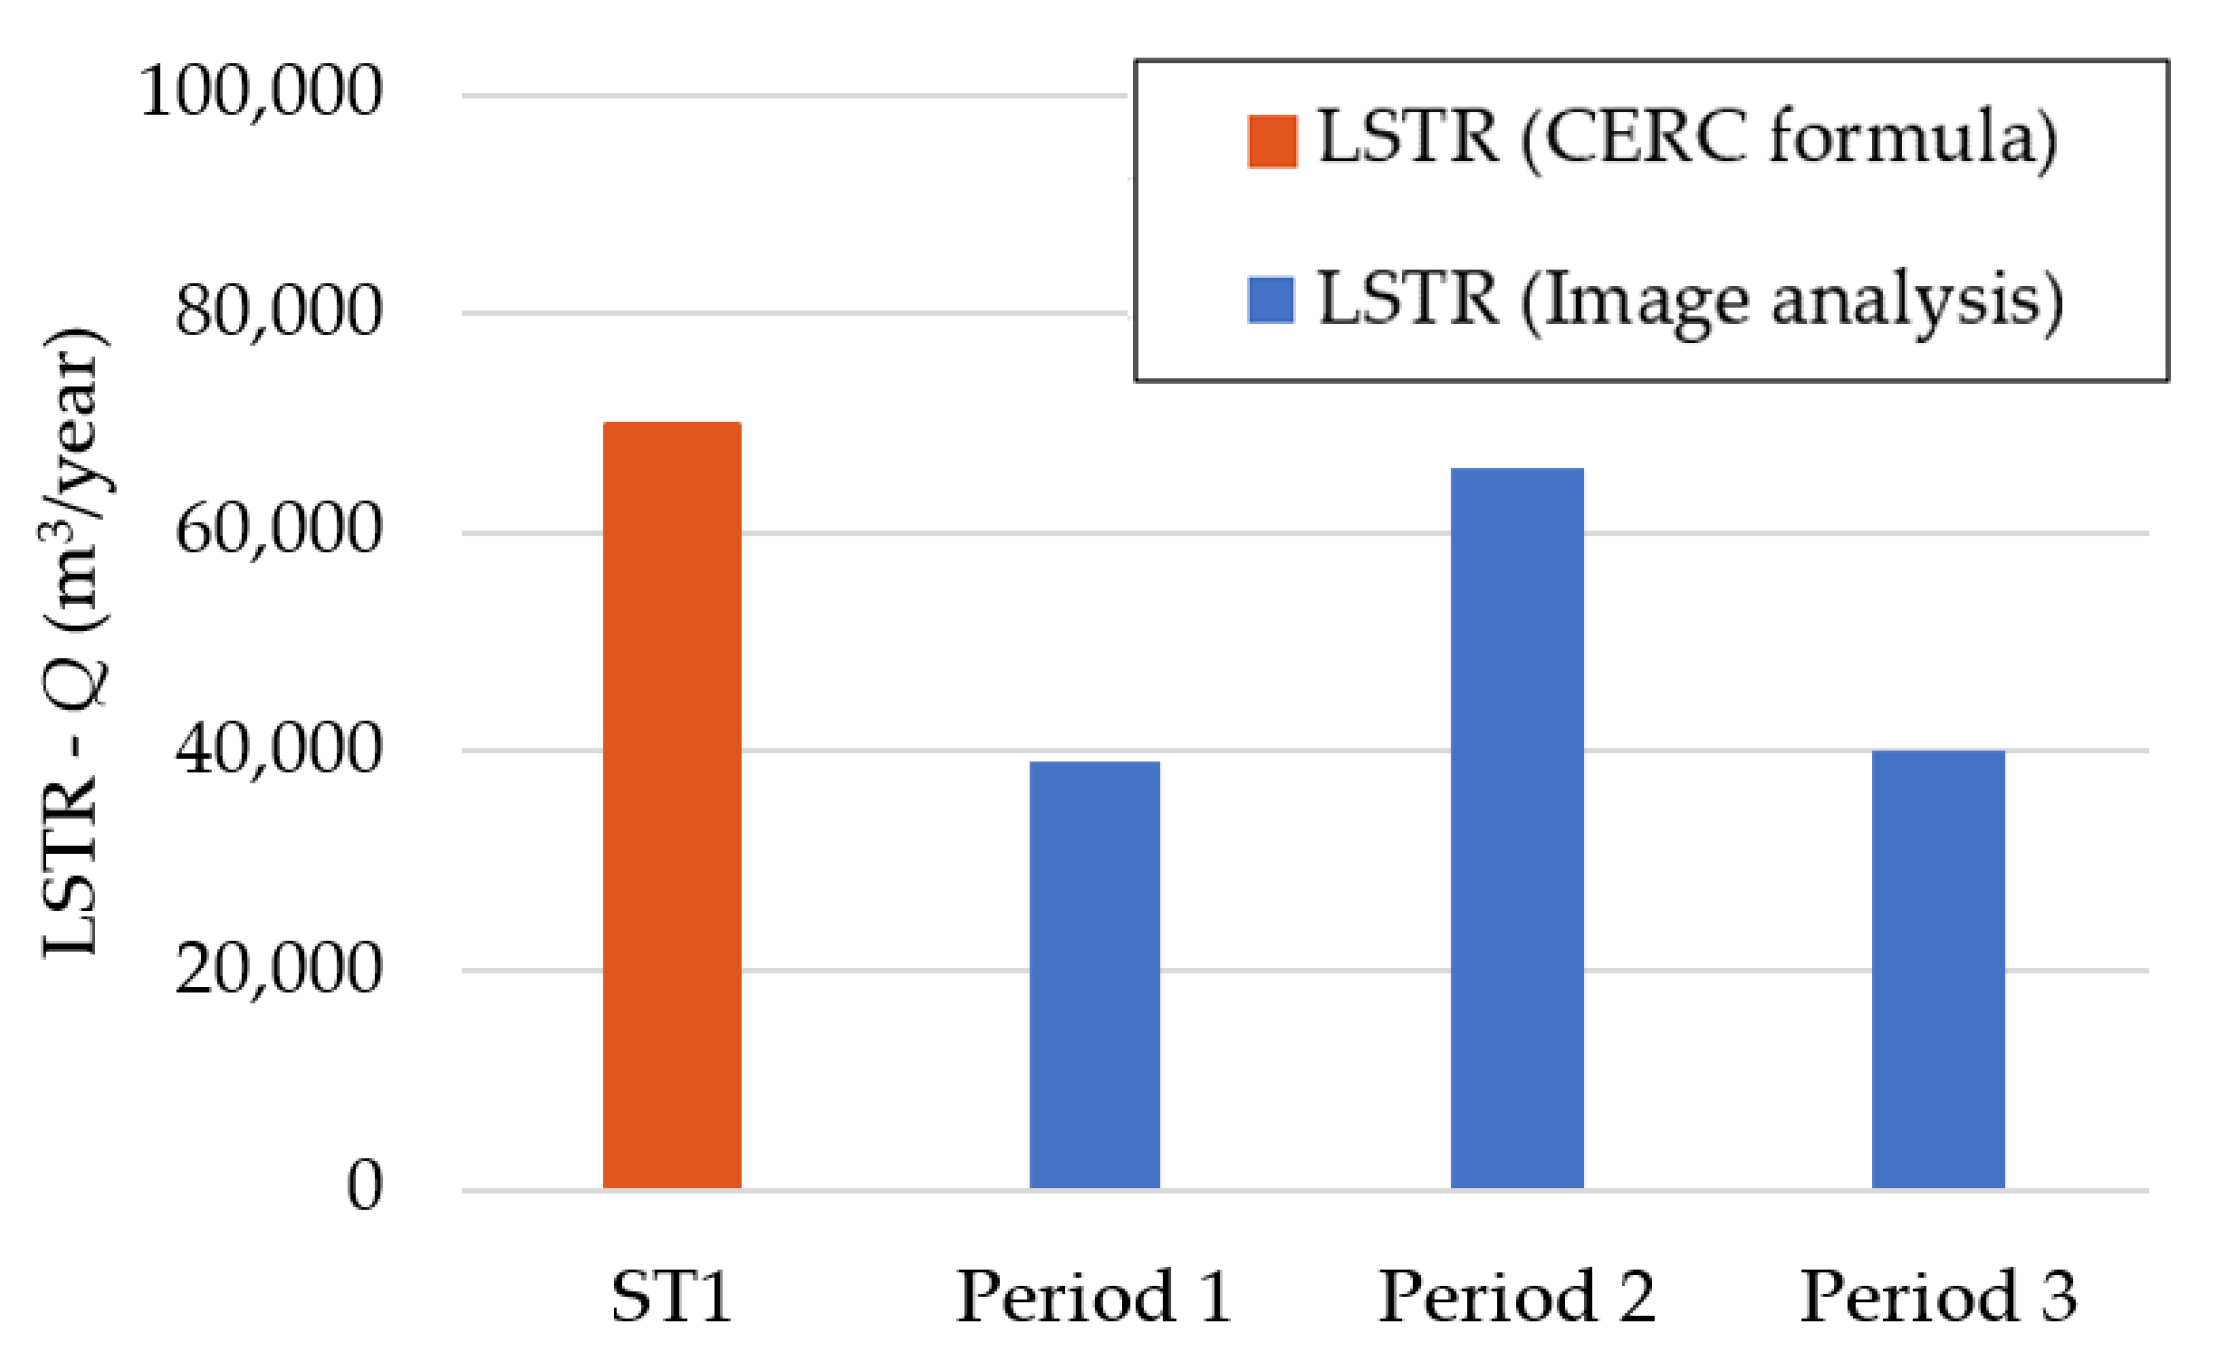
As can be seen in Figure 9, there were three periods of sand spit development in 2022. Therefore, the LSTRs are calculated based on these three periods of the sand. Based on the elongation rates (ΔL/Δt) of the sand spit and Equation (9), the LSTRs in three periods were 39,000 m3/year, 66,000 m3/year, and 40,000 m3/year, respectively.
In addition, the CERC formula was used to calculate the LSTR using Equation (9) together with the wave data in 2022 and the sediment data at the river mouth (K = 0.17 and ρs = 2775 kg/m3). As a result, the LSTR calculated using the CERC formula is 72,000 m3/year.
The values of LSTRs are summarized in Table 3. In Table 3, the values of LSTRs in three periods, 1, 2, and 3, are estimated from the image analysis, while the ST1 denotes the LSTRs near the river mouth using the CERC formula. Good agreement of LSTRs calculated by the two methods can be seen. The variation of LSTRs and possible errors in each calculation method will be discussed in the next section.
3.5. Comparison with Other Study Areas in the World
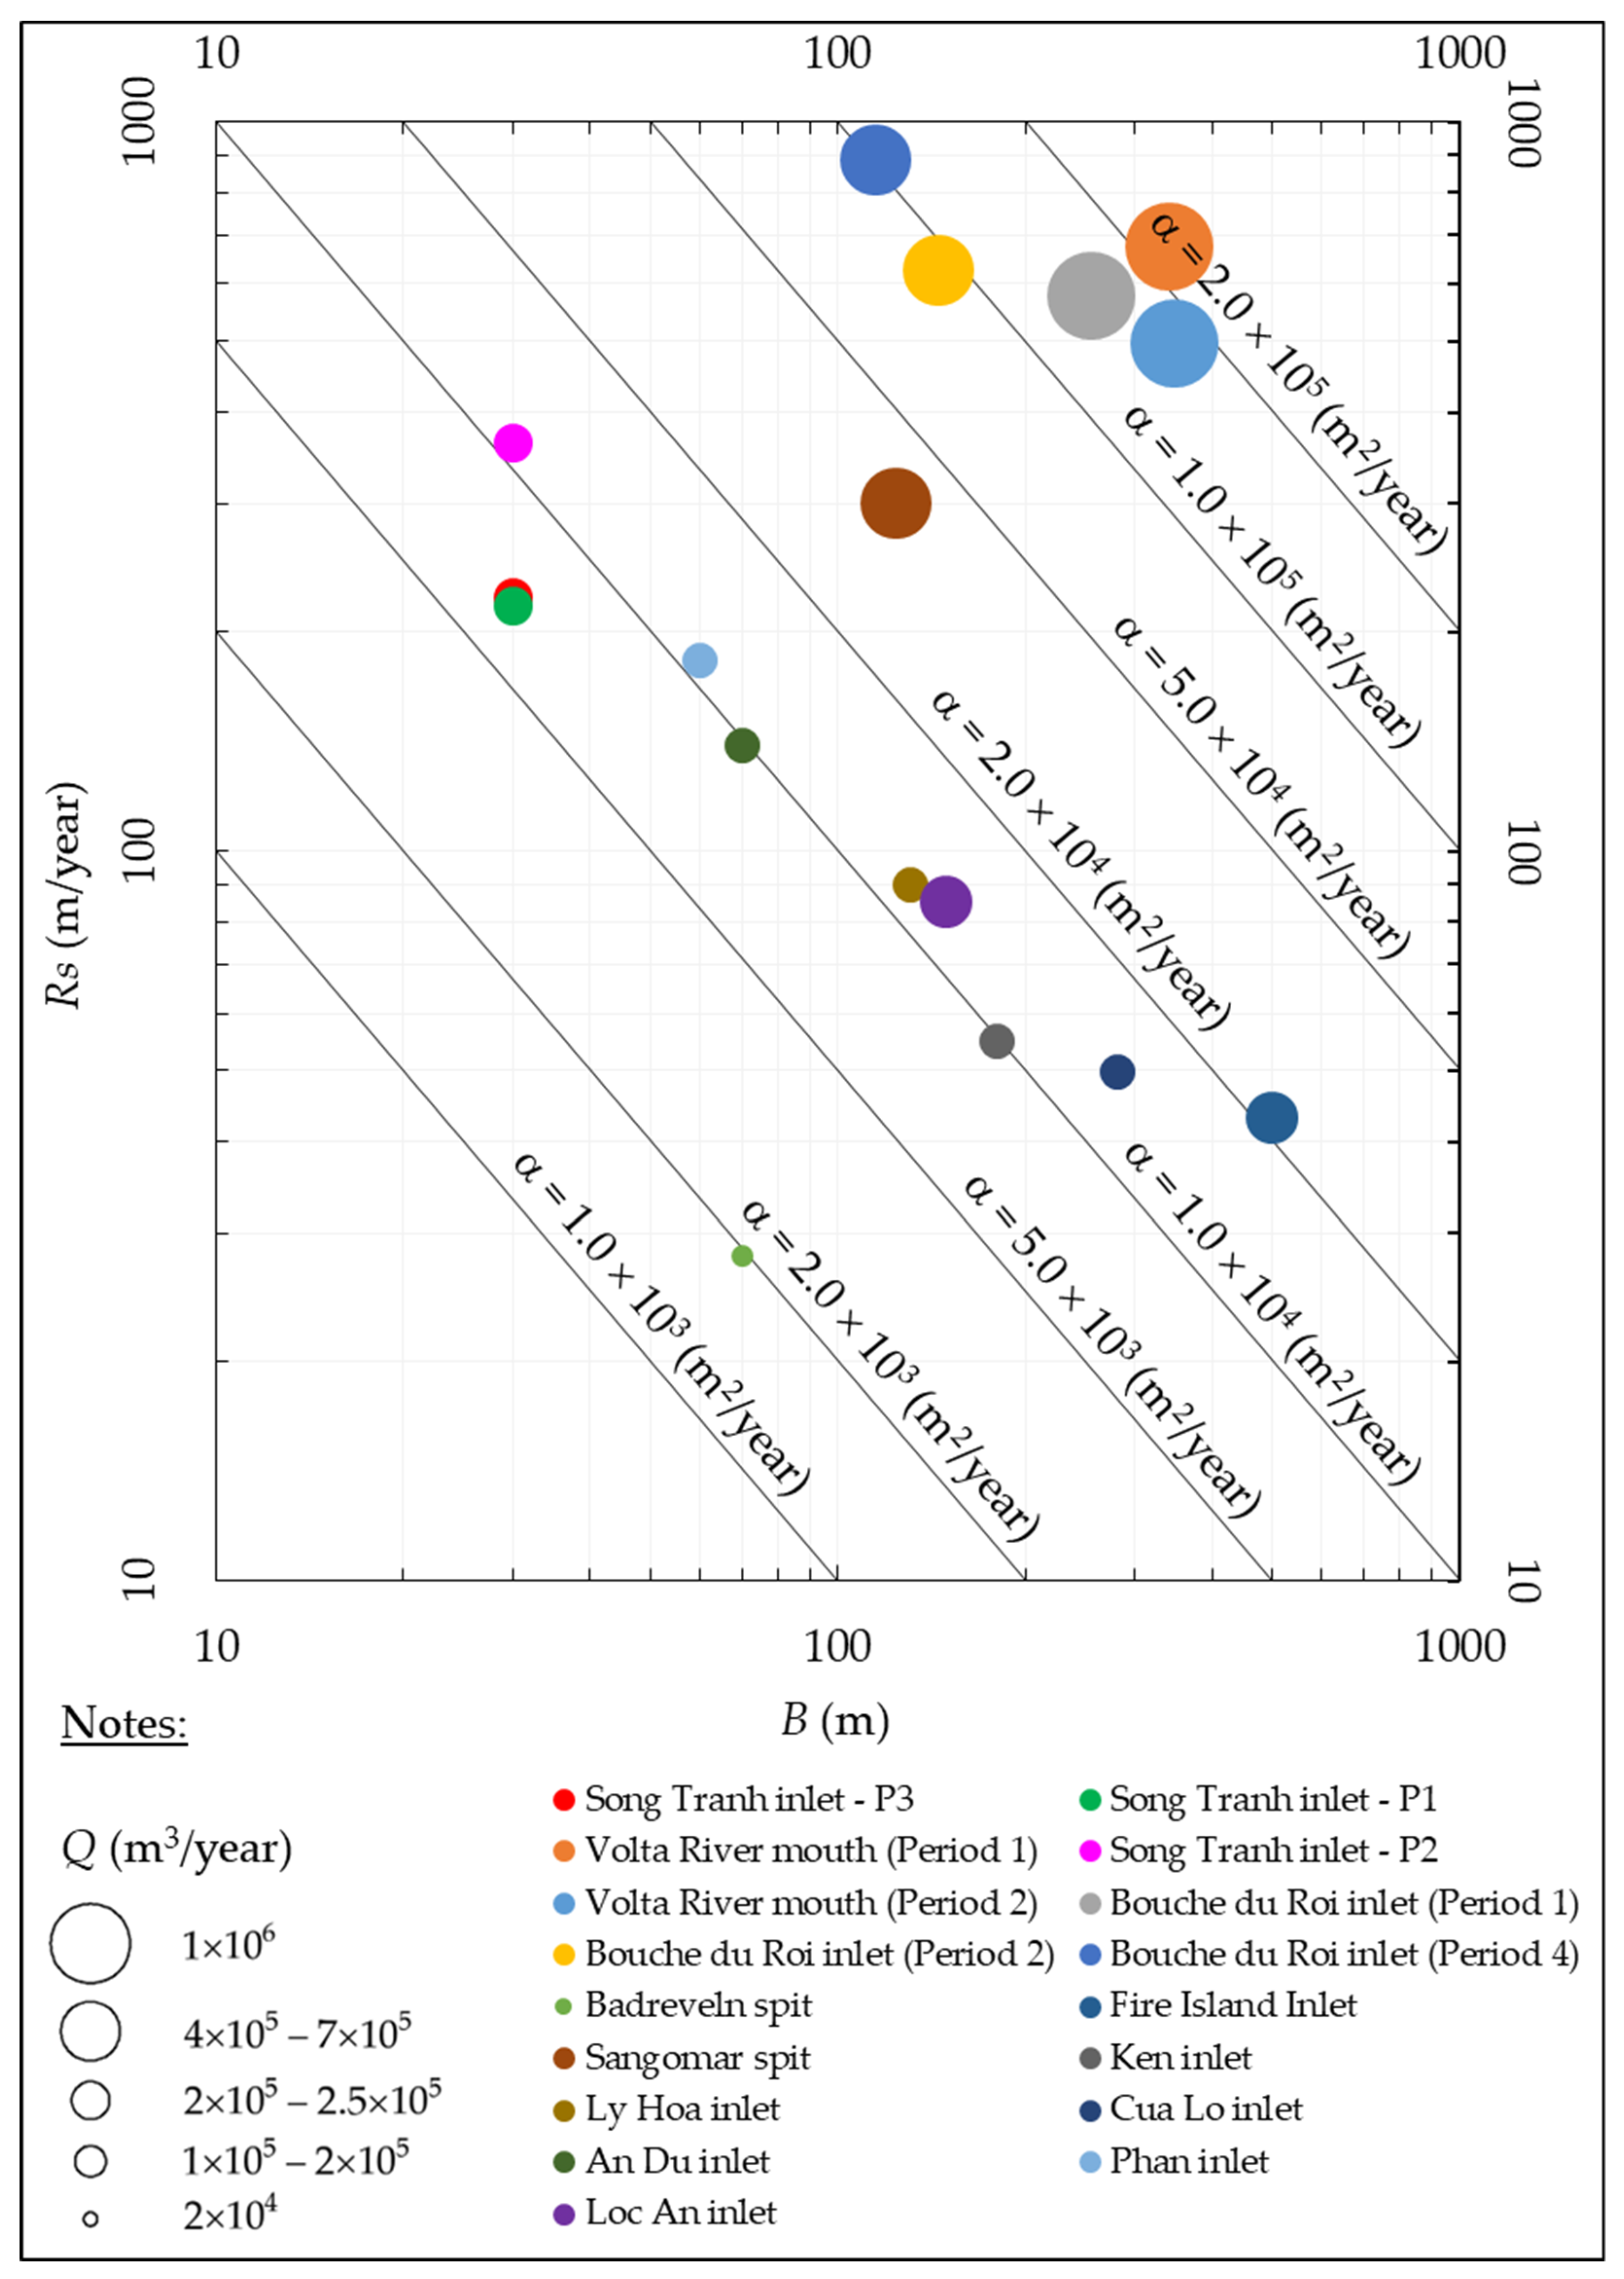
Figure 12 shows the log–log plot of the relationship between the sand spit growth rate (Rs) and sand spit width (B) at Song Tranh Inlet for the three periods. The figure also highlights the contour lines for the coefficient α from Equation (15). The magnitudes of LSTRs are presented by the diameters of the circles. To make a comparison, the morphodynamic properties of other studied inlets and river mouths in the world are plotted, additionally included in the figure. Those inlets and river mouths are the Volta River mouth in Ghana and the Bouche du Roi inlet in Benin [26], the Badreveln spit in Sweden and Fire Island Inlet in the USA [20], Sangomar spit in Senegal [49], and six inlets and river mouths along the Vietnamese coastline [2,13,50,51]. All values used in Figure 12 are summarized in Table 4.
It can be seen from Figure 12 that the growth rates of the sand spit at Song Tranh Inlet in three periods (green, purple, and red circles) are higher than half of the 14 other study areas presented in the figure. The LSTRs along the sand spit at Song Tranh Inlet are also higher than 6 out of 14 areas presented in the figure. With a narrow width (B = 30 m) and a high elongation rate under a high value of LSTR, it can be said that the sand spit at Song Tranh Inlet is quite dynamic, and a coastal solution at this inlet is required to stabilize this inlet and its adjacent beaches. As Phu Quoc Island is a famous tourist location, nature-based coastal protection is recommended [52].
4. Discussion
4.1. Wave Data
The wave data have been obtained from the oceanographic station of Phu Quoc Island, only exhibiting wave heights and periods. Therefore, breaking wave angles were estimated through the refraction process using the relationship h/gT2 with the tool developed by Sana [35]. Therefore, the breaking angle αb = 9° in this study should be used with care. In addition, the breaking angle always has a significant effect on the LSTR [53]. Hence, this estimation of breaking angle will induce error on the values of LSTRs using the CERC formula. Improvements should be made in following studies for this data-scarce area by utilizing the numerical modeling as in [54].
4.2. The LSTR
Freely available remotely sensed images and the theory of the one-line model have been employed to estimate the LSTR along an unexplored sand spit on Phu Quoc Island. Although most improvements of the LSTR calculation methods are nowadays implemented in relevant numerical models, such as Delft-3D [55] and MIKE 21 [56], it is always nice to return to the basics as a starting point and investigate beach behavior [57], especially for data-scarce areas. Based on the image analysis, the LSTRs corresponding to three periods of sand spit development were quickly determined as 39,000 m3/year, 66,000 m3/year, and 40,000 m3/year, respectively.
To verify the results from the image analysis, LSTR along the west coast of Phu Quoc Island was estimated based on the CERC formula. It can be seen from Figure 13 that the LSTRs estimated in this study have the order of 104 m3/year, which can be considered as a good estimation for LSTR, although scatter can be observed in the results [40]. The LSTRs calculated in this study using the CERC formula, without doubt, have errors caused by limitations of the measured data.
5. Conclusions
The morphological evolution of a sand spit at Song Tranh Inlet, Phu Quoc Island, Vietnam was investigated using image analysis, the one-line model, and collected field data. The results of this research can support the sustainable development of the coastal area around Song Tranh Inlet, and the main findings can be summarized as:
- -
- There is a seasonal variation of the sand spit in front of Song Tranh Inlet with several periods of breaching and elongation in a single year.
- -
- Image analysis and the one-line model were used to estimate the LSTRs along the sand spit in three periods in 2022. The results were 39,000 m3/year, 66,000 m3/year, and 40,000 m3/year for periods 1, 2, and 3, respectively.
- -
- The CERC formula and transferred waves and sediment data were used to calculate the LSTR along the sand spit. The calculated result was 72,000 m3/year for the location ST1, which is in front of the inlet.The LSTRs calculated by the two methods show a similar order of magnitude.
- -
- Fourteen values of LSTRs at inlets and river mouths worldwide were reviewed in this study. Although the width of the sand spit at Song Tranh Inlet was the smallest, the LSTRs at Song Tranh Inlet were higher than nearly half of the 14 LSTRs in the literature.
Author Contributions
Conceptualization, D.V.D. and H.T.; data curation, D.V.D., T.N.T. and C.V.D.; formal analysis, T.N.T., C.V.D., V.H.T.D. and T.C.D.; funding acquisition, N.T.V. and H.T.; investigation, D.V.D. and T.V.T.; methodology, D.V.D., T.V.T. and H.T.; supervision, T.V.T., N.T.V. and H.T.; visualization, D.V.D.; writing—original draft, D.V.D. and H.V.T.M.; writing—review and editing, T.V.T., V.H.T.D., T.C.D., N.T.V. and H.T. All authors have read and agreed to the published version of the manuscript.
Funding
This research received no external funding.
Data Availability Statement
Datasets utilized in this study are contained within the article. Further data requests should be addressed to the corresponding author or [email protected].
Acknowledgments
We thank Nigel K. Downes for assistance with the English proofreading and two anonymous reviewers for comments that greatly improved the manuscript.
Conflicts of Interest
The authors declare no conflict of interest.
References
- Teodoro, A.C.; Pais-Barbosa, J.; Gonçalves, H.; Veloso-Gomes, F.; Taveira-Pinto, F. Extraction of Cabedelo sand spit area (Douro estuary) from satellite images through image processing techniques. J. Coast. Res. 2011, 2648, 1740–1744. [Google Scholar]
- Duc Anh, N.Q.; Tanaka, H.; Tam, H.S.; Tinh, N.X.; Tung, T.T.; Viet, N.T. Comprehensive Study of the Sand Spit Evolution at Tidal Inlets in the Central Coast of Vietnam. J. Mar. Sci. Eng. 2020, 8, 722. [Google Scholar] [CrossRef]
- Tanaka, H.; Shuto, N. Field investigation at a mouth of small river. In Coastal Engineering 1992; American Society of Civil Engineers: Reston, VA, USA, 1993; pp. 2486–2499. [Google Scholar]
- Cilli, S.; Billi, P.; Schippa, L.; Grottoli, E.; Ciavola, P. Bedload transport and dune bedforms characteristics in sand-bed rivers supplying a retreating beach of the northern Adriatic Sea (Italy). J. Hydrol. Reg. Stud. 2021, 37, 100894. [Google Scholar] [CrossRef]
- Saengsupavanich, C. Morphological Evolution of Sand Spits in Thailand. Mar. Geod. 2021, 44, 432–453. [Google Scholar] [CrossRef]
- Allard, J.; Bertin, X.; Chaumillon, E.; Pouget, F. Sand spit rhythmic development: A potential record of wave climate variations? Arçay Spit, western coast of France. Mar. Geol. 2008, 253, 107–131. [Google Scholar]
- Bastos, L.; Bio, A.; Pinho, J.L.S.; Granja, H.; da Silva, A.J. Dynamics of the Douro estuary sand spit before and after breakwater construction. Estuar. Coast. Shelf Sci. 2012, 109, 53–69. [Google Scholar] [CrossRef]
- Dinis, P.A.; Huvi, J.; Cascalho, J.; Garzanti, E.; Vermeesch, P.; Callapez, P. Sand-spits systems from Benguela region (SW Angola). An analysis of sediment sources and dispersal from textural and compositional data. J. Afr. Earth Sci. 2016, 117, 171–182. [Google Scholar] [CrossRef]
- Veloso-Gomes, F.; Taveira-Pinto, F. Portuguese coastal zones and the new coastal management plans. J. Coast. Conserv. 2003, 9, 25–34. [Google Scholar] [CrossRef]
- Armaitienė, A.; Boldyrev, V.L.; Povilanskas, R.; Taminskas, J. Integrated Shoreline Management and Tourism Development on the Cross-Border World Heritage Site: A Case Study from the Curonian Spit (Lithuania/Russia). J. Coast. Conserv. 2007, 11, 13–22. [Google Scholar] [CrossRef]
- Miththapala, S. Lagoons and Estuaries; IUCN: Gland, Switzerland, 2013; Volume 4. [Google Scholar]
- Quang, D.N.; Duc Anh, N.Q.; Tam, H.S.; Tinh, N.X.; Tanaka, H.; Viet, N.T. Evaluation of Cua Lo Estuary’s Morpho-Dynamic Evolution and Its Impact on Port Planning. J. Mar. Sci. Eng. 2023, 11, 611. [Google Scholar] [CrossRef]
- Duy, D.V.; Tanaka, H.; Mitobe, Y.; Duc Anh, N.Q.; Viet, N.T. Sand Spit Elongation and Sediment Balance at Cua Lo Inlet in Central Vietnam. J. Coast. Res. 2018, 81, 32–39. [Google Scholar]
- Erwin, W.J.B.; Mamadou, S.; Issa, S.; Rafael, A.; Thierry, G.; Maxime, G.; Hermann, G. Sand-spit Evolution and Inlet Dynamics derived from Space-borne Optical Imagery: Is the Senegal-river Inlet Closing? J. Coast. Res. 2020, 95, 372–376. [Google Scholar]
- Sorensen, R.M. Coastal zone processes. In Basic Coastal Engineering; Springer: New York, NY, USA, 2006; pp. 247–286. [Google Scholar]
- Teodoro, A.C.; Taveira-Pinto, F.; Santos, I. Morphological and statistical analysis of the impact of breakwaters under construction on a sand spit area (Douro River estuary). J. Coast. Conserv. 2014, 18, 177–191. [Google Scholar] [CrossRef]
- Phanomphongphaisarn, N.; Rukvichai, C.; Bidorn, B. Impacts of long jetties construction on shoreline change at the western coast of the Gulf of Thailand. Eng. J. 2020, 24, 1–17. [Google Scholar] [CrossRef]
- Tanaka, H.; Lee, H.-S. Influence of jetty construction on morphology and wave set-up at a river mouth. Coast. Eng. J. 2003, 45, 659–683. [Google Scholar] [CrossRef]
- Thomas, T.; Lynch, S.; Phillips, M.; Williams, A. Long-term evolution of a sand spit, physical forcing and links to coastal flooding. Appl. Geogr. 2014, 53, 187–201. [Google Scholar] [CrossRef]
- Hoan, L.X.; Hanson, H.; Larson, M.; Kato, S. A mathematical model of spit growth and barrier elongation: Application to Fire Island Inlet (USA) and Badreveln Spit (Sweden). Estuar. Coast. Shelf Sci. 2011, 93, 468–477. [Google Scholar] [CrossRef]
- Kraus, N.C. Analytical model of spit evolution at inlets. In Proceedings of the 4th International Symposium of Coastal Engineering and Science of Coastal Sediment Processes, Long Island, NY, USA, 21–23 June 1999; ASCE: New York, NY, USA, 1999. [Google Scholar]
- Tanaka, H.; Kabutoyama, H.; Shuto, N. Numerical model for predicting the seasonal migration of a river mouth. WIT Trans. Ecol. Environ. 1995, 10. [Google Scholar]
- Uda, T.; Masumi, S.; Shiho, M. Formation of Sand Spit and Bay Barrier. In Morphodynamic Model for Predicting Beach Changes Based on Bagnold’s Concept and Its Applications; Uda, T., Masumi, S., Shiho, M., Eds.; IntechOpen: London, UK, 2018; Chapter 6. [Google Scholar]
- Bagnold, R. Beach and Nearshore Processes: The Mechanics of Marine Sedimentation and Littoral Processes. In The Physics of Sediment Transport by Wind and Water; ASCE: New York, NY, USA, 1963; pp. 188–230. [Google Scholar]
- Petersen, D.; Deigaard, R.; Fredsøe, J. Modelling the morphology of sandy spits. Coast. Eng. 2008, 55, 671–684. [Google Scholar] [CrossRef]
- Lawson, S.K.; Tanaka, H.; Udo, K.; Hiep, N.T.; Tinh, N.X. Morphodynamics and Evolution of Estuarine Sandspits along the Bight of Benin Coast, West Africa. Water 2021, 13, 2977. [Google Scholar] [CrossRef]
- Quyet, L.V.; Duy, P.T.; Toan, V.P. Sustainable Development of Tourism Economy in Phu Quoc Island, Kien Giang Province, Vietnam: Current Situation and Prospects; IOP Publishing: Bristol, UK, 2022. [Google Scholar]
- Nam, L.H.; Tuyen, N.N.; Hai, H.Q. Coastal geomorphology and coastal erosion in Phu Quoc Island. Vietnam. J. Hydrometeorol. 2013, 6, 50–56. [Google Scholar]
- Thuy, D.T.N. Study coastal change of Phu Quoc Island for the period 1973–2010. Thu Dau Mot Univ. J. Sci. 2016, 3, 64–69. [Google Scholar]
- Son, N.H.; Tin, H.T.; Ngo, D.V. The negative impacts of artificial islands on the beach erosion in the Eastern of Phu Quoc Island. In Proceedings of the Geotechnics for Sustainable Infrastructure Development—Geotec, Hanoi, Vietnam, 28–29 November 2019. [Google Scholar]
- Skilodimou, H.D.; Antoniou, V.; Bathrellos, G.D.; Tsami, E. Mapping of Coastline Changes in Athens Riviera over the Past 76 Year’s Measurements. Water 2021, 13, 2135. [Google Scholar] [CrossRef]
- McFeeters, S.K. The use of the Normalized Difference Water Index (NDWI) in the delineation of open water features. Int. J. Remote Sens. 1996, 17, 1425–1432. [Google Scholar] [CrossRef]
- Pardo-Pascual, J.E.; Sánchez-García, E.; Almonacid-Caballer, J.; Palomar-Vázquez, J.M.; de los Santos, E.P.; Fernández-Sarría, A.; Balaguer-Beser, Á. Assessing the Accuracy of Automatically Extracted Shorelines on Microtidal Beaches from Landsat 7, Landsat 8 and Sentinel-2 Imagery. Remote Sens. 2018, 10, 326. [Google Scholar] [CrossRef]
- Pradjoko, E.; Tanaka, H. Aerial photograph of Sendai Coast for shoreline behavior analysis. In Proceedings of the 32nd International Conference on Coastal Engineering, Shanghai, China, 30 June–5 July 2010. [Google Scholar]
- Sana, A. Teaching fundamental concepts of coastal engineering using excel spreadsheet. Comput. Appl. Eng. 2017, 25, 304–310. [Google Scholar] [CrossRef]
- Hallermeier, R.J. Uses for a calculated limit depth to beach erosion. In Coastal Engineering 1978; ASCE: New York, NY, USA, 1978; pp. 1493–1512. [Google Scholar]
- Thompson, E.F.; Harris, D.L. A Wave CIimatology for US Coastal Waters. In Proceedings of the Offshore Technology Conference, Houston, TX, USA, 1–3 May 1972; OnePetro: Richardson, TX, USA, 1972. [Google Scholar]
- Uda, T. Japan’s Beach Erosion: Reality and Future Measures; World Scientific: Singapore, 2010. [Google Scholar]
- Uda, T. Beach Erosion in Japan; Sankaido Press: Tokyo, Japan, 1997. (In Japanese) [Google Scholar]
- Rosati, J.D.; Walton, T.; Bodge, K. Longshore sediment transport. In Coastal Engineering Manual. Part III: 2. 2002. Available online: https://www.plainwater.com/pubs/EM-1110-2-1100P3.pdf (accessed on 12 September 2022).
- ASTM C33/C33M-18; Standard Specification for Concrete Aggregates. ASTM International: West Conshohocken, PA, USA, 2018.
- Tran, V.-A.; Hwang, C.-L.; Vo, D.-H. Manufacture and Engineering Properties of Cementitious Mortar Incorporating Unground Rice Husk Ash as Fine Aggregate. J. Mater. Civ. Eng. 2021, 33, 04021258. [Google Scholar] [CrossRef]
- Huynh, T.-P.; Ho, L.S.; Ho, Q.V. Experimental investigation on the performance of concrete incorporating fine dune sand and ground granulated blast-furnace slag. Constr. Build. Mater. 2022, 347, 128512. [Google Scholar] [CrossRef]
- Pelnard-Considère, R. Essai de theorie de l’evolution des formes de rivage en plages de sable et de galets. J. Hydraul. Res. 1957, 4, 289–298. [Google Scholar]
- Del Valle, R.; Medina, R.; Losada, M.A. Dependence of coefficient K on grain size. J. Waterw. Port Coast. Ocean. Eng. 1993, 119, 568–574. [Google Scholar] [CrossRef]
- Weggel, R.J. Maximum Breaker Height. J. Waterw. Port Coast. Ocean. Eng. 1972, 98, 529–548. [Google Scholar] [CrossRef]
- Van Rijn, L.C. Longshore sand transport. In Coastal Engineering 2002: Solving Coastal Conundrums; World Scientific: Singapore, Singapore, 2003; pp. 2439–2451. [Google Scholar]
- Weidman, C.R.; Ebert, J.R. Cyclic spit morphology in a developing inlet system. In Formation and Evolution of Multiple Tidal Inlets; Wiley Online Library: Hoboken, NJ, USA, 1993; pp. 186–212. [Google Scholar]
- Palalane, J.; Larson, M.; Hanson, H. Analytical model of sand spit evolution. In Proceedings of the 34th International Conference on Coastal Engineering, Seoul, Republic of Korea, 15–20 June 2014. [Google Scholar]
- Duc Anh, N.Q.; Tanaka, H.; Tinh, N.X.; Viet, N.T. Sand spit morphological evolution at tidal inlets by using satellite images analysis: Two case studies in Vietnam. J. Sci. Technol. Civ. Eng. 2020, 14, 17–27. [Google Scholar]
- Duc Anh, N.Q.; Duy, D.V.; Tanaka, H.; Viet, N.T. Elongation of sand spit at the Loc An river mouth, Southern Vietnam. J. JSCE Ser.B3 (Ocean Eng.) 2018, 74, I_695–I_700. [Google Scholar] [CrossRef] [PubMed]
- Falkenrich, P.; Wilson, J.; Nistor, I.; Goseberg, N.; Cornett, A.; Mohammadian, A. Nature-Based Coastal Protection by Large Woody Debris as Compared to Seawalls: A Physical Model Study of Beach Morphology and Wave Reflection. Water 2021, 13, 2020. [Google Scholar] [CrossRef]
- Ashton, A.D.; Murray, A.B. High-angle wave instability and emergent shoreline shapes: 2. Wave climate analysis and comparisons to nature. J. Geophys. Res. Earth Surf. 2006, 111. [Google Scholar] [CrossRef]
- Zemann, M.; van der Linden, R.; Dan, T.C.; Duong, V.H.T.; Nguyen, N.M.; Seidel, F.; Oberle, P.; Nestmann, F.; Fink, A.H. Modelling ocean wave conditions at a shallow coast under scarce data availability—A case study at the western coast of the Mekong Delta, Vietnam. EGUsphere 2023, 1–22. [Google Scholar] [CrossRef]
- Van Der Werf, J.; Veen, R.; Ribberink, J.A.N.; van der Zanden, J. Testing of the new SANTOSS transport formula in the Delft3D morphological modeling system. In The Proceedings of the Coastal Sediments 2015; World Scientific: Singapore, 2015. [Google Scholar]
- Mueller, A. Modelling Longshore Sediment Transport. Available online: https://www.researchgate.net/publication/280944048_MODELLING_LONGSHORE_SEDIMENT_TRANSPORT (accessed on 12 September 2022).
- Larson, M.; Hanson, H.; Kraus, N.C. Analytical solutions of the one-line model of shoreline change. COASTAL ENGINEERING RESEARCH CENTER VICKSBURG MS. 1987. Available online: https://archive.org/details/analyticalsoluti00lars (accessed on 12 September 2022).
Figure 1.
Location of Phu Quoc Island in Vietnam (right) and Song Tranh Inlet on the west coast of Phu Quoc Island (left).
Figure 1.
Location of Phu Quoc Island in Vietnam (right) and Song Tranh Inlet on the west coast of Phu Quoc Island (left).

Figure 2.
Flowchart of the research process.

Figure 3.
Sketch of Song Tranh Inlet with definitions of the sand spit’s length (L) and the sand spit’s width (B).
Figure 3.
Sketch of Song Tranh Inlet with definitions of the sand spit’s length (L) and the sand spit’s width (B).

Figure 4.
Wave rose of measured waves in 2021 at Phu Quoc Oceanographic Station and location of extracted ERA5 wave data (P1).
Figure 4.
Wave rose of measured waves in 2021 at Phu Quoc Oceanographic Station and location of extracted ERA5 wave data (P1).

Figure 5.
Wave heights from ERA5 data and measured wave heights at Phu Quoc Oceanographic Station.

Figure 6.
Sediment sample location along the sand spit.

Figure 7.
Proposed model for LSTR along a sand spit redrawn based on the approach of Lawson et al. [26].
Figure 7.
Proposed model for LSTR along a sand spit redrawn based on the approach of Lawson et al. [26].

Figure 8.
Temporal variation of the sand spit’s shoreline.

Figure 9.
(a) Elongation and breaching of the sand spit in 2022 and (b) wave heights in 2022 transferred from ERA5 wave data.
Figure 9.
(a) Elongation and breaching of the sand spit in 2022 and (b) wave heights in 2022 transferred from ERA5 wave data.

Figure 10.
Temporal variation of the sand spit’s width in 2022.

Figure 11.
Sediment grain sizes along the sand spit.

Figure 12.
Contour lines (α) represent the relationship between sand spit growth rate (RS) and sand spit width (B) at Song Tranh Inlet and other estuaries in the world.
Figure 12.
Contour lines (α) represent the relationship between sand spit growth rate (RS) and sand spit width (B) at Song Tranh Inlet and other estuaries in the world.

Figure 13.
LSTRs estimated using the CERC formula and the image analysis method.


Table 1.
Summary of Sentinel-2 and Google Earth images used in this study.
| Date (mm/dd/yyyy) | Sensor | Resolution (m) | Data Source |
|---|---|---|---|
| 01/08/2022 | MultiSpectral Instrument | 10 | Sentinel-2 |
| 02/24/2022 | MultiSpectral Instrument | 10 | Sentinel-2 |
| 03/19/2022 | MultiSpectral Instrument | 10 | Sentinel-2 |
| 04/05/2022 | MultiSpectral Instrument | 10 | Sentinel-2 |
| 05/13/2022 | MultiSpectral Instrument | 10 | Sentinel-2 |
| 06/12/2022 | MultiSpectral Instrument | 10 | Sentinel-2 |
| 07/19/2022 | MultiSpectral Instrument | 10 | Sentinel-2 |
| 08/13/2022 | MultiSpectral Instrument | 10 | Sentinel-2 |
| 09/17/2022 | MultiSpectral Instrument | 10 | Sentinel-2 |
| 10/17/2022 | MultiSpectral Instrument | 10 | Sentinel-2 |
| 11/19/2022 | MultiSpectral Instrument | 10 | Sentinel-2 |
| 12/24/2022 | MultiSpectral Instrument | 10 | Sentinel-2 |
| 02/06/2022 | Unknown | 2 | Google Earth |
| 03/09/2022 | Unknown | 2 | Google Earth |
| 08/29/2022 | Unknown | 2 | Google Earth |
| 12/14/2022 | Unknown | 2 | Google Earth |
| 12/19/2022 | Unknown | 2 | Google Earth |
| 12/24/2022 | Unknown | 2 | Google Earth |
Table 2.
Values of K based on the sediment grain sizes (D50).
| Sample No. | D50 (mm) | K |
|---|---|---|
| 1 | 0.85 | 0.17 |
| 2 | 0.50 | 0.40 |
| 3 | 0.49 | 0.41 |
| 5 | 0.58 | 0.33 |
Table 3.
Values of LSTRs determined based on CERC formula and image analysis.
| LSTR (m3/s) | ||
|---|---|---|
| CERC formula | ST1 | 72,000 |
| Image analysis | Period 1 | 39,000 |
| Period 2 | 66,000 | |
| Period 3 | 40,000 | |
Table 4.
Sand spit morphodynamic properties of other inlets.
| Study Area | Country | Rs (m/year) | B (m) | LSTR (m3/year) |
|---|---|---|---|---|
| Volta River mouth (Period 1) | Ghana | 674 | 342 | 1,290,000 |
| Volta River mouth (Period 2) | 496 | 348 | 1,210,000 | |
| Bouche du Roi inlet (Period 1) | Benin | 578 | 255 | 1,980,000 |
| Bouche du Roi inlet (Period 2) | 626 | 145 | 781,000 | |
| Bouche du Roi inlet (Period 4) | 889 | 115 | 734,000 | |
| Badreveln spit | Sweden | 28 | 70 | 10,000 |
| Fire Island Inlet | USA | 43 | 500 | 220,000 |
| Sangomar spit | Senegal | 300 | 124 | 465,000 |
| Ken inlet | Vietnam | 55 | 180 | 133,000 |
| Ly Hoa inlet | 90 | 130 | 130,000 | |
| Cua Loa inlet | 50 | 280 | 160,000 | |
| An Du inlet | 140 | 70 | 170,000 | |
| Phan inlet | 183 | 60 | 145,000 | |
| Loc An inlet | 85 | 150 | 200,000 | |
| Song Tranh Inlet (Period 1) | 217 | 30 | 39,000 | |
| Song Tranh Inlet (Period 2) | 365 | 30 | 66,000 | |
| Song Tranh Inlet (Period 3) | 224 | 30 | 40,000 |
Disclaimer/Publisher’s Note: The statements, opinions and data contained in all publications are solely those of the individual author(s) and contributor(s) and not of MDPI and/or the editor(s). MDPI and/or the editor(s) disclaim responsibility for any injury to people or property resulting from any ideas, methods, instructions or products referred to in the content. |
© 2023 by the authors. Licensee MDPI, Basel, Switzerland. This article is an open access article distributed under the terms and conditions of the Creative Commons Attribution (CC BY) license (https://creativecommons.org/licenses/by/4.0/).
Share and Cite
MDPI and ACS Style
Duy, D.V.; Ty, T.V.; Thanh, T.N.; Minh, H.V.T.; De, C.V.; Duong, V.H.T.; Dan, T.C.; Viet, N.T.; Tanaka, H. Sand Spit Morphology at an Inlet on Phu Quoc Island, Vietnam. Water 2023, 15, 1941. https://doi.org/10.3390/w15101941
AMA Style
Duy DV, Ty TV, Thanh TN, Minh HVT, De CV, Duong VHT, Dan TC, Viet NT, Tanaka H. Sand Spit Morphology at an Inlet on Phu Quoc Island, Vietnam. Water. 2023; 15(10):1941. https://doi.org/10.3390/w15101941
Chicago/Turabian StyleDuy, Dinh Van, Tran Van Ty, Tran Nhat Thanh, Huynh Vuong Thu Minh, Cao Van De, Vu Hoang Thai Duong, Trinh Cong Dan, Nguyen Trung Viet, and Hitoshi Tanaka. 2023. "Sand Spit Morphology at an Inlet on Phu Quoc Island, Vietnam" Water 15, no. 10: 1941. https://doi.org/10.3390/w15101941
Note that from the first issue of 2016, this journal uses article numbers instead of page numbers. See further details here.