
Characterisation of the Hydrogeological Properties of the Ntane Sandstone Aquifer Using Co-Seismic and Post-Seismic Groundwater Level Responses to the Mw 6.5 Moiyabana Earthquake, Central Botswana
Abstract
:1. Introduction
Problem Statement
2. Materials and Methods
2.1. Study Location

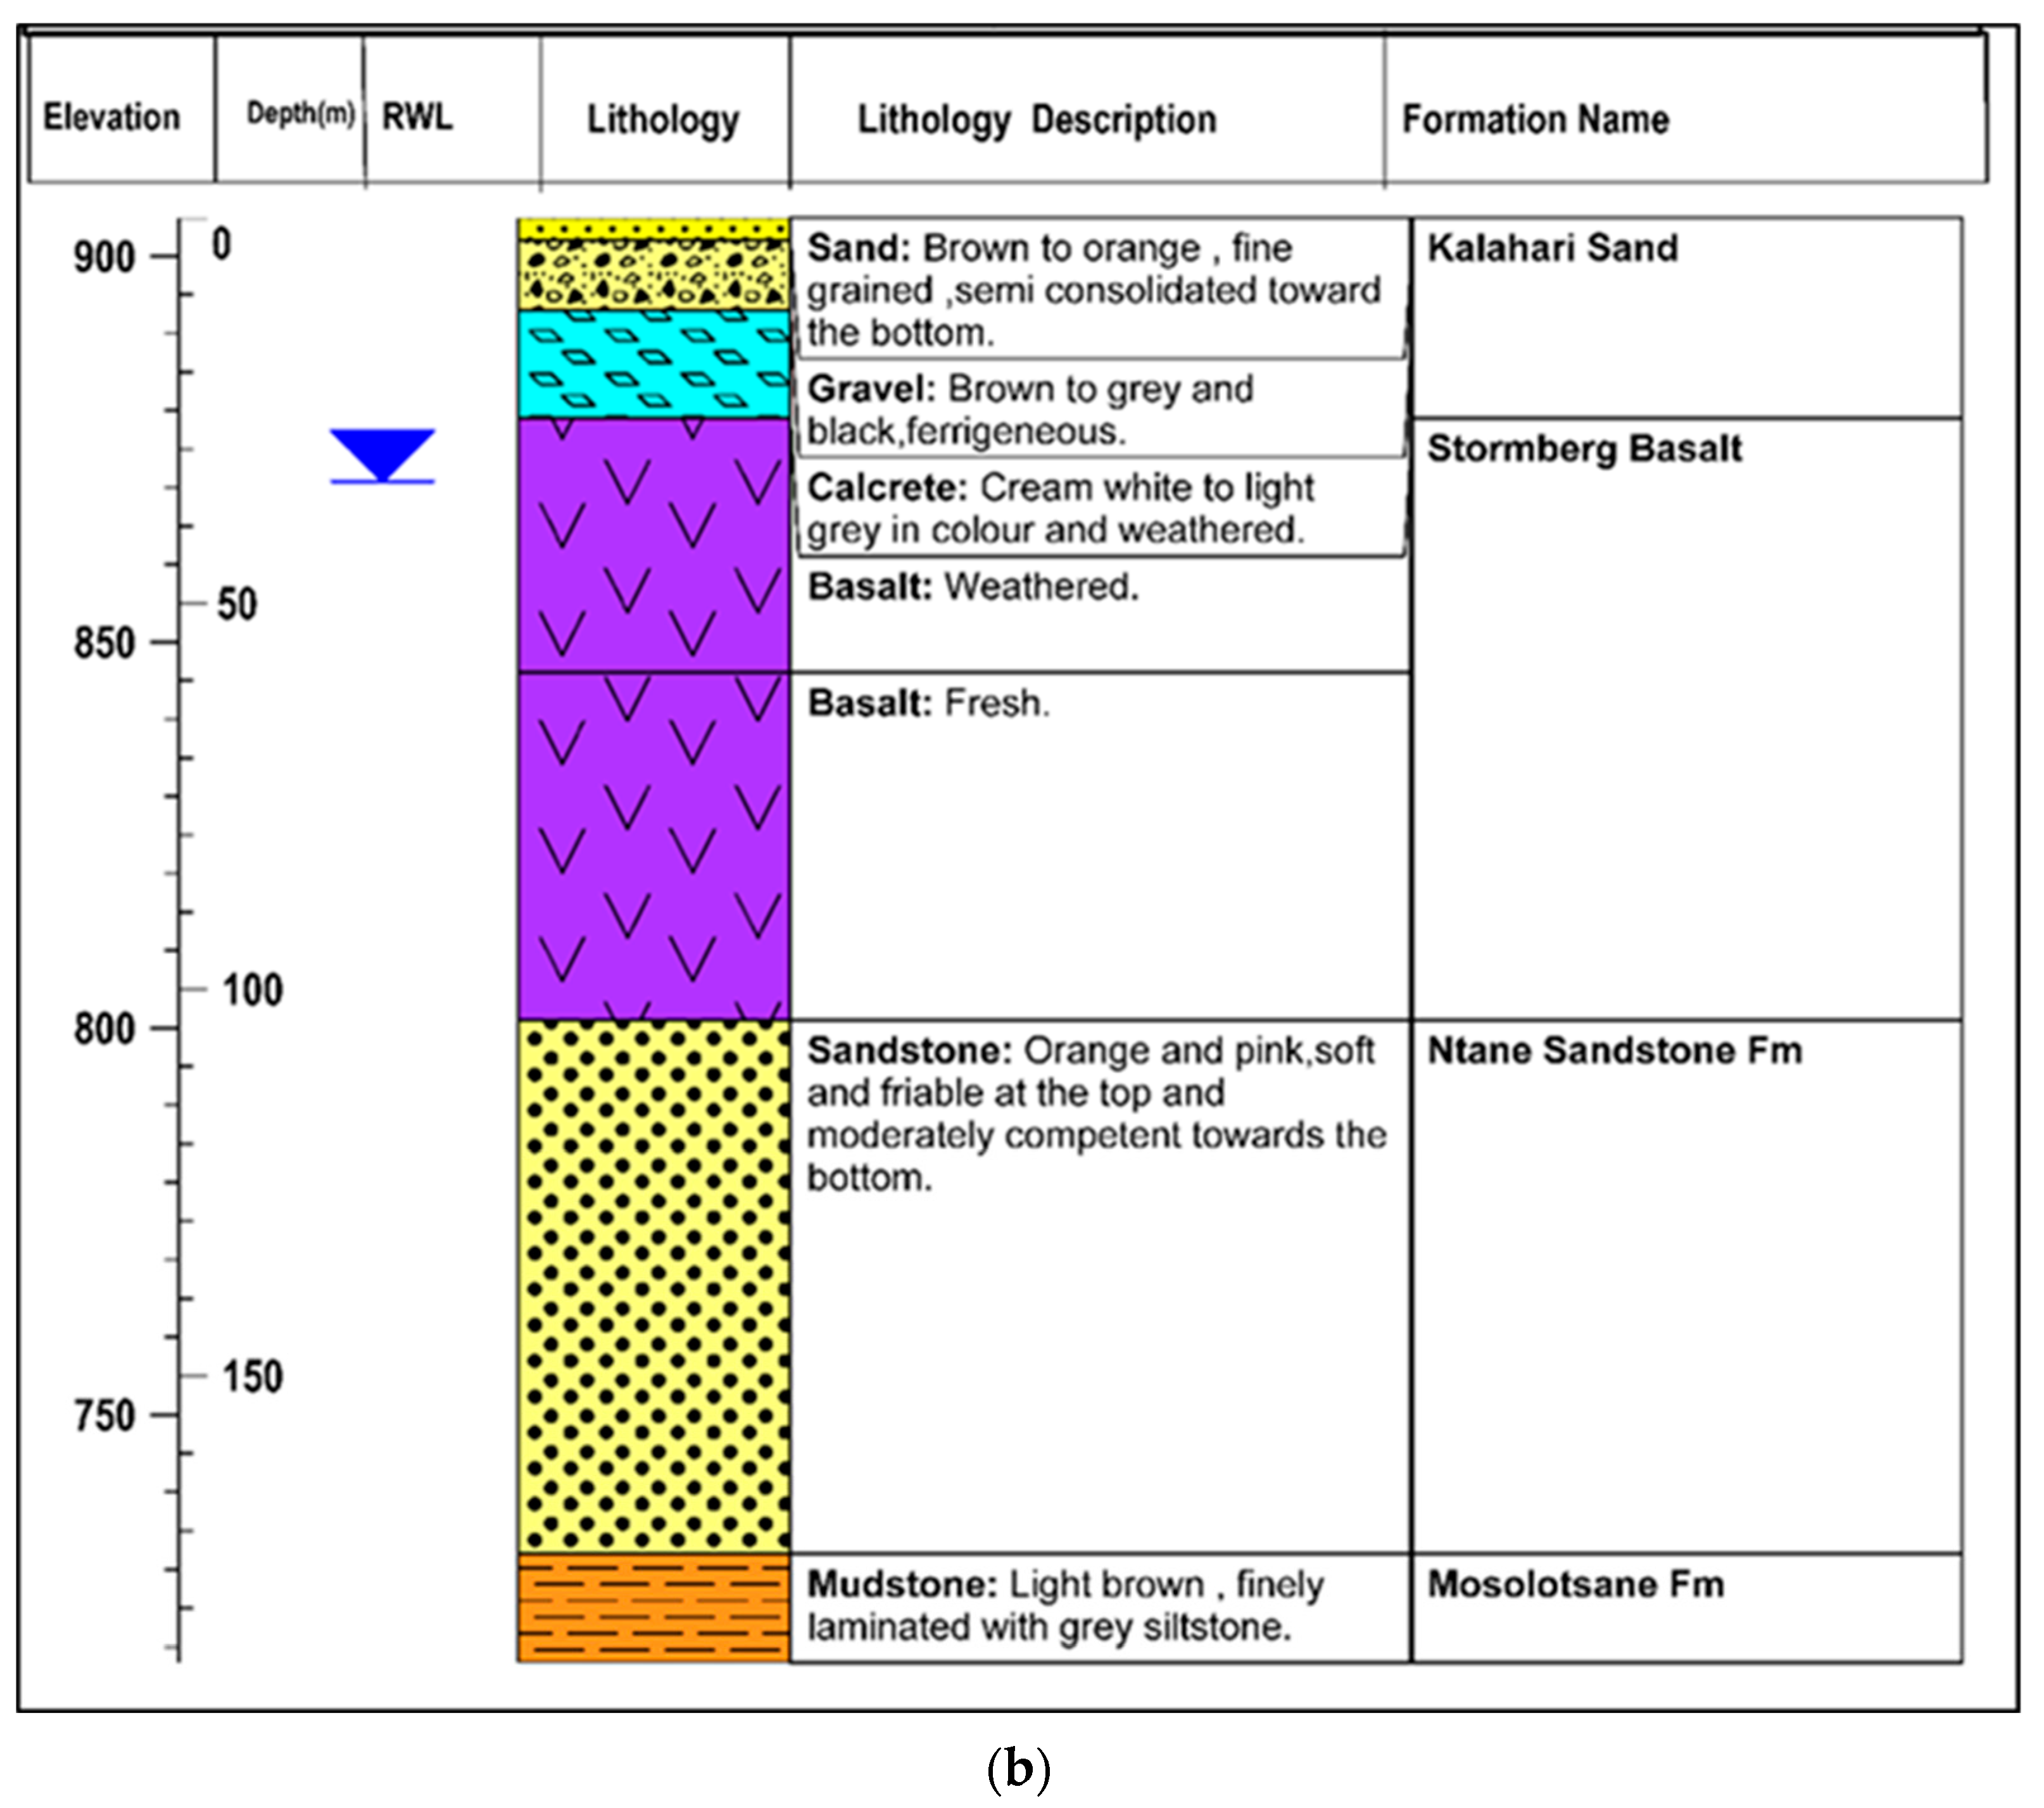
2.1.1. Geology
2.1.2. Hydrogeology and Aquifer Parameters
2.1.3. Borehole Construction
2.2. Methodology
2.2.1. Sampling
2.2.2. Borehole Hydrograph Analysis
2.2.3. Tidal Analysis
2.3. Mechanisms for Classifying/Determining the Hydrogeological Properties
2.3.1. Estimating the Aquifer Storage Coefficient
2.3.2. Estimation of the Aquifer Transmissivity Using Phase Shift
The Horizontal Flow Model
Vertical Flow Model
2.3.3. Estimation of the Aquifer’s Permeability
3. Results
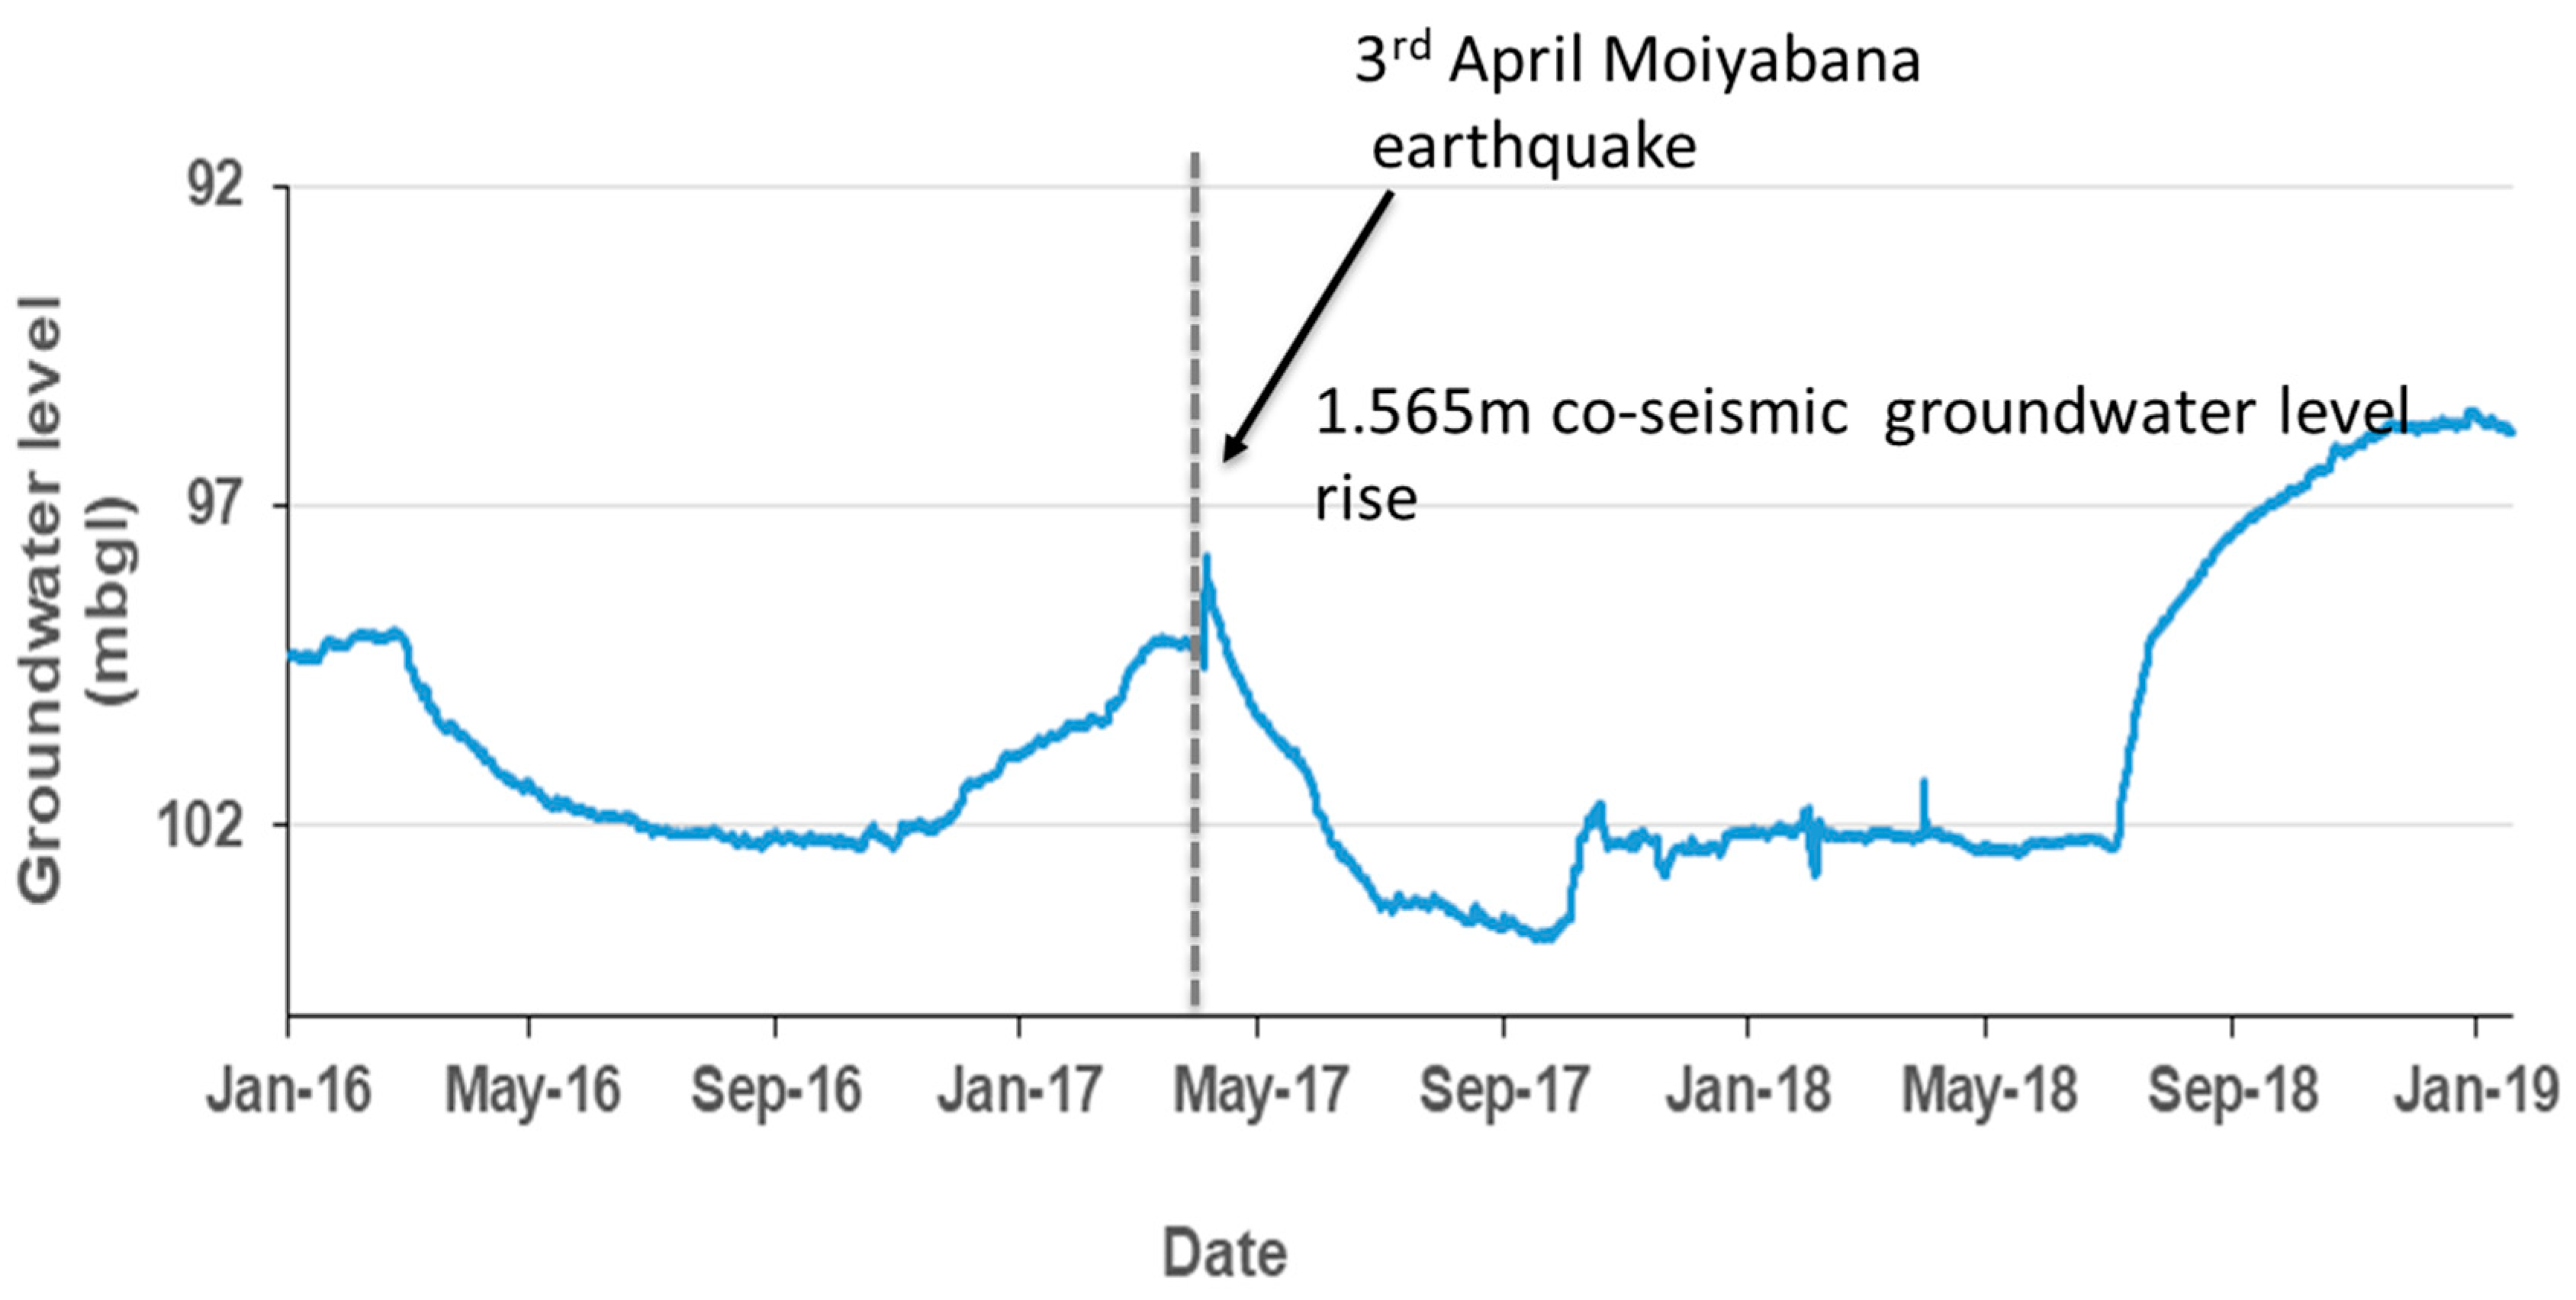
3.1. Borehole Hydrograph Analysis
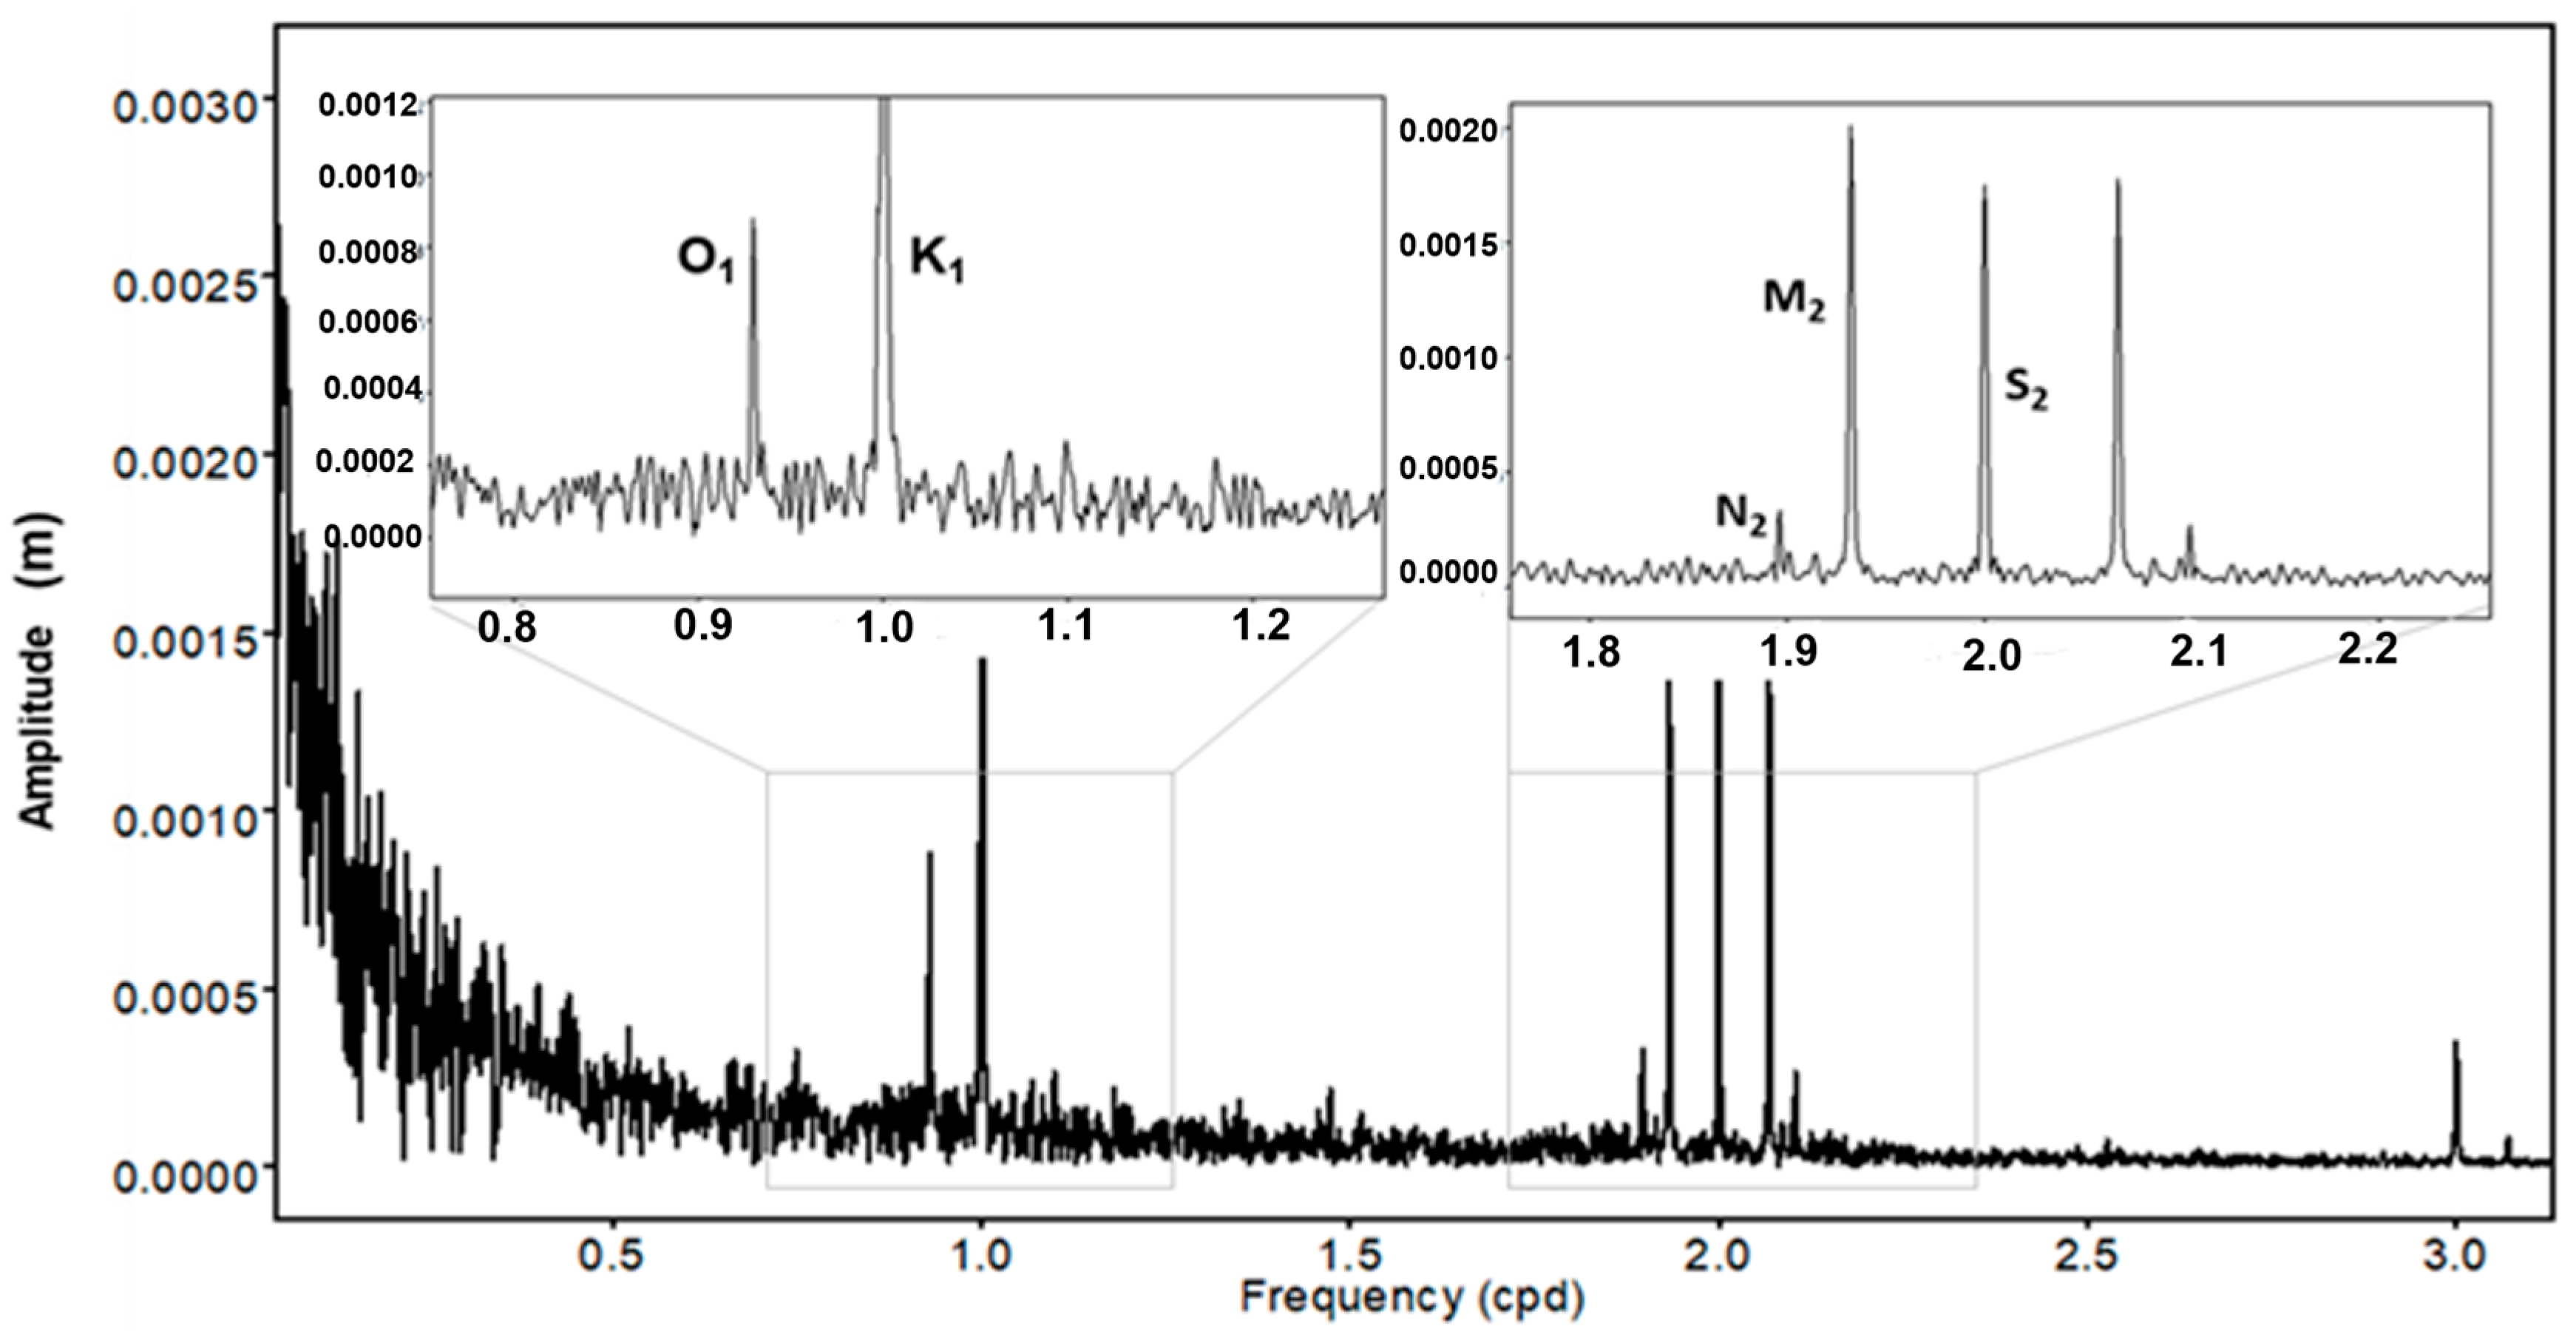
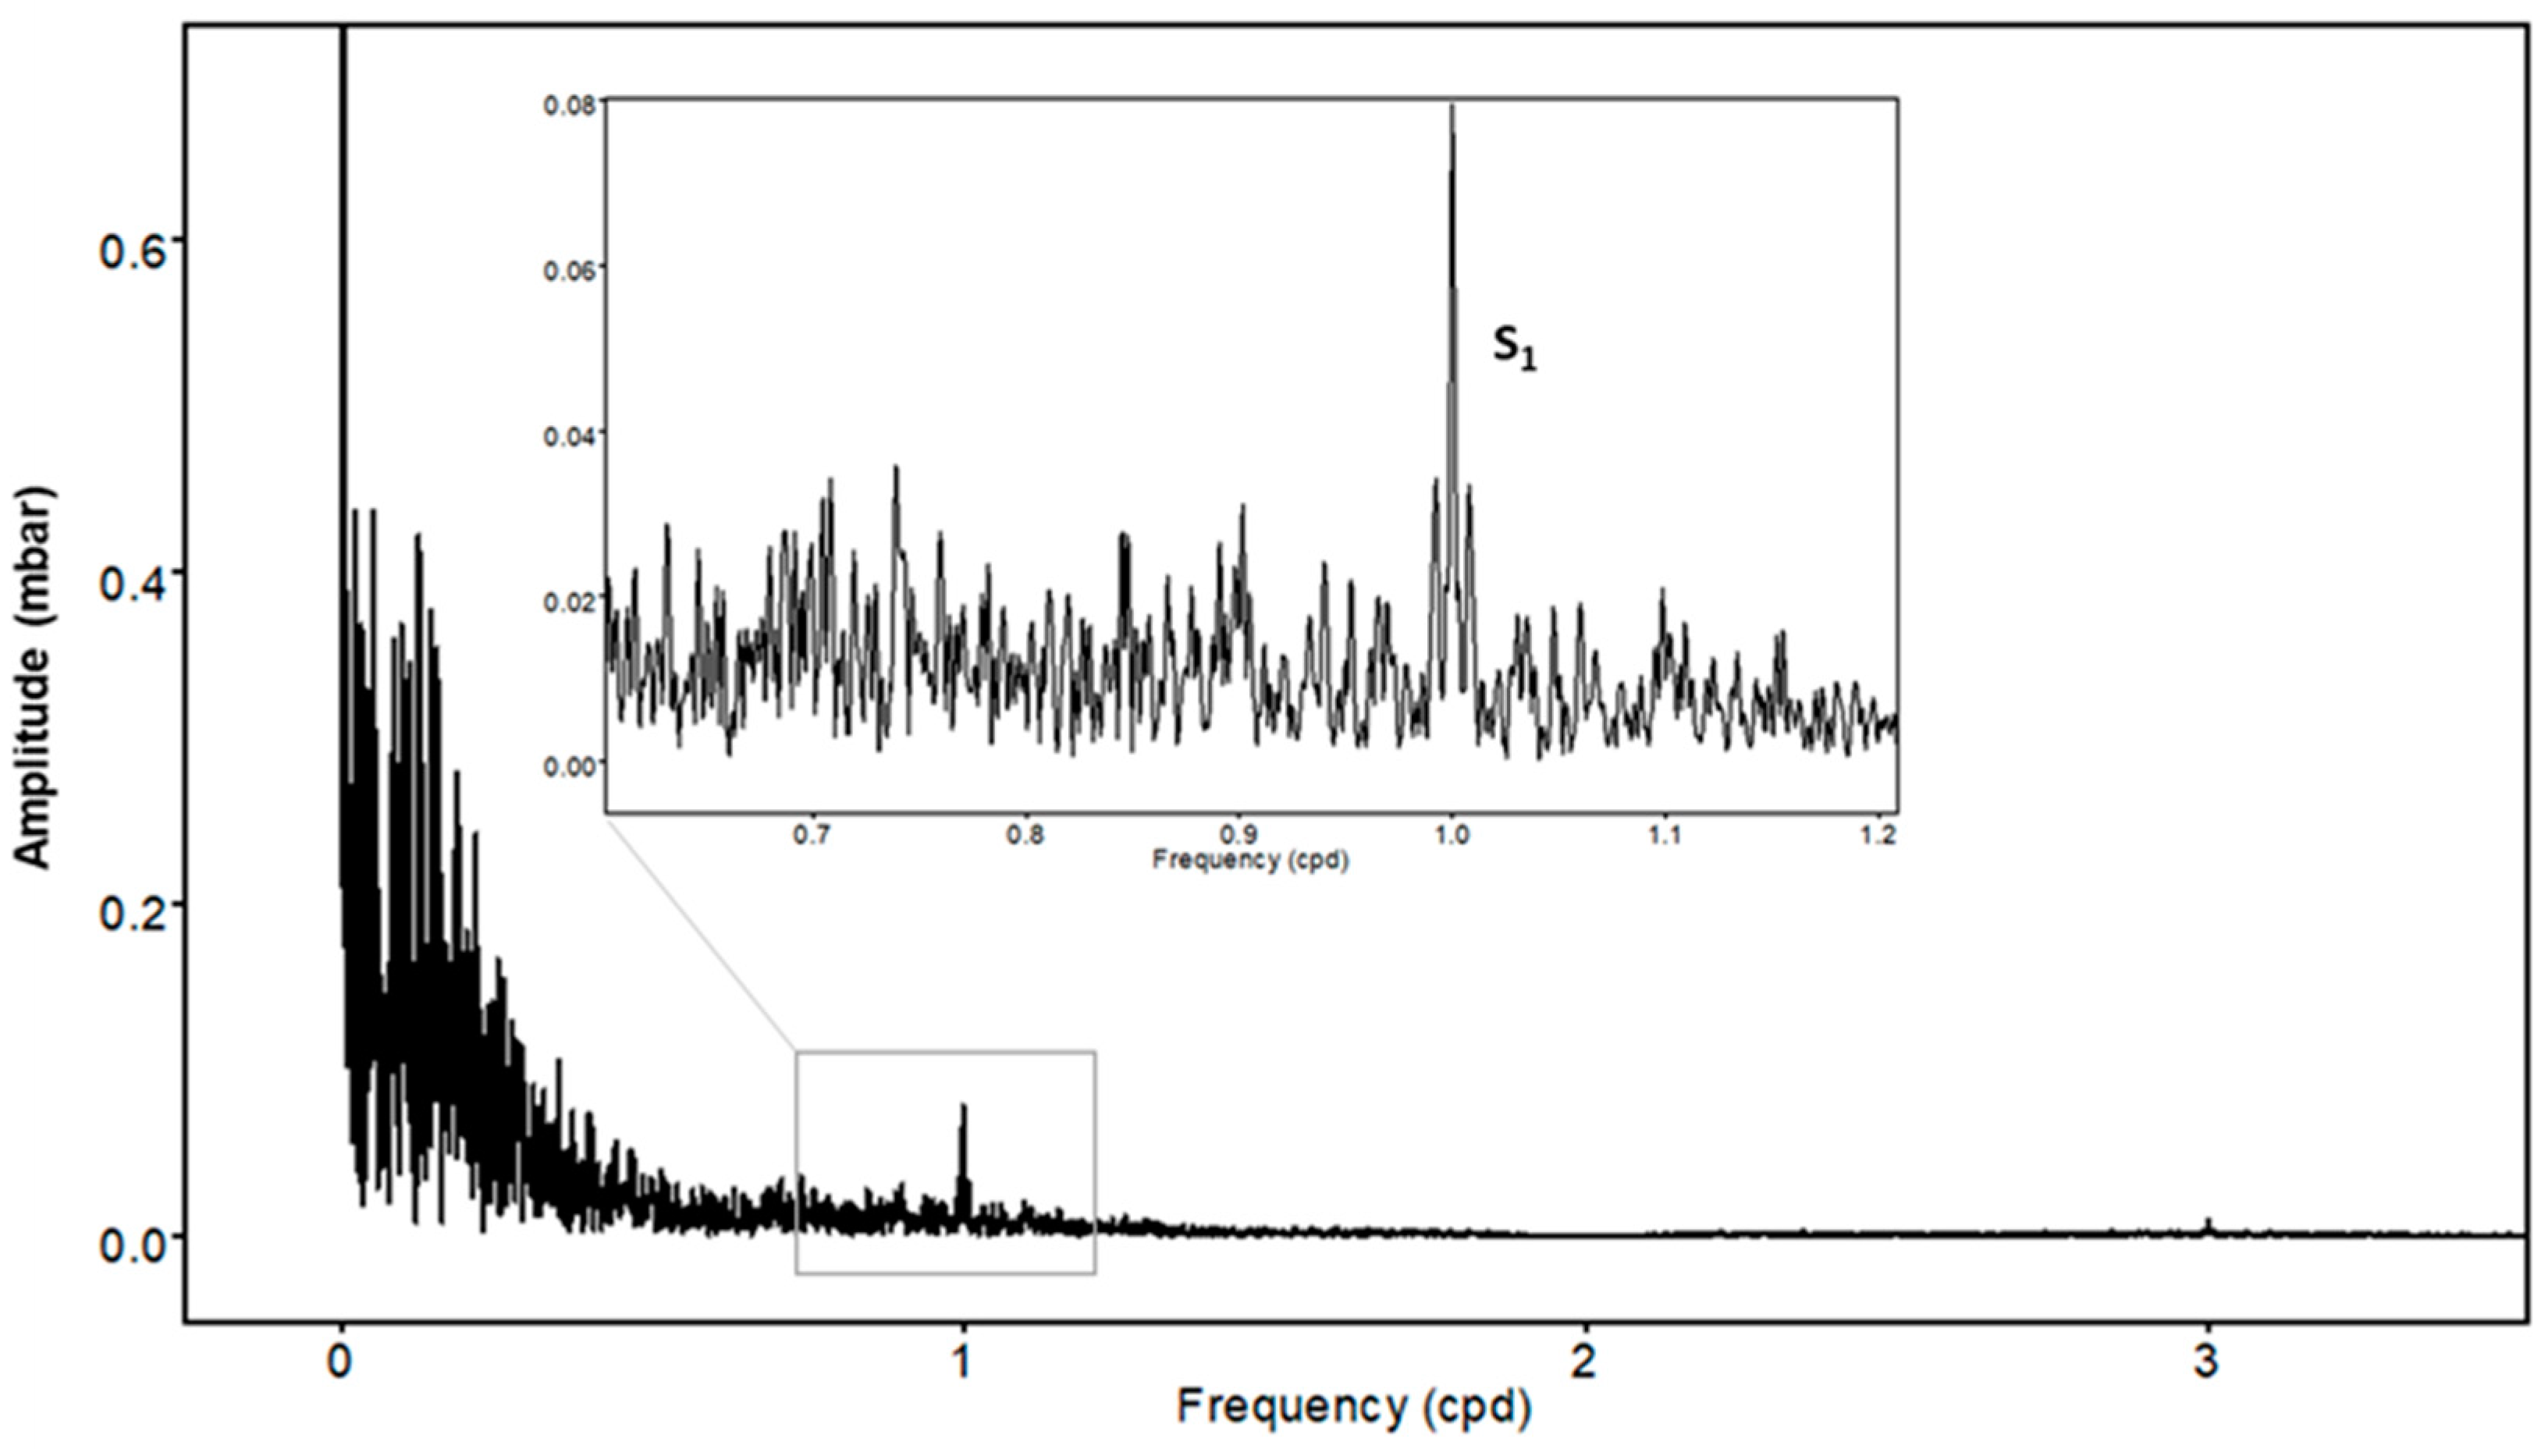
3.2. Spectra Analysis
3.3. Tidal Analysis
4. Discussion
5. Conclusions
Author Contributions
Funding
Data Availability Statement
Acknowledgments
Conflicts of Interest
References
- Lee, J.M.; Woo, N.C.; Koh, D.-C.; Kim, K.-Y.; Ko, K.-S. Assessing aquifer responses to earthquakes using temporal variations in groundwater monitoring data in alluvial and sedimentary bedrock aquifers. Geomat. Nat. Hazards Risk 2020, 11, 742–765. [Google Scholar] [CrossRef]
- Zhang, S.; Shi, Z.; Wang, G. Comparison of aquifer parameters inferred from water level changes induced by slug test, earth tide and earthquake—A case study in the three Gorges area. J. Hydrol. 2019, 579, 124169. [Google Scholar] [CrossRef]
- Liu, C.-Y.; Chia, Y.; Chuang, P.-Y.; Chiu, Y.-C.; Tseng, T.-L. Impacts of hydrogeological characteristics on groundwater-level changes induced by earthquakes. Hydrogeol. J. 2017, 26, 451–465. [Google Scholar] [CrossRef]
- Wang, C.Y.; Manga, M. Hydrologic responses to earthquakes and a general metric. Geofluids 2010, 10, 206–216. [Google Scholar]
- Wang, C.-H.; Kuo, C.-H. Temporal change in groundwater level following the 1999 (Mw = 7.5) Chi-Chi earthquake, Taiwan. Geofluids 2004, 4, 210–220. [Google Scholar] [CrossRef]
- Sun, X.; Wang, G.; Yang, X. Coseismic response of water level in Changping well, China, to the Mw 9.0 Tohoku earthquake. J. Hydrol. 2015, 531, 1028–1039. [Google Scholar] [CrossRef]
- Roeloffs, A. Persistent water level changes in a well near Parkfield, California, due to local and distant earthquakes. J. Geophys. Res. 1998, 103, 869–889. [Google Scholar] [CrossRef]
- ElKhoury, J.E.; Brodsky, E.E.; Agnew, D.C. Seismic waves increase permeability. Nature 2006, 441, 1135–1138. [Google Scholar] [CrossRef]
- Hsieh, P.A.; Bredehoeft, J.D.; Farr, J.M. Determination of aquifer transmissivity from Earth tide analysis. Water Resour. Res. 1987, 23, 1824–1832. [Google Scholar] [CrossRef]
- Allègre, V.; Brodsky, E.E.; Xue, L.; Nale, S.M.; Parker, B.L.; Cherry, J.A. Using earth-tide induced water pressure changes to measure in situ permeability: A comparison with long-term pumping tests. Water Resour. Res. 2016, 52, 3113–3126. [Google Scholar] [CrossRef]
- Zhang, Y.; Fu, L.-Y.; Ma, Y.; Hu, J. Different hydraulic responses to the 2008 Wenchuan and 2011 Tohoku earthquakes in two adjacent far-field wells: The effect of shales on aquifer lithology. Earth Planets Space 2016, 68, 178. [Google Scholar] [CrossRef]
- Bredehoeft, J.D. United States. Geological Survey WD. Response of well-aquifer systems to Earth tides. J. Geophys. Res. Atmos. 1967, 72, 3075–3087. [Google Scholar] [CrossRef]
- Hsieh, P.A.; Bredehoeft, J.D.; Rojstaczer, S.A. Response of well aquifer systems to Earth tides: Problem revisited. Water Resour. Res. 1988, 24, 468–472. [Google Scholar] [CrossRef]
- Rojstaczer, S.; Agnew, D. The influence of formation material properties on the response of water levels in wells to Earth tides and atmospheric loading. J. Geophys. Res. Atmos. 1989, 94, 12403–12411. [Google Scholar] [CrossRef]
- Matsumoto, N.; Roeloffs, E.A. Hydrological response to earthquakes in the Haibara well, central Japan-II. Possible mechanism inferred from time-varying hydraulic propeties. Geophys. J. Int. 2003, 155, 899–913. [Google Scholar] [CrossRef]
- Brodsky, E.E.; Roeloffs, E.; Woodcock, D.; Gall, I.; Manga, M. A mechanism for sustained groundwater pressure changes induced by distant earthquakes. J. Geophys. Res. Atmos. 2003, 108, B8. [Google Scholar] [CrossRef]
- Montgomery, D.R.; Greenberg, H.M.; Smith, D.T. Streamflow response to the Nisqually earthquake. Earth Planet. Sci. Lett. 2003, 209, 19–28. [Google Scholar] [CrossRef]
- Lai, G.; Jiang, C.; Han, L.; Sheng, S.; Ma, Y. Co-seismic water level changes in response to multiple large earthquakes at the LGH well in Sichuan, China. Tectonophysics 2016, 679, 211–217. [Google Scholar] [CrossRef]
- Shi, Z.; Wang, G.; Manga, M.; Wang, C.Y. Mechanism of co-seismic water level change following four great earthquakes—Insights from co-seismic responses throughout the Chinese mainland. Earth Planet. Sci. Lett. 2015, 430, 66–74. [Google Scholar] [CrossRef]
- Xue, L.; Li, H.-B.; Brodsky, E.E.; Xu, Z.-Q.; Kano, Y.; Wang, H.; Mori, J.J.; Si, J.-L.; Pei, J.-L.; Zhang, W.; et al. Continuous Permeability Measurements Record Healing inside the Wenchuan Earthquake Fault Zone. Science 2013, 340, 1555–1559. [Google Scholar] [CrossRef]
- Liao, X.; Wang, C.-Y.; Liu, C.-P. Disruption of groundwater systems by earthquakes. Geophys. Res. Lett. 2015, 42, 9758–9763. [Google Scholar] [CrossRef]
- Kolawole, F.; Atekwana, E.A.; Malloy, S.; Stamps, D.S.; Grandin, R.; Abdelsalam, M.G.; Leseane, K.; Shemang, E.M. Aeromagnetic, gravity, and Differential Interferometric Synthetic Aperture Radar analyses reveal the causative fault of the 3 April 2017 Mw 6.5 Moiyabana, Botswana, earthquake. Geophys. Res. Lett. 2017, 44, 8837–8846. [Google Scholar] [CrossRef]
- Midzi, V.; Saunders, I.; Manzunzu, B.; Kwadiba, M.; Jele, V.; Mantsha, R.; Marimira, K.; Mulabisana, T.; Ntibinyane, O.; Pule, T.; et al. The 03 April 2017 Botswana M6.5 earthquake: Preliminary results. J. Afr. Earth Sci. 2018, 143, 187–194. [Google Scholar] [CrossRef]
- Modisi, M.P.; Atekwana, E.A.; Kampunzu, A.B.; Ngwisanyi, T.H. Rift kinematics during the incipient stages of continental extension: Evidence the nascent Okavango rift basin, Northwest Botswana. Geology 2000, 28, 939–942. [Google Scholar] [CrossRef]
- Simon, R.E.; Kwadiba, M.T.O.; King, J.G.; Moidaki, M. A History of Botswana’s Seismic Network. Botsw. Notes Rec. 2012, 44, 184–192. Available online: http://www.jstor.com/stable/43 (accessed on 28 February 2018).
- Albano, M.; Polcari, M.; Bignami, C.; Moro, M.; Saroli, M.; Stramondo, S. Did Anthropogenic Activities Trigger the 3 April 2017 Mw 6.5 Botswana Earthquake? Remote. Sens. 2017, 9, 1028. [Google Scholar] [CrossRef]
- Fadel, I.; van der Meijde, M.; Paulssen, H. Crustal Structure and Dynamics of Botswana. J. Geophys. Res. Solid Earth 2018, 123, 10659–10671. [Google Scholar] [CrossRef]
- Gardonio, B.; Jolivet, R.; Calais, E.; Leclère, H. The April 2017 Mw6.5 Botswana Earthquake: An Intraplate Event Triggered by Deep Fluids. Geophys. Res. Lett. 2018, 45, 8886–8896. [Google Scholar] [CrossRef]
- Moorkamp, M.; Fishwick, S.; Walker, R.J.; Jones, A.G. Geophysical evidence for crustal and mantle weak zones controlling intra-plate seismicity—The 2017 Botswana earthquake sequence. Earth Planet. Sci. Lett. 2018, 506, 175–183. [Google Scholar] [CrossRef]
- Lekula, M.; Lubczynski, M.W.; Shemang, E.M. Hydrogeological conceptual model of large and complex sedimentary aquifer systems—Central Kalahari Basin. Phys. Chem. Earth Parts A/B/C 2018, 106, 47–62. [Google Scholar] [CrossRef]
- Smith, R. The Lithostratigraphy of the Karoo Supergroup in Botswana. Bulletin 2. Department of Geological Survey. Bull.-Geol. Surv. Dep. Repub. Botswana. 1984, 26, 239. [Google Scholar]
- Williamson, L.; District, M. The geology of the area around Mmamabula and Dibete: Including an account of the Greater Mmamabula Coalfield. Dep. Geol. Surv. 1996, 6, 40–105. [Google Scholar]
- Carney, J.; Aldiss, D.; Lock, N. The Geology of Botswana, Bulletin37; Bulletin37 1st ed.; Department of Geological Survey: Gaborone, Botswana, 1994.
- Reeves, C.; Hutchins, D. A progress report on the geophysical exploration of the Kalahari in Botswana. Geoexploration 1982, 20, 209–224. [Google Scholar] [CrossRef]
- Hutchins, D.; Reeves, C. Regional geophysical exploration of the Kalahari in Botswana. Tectonophysics 1980, 69, 201–220. [Google Scholar] [CrossRef]
- Chisenga, C.; Van der Meijde, M.; Yan, J.; Fadel, I.; Atekwana, E.A.; Steffen, R.; Ramotoroko, C. Gravity derived crustal thickness model of Botswana: Its implication for the Mw 6.5 April 3, 2017, Botswana earthquake. Tectonophysics 2020, 787, 228479. [Google Scholar] [CrossRef]
- Rajesh, H.; Safonov, O.; Basupi, T.; Belyanin, G.; Tsunogae, T. Complexity of characterizing granitoids in high-grade terranes: An example from the Neoarchean Verbaard granitoid, Limpopo Complex, Southern Africa. Lithos 2018, 318–319, 399–418. [Google Scholar] [CrossRef]
- Obakeng, O.T.; de Vries, J.J.; Lubczynski, M.W. Soil Moisture Dynamics and Evapotranspiration at the Fringe of the Botswana Kalahari, with Emphasis on Deep Rooting Vegetation; Vrije Universiteit: Amsterdam, The Netherland, 2007. [Google Scholar]
- Nthaba, B.; Simon, R.E.; Ogubazghi, G.M. Seismicity Study of Botswana from 1966 to 2012. Int. J. Geosci. 2018, 9, 707–718. [Google Scholar] [CrossRef]
- SMEC; EHES. Botswana National Water Master Plan Review; Department of Water Affairs: Gaborone, Botswana, 2006; Volume 4.
- WRC. Consultancy Services for the Post—Auditing of the Palla Road Groundwater Model (Palla Road & Chepete Wellfields) TENDER NO: MTC\MMEWR\DWA\1\29\11-12. Draft Modelling Report. Gaborone, Botswana, 2012. [Google Scholar]
- WCS. Kudumatse Block Groundwater Investigation—Borehole Z12836; WCA: New York, NY, USA, 2007. [Google Scholar]
- Van Biljon, M. Geological Investigation and Groundwater Modelling at the Proposed Gope Diamond Mine Project; Botswana, 2008. [Google Scholar]
- Cooper, H.H., Jr.; Jacob, C.E. A generalized graphical method for evaluating formation constants and summarizing well-field history. Eos, Transactions American Geophysical Union. Eos Trans. Am. Geophys. Union 1946, 27, 526–534. [Google Scholar] [CrossRef]
- Shi, Z.; Wang, G. Sustained groundwater level changes and permeability variation in a fault zone following the 12 May 2008, Mw7.9 Wenchuan earthquake. Hydrol. Process. 2014, 29, 2659–2667. [Google Scholar] [CrossRef]
- He, A.; Singh, R.P. Groundwater level response to the Wenchuan earthquake of May 2008. Geomat. Nat. Hazards Risk 2018, 10, 336–352. [Google Scholar] [CrossRef]
- Van Camp, M.; Vauterin, P. Tsoft: Graphical and interactive software for the analysis of time series and Earth tides. Comput. Geosci. 2005, 31, 631–640. [Google Scholar] [CrossRef]
- Acworth, R.I.; Halloran, L.J.S.; Rau, G.C.; Cuthbert, M.O.; Bernardi, T.L. An objective frequency domain method for quantifying confined aquifer compressible storage using Earth and atmospheric tides. Geophys. Res. Lett. 2016, 43, 11671–11678. [Google Scholar] [CrossRef]
- Cutillo, P.A.; Bredehoeft, J.D. Estimating Aquifer Properties from the Water Level Response to Earth Tides. Groundwater 2010, 49, 600–610. [Google Scholar] [CrossRef] [PubMed]
- Fuentes-Arreazola, M.A.; Ramírez-Hernández, J.; Vázquez-González, R. Hydrogeological Properties Estimation from Groundwater Level Natural Fluctuations Analysis as a Low-Cost Tool for the Mexicali Valley Aquifer. Water 2018, 10, 586. [Google Scholar] [CrossRef]
- Ishiguro, M.; Tamura, Y. BAYTAP-G in TIMSAC-84, in Computer Science Monographs. Inst. Stat. Math. 1985, 22, 56–117. [Google Scholar]
- Tamura, Y.; Sato, T.; Ooe, M.; Ishiguro, M. A procedure for tidal analysis with a Bayesian information criterion. Geophys. J. Int. 1991, 104, 507–516. [Google Scholar] [CrossRef]
- Munk, W.; MacDonald, G.J. The Rotation of the Earth; Cambridge University Press: London, UK, 1960; p. 68. [Google Scholar]
- Roeloffs, E. Poroelastic Techniques in the Study of Earthquake-Related Hydrologic Phenomena. Adv. Geophys. 1996, 37, 135–195. [Google Scholar] [CrossRef]
- Xue, L.; Brodsky, E.E.; Erskine, J.; Fulton, P.M.; Carter, R. A permeability and compliance contrast measured hydrogeologically on the San Andreas Fault. Geochem. Geophys. Geosyst. 2016, 17, 858–871. [Google Scholar] [CrossRef]
- Marine, I.W. Water level fluctuations due to earth tides in a well pumping from slightly fractured crystalline rock. Water Resour. Res. 1975, 11, 165–173. [Google Scholar] [CrossRef]
- Merritt, M. Estimating Hydraulic Properties of the Floridan Aquifer System by Analysis of Earth-Tide, Ocean-Tide, and Barometric Effects, Collier and Hendry Counties, Florida; US Department of the Interior; US Geological Survey: Reston, VA, USA, 2004.
- Shen, Q.; Zheming, S.; Guangcai, W.; Qingyu, X.; Zejun, Z.; Jiaqian, H. Using water-level fluctuations in response to Earth-tide and barometric-pressure changes to measure the in-situ hydrogeological properties of an overburden aquifer in a coalfield. Hydrogeol. J. 2020, 28, 1465–1479. [Google Scholar] [CrossRef]
- Wang, C.; Doan, M.; Xue, L.; Barbour, A.J. Tidal Response of Groundwater in a Leaky Aquifer—Application to Oklahoma. Water Resour. Res. 2018, 54, 8019–8033. [Google Scholar] [CrossRef]
- Wang, H.F. Theory of Linear Poroelasticity with Applications to Geomechanics and Hydrogeology; Princeton University Press: Princeton, NJ, USA, 2001. [Google Scholar] [CrossRef]
- Freeze, R.A.; Cherry, J.A. Groundwater. Englewood Cliffs; Prentice-Hall: Hoboken, NJ, USA, 1979. [Google Scholar]
- Zhang, H.; Shi, Z.; Wang, G.; Sun, X.; Yan, R.; Liu, C. Large Earthquake Reshapes the Groundwater Flow System: Insight from the Water-Level Response to Earth Tides and Atmospheric Pressure in a Deep Well. Water Resour. Res. 2019, 55, 4207–4219. [Google Scholar] [CrossRef]
- Zhang, S.; Shi, Z.; Wang, G.; Zhang, Z. Quantitative Assessment of the Mechanisms of Earthquake-Induced Groundwater-Level Change in the MP Well, Three Gorges Area. Pure Appl. Geophys. 2018, 175, 2475–2484. [Google Scholar] [CrossRef]
- Shibata, T.; Takahashi, R.; Takahashi, H.; Kagoshima, T.; Takahata, N.; Sano, Y.; Pinti, D.L. Coseismic changes in groundwater level during the 2018 Hokkaido Eastern Iburi earthquake. Earth Planets Space 2020, 72, 23. [Google Scholar] [CrossRef]
- Yan, R.; Wang, G.; Shi, Z. Sensitivity of hydraulic properties to dynamic strain within a fault damage zone. J. Hydrol. 2016, 543, 721–728. [Google Scholar] [CrossRef]
- Fetter, C. Applied Hydrogeology, 4th ed.; Waveland Press: Salem, WI, USA, 2001; Volume 4. [Google Scholar]
- Burbey, T.J.; Hisz, D.; Murdoch, L.C.; Zhang, M. Quantifying fractured crystalline-rock properties using well tests, earth tides and barometric effects. J. Hydrol. 2012, 414–415, 317–328. [Google Scholar] [CrossRef]
- Gao, X.; Sato, K.; Horne, R.N. General Solution for Tidal Behavior in Confined and Semiconfined Aquifers Considering Skin and Wellbore Storage Effects. Water Resour. Res. 2020, 56, e2020WR027195. [Google Scholar] [CrossRef]
- Kumar, T.J.R.; Balasubramanian, A.; Kumar, R.S.; Dushiyanthan, C.; Thiruneelakandan, B.; Suresh, R.; Karthikeyan, K.; Davidraju, D. Assessment of groundwater potential based on aquifer properties of hard rock terrain in the Chittar–Uppodai watershed, Tamil Nadu, India. Appl. Water Sci. 2014, 6, 179–186. [Google Scholar] [CrossRef]
- Nespoli, M.; Todesco, M.; Serpelloni, E.; Belardinelli, M.E.; Bonafede, M.; Marcaccio, M.; Rinaldi, A.P.; Anderlini, L.; Gualandi, A. Modeling earthquake effects on groundwater levels: Evidences from the 2012 Emilia earthquake (Italy). Geofluids 2015, 16, 452–463. [Google Scholar] [CrossRef]
- Wang, C.-Y.; Chia, Y. Mechanism of water level changes during earthquakes: Near field versus intermediate field. Geophys. Res. Lett. 2008, 35, L12402. [Google Scholar] [CrossRef]
- Wang, C.-Y.; Manga, M.; Chen, C.-H. Transient change in groundwater temperature after earthquakes. Geology 2012, 40, 119–122. [Google Scholar] [CrossRef]


| Borehole ID | Borehole Depth (mbgl) | Depth to Base (mbgl) | Water Strike (mbgl) | Rest Water Level (mbgl) | |||
|---|---|---|---|---|---|---|---|
| Kalahari Beds | Stormberg Basalt | Ntane Sandstone Fm | Mosolotsane Fm | ||||
| MH2 | 501 | 71.8 | 394 | 425 | >501 | 211; 388 | 99.362 |
| Z12836 | 187 | 26 | 104 | 173 | >187 | 58; 104; 112 | 34.19 |
| Tidal Component | Description | Period (Day) | Frequency, cpd (Cycles per Day) |
|---|---|---|---|
| O1 | Principal lunar | 1.0758 | 0.9295 |
| K1 | Lunar–solar | 1.3721 | 1.0029 |
| N2 | Lunar elliptic | 0.5275 | 1.8957 |
| M2 | Principal lunar | 0.5175 | 1.9324 |
| S2 | Principal solar | 0.5000 | 2.0000 |
| Borehole ID | Epicentral Distance (km) | Seismic Energy Density (J/m3) |
|---|---|---|
| MH2 | 40 | 2.277 |
| Z12836 | 167 | 0.0299 |
| BH ID | Date | Tidal Amplitude (mm) | Phase Shift (°) | Specific Storage Ss (10−6 m−1) | Storativity (Dimensionless) S (10−4) | Transmissivity T (10−5 m2/s) | Permeability k (10−13 m2) |
|---|---|---|---|---|---|---|---|
| MH2 | Mar 17 | 1.592 | 10.592 | 20.172 | 6.25332 | 9.7766 | 3.215 |
| Apr 17 | 3.209 | −3.437 | 9.933 | 3.079 | 9.2157 | 3.03 | |
| Δ | 1.617 | −14.029 | −10.521 | −3.17432 | −0.5609 | −0.185 | |
| Z12836 | Mar 17 | 2.46 | −2.933 | 12.883 | 8.89 | 8.0638 | 1.191 |
| Apr 17 | 3.514 | 12.363 | 8.752 | 6.04 | 8.3799 | 1.238 | |
| Δ | 1.054 | 15.259 | −4.131 | −2.85 | 0.3161 | 0.047 |
Disclaimer/Publisher’s Note: The statements, opinions and data contained in all publications are solely those of the individual author(s) and contributor(s) and not of MDPI and/or the editor(s). MDPI and/or the editor(s) disclaim responsibility for any injury to people or property resulting from any ideas, methods, instructions or products referred to in the content. |
© 2023 by the authors. Licensee MDPI, Basel, Switzerland. This article is an open access article distributed under the terms and conditions of the Creative Commons Attribution (CC BY) license (https://creativecommons.org/licenses/by/4.0/).
Share and Cite
Marema, T.M.; Molwalefhe, L.; Shemang, E.M. Characterisation of the Hydrogeological Properties of the Ntane Sandstone Aquifer Using Co-Seismic and Post-Seismic Groundwater Level Responses to the Mw 6.5 Moiyabana Earthquake, Central Botswana. Water 2023, 15, 1947. https://doi.org/10.3390/w15101947
Marema TM, Molwalefhe L, Shemang EM. Characterisation of the Hydrogeological Properties of the Ntane Sandstone Aquifer Using Co-Seismic and Post-Seismic Groundwater Level Responses to the Mw 6.5 Moiyabana Earthquake, Central Botswana. Water. 2023; 15(10):1947. https://doi.org/10.3390/w15101947
Chicago/Turabian StyleMarema, Tshepang Mmamorena, Loago Molwalefhe, and Elisha M. Shemang. 2023. "Characterisation of the Hydrogeological Properties of the Ntane Sandstone Aquifer Using Co-Seismic and Post-Seismic Groundwater Level Responses to the Mw 6.5 Moiyabana Earthquake, Central Botswana" Water 15, no. 10: 1947. https://doi.org/10.3390/w15101947