Article

The Surface-to-Atmosphere GHG Fluxes in Rewetted and Permanently Flooded Former Peat Extraction Areas Compared to Pristine Peatland in Hemiboreal Latvia

Latvian State Forest Research Institute ‘Silava’, Rigas Str. 111, LV-2169 Salaspils, Latvia
*
Author to whom correspondence should be addressed.
Water 2023, 15(10), 1954; https://doi.org/10.3390/w15101954
Submission received: 13 April 2023 / Revised: 17 May 2023 / Accepted: 18 May 2023 / Published: 21 May 2023

Abstract

:
When it comes to greenhouse gas (GHG) reduction, the role of water tables in former peat extraction areas has received considerable interest in recent decades. This study analysed the carbon dioxide (CO2), methane (CH4) and nitrous oxide (N2O) surface-to-atmosphere fluxes from a rewetted and permanently flooded former peat extraction areas in comparison to pristine peatland in hemiboreal Latvia. Measurements of GHG fluxes combined gas sampling using a closed-chamber (opaque) method with the gas chromatography detection method. Among the studied land-use types, the highest annualised CO2 fluxes (soil heterotrophic and autotrophic respiration) were recorded in rewetted former peat extraction areas with restored vegetation and in undisturbed peatland (4.10 ± 0.21 and 3.45 ± 0.21 t CO2-C ha−1 yr−1, respectively), with the lowest in flooded former peat extraction areas (0.55 ± 0.05 t CO2-C ha−1 yr−1); temperature and groundwater level were found to be significant influencing factors. The highest annualised CH4 fluxes were recorded in undisturbed peatland (562.4 ± 155.8 kg CH4-C ha−1 yr−1), followed by about two-fold and ~20-fold smaller CH4 fluxes in flooded and rewetted areas, respectively. N2O fluxes were negligible in all the studied land-use types, with the highest N2O fluxes in undisturbed peatland (0.66 ± 0.41 kg N2O-N ha−1 yr−1).

1. Introduction

Cutover peatlands release considerable amount of GHG emissions into the atmosphere [1,2,3,4], and the absence of vegetation does not compensate for the reduction in soil organic carbon (C) stock. In recent decades, the research on the impact of various management practices, natural and human-induced disturbances, and conservation and restoration measures in such areas has focused mainly on the interrelation between water level regulation and surface-to-atmosphere GHG fluxes [5,6,7,8]. The focus of this study was rewetted and permanently flooded former peat extraction areas in comparison to pristine (undisturbed) peatland in the hemiboreal region, with particular attention paid to Europe. The Intergovernmental Panel on Climate Change (IPCC) defined rewetting as ‘the deliberate action of raising the water table on drained soils to re-establish water saturated conditions’ in the IPCC Wetlands Supplement (2014) [9], while flooded lands were defined as ‘water bodies where human activities have caused changes in the amount of surface area covered by water, typically through water level regulation’ [10]. In general, two main categories of mechanisms responsible for altered soil GHG fluxes following changed water levels have commonly been hypothesised: (1) enhanced or reduced microbial metabolism by substrate supply and oxygen (O2) availability, and (2) physical mechanisms [11]. For example, water levels or hydrological conditions acting as a barrier to diffusion of GHG, limiting the aerobic zone (availability of O2), and controlling major soil biological and physicochemical processes and thus the magnitude of net GHG fluxes from soils characterised by high levels of organic matter [6,7,9,10]. Simplified, CO2 and N2O emissions from organic soils in saturated conditions are generally lower compared to those of drained soils due to a decrease in soil organic matter oxidation, while CH4 emissions increase due to conditions conducive to enhanced methanogenesis and decreased CH4 oxidation [12]. Indeed, GHG production, release and consumption are highly complex processes with a considerable variety of affecting factors (both biotic and abiotic). Although decreasing the zone of aerobic decomposition in areas with drained organic soils by raising the water table level is often considered a climate change mitigation measure [13,14,15,16], contradictory results have been found, especially for nutrient-rich sites and during the first years after intervention [12,17,18,19]. Furthermore, GHG emissions/removals are characterised by high spatial and temporal variation [9,10,20] in both rewetted and flooded areas, depending on a range of factors, including climate, nutrient availability, soil parameters (peat degradation, soil bulk density, C/N ratio), vegetation characteristics (species and cover), land-use and management practices before the water table level change, as well as on the extent, frequency and the duration of flooding, drought, freezing and thawing periods [6,10,11,15,21]. In Latvia, the naturally high fluctuation in groundwater (GW) levels—including confined aquifer discharge both in naturally wet and drained areas (e.g., [22])—may additionally reinforce spatial and temporal variation of GHG emissions.
According to the latest information, there were 89.3 kha of drained organic soils in croplands and 77.0 kha in grasslands, as well as 31.6 kha of drained peat extraction areas in 2021 in Latvia [23]. Butlers and Ivanovs (2018) recently estimated that active peat extraction currently occurs in 22% of the total area previously drained for peat extraction in Latvia, while ~10% of the area previously drained for peat extraction is under flooded and rewetted conditions [24]. However, it should be emphasised that only part of the mentioned area with organic soil corresponds to the typical Histosol. The other part of the mentioned area can be defined as soil rich in organic matter—conforming to the IPCC 2006 GPG definition for organic soil (at least a 10-cm-deep peat layer and at least 12% by mass C content in the topsoil—the 0–20 cm soil layer), but not conforming to national or World Reference Base (WRB) criteria for Histosols. An increasing number of studies have concluded that afforestation of drained organic soils is among the most effective climate change mitigation measures (e.g., [25,26]) and the EU biodiversity strategy for 2030 has committed to planting at least 3 billion additional trees in the EU [27]. Nevertheless, some proportion of the total area of drained organic soils (at least part of those areas currently under agricultural production) will most likely be subject to the rising of water tables near or above the ground surface according to the Proposal for a Regulation of the European Parliament and of the Council on nature restoration [28], which states that 70% of organic soils under farming activities should be restored by 2050. This area can be partially substituted by the restoration of former peat extraction areas and—according to the most recent proposal—an additional 20% of the total area of organic soil under farming activities by restoration of organic soils under other land uses.
Consequently, several studies have highlighted that future field studies incorporating vegetation are necessary to select the most effective management and restoration strategies for organic soils in the course to the climate neutrality (e.g., [15]), and to provide knowledge from all regions (climate zones). This study provides additional knowledge from the hemiboreal region of Europe, which has a characteristic combination of a cold, wet climate and a considerable area of managed organic soils, including abandoned peat extraction sites. The total GHG emissions from organic soils in Latvia are equal to the emissions of the energy sector in Latvia; however, some of the key sources of the emissions are reported using highly uncertain tier 1 methods, hampering implementation of efficient mitigation measures and leaving space for speculation in the climate policy related processes. In this study, our objective was to estimate the magnitude of surface-to-atmosphere GHG fluxes in rewetted and permanently flooded former peat extraction areas in comparison to pristine (undisturbed) peatland in hemiboreal Latvia. Investigated surface-to-atmosphere GHG fluxes included sum of soil autotrophic and heterotrophic respiration (CO2 fluxes), as well as fluxes of CH4 and N2O.

2. Materials and Methods
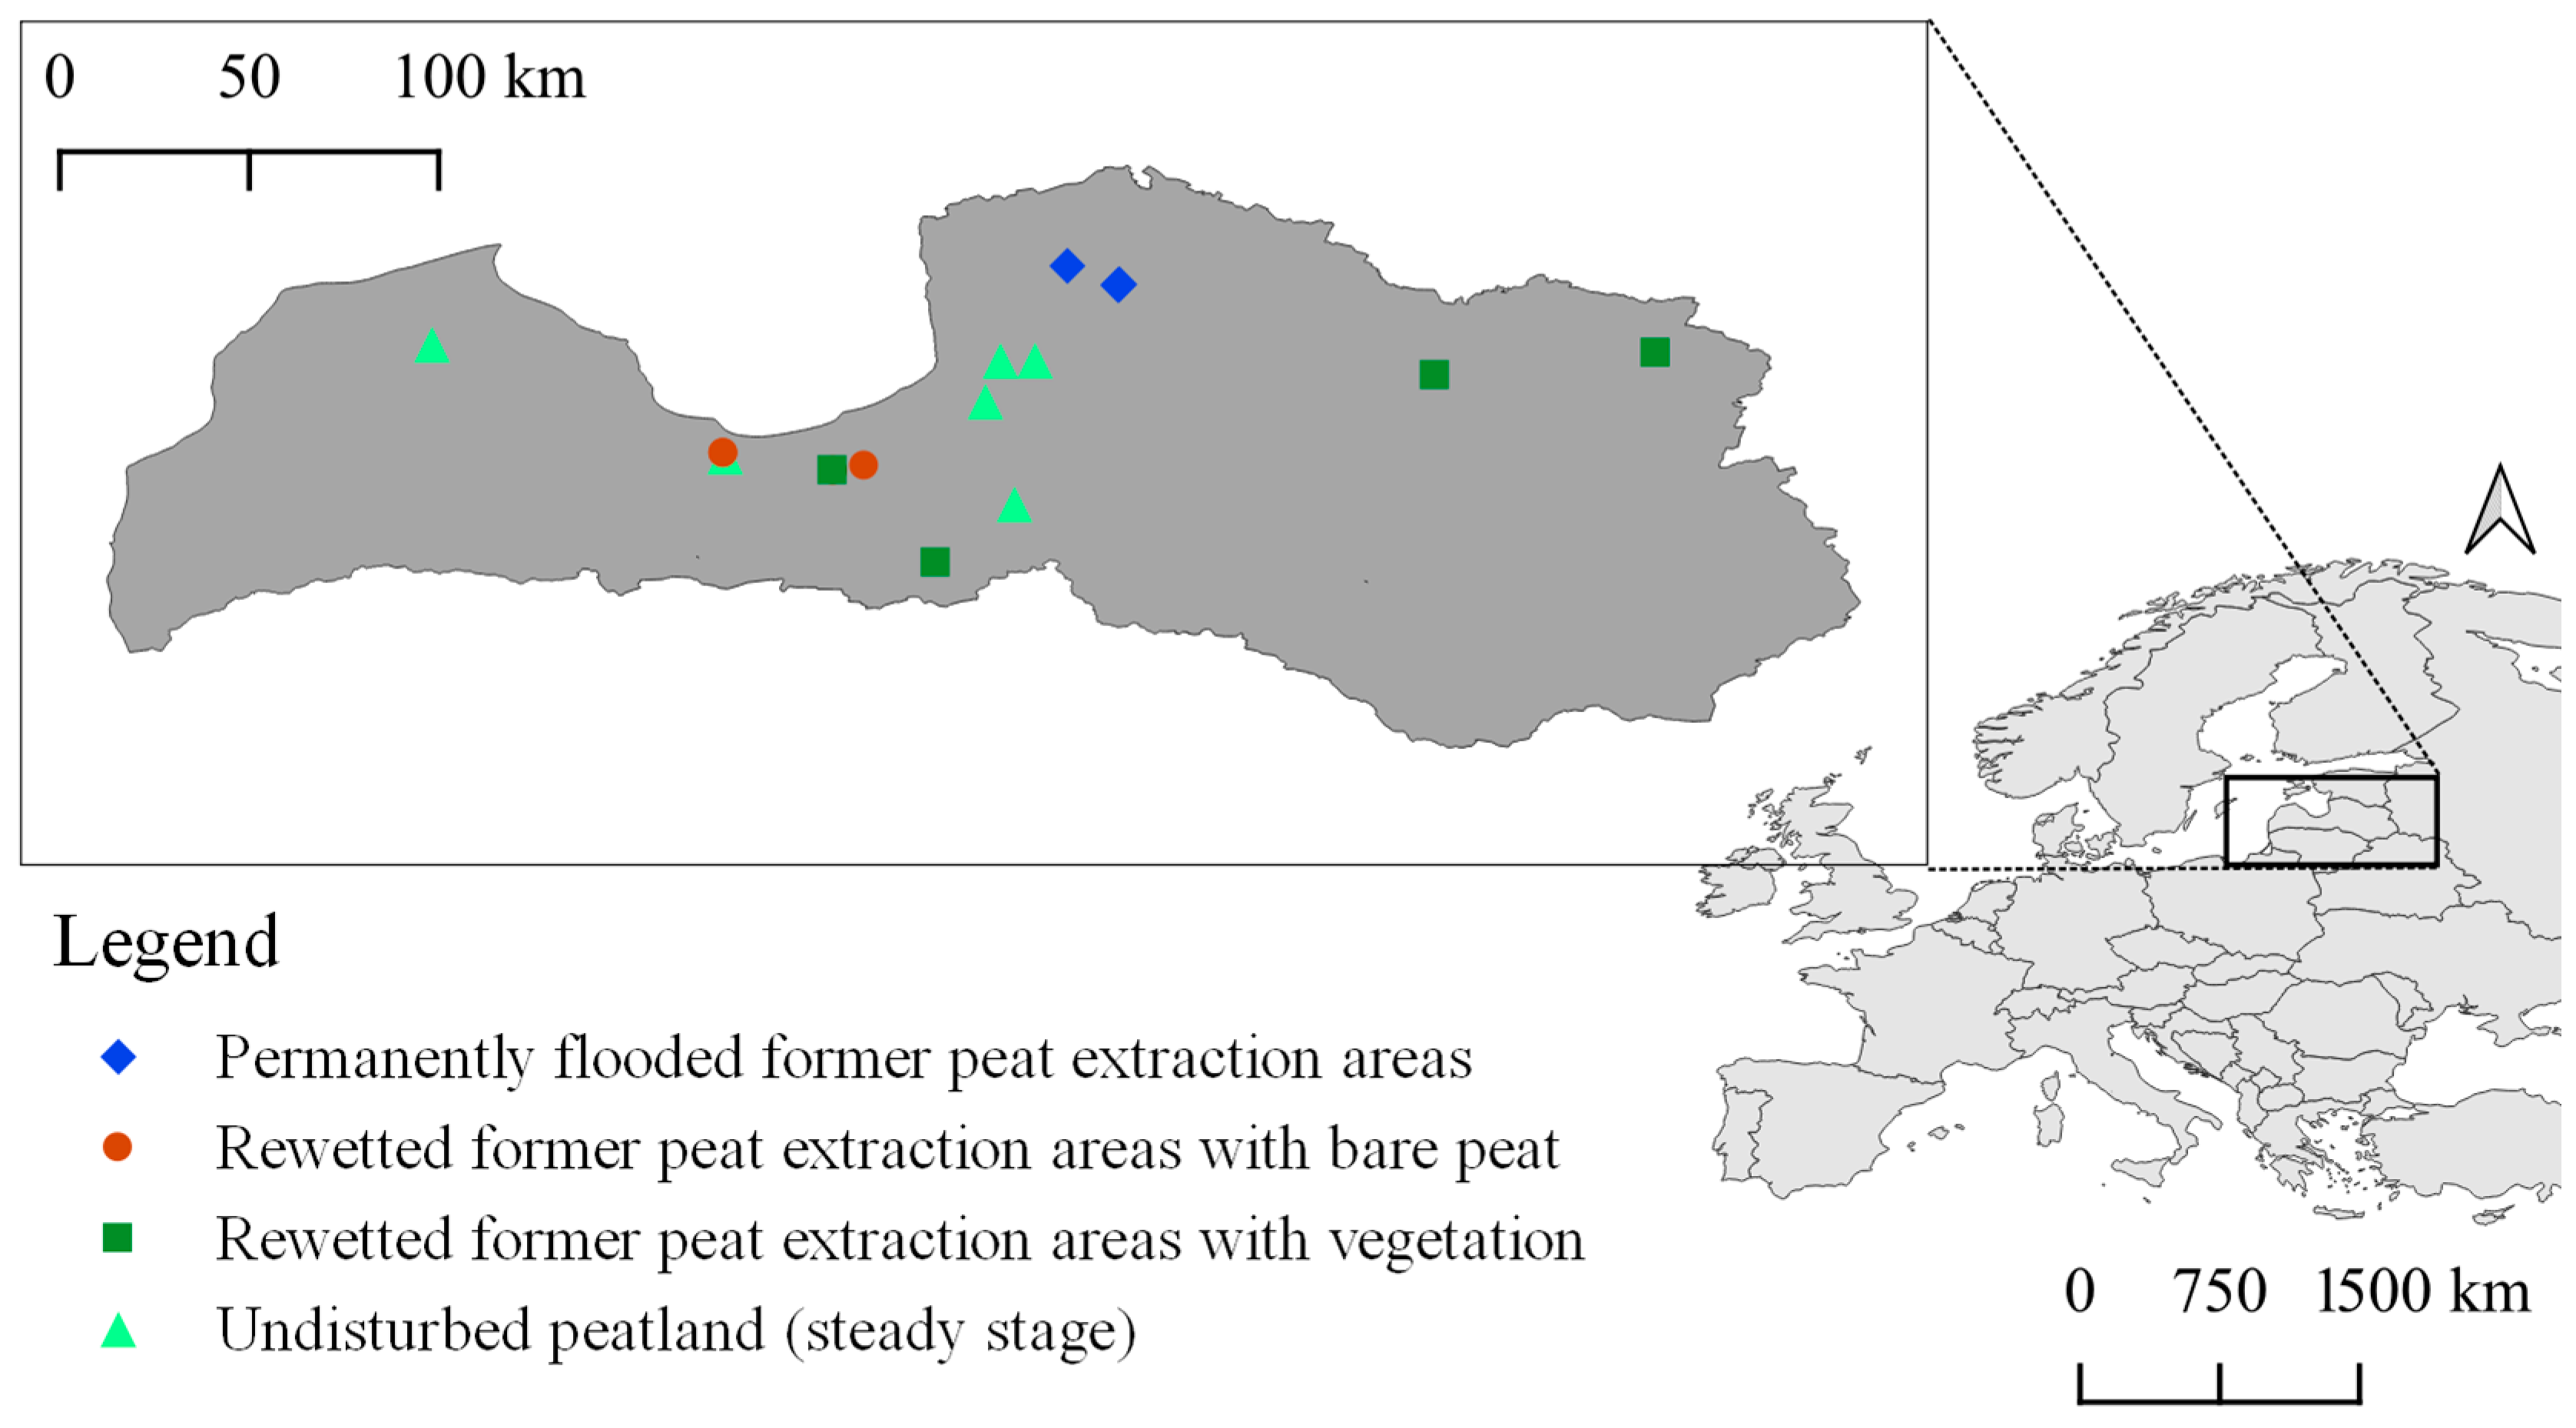
2.1. Research Sites

The study was conducted between December 2016 and December 2022 in Latvia, which is in the hemiboreal zone (halfway—i.e., the ecotone—between the temperate and subarctic or boreal climate zones). During this period, the mean annual precipitation in Latvia ranged from 473 to 810 mm, while the mean annual air temperature ranged from +6.9 to +8.8 °C [29]. In general, the average annual air temperature in Latvia is +6.8 °C (climatic standard norm 1991–2020), while the average annual precipitation is 685.6 mm [29].
During the study period, the maximum deviation of the average annual air temperature from the climatic standard norm (1991–2020) was 0.8 °C, while the maximum deviation of the average annual precipitation from the climatic standard norm (1991–2020) was 212.9 mm (Figures S1 and S2 in Supplementary Materials). At each research site, monitoring of the soil GHG fluxes was carried out for at least 24 months.
In total, 17 research sites were selected in former peat extraction areas and undisturbed (natural) peatland, covering different regions of Latvia (Figure 1). Eight research site represented rewetted former peat extraction areas where the water table was raised and water-saturated conditions had been re-established during the last 20–30 years. Three research sites represented permanently flooded former peat extraction areas where the flooded water level was up to 1.8 m deep. Flooding of former peat extraction areas was caused due to closing of outputs of drainage ditches by removing culverts. Six research sites represented pristine (undisturbed) peatland (raised bog and transitional mire). The thickness of the peat layer at the studied research sites was greater than 70 cm. Short descriptions of the studied research sites are presented in Table 1.

2.2. GHG Flux Sampling Design in Rewetted Former Peat Extraction Areas and Undisturbed Peatland

Soil-to-atmosphere GHG flux sampling was conducted using the manual closed-chamber (opaque) method [30]. Permanent chamber collars were installed in five replicates, spread evenly within a distance of 3 m of each other, in a representative area of each studied research site. The collars were installed in the soil at a depth of 5 cm—avoiding roots, the litter layer and vegetation damage—at least one month before the beginning of the GHG flux sampling. The monitored GHG fluxes represent the net soil CH4 and N2O fluxes, as well as total soil respiration (CO2 fluxes), including both soil heterotrophic respiration and autotrophic respiration of above- and belowground biomass surrounded by the chamber collars and enclosed in the chambers. The dimensions of the chambers allowed for full encapsulation of the present vegetation. In rewetted former peat extraction areas with bare peat, the estimated soil CO2 fluxes can be interpreted as soil heterotrophic respiration due to the absence of vegetation and, simultaneously, net ecosystem exchange (NEE). Study sites were visited once every four weeks to collect flux samples from chambers in each of the collar positions.

2.3. GHG Flux Sampling Design in Permanently Flooded Former Peat Extraction Areas

At each study site of the permanently flooded former peat extraction areas (Table 1), three representative subplots were selected. GHG flux sampling was conducted using opaque chambers positioned on mobile floating collars accessed by footbridges [31]. At each subplot, shortly before GHG flux sampling five chamber collars were evenly distributed around the footbridge at least 3 m from the edge of the flooded area. GHG flux sampling was conducted once every three weeks during the vegetative season (March to October) and once per month from November to February. In permanently flooded former peat extraction areas, the monitored GHG fluxes represented the net water-surface-to-atmosphere CO2, CH4 and N2O fluxes.

2.4. GHG Flux Sampling and Analysis

GHG flux sampling was conducted according to the randomized time schedule of research-site survey to reduce potential impact of sampling time on GHG emissions [30,32]. Regardless of permanent soil collars or mobile floating collars, four successive replicates of GHG fluxes were sampled within 30 min of chamber connection with the soil collar (i.e., samples were taken every 10 min). GHG fluxes from the chambers were sampled using glass vials (50 mL, underpressure of 0.3 mbar). Samples of GHG fluxes were transported to the laboratory and GHG concentrations were determined with a gas chromatograph equipped with an automatic sampling device, an electron capture detector (ESD) and a flame ionisation detector (FID) [33].
Soil- or water-surface-to-atmosphere fluxes were calculated (Equation (1)) based on the Ideal Gas Law equation and the slope coefficient of linear regression describing gas concentration change in the chambers during 30 min (results of gas chromatography analysis of four successive GHG flux samples). As a measure for ensuring the quality control of the results, estimation of data point compliance with the tendency of GHG concentration changes over time in the chamber was performed.
G H G f l u x = M × P × V × s l o p e R × T × A
where GHG flux is the instantaneous GHG (CO2, CH4 or N2O) flux, µg GHG m2 h−1; M is the molar mass of GHG, g mol−1; R is the universal gas constant, 8.314 m3 Pa K−1 mol−1; P is the assumption of air pressure inside the chamber, 101,300 Pa; T is the air temperature, K; V is the chamber volume, 0.063 m3; slope is the GHG concentration changes over time, ppm h−1; and A is the collar area, 0.1995 m2.

2.5. Measurements of Environmental Parameters

To identify and quantify GHG-flux-affecting factors, several environmental parameters were determined during study site surveys. In rewetted former peat extraction areas and undisturbed peatland, PVC pipes were installed among chamber collars down to a depth of 140 cm in the soil for GW level (the depth of the groundwater table below the ground) monitoring (manual measurements were performed during each study site survey). Soil temperature was recorded at depths of 5 cm, 10 cm, 15 cm and 30 cm using the soil temperature sensor and a data logger; air (ambient) temperature was measured using an electronic thermometer with 0.1 °C thermal resolution (results in Appendix A, Figure A1). In 2016, soil samples were taken at each research site using a stainless-steel soil sample probe at the following depths: 0–10 cm, 10–20 cm, 20–30 cm and 30–40 cm. Soil samples were prepared for analyses according to the LVS ISO 11464:2005 and the following parameters of were determined: pH (CaCl2) according to LVS EN ISO 10390:2022; organic C (OC, in g kg−1) and total N (TN, in g kg−1) content was determined with the elementary analysis method (LVS ISO 10694:2006 and LVS ISO 13878:1998, respectively); and the HNO3-extractable phosphorus (P), potassium (K), calcium (Ca) and magnesium (Mg) contents (in g kg−1) were determined with the inductively coupled plasma-optical emission spectrometry (ICP-OES) method. In addition, the soil OC/TN (C/N) ratio were calculated as proxy to describe the decomposition status of soil organic matter (results in Appendix A, Table A1).
During GHG flux sampling from chambers on floating collars in flooded former peat extraction areas, the water level—the depth of the flooded water layer to the soil surface—as well as both air and water temperature were measured (results in Appendix A, Figure A1). In addition, flooded water samples were taken. The following parameters were determined: water pH and electrical conductivity according to LVS ISO 10523:2012 and LVS EN 27888:1993, respectively; potassium (K) concentrations in water were determined using the flame atomic absorption spectroscopy according to LVS ISO 9964-3:2000; total nitrogen (TN) and dissolved organic carbon (DOC) concentrations were determined according to LVS EN 12260:2004 and LVS EN 1484:2000.

2.6. Statistical Analysis

All statistical analyses were conducted using R [34]. To check the data for normal distribution and homogeneity of variance a Shapiro–Wilk normality test and Quantile-Comparison Plot (function ‘qqPlot()’ from R package ‘car’) was used. Possible differences in the mean values of GHG fluxes grouped by land-use types and seasons were evaluated using pairwise comparisons using t-tests with pooled standard deviations (SD). To relate mean GHG fluxes to different environmental factors (GW level in rewetted areas and undisturbed peatland, water level in flooded areas, temperature), Pearson correlation (r) analysis and simple regression analysis were carried out. A significance level of p < 0.05 was used.
In the box plots (Figure 2, Figure 3 and Figure 4 and Figure A1), bold lines represent the medians, black asterisks represent the mean values, the boxes correspond to the lower and upper quartiles, the whiskers show the minimal and maximal values (within 150% of the interquartile range from the median), and the black dots show outliers of the datasets.

3. Results

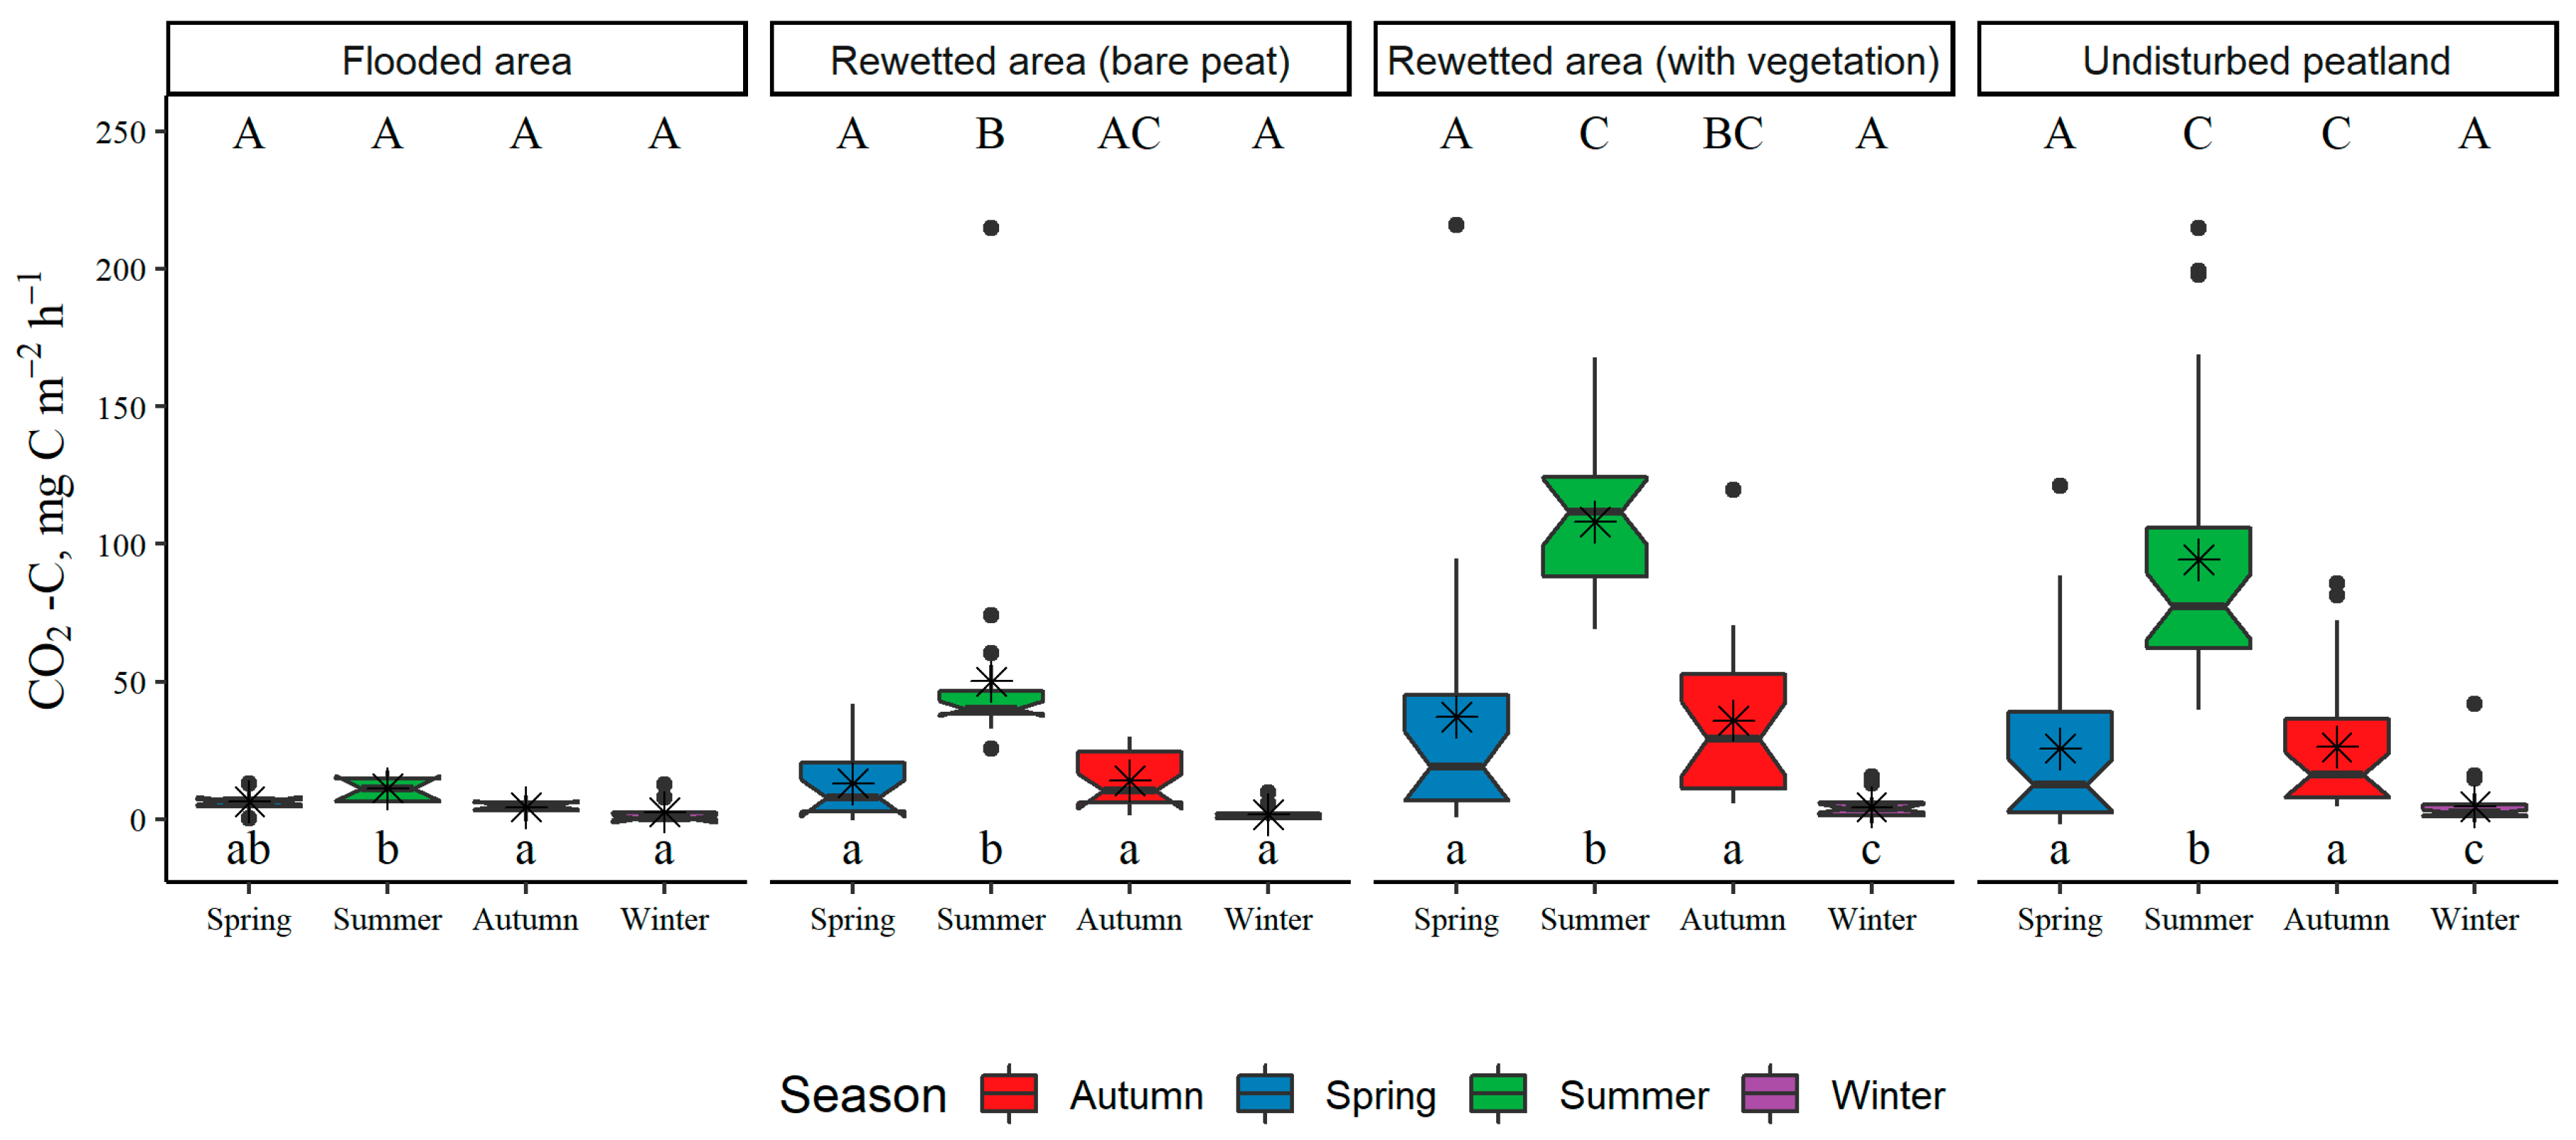
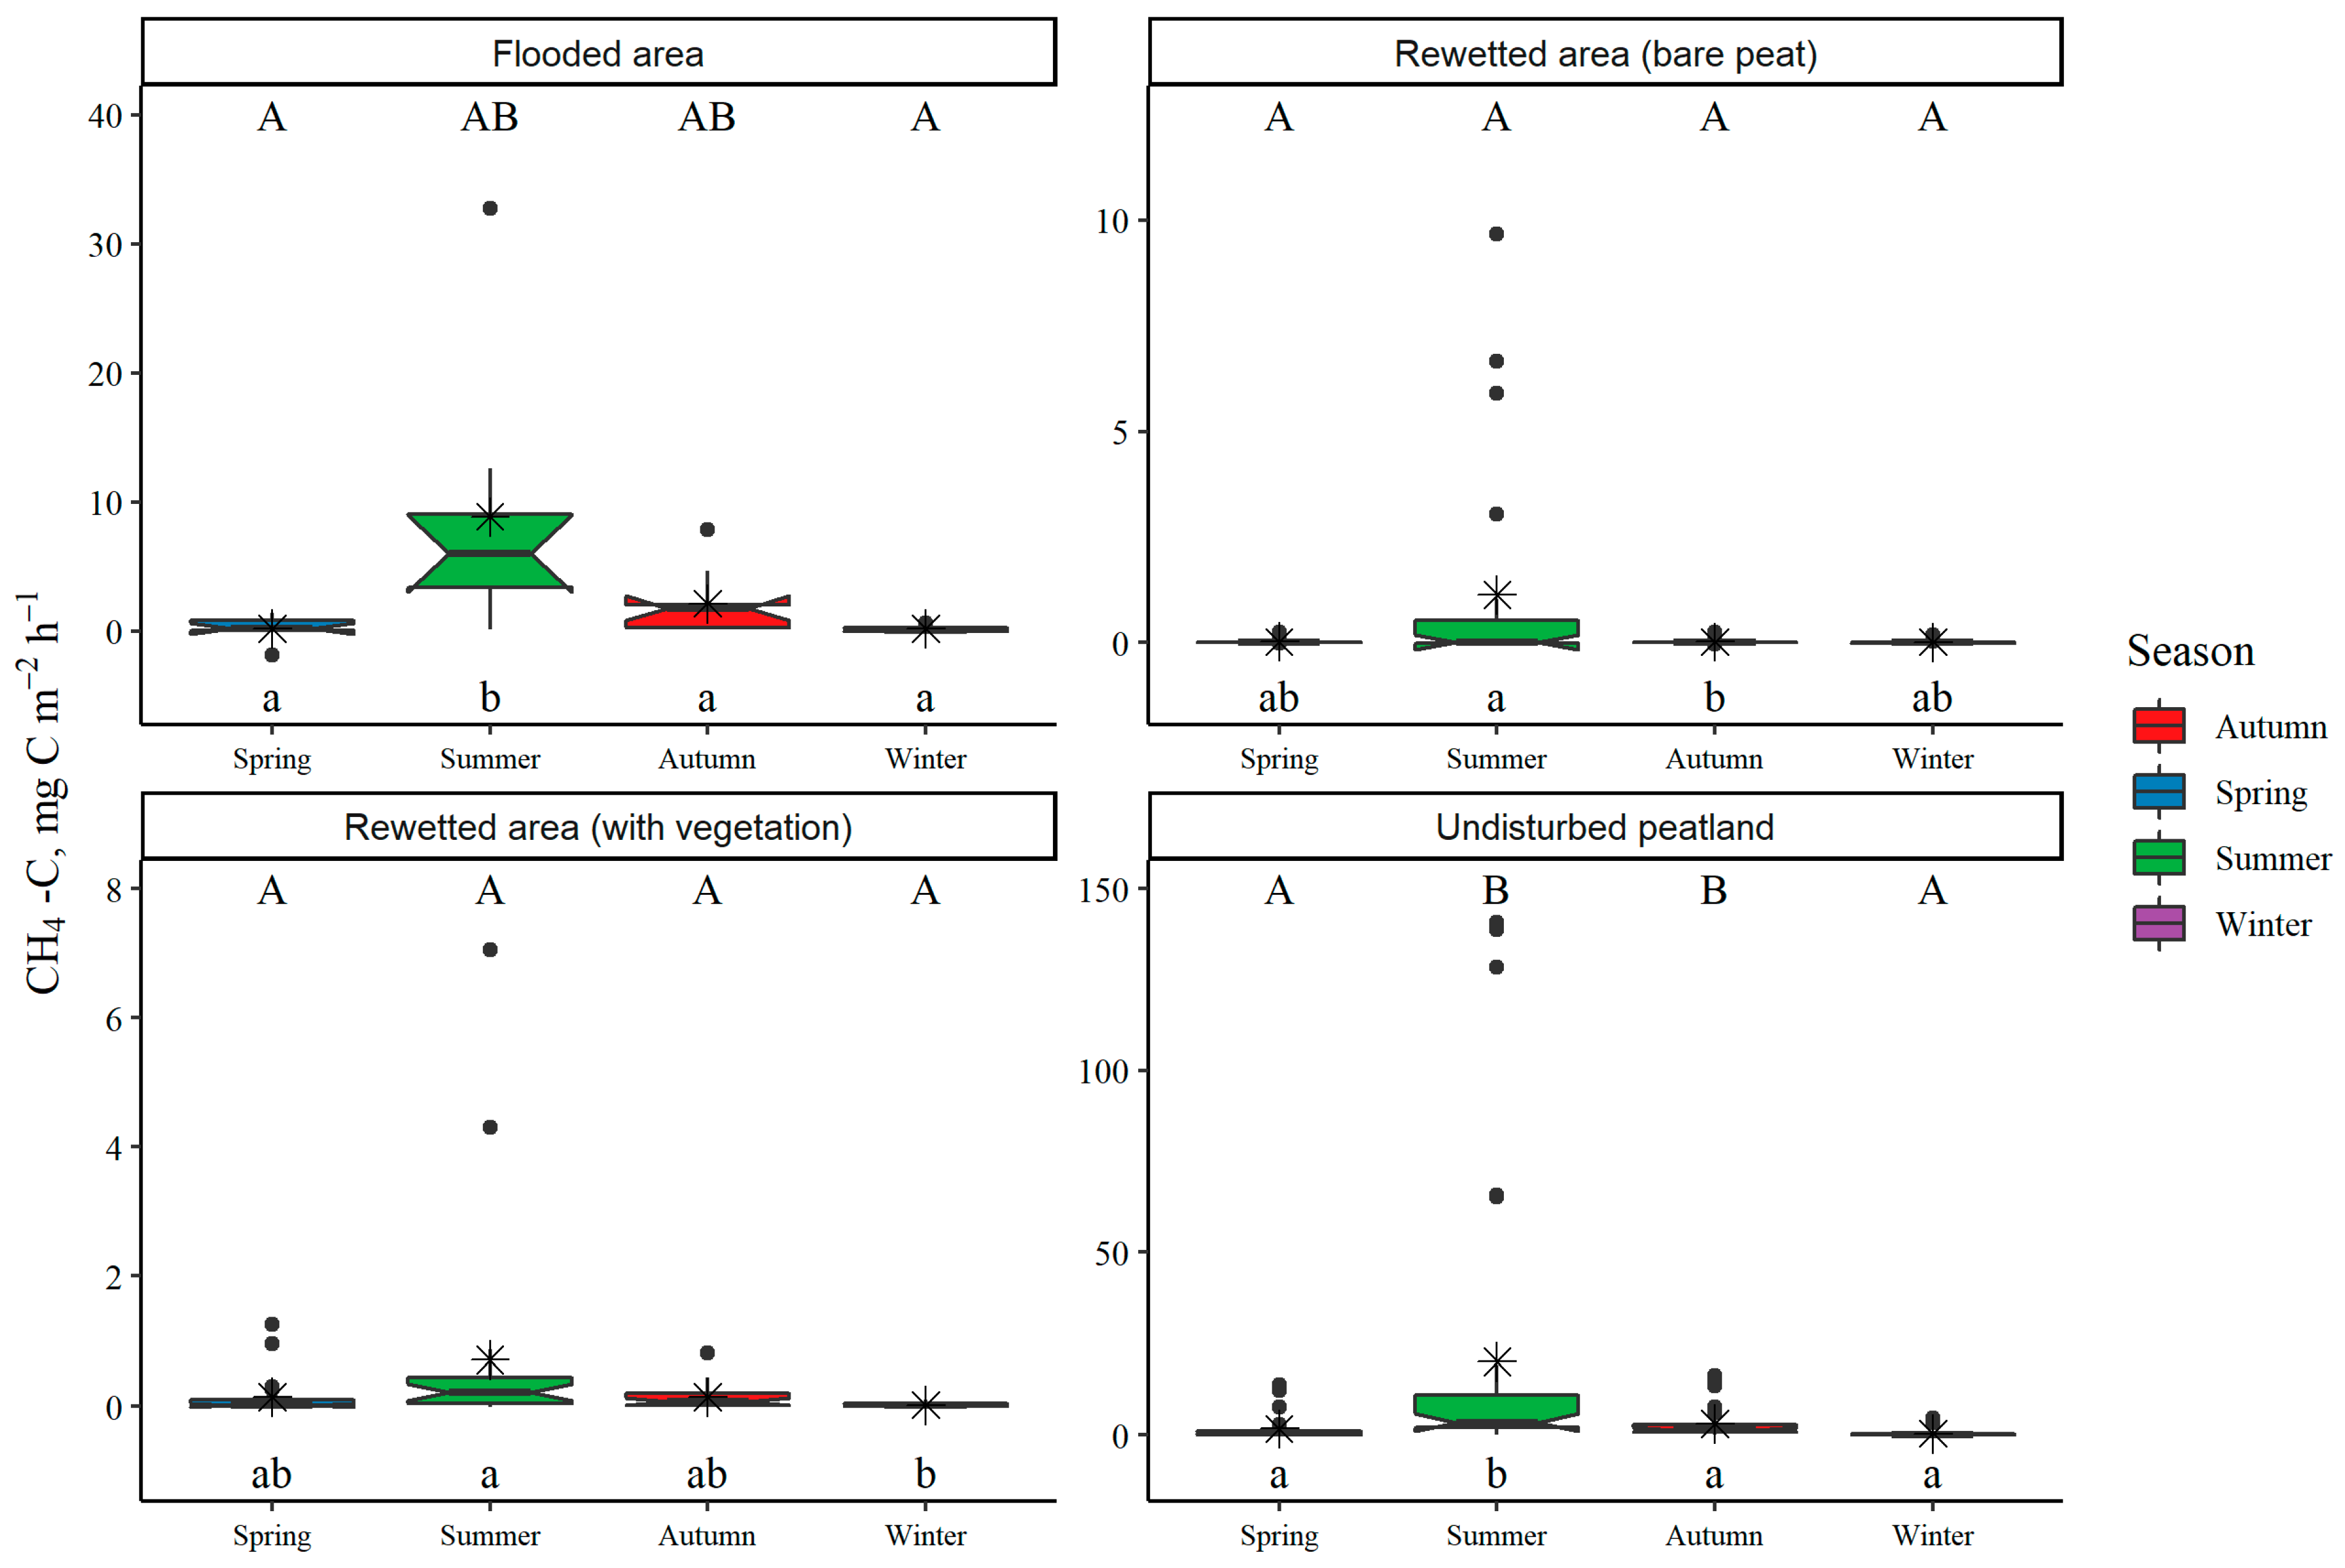
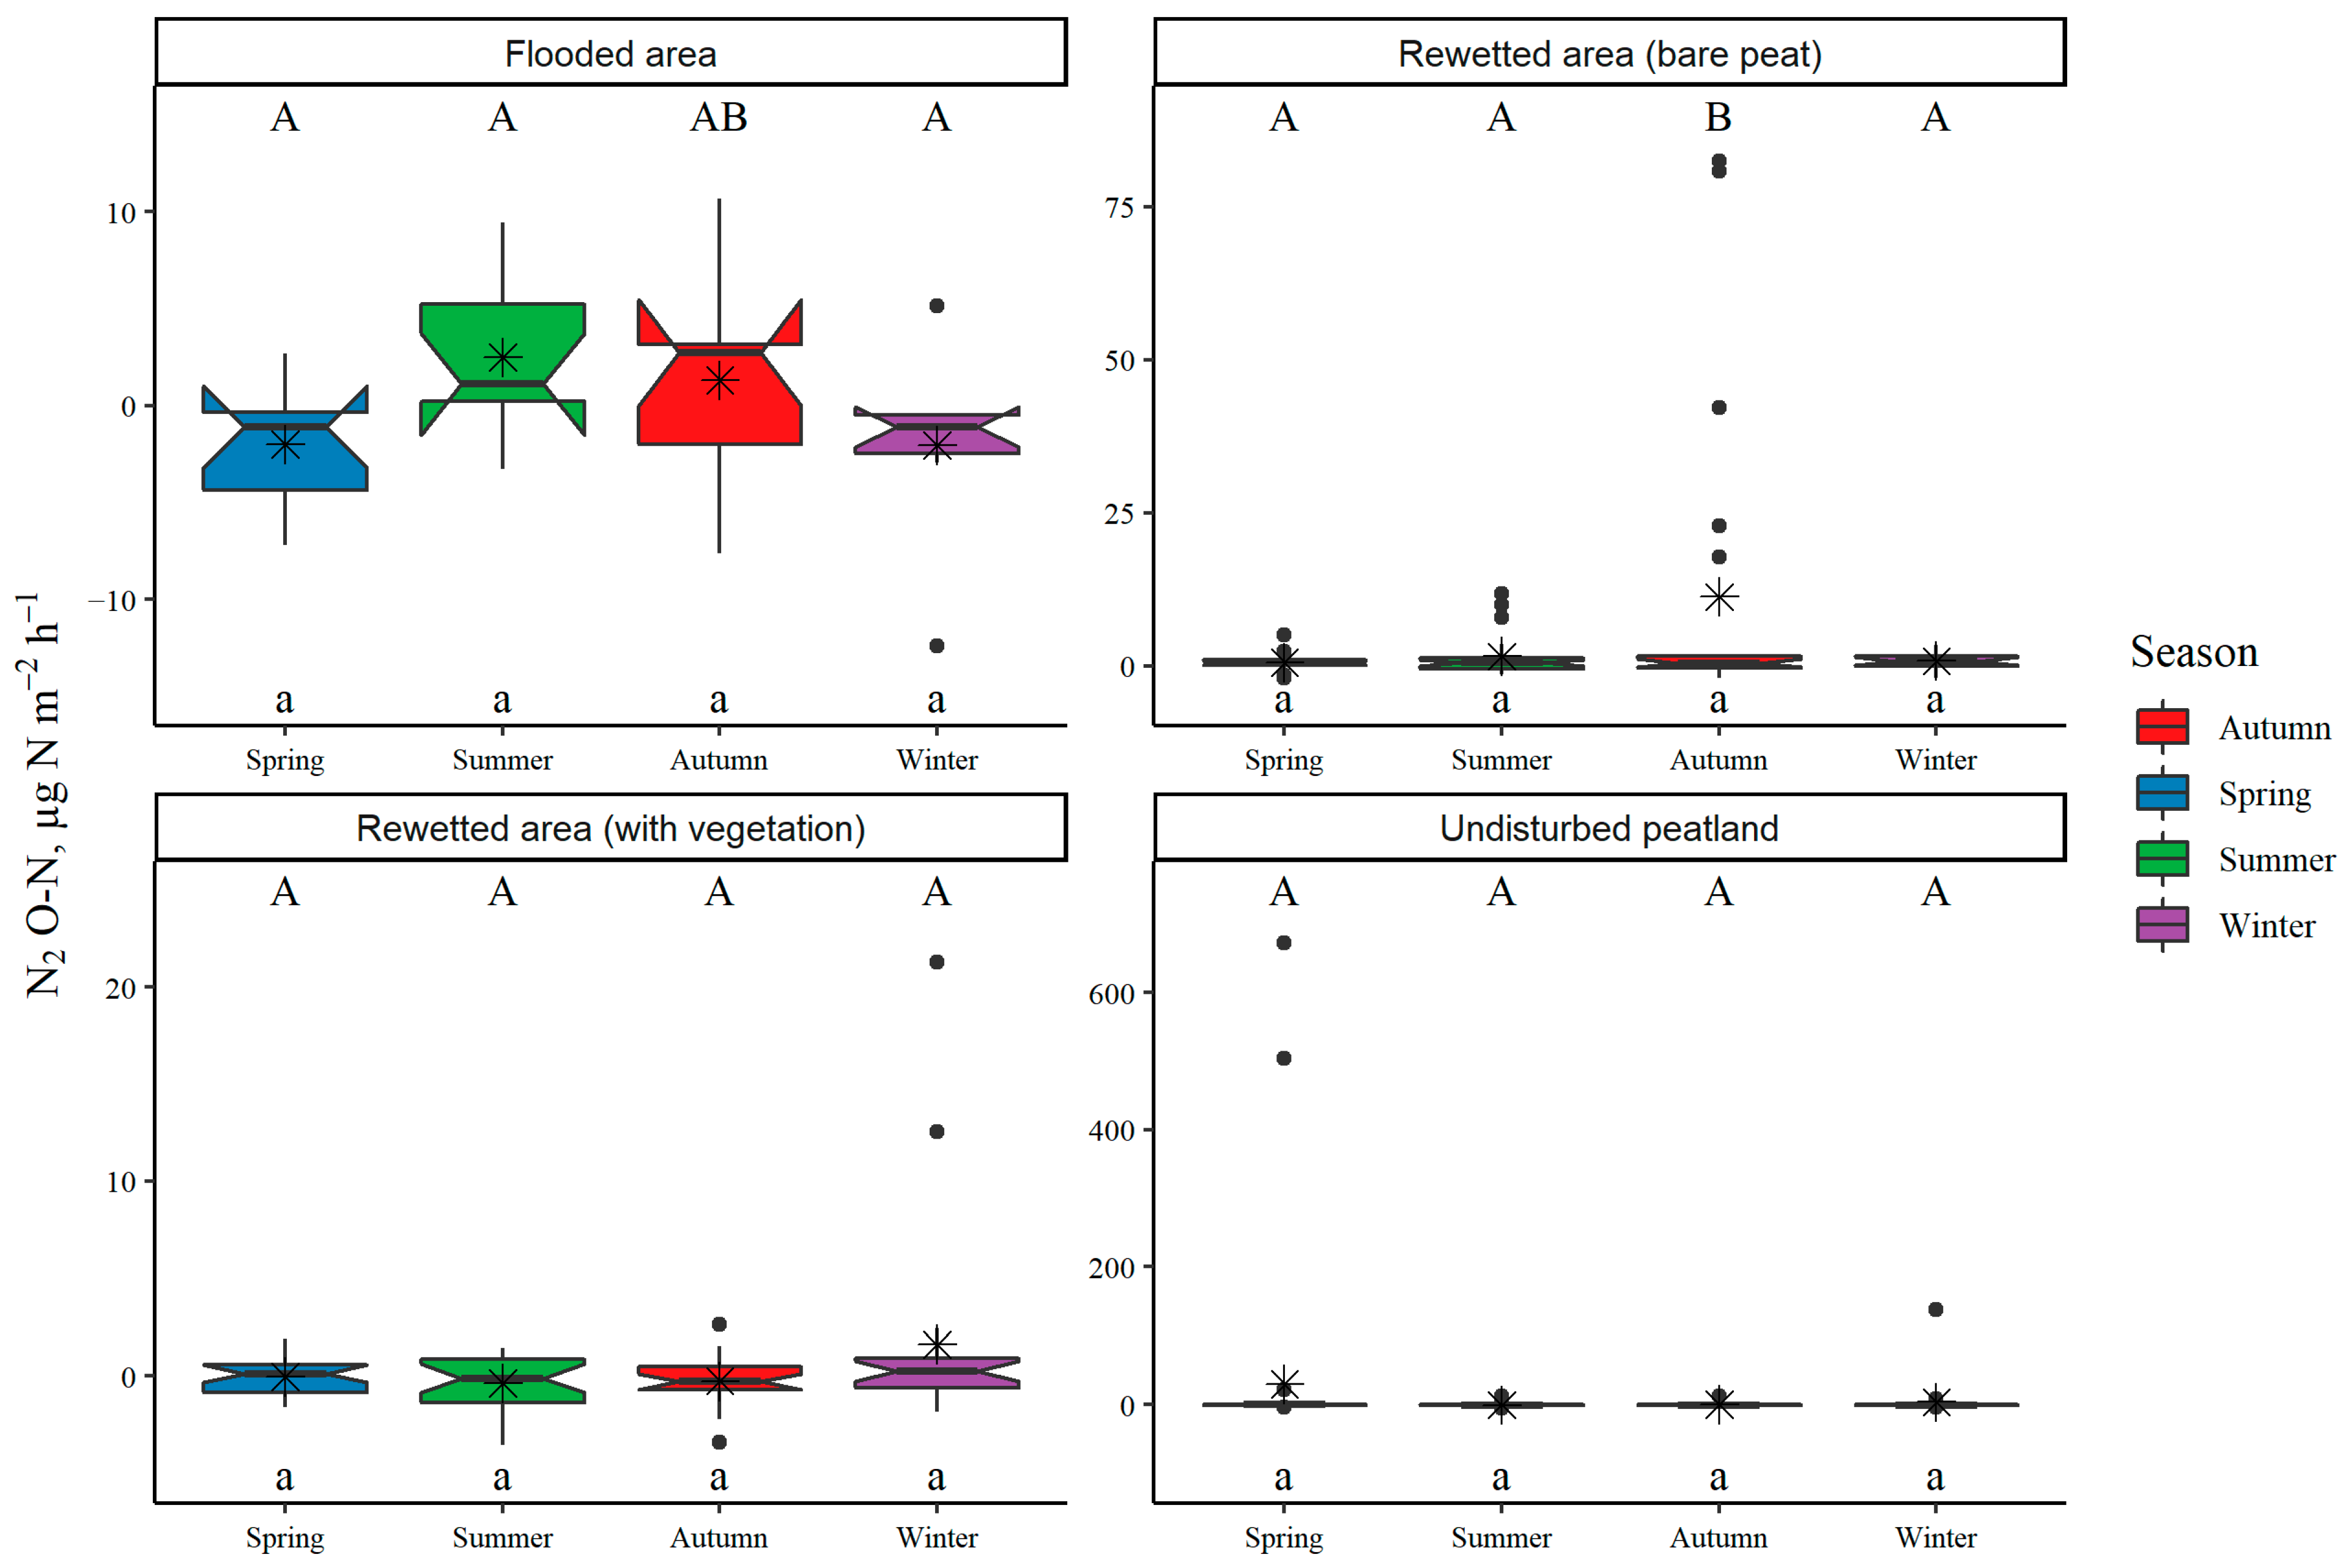
3.1. Land-Use Type and Seasonal Variation in GHG Fluxes from Soil or Water Surface

In all land-use types, the highest CO2 surface-to-atmosphere fluxes (sum of soil heterotrophic and autotrophic respiration) were observed in summer, and the lowest in winter; furthermore, the differences between seasons were statistically significant (Figure 2). Among the studied land-use types, the highest CO2 surface-to-atmosphere fluxes were recorded in rewetted former peat extraction areas with vegetation and in undisturbed peatland, where mean CO2 fluxes were 108.1 ± 5.2 and 94.4 ± 9.3 mg CO2–C m−2 h−1, respectively, during the summer season. The lowest CO2 fluxes were observed in flooded former peat extraction areas, where mean CO2 fluxes reached 11.3 ± 1.6 mg CO2–C m−2 h−1 during the summer season. During the winter, CO2 fluxes were relatively low in all land-use types, ranging from 1.8 ± 0.6 mg CO2–C m−2 h−1 in rewetted areas with bare peat to 4.6 ± 1.3 mg CO2–C m−2 h−1 in undisturbed peatland; no significant differences between the studied land-use types were found in the spring and winter months.
As with the CO2 surface-to-atmosphere fluxes, the highest CH4 fluxes were observed in summer, and the lowest in winter; the differences between seasons were statistically significant (Figure 3). Among the studied land-use types, the highest CH4 surface-to-atmosphere fluxes were recorded in undisturbed peatland in all seasons, reaching the highest mean CH4 fluxes of 20.0 ± 6.8 mg CH4–C m−2 h−1 in summer. The lowest CH4 fluxes were observed in rewetted former peat extraction areas, where the mean CH4 fluxes during the summer season reached 0.7 ± 0.3 mg CH4–C m−2 h−1 in rewetted areas with vegetation and 1.1 ± 0.5 mg CH4–C m−2 h−1 in rewetted areas with bare peat. During the winter, CH4 fluxes were relatively low in all land-use types, ranging from 0.02 ± 0.01 mg CH4–C m−2 h−1 in rewetted areas with bare peat to 0.43 ± 0.16 mg CH4–C m−2 h−1 in undisturbed peatland; no significant differences between the studied land-use types were found in the spring and winter months.
Among the different land-use types and seasons studied, mean N2O surface-to-atmosphere fluxes ranged from −2.0 ± 1.5 µg N2O–N m−2 h−1 in flooded former peat extraction areas in spring and winter to 29.8 ± 20.8 µg N2O–N m−2 h−1 in undisturbed peatland in spring (Figure 4). No statistically significant differences in mean N2O fluxes between different seasons within the same land-use type were observed. Among the studied land-use types, only in autumn months were statistically higher N2O fluxes observed in rewetted former peat extraction areas with bare peat compared to rewetted areas with vegetation and undisturbed peatland. When data from all seasons are pooled, the highest mean N2O fluxes were recorded in undisturbed peatland (9.3 ± 6.0 µg N2O–N m−2 h−1) followed by rewetted former peat extraction areas with bare peat (3.9 ± 1.6 µg N2O–N m−2 h−1).

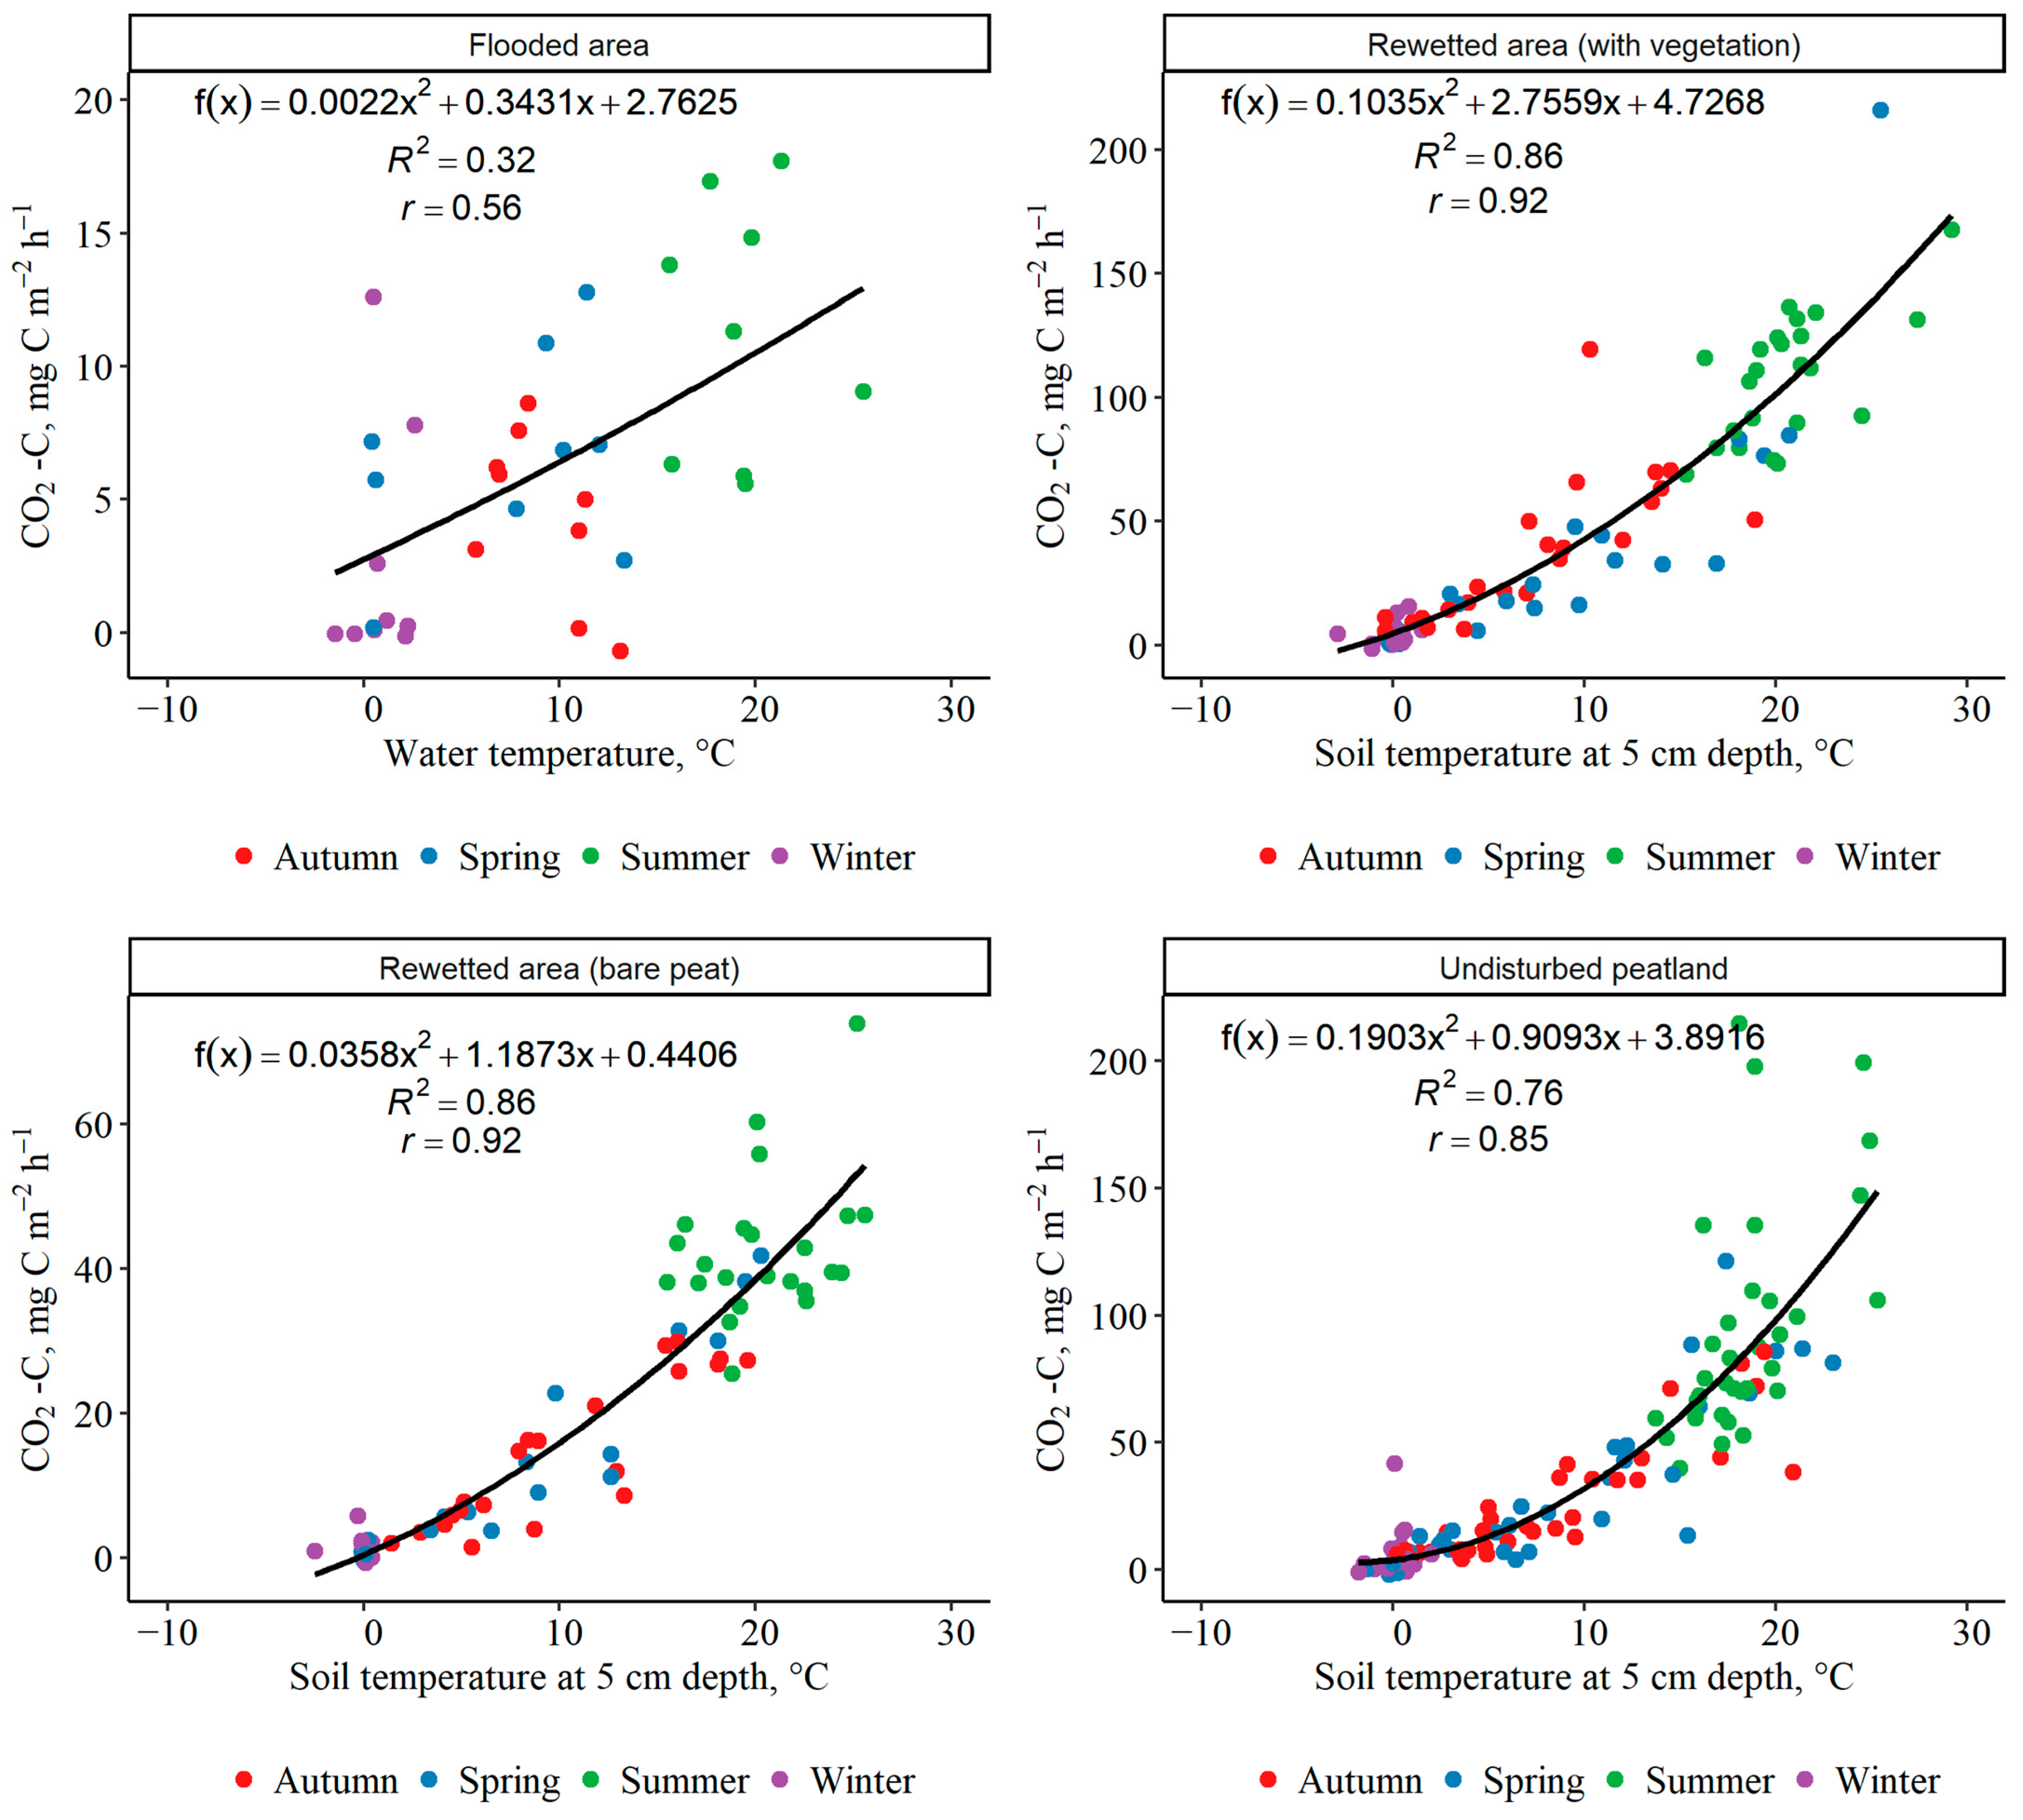
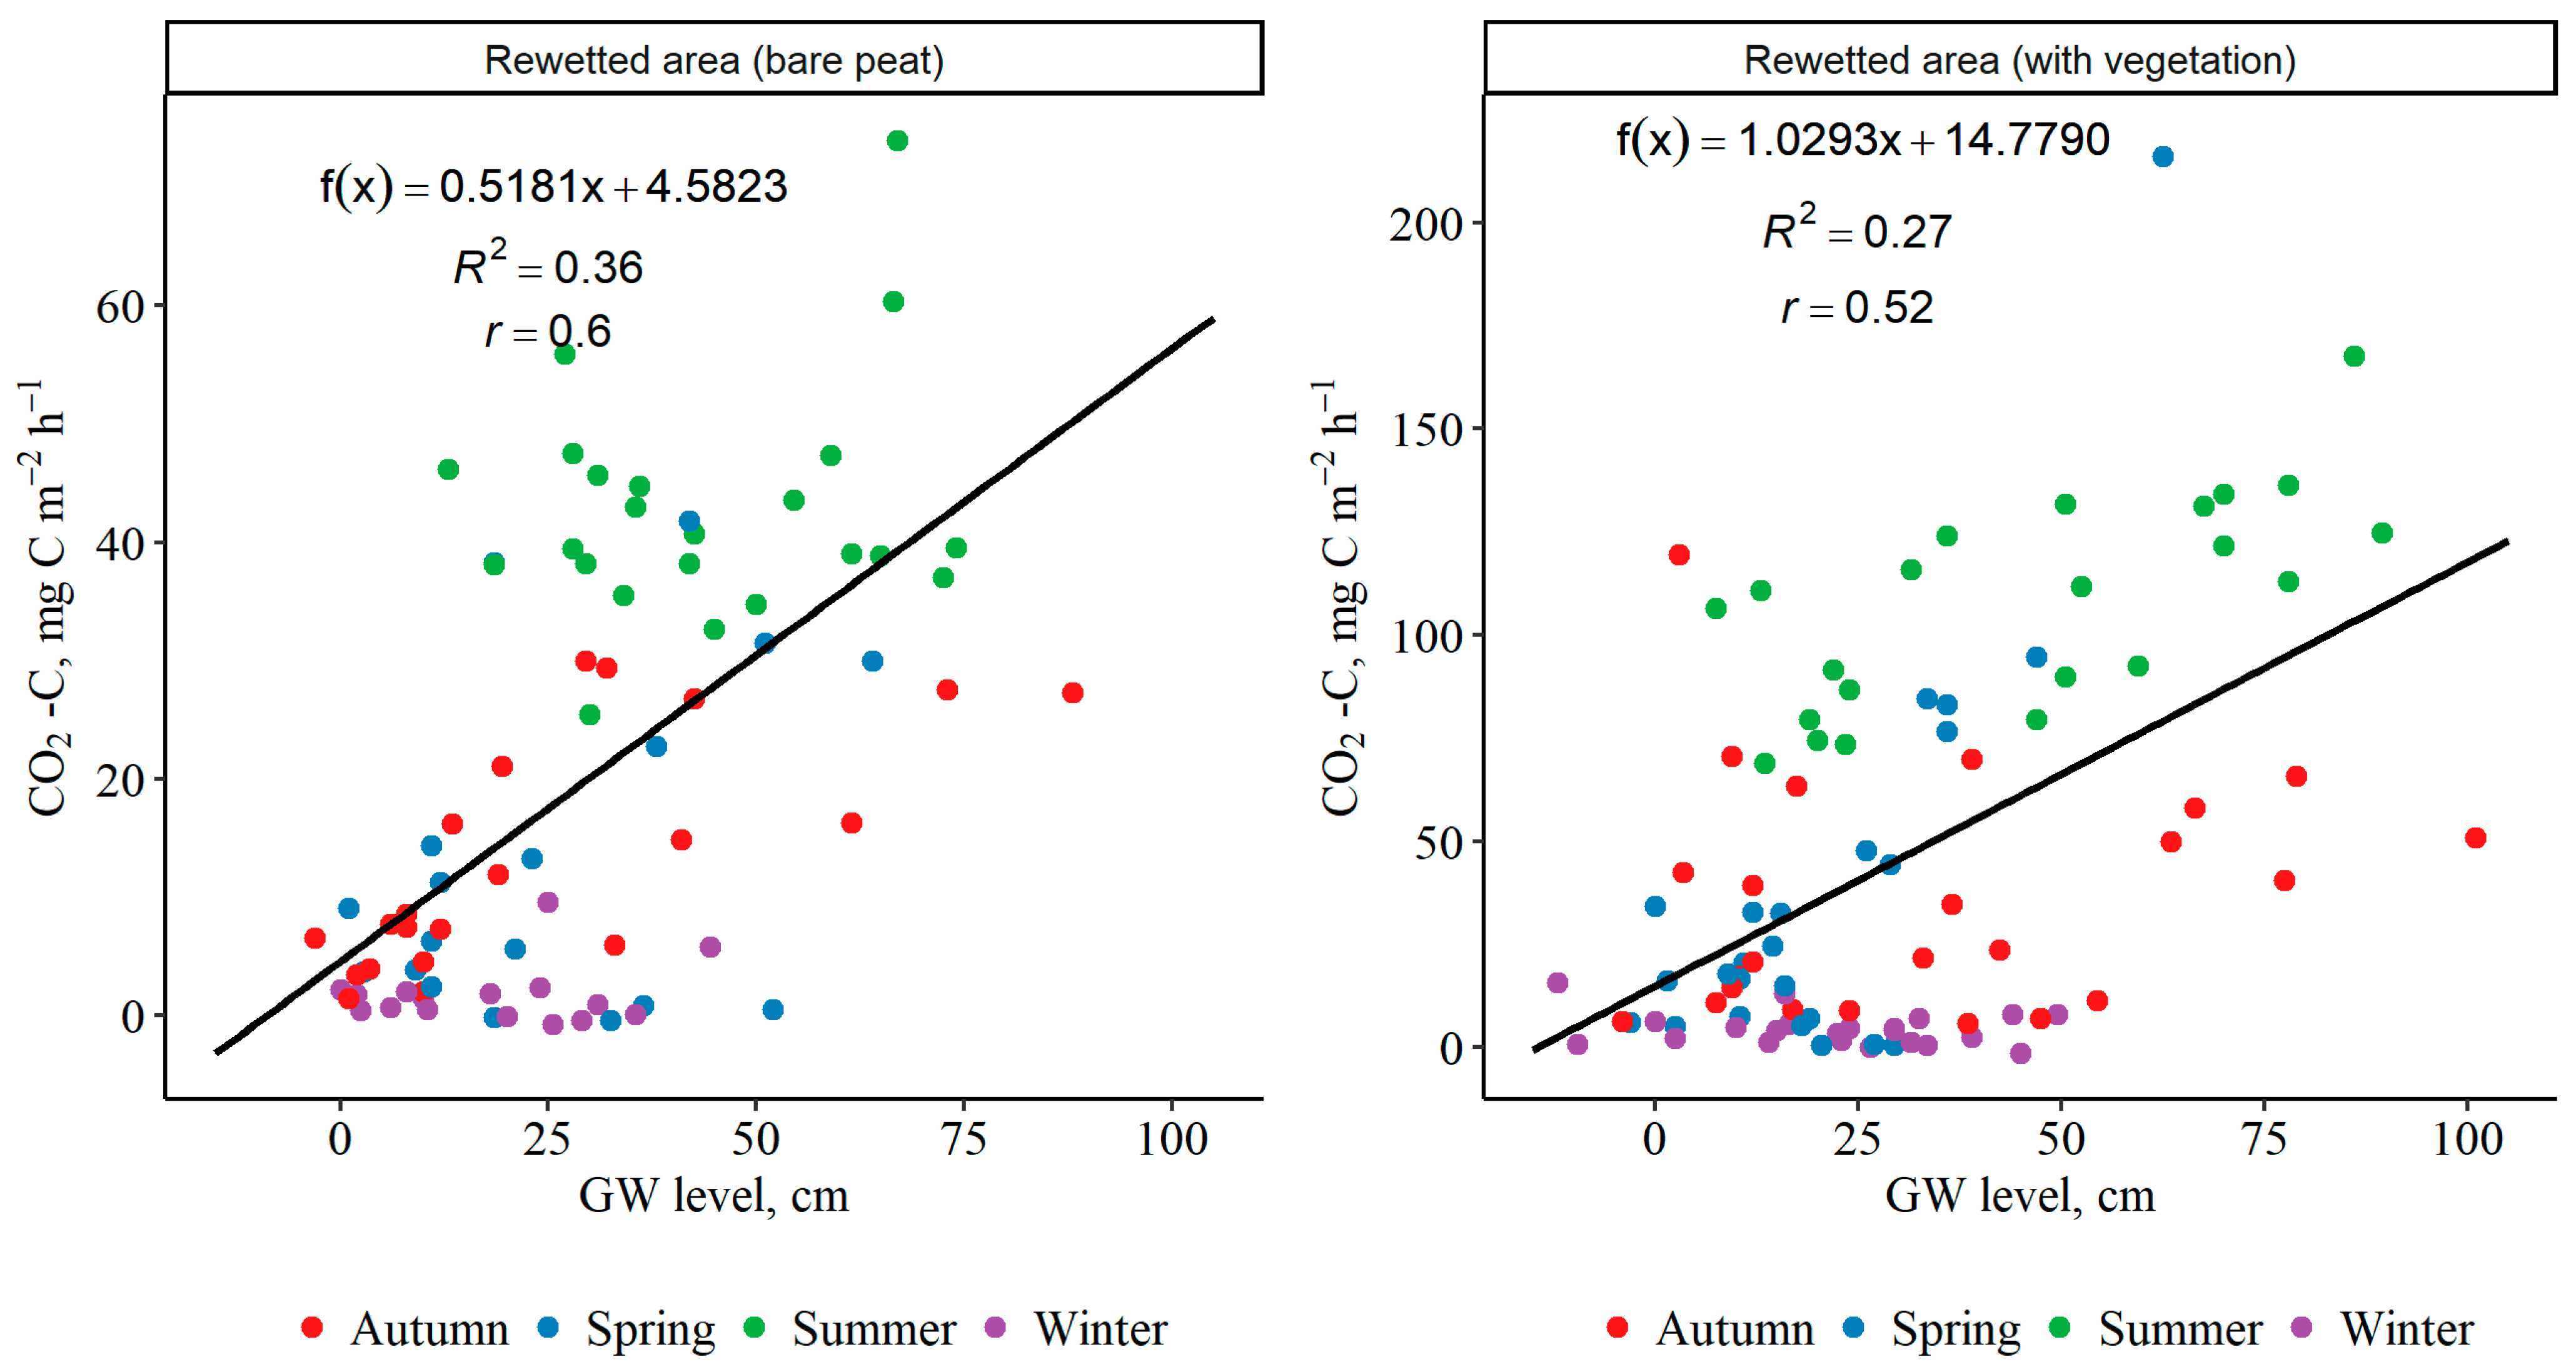
3.2. Impact of Environmental Parameters on Magnitude of GHG Fluxes from Soil or Water Surfaces

In all land-use types, surface-to-atmosphere CO2 fluxes positively correlated with both air and soil or water temperature (Table 2). Although less pronounced than for CO2 fluxes, the impact of temperature on CH4 fluxes was also statistically significant, while temperature was not found to be a significant influencing factor of N2O surface-to-atmosphere fluxes (Table 2). Simple non-linear (polynomial) regressions describing relationships between surface-to-atmosphere CO2 fluxes and water temperature in flooded former peat extraction areas or soil temperature at a depth of 5 cm in rewetted former peat extraction areas and undisturbed peatland are shown in Figure 5. GW level was also found to be a significant CO2-flux-influencing factor in rewetted former peat extraction areas (Figure 6), while there were no correlations between GW level and CH4 or N2O fluxes in rewetted areas or undisturbed peatland. In addition, the water level in flooded areas during frost-free periods was not found to be a significant surface-to-atmosphere GHG-flux-influencing factor.
Analysis of relationships (linear regressions) between average water surface-to-atmosphere GHG fluxes and average water general chemistry (water pH, conductivity, concentrations of K, Ca, Mg, TN, DOC) in flooded former peat extraction areas highlighted several trends and even some significant correlations (p < 0.05; Figure A2, Appendix A). For instance, a positive correlation between average CH4 fluxes and water pH, and a negative correlation between average CO2 fluxes and K concentration in water were found. However, these trends should be evaluated with caution, and their generalisation is not scientifically justified due to the limited number of research sites representing flooded conditions (n = 3, Table 1).
Analysis of relationships between average soil surface-to-atmosphere GHG fluxes and average soil general chemistry (soil pH, content of OC, TN, P, K, Ca and Mg, soil C/N ratio; see Table A1, Appendix A) in rewetted former peat extraction areas and undisturbed peatland highlighted significant correlations (linear regressions) between CO2 fluxes and soil pH (adj. R2 = 0.363, p = 0.039), K content (adj. R2 = 0.324, p = 0.050), Ca content (adj. R2 = 0.349, p = 0.042) and Mg content (adj. R2 = 0.509, p = 0.012) in soil at a depth of 0–20 cm. Furthermore, at 20–40 cm soil depth, a significant correlation (linear regression) between CO2 fluxes and soil pH was found (adj. R2 = 0.445, p = 0.021). Other correlations between soil surface-to-atmosphere GHG fluxes and parameters of soil general chemistry were not found.

3.3. Annual GHG Fluxes from Soil or Water Surfaces

The estimated annual GHG fluxes from soil or water surfaces in the studied land-use types are shown in Table 3. Annual GHG fluxes were calculated as the sum of monthly average fluxes (expressed as t CO2–C ha−1 month−1, kg CH4–C or N2O–N ha−1 month−1), thus maintaining the contribution of all seasons in the calculation of the average values of annual GHG fluxes from the soil or water surface. Among the studied land-use types, the highest annual CO2 fluxes (4.10 ± 0.21 t CO2–C ha−1 yr−1) were estimated in rewetted former peat extraction areas with vegetation, but it should be noted that CO2 fluxes in rewetted areas with vegetation represent the sum of soil heterotrophic and autotrophic respiration. The highest annual CH4 fluxes (562.4 ± 155.8 kg CH4–C ha−1 yr−1) were estimated in undisturbed peatland, followed by flooded areas (251.1 ± 77.2 kg CH4–C ha−1 yr−1). In addition, the highest annual N2O fluxes (0.66 ± 0.41 kg N2O–N ha−1 yr−1) were estimated in undisturbed peatland.

4. Discussion

4.1. CO2 Fluxes

Among the different land-use types and seasons studied, the highest mean surface-to-atmosphere CO2 fluxes (sum of soil heterotrophic and autotrophic respiration) were recorded in rewetted former peat extraction areas with vegetation and in undisturbed peatland, where mean instantaneous CO2 fluxes during the summer season were 108.1 ± 5.2 and 94.4 ± 9.3 mg CO2–C m−2 h−1, respectively. The lowest CO2 fluxes were observed in rewetted areas with bare peat during the winter (1.8 ± 0.6 mg CO2–C m−2 h−1). Higher CO2 fluxes in rewetted former peat extraction areas with vegetation and undisturbed peatland (also covered with vegetation) compared to rewetted areas with bare peat are most likely related to the higher contribution of autotrophic respiration of the above- and belowground plant parts and rhizosphere respiration in areas covered by vegetation (see [35,36]). In addition, in rewetted areas and undisturbed peatland, GW levels dropped as much as 1 m during summer and autumn; soil aeration—and, consequently, oxidation processes of soil organic matter—was thus intensified, resulting in elevated CO2 fluxes. In flooded conditions, mean surface-to-atmosphere CO2 fluxes were significantly lower than under rewetted conditions or in the natural (undisturbed) counterparts due to the anaerobic conditions in the flooded soils [21]. The more limited organic matter decomposition as well as water column above the soil surface thus acted as diffusion barriers reducing CO2 transport [21,37]. Annualised cumulative CO2 fluxes under flooded conditions (0.55 ± 0.05 t CO2–C ha−1 yr−1) were similar, for instance, compared to those reported for cultivated peatland under continuously flooded conditions in south Florida (0.32 t CO2–C ha−1 yr−1 [37]).
In general, our results support previous conclusions that temperature and water level are key factors controlling organic matter decomposition and surface-to-atmosphere CO2 fluxes in areas with organic (peat) soils [21,25,37]. The magnitude of surface-to-atmosphere CO2 fluxes in rewetted areas with vegetation and in natural (undisturbed) counterparts in our study was similar, but the dependence of fluctuations in magnitude of CO2 on GW level changes was more pronounced in rewetted areas than in undisturbed peatland. In general, natural peatland is more stable—being capable of buffering hydrological extremes by surface oscillation—than rewetted peatland, which is characterised as being highly responsive to weather extremes [8,38]. This is in line with our results, which showed significantly greater variation (dropping) in GW level in rewetted former peat extraction areas than in undisturbed peatland (Figure A1). Moreover, previous studies in rewetted areas have shown that water table fluctuations are better self-regulated in vegetated areas than in bare peat sites [18]. We did not find significant differences in GW level fluctuations between rewetted areas with bare peat and with vegetation cover.
Our annualised cumulative CO2 fluxes from rewetted areas with bare peat are methodologically comparable with the IPCC default CO2 emission factors (EFs), and are significantly higher than those provided by IPCC for rewetted areas in boreal and temperate climate zones (which range from −0.55 to +0.50 t CO2–C ha−1 yr−1 [9]), as well as those reported by Wilson et al. (2016) [20] and recently by Tiemeyer et al. (2020) for Germany [39]. This could be explained by the fact that the GW level in our rewetted sites dropped to 1 m during summer and autumn (which is common in the region), when the highest CO2 fluxes were observed. Wilson et al. (2016) only deemed sites with an annual or seasonal GW level of −0.3 m or shallower suitable as proxies for rewetted areas [20], and Tiemeyer et al. (2020) averaged the mean annual CO2 fluxes of all sites within a GW level range of −0.1 to 0.2 m [39]. Nevertheless, the results emphasise that rewetted areas with bare peat where the typical (peat-forming) cover of vegetation has not fully re-established cannot be considered to be C-neutral or as CO2 sinks.
Considering the view that rewetting of drained organic soils may lower net GHG emissions and could return drained peatland to a C-sink ecosystem [14,20], we compared the CO2 fluxes under the rewetted conditions recorded within this study to previously reported CO2 fluxes under drained conditions. The mean instantaneous surface-to-atmosphere CO2 fluxes (sum of soil heterotrophic and autotrophic respiration) recorded within this study in rewetted conditions during the summer season (50.0 ± 7.4 and 108.1 ± 5.2 mg CO2–C m−2 h−1 in areas with bare peat and with vegetation, respectively) were slightly higher compared to those previously reported in Latvia for disturbed (peat-extracted) peatland under drained conditions with bare peat and with vegetation cover (33.0 ± 19.7 and 85.3 ± 10.3 mg CO2–C m−2 h−1, respectively) [40]. Thus, rewetted former peat extraction fields may have better soil C stock-preservation capacity than drained areas only if the C input into the soil through plant biomass compensates surface-to-atmosphere CO2 emissions in rewetted areas. In addition, when we evaluate the impact of rewetting on climate as a whole, the annual increase in plant biomass must additionally compensate the higher global warming effect of elevated CH4 emissions, if compared to drained areas. Annualised cumulative CO2 fluxes from rewetted areas with bare peat included in our study—which represent soil heterotrophic respiration due to the absence of vegetation and thus plant-derived CO2—were 1.73 ± 0.17 t CO2–C ha−1 yr−1, while soil heterotrophic respiration in rewetted areas with vegetation was estimated to be 1.76 t CO2–C ha−1 yr−1, considering that the contribution of soil heterotrophic respiration to the total respiration is 43% according to Berglund et al. (2011) [41]. These values slightly exceeded the annual CO2 fluxes (soil heterotrophic respiration) previously estimated in Latvia from drained former peat extraction fields (1.46 ± 0.05 t CO2–C ha−1 yr−1) and abandoned peat extraction fields with herb and dwarf shrub vegetation (1.62 ± 0.06 t CO2–C ha−1 yr−1) [25]. This indicates that rewetting of former peat extraction fields may not ensure lower soil C losses compared to drained peat fields and, thus, that rewetting may not be an effective measure for climate change mitigation in hemiboreal regions where GW fluctuations commonly occur even after restoration of elevated GW levels. For a more accurate assessment, future studies should include not only a distinction between heterotrophic and autotrophic soil respiration and quantification of C input into soil through plant biomass, but also C losses due to wind erosion and a wider range of potentially affecting factors (predictors) of GHG fluxes (for instance, physico-chemical parameters). However, our cumulative CO2 fluxes from rewetted areas with bare peat (1.73 ± 0.17 t CO2–C ha−1 yr−1)—which represent net ecosystem exchange in CO2—were lower than those provided by IPCC guidelines [9] for peatland managed for extraction in temperate and boreal regions (2.8 t CO2–C ha−1 yr−1 with a 95% confidence interval from 1.1 to 4.2 t CO2–C ha−1 yr−1).

4.2. CH4 Fluxes

The annualised cumulative CH4 fluxes in our study ranged from 22.6 ± 7.6 and 26.4 ± 12.0 kg CH4–C ha−1 yr−1 in rewetted former peat extraction areas with vegetation and bare peat, respectively, to 562.4 ± 155.8 kg CH4–C ha−1 yr−1 in pristine (undisturbed) peatland. Thus, the CH4 emissions in rewetted former peat extraction areas (22.6 ± 7.6 and 26.4 ± 12.0 kg CH4–C ha−1 yr−1 in areas with vegetation and bare peat, respectively) were approximately ten and twenty orders of magnitude lower than those observed in flooded former peat extraction areas (251.1 ± 77.2 kg CH4–C ha−1 yr−1) and undisturbed peatland (562.4 ± 155.8 kg CH4–C ha−1 yr−1), respectively. Re-established vegetation cover can enhance CH4 emissions (compared to bare peat) through the supply of substrate (labile C via root exudates) for methanogenesis and the CH4 pathway (transport to the atmosphere through aerenchyma, avoiding oxidation by methanotrophic microbes in the aerobic soil layer) [12,42,43,44]. For instance, sedge-mediated CH4 transport to the atmosphere due to the presence of aerenchyma tissues in stems of sedges has been recognized as a significant gas pathway in both northern and tropical peatlands [45]. At the same time, Sphagnum moss species support methanotrophic (i.e., methane-consuming) bacteria, and CH4 emissions can be lower in Sphagnum-dominated peatland than in those dominated by other vegetation [46]. Our results showed a slightly higher magnitude of CH4 fluxes from rewetted former peat extraction areas with bare peat than in rewetted areas with vegetation, but the difference was not statistically significant.
Annualised cumulative CH4 fluxes from rewetted areas in our study are significantly lower than the default CH4 EF (216 kg CH4–C ha−1 yr−1, temperate climate zone, nutrient status: rich) provided by the IPCC [9,20] and the German average CH4 EF for rewetted organic soils (279 kg CH4–C ha−1 yr−1) [39]. This could be explained by the impact of previous land use: rewetted boreal cutover peatland may show relatively low CH4 emissions [20] and may preserve at a lower level compared to pristine (undisturbed) peatland for a long period—even after former peat extraction areas become fully re-established by natural peat-forming vegetation [12,42]. Our annualised cumulative CH4 fluxes from flooded areas are well within the IPCC default CH4 EF for rewetted areas.
Water level in peatland is an important factor for determining CH4 emissions (e.g., [21,42]). This is also supported by our results showing higher CH4 emissions in flooded conditions than in rewetted conditions, in which the GW level tends to drop, especially in summer and autumn. Nevertheless, no significant relationships between GW level and magnitude of surface-to-atmosphere CH4 fluxes were found in rewetted areas or in undisturbed peatland when each group of land-use type was analysed separately. This does not confirm the widely described relationship between CH4 release and GW level, but is in line with the findings of other studies, such as that of Glatzel et al. (2008) on peat bog restoration in NW Germany [43].

4.3. N2O Fluxes

In our study, the annualised cumulative N2O fluxes were low, ranging from zero in flooded former peat extraction areas to 0.66 ± 0.41 kg N2O–N ha−1 yr−1 in undisturbed peatland. In rewetted former peat extraction areas, annualised cumulative N2O fluxes were 0.32 ± 0.12 kg N2O–N ha−1 yr−1 in areas with bare peat and 0.02 ± 0.03 kg N2O–N ha−1 yr−1 in areas with vegetation. The lower annualised cumulative N2O fluxes in rewetted former peat extraction areas with vegetation compared to areas with bare peat could be explained by the uptake of N by vegetation communities [43]. A low soil C/N ratio is traditionally applied as a predictor of high N2O emissions [47,48], while a high C/N ratio indicates comparatively nutrient-poor peat and thus lower rates of microbial decomposition, resulting in lower N2O and CO2 fluxes [18]. We did not find significant correlations between soil C/N ratio and soil surface-to-atmosphere N2O fluxes; moreover, soil C/N ratio in rewetted former peat extraction areas with vegetation was lower compared to rewetted areas with bare peat (50 vs. 84 at a depth of 0–20 cm, Table A1). However, our range of soil C/N ratios (from 50 to 84 at a depth of 0–20 cm) is significantly above the threshold C/N ratio of 25 reported by Klemedtsson et al. (2005) for significant N2O emissions [47]. The German average N2O EF for rewetted organic soils is 0.1 kg N2O–N ha−1 yr−1 [39], while the IPCC (2014) guidelines [9,18,49] assume that N2O emissions from organic soils under fully saturated, rewetted conditions are negligible (under Tier 1). Our study supports the IPCC default approach, although there was some variation in annualised cumulative N2O fluxes in rewetted conditions. In general, N2O fluxes from organic soils are controlled through nitrification and denitrification processes limited by the availability of N and/or oxygen, and thus GW level [9,50]. Saturated soils under flooded (anoxic) conditions reduce the rates of nitrification, and thus NO3 production, while promoting denitrification and the consumption of N2O, resulting in negligible N2O fluxes [9,37]. Our research sites were not fertilised, and thus an increase in available mineral nitrogen was not promoted; furthermore, the studied region is located in a comparatively low-N-deposition area [51,52]. These could be additional reasons for the relatively low magnitude of the N2O emissions recorded. In our study, neither the temperature nor the water level were found to be significant influencing factors of surface-to-atmosphere N2O fluxes. Nevertheless, with the latest N2O global warming potential (GWP100) value of 265 (AR5 [53]), even small changes in emissions of N2O would have some impact on the climate [18].

5. Conclusions

In this study, we presented the results of monitored surface-to-atmosphere GHG fluxes from rewetted and permanently flooded former peat extraction areas in comparison to pristine (undisturbed) peatland in hemiboreal Latvia. Using pristine peatland for comparison, we found that rewetting of former peat extraction areas in the hemiboreal region of Europe initiated before 20–30 years ago had not fully returned the peatland to the GHG (especially CH4) flux-magnitude state that occurred prior to disturbance (peat extraction), and that the GW level dynamic did not reach values characteristic for pristine wetlands. Among the studied land-use types, the highest annualised surface-to-atmosphere CO2 fluxes (sum of soil heterotrophic and autotrophic respiration) were recorded in rewetted former peat extraction areas with restored vegetation and in undisturbed peatland, while the lowest were in flooded former peat extraction areas (temperature and GW level was found to be significant CO2-flux influencing factors). The highest annualised CH4 fluxes were recorded in undisturbed peatland, followed by about two-fold smaller CH4 fluxes in flooded areas and ~20-fold smaller CH4 fluxes in rewetted areas than in undisturbed peatland. N2O fluxes were negligible in all the studied land-use types; the highest annualised N2O fluxes were recorded in undisturbed peatland. In general, our results show that the IPCC default EFs for rewetted areas significantly underestimate CO2 emissions (at least for those areas with bare peat) and overestimate CH4 emissions in hemiboreal regions where considerable GW fluctuations are observed, and the water regime is still most probably affected by residuals of drainage systems and regional changes.
The results of this study have highlighted the necessity of long-term GHG monitoring in order to more accurately assess the impact of raised water tables on GHG fluxes from drained organic soils, including former peat extraction areas at the ecosystem level in hemiboreal regions, as well as to develop more stratified and accurate GHG EFs applicable for the IPCC GHG accounting system. In addition, further studies are important to enhance our knowledge of the impact of raised water tables on climate change mitigation to support policy makers with information from different regions with different specificities (e.g., GW fluctuations, duration of re-establishment of vegetation under rewetted conditions, periods of drought, flooding events).

Supplementary Materials

The following supporting information can be downloaded at: https://www.mdpi.com/article/10.3390/w15101954/s1, Figure S1: Average annual air temperature in Latvia in 2012–2022; Figure S2: Average annual precipitation in Latvia in 2012–2022 (Reference [29] is cited in the Supplementasy Materials).

Author Contributions

Conceptualization, A.L.; methodology, A.B. (Aldis Butlers); validation, A.B. (Arta Bārdule) and R.N.M.; formal analysis, A.B. (Arta Bārdule); investigation, R.N.M. and G.S.; resources, I.L.; data curation, A.B. (Aldis Butlers); writing—original draft preparation, A.B. (Arta Bārdule) and A.B. (Aldis Butlers); writing—review and editing, A.L.; visualization, J.I. and A.B. (Arta Bārdule); supervision, A.L.; project administration, A.L.; funding acquisition, A.L. All authors have read and agreed to the published version of the manuscript.

Funding

This research was funded by European Regional Development Fund project “Development of greenhouse gas emission factors and decision support tools for management of peatlands after peat extraction”, grant number 1.1.1.1/19/A/064. The article processing charge was funded by LIFE Programme project “Demonstration of climate change mitigation potential of nutrient rich organic soils in Baltic States and Finland”, LIFE OrgBalt, LIFE18 CCM/LV/001158.

Data Availability Statement

Data available on request made to the corresponding author A.B. (Arta Bārdule).

Acknowledgments

The contribution of A.B. (Arta Bārdule) was funded by the Fundamental and Applied Research Projects program “Evaluation of factors affecting greenhouse gas (GHG) emissions from surface of tree stems in deciduous forests with drained and wet soils”, grant number LZP-2021/1-0137; the contribution of I.L. was funded by the LIFE Programme project “Demonstration of climate change mitigation potential of nutrient rich organic soils in Baltic States and Finland”, LIFE OrgBalt, LIFE18 CCM/LV/001158; the work of A.B. (Aldis Butlers) was supported by the European Social Fund within the project (No. 8.2.2.0/20/I/001) “LLU Transition to a new funding model of doctoral studies” and the work of R.M. was supported by grant program “Strengthening of capacity of LU doctoral program within the scope of new model of doctoral studies”, number 8.2.2.0/20/I/006.

Conflicts of Interest

The authors declare no conflict of interest. The funders had no role in the design of the study; in the collection, analyses, or interpretation of data; in the writing of the manuscript; or in the decision to publish the results.

Appendix A

Figure A1. Variation in environmental parameters: flooded water layer depth (during frost-free period) and water temperature (T) in flooded former peat extraction areas, groundwater level and soil temperature at a depth of 5 cm in rewetted and flooded former peat extraction areas and in undisturbed peatland.
Water 15 01954 g0a1
Figure A2. Trends (linear regressions) describing the dependence of average surface-to-atmosphere GHG fluxes on water general chemistry in flooded former peat extraction areas.
Water 15 01954 g0a2
Table A1. Soil general chemistry at depths of 0–20 cm and 20–40 cm in rewetted former peat extraction areas and undisturbed peatland.
ParameterStudied Land-Use Types with Organic Soils
Rewetted Area (Bare Peat)Rewetted Area (with Vegetation)Undisturbed Peatland
Soil at 0–20 cm depth
OC, g kg−1544.6 ± 3.8539.5 ± 9.5524.1 ± 6.5
pH (CaCl2)2.56 ± 0.023.22 ± 0.332.87 ± 0.05
TN, g kg−16.57 ± 0.5911.42 ± 1.059.83 ± 1.15
P, g kg−10.12 ± 0.020.20 ± 0.030.24 ± 0.03
K, g kg−10.12 ± 0.030.88 ± 0.310.51 ± 0.07
Ca, g kg−11.35 ± 0.1311.23 ± 5.202.09 ± 0.52
Mg, g kg−10.63 ± 0.091.01 ± 0.310.71 ± 0.10
C/N ratio84.0 ± 6.650.4 ± 5.263.6 ± 6.2
Soil at 20–40 cm depth
OC, g kg−1554.1 ± 3.8553.6 ± 14.6534.2 ± 4.5
pH (CaCl2)2.54 ± 0.013.25 ± 0.342.93 ± 0.05
TN, g kg−16.69 ± 0.1910.04 ± 0.969.64 ± 0.85
P, g kg−10.10 ± 0.010.18 ± 0.020.20 ± 0.02
K, g kg−10.06 ± 0.010.23 ± 0.060.40 ± 0.08
Ca, g kg−11.06 ± 0.0412.37 ± 5.601.83 ± 0.32
Mg, g kg−10.38 ± 0.060.97 ± 0.340.54 ± 0.05
C/N ratio83.2 ± 2.658.5 ± 0.963.4 ± 6.0

References

  1. Waddington, J.M.; Warner, K.D.; Kennedy, G.W. Cutover peatlands: A consistent source of CO2. Glob. Biogeochem. Cycles 2002, 16, 1–7. [Google Scholar] [CrossRef]
  2. Leifeld, J.; Wüst-Galley, C.; Page, S. Intact and managed peatland soils as a source and sink of GHGs from 1850 to 2100. Nat. Clim. Chang. 2019, 9, 945–947. [Google Scholar] [CrossRef]
  3. Conchedda, G.; Tubiello, F.N. Drainage of organic soils and GHG emissions: Validation with country data. Earth Syst. Sci. Data 2020, 12, 3113–3137. [Google Scholar] [CrossRef]
  4. FAO. Drained Organic Soils 1990–2019. Global, Regional and Country Trends; FAOSTAT Analytical Brief Series No 4; FAO: Rome, Italy, 2020; pp. 1–9. [Google Scholar]
  5. Joosten, H.; Tapio-Biström, M.-L.; Tol, S. Peatlands-Guidance for Climate Change Mitigation through Conservation, Rehabilitation and Sustainable Use, 2nd ed.; FAO and Wetlands International: Rome, Italy, 2012; pp. 1–114. [Google Scholar]
  6. Gebremichael, A.W.; Osborne, B.; Orr, P. Flooding-related increases in CO2 and N2O emissions from a temperate coastal grassland ecosystem. Biogeosciences 2017, 14, 2611–2626. [Google Scholar] [CrossRef]
  7. Evans, C.D.; Peacock, M.; Baird, A.J.; Artz, R.R.E.; Burden, A.; Callaghan, N.; Chapman, P.J.; Cooper, H.M.; Coyle, M.; Craig, E.; et al. Overriding water table control on managed peatland greenhouse gas emissions. Nature 2021, 593, 548–552. [Google Scholar] [CrossRef]
  8. Kreyling, J.; Tanneberger, F.; Jansen, F.; van der Linden, S.; Aggenbach, C.; Blüml, V.; Couwenberg, J.; Emsens, W.-J.; Joosten, H.; Klimkowska, A.; et al. Rewetting does not return drained fen peatlands to their old selves. Nat. Commun. 2021, 12, 5693. [Google Scholar] [CrossRef] [PubMed]
  9. IPCC. 2013 Supplement to the 2006 IPCC Guidelines for National Greenhouse Gas Inventories: Wetlands; Hiraishi, T., Krug, T., Tanabe, K., Srivastava, N., Baasansuren, J., Fukuda, M., Troxler, T.G., Eds.; IPCC: Geneva, Switzerland, 2014. [Google Scholar]
  10. IPCC. 2006 IPCC Guidelines for National Greenhouse Gas Inventories, Prepared by the National Greenhouse Gas Inventories Programme; Eggleston, H.S., Buendia, L., Miwa, K., Ngara, T., Tanabe, K., Eds.; IGES: Hayama, Japan, 2006. [Google Scholar]
  11. Kim, D.-G.; Vargas, R.; Bond-Lamberty, B.; Turetsky, M.R. Effects of soil rewetting and thawing on soil gas fluxes: A review of current literature and suggestions for future research. Biogeosciences 2012, 9, 2459–2483. [Google Scholar] [CrossRef]
  12. Waddington, J.M.; Day, S.M. Methane emissions from a peatland following restoration. JGR Biogeosci. 2007, 112, G03018. [Google Scholar] [CrossRef]
  13. Waddington, J.M.; Warner, K. Atmospheric CO2 sequestration in restored mined peatlands. Ecoscience 2001, 8, 359–368. [Google Scholar] [CrossRef]
  14. Günther, A.; Barthelmes, A.; Huth, V.; Joosten, H.; Jurasinski, G.; Koebsch, F.; Couwenberg, J. Prompt rewetting of drained peatlands reduces climate warming despite methane emissions. Nat. Commun. 2020, 11, 1644. [Google Scholar] [CrossRef]
  15. Liu, H.; Wrage-Mönnig, N.; Lennartz, B. Rewetting strategies to reduce nitrous oxide emissions from European peatlands. Commun. Earth Environ. 2020, 1, 17. [Google Scholar] [CrossRef]
  16. Zou, J.; Ziegler, A.D.; Chen, D.; McNicol, G.; Ciais, P.; Jiang, X.; Zheng, C.; Wu, J.; Wu, J.; Lin, Z.; et al. Rewetting global wetlands effectively reduces major greenhouse gas emissions. Nat. Geosci. 2022, 15, 627–632. [Google Scholar] [CrossRef]
  17. Aitova, E.; Morley, T.; Wilson, D.; Renou-Wilson, F. A review of greenhouse gas emissions and removals from Irish peatlands. Mires Peat 2023, 29, 1–17. [Google Scholar]
  18. Wilson, D.; Farrell, C.; Mueller, C.; Hepp, S.; Renou-Wilson, F. Rewetted industrial cutaway peatlands in western Ireland: A prime location for climate change mitigation? Mires Peat 2013, 11, 1–22. [Google Scholar]
  19. MacDonald, S.M. Carbon Gas Exchange at a Recently Restored Peatland in Alberta, Canada. Master’s Thesis, McGill University, Montreal, QC, Canada, December 2017. [Google Scholar]
  20. Wilson, D.; Blain, D.; Couwenberg, J.; Evans, C.D.; Murdiyarso, D.; Page, S.E.; Renou-Wilson, F.; Rieley, J.O.; Sirin, A.; Strack, M.; et al. Greenhouse gas emission factors associated with rewetting of organic soils. Mires Peat 2016, 17, 1–28. [Google Scholar]
  21. Martens, M.; Karlsson, N.P.E.; Ehde, P.M.; Mattsson, M.; Weisner, S.E.B. The greenhouse gas emission effects of rewetting drained peatlands and growing wetland plants for biogas fuel production. J. Environ. Manag. 2021, 277, 111391. [Google Scholar] [CrossRef]
  22. Butlers, A.; Bārdule, A.; Spalva, G.; Muižnieks, E. N2O and CH4 emissions from naturally wet and drained nutrient-rich organic forest soils. In Proceedings of the 10th International Scientific Conference Rural Development, Kaunas, Lithuania, 21–23 September 2021; pp. 195–200. [Google Scholar] [CrossRef]
  23. Latvia National Inventory Report. Available online: https://unfccc.int/documents/461908 (accessed on 12 April 2023).
  24. Butlers, A.; Ivanovs, J. Improved activity data for accounting greenhouse gas emissions due to management of wetlands. Res. Rural Dev. 2018, 1, 27–33. [Google Scholar] [CrossRef]
  25. Samariks, V.; Lazdiņš, A.; Bārdule, A.; Kalēja, S.; Butlers, A.; Spalva, G.; Jansons, Ā. Impact of former peat extraction field afforestation on soil greenhouse gas emissions in hemiboreal region. Forests 2023, 14, 184. [Google Scholar] [CrossRef]
  26. Kaleja, S.; Bardule, A. Review of climate change mitigation measures applicable in degraded peatlands in Latvia. Res. Rural Dev. 2022, 37, 56–62. [Google Scholar] [CrossRef]
  27. EU Biodiversity Strategy for 2030. Available online: https://eur-lex.europa.eu/resource.html?uri=cellar:a3c806a6-9ab3-11ea-9d2d-01aa75ed71a1.0001.02/DOC_1&format=PDF (accessed on 12 April 2023).
  28. Proposal for a Regulation of the European Parliament and of the Council on Nature Restoration. Available online: https://environment.ec.europa.eu/system/files/2022-06/Proposal%20for%20a%20Regulation%20on%20nature%20restoration.pdf (accessed on 12 April 2023).
  29. Latvian Environment, Geology and Meteorology Centre. Meteorological Network. Available online: https://klimats.meteo.lv/klimats/latvijas_klimats/ (accessed on 12 April 2023).
  30. Pavelka, M.; Acosta, M.; Kiese, R.; Altimir, N.; Brümmer, C.; Crill, P.; Darenova, E.; Fuß, R.; Gielen, B.; Graf, A.; et al. Standardisation of chamber technique for CO2, N2O and CH4 fluxes measurements from terrestrial ecosystems. Int. Agrophysics 2018, 32, 569–587. [Google Scholar] [CrossRef]
  31. Butlers, A.; Lazdiņš, A. Case study on greenhouse gas (GHG) fluxes from flooded former peat extraction fields in central part of Latvia. Res. Rural Dev. 2022, 37, 44–49. [Google Scholar]
  32. Darenova, E.; Pavelka, M.; Acosta, M. Diurnal deviations in the relationship between CO2 efflux and temperature: A case study. Catena 2014, 123, 263–269. [Google Scholar] [CrossRef]
  33. Loftfield, N.; Flessa, H.; Augustin, J.; Beese, F. Automated gas chromatographic system for rapid analysis of the atmospheric trace gases methane, carbon dioxide, and nitrous oxide. J. Environ. Qual. 1997, 26, 560–564. [Google Scholar] [CrossRef]
  34. R Core Team. The R Project for Statistical Computing. Available online: https://www.R-project.org (accessed on 12 April 2023).
  35. Kuzyakov, Y. Sources of CO2 efflux from soil and review of partitioning methods. Soil Biol. Biochem. 2006, 38, 425–448. [Google Scholar] [CrossRef]
  36. Tang, X.; Pei, X.; Lei, N.; Luo, X.; Liu, L.; Shi, L.; Chen, G.; Liang, J. Global patterns of soil autotrophic respiration and its relation to climate, soil and vegetation characteristics. Geoderma 2020, 369, 114339. [Google Scholar] [CrossRef]
  37. Hu, J.; VanZomeren, C.M.; Inglett, K.S.; Wright, A.L.; Clark, M.W.; Reddy, K.R. Greenhouse gas emissions under different drainage and flooding regimes of cultivated peatlands. JGR Biogeosci. 2017, 122, 3047–3062. [Google Scholar] [CrossRef]
  38. Koebsch, F.; Gottschalk, P.; Beyer, F.; Wille, C.; Jurasinski, G.; Sachs, T. The impact of occasional drought periods on vegetation spread and greenhouse gas exchange in rewetted fens. Philos. Trans. R. Soc. B 2020, 375, 20190685. [Google Scholar] [CrossRef] [PubMed]
  39. Tiemeyer, B.; Freibauer, A.; Borraz, E.A.; Augustin, J.; Bechtold, M.; Beetz, S.; Beyer, C.; Ebli, M.; Eickenscheidt, T.; Fiedler, S.; et al. A new methodology for organic soils in national greenhouse gas inventories: Data synthesis, derivation and application. Ecol. Indic. 2020, 109, 105838. [Google Scholar] [CrossRef]
  40. Bārdule, A.; Gerra-Inohosa, L.; Kļaviņš, I.; Kļaviņa, Z.; Bitenieks, K.; Butlers, A.; Lazdiņš, A.; Lībiete, Z. Variation in the mercury concentrations and greenhouse gas emissions of pristine and managed hemiboreal peatlands. Land 2022, 11, 1414. [Google Scholar] [CrossRef]
  41. Berglund, Ö.; Berglund, K.; Klemedtsson, L. Plant-derived CO2 flux from cultivated peat soils. Acta Agric. Scand. Sect. B—Soil Plant Sci. 2011, 61, 508–513. [Google Scholar]
  42. Tuittila, E.-S.; Komulainen, V.-M.; Vasander, H.; Nykänen, H.; Martikainen, P.J.; Laine, J. Methane dynamics of a restored cut-away peatland. Glob. Chang. Biol. 2000, 6, 569–581. [Google Scholar] [CrossRef]
  43. Glatzel, S.; Forbrich, I.; Krüger, C.; Lemke, S.; Gerold, G. Small scale controls of greenhouse gas release under elevated Ndeposition rates in a restoring peat bog in NW Germany. Biogeosciences 2008, 5, 925–935. [Google Scholar] [CrossRef]
  44. Carmichael, M.J.; Bernhardt, E.S.; Bräuer, S.L.; Smith, W.K. The role of vegetation in methane flux to the atmosphere: Should vegetation be included as a distinct category in the global methane budget? Biogeochemistry 2014, 119, 1–24. [Google Scholar] [CrossRef]
  45. Akhtar, H.; Lupascu, M.; Sukri, R.S.; Smith, T.E.L.; Cobb, A.R.; Swarup, S. Significant sedge-mediated methane emissions from degraded tropical peatlands. Environ. Res. Lett. 2020, 16, 014002. [Google Scholar] [CrossRef]
  46. Larmola, T.; Tuittila, E.-S.; Tiirola, M.; Nykänen, H.; Martikainen, P.J.; Yrjälä, K.; Tuomivirta, T.; Fritze, H. The role of Sphagnum mosses in the methane cycling of a boreal mire. Ecology 2010, 91, 2356–2365. [Google Scholar] [CrossRef]
  47. Klemedtsson, L.; Von Arnold, K.; Weslien, P.; Gundersen, P. Soil CN ratio as a scalar parameter to predict nitrous oxide emissions. Glob. Chang. Biol. 2005, 11, 1142–1147. [Google Scholar] [CrossRef]
  48. Liimatainen, M.; Voigt, C.; Martikainen, P.J.; Hytönen, J.; Regina, K.; Óskarsson, H.; Maljanen, M. Factors controlling nitrous oxide emissions from managed northern peat soils with low carbon to nitrogen ratio. Soil Biol. Biochem. 2018, 122, 186–195. [Google Scholar] [CrossRef]
  49. Hendriks, D.M.D.; van Huissteden, J.; Dolman, A.J.; van der Molen, M.K. The full greenhouse gas balance of an abandoned peat meadow. Biogeosciences 2007, 4, 411–424. [Google Scholar] [CrossRef]
  50. Wrage-Mönnig, N.; Horn, M.A.; Well, R.; Müller, C.; Velthof, G.; Oenema, O. The role of nitrifier denitrification in the production of nitrous oxide revisited. Soil Biol. Biochem. 2018, 123, A3–A16. [Google Scholar] [CrossRef]
  51. Bārdule, A.; Bārdulis, A.; Polmanis, K.; Krumšteds, L.L.; Butlers, A.; Stola, J.; Skranda, I.; Purviņa, D.; Zvaigzne, Z.A.; Muižnieks, E.; et al. Trends of Scots pine forest health and element flow changes in the ICP Forests monitoring sites in Latvia. Balt. For. 2021, 27, 536. [Google Scholar] [CrossRef]
  52. Michel, A.; Kirchner, T.; Prescher, A.-K.; Schwärzel, K. Forest Condition in Europe: The 2022 Assessment. ICP Forests Technical Report under the UNECE Convention on Long-Range Transboundary Air Pollution (Air Convention); Thünen Institute: Eberswalde, Germany, 2022. [Google Scholar] [CrossRef]
  53. Myhre, G.; Shindell, D.; Bréon, F.-M.; Collins, W.; Fuglestvedt, J.; Huang, J.; Koch, D.; Lamarque, J.-F.; Lee, D.; Mendoza, B.; et al. Anthropogenic and Natural Radiative Forcing. In Climate Change 2013: The Physical Science Basis. Contribution of Working Group I to the Fifth Assessment Report of the In-tergovernmental Panel on Climate Change; Stocker, T.F., Qin, D., Plattner, G.-K., Tignor, M., Allen, S.K., Boschung, J., Nauels, A., Xia, Y., Bex, V., Midgley, P.M., Eds.; Cambridge University Press: Cambridge, UK; New York, NY, USA, 2013. [Google Scholar]
Figure 1. Location of the studied research sites in hemiboreal Latvia.
Water 15 01954 g001
Figure 2. Seasonal variation in CO2 fluxes from soil or water surfaces in rewetted and flooded former peat extraction areas and in undisturbed peatland. Statistically significant differences (p < 0.05) between land use types within the same season are shown with different uppercase letters; statistically significant differences (p < 0.05) between different seasons within the same land use type are show with different lowercase letters.
Water 15 01954 g002
Figure 3. Seasonal variation in CH4 fluxes from soil or water surface in rewetted and flooded peat extraction areas and in undisturbed peatland. Statistically significant differences (p < 0.05) between land use types within the same season are shown with different uppercase letters; statistically significant differences (p < 0.05) between different seasons within the same land use type are shown with different lowercase letters.
Water 15 01954 g003
Figure 4. Seasonal variation in N2O fluxes from soil or water surface in rewetted and flooded former peat extraction areas and in undisturbed peatland. Statistically significant differences (p < 0.05) between land use types within the same season are shown with different uppercase letters; no significant differences (p > 0.05) were detected between different seasons within the same land use type (similar lowercase letters).
Water 15 01954 g004
Figure 5. Nonlinear regressions describing dependence of CO2 surface-to-atmosphere fluxes (sum of soil heterotrophic and autotrophic respiration) on water temperature in flooded former peat extraction areas and soil temperature at a depth of 5 cm in rewetted former peat extraction areas and undisturbed peatland.
Water 15 01954 g005
Figure 6. Linear regressions describing dependence of CO2 surface-to-atmosphere fluxes (sum of soil heterotrophic and autotrophic respiration) on GW level in rewetted former peat extraction areas.
Water 15 01954 g006
Table 1. Characterisation of the studied research sites in hemiboreal Latvia.
Type of Research Sites, Study Period (GHG Flux Sampling) Name of Research SitesShort Description, Water Level Position
during the Study Period
Coordinates
(WGS-84 Coordinate System)
Undisturbed peatland (steady stage), December 2016–2018Lauga MireRaised bog, groundwater level in range from 0 to 35 cmX: 24.67638;
Y: 57.27659
Ķemeri MireRaised bog, groundwater level in range from −23 to 20 cmX: 23.53489;
Y: 56.88007
Lielsala MireRaised bog, groundwater level in range from −2 to 15 cmX: 22.31902;
Y: 57.34393
Igerīšu MireTransitional mire, groundwater level in range from −8 to 7 cmX: 24.61425;
Y: 57.10805
Kalnezera MireTransitional mire, groundwater level in range from −16 to 35 cmX: 24.73494;
Y: 56.68246
Kazu MireTransitional mire, groundwater level in range from −10 to 36 cmX: 24.82005;
Y: 57.27762
Rewetted former peat extraction areas with bare peat, December 2016–2018Cenas MireGroundwater level in range from 2 to 88 cmX: 23.98021;
Y: 56.82464
Medema MireGroundwater level in range from 2 to 74 cmX: 24.10859;
Y: 56.84534
Ķemeri MireGroundwater level in range from −3 to 30 cmX: 23.52458;
Y: 56.89753
Ķemeri MireGroundwater level in range from 0 to 43 cmX: 23.52478;
Y: 56.89730
Rewetted former peat extraction areas with vegetation, December 2016–2018Cenas MireHerbaceous plant and shrub vegetation, groundwater level in range from 0 to 101 cmX: 23.97731;
Y: 56.82599
Cepļa MireHerbaceous plant and shrub vegetation, groundwater level in range from 9 to 53 cmX: 26.47581;
Y: 57.22005
Silguldas MireHerbaceous plant and shrub vegetation, groundwater level in range from 8 to 79 cmX: 27.39121;
Y: 57.31268
Briģu MireReed vegetation, groundwater level in range from −12 to 90 cmX: 24.40517;
Y: 56.44364
Permanently flooded former peat extraction areas, January 2021–December 2022Tēvgāršu SwampDepth of flooded water level in range from 1.0 to 1.5 m, decrease during summer (by max 0.6 m)X: 24.95375;
Y: 57.67010
Zilākalna SwampDepth of flooded water level in range from 0.8 to 1.8 m, relatively stable during summer (decrease by max 0.3 m)X: 25.16912;
Y: 57.59400
Zilākalna swampDepth of flooded water level in range from 0.7 to 1.2 m, decrease during summer (by max 0.5 m)X: 25.16439;
Y: 57.59056
Table 2. Pearson correlation coefficients (r) characterising relationships between surface-to-atmosphere GHG fluxes and environmental factors, grouped by type of land use. * p < 0.05, ** p < 0.01, *** p < 0.001.
ParameterFlooded AreaRewetted Area (Bare Peat)Rewetted Area (with Vegetation)Undisturbed Peatland
Surface-to-atmosphere CO2 fluxes (sum of soil heterotrophic and autotrophic respiration)
Air temperature0.52 ***0.83 ***0.80 ***0.80 ***
Soil temperature, 5 cm depth 0.92 ***0.92 ***0.85 ***
Soil temperature, 10 cm depth 0.92 ***0.92 ***0.84 ***
Soil temperature, 15 cm depth 0.88 ***0.92 ***0.82 ***
Soil temperature, 30 cm depth 0.88 ***0.92 ***0.81 ***
GW level 0.60 ***0.52 ***0.29 **
Water level in flooded area during frost-free period−0.16
Water temperature in flooded area0.56 ***
Surface-to-atmosphere CH4 fluxes
Air temperature0.52 ***0.32 **0.26 *0.32 ***
Soil temperature, 5 cm depth 0.34 **0.27 *0.31 ***
Soil temperature, 10 cm depth 0.32 **0.30 *0.32 ***
Soil temperature, 15 cm depth 0.30 *0.28 **0.30 ***
Soil temperature, 30 cm depth 0.30 *0.28 **0.28 **
GW level −0.02−0.08−0.01
Water level in flooded area during frost-free period−0.04
Water temperature in flooded area0.62 ***
Surface-to-atmosphere N2O fluxes
Air temperature0.32−0.04−0.19−0.05
Soil temperature, 5 cm depth −0.04−0.20−0.14
Soil temperature, 10 cm depth 0.05−0.18−0.15
Soil temperature, 15 cm depth 0.01−0.21 *−0.16
Soil temperature, 30 cm depth 0.01−0.21 *−0.15
GW level −0.050.010.01
Water level in flooded area during frost-free period−0.21
Water temperature in flooded area0.26
Table 3. Estimated annual GHG fluxes (mean value ± S.E.) from soil or water surfaces in the studied land-use types. IPCC CO2 and CH4 emission factors (temperate climate zone, nutrient status - rich) for rewetted areas are given for comparison.
Surface-to-Atmosphere GHG FluxesUnitStudied Land-Use Types with Organic Soils
Flooded AreaRewetted Area (Bare Peat)Rewetted Area (with Vegetation)Undisturbed Peatland
Estimated annual CO2 fluxes (sum of soil heterotrophic and autotrophic respiration)t CO2-C ha−1 yr−10.55 ± 0.051.73 ± 0.174.10 ± 0.213.45 ± 0.21
IPCC CO2 emission factor taken from Table 3.1 in the 2013 IPCC Wetlands Supplement [9]t CO2-C ha−1 yr−1-0.50
(95% range: from −0.71 to +1.71)
-
Estimated annual CH4 fluxeskg CH4-C ha−1 yr−1251.1 ± 77.226.4 ± 12.022.6 ± 7.6562.4 ± 155.8
IPCC CH4 emission factor taken from Table 3.3 in the 2013 IPCC Wetlands Supplement [9]kg CH4-C ha−1 yr−1-216 (95% range: from 0 to 856)-
Estimated annual N2O fluxeskg N2O-N ha−1 yr−10.00 ± 0.060.32 ± 0.120.02 ± 0.030.66 ± 0.41
IPCC N2O emission factor according to the 2013 IPCC Wetlands Supplement [9]kg N2O-N ha−1 yr−1-negligible-
Disclaimer/Publisher’s Note: The statements, opinions and data contained in all publications are solely those of the individual author(s) and contributor(s) and not of MDPI and/or the editor(s). MDPI and/or the editor(s) disclaim responsibility for any injury to people or property resulting from any ideas, methods, instructions or products referred to in the content.

