
Flood-Triggering Rainfall and Potential Losses—The Copula-Based Approach on the Example of the Upper Nysa Kłodzka River


1
Department of Hydrology and Water Resources Management, Faculty of Geographical and Geological Sciences, Adam Mickiewicz University, Bogumiła Krygowskiego Str. 10, 61-680 Poznan, Poland
2
Institute of International Business and Economics, Poznań University of Economics and Business, Al. Niepodległości 10, 61-875 Poznań, Poland
*
Author to whom correspondence should be addressed.
Water 2023, 15(10), 1958; https://doi.org/10.3390/w15101958
Submission received: 18 April 2023
/
Revised: 13 May 2023
/
Accepted: 19 May 2023
/
Published: 22 May 2023
(This article belongs to the Special Issue Impacts of Climate Change on Water Resources: Assessment and Modeling)
Abstract
:Floods are natural phenomena, inextricably related to river regimes, which can threaten human health and life, the environment, cultural heritage, economic activity and infrastructure. The aim of the research is to assess the connection between rainfall and river flood risk. The proposed methodology is presented on the example of the upper Nysa Kłodzka River (NKR) catchment and Kłodzko town located on NKR, which are two of the most flood-prone areas in the Odra River basin. The methodology is based on the well-established methods of potential flood losses (PFL) estimation and the copula-based model, allowing an assessment of connections between rainfall and flood losses in a probabilistic way. The results are presented using the ‘synchronicity’ measure. Seventeen significant summer (rainfall-driven) flood waves were selected, for which PFL were estimated and cumulative rainfall was calculated for 24, 48, 72, 96 and 120 h preceding the flood peak. It was found that the synchronicity of PFL and the 24 h rainfall was the lowest among the analyzed variants, while for the 48 to 120 h rainfall the highest synchronicity was identified at precipitation gauge Podzamek.
Keywords:
flood risk; rainfall; potential flood losses; copula; synchronicity; Poland; Nysa Kłodzka River1. Introduction
Floods are natural phenomena inextricably related to river regimes. In general, they are responses to increased water supply due to precipitation or snow and ice melts. Floods play a significant role in environment functioning; they are even essential for certain ecosystems. For centuries, floodplains and river valleys were also chosen by humans to build their settlements due to their water-resources availability, fertile soil, and relatively flat terrain, or for military purposes. However, sometimes, proximity to rivers turns from a blessing into a curse, because floods can be of extreme proportions and be catastrophic in their consequences. They can threaten human health and life, the environment, cultural heritage, economic activity and infrastructure [1,2]. Extreme floods cannot be avoided; thus, the risk of their occurrence should be a part of rational water management and governance [3,4], especially in the context of climate change [5].
What is more, recent times can be taken as an exceptionally flood-rich period in terms of the timing of flood occurrences, their magnitudes and their spatial extent in Europe [6,7]. For last 150 years in Europe, there has been an increase in the area inundated by floods; however, this has been accompanied by a relative (to the demographic and economic growth) reduction in fatalities and economic losses [8]. There is evidence that climate change will make extreme hydrological events in Europe more frequent and adverse [9,10,11,12,13,14], although these changes will not occur in a similar way in every region [15,16,17,18,19,20,21,22]. In general, global warming is going to significantly increase human and economic losses from river flooding in the future [23,24,25,26]. However, the changing climate is not the only driver of increasing flood risk—there is a constant pressure to convert floodplains into artificial surfaces [27,28], and intensive land use also increases the exposure of human assets to floods [29].
In such conditions, the significance of a proper flood hazard and risk assessment is growing. Floods, in water management and governance, may be considered using several terms, including sensitivity (or susceptibility), exposure, vulnerability, resilience, hazard and risk. Some of them are sometimes treated as synonyms, which leads to misunderstandings. In this paper, the terms “hazard” and “risk” are understood in line with the Floods Directive [1]—“hazard” is connected to the occurrence probability of a flood event, while “risk” is a combination of hazard and the potential adverse consequences associated with a flood event. According to these definitions, in the standard flood risk assessment approach, two things are crucial: calculation of probable values of river flows/water levels (leading to the designation of the inundation zones and flood water depths), and an estimation of potential flood losses (PFL).
Such an approach meets certain obstacles [30], which leads to the uncertainty of results [31]; thus, risk-assessment methods are developed, e.g., by applying the theory of reliability [32], the rapid flood risk assessment based on issued predictions [33] or a continuous approach which allows for the modelling and simulation of spatially and temporally correlated hazard scenarios at a weekly time scale [30]. A growing number of methods are based on copulas [24,30,34] or machine-learning techniques [35,36]. These methods allow for the estimation of the PFL and flood risk; however, it should be remembered that these analyses should be a part of flood risk management and should be followed by, e.g., preparing spatial development policies and establishing investment priorities in flood protection infrastructure. This is usually carried out using economic methods, such as a cost–benefit analysis (CBA) [37,38,39].
Many researchers also focus on pluvial flood hazard and risk (e.g., [40,41,42]), especially in urban areas (e.g., [43,44,45]). However, such studies, in most cases, develop modelling methods and tools (in terms of rainfall-runoff relation, losses, etc.), rather than searching for spatial dependencies between economically estimated flood risk and the factors causing it in the catchment, such as rainfall or snowmelt; such studies have been performed, e.g., by [46,47].
This research aims to fill the existing research gap by assessing the connection between rainfall and river flood risk. The presented methodology is based on the well-established methods of PFL estimation and the copula-based ‘synchronicity’ measure. It is demonstrated on the example of Kłodzko town, Poland, located in the Nysa Kłodzka River (NKR) catchment.
The research fits into the trend of analyzing relationships between hydro- and meteorological variables in terms of synchronicity and asynchronicity, described also as, e.g., “synchronous–asynchronous encounter probability”, “probability of synchronous or asynchronous occurrence”, or “dryness–wetness/rich–poor encounter probability”. Such an approach has been used in the analyses of the probability of the co-occurrence of precipitation [48,49,50], runoff and sediment load [51,52,53], the water level of a sea and coastal lakes [54], maximum or average annual discharge/runoff [55,56,57,58,59], precipitation and runoff [60,61,62], flood hazard [62] or water transfer projects [63]. The novelty of this research is its combining of the estimated economic flood losses and rainfall data within one copula-based model, which allows the formulation of spatio-temporal dependencies.
2. Study Area, Materials and Methods
2.1. Study Area
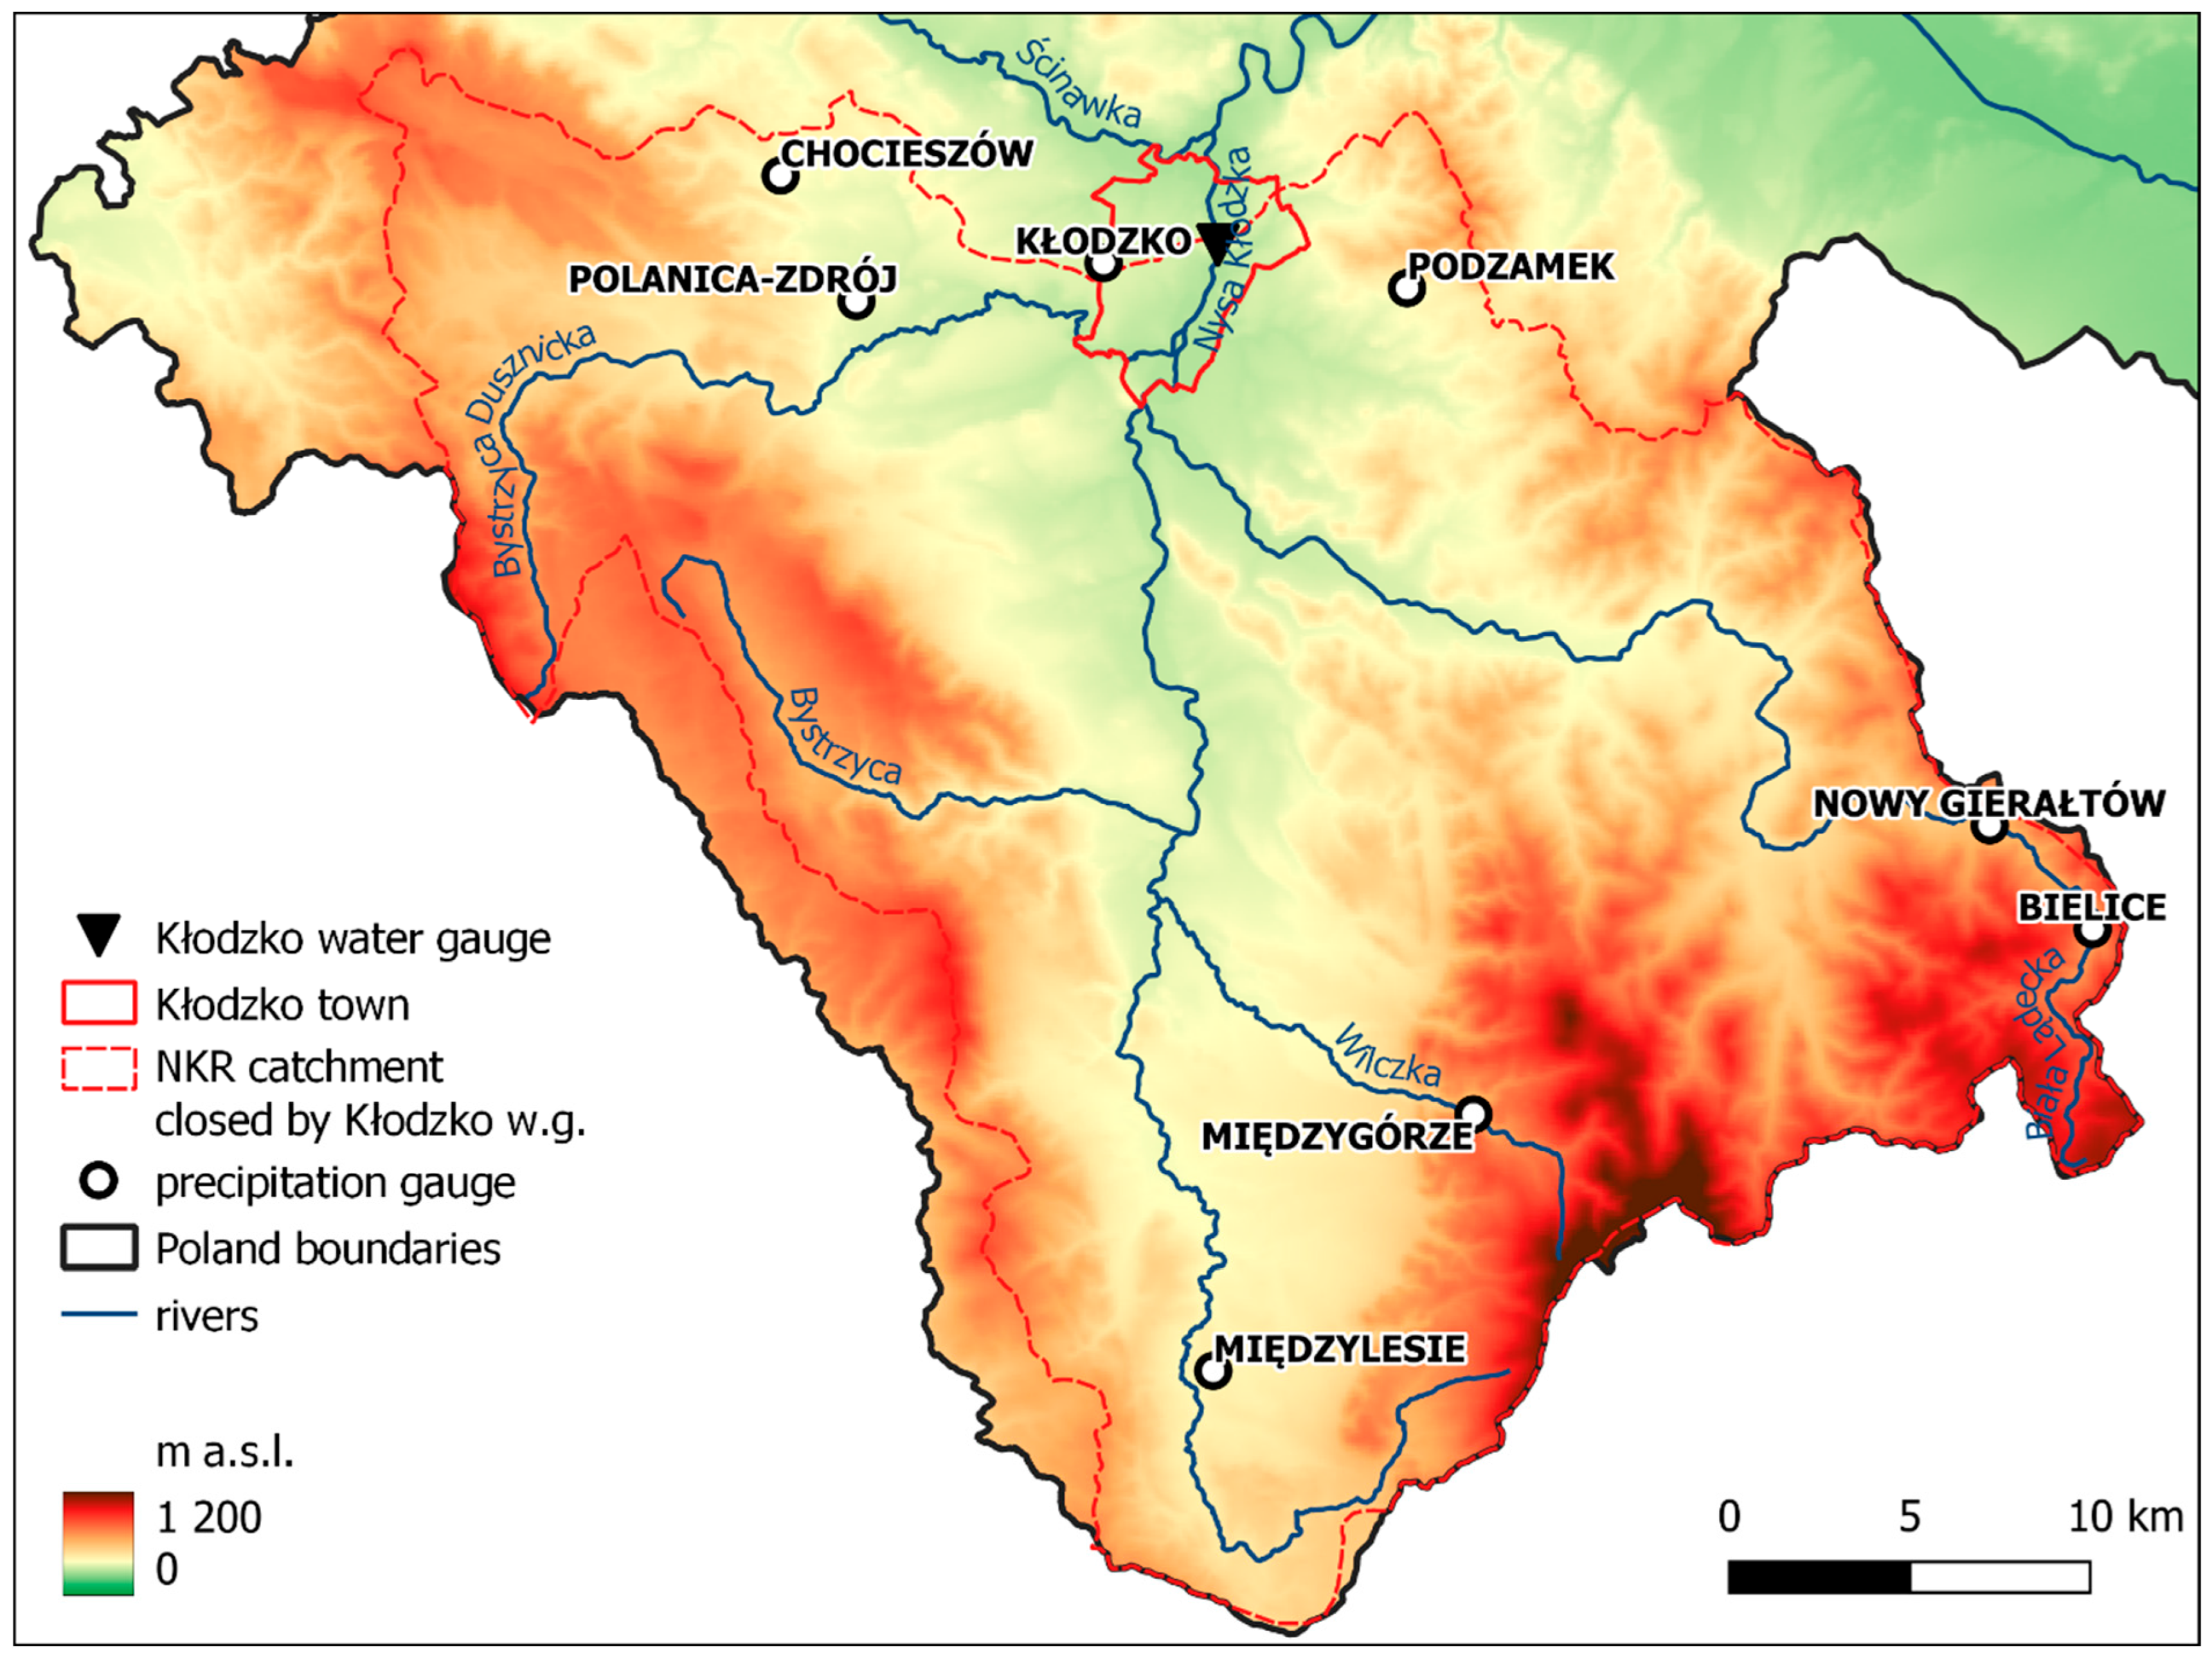
The upper NKR catchment lies in the Polish part of the Sudety Mountains (Figure 1). It is one of the areas most threatened by flooding in Poland [64], and rivers flowing from there to the Odra River have one of the highest values of the flood potential index in the country [65,66]. They are also characterized by apparent differences in terms of the uncertainty and stability of the river runoff regime [67]. Devastating floods in that region have been documented from as early as in the 14th century, when the July 1310 flood killed more than 1500 people [68]. One of the worst natural disasters in the modern history of Poland—the July 1997 flood in the Odra River basin—also originated from the upper NKR catchment. It is called the “Millennium Flood”, and this term is still rhetorically used to describe an event whose scale exceeded all imagination of the possible disaster size [69], because it caused more than 50 fatalities and losses counted in billions of USD. The July 1997 flood also hit the town of Kłodzko, killing several inhabitants and depriving more than 500 families of virtually everything they owned [69].
The possibility of flood-wave coincidence on the NKR and the Odra River is recognized as one of the serious environmental hazards in Poland [68,70]. The concentric arrangement of the river network and river-beds deposition in older formations are highlighted by [71] as favorable conditions for the formation of flood waves in that area. In their research, Bednorz et al. [71] determined five patterns of cyclonic circulation characterized by different intensities, extents and origins, which are responsible for heavy rainfall triggering floods in the Sudety Mountains. Kłodzko town was established as one of municipalities with the highest flood risk levels (according to the Flood Risk Management Plans) in the entire NKR catchment [72]. At the same time, the adaptability level of the town was assessed as one of the highest in that region, too.
Kłodzko town is located on the NKR, it has 25,239 inhabitants (as of 31 June 2022) [73] and an area of 24.84 km2. Due to the location in the river valley, its elevation is differentiated, ranging from 280 to 431 m a.s.l. A detailed description of the upper NKR catchment, including precipitation and hydrological conditions, is given in [74] and in earlier papers—please refer to [60,61,62,75].
2.2. Data
The study was conducted on the basis of values of daily water levels (H) of the NKR in Kłodzko town and rainfall (R) recorded in precipitation gauges in the NKR catchment. The data were obtained from the resources of the Institute of Meteorology and Water Management—National Research Institute in Warsaw, Poland, and downloaded using the climate R package [76]. The data cover the period of hydrological years (from 1 November to 31 October) 1971–2021.
In the proposed methodology, the digital elevation model (DEM) was used, with resolution of 1 m × 1 m. The Topographic Objects Database (BDOT10k) was used in estimation of flood losses, based on the land use classification. Both DEM and BDOT10k are provided by the Head Office of Geodesy and Cartography in Warsaw, Poland.
The obtained data sets are complete and sufficient to carry out the study and draw reliable conclusions.
2.3. Methods
2.3.1. Selection of Significant Floods and Rainfall Data Preparation
Firstly, based on the obtained data, the average annual maximum water level (hereinafter referred to as “mean high water”—MHW) was calculated. This value was applied to designate significant summer (rainfall-driven) floods—every flood equal to or higher than MHW was taken into the analyses. Exceedance of MHW for several following days was treated as one flood event, and for the further analyses only peak water levels were selected.
Besides the empirical H, the probable water levels were also obtained from the available flood hazard maps [77], for return periods of 10, 100 and 500 years, respectively. In order to obtain the flooding surface elevation (FSE, expressed in m a.s.l.), used to estimation of flood inundation zones (FIZ) and floodwater depths (FWD), all selected H were added to the “zero” level of the river gauge.
For each selected flood event, the rainfall from five preceding days was identified and summed to the 24 h (R24), 48 h (R48), 72 h (R72), 96 h (R96) and 120 h (R120) rainfall.
2.3.2. Estimation of FIZ Range
To obtain FIZ for each selected H, without using the complex hydrological/hydraulic model, the following steps were carried out using the GIS software (a visualization of these steps is presented in Figure 2):
- The river-valley and river-bed cross-sections were drawn (for NKR and its tributaries within the Kłodzko town boundaries).
- For each cross-section, elevation of the riverbank from DEM was added.
- For Kłodzko water-gauge cross-section, values of H were added.
- The differences between Kłodzko water-gauge elevation and elevations of other cross-sections were calculated.
- FSE in each cross-section (FSECS) was calculated with the use of formula (Equation (1)):where d—difference between elevation of the water-gauge cross-section and the given cross-section (“+” for cross-sections upstream, “−“ for cross-sections downstream).FSECS = H + d
- To obtain FIZ, the triangulated irregular network (TIN) model was applied to interpolate floodwater surface for each H.
- TIN was transformed into raster, and DEM was subtracted from it.
- The obtained raster was reclassified according to four depth classes (see Section 2.3.3 for details).
- The reclassified raster was transformed into polygon layer presenting initial FIZ range and FWD.
- The range of initial FIZ was limited to the administrative boundaries of the Kłodzko town.
- The final FIZ was obtained by subtracting the FIZ parts not linked to the river (e.g., behind dikes or naturally lower than the river) and riverbeds area from the polygon layer.
2.3.3. Estimation of PFL
For each final FIZ, PFL were estimated on the basis of land use type in accordance with the methodology used in preparation of the updated flood risk maps [78] and the updated flood risk management plans for the Odra River basin [79]. The approach is based on the methodology for determining the property value indicators proposed by [80]. The property value indicators adopted in the research were indexed using the growth in the economic indicators from 2016 to 2019 [79].
This methodology considers both the types of flooded area (according to BDOT10k) and depth of the water covering it. There are designated eight land use classes and four water depth classes, based on which levels of assets impairment were adopted (Table 1).
Based on values indicated in Table 1, for each FIZ total PFL was calculated.
2.3.4. Estimation of Distribution Parameters
The best matching statistical distribution type was selected for the analyzed data sets (R and PFL). The log-normal, Gumbel, Gamma and Weibull distributions were taken into consideration. Distribution-parameters estimation was conducted with the help of the maximum-likelihood method. In order to check the goodness of fit of the distribution type in the data series, the Akaike information criterion (AIC) [81] was used (Equation (2)):
where MSE—mean square error, N—size of a sample, p—fitted-parameters number or (Equation (3)):
where ML—maximum likelihood for model, and p–fitted-parameters number.
AIC = Nlog (MSE) + 2p
AIC = 2 log (ML) + 2p
The best-fitted distribution type is the one having the lowest value of AIC [81].
2.3.5. Application of Copulas
For H and PFL, the joint distribution was constructed using copulas. A definition of the bivariate Archimedean copula function is as follows (Equation (4)):
where u and v are marginal distributions, the θ, subscript of copula C, is the parameter hidden in the generating function ϕ, and ϕ is a continuous function called a generator which strictly decreases and is convex from I = [0, 1] to [0, ϕ(0)] [82].
Cθ (u,v) = ϕ−1 {ϕ(u) + ϕ(v)},
The one-parameter Archimedean copulas (Clayton, Gumbel–Hougaard and Frank copula families) were applied (Table 2).
AIC was applied in order to check the goodness of fit of the joint distribution.
Based on the estimated parameters of statistical distributions (see Section 2.3.4), for the analyzed data pairs (R—PFL) 5000 hypothetical values were randomly generated. They were used for selection of the best-fitted Archimedean copula family for a given data pair, and, subsequently, for forming of an appropriate copula function. Such a procedure (choosing a proper copula family for each data pair independently) helps to avoid having distorted (or even reverse) results—such a possibility was noted, e.g., in [55]. On the basis of empirical values of R and PFL for particular years and generated points, graphs with return period curves were generated. Next, the generated hypothetical values were analyzed using 62.5% and 37.5% probability levels [51,55]. These levels allowed designation of nine sectors (Table 3), which represent various relation types of analyzed variables probable values.
The synchronicity is the percent share of generated points in sectors No. 1, 5, and 9 (Table 3) in the total number of generated points, whereas the asynchronicity is divided into two types:
- Moderate asynchronicity representing “low–medium”, “medium–low”, “medium–high” and “high–medium” relation types (sectors Nos. 2, 4, 6, 8).
- High asynchronicity, representing “high–low” and “low–high” relation types (sectors No. 3 and 7).
To put it another way, synchronous and asynchronous occurrences probability (i.e., synchronicity and asynchronicity) of the analyzed variables (i.e., R and PFL) were determined with the calculated threshold values of probability ranges:
- LoR/LoPFL describing the probable values with a probability of exceedance >62.5%;
- MeR/MePFL describing the probable values with a probability of exceedance in a range <62.5% and >37.5%;
- HiR/HiPFL describing the probable values with a probability of exceedance <37.5%.
For description of LoR/LoPFL, MeR/MePFL and HiR/HiPFL, see footer of Table 3.
The sum of asynchronicity and synchronicity is 100%. The obtained results concern precipitation gauges in the NKR catchment, so interpolation of results was conducted to analyze spatial dependencies. It was performed using the inverse distance weighted (IDW) method [83].
The synchronous event is, e.g., when both R in Podzamek rainfall gauge and PFL in Kłodzko are in the same probability range. Synchronicity is the probability of occurrence of such a situation.
Similar methods of using the copulas and synchronicity within the upper NKR catchment were applied in earlier studies [60,61,62]; however, there are tangible differences between the used data, objectives and findings of that research. The first of these studies [60] focuses on relationships between the annual precipitation totals and river annual runoff. In the second study [61], three relation types were analyzed: between (1) precipitation totals recorded in rain gauge stations and average areal precipitation totals for the whole upper NKR catchment, (2) runoff totals recorded in sub-catchments and runoff totals recorded in Kłodzko water gauge and (3) areal precipitation totals for each sub-catchment and runoff from these sub-catchments. The third study [62], in contrast to the previous ones, does not concern water resources, but focuses on summer flood hazard and relations between flood peak flow, flood wave volume and rainfall in days preceding flood events. Present study, as described earlier, also concerns rainfall in days preceding significant summer flood events, but in relation to PFL, i.e., economic values (losses) used in flood risk analyses.
3. Results
3.1. Selected Flood Events
On the basis of MHW for the Kłodzko water gauge on the NKR (242.80 cm), 30 flood events were identified, among which 17 summer (recorded from May to October) floods were selected as significant ones and taken for further analysis (Table 4). The MHW value was similar to the alarm water level set for the Kłodzko water gauge (240 cm). The estimated PFL for the flood events ranges from PLN 12.1 million (EUR 2.61 million) to PLN 361.4 million (EUR 77.89 million), while the FIZ area is from 0.8 to 4.6 km2 (Table 4). The highest water level was recorded on 8 July 1997 (Figure 3), during so called “Millennium Flood” (see Section 2.1). From 2011 to 2021, no significant summer flood occurred. For every selected event, the 24 to 120 h rainfall sums were calculated for eight precipitation gauges located in the upper NKR catchment (Figure 1).
The official flood hazard and flood risk maps for NKR were prepared, based on values of probable water level with probabilities of exceedance: 10, 1, and 0.2% [77]. The same values were also used to estimate PFL and FIZ (Table 5).
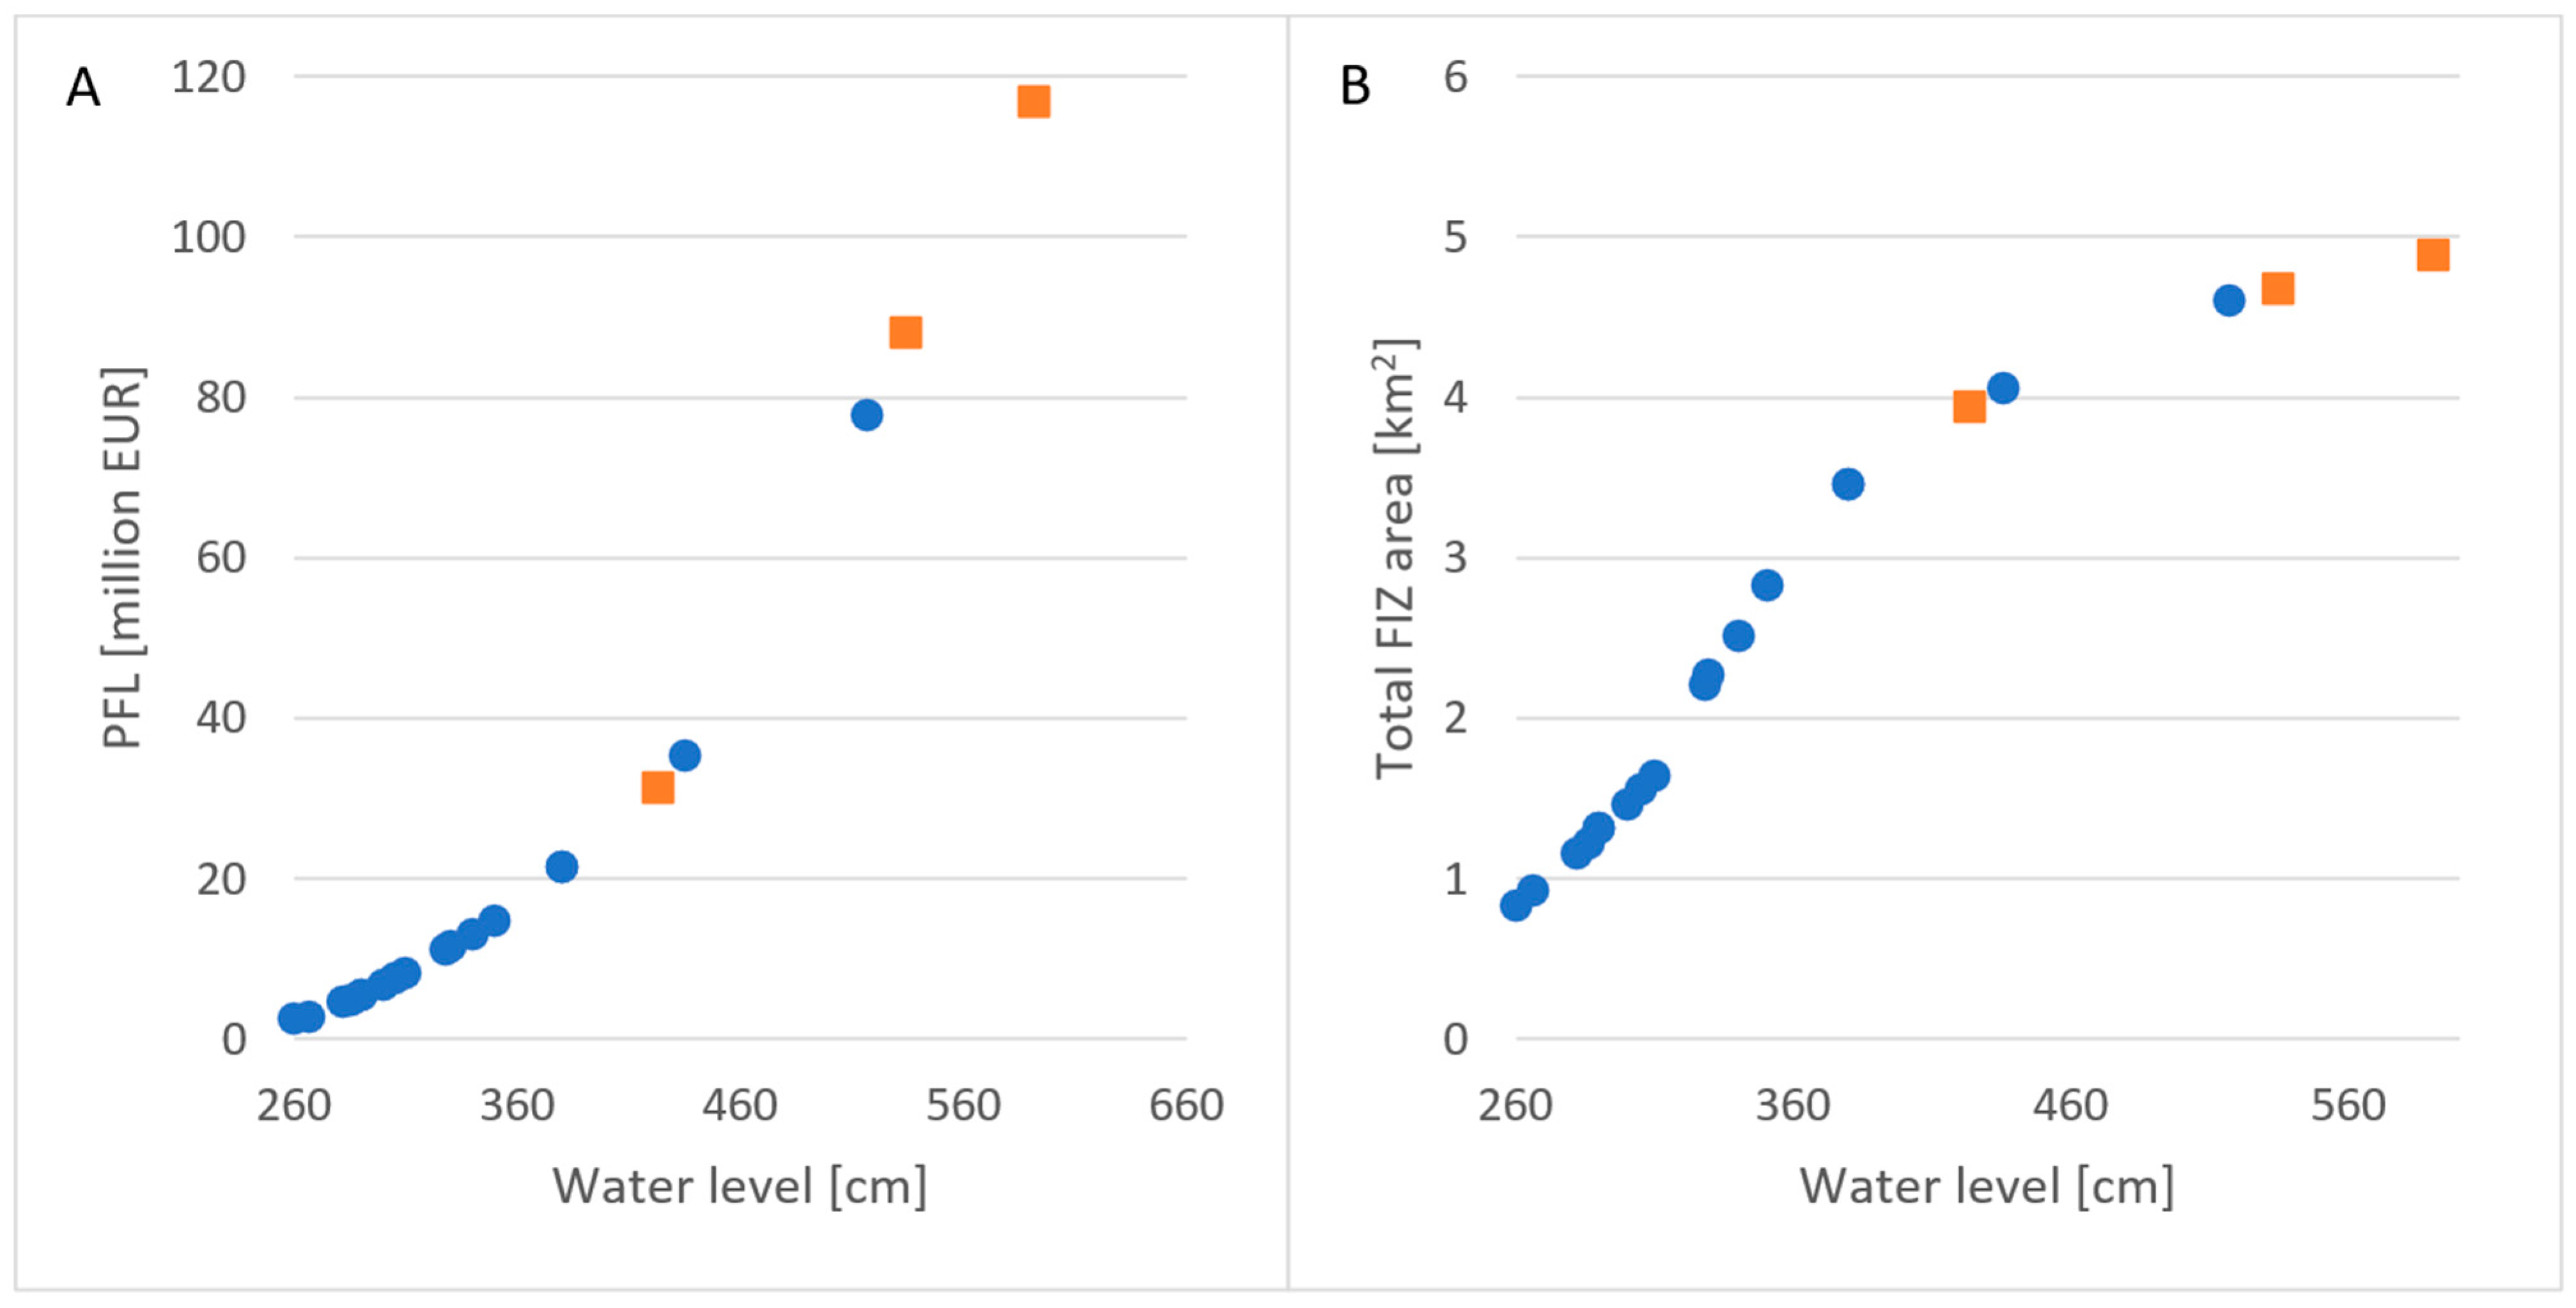
The data comparison shows that in the analyzed period there were only two historical summer flood events exceeding the level of a 10-year flood, while the level of a 100-year flood has never been reached (Figure 4). The PFL value is exponentially rising with water level, while the FIZ area is also rising, but there is an inflection point. These findings will be discussed later.
3.2. Synchronicity of Rainfall and PFL
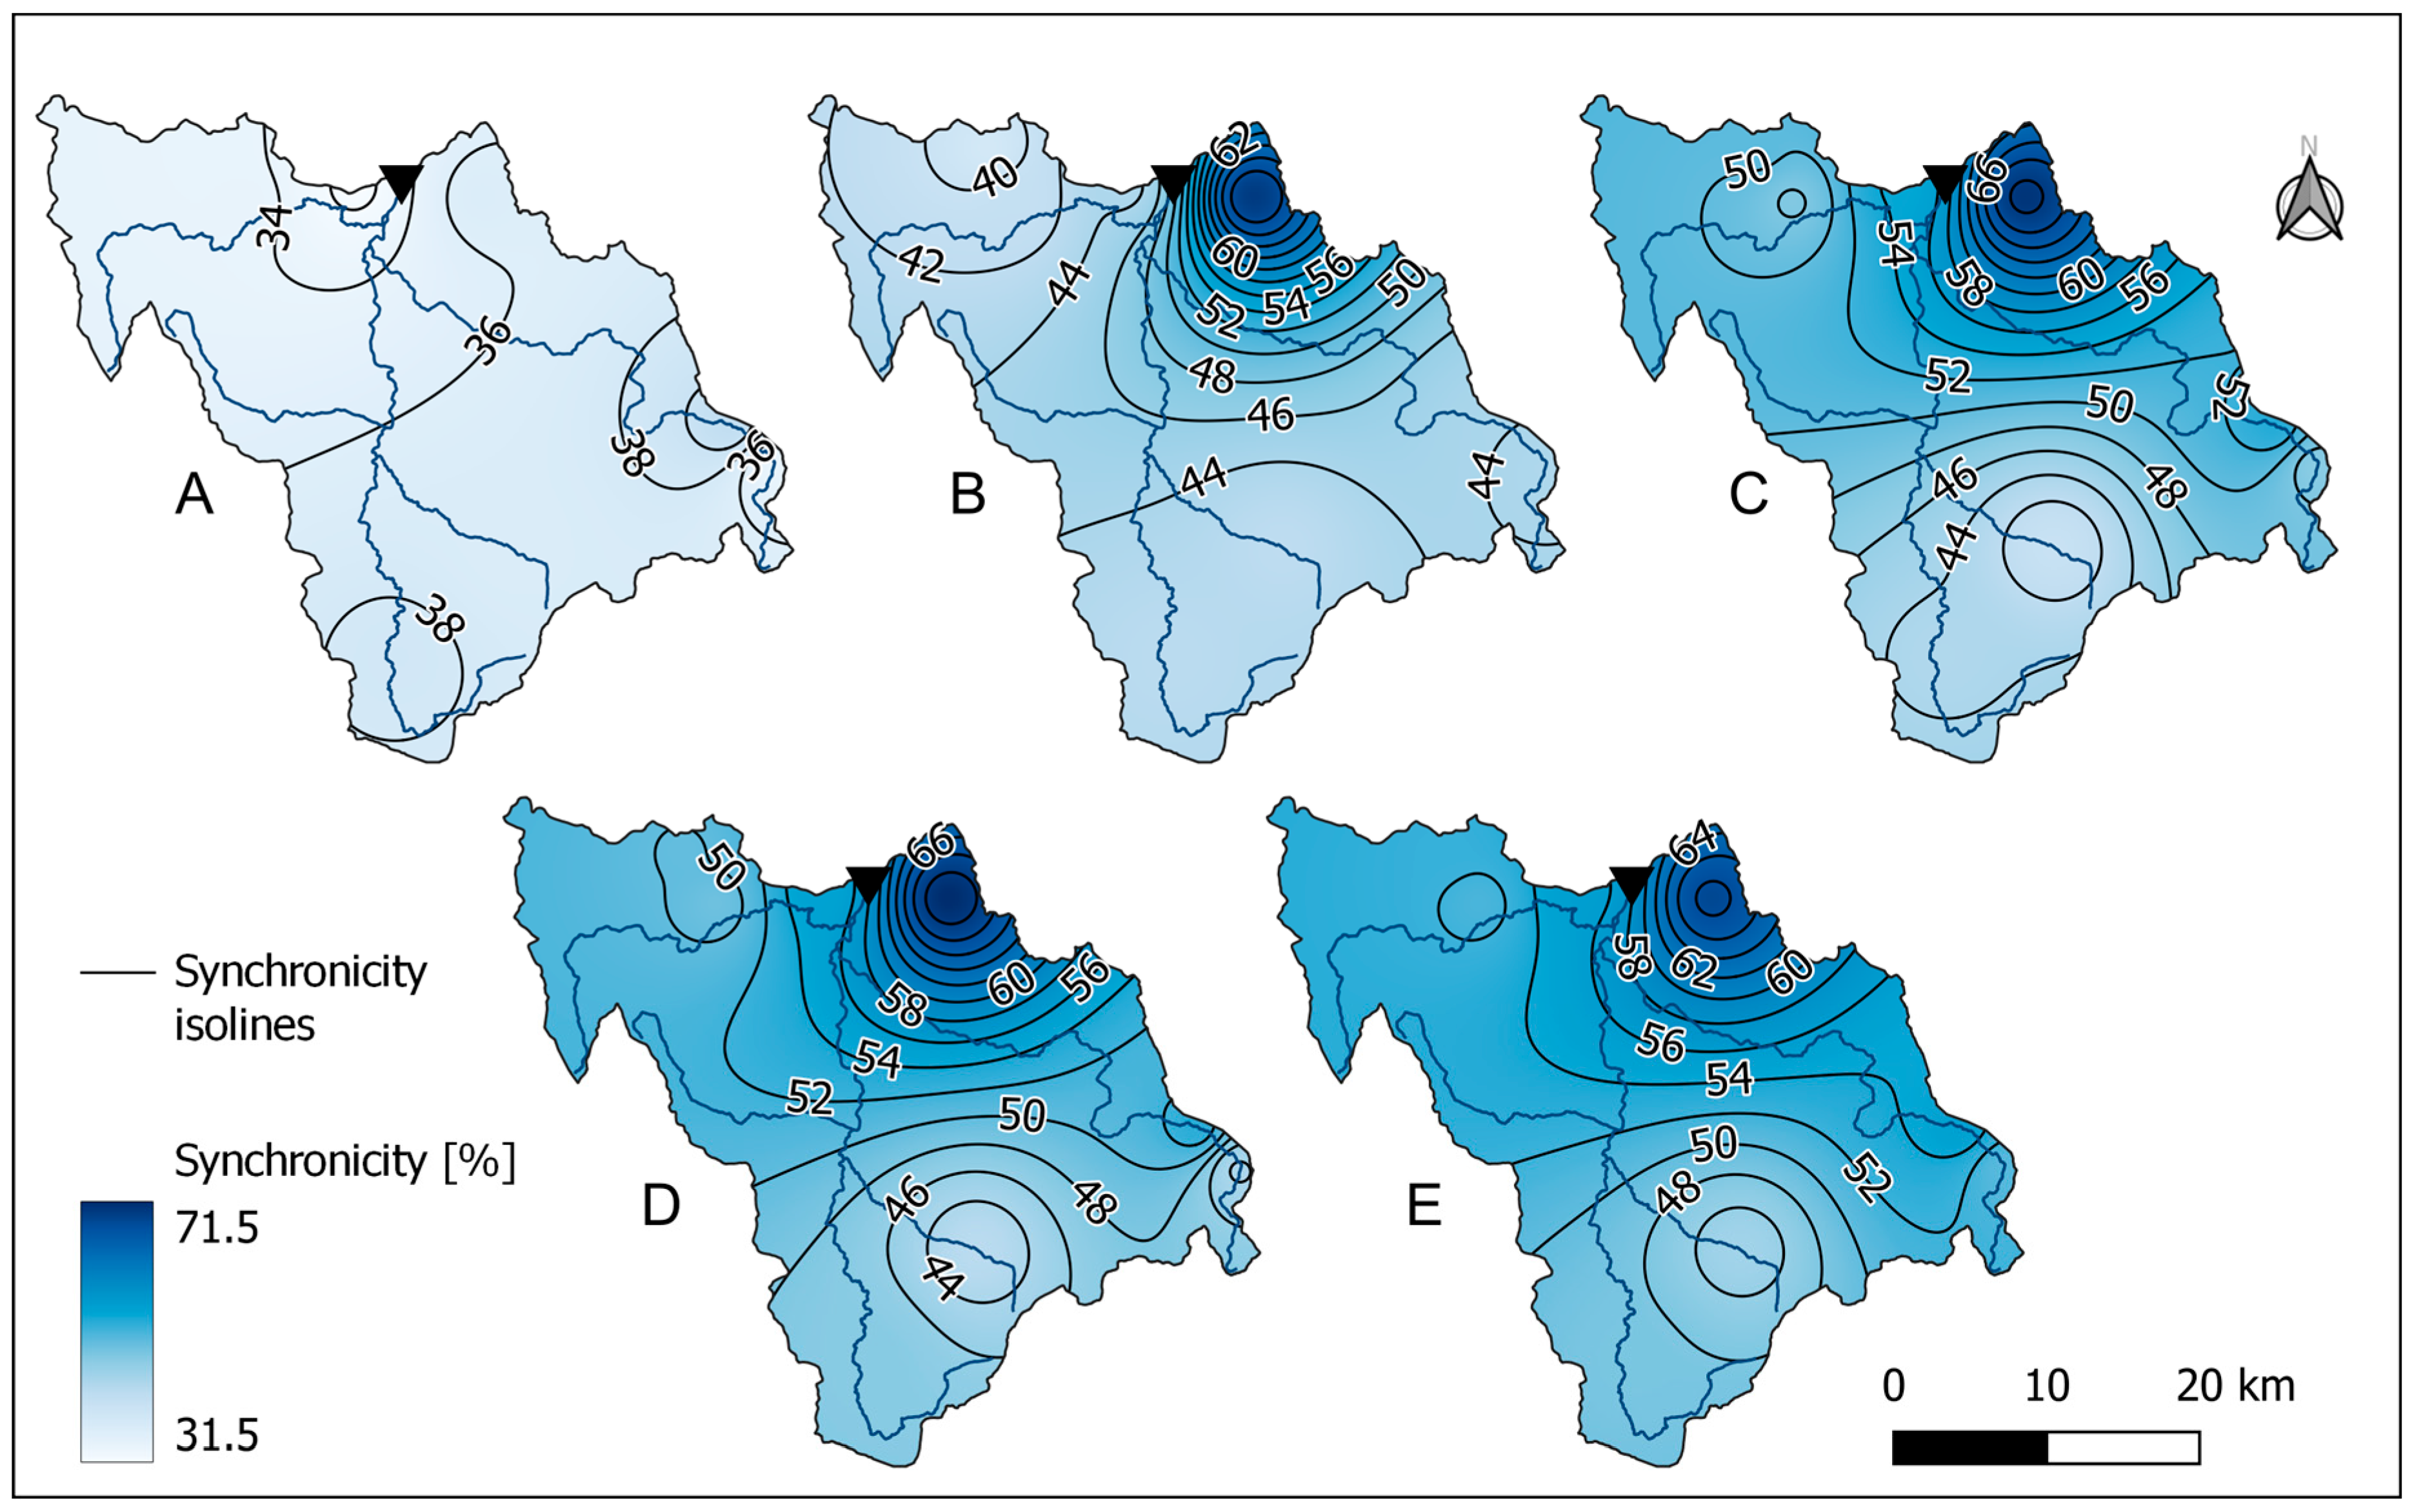
The probability of the synchronous occurrence of rainfall and PFL in Kłodzko town was calculated for five variants of rainfall sums, from 24 to 120 h (Figure 5A–E). In general, synchronicity between rainfall and PFL is the lowest when R24 is considered (Figure 5A), and the longer the aggregation period of rainfall, the higher the synchronicity (Figure 5B–E).
The synchronicity between R24 and PFL (Figure 5A) ranged from 31.6 (Kłodzko) to 41.5% (Nowy Gierałtów), so the relation between PFL and R24 is asynchronous. Taking into account that in the analysis the biggest floods are considered, this can be explained by the fact that such events are not usually caused by one-day rainfall. In terms of the relation between R48 and PFL (Figure 5B), the highest synchronicity was calculated for the Podzamek precipitation gauge (70%), while for other gauges the synchronicity did not exceed 45%, so it was higher than in the R24 variant (Figure 5A); however, the relation was still mostly asynchronous. For data pair R72 and PFL (Figure 5C), the synchronicity ranged from 40.3 (Międzygórze) to 70.6% (Podzamek).
The synchronicity is higher than for R24 and R48 for precipitation gauges located in the Biała Lądecka and Bystrzyca Dusznicka river catchments, but the relation between PFL and rainfall in the upper section of the NKR is asynchronous. For variant R96 and PFL (Figure 5D), the synchronicity ranged from 42.4 (Międzygórze) to 71.4% (Podzamek)—the result for the Podzamek precipitation gauge in this variant is the highest among all the analyzed variants. A quite similar, spatially, situation characterizes the R120 and PFL variant (Figure 5E), in which synchronicity ranged from 44.8 (Międzygórze) to 68.5% (Podzamek). The southern part of the NKR catchment is asynchronous (Międzylesie and Międzygórze precipitation gauges) and is close to 50–55% for precipitation gauges located on tributaries of the NKR (the Biała Lądecka and Bystrzyca Dusznicka rivers).
4. Discussion and Conclusions
The aim of this research was to assess the relationship between potential losses caused by significant floods in Kłodzko town, triggered by rainfall in the upper NKR catchment. It was analyzed using five variants, regarding different periods of rainfall aggregation (from 24 to 120 h) and in terms of the probability of synchronous occurrence. The lowest synchronicity across the entire upper NKR catchment was measured for the R24 variant (Figure 5A). Such a result was expected, because floods such as the analyzed ones, in most cases, are not caused by one-day rainfall—in several cases, during the 24 h before the flood peak in Kłodzko town, the rainfall was not recorded in all the studied precipitation gauges. In other cases (i.e., for R48, R72, R96 and R120), the synchronicity was spatially differentiated (Figure 5B–E); however, the highest value was always determined for the Podzamek precipitation gauge, and the lowest for the Międzygórze precipitation gauge (with one exception, variant R48—PFL, in which the lowest synchronicity was calculated for the Chocieszów precipitation gauge).
Both calculated PFL and FIZ increase with an increasing water level, but in the case of PFL, the increase is exponential, while the FIZ area shows an inflection point in the graph (Figure 4). This is a consequence of the selected PFL estimation method (it depends on the range and type of flooded area and depth of flooding, while, e.g., flood wave duration is not taken into account) and the topography of the Kłodzko town area, which is located in the mountain river valley; thus, the rising water mainly causes an increase in the depth of the flood in the already-inundated area.
The results obtained are in-line with our previous research [62], especially for variants R96 and R120. For the corresponding variants in [62], as well as for rainfall data from the Podzamek precipitation gauge, the synchronicity with the flood peak flow (FPQ) was the highest, although its maximum was around 53.5%, while the synchronicity of rainfall with PFL reached 71.4%. However, in the aforementioned research, another flood data set was analyzed (all floods exceeding the 99th percentile). Additionally, in this study, PFL was based on water level, while in the previous research our analysis was based on discharge (Q). Nevertheless, both studies confirm a significant correlation between floods in Kłodzko town and precipitation measured at the Podzamek gauge.
Regarding the floods selected in this research, it should also be emphasized that at the Kłodzko water gauge in the multi-annual period 1971–2021 (i.e., within 51 years), flood waves exceeding the ’10-year’ water level (i.e., with probability of exceedance p = 10%) were recorded only twice, and the 100-year water level (p = 1%) has never been reached. As mentioned in Section 2.1, the 1997 flood in the Odra River basin is called the “Millennium Flood” or the “Great Flood”, when unit outflow reached 1300 L·s−1·km−2 and the historic water level was exceeded by 70 cm [69]. It was an unprecedented in modern history, catastrophic event. Taking it into calculations of the probable maximum flows may lead to overestimation of the theoretical flood water levels. Both overestimation and underestimation of probable flood events is misleading, because in the first case it may result in excessive construction and maintenance costs of flood protection infrastructure, and in the second in the failure of flood protection infrastructure [84]. Such situations will also appear more and more frequently due to climate change, because it may both lead to increases or decreases in European river floods [16], also in Poland, where statistically significant trends in the observed river floods have been identified [19].
The proposed methodology considers only summer floods caused by rainfall, but in the mountains snowmelts can also pose a significant threat to the local communities. Thus, these should also be taken into account to fully understand the flood hazard and risk in such areas. As is mentioned in other studies (e.g., [85,86,87]), results obtained by applying the copula-based methods are subject to uncertainty, so techniques for these methods’ quantification still need to be developed. In terms of the flood losses estimation, a methodology should be developed to also incorporate other flood wave characteristics, such as flood duration, flood water volume and velocity. A comprehensive review of existing flood hazard-assessment methods is presented in [88], and some of them could be incorporated into the PFL estimation.
In conclusion, the introduced methods allow analysis of the spatio-temporal relationships of precipitation and flood risk (in this study, expressed as PFL). The obtained results indicate that (1) the relation between PFL in Kłodzko and 24 h rainfall preceding the flood peak for all precipitation stations is asynchronous, (2) there is a high synchronicity of PFL and cumulative rainfall in the Podzamek station from 48 to 120 h before a flood event, and (3) the probable floods in Kłodzko may be overestimated due to the occurrence of the catastrophic flood of July 1997. These findings can be helpful in preparing and adjusting flood warning systems or planning flood protection measures and infrastructure. As mentioned above, future research should focus on including snowmelt floods into the presented methodology, incorporating quantitative uncertainty estimations, developing PFL calculation methods which not only include depth of flooding, and assessing the impact of climate change on flood risk. Another interesting research topic is an assessment of the possible under- or overestimation of probable floods, e.g., due to the occurrence of catastrophic events in the past or resulting from the predicted climate change.
Author Contributions
Conceptualization, A.P., D.W. and W.W.B.; methodology, A.P., D.W., W.W.B. and L.S.; software, A.P.; validation, A.P.; formal analysis, A.P.; investigation, A.P. and D.W.; resources, A.P. and D.W.; data curation, A.P. and D.W.; writing—original draft preparation, A.P.; writing—review and editing, A.P., D.W., W.W.B. and L.S.; visualization, A.P.; supervision, D.W., W.W.B. and A.P.; project administration, A.P.; funding acquisition, D.W., L.S. and A.P. All authors have read and agreed to the published version of the manuscript.
Funding
The research was carried out under the “GEO-INTER-APLIKACJE” project (No. POWR.03.02.00–00-I027/17) implemented at the Faculty of Geographical and Geological Sciences of Adam Mickiewicz University in Poznań, Poland. Adam Perz has been granted by scholarship of the Adam Mickiewicz University Foundation and the Kulczyk Foundation for the academic year 2022/2023.
Data Availability Statement
Data available on request due to restrictions e.g., privacy or ethical. The data presented in this study are available on request from the corresponding author.
Acknowledgments
The authors acknowledge the help of Patryk Nowicki, Katarzyna Pędziwiatr, Olga Konieczna and Łukasz Trojnarski from Sweco Polska Sp. z o.o. in processing GIS data and potential flood losses estimation. The authors would like to thank the editors and reviewers for their comments and suggestions, which have significantly helped to improve the quality of the manuscript.
Conflicts of Interest
The authors declare no conflict of interest.
References
- European Parliament. FD 2007/60/EC, Directive of the European Parliament and Council of 23 October, 2007 on the Assessment and Management of Flood Risks, Official Journal L 288, 6 November 2007. Available online: https://eur-lex.europa.eu/legal-content/EN/TXT/PDF/?uri=CELEX:32019L1937 (accessed on 10 February 2023).
- Graf, R. Flood risk management system in Poland. In Management of Water Resources in Poland; Zeleňáková, M., Kubiak-Wójcicka, K., Negm, A.M., Eds.; Springer Water: Cham, Switzerland, 2021; pp. 281–304. [Google Scholar] [CrossRef]
- Kundzewicz, Z.W.; Hegger, D.L.T.; Matczak, P.; Driessen, P.P.J. Flood-Risk Reduction: Structural Measures and Diverse Strategies. Proc. Natl. Acad. Sci. USA 2018, 115, 12321–12325. [Google Scholar] [CrossRef] [PubMed]
- Matczak, P.; Hegger, D. Improving Flood Resilience through Governance Strategies: Gauging the State of the Art. Wiley Interdiscip. Rev. Water 2021, 8, e1532. [Google Scholar] [CrossRef]
- Driessen, P.P.J.; Hegger, D.L.T.; Kundzewicz, Z.W.; van Rijswick, H.F.M.W.; Crabbé, A.; Larrue, C.; Matczak, P.; Pettersson, M.; Priest, S.; Suykens, C.; et al. Governance Strategies for Improving Flood Resilience in the Face of Climate Change. Water 2018, 10, 1595. [Google Scholar] [CrossRef]
- Blöschl, G.; Kiss, A.; Viglione, A.; Barriendos, M.; Böhm, O.; Brázdil, R.; Coeur, D.; Demarée, G.; Llasat, M.C.; Macdonald, N.; et al. Current European Flood-Rich Period Exceptional Compared with Past 500 Years. Nature 2020, 583, 560–566. [Google Scholar] [CrossRef]
- Fang, G.; Yang, J.; Li, Z.; Chen, Y.; Duan, W.; Amory, C.; Maeyer, P.D. Shifting in the Global Flood Timing. Sci. Rep. 2022, 12, 18853. [Google Scholar] [CrossRef]
- Paprotny, D.; Sebastian, A.; Morales-Nápoles, O.; Jonkman, S.N. Trends in Flood Losses in Europe over the Past 150 Years. Nat. Commun. 2018, 9, 1985. [Google Scholar] [CrossRef]
- Lehner, B.; Döll, P.; Alcamo, J.; Henrichs, T.; Kaspar, F. Estimating the Impact of Global Change on Flood and Drought Risks in Europe: A Continental, Integrated Analysis. Clim. Chang. 2006, 75, 273–299. [Google Scholar] [CrossRef]
- Dankers, R.; Feyen, L. Climate Change Impact on Flood Hazard in Europe: An Assessment Based on High-resolution Climate Simulations. J. Geophys. Res. Atmos. 2008, 113, D19105. [Google Scholar] [CrossRef]
- Kundzewicz, Z.W.; Pińskwar, I.; Brakenridge, G.R. Large Floods in Europe, 1985–2009. Hydrol. Sci. J. 2013, 58, 1–7. [Google Scholar] [CrossRef]
- Alfieri, L.; Burek, P.; Feyen, L.; Forzieri, G. Global Warming Increases the Frequency of River Floods in Europe. Hydrol. Earth Syst. Sci. 2015, 19, 2247–2260. [Google Scholar] [CrossRef]
- Kundzewicz, Z.W.; Pińskwar, I.; Brakenridge, G.R. Changes in River Flood Hazard in Europe: A Review. Hydrol. Res. 2018, 49, 294–302. [Google Scholar] [CrossRef]
- IPCC. Synthesis Report of the IPCC Sixth Assessment Report (AR6) Summary for Policymakers; IPCC: Geneva, Switzerland, 2023. [Google Scholar]
- Paprotny, D.; Morales-Nápoles, O. Estimating Extreme River Discharges in Europe through a Bayesian Network. Hydrol. Earth Syst. Sci. 2017, 21, 2615–2636. [Google Scholar] [CrossRef]
- Blöschl, G.; Hall, J.; Viglione, A.; Perdigão, R.A.P.; Parajka, J.; Merz, B.; Lun, D.; Arheimer, B.; Aronica, G.T.; Bilibashi, A.; et al. Changing Climate Both Increases and Decreases European River Floods. Nature 2019, 573, 108–111. [Google Scholar] [CrossRef]
- Bertola, M.; Viglione, A.; Lun, D.; Hall, J.; Blöschl, G. Flood Trends in Europe: Are Changes in Small and Big Floods Different? Hydrol. Earth Syst. Sci. 2020, 24, 1805–1822. [Google Scholar] [CrossRef]
- Rutgersson, A.; Kjellström, E.; Haapala, J.; Stendel, M.; Danilovich, I.; Drews, M.; Jylhä, K.; Kujala, P.; Larsén, X.G.; Halsnæs, K.; et al. Natural Hazards and Extreme Events in the Baltic Sea Region. Earth Syst. Dyn. 2021, 13, 251–301. [Google Scholar] [CrossRef]
- Venegas-Cordero, N.; Kundzewicz, Z.W.; Jamro, S.; Piniewski, M. Detection of Trends in Observed River Floods in Poland. J. Hydrol. Reg. Stud. 2022, 41, 101098. [Google Scholar] [CrossRef]
- Kundzewicz, Z.W.; Pińskwar, I. Are Pluvial and Fluvial Floods on the Rise? Water 2022, 14, 2612. [Google Scholar] [CrossRef]
- Alifu, H.; Hirabayashi, Y.; Imada, Y.; Shiogama, H. Enhancement of River Flooding Due to Global Warming. Sci. Rep. 2022, 12, 20687. [Google Scholar] [CrossRef]
- Tarasova, L.; Lun, D.; Merz, R.; Blöschl, G.; Basso, S.; Bertola, M.; Miniussi, A.; Rakovec, O.; Samaniego, L.; Thober, S.; et al. Shifts in Flood Generation Processes Exacerbate Regional Flood Anomalies in Europe. Commun. Earth Environ. 2023, 4, 49. [Google Scholar] [CrossRef]
- Dottori, F.; Szewczyk, W.; Ciscar, J.-C.; Zhao, F.; Alfieri, L.; Hirabayashi, Y.; Bianchi, A.; Mongelli, I.; Frieler, K.; Betts, R.A.; et al. Increased Human and Economic Losses from River Flooding with Anthropogenic Warming. Nat. Clim. Chang. 2018, 8, 781–786. [Google Scholar] [CrossRef]
- Jongman, B.; Hochrainer-Stigler, S.; Feyen, L.; Aerts, J.C.J.H.; Mechler, R.; Botzen, W.J.W.; Bouwer, L.M.; Pflug, G.; Rojas, R.; Ward, P.J. Increasing Stress on Disaster-Risk Finance Due to Large Floods. Nat. Clim. Chang. 2014, 4, 264–268. [Google Scholar] [CrossRef]
- Koks, E.E.; Thissen, M.; Alfieri, L.; Moel, H.D.; Feyen, L.; Jongman, B.; Aerts, J.C.J.H. The Macroeconomic Impacts of Future River Flooding in Europe. Environ. Res. Lett. 2019, 14, 084042. [Google Scholar] [CrossRef]
- Kundzewicz, Z.W.; Kanae, S.; Seneviratne, S.I.; Handmer, J.; Nicholls, N.; Peduzzi, P.; Mechler, R.; Bouwer, L.M.; Arnell, N.; Mach, K.; et al. Flood Risk and Climate Change: Global and Regional Perspectives. Hydrol. Sci. J. 2014, 59, 1–28. [Google Scholar] [CrossRef]
- Dolejš, M.; Raška, P.; Kohnová, S.; Schinke, R.; Warachowska, W.; Thaler, T.; Kočický, D. On the Right Track of Flood Planning Policy? Land Uptake in Central-European Floodplains (1990–2018). Landsc. Urban Plan 2022, 228, 104560. [Google Scholar] [CrossRef]
- Merz, B.; Blöschl, G.; Vorogushyn, S.; Dottori, F.; Aerts, J.C.J.H.; Bates, P.; Bertola, M.; Kemter, M.; Kreibich, H.; Lall, U.; et al. Causes, Impacts and Patterns of Disastrous River Floods. Nat. Rev. Earth Environ. 2021, 2, 592–609. [Google Scholar] [CrossRef]
- Löschner, L.; Herrnegger, M.; Apperl, B.; Senoner, T.; Seher, W.; Nachtnebel, H.P. Flood Risk, Climate Change and Settlement Development: A Micro-Scale Assessment of Austrian Municipalities. Reg. Environ. Chang. 2017, 17, 311–322. [Google Scholar] [CrossRef]
- Serinaldi, F.; Kilsby, C.G. A Blueprint for Full Collective Flood Risk Estimation: Demonstration for European River Flooding. Risk Anal. 2016, 37, 1958–1976. [Google Scholar] [CrossRef]
- de Moel, H.; Aerts, J.C.J.H. Effect of Uncertainty in Land Use, Damage Models and Inundation Depth on Flood Damage Estimates. Nat. Hazards 2011, 58, 407–425. [Google Scholar] [CrossRef]
- Ozga-Zielinski, B.; Adamowski, J.; Ciupak, M. Applying the Theory of Reliability to the Assessment of Hazard, Risk and Safety in a Hydrologic System: A Case Study in the Upper Sola River Catchment, Poland. Water 2018, 10, 723. [Google Scholar] [CrossRef]
- Dottori, F.; Kalas, M.; Salamon, P.; Bianchi, A.; Alfieri, L.; Feyen, L. An Operational Procedure for Rapid Flood Risk Assessment in Europe. Nat. Hazard Earth Syst. Sci. 2017, 17, 1111–1126. [Google Scholar] [CrossRef]
- Albrecher, H.; Kortschak, D.; Prettenthaler, F. Spatial Dependence Modeling of Flood Risk Using Max-Stable Processes: The Example of Austria. Water 2020, 12, 1805. [Google Scholar] [CrossRef]
- Amadio, M.; Scorzini, A.R.; Carisi, F.; Essenfelder, A.H.; Domeneghetti, A.; Mysiak, J.; Castellarin, A. Testing Empirical and Synthetic Flood Damage Models: The Case of Italy. Nat. Hazard Earth Syst. Sci. 2019, 19, 661–678. [Google Scholar] [CrossRef]
- Ha, J.; Kang, J.E. Assessment of Flood-Risk Areas Using Random Forest Techniques: Busan Metropolitan City. Nat. Hazards 2022, 111, 2407–2429. [Google Scholar] [CrossRef]
- van der Pol, T.D.; van Ierland, E.C.; Gabbert, S. Economic Analysis of Adaptive Strategies for Flood Risk Management under Climate Change. Mitig. Adapt. Strat. Glob. Chang. 2017, 22, 267–285. [Google Scholar] [CrossRef]
- Hudson, P.; Botzen, W.J.W. Cost–Benefit Analysis of Flood-zoning Policies: A Review of Current Practice. Wiley Interdiscip. Rev. Water 2019, 6, e1387. [Google Scholar] [CrossRef]
- Ventimiglia, U.; Candela, A.; Aronica, G.T. A Cost Efficiency Analysis of Flood Proofing Measures for Hydraulic Risk Mitigation in an Urbanized Riverine Area. Water 2020, 12, 2395. [Google Scholar] [CrossRef]
- Jiang, X.; Yang, L.; Tatano, H. Assessing Spatial Flood Risk from Multiple Flood Sources in a Small River Basin: A Method Based on Multivariate Design Rainfall. Water 2019, 11, 1031. [Google Scholar] [CrossRef]
- Prabaswara, M.H.M.A.; Wickramaarachchi, T.N. Event-Based Rainfall-Runoff Simulation Using Different Precipitation Loss Methods: Case Study in Tropical Monsoon Catchment. Sustain. Water Resour. Manag. 2023, 9, 16. [Google Scholar] [CrossRef]
- Wei, H.; Yu, T.; Tu, J.; Ke, F. Detection and Evaluation of Flood Inundation Using CYGNSS Data during Extreme Precipitation in 2022 in Guangdong Province, China. Remote Sens. 2023, 15, 297. [Google Scholar] [CrossRef]
- Szewrański, S.; Chruściński, J.; Kazak, J.; Świąder, M.; Tokarczyk-Dorociak, K.; Żmuda, R. Pluvial Flood Risk Assessment Tool (PFRA) for Rainwater Management and Adaptation to Climate Change in Newly Urbanised Areas. Water 2018, 10, 386. [Google Scholar] [CrossRef]
- Szeląg, B.; Suligowski, R.; Łagód, G.; Łazuka, E.; Wlaź, P.; Stránský, D.; Paola, F.D.; Fatone, F. Flood Occurrence Analysis in Small Urban Catchments in the Context of Regional Variability. PLoS ONE 2022, 17, e0276312. [Google Scholar] [CrossRef] [PubMed]
- Essenfelder, A.H.; Bagli, S.; Mysiak, J.; Pal, J.S.; Mercogliano, P.; Reder, A.; Rianna, G.; Mazzoli, P.; Broccoli, D.; Luzzi, V. Probabilistic Assessment of Pluvial Flood Risk Across 20 European Cities: A Demonstrator of the Copernicus Disaster Risk Reduction Service for Pluvial Flood Risk in Urban Areas. Water Econ. Policy 2022, 8, 2240007. [Google Scholar] [CrossRef]
- Wei, L.; Hu, K.; Hu, X. Rainfall Occurrence and Its Relation to Flood Damage in China from 2000 to 2015. J. Mt. Sci. 2018, 15, 2492–2504. [Google Scholar] [CrossRef]
- Rashid, M.M.; Wahl, T.; Villarini, G.; Sharma, A. Fluvial Flood Losses in the Contiguous United States Under Climate Change. Earths Future 2023, 11, e2022EF003328. [Google Scholar] [CrossRef]
- Zhang, Q.; Li, J.; Singh, V.P. Application of Archimedean Copulas in the Analysis of the Precipitation Extremes: Effects of Precipitation Changes. Theor. Appl. Climatol. 2012, 107, 255–264. [Google Scholar] [CrossRef]
- Guan, X.; Dong, Z.; Luo, Y.; Zhong, D. Multi-Objective Optimal Allocation of River Basin Water Resources under Full Probability Scenarios Considering Wet–Dry Encounters: A Case Study of Yellow River Basin. Int. J. Environ. Res. Public Health 2021, 18, 11652. [Google Scholar] [CrossRef]
- Qian, L.; Wang, X.; Hong, M.; Dang, S.; Wang, H. Encounter Risk Prediction of Rich-Poor Precipitation Using a Combined Copula. Theor. Appl. Climatol. 2022, 149, 1057–1067. [Google Scholar] [CrossRef]
- Zhang, J.; Ding, Z.; You, J. The Joint Probability Distribution of Runoff and Sediment and Its Change Characteristics with Multi-Time Scales. J. Hydrol. Hydromech. 2014, 62, 218–225. [Google Scholar] [CrossRef]
- You, Q.; Jiang, H.; Liu, Y.; Liu, Z.; Guan, Z. Probability Analysis and Control of River Runoff–Sediment Characteristics Based on Pair-Copula Functions: The Case of the Weihe River and Jinghe River. Water 2019, 11, 510. [Google Scholar] [CrossRef]
- Qian, L.; Dang, S.; Bai, C.; Wang, H. Variation in the Dependence Structure between Runoff and Sediment Discharge Using an Improved Copula. Theor. Appl. Climatol. 2021, 145, 285–293. [Google Scholar] [CrossRef]
- Plewa, K.; Perz, A.; Wrzesiński, D.; Sobkowiak, L. Probabilistic Assessment of Correlations of Water Levels in Polish Coastal Lakes with Sea Water Level with the Application of Archimedean Copulas. Water 2019, 11, 1292. [Google Scholar] [CrossRef]
- Gu, H.; Yu, Z.; Li, G.; Ju, Q. Nonstationary Multivariate Hydrological Frequency Analysis in the Upper Zhanghe River Basin, China. Water 2018, 10, 772. [Google Scholar] [CrossRef]
- Mitkova, V.B.; Halmova, D. Analysis of The Joint Impact of Synchronous Discharges in Estimating the Flood Risk: Case Study on Hron River. IOP Conf. Ser. Earth Environ. Sci. 2019, 221, 012034. [Google Scholar] [CrossRef]
- Perz, A.; Sobkowiak, L.; Wrzesiński, D. Spatial Differentiation of the Maximum River Runoff Synchronicity in the Warta River Catchment, Poland. Water 2020, 12, 1782. [Google Scholar] [CrossRef]
- Sobkowiak, L.; Perz, A.; Wrzesiński, D.; Faiz, M.A. Estimation of the River Flow Synchronicity in the Upper Indus River Basin Using Copula Functions. Sustainability 2020, 12, 5122. [Google Scholar] [CrossRef]
- Xu, Y.; Lu, F.; Zhou, Y.; Ruan, B.; Dai, Y.; Wang, K. Dryness–Wetness Encounter Probabilities’ Analysis for Lake Ecological Water Replenishment Considering Non-Stationarity Effects. Front. Environ. Sci. 2022, 10, 806794. [Google Scholar] [CrossRef]
- Perz, A.; Sobkowiak, L.; Wrzesiński, D. Probabilistic Approach to Precipitation-Runoff Relation in a Mountain Catchment: A Case Study of the Kłodzka Valley in Poland. Water 2021, 13, 1229. [Google Scholar] [CrossRef]
- Perz, A.; Sobkowiak, L.; Wrzesiński, D. Co-Occurrence Probability of Water Balance Elements in a Mountain Catchment on the Example of the Upper Nysa Kłodzka River. Acta Geophys. 2022, 70, 1301–1315. [Google Scholar] [CrossRef]
- Perz, A.; Wrzesiński, D.; Sobkowiak, L.; Stodolak, R. Copula-Based Geohazard Assessment—Case of Flood-Prone Area in Poland. J. Hydrol. Reg. Stud. 2022, 44, 101214. [Google Scholar] [CrossRef]
- Wang, S.; Zhong, P.-A.; Zhu, F.; Xu, C.; Wang, Y.; Liu, W. Analysis and Forecasting of Wetness-Dryness Encountering of a Multi-Water System Based on a Vine Copula Function-Bayesian Network. Water 2022, 14, 1701. [Google Scholar] [CrossRef]
- Bartnik, A.; Jokiel, P. Geografia Wezbrań i Powodzi Rzecznych; Wydawnictwo Uniwersytetu Łódzkiego: Łódź, Poland, 2012. [Google Scholar] [CrossRef]
- Jokiel, P.; Bartnik, A. Wezbrania i powodzie. In Hydrologia Polski; Jokiel, P., Marszelewski, W., Pociask-Karteczka, J., Eds.; Wydawnictwo Naukowe PWN: Warszawa, Poland, 2017; pp. 167–175. ISBN 978-83-01-19379-9. (In Polish) [Google Scholar]
- Magnuszewski, A. Flood potential of Polish rivers. In Management of Water Resources in Poland; Zeleňáková, M., Kubiak-Wójcicka, K., Negm, A.M., Eds.; Springer Water: Cham, Switzerland, 2021; pp. 269–280. [Google Scholar] [CrossRef]
- Wrzesiński, D. Uncertainty of Flow Regime Characteristics of Rivers in Europe. Quaest. Geogr. 2013, 32, 43–53. [Google Scholar] [CrossRef]
- Pociask-Karteczka, J.; Kundzewicz, Z.W.; Twardosz, R.; Rajwa-Kuligiewicz, A. Natural hazards in Poland. In Exploring Natural Hazards: A Case Study Approach; Bartlett, D., Singh, R.P., Eds.; Chapman and Hall/CRC: New York, NY, USA, 2018; pp. 317–345. [Google Scholar] [CrossRef]
- Kundzewicz, Z.W.; Szamałek, K.; Kowalczak, P. The Great Flood of 1997 in Poland. Hydrol. Sci. J. 2009, 44, 855–870. [Google Scholar] [CrossRef]
- Kundzewicz, Z.W. (Ed.) Changes in Flood Risk in Europe—IAHS Special Publication 10; IAHS Press: Oxfordshire, UK, 2012. [Google Scholar] [CrossRef]
- Bednorz, E.; Wrzesiński, D.; Tomczyk, A.M.; Jasik, D. Classification of Synoptic Conditions of Summer Floods in Polish Sudeten Mountains. Water 2019, 11, 1450. [Google Scholar] [CrossRef]
- Dumieński, G.; Mruklik, A.; Tiukało, A.; Bedryj, M. The Comparative Analysis of the Adaptability Level of Municipalities in the Nysa Kłodzka Sub-Basin to Flood Hazard. Sustainability 2020, 12, 3003. [Google Scholar] [CrossRef]
- Głównu Urząd Statystyczny. Available online: https://demografia.stat.gov.pl/BazaDemografia/Tables.aspx (accessed on 2 April 2023).
- Richling, A.; Solon, J.; Macias, A.; Balon, J.; Borzyszkowski, J.; Kistowski, M. (Eds.) Regionalna Geografia Fizyczna Polski; Bogucki Wyd. Naukowe: Poznań, Poland, 2021; ISBN 978-83-7986-381-5. (In Polish) [Google Scholar]
- Perz, A. Characteristics of the Flow Regime of the Kłodzka Valley Rivers. Bad. Fizjogr. Ser. A Geogr. Fiz. 2019, 70, 65–83. (In Polish) [Google Scholar] [CrossRef]
- Czernecki, B.; Głogowski, A.; Nowosad, J. Climate: An R Package to Access Free In-Situ Meteorological and Hydrological Datasets For Environmental Assessment. Sustainability 2020, 12, 394. [Google Scholar] [CrossRef]
- ISOK. Raport z Wykonania Map Zagrożenia Powodziowego i Map Ryzyka Powodziowego. 2013. Available online: https://www.kzgw.gov.pl/files/mzp-mrp/zal1.pdf (accessed on 15 January 2023).
- State Water Holding Polish Waters. Metodyka Opracowania Map Zagrożenia Powodziowego i Map Ryzyka Powodziowego w II Cyklu Planistycznym. 2020. Available online: https://powodz.gov.pl/www/powodz/Mapy/raport%202022/aMZPiMRP%20Zal1%20Metodyka%20RZEKI%2020200617%20v7.00%20pub.pdf (accessed on 15 January 2023).
- Rozporządzenie Ministra Infrastruktury z Dnia 16 Listopada 2022 r. w Sprawie Planu Gospodarowania Wodami Na Obszarze Dorzecza Odry. Available online: https://isap.sejm.gov.pl/isap.nsf/DocDetails.xsp?id=WDU20230000335 (accessed on 15 January 2023).
- Godyń, I. A Revised Approach to Flood Damage Estimation in Flood Risk Maps and Flood Risk Management Plans, Poland. Water 2021, 13, 2713. [Google Scholar] [CrossRef]
- Akaike, H. A New Look at the Statistical Model Identification. IEEE Trans. Autom. Control 1974, 19, 716–723. [Google Scholar] [CrossRef]
- Nelsen, R.B. An Introduction to Copulas; Springer: New York, NY, USA, 1999. [Google Scholar]
- Chen, F.-W.; Liu, C.-W. Estimation of the Spatial Rainfall Distribution Using Inverse Distance Weighting (IDW) in the Middle of Taiwan. Paddy Water Environ. 2012, 10, 209–222. [Google Scholar] [CrossRef]
- Clavet-Gaumont, J.; Huard, D.; Frigon, A.; Koenig, K.; Slota, P.; Rousseau, A.; Klein, I.; Thiémonge, N.; Houdré, F.; Perdikaris, J.; et al. Probable Maximum Flood in a Changing Climate: An Overview for Canadian Basins. J. Hydrol. Reg. Stud. 2017, 13, 11–25. [Google Scholar] [CrossRef]
- Zhang, B.; Wang, S.; Wang, Y. Probabilistic Projections of Multidimensional Flood Risks at a Convection-Permitting Scale. Water Resour. Res. 2021, 57, e2020WR028582. [Google Scholar] [CrossRef]
- Fan, Y.R.; Yu, L.; Shi, X.; Duan, Q.Y. Tracing Uncertainty Contributors in the Multi-Hazard Risk Analysis for Compound Extremes. Earths Future 2021, 9, e2021EF002280. [Google Scholar] [CrossRef]
- Tootoonchi, F.; Sadegh, M.; Haerter, J.O.; Räty, O.; Grabs, T.; Teutschbein, C. Copulas for Hydroclimatic Analysis: A Practice-oriented Overview. Wiley Interdiscip. Rev. Water 2022, 9, e1579. [Google Scholar] [CrossRef]
- Maranzoni, A.; D’Oria, M.; Rizzo, C. Quantitative Flood Hazard Assessment Methods: A Review. J. Flood Risk Manag. 2022, 16, e12855. [Google Scholar] [CrossRef]
Figure 1.
Study area—location of Kłodzko town, upper NKR catchment and precipitation gauges.

Figure 2.
Visualization of steps in obtaining the final FIZ range.

Figure 3.
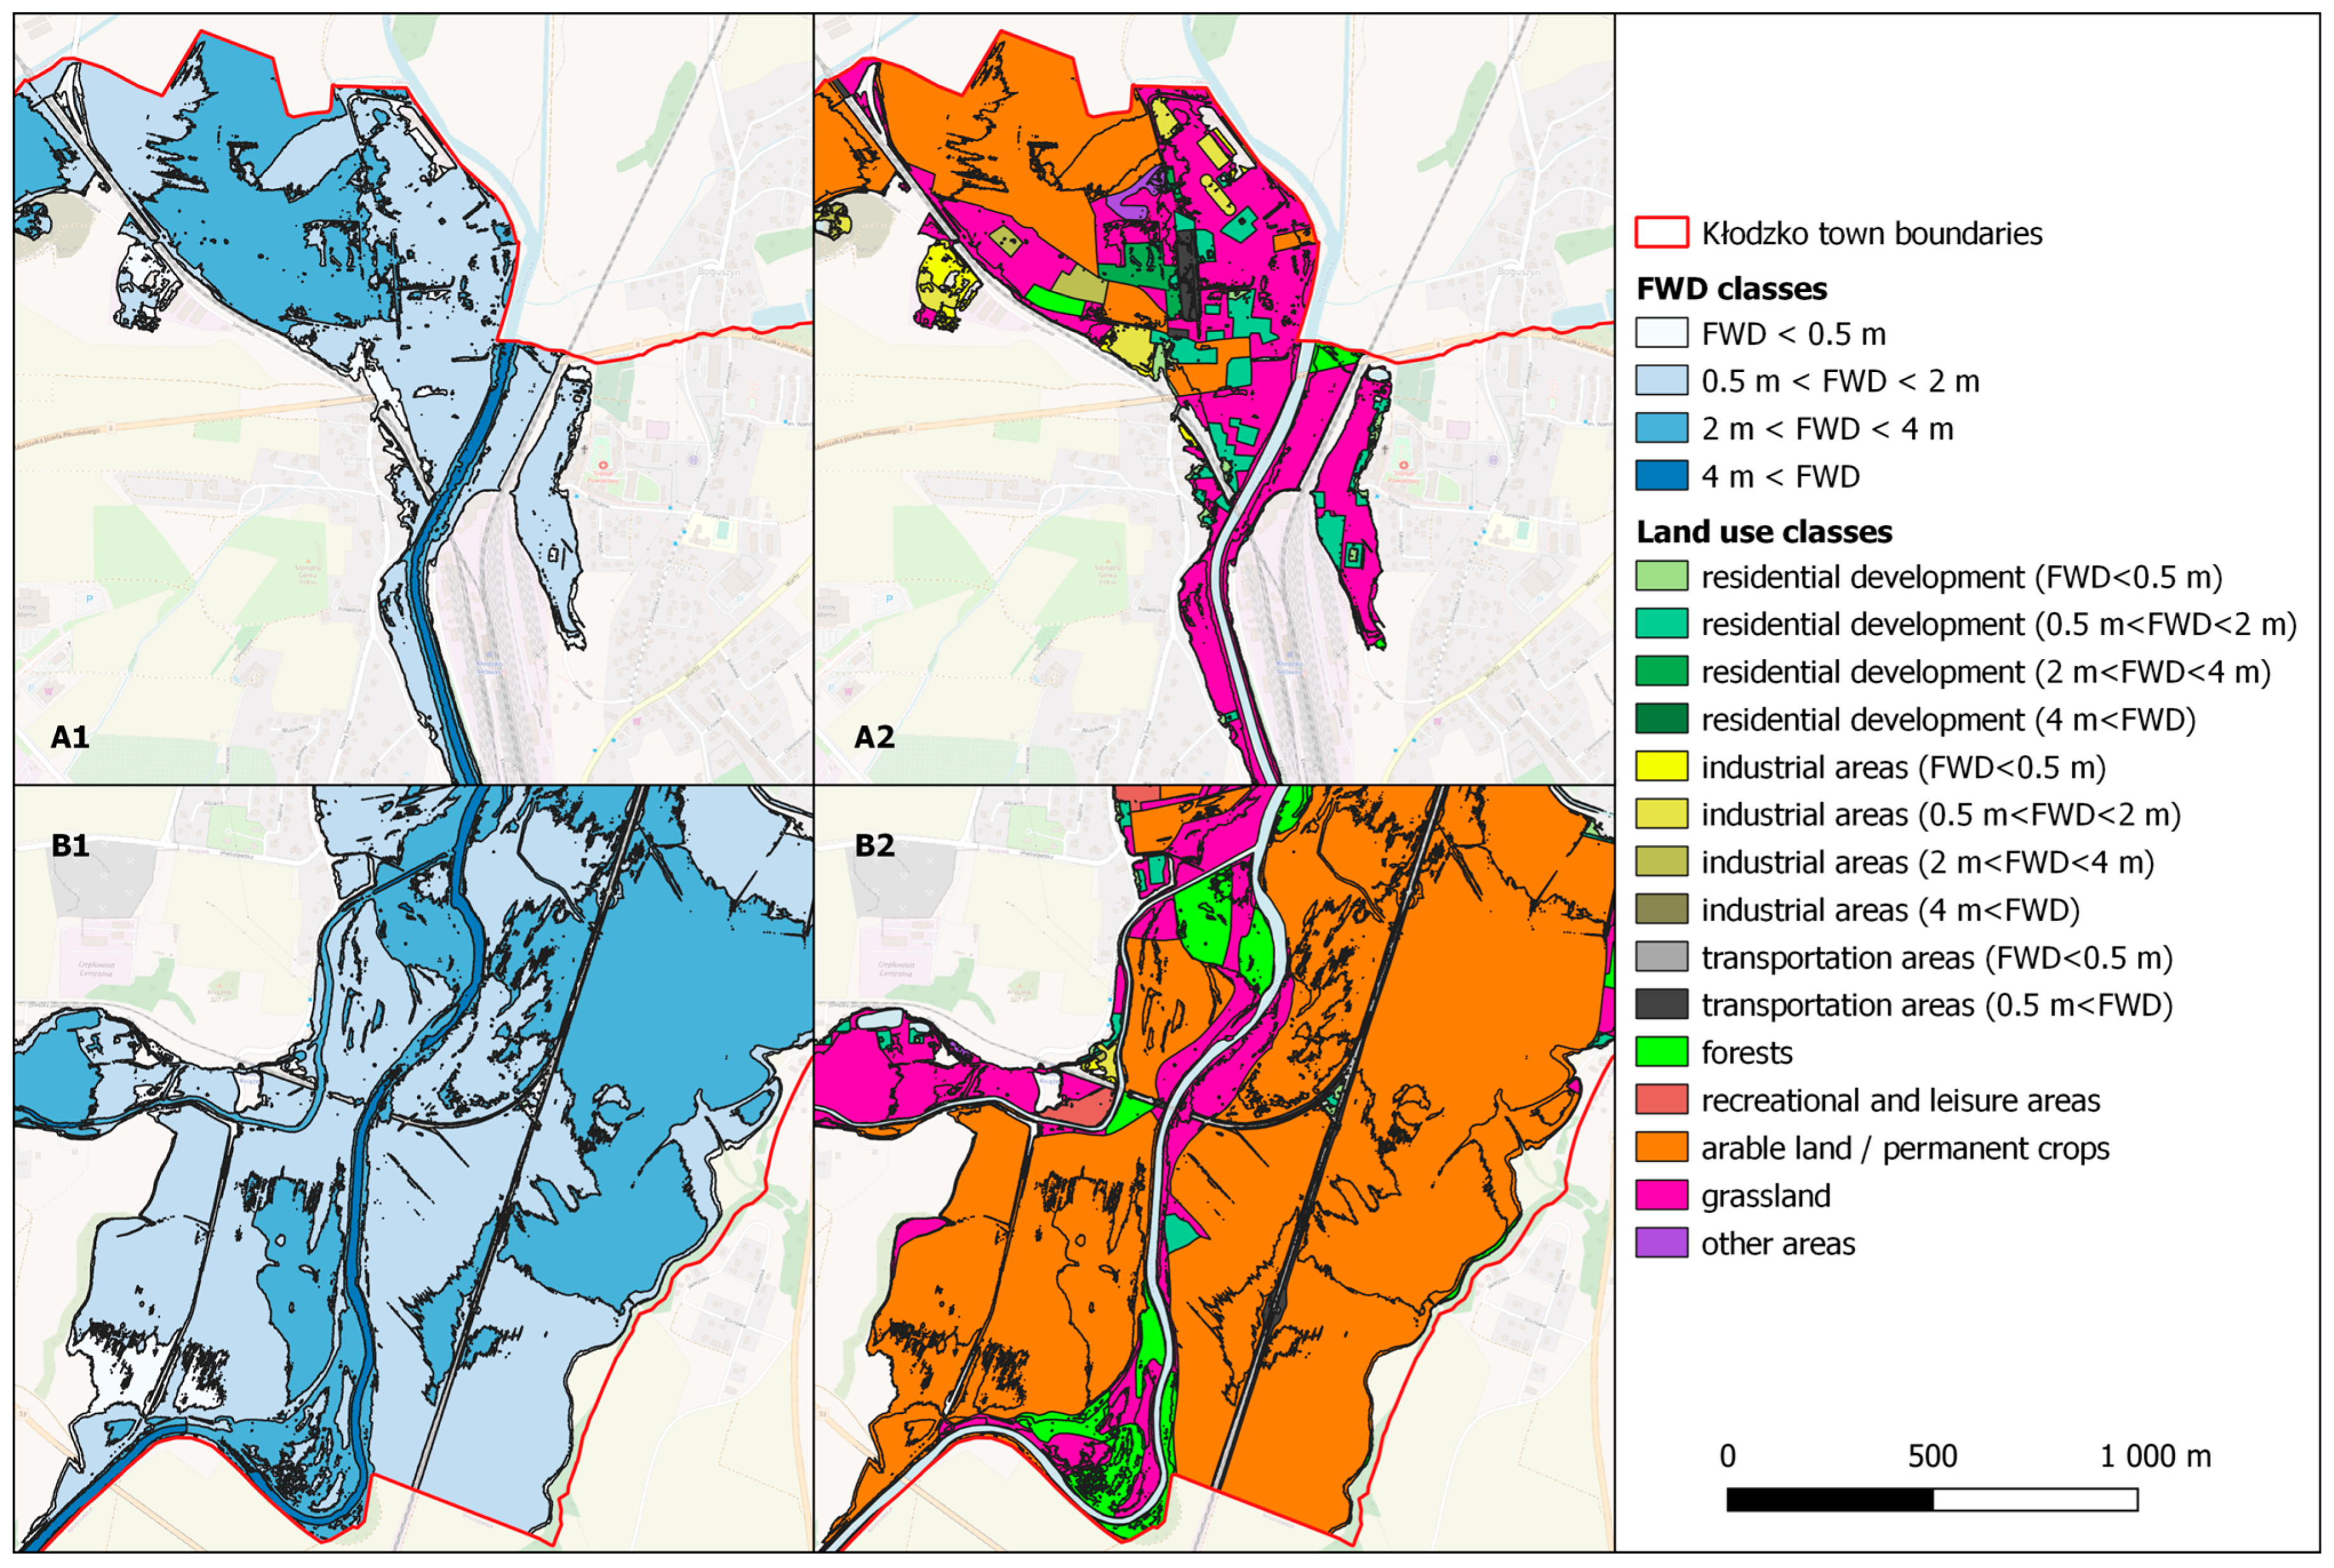
Example of generated FIZ area for flood event of 8 July 1997, with view on the northern (A1,A2) and southern (B1,B2) parts of Kłodzko town. FIZ are presented broken down into FWD classes (A1,B1) and land use classes (A2,B2) in accordance with the property value indicators used in the PFL estimation (see Table 1 for details).
Figure 3.
Example of generated FIZ area for flood event of 8 July 1997, with view on the northern (A1,A2) and southern (B1,B2) parts of Kłodzko town. FIZ are presented broken down into FWD classes (A1,B1) and land use classes (A2,B2) in accordance with the property value indicators used in the PFL estimation (see Table 1 for details).

Figure 4.
Dependence of water level and estimated PFL (A) and total FIZ area (B). Blue points refer to significant historical summer floods, orange squares to probable floods.
Figure 4.
Dependence of water level and estimated PFL (A) and total FIZ area (B). Blue points refer to significant historical summer floods, orange squares to probable floods.

Figure 5.
Synchronicity of PFL and cumulative 24 to 120 h rainfall before flood event: (A) R24, (B) R48, (C) R72, (D) R96 and (E) R120.
Figure 5.
Synchronicity of PFL and cumulative 24 to 120 h rainfall before flood event: (A) R24, (B) R48, (C) R72, (D) R96 and (E) R120.


| Class No. | Class Name | FWD < 0.5 m | 0.5 m < FWD ≤ 2 m | 2 m < FWD ≤ 4 m | FWD > 4 m |
|---|---|---|---|---|---|
| 1 | Areas of residential development | 20% v | 35% v | 60% v | 95% v |
| 2 | Industrial areas | 20% v | 40% v | 60% v | 80% v |
| 3 | Transportation areas | 5% v | 10% v | 10% v | 10% v |
| 4 | Forests | 0.04 PLN/m2 (0.01 EUR/m2) | |||
| 5 | Recreational and leisure areas | 8.81 PLN/m2 (1.90 EUR/m2) | |||
| 6 | Arable land/permanent crops | 0.36 PLN/m2 (0.08 EUR/m2) | |||
| 7 | Grassland | 0.09 PLN/m2 (0.02 EUR/m2) | |||
| 8 | Other areas and surface waters | - | |||
Notes: EUR 1 = PLN 4.64 (Polish zloty); v—value of given land use class per m2 adopted for Lower Silesian Voivodeship: class No. 1—2775.76 PLN/m2 (598.22 EUR/m2); class No. 2—1968.34 PLN/m2 (424.21 EUR/m2); class No. 3—789.23 PLN/m2 (170.09 EUR/m2).
Table 2.
Copula function, parameter space, generating function Φ(t), and functional relationship of Kendall’s τθ with a copula parameter for selected single-parameter bivariate Archimedean copulas (following [60,62]).
| Copula Family | Kendall’s | |||
|---|---|---|---|---|
| Clayton | ||||
| Gumbel–Hougaard | ||||
| Frank |
Table 3.
Designation of sectors determining the synchronicity and asynchronicity (after [62], modified).
Table 3.
Designation of sectors determining the synchronicity and asynchronicity (after [62], modified).
| Sector | Relation Type | X | Y | |
|---|---|---|---|---|
| 1 | LoR–LoPFL | Synchronicity | X ≤ R62.5% | Y ≤ PFL62.5% |
| 2 | LoR–MePFL | Moderate asynchronicity | X ≤ R62.5% | PFL62.5% < Y ≤ PFL37.5% |
| 3 | LoR–HiPFL | High asynchronicity | X ≤ R62.5% | Y > PFL37.5% |
| 4 | MeR–LoPFL | Moderate asynchronicity | R62.5% < X ≤ R37.5% | Y ≤ PFL62.5% |
| 5 | MeR–MePFL | Synchronicity | R62.5% < X ≤ R37.5% | PFL62.5% < Y ≤ PFL37.5% |
| 6 | MeR–HiPFL | Moderate asynchronicity | R62.5% < X ≤ R37.5% | Y > PFL37.5% |
| 7 | HiR–LoPFL | High asynchronicity | X > R37.5% | Y ≤ PFL62.5% |
| 8 | HiR–MePFL | Moderate asynchronicity | X > R37.5% | PFL62.5% < Y ≤ PFL37.5% |
| 9 | HiR–HiPFL | Synchronicity | X > R37.5% | Y > PFL37.5% |
Notes: where X = x coordinates of generated points; Y = y coordinates of generated points; R62.5%/PFL62.5% = the value of R or PFL with a probability of exceedance of 62.5%; R37.5%/PFL37.5% = the value of R or PFL with a probability of exceedance of 37.5%; Lo = “low”, Me = “medium”, and Hi = “high”; and R/PFL = variables used in this study, i.e., cumulative rainfall or potential flood losses (see details in Section 2.3.1 and Section 2.3.3).
Table 4.
Significant (i.e., exceeding MHW) historical summer flood events in Kłodzko in 1971–2021 with estimated PFL and FIZ area.
Table 4.
Significant (i.e., exceeding MHW) historical summer flood events in Kłodzko in 1971–2021 with estimated PFL and FIZ area.
| No. | Date | H (cm) | Q (m3·s−1) | PFL (PLN Million (EUR Million)) 1 | Total FIZ Area (km2) |
|---|---|---|---|---|---|
| 1 | 30.05.1971 | 266 | 120 | 13.4 (2.89) | 0.9 |
| 2 | 02.07.1975 | 330 | 212 | 53.4 (11.51) | 2.3 |
| 3 | 03.08.1977 | 380 | 298 | 99.0 (21.34) | 3.5 |
| 4 | 23.08.1977 | 310 | 180 | 38.4 (8.28) | 1.6 |
| 5 | 10.07.1980 | 350 | 244 | 68.2 (14.7) | 2.8 |
| 6 | 21.07.1980 | 300 | 164 | 31.4 (6.77) | 1.5 |
| 7 | 23.10.1981 | 260 | 113 | 12.1 (2.61) | 0.8 |
| 8 | 09.08.1985 | 290 | 149 | 25.2 (5.43) | 1.3 |
| 9 | 06.09.1987 | 286 | 144 | 23.5 (5.06) | 1.2 |
| 10 | 14.05.1996 | 290 | 149 | 25.2 (5.43) | 1.3 |
| 11 | 08.07.1997 | 517 | 693 | 361.4 (77.89) | 4.6 |
| 12 | 20.07.1997 | 328 | 209 | 52.2 (11.25) | 2.2 |
| 13 | 23.07.1998 | 380 | 298 | 99.0 (21.34) | 3.5 |
| 14 | 21.07.2001 | 282 | 139 | 21.7 (4.68) | 1.2 |
| 15 | 08.08.2006 | 340 | 243 | 61.0 (13.15) | 2.5 |
| 16 | 27.06.2009 | 435 | 424 | 164.1 (35.37) | 4.1 |
| 17 | 22.07.2011 | 305 | 205 | 34.9 (7.52) | 1.6 |
Note: 1 EUR 1 = PLN 4.64.
Table 5.
Estimated PFL and FIZ area for floods with a given probability of occurrence in Kłodzko town.
Table 5.
Estimated PFL and FIZ area for floods with a given probability of occurrence in Kłodzko town.
| Probability | Return Period | H (cm) | Q (m3·s−1) | PFL (PLN Million (EUR Million)) 1 | Total FIZ Area (km2) |
|---|---|---|---|---|---|
| 10% | 10 years | 423 | 391 | 145.0 (31.25) | 3.9 |
| 1% | 100 years | 534 | 762 | 408.5 (88.04) | 4.7 |
| 0.2% | 500 years | 591 | 1025 | 542.6 (116.94) | 4.9 |
Note: 1 EUR 1 = PLN 4.64.
Disclaimer/Publisher’s Note: The statements, opinions and data contained in all publications are solely those of the individual author(s) and contributor(s) and not of MDPI and/or the editor(s). MDPI and/or the editor(s) disclaim responsibility for any injury to people or property resulting from any ideas, methods, instructions or products referred to in the content. |
© 2023 by the authors. Licensee MDPI, Basel, Switzerland. This article is an open access article distributed under the terms and conditions of the Creative Commons Attribution (CC BY) license (https://creativecommons.org/licenses/by/4.0/).
Share and Cite
MDPI and ACS Style
Perz, A.; Wrzesiński, D.; Budner, W.W.; Sobkowiak, L. Flood-Triggering Rainfall and Potential Losses—The Copula-Based Approach on the Example of the Upper Nysa Kłodzka River. Water 2023, 15, 1958. https://doi.org/10.3390/w15101958
AMA Style
Perz A, Wrzesiński D, Budner WW, Sobkowiak L. Flood-Triggering Rainfall and Potential Losses—The Copula-Based Approach on the Example of the Upper Nysa Kłodzka River. Water. 2023; 15(10):1958. https://doi.org/10.3390/w15101958
Chicago/Turabian StylePerz, Adam, Dariusz Wrzesiński, Waldemar W. Budner, and Leszek Sobkowiak. 2023. "Flood-Triggering Rainfall and Potential Losses—The Copula-Based Approach on the Example of the Upper Nysa Kłodzka River" Water 15, no. 10: 1958. https://doi.org/10.3390/w15101958
Note that from the first issue of 2016, this journal uses article numbers instead of page numbers. See further details here.