
Evaluation and Development of Pedotransfer Functions and Artificial Neural Networks to Saturation Moisture Content Estimation


Abstract
:1. Introduction
2. Materials and Methods
2.1. Study Area
2.2. Soil Textures
2.3. Statistical Analysis
2.4. Development of the PTFs and the ANNs
3. Results
3.1. PTFs
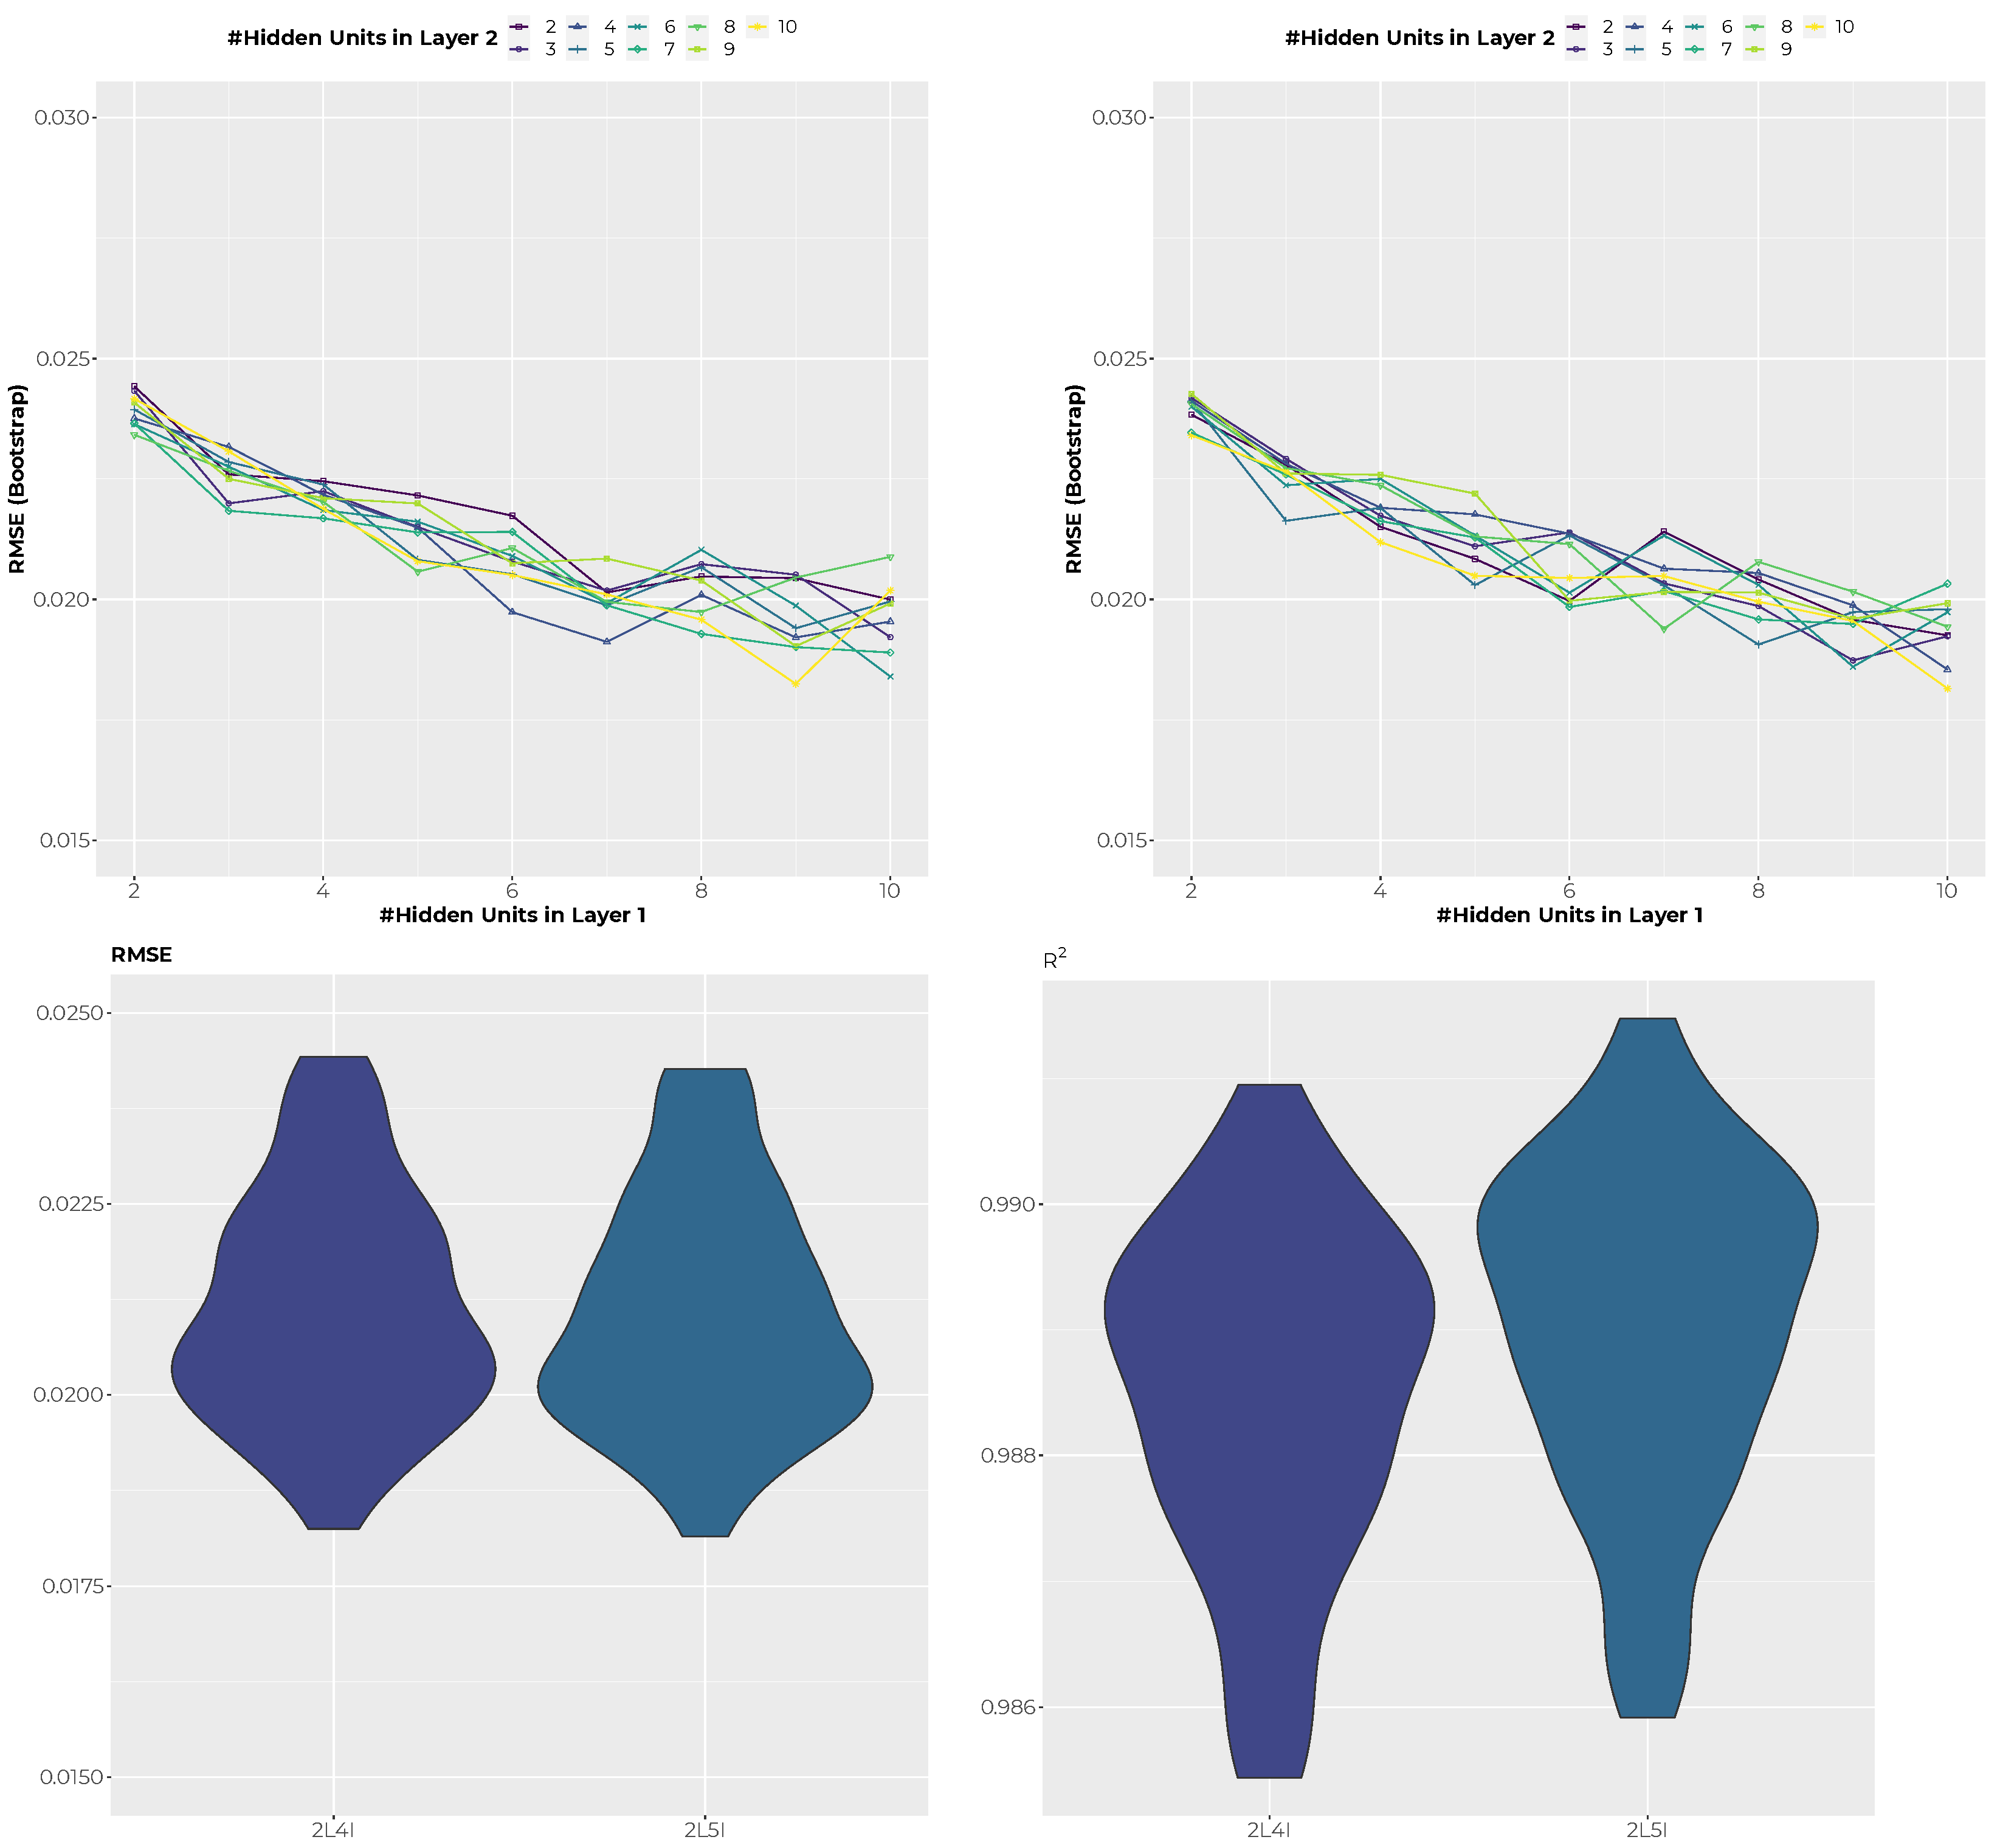
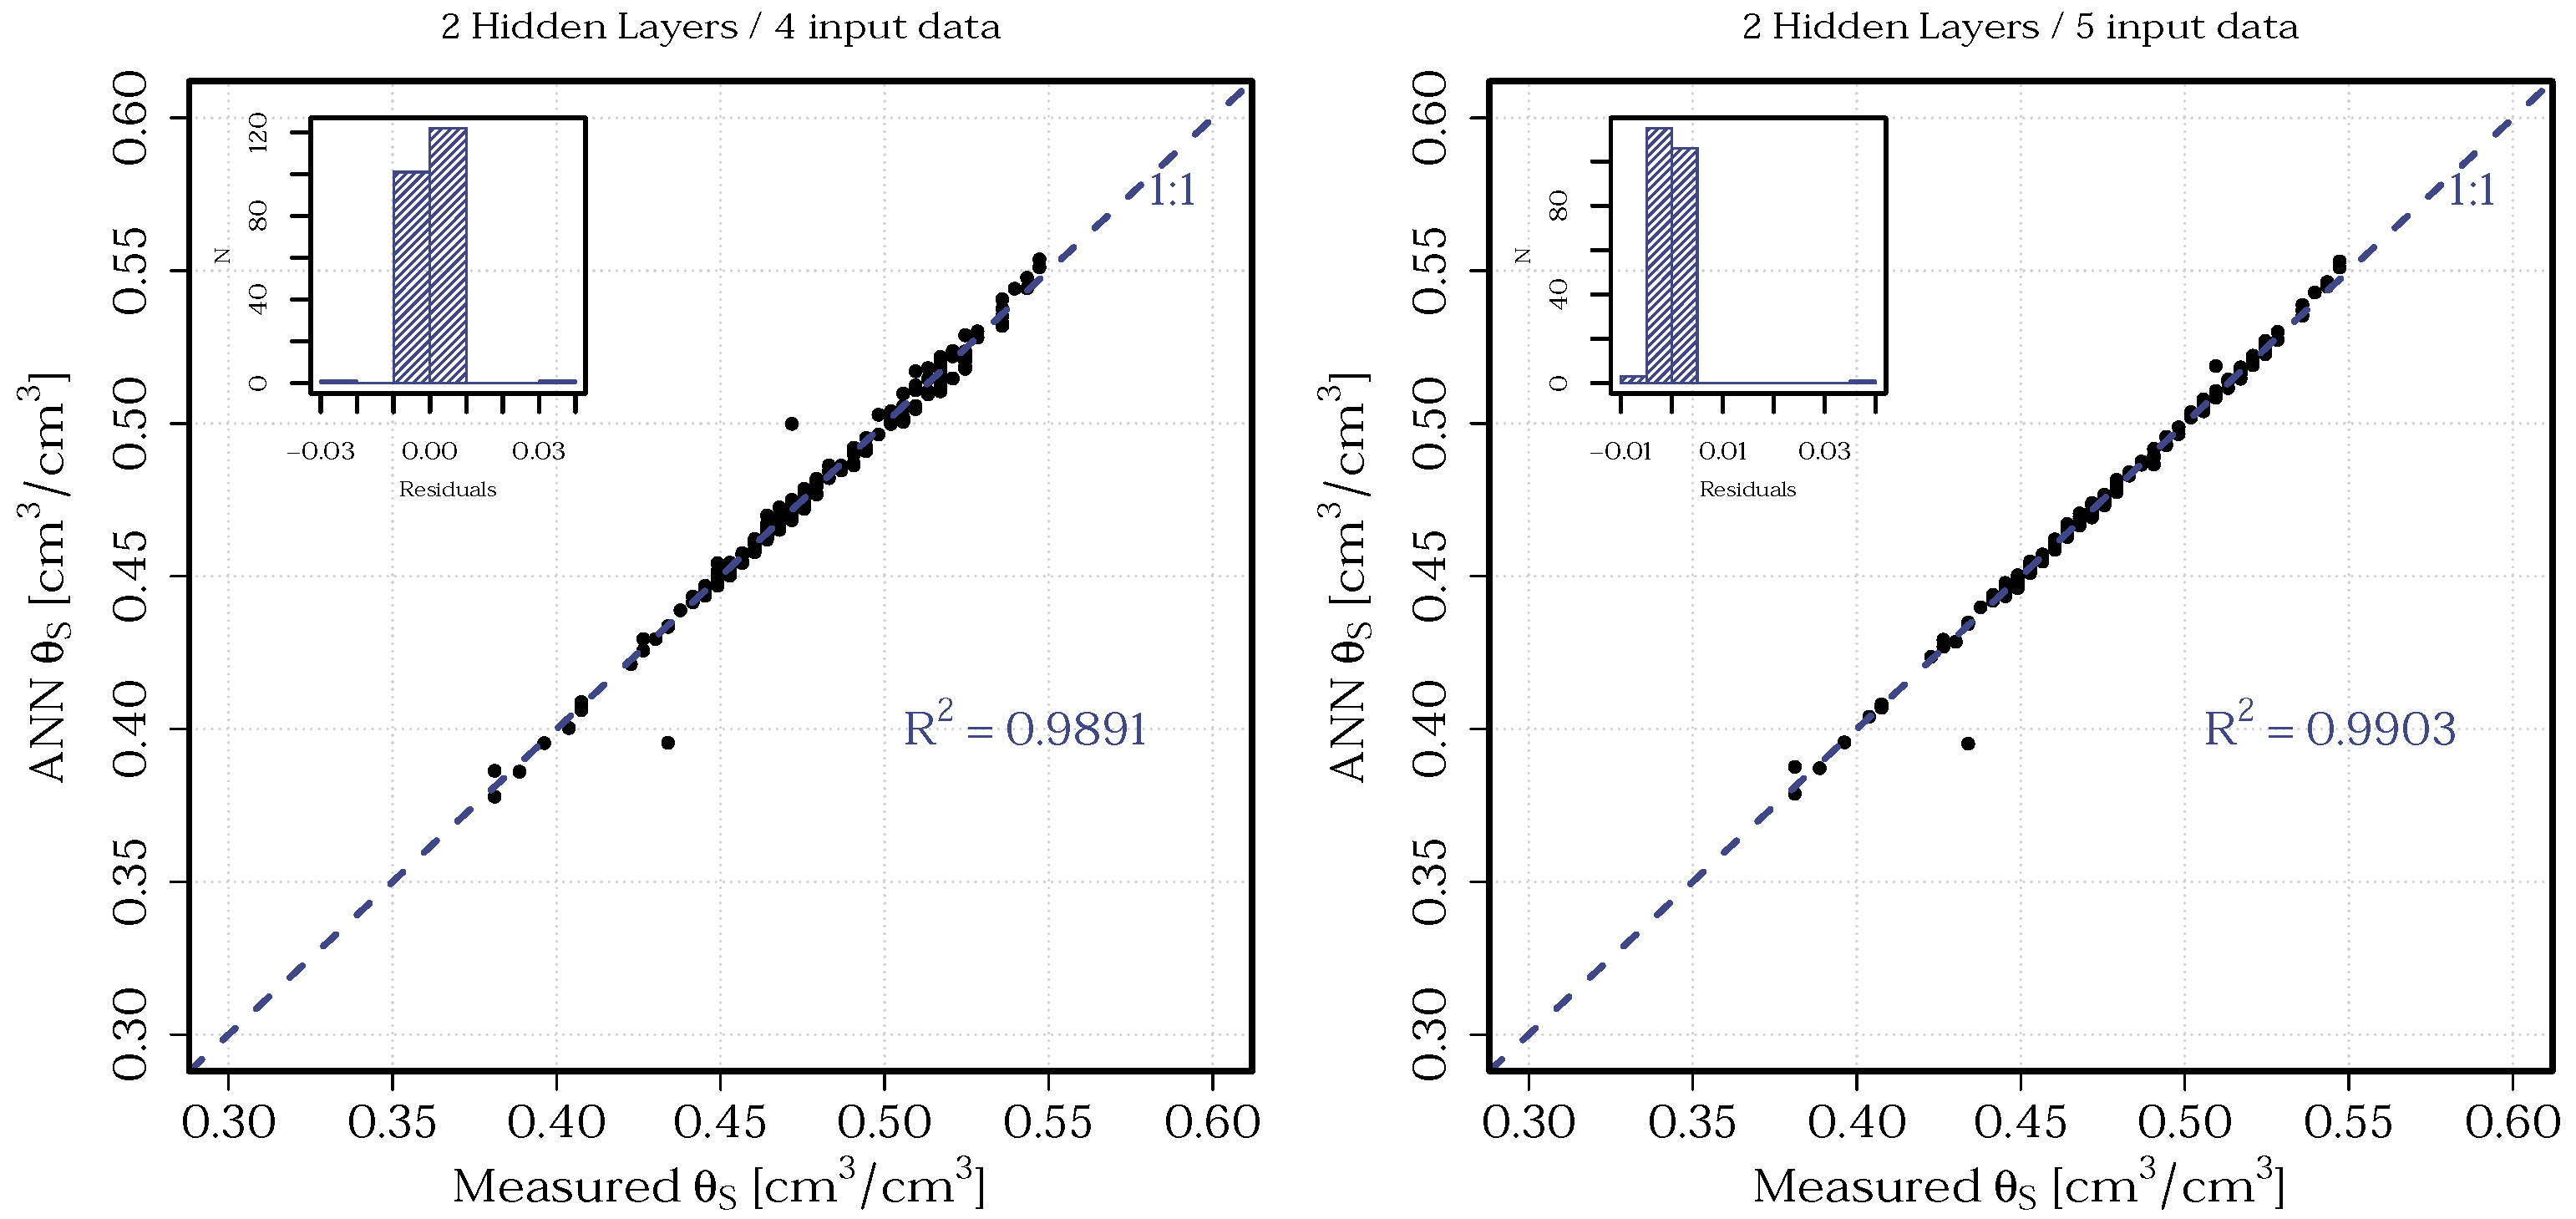
3.2. ANN
4. Discussion
5. Conclusions
Author Contributions
Funding
Institutional Review Board Statement
Informed Consent Statement
Data Availability Statement
Acknowledgments
Conflicts of Interest
References
- Shelia, V.; Šimůnek, J.; Boote, K.; Hoogenbooom, G. Coupling DSSAT and HYDRUS-1D for Simulations of Soil Water Dynamics in the Soil-Plant-Atmosphere System. J. Hydrol. Hydromech. 2018, 66, 232–245. [Google Scholar] [CrossRef] [Green Version]
- Hodnett, M.G.; Tomasella, J. Marked Differences between van Genuchten Soil Water-Retention Parameters for Temperate and Tropical Soils: A New Water-Retention Pedo-Transfer Functions Developed for Tropical Soils. Geoderma 2002, 108, 155–180. [Google Scholar] [CrossRef]
- Tian, H.; Huang, N.; Niu, Z.; Qin, Y.; Pei, J.; Wang, J. Mapping Winter Crops in China with Multi-Source Satellite Imagery and Phenology-Based Algorithm. Remote Sens. 2019, 11, 820. [Google Scholar] [CrossRef] [Green Version]
- Schaap, M. Using Neural Networks to Predict Soil Water Retention and Soil Hydraulic Conductivity. Soil Tillage Res. 1998, 47, 37–42. [Google Scholar] [CrossRef]
- Richards, L.A. Capillary Conduction of Liquids through Porous Mediums. Physics 1931, 1, 318–333. [Google Scholar] [CrossRef]
- Balland, V.; Pollacco, J.A.P.; Arp, P.A. Modeling Soil Hydraulic Properties for a Wide Range of Soil Conditions. Ecol. Model. 2008, 219, 300–316. [Google Scholar] [CrossRef]
- Wösten, J.H.M.; Verzandvoort, S.J.E.; Leenaars, J.G.B.; Hoogland, T.; Wesseling, J.G. Soil Hydraulic Information for River Basin Studies in Semi-Arid Regions. Geoderma 2013, 195–196, 79–86. [Google Scholar] [CrossRef]
- Van Genuchten, M.T. A Closed-Form Equation for Predicting the Hydraulic Conductivity of Unsaturated Soils. Soil Sci. Soc. Am. J. 1980, 44, 892–898. [Google Scholar] [CrossRef] [Green Version]
- Zavala, M.; Fuentes, C.; Saucedo, H. On the radiation condition in the drainage of an initially saturated soil column. Ing. Hidraul. Mex. 2003, 18, 121–131. [Google Scholar]
- Liang, S.; Wang, J. Advanced Remote Sensing: Terrestrial Information Extraction and Applications; Academic Press: Cambridge, MA, USA, 2019; ISBN 978-0-12-815826-5. [Google Scholar]
- Ahlmer, A.-K.; Cavalli, M.; Hansson, K.; Koutsouris, A.J.; Crema, S.; Kalantari, Z. Soil Moisture Remote-Sensing Applications for Identification of Flood-Prone Areas along Transport Infrastructure. Environ. Earth Sci. 2018, 77, 533. [Google Scholar] [CrossRef] [Green Version]
- Qiu, B.; Luo, Y.; Tang, Z.; Chen, C.; Lu, D.; Huang, H.; Chen, Y.; Chen, N.; Xu, W. Winter Wheat Mapping Combining Variations before and after Estimated Heading Dates. ISPRS J. Photogramm. Remote Sens. 2017, 123, 35–46. [Google Scholar] [CrossRef]
- Atzberger, C. Advances in Remote Sensing of Agriculture: Context Description, Existing Operational Monitoring Systems and Major Information Needs. Remote Sens. 2013, 5, 949–981. [Google Scholar] [CrossRef] [Green Version]
- Yuping, M.; Shili, W.; Li, Z.; Yingyu, H.; Liwei, Z.; Yanbo, H.; Futang, W. Monitoring Winter Wheat Growth in North China by Combining a Crop Model and Remote Sensing Data. Int. J. Appl. Earth Obs. Geoinf. 2008, 10, 426–437. [Google Scholar] [CrossRef]
- He, L.; Song, X.; Feng, W.; Guo, B.-B.; Zhang, Y.-S.; Wang, Y.-H.; Wang, C.-Y.; Guo, T.-C. Improved Remote Sensing of Leaf Nitrogen Concentration in Winter Wheat Using Multi-Angular Hyperspectral Data. Remote Sens. Environ. 2016, 174, 122–133. [Google Scholar] [CrossRef]
- Franke, J.; Menz, G. Multi-Temporal Wheat Disease Detection by Multi-Spectral Remote Sensing. Precis. Agric. 2007, 8, 161–172. [Google Scholar] [CrossRef]
- Aziz, M.; Khan, M.; Anjum, N.; Sultan, M.; Shamshiri, R.R.; Ibrahim, S.M.; Balasundram, S.K.; Aleem, M. Scientific Irrigation Scheduling for Sustainable Production in Olive Groves. Agriculture 2022, 12, 564. [Google Scholar] [CrossRef]
- Zapata-Sierra, A.; Roldán-Cañas, J.; Reyes-Requena, R.; Moreno-Pérez, M. Study of the Wet Bulb in Stratified Soils (Sand-Covered Soil) in Intensive Greenhouse Agriculture under Drip Irrigation by Calibrating the Hydrus-3D Model. Water 2021, 13, 600. [Google Scholar] [CrossRef]
- Koumanov, K.S.; Hopmans, J.W.; Schwankl, L.J.; Andreu, L.; Tuli, A. Application Efficiency of Micro-Sprinkler Irrigation of Almond Trees. Agric. Water Manag. 1997, 34, 247–263. [Google Scholar] [CrossRef]
- Butters, G.L.; Cardon, G.E. Temperature Effects on Air-Pocket Tensiometers. Soil Sci. 1998, 163, 677–685. [Google Scholar] [CrossRef]
- Warrick, A.W.; Wierenga, P.J.; Young, M.H.; Musil, S.A. Diurnal Fluctuations of Tensiometric Readings Due to Surface Temperature Changes. Water Resour. Res. 1998, 34, 2863–2869. [Google Scholar] [CrossRef]
- He, H.; Aogu, K.; Li, M.; Xu, J.; Sheng, W.; Jones, S.B.; González-Teruel, J.D.; Robinson, D.A.; Horton, R.; Bristow, K.; et al. A Review of Time Domain Reflectometry (TDR) Applications in Porous Media. Adv. Agron. 2021, 168, 83–155. [Google Scholar]
- Noborio, K. Measurement of Soil Water Content and Electrical Conductivity by Time Domain Reflectometry: A Review. Comput. Electron. Agric. 2001, 31, 213–237. [Google Scholar] [CrossRef]
- Rasheed, M.W.; Tang, J.; Sarwar, A.; Shah, S.; Saddique, N.; Khan, M.U.; Imran Khan, M.; Nawaz, S.; Shamshiri, R.R.; Aziz, M.; et al. Soil Moisture Measuring Techniques and Factors Affecting the Moisture Dynamics: A Comprehensive Review. Sustainability 2022, 14, 11538. [Google Scholar] [CrossRef]
- Zhang, Y.; Liang, S.; Zhu, Z.; Ma, H.; He, T. Soil Moisture Content Retrieval from Landsat 8 Data Using Ensemble Learning. ISPRS J. Photogramm. Remote Sens. 2022, 185, 32–47. [Google Scholar] [CrossRef]
- Haverkamp, R.; Debionne, S.; Viallet, P.; Angulo-Jaramillo, R.; de Condappa, D.; Delleur, J.W. Soil Properties and Moisture Movement in the Unsaturated Zone. In The Handbook of Groundwater Engineering; CRC Press: Boca Raton, FL, USA, 2006; pp. 1–59. [Google Scholar]
- Rogowski, A.S. Watershed Physics: Model of the Soil Moisture Characteristic. Water Resour. Res. 1971, 7, 1575–1582. [Google Scholar] [CrossRef]
- Chávez, C.; Fuentes, C. Design and Evaluation of Surface Irrigation Systems Applying an Analytical Formula in the Irrigation District 085, La Begoña, Mexico. Agric. Water Manag. 2019, 221, 279–285. [Google Scholar] [CrossRef]
- Saucedo, H.; Zavala, M.; Fuentes, C. Border irrigation design with the Saint-Venant and Green & Ampt equations. Water Technol. Sci. 2015, 6, 103–112. [Google Scholar]
- Fuentes, S.; Fuentes, C.; Saucedo, H.; Chávez, C. Border Irrigation Modeling with the Barré de Saint-Venant and Green and Ampt Equations. Mathematics 2022, 10, 1039. [Google Scholar] [CrossRef]
- Patil, N.G.; Singh, S.K. Pedotransfer Functions for Estimating Soil Hydraulic Properties: A Review. Pedosphere 2016, 26, 417–430. [Google Scholar] [CrossRef]
- Botula, Y.-D.; Van Ranst, E.; Cornelis, W.M. Pedotransfer Functions to Predict Water Retention for Soils of the Humid Tropics: A Review. Rev. Bras. Ciênc. Solo. 2014, 38, 679–698. [Google Scholar] [CrossRef] [Green Version]
- Botula, Y.-D.; Cornelis, W.M.; Baert, G.; Van Ranst, E. Evaluation of Pedotransfer Functions for Predicting Water Retention of Soils in Lower Congo (D.R. Congo). Agric. Water Manag. 2012, 111, 1–10. [Google Scholar] [CrossRef]
- Santra, P.; Kumar, M.; Kumawat, R.N.; Painuli, D.K.; Hati, K.M.; Heuvelink, G.B.M.; Batjes, N.H. Pedotransfer Functions to Estimate Soil Water Content at Field Capacity and Permanent Wilting Point in Hot Arid Western India. J. Earth Syst. Sci. 2018, 127, 35. [Google Scholar] [CrossRef] [Green Version]
- Lee, K.-S.; Lee, D.-S.; Jung, H.-G.; Lee, S.-P.; Ryu, J.-H.; Choi, W.-J.; Yang, J.-E.; Chung, D.-Y. Evaluation of Pedotransfer Functions for Estimating Soil Water Retention Curve of Ap Horizon Soils for Various Soil Series of Reclaimed Tidal Flat Soil. Agronomy 2022, 12, 1507. [Google Scholar] [CrossRef]
- Vereecken, H.; Maes, J.; Feyen, J.; Darius, P. Estimating the soil moisture retention characteristic from texture, bulk density, and carbon content. Soil Sci. 1989, 148, 389–403. [Google Scholar] [CrossRef]
- Wösten, J.H.M.; Pachepsky, Y.A.; Rawls, W.J. Pedotransfer Functions: Bridging the Gap between Available Basic Soil Data and Missing Soil Hydraulic Characteristics. J. Hydrol. 2001, 251, 123–150. [Google Scholar] [CrossRef]
- Trejo-Alonso, J.; Fuentes, C.; Chávez, C.; Quevedo, A.; Gutierrez-Lopez, A.; González-Correa, B. Saturated Hydraulic Conductivity Estimation Using Artificial Neural Networks. Water 2021, 13, 705. [Google Scholar] [CrossRef]
- Erzin, Y.; Gumaste, S.D.; Gupta, A.K.; Singh, D.N. Artificial neural network (ANN) models for determining hydraulic conductivity of compacted fine-grained soils. Can. Geotech. J. 2009, 46, 955–968. [Google Scholar] [CrossRef]
- Tomasella, J.; Pachepsky, Y.; Crestana, S.; Rawls, W.J. Comparison of Two Techniques to Develop Pedotransfer Functions for Water Retention. Soil Sci. Soc. Am. J. 2003, 67, 1085–1092. [Google Scholar] [CrossRef] [Green Version]
- Brooks, R.H.; Corey, A.T. Hydraulic Properties of Porous Media and Their Relation to Drainage Design. Trans. ASAE. 1964, 7, 26–28. [Google Scholar] [CrossRef]
- Børgesen, C.D.; Schaap, M.G. Point and Parameter Pedotransfer Functions for Water Retention Predictions for Danish Soils. Geoderma 2005, 127, 154–167. [Google Scholar] [CrossRef]
- Haghverdi, A.; Cornelis, W.M.; Ghahraman, B. A Pseudo-Continuous Neural Network Approach for Developing Water Retention Pedotransfer Functions with Limited Data. J. Hydrol. 2012, 442–443, 46–54. [Google Scholar] [CrossRef]
- Bautista, E.; Schlegel, J.L.; Clemmens, A.J. The SRFR 5 Modeling System for Surface Irrigation. J. Irrig. Drain Eng. 2016, 142, 04015038. [Google Scholar] [CrossRef]
- Fuentes, C.; Chávez, C. Analytic Representation of the Optimal Flow for Gravity Irrigation. Water 2020, 12, 2710. [Google Scholar] [CrossRef]
- Bouyoucos, G.J. Hydrometer Method Improved for Making Particle Size Analyses of Soils. Agron. J. 1962, 54, 464–465. [Google Scholar] [CrossRef]
- Richards, L.A.; Fireman, M. Pressure-Plate Apparatus for Measuring Moisture Sorption and Transmission by Soils. Soil Sci. 1943, 56, 395–404. [Google Scholar] [CrossRef]
- Chávez, C.; Fuentes, S.; Fuentes, C.; Brambila-Paz, F.; Trejo-Alonso, J. How Surface Irrigation Contributes to Climate Change Resilience—A Case Study of Practices in Mexico. Sustainability 2022, 14, 7689. [Google Scholar] [CrossRef]
- Chávez, C.; Limón-Jiménez, I.; Espinoza-Alcántara, B.; López-Hernández, J.A.; Bárcenas-Ferruzca, E.; Trejo-Alonso, J. Water-Use Efficiency and Productivity Improvements in Surface Irrigation Systems. Agronomy 2020, 10, 1759. [Google Scholar] [CrossRef]
- Moeys, J. Soiltexture: Functions for Soil Texture Plot, Classification and Transformation. 2018. Available online: https://CRAN.R-project.org/package=soiltexture (accessed on 27 December 2022).
- Donatelli, M.; Wösten, J.H.M.; Belocchi, G. Methods to Evaluate Pedotransfer Functions. Dev. Soil Sci. 2004, 30, 357–411. [Google Scholar] [CrossRef]
- Schaap, M.G. Accuracy and Uncertainty in PTF Predictions. Dev. Soil Sci. 2004, 30, 33–43. [Google Scholar] [CrossRef]
- Zhang, Y.; Schaap, M.G. Estimation of Saturated Hydraulic Conductivity with Pedotransfer Functions: A Review. J. Hydrol. 2019, 575, 1011–1030. [Google Scholar] [CrossRef]
- Trejo-Alonso, J.; Quevedo, A.; Fuentes, C.; Chávez, C. Evaluation and Development of Pedotransfer Functions for Predicting Saturated Hydraulic Conductivity for Mexican Soils. Agronomy 2020, 10, 1516. [Google Scholar] [CrossRef]
- R Core Team. R: A Language and Environment for Statistical Computing; R Foundation for Statistical Computing: Vienna, Austria, 2022; Available online: https://www.R-project.org/ (accessed on 27 December 2022).
- Fritsch, S.; Guenther, F.; Wright, M.N. Neuralnet: Training of Neural Networks. R Package Version 1.44.2. 2019. Available online: https://CRAN.R-project.org/package=neuralnet (accessed on 27 December 2022).
- Kuhn, M. Caret: Classification and Regression Training. R Package Version 6.0-93. 2022. Available online: https://CRAN.R-project.org/package=caret (accessed on 27 December 2022).


| PTF | Formula | Source |
|---|---|---|
| PTF1 | [2] | |
| PTF2 | [36] | |
| PTF3 | [37] |
| PTF | Formula | R |
|---|---|---|
| PTF-1 | 0.9046 | |
| PTF-2 | 0.9705 | |
| PTF-3 | 0.9445 | |
| PTF-4 | 0.9877 | |
| PTF-5 | 0.9328 | |
| PTF-6 | 0.9469 | |
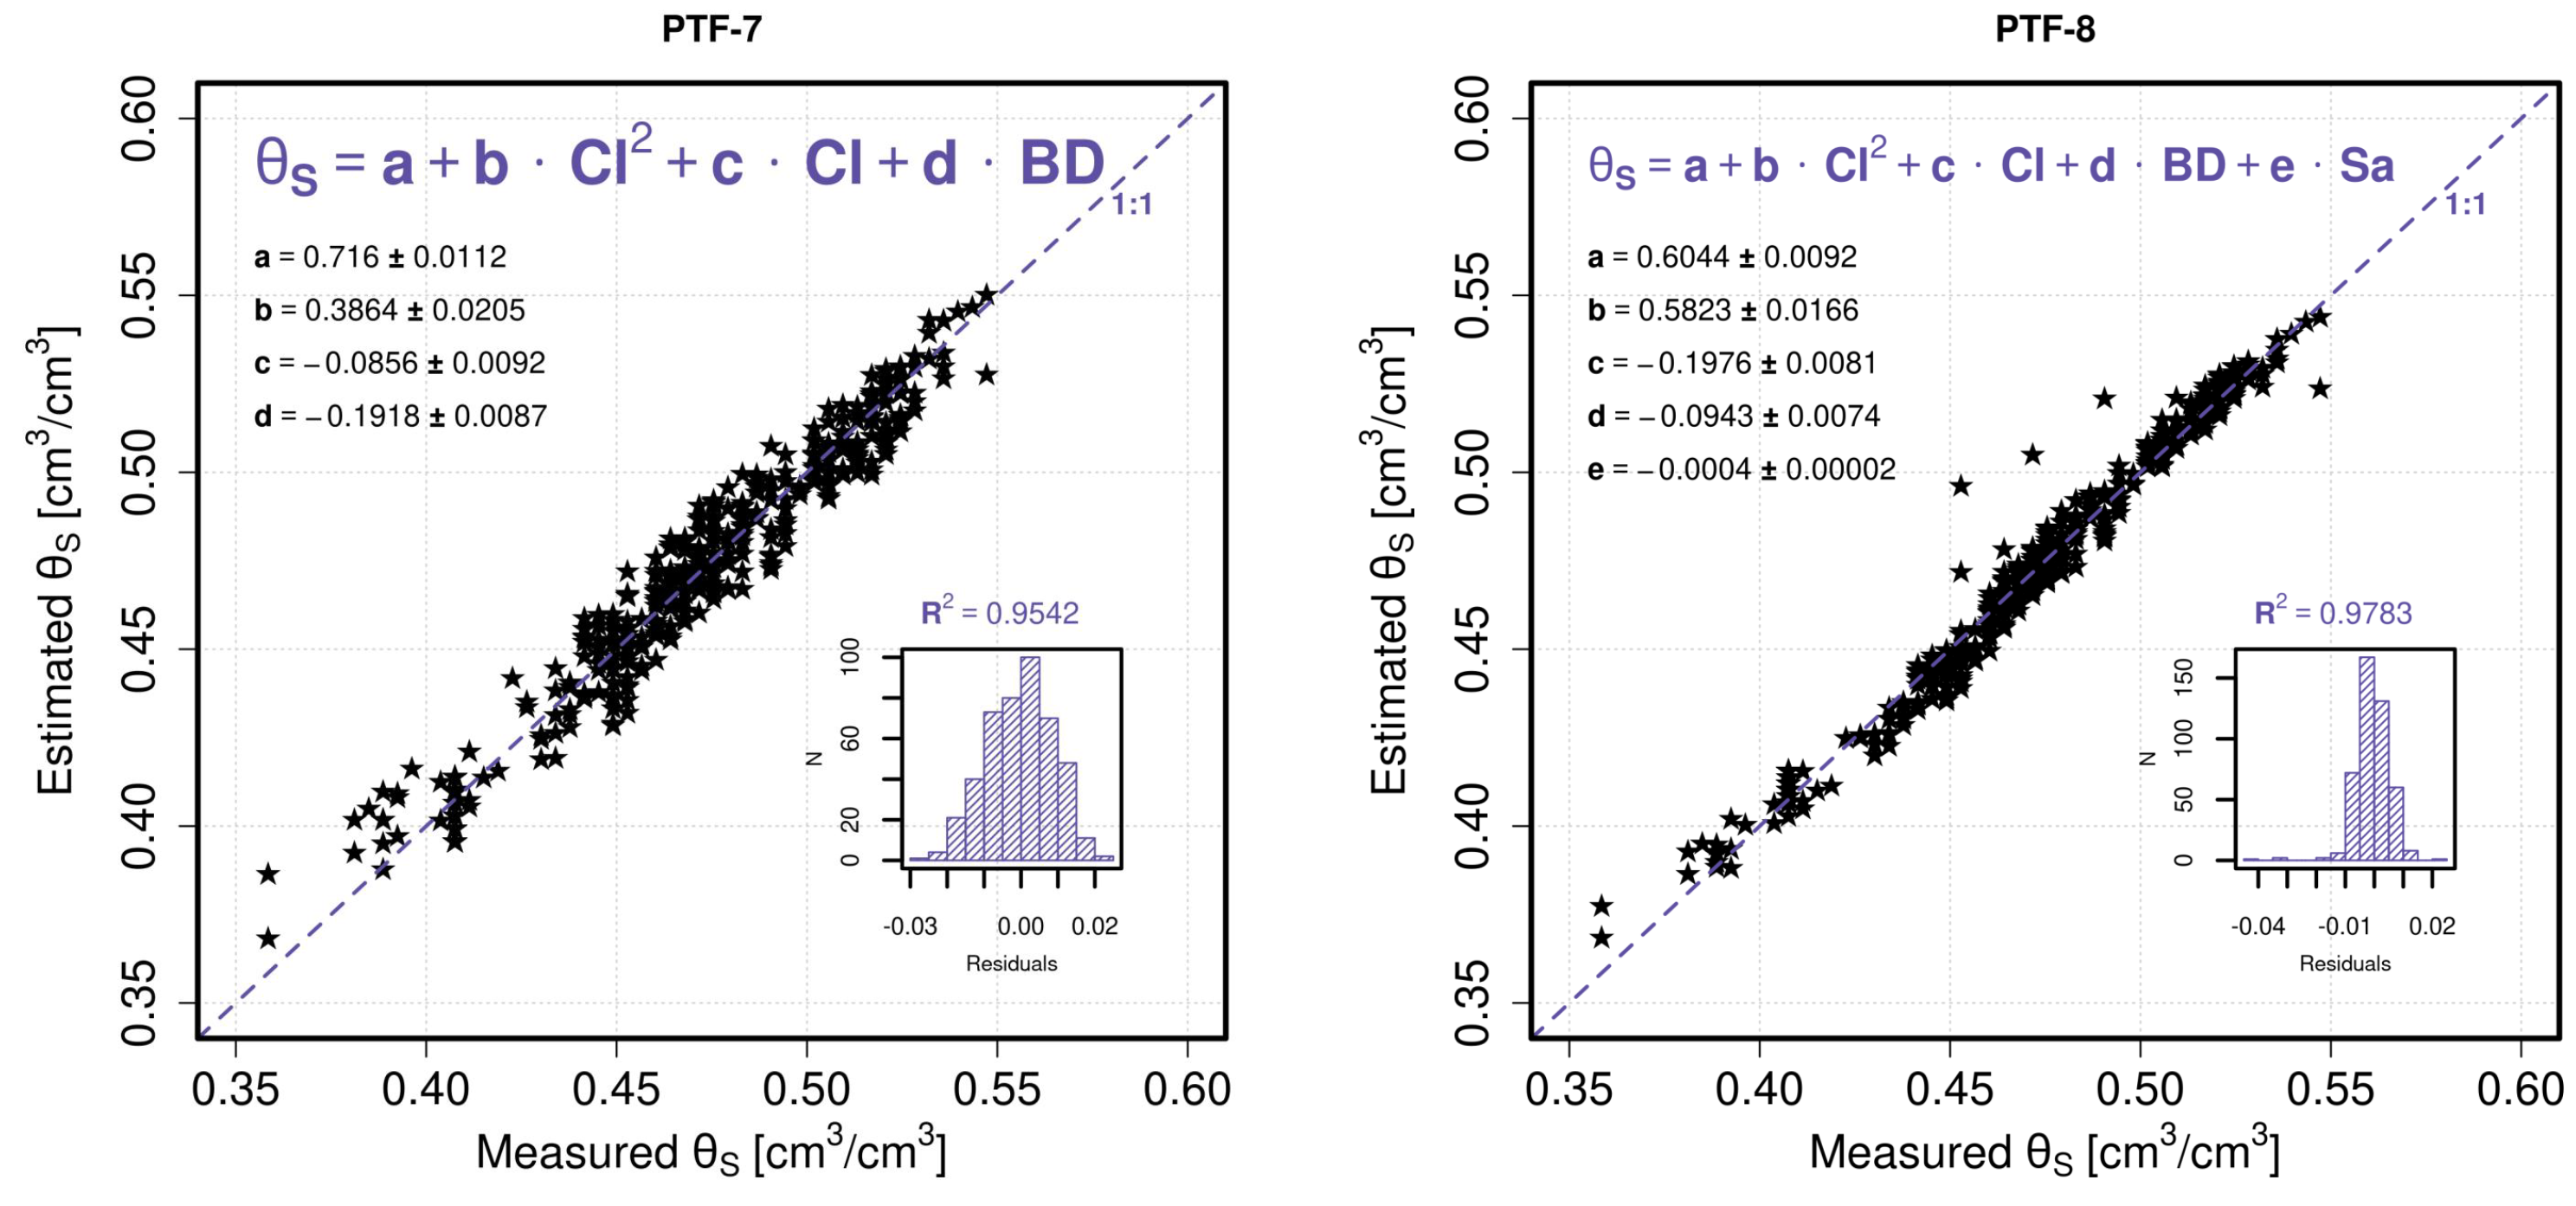
| PTF-7 | 0.9542 | |
| PTF-8 | 0.9783 |
| ANN | RMSE | R | ME |
|---|---|---|---|
| 4-9-10-1 | 0.0182 | 0.9891 | 0.0091 |
| 5-10-10-1 | 0.0195 | 0.9903 | 0.0095 |
Disclaimer/Publisher’s Note: The statements, opinions and data contained in all publications are solely those of the individual author(s) and contributor(s) and not of MDPI and/or the editor(s). MDPI and/or the editor(s) disclaim responsibility for any injury to people or property resulting from any ideas, methods, instructions or products referred to in the content. |
© 2023 by the authors. Licensee MDPI, Basel, Switzerland. This article is an open access article distributed under the terms and conditions of the Creative Commons Attribution (CC BY) license (https://creativecommons.org/licenses/by/4.0/).
Share and Cite
Trejo-Alonso, J.; Fuentes, S.; Morales-Durán, N.; Chávez, C. Evaluation and Development of Pedotransfer Functions and Artificial Neural Networks to Saturation Moisture Content Estimation. Water 2023, 15, 220. https://doi.org/10.3390/w15020220
Trejo-Alonso J, Fuentes S, Morales-Durán N, Chávez C. Evaluation and Development of Pedotransfer Functions and Artificial Neural Networks to Saturation Moisture Content Estimation. Water. 2023; 15(2):220. https://doi.org/10.3390/w15020220
Chicago/Turabian StyleTrejo-Alonso, Josué, Sebastián Fuentes, Nami Morales-Durán, and Carlos Chávez. 2023. "Evaluation and Development of Pedotransfer Functions and Artificial Neural Networks to Saturation Moisture Content Estimation" Water 15, no. 2: 220. https://doi.org/10.3390/w15020220