1. Introduction
During water scarcity scenarios resulting from periods of drought, reduced precipitation and pollution of water sources, ensuring the reliability of the population’s supply is a key factor to avoid conflicts and vulnerabilities. Although there is a natural predisposition to regions with poor distribution of water resources and adverse weather conditions, anthropogenic actions make the scenario even more worrying. Problems such as high water demand associated with population growth, pollution of water bodies and climate change significantly increase the water deficit, bringing unsustainable conditions to the population and the local environment [
1].
Ren et al. [
2] highlight that climate change and the intensification of human activities have changed the stationarity of hydrometeorological series, bringing greater uncertainty to the use of water resources. A key challenge in managing water resources is to reduce the vulnerability of this system, even if anthropogenic influences cannot be predicted by statistical methods. Modeling water supply systems is complex, fraught with uncertainties and incomplete input data, which often prevents ensuring the reliability of flow allocation and quantifying supply risks.
In the context of water resources management, a very relevant topic is the design and operation of integrated hydraulic systems [
2,
3,
4]. The integration of multiple water sources is an effective alternative to alleviate water scarcity problems and ensure the development of effective water allocation policies. Despite this, supply systems with multiple water sources, especially transferred water, make water resource management a major challenge [
4,
5]. The presence of multiple water sources leads to the problem of a multi-process, as it requires complex analysis of the infrastructural limitations of the system, control of reservoir volumes, demand projections and climate forecasts, thus requiring a robust optimization method for decision making.
The promotion of various methodologies for managing water resources, whether they be methods of genetic algorithms, collective intelligence or simulation models of the processes that occur in watersheds, is crucial to aid in decision making. Yao and Georgakakos [
6] find that reliable flow forecasts and adaptive decision support systems (DSSs) substantially benefit the performance of reservoirs and, consequently, the water supply system. For this, the DSS must be able to focus efforts on developing strategies to increase water supply and consciously control demand.
The effectiveness of the flow allocation model is directly linked to the ability of the optimization method to adapt to the study site and describe its characteristics. It can be seen that evolutionary and collective intelligence algorithms, coupled with reservoir simulation models, have been a frequent choice for use in water resources management and have generated consistent results at good convergence rates [
5,
7,
8,
9,
10,
11]. It is necessary to use techniques capable of assisting in the process of analysis, operation, planning and decision making in water resources systems in a deeper way than a simple balance between supply and demand.
The particle swarm optimization (PSO) collective intelligence method assumes a prominent position among probabilistic algorithms, being frequently applied in the most diverse areas and standing out among genetic algorithms for better results at shorter processing times [
12]. The model was inspired by the dynamics and behavior of socially organized populations in nature, which are influenced by the individual’s personal experience and the group’s knowledge. The PSO is an efficient, robust and easy-to-implement method with few parameters to be adjusted [
13]; therefore, it has gained space in the scientific field in the area of water supply with multiple water sources [
1,
8,
9,
14].
Searching for technologies and strategies to optimize the management of water resources is an indispensable tool to minimize supply inefficiencies. In the Brazilian semiarid region, especially in the Agreste region of Pernambuco (Brazil), there is a large concentration of people, few options for local sources, low rainfall and high evaporation rates, generating a conflict scenario that highlights the importance of strategic planning. Because of this scenario, the DSS developed seeks to obtain the allocation of flows from consumption centers in the Agreste region of Pernambuco through an integrated proposal for optimization via PSO coupled with a model of operational zoning of reservoirs, considering technical and economic criteria.
Some papers using the PSO method analyze the optimal allocation of water resources to competing water-use sectors, such as the agricultural, domestic, industrial and ecological sectors [
14,
15]. Others use reservoir operation models, such as the PSO coupled with MODSIM river basin decision support system [
16] to maximize the catchable flow to supply a total demand in the basin based on the fulfillment of guarantees [
1,
17]. Yan et al. [
9] chose to use the PSO, but this time to compare the results of the whale optimization algorithm (AWOA), which showed better rates of convergence and precision for the allocation of water resources in the Hadan province in China. In Brazil, Cirilo et al. [
11] adopted the PSO to define the flows to be transported from different sources to 18 locations, minimizing the corresponding costs. The decision variables were the discharge percentages from each source to each demand center and the model was applied in the Agreste region of the state of Pernambuco, this study being the precursor of the present study.
The present study uses the PSO coupled with a model of operational zoning of reservoirs, considering technical and economic criteria. A holistic view of the problem is sought, focusing on optimizing the operation of the reservoirs and discriminating the demands and impacts on all municipalities and villages in the study area. The flow allocation problem ranges from 26 water sources to 41 consumption centers belonging to the Agreste region of Pernambuco, Brazil. The system has reservoirs, pipelines and water-transfer works between basins. The high number of variables involved in the process, as well as the volume of input data of the model, increases the complexity of decision making. The reservoir operation model based on the general zoning of the reservoir capacity [
7] allows defining of a set of capturable flows based on reservoir operation scenarios and no longer on the usual concept of supply guarantees. The use of the PSO to allocate flows allows parallelization between the optimization of the operation of the reservoir and the operational costs of water transport with a focus on the full service of the consumption centers benefited by the project.
The main differences of this study in relation to the cited works that can be highlighted are (a) greater number of consumption centers and water sources involved in the process, increasing the number of variables of the problem and the complexity of the optimization process; (b) disaggregation of demands by consumer centers, considering infrastructure limitations, instead of using a total demand of the study area or categorizing conflicts of general use.
2. Study Area
The Brazilian semiarid region is usually affected by water scarcity problems, causing several socioeconomic and environmental impacts that impose obstacles to the region’s development. From the perspective of reducing the vulnerability of the population affected by the unavailability of water, promoting the rational use of water and circumventing the effects of droughts, several debates and public policies have emerged over time. The issue of public policies to combat and coexist with droughts has undergone major and marked transformations over the last two centuries, but there are still many challenges in water management.
Water scarcity depends on meteorological systems that operate in the region and large-scale climatic phenomena that influence the variables that define the behavior and circulation of the atmosphere [
18]. The northeastern semiarid region presents great spatial and temporal variability of rainfall, with irregular rainfall concentrated in a few months. This scenario, associated with the high potential for water evaporation, the dominant geological characteristics and climate change, which have increasingly intensified the problem of water scarcity, place the region on constant alert and promote the need to live with drought [
19,
20].
The state of Pernambuco has the most unfavorable water balance in Brazil, and the Pernambuco Agreste has the worst performance among all regions of the state [
20]. The Agreste region of Pernambuco is poor in terms of water flow from the rivers, which makes it impossible to fully supply the population and causes a series of conflicts over the use of water. In addition to the low rainfall, there is a high population density in the region, an absence of local sources that allow meeting demand, high evaporation rates and poor water quality, either due to soil salinity or sewage load.
Cirilo et al. [
21] highlight that, despite efforts to provide sufficient water, these measures are not enough to solve the problems arising from water scarcity, especially in rural areas. Therefore, technologies and alternatives for optimizing the management of water resources must be sought to minimize the problems of restricting water availability, and the need to transfer water between basins sometimes arises. In Pernambuco’s Agreste, transfers between basins and integrated systems are part of the strategy to solve the problem.
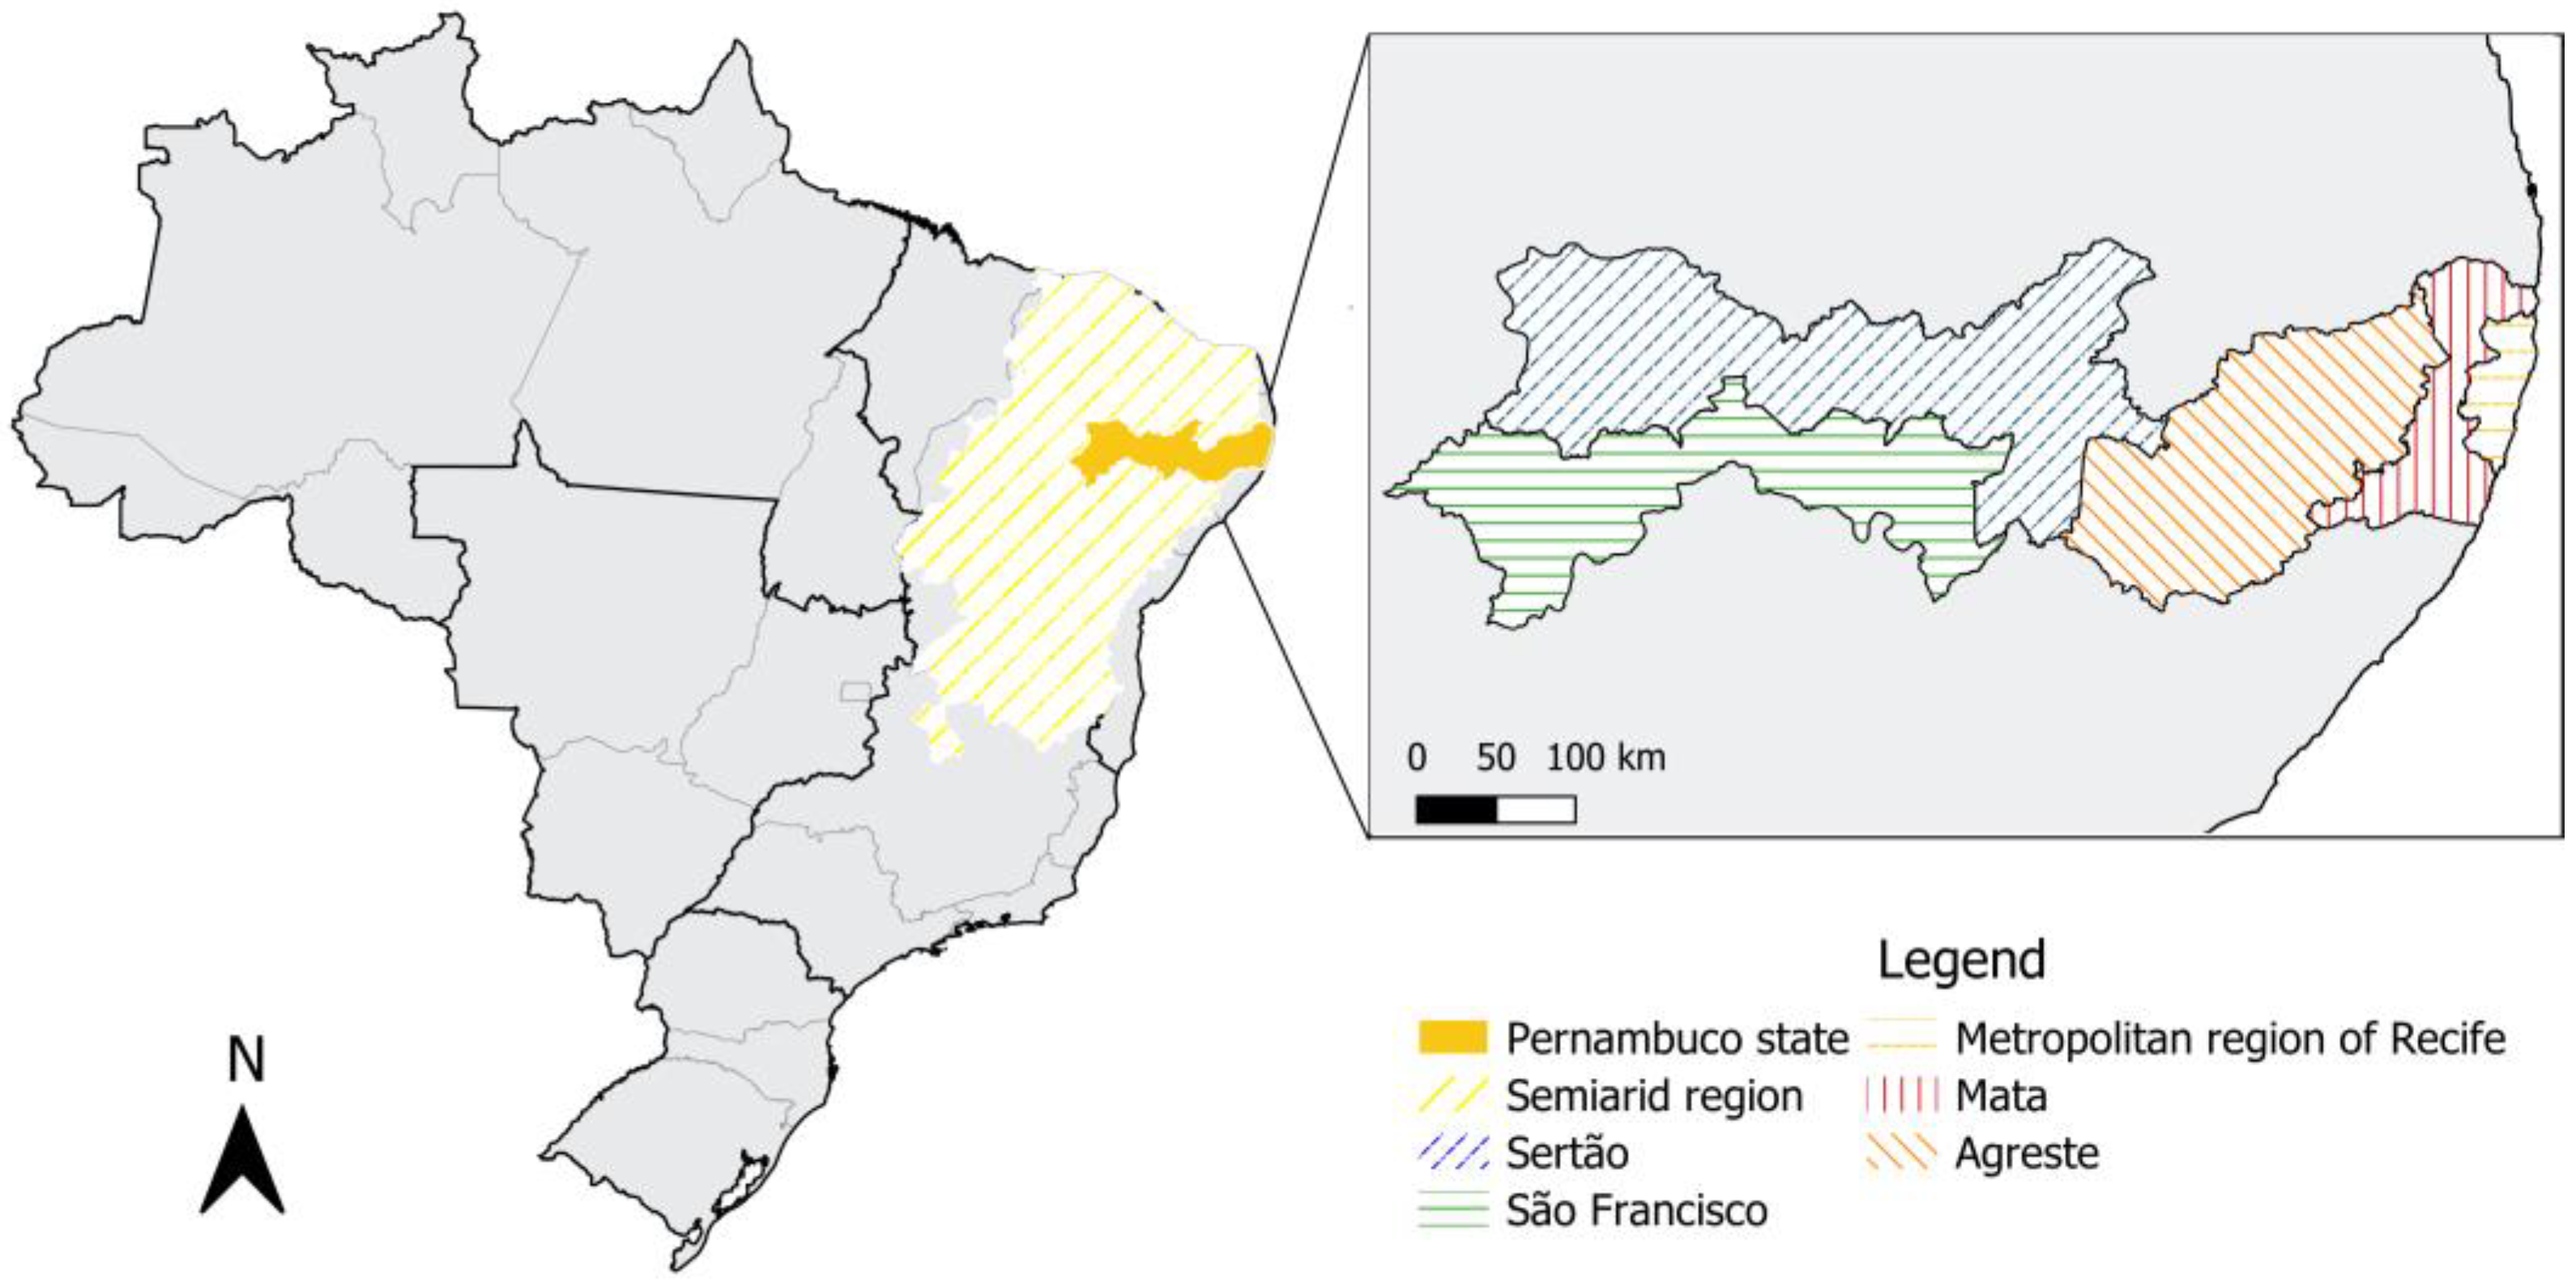
Figure 1 shows the location of the study area in the state of Pernambuco and Brazil.
The study area comprises parts of the hydrographic basins of the Capibaribe, Ipojuca, Una, Mundaú, Ipanema and Moxotó rivers. In all, there are 35 municipalities and 6 villages, 21 reservoirs and 5 pipelines, making up a universe of 41 consumption centers and 26 water sources. The possibility of allocating flows from different sources justifies the need for a DSS that facilitates the management of the region’s supply system.
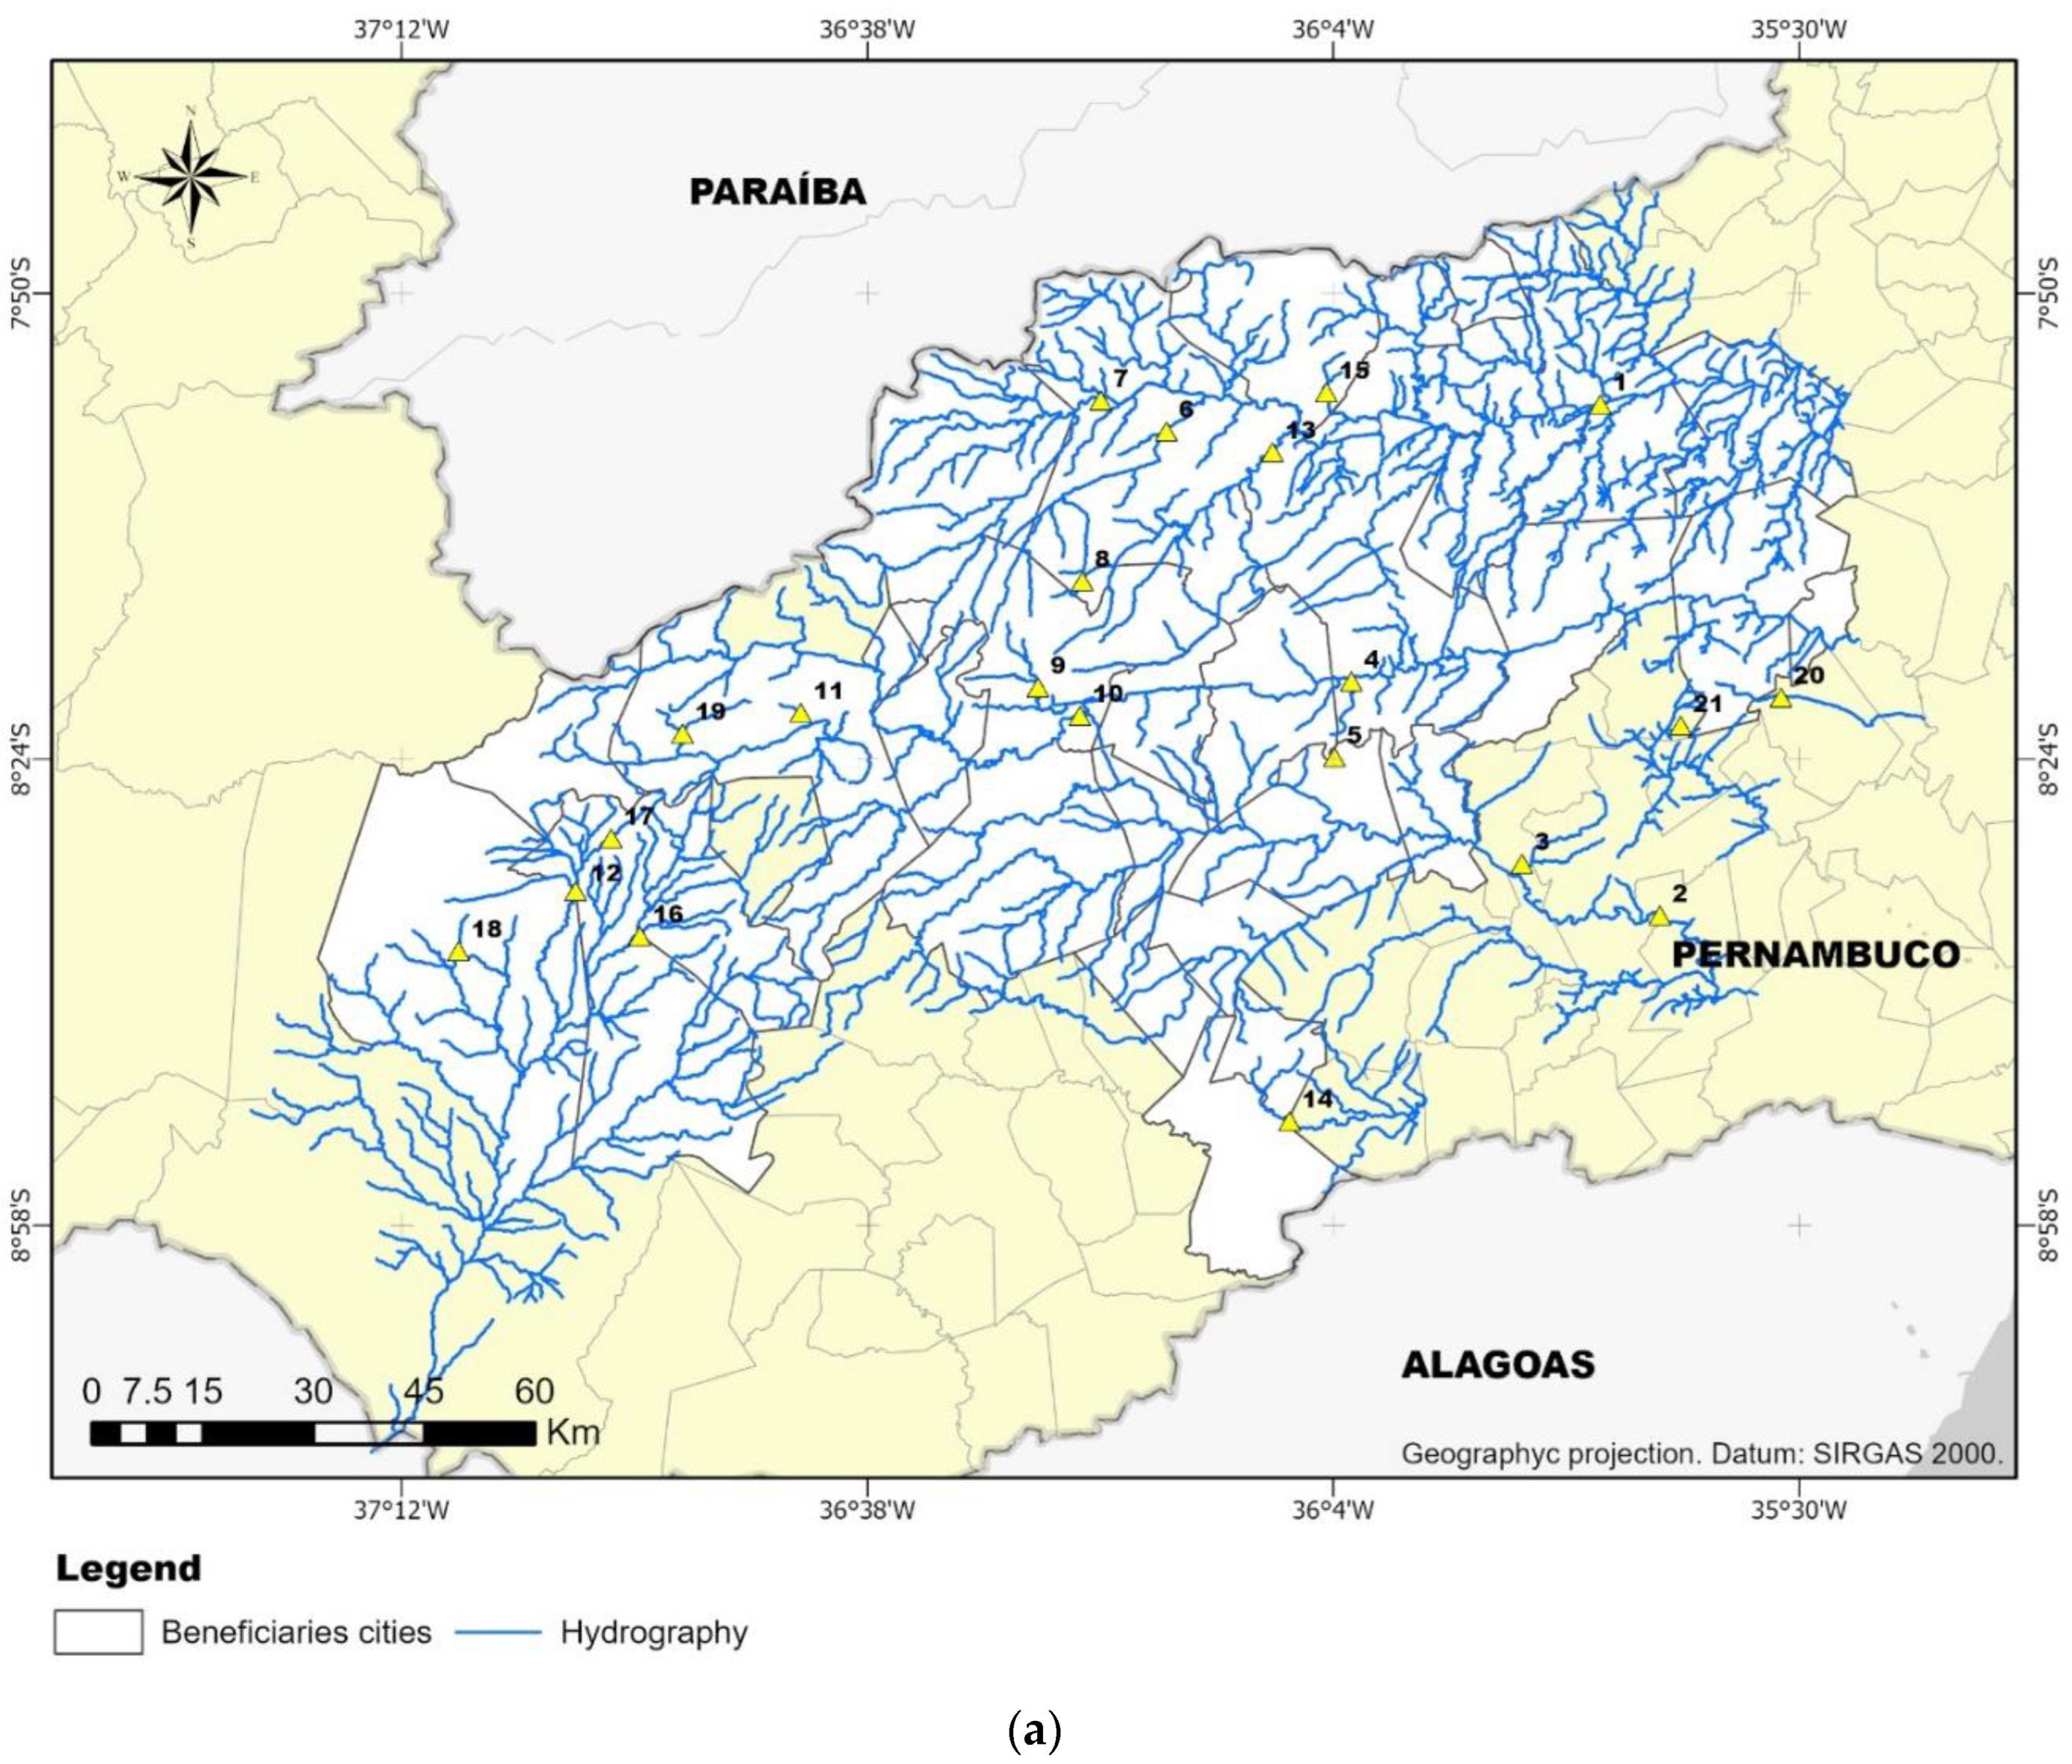
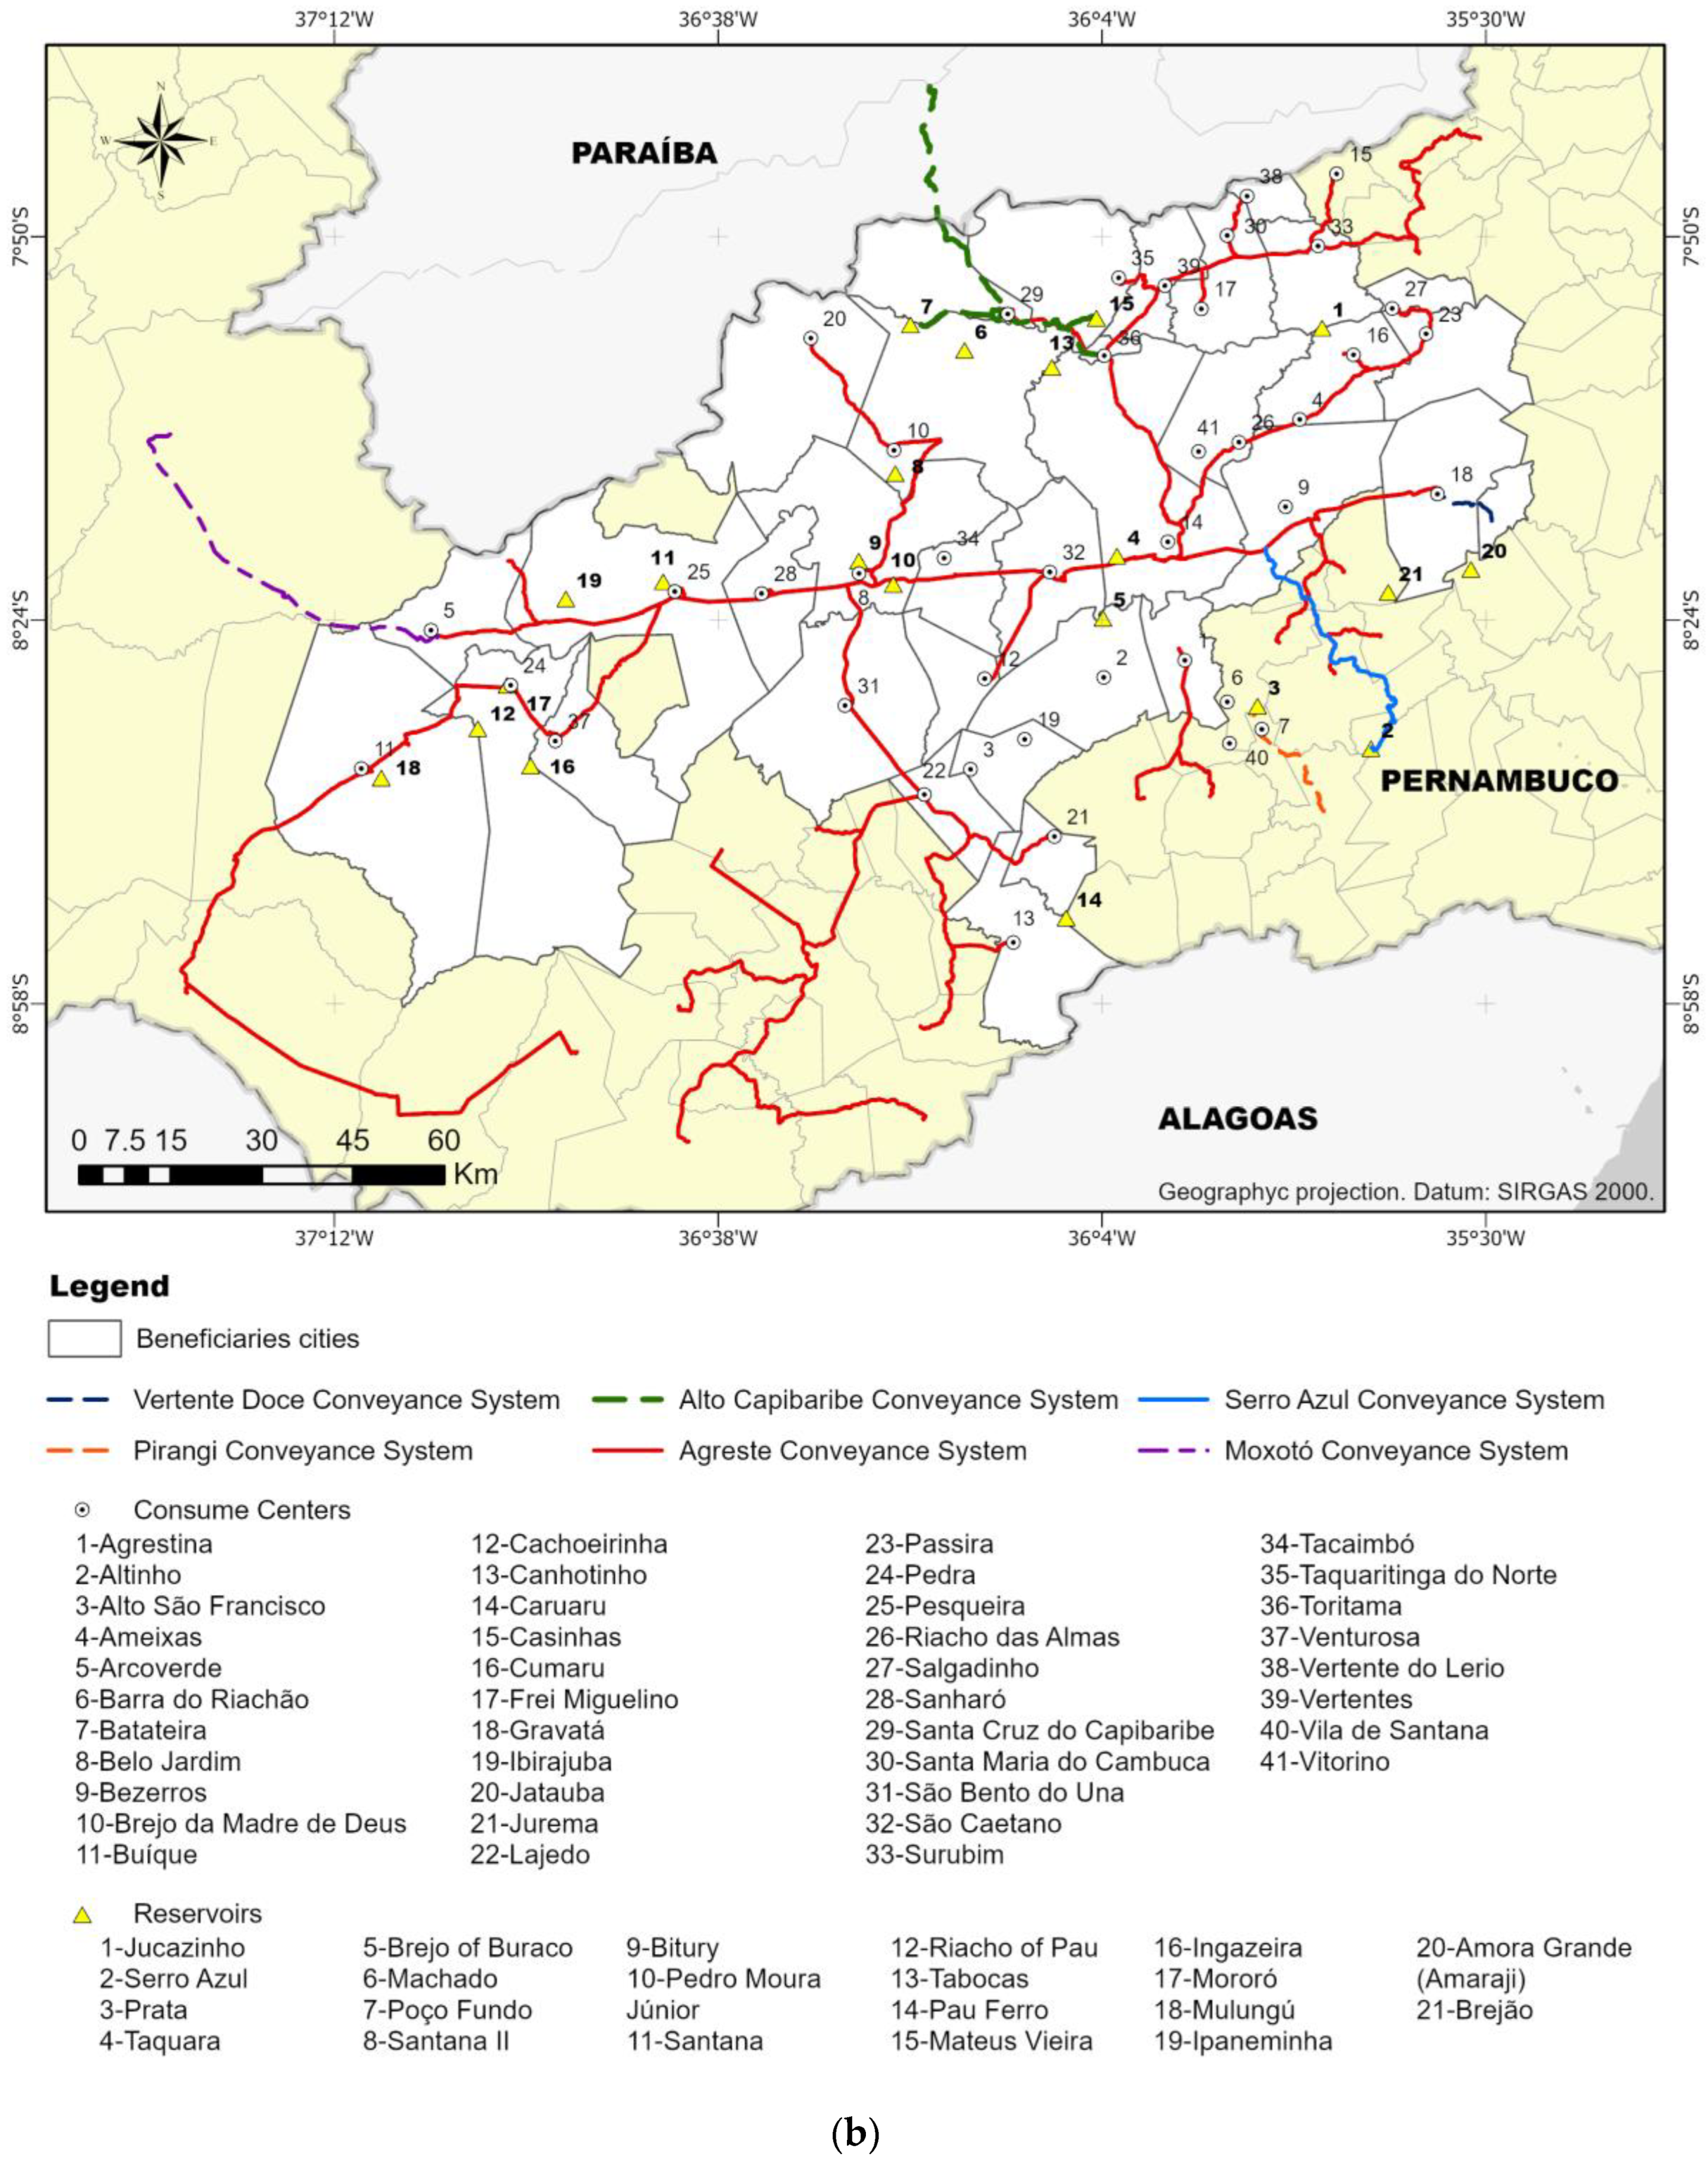
Figure 2 shows the hydrological network, the consumption centers and the infrastructure available for water supply in the region.
Caruaru is the main city in the Agreste region of Pernambuco. It is the second largest city in the state of Pernambuco and the third most populous in the countryside of the northeast region of Brazil, with a population of over 370,000 inhabitants. It is also an important educational, industrial and technological center of the region and located on 08°17′00″ latitude and 35°58′34″ longitude, away 130 km from Recife, the capital city of the state [
22]. The city has a negative water balance due to the influence of factors such as irregular rainfall in time and space, high evaporation rate, and the crystalline nature of the geology [
23]. The temperature varies from 11 °C to 38 °C, with an average annual precipitation of 680 mm, which is concentrated between March and July [
24].
To mitigate the impacts of water scarcity in the region, the Ministry of National Integration prepared the São Francisco River Integration Project (PISF), which began to be discussed and negotiated with state governments and with entities represented in basin and water bodies, effectively being designed in the 1990s. In its first conception, there was only one main channel called Eixo Norte with capture in the municipality of Cabrobó, PE, crossing this state and emptying into the networks of rivers in Paraíba, Ceará and Rio Grande do Norte. Following the disagreement of the Government of Pernambuco about this conception, the project of a second channel, called Eixo Leste, is destined to serve, through complementary works, the Agreste of Pernambuco and areas of Paraíba. The East Axis is currently in operation, feeding the Paraíba River and through it the Boqueirão Reservoir, the main source of the Paraíba city of Campina Grande, whose 410,000 inhabitants were in a situation of pre-collapse of water supply.
For the water from the São Francisco River to reach the Agreste of Pernambuco, some complementary works are necessary. The first is a channel, called Ramal do Agreste, which will interconnect the East Axis of the PISF to the water-treatment plant in the municipality of Arcoverde-PE, which constitutes the second complementary work. The channel was recently opened.
The ETA works are still at an early stage. The third is the Agreste Adductor System, a set of lifting systems with approximately 1300 km of pipes (divided into two phases) to serve 68 cities and at least 80 locations in the region. These works should already have been completed according to the originally established schedule. In 2011, the most severe drought occurred in the state, probably more severe than any in the last 80 to 100 years. Anticipating the delay of the PISF works, the Government of Pernambuco, in 2013, started a schedule of works in parallel to minimize the supply problem. These are the Pirangi and Serro Azul pipelines, from springs in the Mata Sul region of the state, the Siriji pipeline in Mata Norte, the drilling of a battery of wells in the Tupanatinga region, sedimentary aquifers and local systems derived from dams in the Southern Agreste.
More recently, also intending to anticipate the supply of cities from the São Francisco River, two pipelines are under construction: the Moxotó pipeline, derived from the Eixo Leste reservoir in the municipality of Ibimirim, with completed stages, and the Alto Capibaribe pipeline, from the Boqueirão reservoir, in Paraíba, which was the first source outside the São Francisco River basin to receive water from the PISF. In the general context, these sources should be interconnected wherever possible to the Agreste pipeline sections as they are completed to allow the transport of water to the cities.
In addition to the anticipation of supply, it is important to note that this multiplicity of water sources will represent a remarkable paradigm shift because the Agreste region will have different means of being supplied. For a region identified as having the most critical water balance in the country, it will undoubtedly be an extraordinary change that will boost its development.
3. Materials and Methods
3.1. Particle Swarm Optimization (PSO)
PSO was developed by Kennedy and Eberhart [
25] as a stochastic optimization algorithm based on social simulation models. The model is inspired by the dynamics and behavior of socially organized populations in nature, such as flocks of birds, schools of fish and herds of animals. In general terms, individuals in the population are represented by particles that move in a search space and are influenced by their own experience, the cognitive system, and through the knowledge of neighboring particles, the social system.
Kennedy et al. [
26] state that the process of cultural adaptation is based on the ability of particles to feel the environment and estimate their behavior, followed by the comparison of performances between the group and imitation of promising trajectories. The PSO structure requires particle initialization: the most usual technique is random uniform initialization, which means that each particle of the initial swarm and, consequently, the initial positions and velocities are described by sampling a uniform distribution over search space.
PSO uses two important sociometric principles, Gbest and Pbest, which represent, respectively, the best position in the search space traversed by any of the particles and the best individual position of the particle. Both focus on the adopted objective function, which guarantees the optimality of the problem solution. The impact exerted by the metrics Gbest and Pbest depends on two constants: the cognitive factor (c1) and the social factor (c2). Furthermore, the search space exploration capability is controlled by the inertia factor (ω), which brings a balance between global and local exploration, resulting in a smaller number of iterations to find the optimal solution.
Thus, a particle will move in a certain direction that is a function of some parameters: the current position x
i(t), the current velocity v
i(t), the inertia, the best position ever occupied by the particle (P
best) and the best position ever found by the swarm (G
best). The particle velocity is adjusted according to Equation (1):
where c
1 and c
2 are constants limited to a finite range, i is the analyzed particle, t is the current iteration and rand generates random values between 0 and 1, which help ensure that the particle does not get lost in local minima. The cognitive and social factors, c
1 and c
2, normally assume a value of 2 [
27].
After calculating the velocity of particle i, its position in the next iteration is established as the addition of the old position and the calculated velocity, expressed by Equation (2).
The inertia weight ω has a significant effect on the behavior of the algorithm and indicates the ability of the particles to maintain their current trajectory, reducing the disturbances that move them away from the best positions. Without inertia, even if a promising region of the search space was detected, the particles would oscillate in wide trajectories around their best positions. The refined search (i.e., around the best positions) requires strong attraction of particles toward promising regions and small changes in a position that prevent their escape from the close neighborhood [
28].
Global exploration has its most effective performance at the beginning of the process, as the particles are spread out in a very comprehensive search field. Therefore, it is recommended that ω takes on larger values at the beginning of the searches, and, over the iterations, its value is gradually reduced, thus ensuring a faster convergence. The suggestion, proposed by Eberhart and Shi [
27], was to use a linear variation of inertia with an initial value of 0.9 and a final value of 0.4, according to Equation (3).
where ω
ini and ω
end are the initial and final values, respectively, T is the total number of iterations and t is the current iteration.
3.2. Reservoirs Operation
To quantify the flow that can be captured in the reservoirs, the time series of flow and precipitation of stations close to the reservoirs were used. Assuming that the physical and climatic characteristics of the watershed are similar to the dam [
29], the daily flow was calculated in proportion to the drainage area between the fluviometric station and the drainage area controlled by each dam. The evaporation rate was obtained at the meteorological stations closest to each of the reservoirs. The historical series of flows and rainfall were obtained from the databases of the National Water and Basic Sanitation Agency (ANA) and the Pernambuco Water and Climate Agency. The Height x Area x Volume curves were calculated using geoprocessing tools and applied to the high-resolution MDT of the Pernambuco Tridimensional Program (PE3D) [
30].
The set of capturable flows was obtained through the concept of general zoning of the reservoir capacity for the operating rules based on the storage status at the beginning of each time [
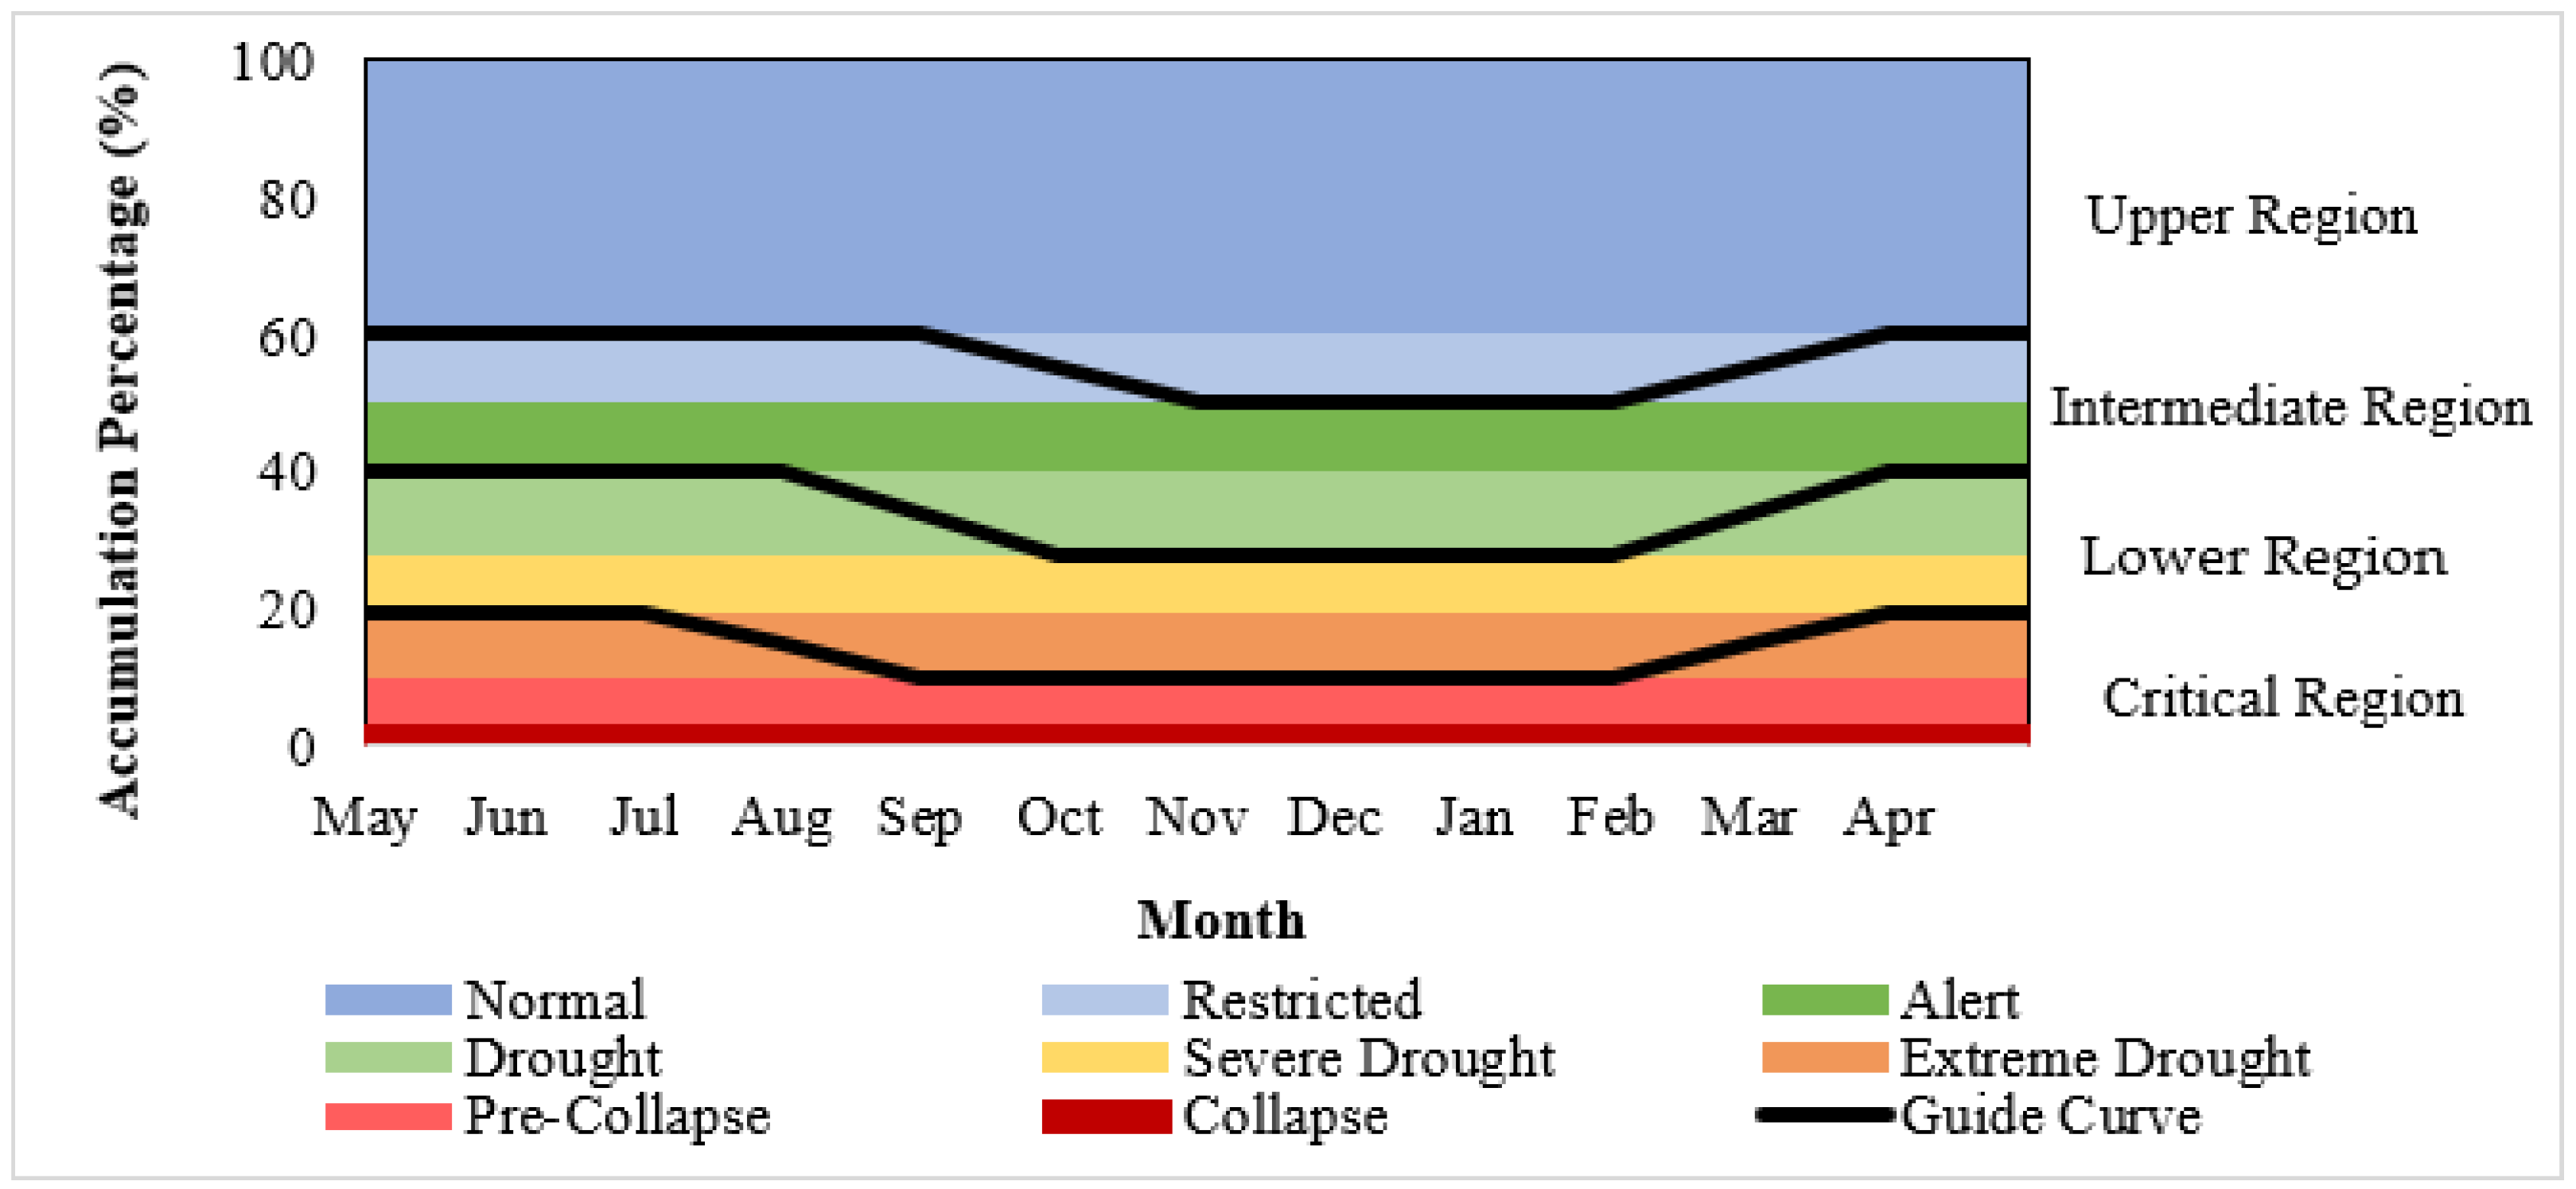
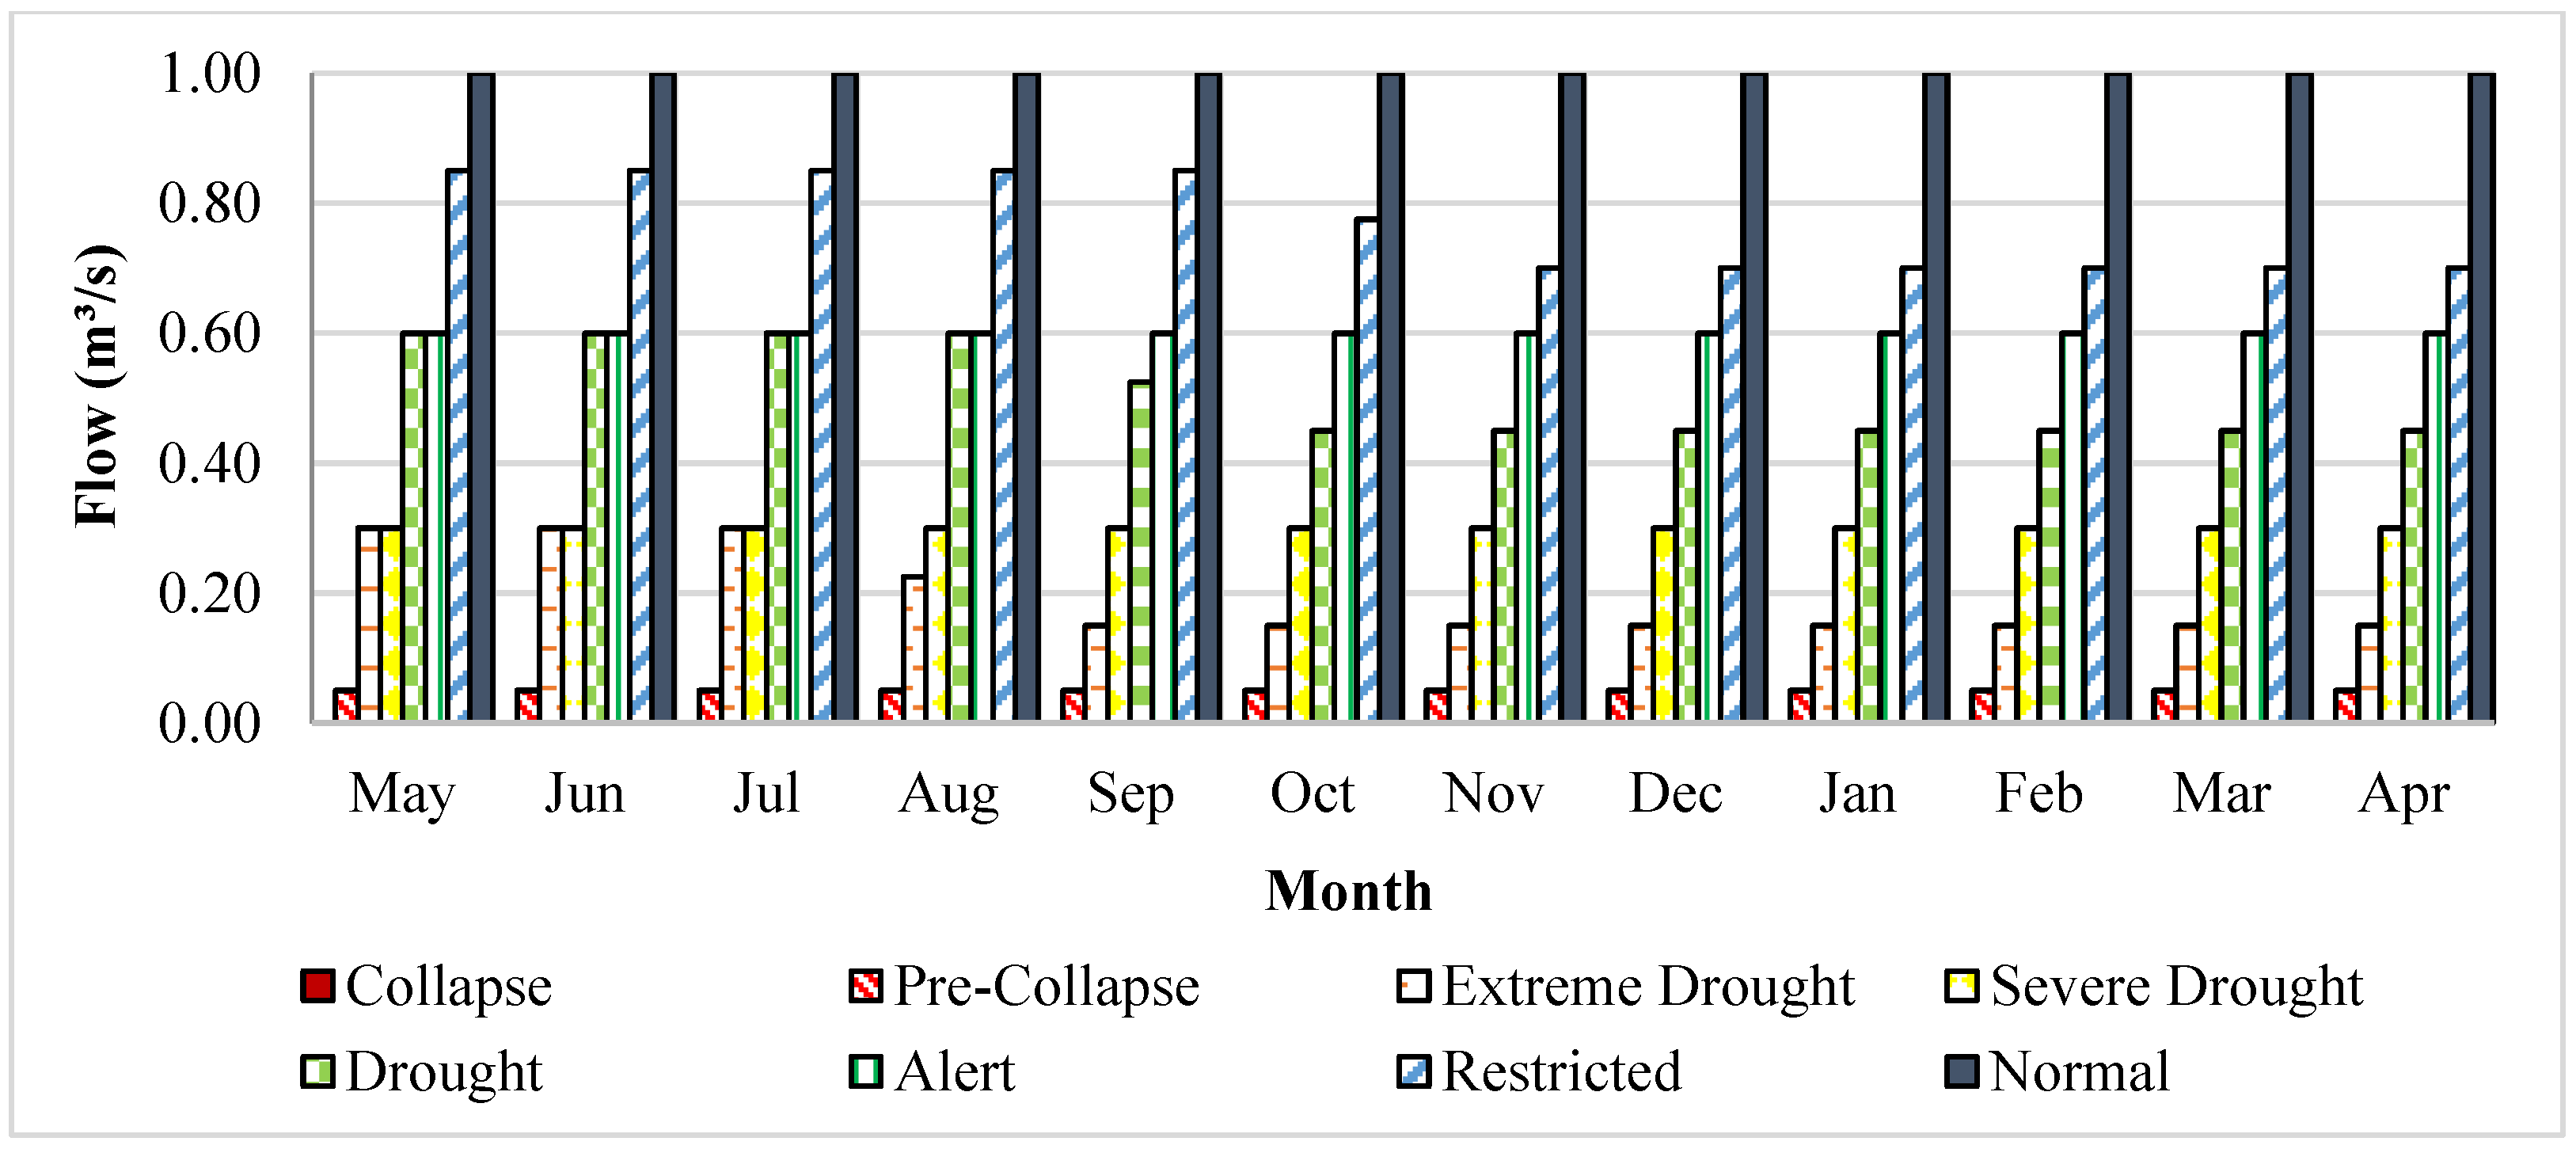
7]. Operation scenarios were defined based on percentage ranges of the reservoirs’ storage, namely the following: collapse, pre-collapse, extreme drought, severe drought, drought, alert, restricted operation and normal operation. The percentage ranges are based on the reservoir zoning guide curves, considering the hydrological year for the analysis. For each guide curve, there are two restriction levels, separated by a transition period (i.e., their duration depending on the level of water accumulation in the reservoir) so that when the reservoir’s situation is more critical, the time is longer with more severe restriction.
Figure 3 illustrates the guide curves and accumulation scenarios for one of the reservoirs in the study area, the Prata reservoir, followed by the respective flow distribution (
Figure 4).
3.3. Decision Support System
The optimization process corresponds to the allocation of water from sources (NS) to consumption centers (NC). The decision variables were the set of percentage values (Xi,j) of the maximum flow Qj,t that can be captured from each reservoir or transported through the pipeline systems that make up the water transfers between basins. This approach allows capturing water from sources proportionally depending on an increase or decrease in water availability.
DSS provides subsidies for water allocation each month. The annual historical series of inflows to each reservoir, with 40 years of daily data, were classified into five classes: (a) year with rainfall much above average; (b) above average; (c) on average; (d) below average; and (e) well below average. The definition of a climate scenario at the time the DSS is rotated leads to the choice of data from one of the classes to feed the operation of the reservoirs and, consequently, to the decision of the recommended flow rates for capture in each one of them. Simulations are performed with daily time steps and allocated flow (decision variables) throughout the month under analysis.
Because this is an optimization problem governed by constraint and boundary conditions, penalties are applied to the optimization process, causing solutions that violate the constraints to be discarded immediately and disregarded in the following solutions. The application of a penalty guarantees that the sum of the corrected flows allocated to the consumption centers of a given source j in any period t does not exceed the water availability of the source.
DSS seeks to find economically viable solutions that respect infrastructural, operational and water availability constraints from sources. For this, the objective function to be optimized depends directly on the operating costs of the systems and on penalties capable of guiding the model through the search space, as shown in Equation (4). The penalty function is based on the constraints of the problem and guarantees that the maximum flows are not exceeded.
where q
i,j,t is the final corrected flow allocated from source j to consumption center i at time t, c
i,j is the average energy cost of pumps in section i–j per m
3 of water transported and f
j is the cost of source j of different natures to energy costs, comprising the sum of water purchase and/or treatment costs, personnel costs and others that may be considered significant for decision making. Q
j,t is the water availability of source j at time t, and β is the penalty factor, equivalent to a fine of USD 190,000.00 per m
3/s, exceeding the maximum flow that can be supplied by the water source.
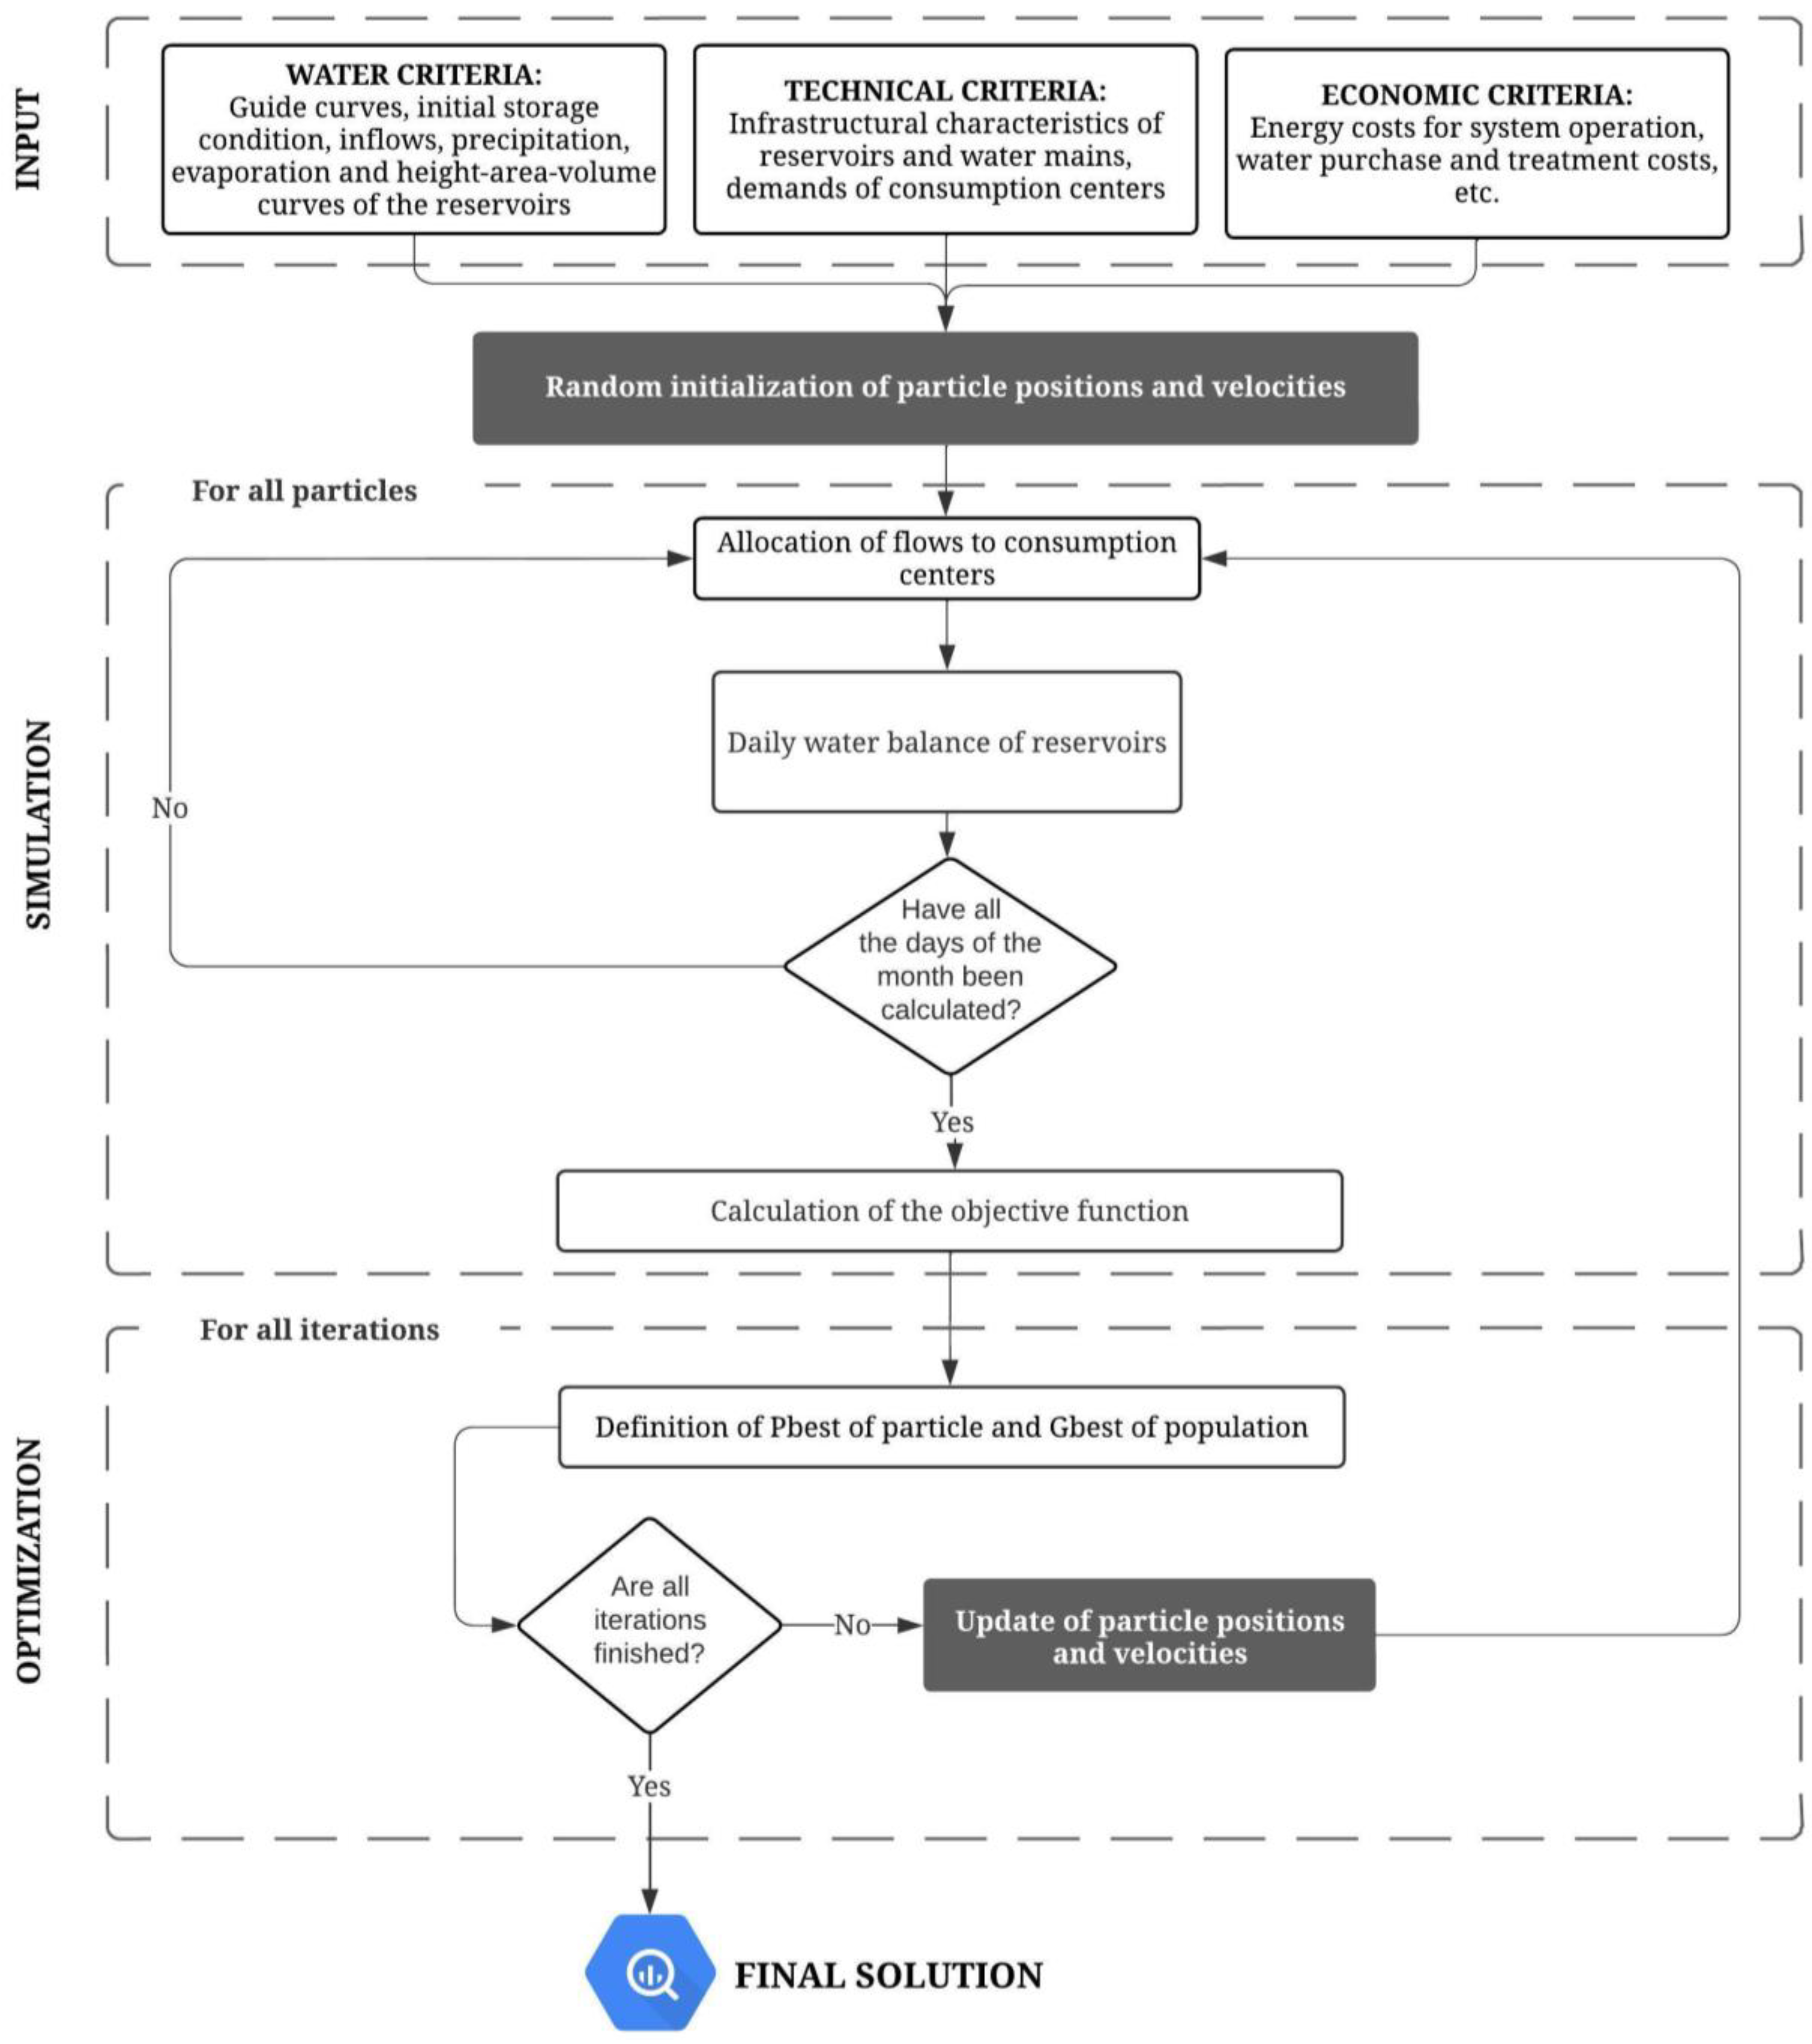
The input information concerning water, technical and economic nature from the DSS allows for a safer simulation of the systems’ operation. The water order criteria describe important conditions for the functioning of the reservoirs, such as guide curves and Height x Area x Volume curves, initial percentage of reservoir accumulation and historical series of inflow, precipitation and evaporation. The technical criteria characterize the infrastructure of the system and the demands of consumption centers. The economic criteria are the unit costs associated with the costs of energy consumed in the water-pumping stations that make up the system, in addition to costs for water treatment and payment for raw water, when applicable.
In the optimization process, the initialization of particle positions occurs randomly by uniform distribution rules from a predefined interval. The decision variables must assume values that are physically possible and restricted to demand conditions at consumption centers and water availability from sources.
Figure 5 shows the DSS flowchart. At each iteration of the optimization, the simulation process is performed for the total particle population, providing information that is compared later and that offers support for decision making.
4. Results and Discussion
Once the maximum flows that can be captured from the reservoirs are defined, as well as the water transport limitations of the adductor systems, the DSS allocates water from each water source to each consumption center. The allocation problem defines the functioning of the integrated supply system composed of 41 consumption centers and 26 water sources (NC = 41, NS = 26). In the simulation, a solution is obtained for the current month because the weather forecast may change in the following months. The optimal solution must be able to operate with minimum costs under technical and water criteria, in addition to presenting a satisfactory performance for the analyzed historical series.
It was assumed that each reservoir starts from an initial condition of 50% of accumulation volume at the beginning of the month, and the DSS presented in this work considers the possibility of bidirectional flow: depending on the availability of water in the reservoirs, the pipelines that take water to the cities can be supplied by more than one source and eventually by flow reversal. In the context of this work, the months of February, which is part of the dry season, and July, which is considered a rainy month, were selected to represent the dry and wet periods. The climate forecast scenario for the simulation was rainfall at the historical average.
Figure 6 shows the flow distribution for consumption centers with a demand greater than 0.2 m
3/s in February and July. It can be seen that the rainy season and the consequent increase in the level of accumulation in the reservoirs result in the allocation of more water to the consumption centers. There is a significant increase in the flow captured from the Jucazinho reservoir, equivalent to more than 30% of the supply to the municipality of Caruaru in July, and the Tabocas reservoir, which is now responsible for most of the water supply to the municipality of Santa Cruz do Capibaribe. This flow arrangement allowed for a greater contribution from the Agreste pipeline to the municipality of Arcoverde, but there was no significant interference for the other municipalities.
In both simulations, it was possible to notice the economic viability of the Agreste pipeline, which, in periods of drought, is the most used water source. This pipeline would be responsible for supplying more than 40% of the demand of the study area in the simulations made, and this choice in the optimization process is due to the high average energy costs practiced in the region for the continuous operation of the system. In the case of the Agreste pipeline, the cost of water is charged per m3 consumed plus a fixed cost resulting from the contracted demand and is independent of energy tariffs.
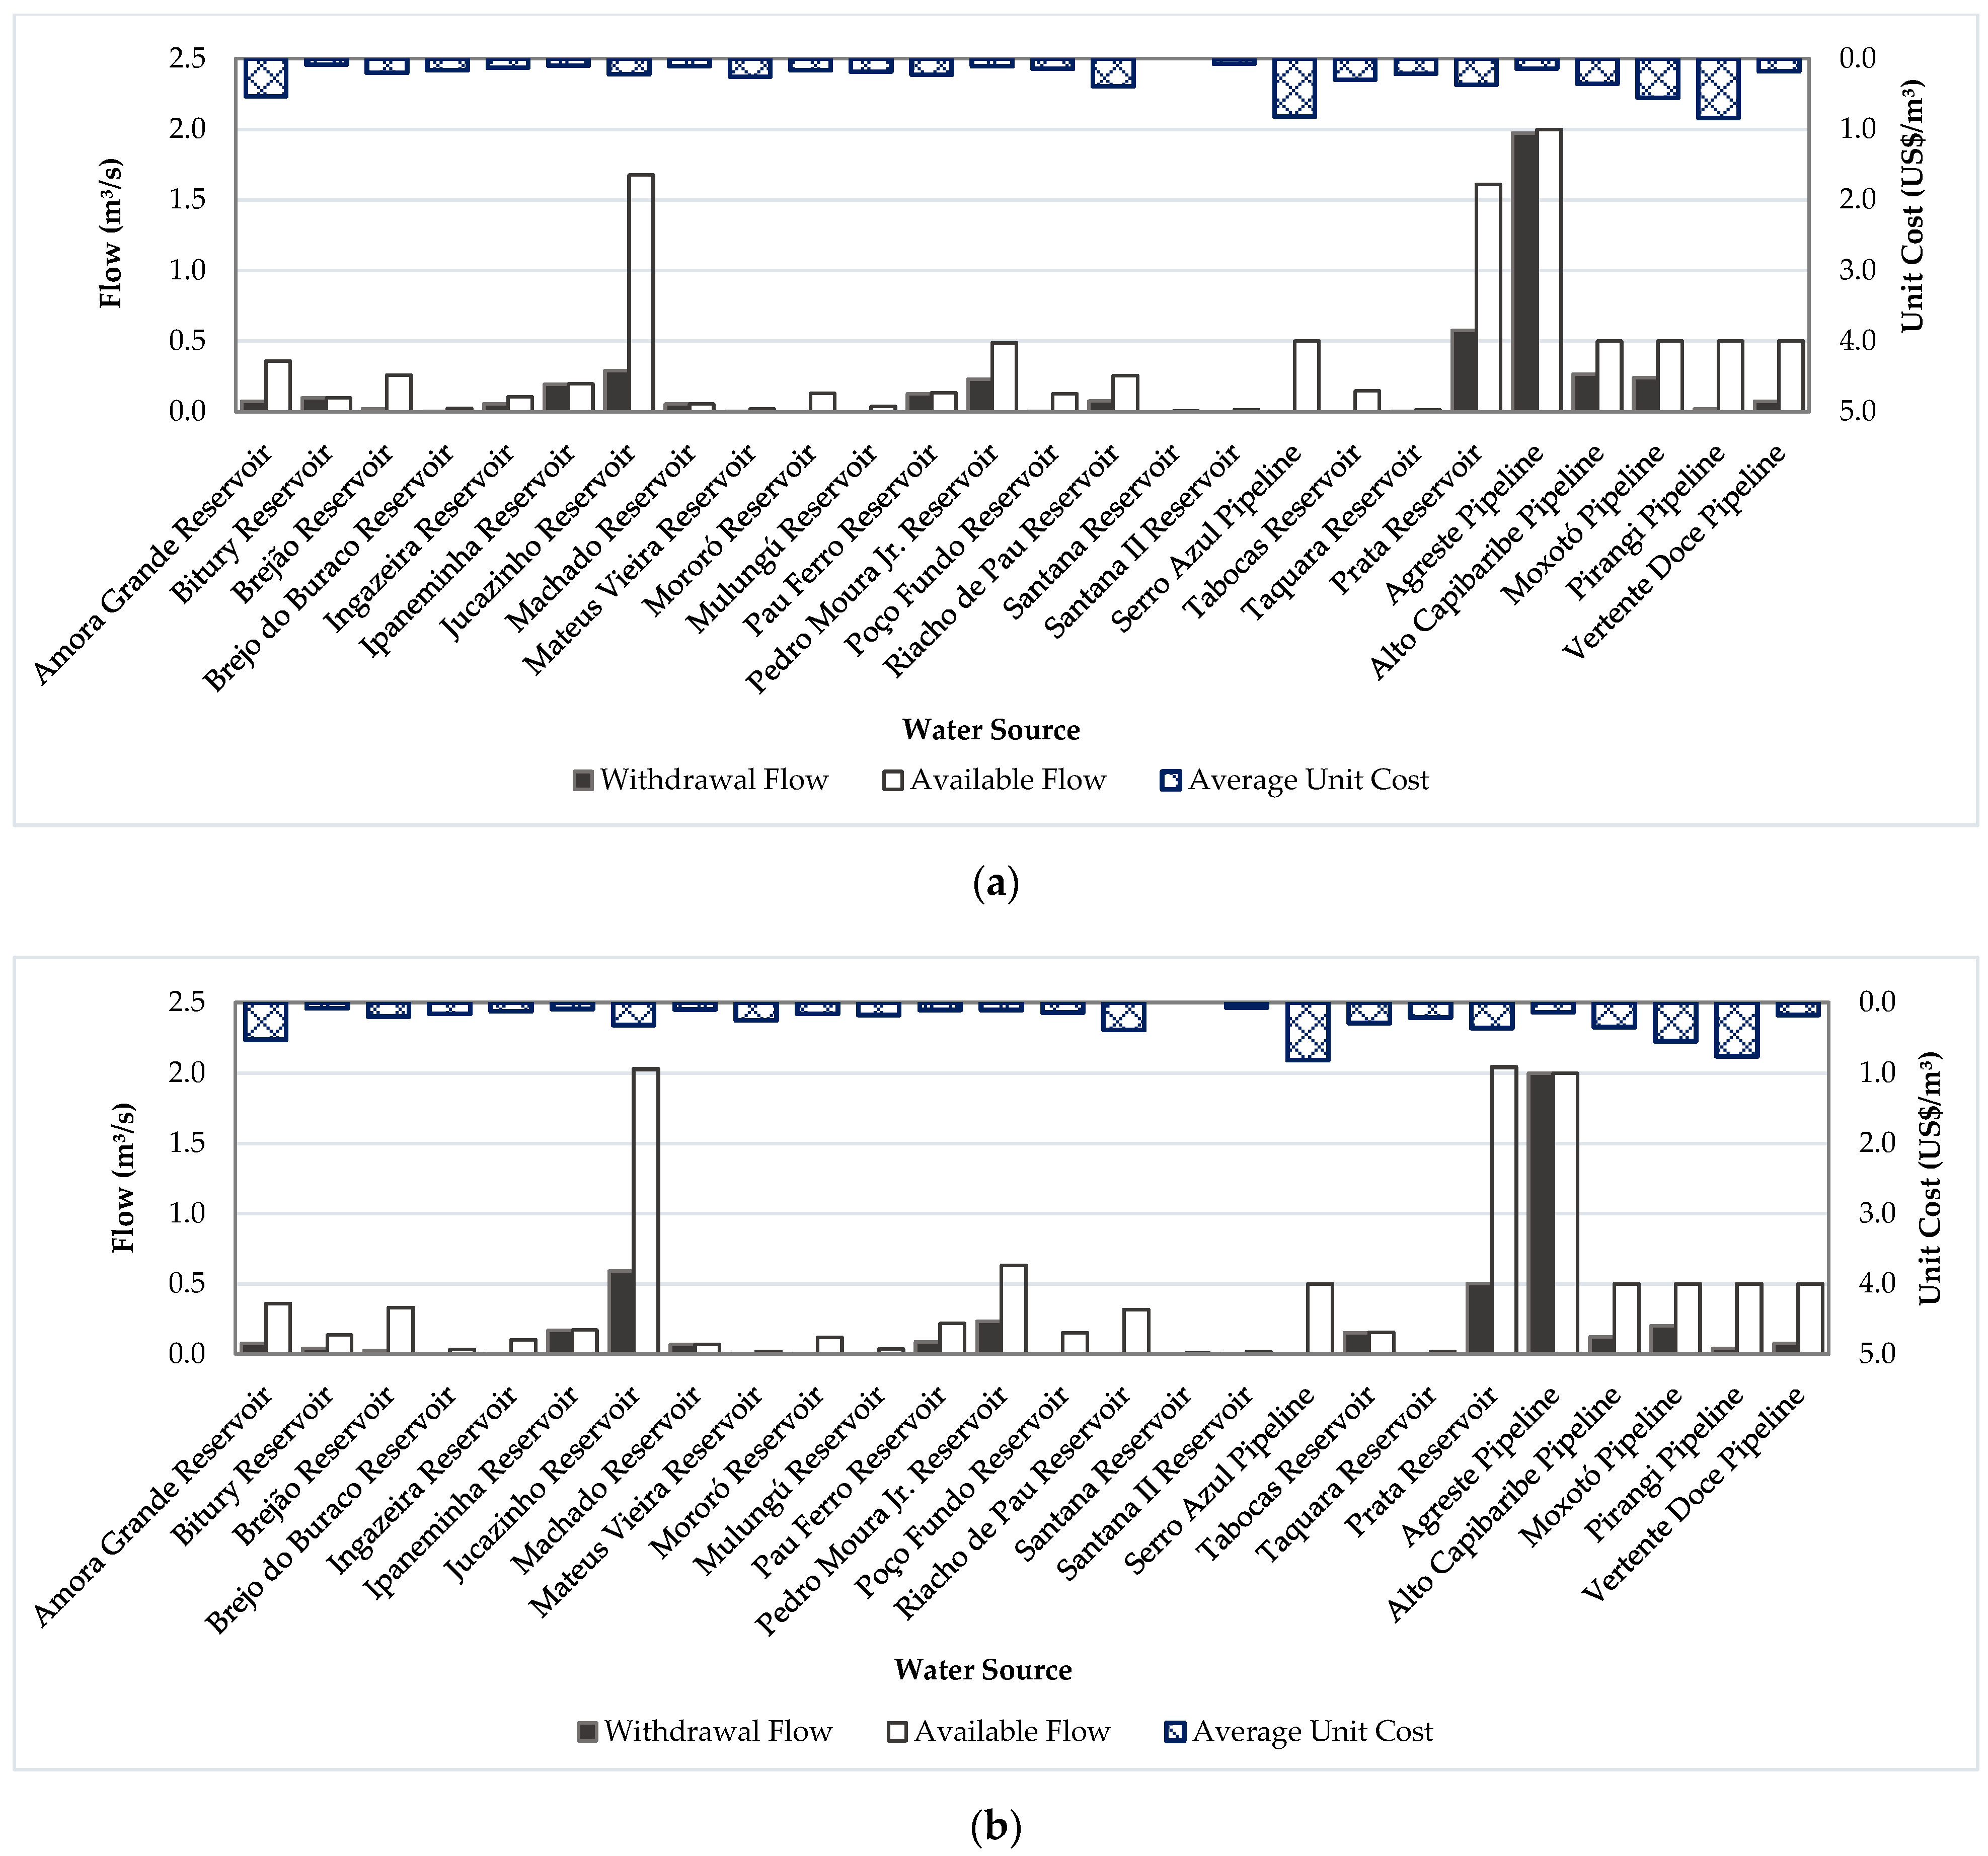
With the increase in the water availability of the reservoirs throughout the month due to the increase in rainfall and inflows, the DSS leads to a path of greater use of the reservoirs and consequent reduction in water transport through the pipelines whose costs are less viable, such as the Alto Capibaribe and Moxotó pipelines, which can be seen from the results in
Figure 7.
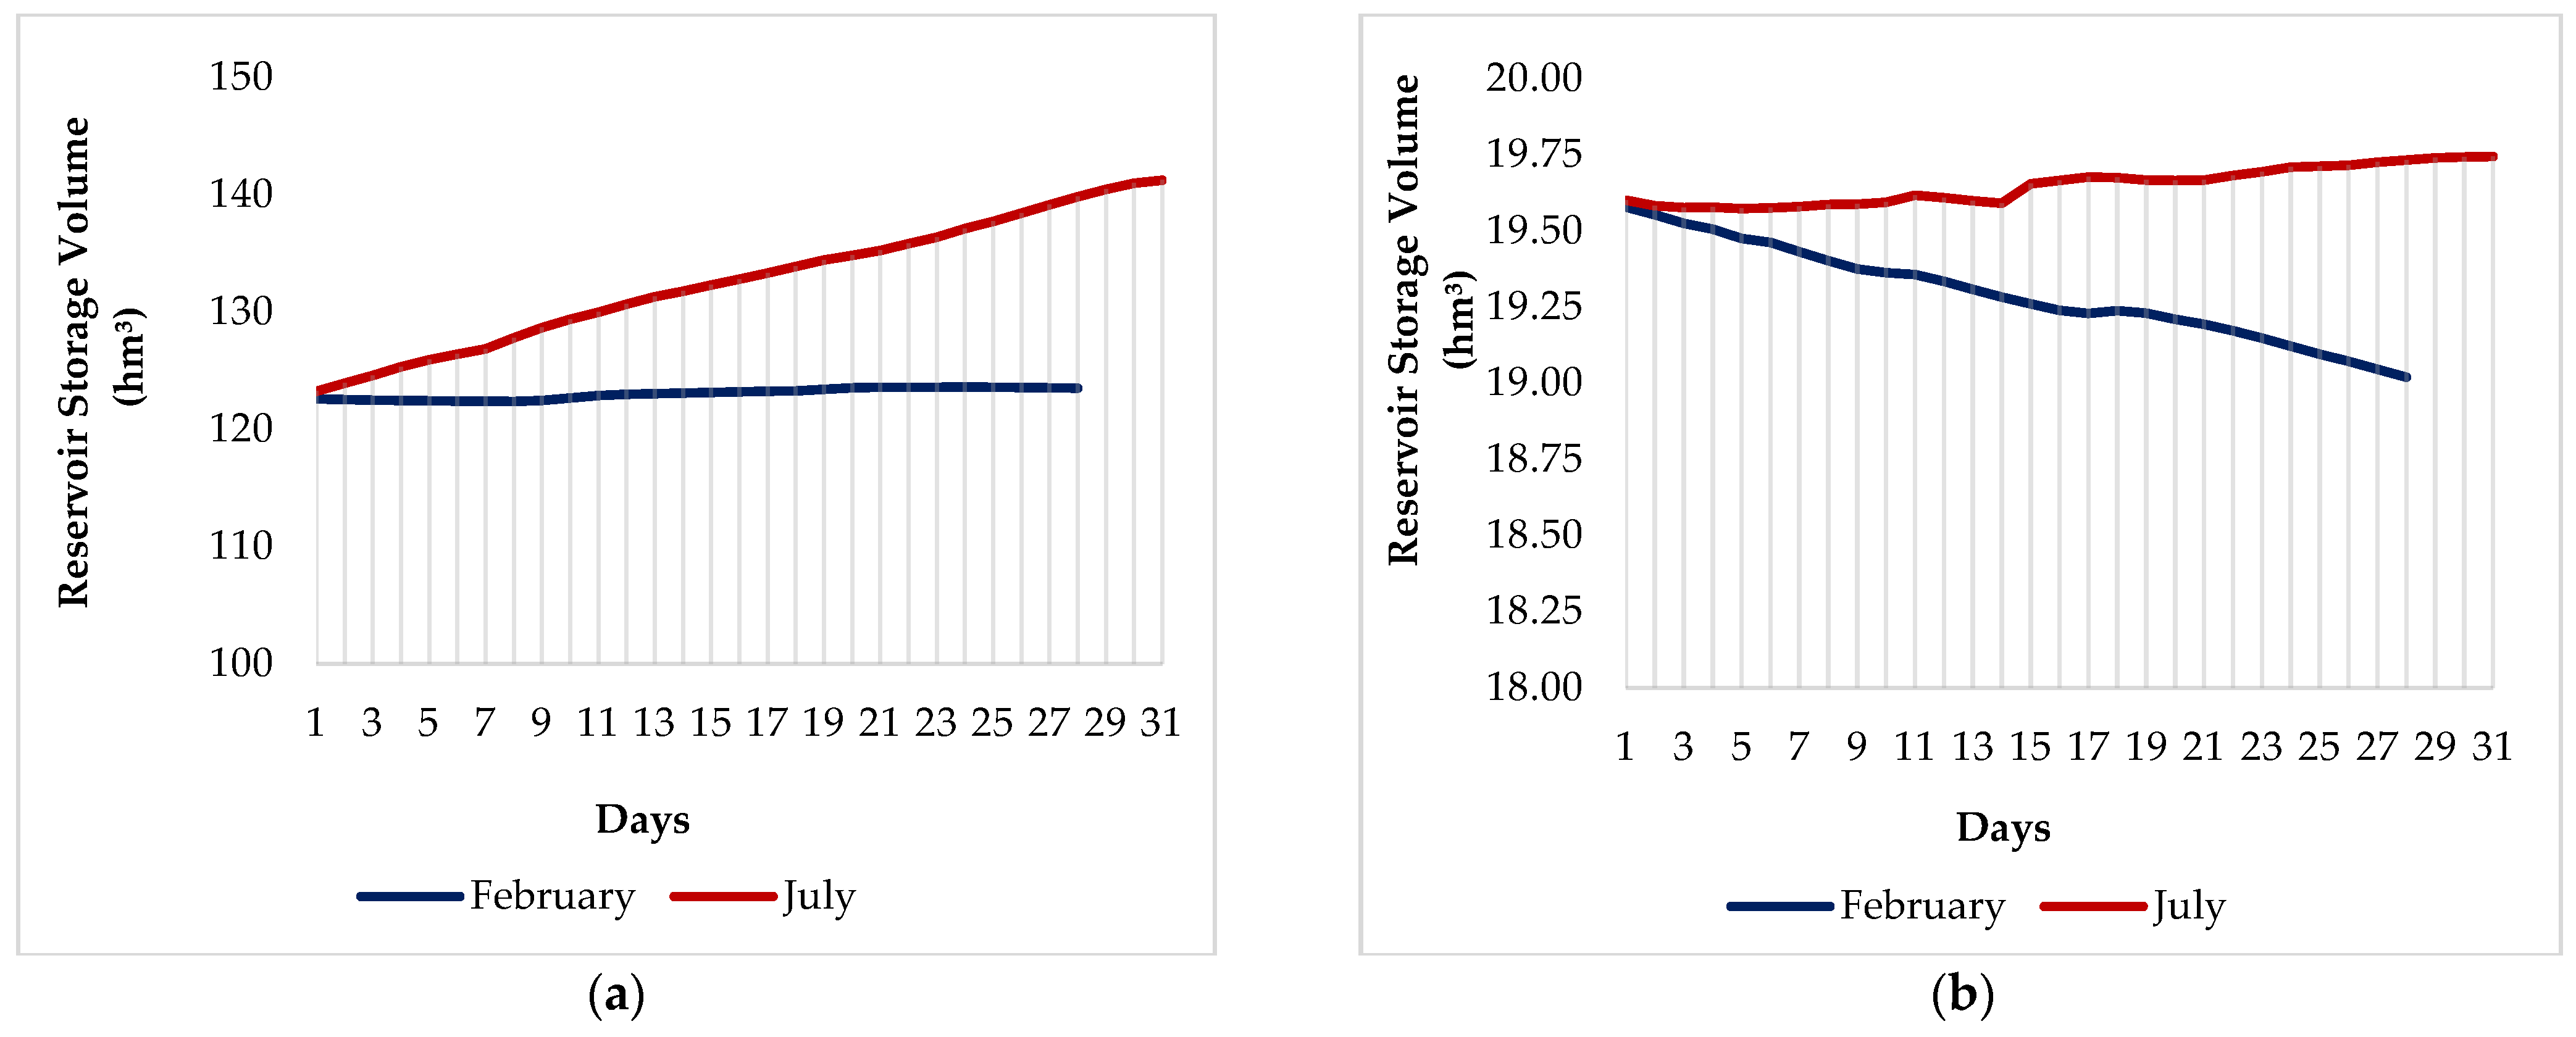
Figure 8 shows how the accumulation of the Jucazinho and Prata reservoirs behaves, which are the main and most used reservoirs in the study area. Both start the month with 50% of their maximum capacity and follow different paths depending on the analyzed month. For the Prata reservoir, whose capacity is smaller, the variations are few throughout the month, but it is noted that the storage condition of the reservoir is slightly higher than the initial one at the end of July, whereas the opposite happens in February. For the Jucazinho reservoir, there is a considerable increase in the volume of accumulation in July, equivalent to 18 hm
3, whereas the reservoir does not undergo significant changes in February. It is noticeable that, for both reservoirs, the abstraction is below the availability of the water source, which highlights the existence of more viable sources to supply the demands.
The increase in the volume of accumulation in the reservoirs leads to an increase in water availability and consequent greater use of the source. DSS solutions are percentage values of source availability and, therefore, a higher available flow is directly reflected in a higher captured flow. This mechanism allows the process to prioritize local sources, even if water transfer pipelines between basins are more economically viable. In
Table 1, the average costs of supplying each water source are shown, allowing the conclusion that the total cost of operation is higher in the rainy season than in the dry season. This result highlights inefficient pumping stations and high energy tariffs, which make it difficult to take advantage of nearby reservoirs and lead the system to choose to use almost exclusively the available flow from the Agreste pipeline.
The Jucazinho reservoir, whose available flows for February and July were 1.68 m3/s and 2.03 m3/s, respectively, provided only 0.29 m3/s in February and 0.59 m3/s in July. This is not an isolated situation, given the low utilization of the Prata reservoir, in addition to the small reservoirs that were also underexploited. In general, the Agreste pipeline stands out for supplying the region, followed by the Jucazinho and Prata reservoirs, and the Moxotó and Alto Capibaribe pipelines. The other sources make a negligible contribution, supplying few consumption centers. It is also noted that the increase in the flow captured from Jucazinho reduced the operational costs of the Moxotó and Alto Capibaribe pipelines, although globally this solution is less economically viable.
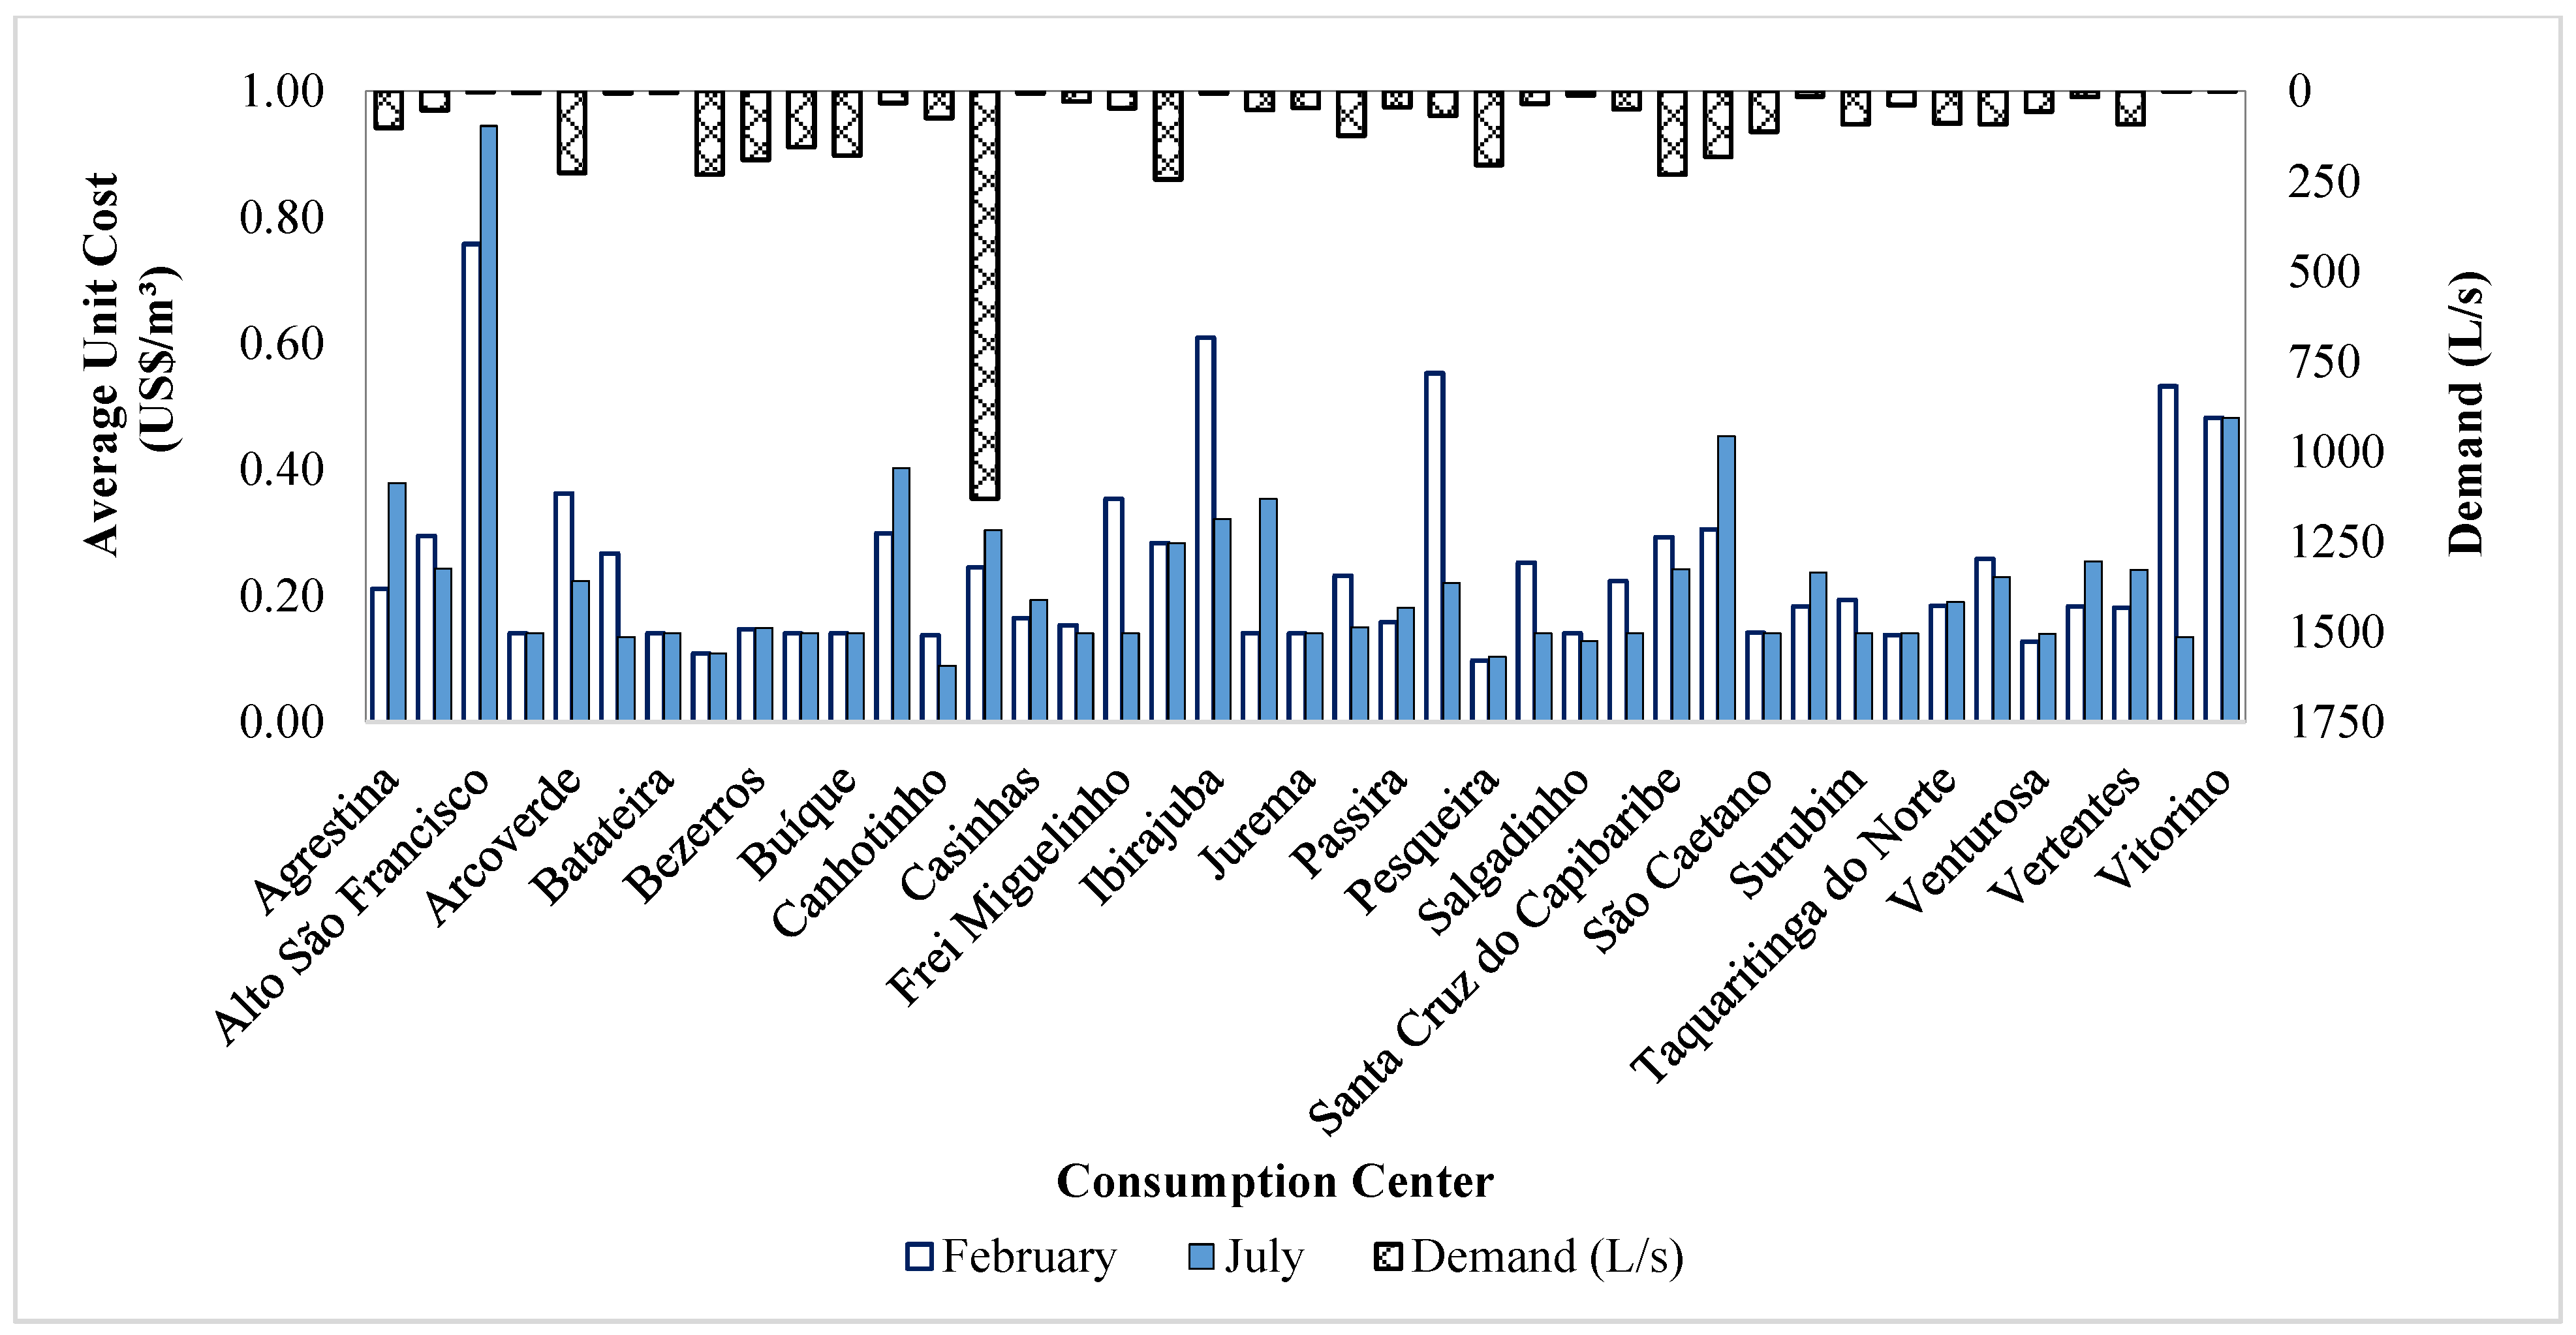
DSS is designed to process large amounts of data, simulate various solutions, support optimization models and provide clear reports with important information. Despite the solution being a key part of the optimization process, the clarity of the reports provided by DSS allows for identifying provision inefficiencies and focusing efforts to improve service delivery. Metrics of costs per water source and unit costs per consumption center offer support to identify problem points in the supply of the study area, serving as the initial step for more detailed investigations and infrastructure improvements.
Figure 9 shows the demands of consumption centers and the average unit costs for supply in the simulated months. It can be seen that most demands are low, with the municipality of Caruaru having the highest demand, equivalent to 1.130 m
3/s, but the average for the study area is only 0.107 m
3/s. Without the use of multiple water sources, the municipality of Caruaru is subject to significant water rationing, driven mainly by the lack of rain, the deficiency in water distribution and the higher demand required, as highlighted by Silva et al. [
31].
It was possible to notice that most consumption centers categorized as villages and, therefore, with very low demands, have higher unit costs, as is the case of Alto São Francisco, Vila de Santana and Vitorino. In general, costs tend to increase for the July simulation due to the greater use of reservoirs. The municipality of Caruaru, for example, had no input from the Jucazinho reservoir in February, and the results indicated an average unit supply cost of 0.245 USD/m3. In June, with more than 30% of its demand supplied by the Jucazinho reservoir, the cost was raised to 0.304 USD/m3. Despite this, about 24% of the consumption centers did not have considerable changes between the months, meaning a low influence of the rainy and dry periods on the distribution of flows.
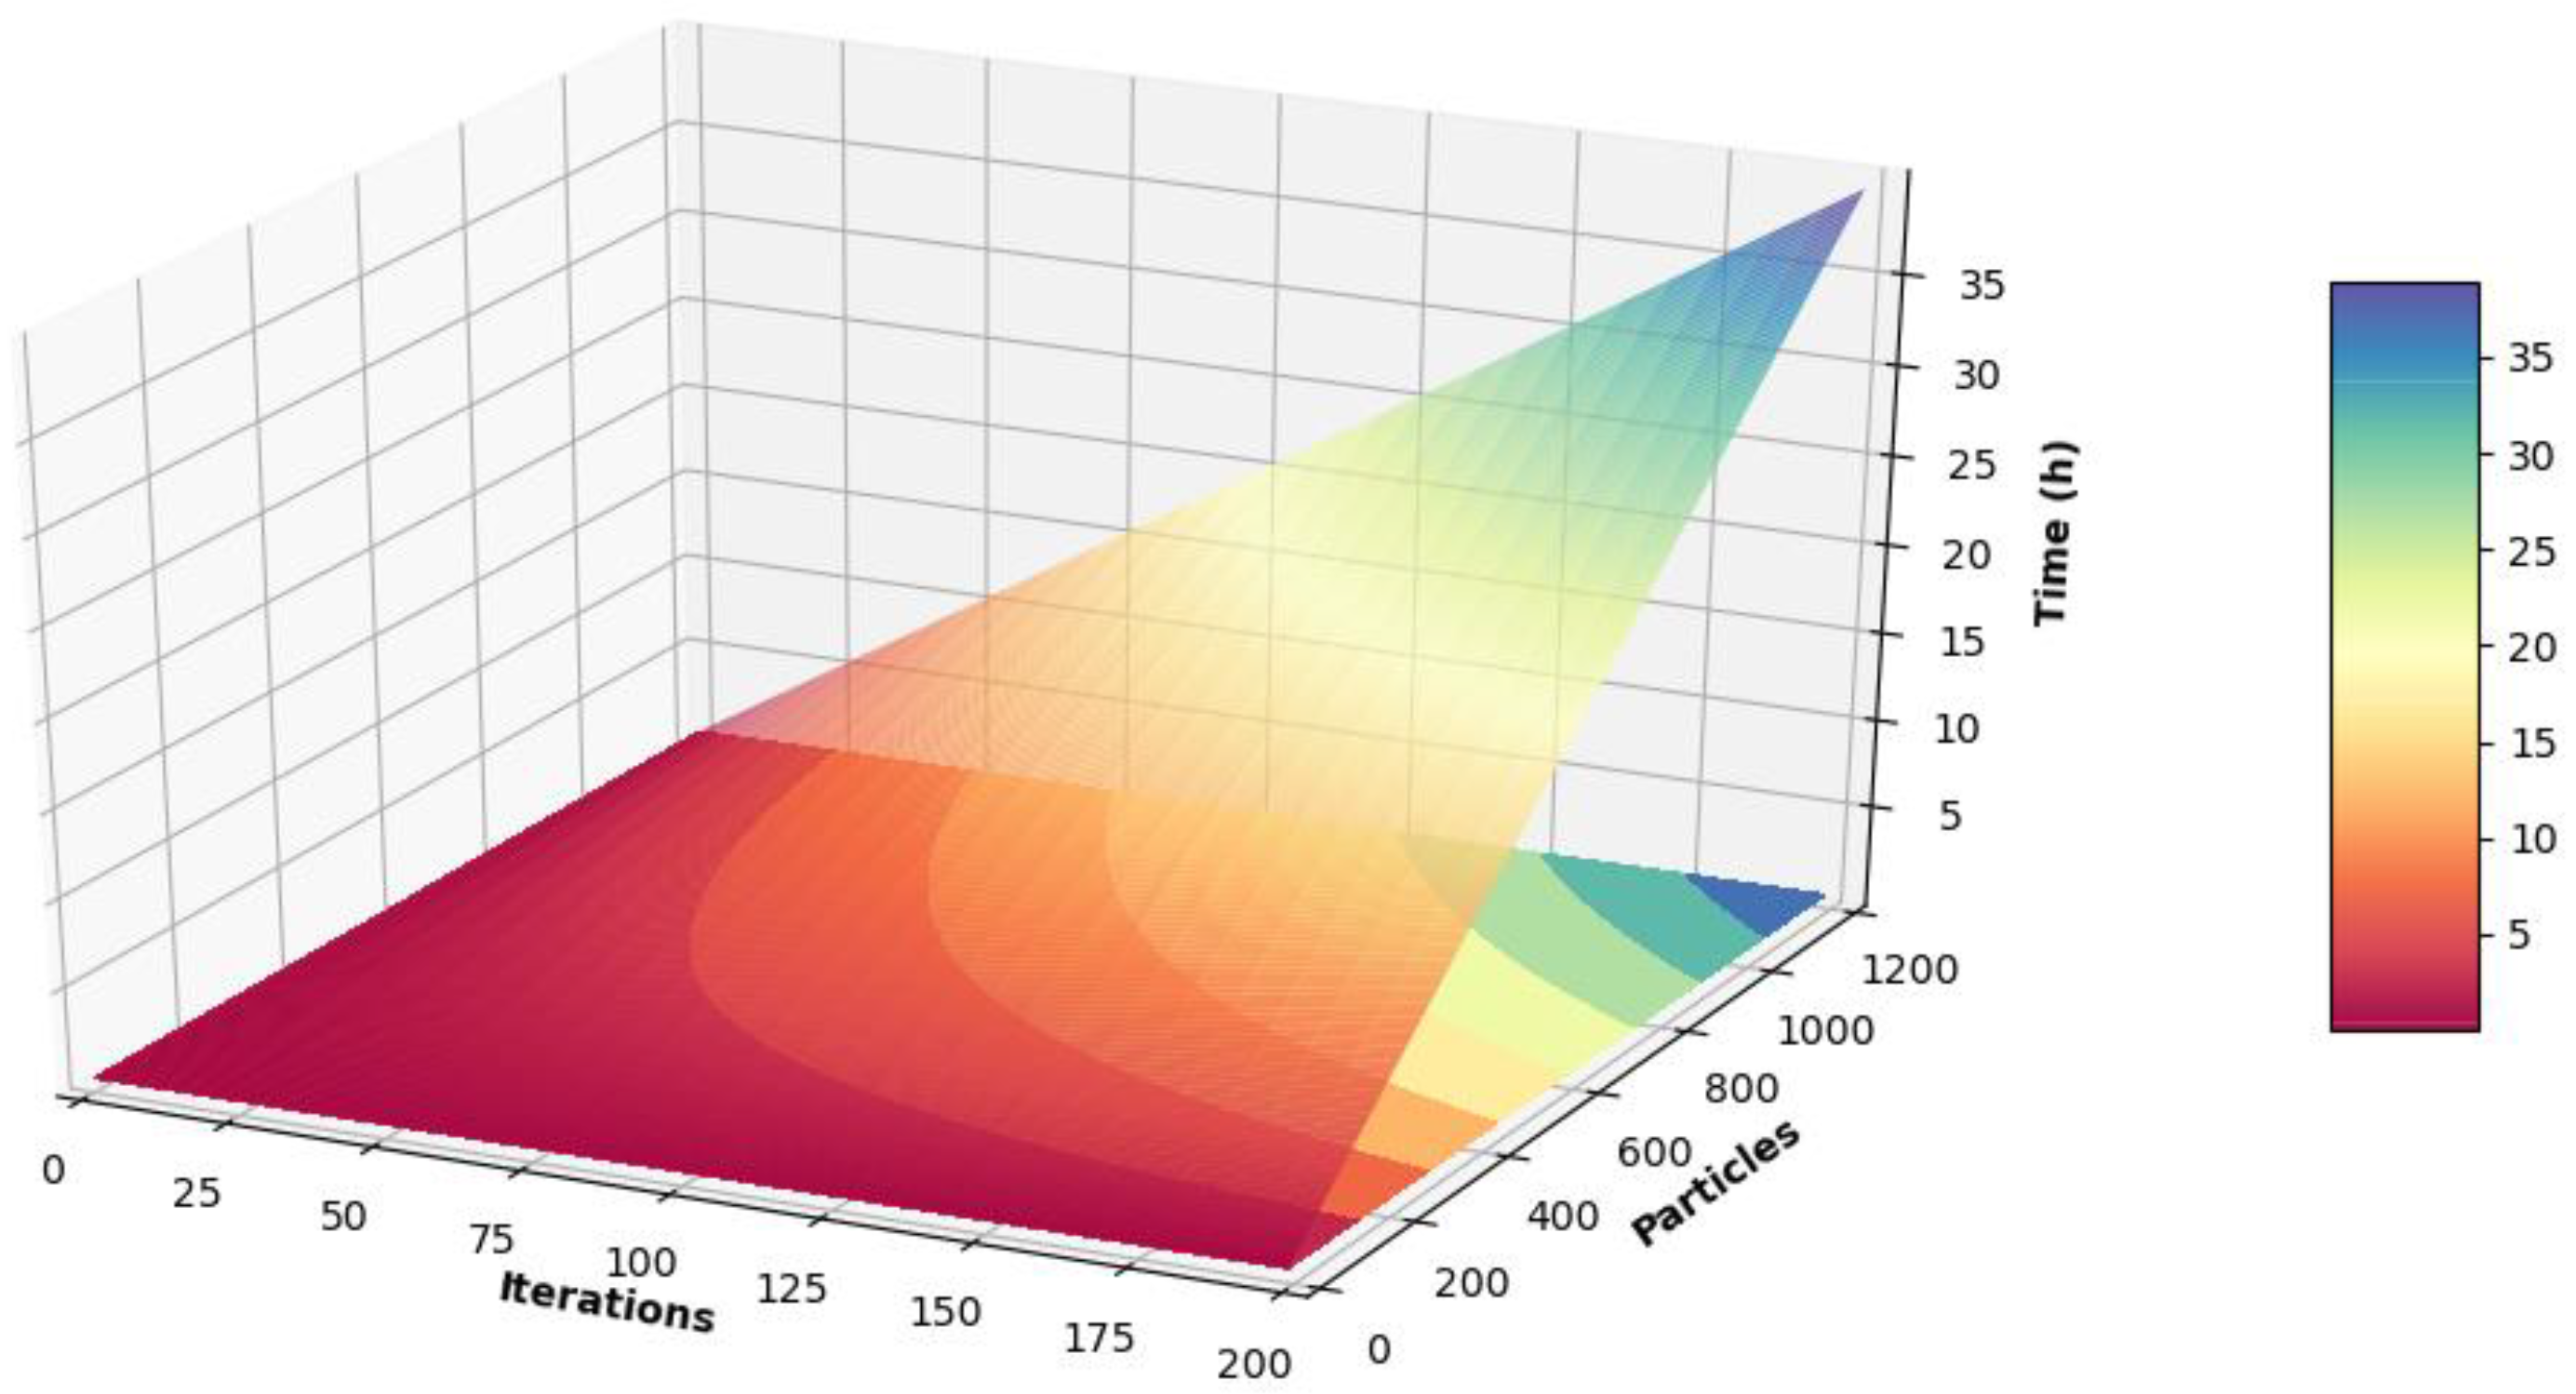
In general, optimization methods based on probabilistic algorithms tend to be more efficient than deterministic ones for application in complex real problems, since the objective function and constraints do not need to have a mathematical representation, much less be continuous and differentiable. These work correctly with discrete and continuous parameters and, in most cases, they tend to be simpler to implement. On the other hand, the biggest disadvantage of probabilistic methods is the computational processing time required, which directly depends on the computational cost linked to the evaluation of the objective function and the desired level of uncertainty. The complexity of the DSS is due to the processes of correcting the allocated flows and obtaining daily costs that require the manipulation of a large amount of data and verifications, thus making the process slower. In PSO, the main parameters responsible for defining the certainty of the solution are the quantities of particles and iterations.
Figure 10 shows the surface that describes the processing time as a function of the number of iterations and particles.
The results of this section were obtained with 100 iterations and 1000 particles, totaling 16 h and 40 min of processing for each simulation. Knowing that the longer the processing time, the closer the solution obtained is to the global optimum, the definition of using 100 iterations and 1000 particles emerged from an exhaustive battery of optimization tests of the problem. Tests of 50, 100 and 200 iterations correlated to 100, 500, 1000 and 1500 particles were performed, varying the input information, such as months of the year for analysis and the initial condition of reservoir accumulation. The results obtained in the sensitivity test showed that above 100 iterations and 1000 particles, the minimization of costs is insignificant compared to the required processing time.
5. Conclusions
The efficient allocation of water resources, especially in conditions of multiple sources of water supply and water scarcity, is a challenge for managers of supply companies. The need to develop robust decision support systems capable of providing support for decision making is well known. The definition of parameters that guide the efficient operation of large systems that produce and add water is essential for the Agreste region of Pernambuco (Brazil), whose unfavorable water balance reinforces the need for strategic planning. The collection of water, technical and economic information proved to be an important step for the modeling and optimization of processes, allowing the system to emulate the characteristics of the case study and guaranteeing the achievement of applicable and real solutions.
It is important to highlight how, in the general composition, the use of multiple sources and the transfer works between basins will make it possible for the Agreste to reduce the problem of water scarcity, making it possible to supply water to the population in full, without interruptions or rationing. This new reality highlights the need for DSS, as it places the water supply in the Agreste region of Pernambuco in a new phase: the optimization of service provision.
The DSS highlighted the economic viability of the Agreste pipeline and that the maximum use of local reservoirs has not been economically advantageous due to high energy tariffs. The Agreste pipeline was responsible for supplying more than 40% of the demand in the study area, reflecting its unit cost of 0.14 USD/m3, while there are water sources that reach 0.80 USD/m3. Depending on the number of pumping stations between the water source and the consumption center, the input from the Agreste pipeline should be prioritized. Unit cost metrics by water source and consumption centers provided important information to identify system inefficiencies and develop a strategic plan to optimize service delivery. Although supplying from multiple sources is complex and makes the integrated management of the system difficult, it is clear that its use guarantees sufficient quantity and quality of water for the local population, providing relief from the water scarcity that still plagues the region.

 ,
, 


