Article

Assessment of Groundwater Quality Using APCS-MLR Model: A Case Study in the Pilot Promoter Region of Yangtze River Delta Integration Demonstration Zone, China

1
Nanjing Center, China Geological Survey, Nanjing 210016, China
2
Key Laboratory of Watershed Eco-Geological Processes, Ministry of Natural Resources, Nanjing 210016, China
3
Chinese Academy of Geological Sciences, Beijing 100037, China
*
Author to whom correspondence should be addressed.
Water 2023, 15(2), 225; https://doi.org/10.3390/w15020225
Submission received: 2 December 2022 / Revised: 31 December 2022 / Accepted: 31 December 2022 / Published: 4 January 2023
(This article belongs to the Special Issue Groundwater Chemistry and Quality in Coastal Aquifers)

Abstract

:
Groundwater contaminant source identification is an endeavor task in highly developed areas that have been impacted by diverse natural processes and anthropogenic activities. In this study, groundwater samples from 84 wells in the pilot promoter region of the Yangtze River Delta integration demonstration zone in eastern China were collected and then analyzed for 17 groundwater quality parameters. The principal component analysis (PCA) method was utilized to recognize the natural and anthropogenic aspects impacting the groundwater quality; furthermore, the absolute principal component score-multiple linear regression (APCS-MLR) model was employed to quantify the contribution of potential sources to each groundwater quality parameter. The results demonstrated that natural hydro-chemical evolution, agricultural activities, domestic sewage, textile industrial effluent and other industrial activities were responsible for the status of groundwater quality in the study area. Meanwhile, the contribution of these five sources obtained by the APCS-MLR model were ranked as natural hydro-chemical evolution ( 18.89 % ) > textile industrial effluent ( 18.18 % ) > non-point source pollution from agricultural activities ( 17.08 % ) > other industrial activities ( 15.09 % ) > domestic sewage ( 4.19 % ) . It is believed that this contaminant source apportionment result could provide a reliable basis to the local authorities for groundwater pollution management.

1. Introduction

Groundwater quality degradation by natural processes or anthropogenic activities is widely recognized and has drawn the attention of researchers for decades [1,2,3]. The natural processes, mainly water–rock interactions, may cause specific ions’ accumulations in groundwater, such as arsenic, magnesium and iodine [4,5,6]. In the meantime, anthropogenic activities can deteriorate groundwater quality and lead to a series of geological environment problems. For instance, agricultural behaviors including fertilization and livestock breeding are implicated in excess of nitrogen, phosphorus and potassium [7,8,9]. Industry effluent and leakage can lead to increased concentrations of sulfate and some heavy metal ions [10,11,12], and domestic sewage can lead to high levels of ammonia in groundwater [13]. Under the interaction of natural processes and anthropogenic activities, groundwater contamination management is undoubtedly a vital task. Classifying the contamination into their original sources is the primary step for an authentic assessment of the contaminated aquifer [14,15]. It will not only benefit the status survey, but also provide a consequential basis for future groundwater protection and pollution management.
Various methods have been developed for identifying the groundwater contaminant sources, such as the in situ survey, stable isotope methods, model-based numerical inversion and multivariate statistical approaches [16,17,18,19,20]. The in situ surveys usually attempts to find out the potential sources with labor-intensive work, but often fails to give a quantified analysis of the contamination source apportionment. The stable isotope methods can provide precise apportionment of sources, but only for the isotope-related contaminant. As for the model-based numerical inversion methods, they are believed to be more suitable for local scale research [21,22,23,24]. Meanwhile, multivariate statistical approaches have gained popularity among researchers due to their convenience and efficiency for regional scale problems [25,26,27]. This branch of methods include cluster analysis (CA), principal component analysis (PCA), positive matrix factorization (PMF), absolute principal component score-multiple linear regression (APCS-MLR) and so on. Compared with other approaches, the APCS-MLR method is an especially effective and practical method for identifying pollution sources. It was first developed by Thurston and Spengler [28] and then applied to pollution source apportionment problems on air, surface water and sediments [29,30,31,32,33]. More recently, the APCS-MLR method has started to be employed in groundwater quality research and has proven to be a powerful tool in identifying the impact of natural processes and anthropogenic activities to groundwater quality. For instance, Zhang et al. [34] employed the PCA and APCS-MLR methods to identify groundwater pollution sources and their apportionment in the Hutuo River alluvial-pluvial fan region of northern China. Meng et al. [35] used the APCS-MLR receptor model to assess the potential pollution sources of groundwater from 2006 to 2016 in the Limin Groundwater Source Area in Harbin. Yu et al. [36] applied the APCS-MLR method in nitrate pollution sources apportionment and compared its result with a Bayesian isotope mixing model. Sheng et al. [37] utilized the APCS-MLR receptor model to estimate the source apportionment of heavy metal pollution in an arid oasis region in Northwest China.
Therefore, in this research, we employ the APCS-MLR model to assess the potential sources of groundwater contamination in the pilot promoter region of the Yangtze River Delta integration demonstration zone. The study area is located in the Taihu watershed in eastern China, of which the groundwater has been influenced by intense anthropogenic activities. Previous work has demonstrated the complexity of the groundwater pollution in this area. Various contaminants have been found, including heavy-metal ions, nitrogen and phosphorus compounds [38,39,40,41]. Despite the numerous individual investigations for several specific contaminants, the overall groundwater contaminant source apportionment problem is still unsolved.
The objective of this work is to: 1. recognize the natural and anthropogenic aspects that affect the groundwater quality; 2. quantify the contribution of potential sources to each groundwater quality parameter via the APCS-MLR model. Insights from this paper could provide reliable advice for further pollution remediation plans in the pilot promoter region of the Yangtze River Delta integration demonstration zone.

2. Materials and Methods
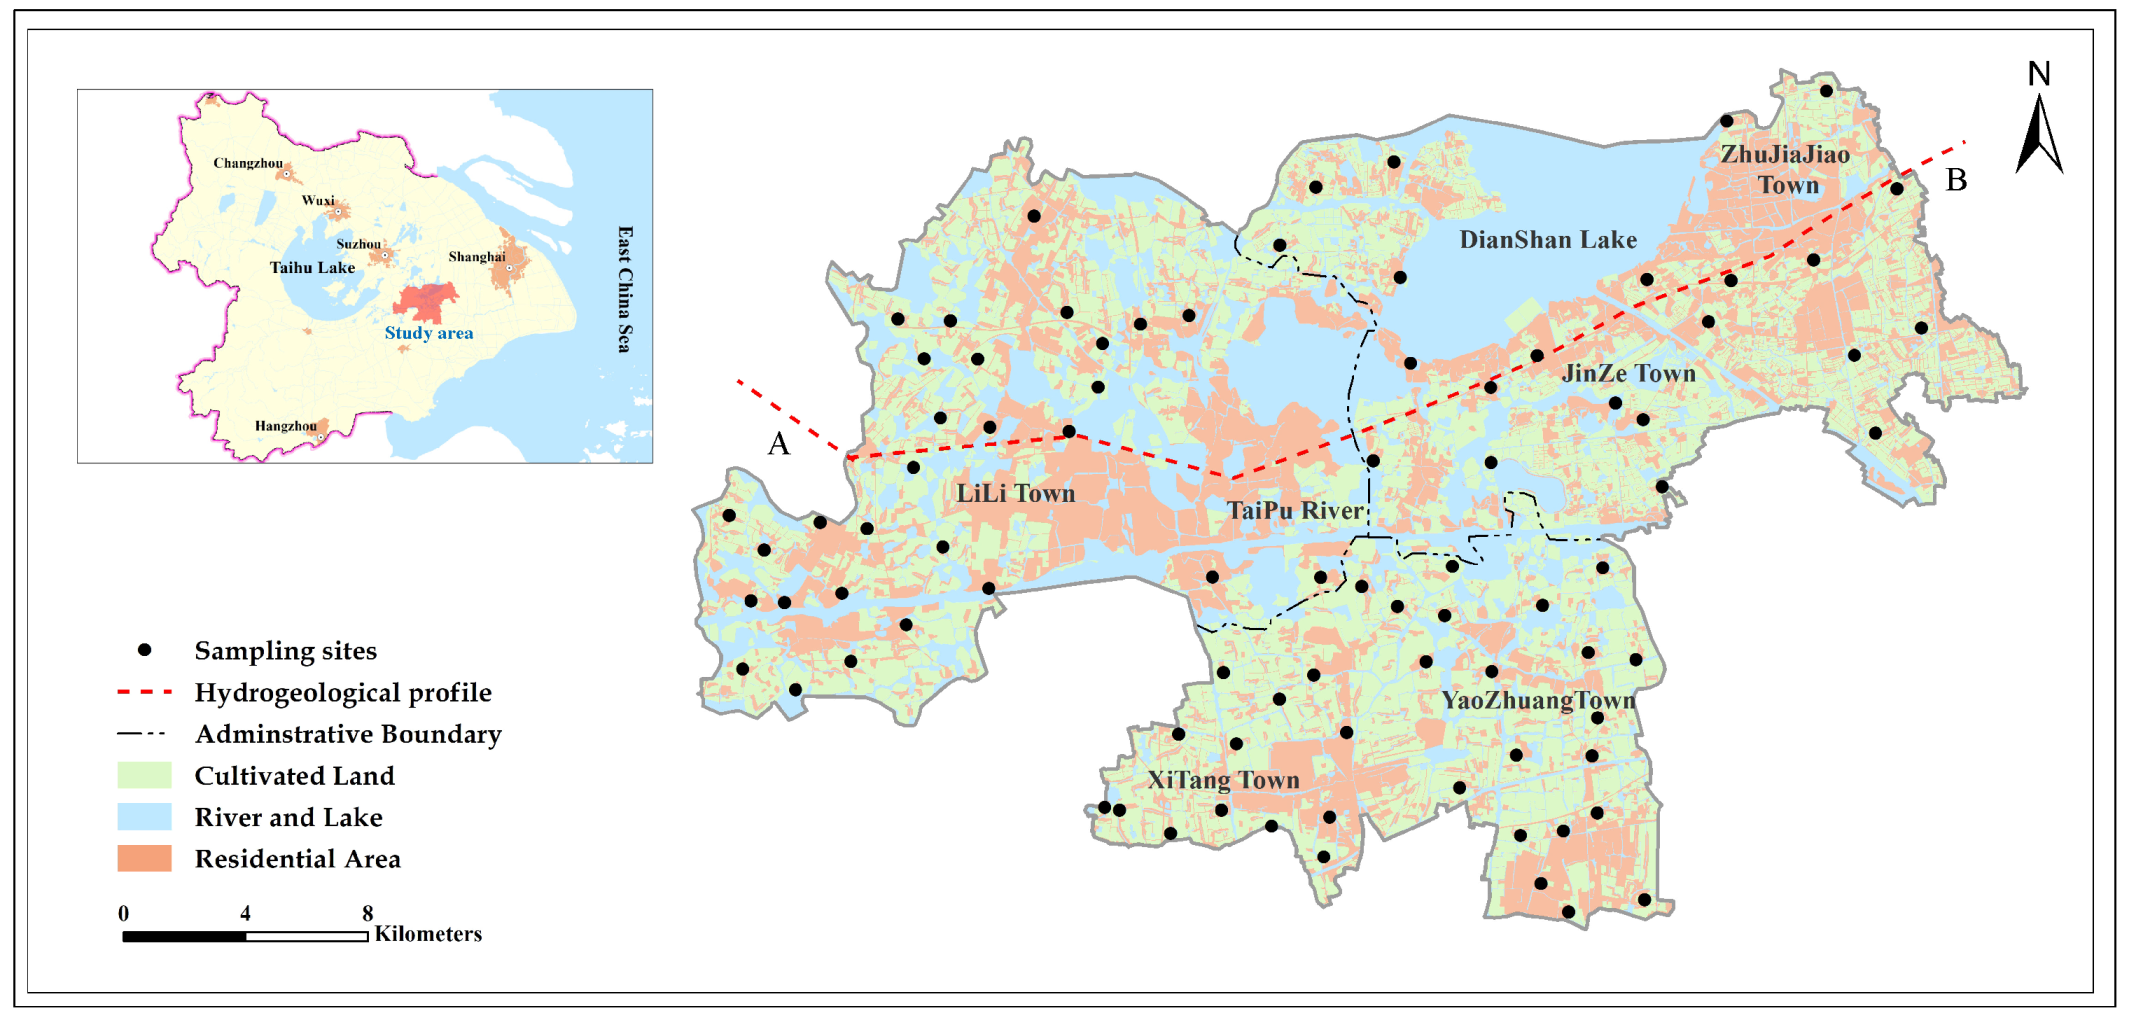
2.1. Study Area

The pilot promoter region of the Yangtze River Delta integration demonstration zone ( 30 ° 54 14 31 ° 09 25 N and 120 ° 39 47 121 ° 07 30 E) is located southeastern of the Taihu Lake with a total area of 653.9 km 2 (Figure 1). It is under a subtropical monsoon climate, with 16.2 °C annual temperature and 1127.1 mm annual rainfall [42]. The groundwater in this region is mainly distributed in the sand and silt layers from Quaternary sediments [43,44]. The thickness of the Quaternary sediments is larger than 150 m according to the borehole materials, and the phreatic aquifer with thickness ranging from 3 to 7 m is the layer closely related to human activities (Figure 2). The aquifer is recharged from precipitation, river infiltration, and irrigation; in the meantime, its discharge mainly occurs through run off to rivers and evaporation since restrictions on groundwater exploitation have been imposed by the government since 1997 [45]. As an interactive area of Jiangsu, Zhejiang Provinces and Shanghai metropolis, this area is one of the most developed regions in China. Based on the a remote sensing survey with field validation, a major part of the land use in this area is cultivated land and residential area. Industries, especially textile factories, are mainly scattered in the south of the study area. What is more, a dense surface water network, including Taipu River and Dianshan Lake, is located in this area, which makes the surface water–groundwater interaction extremely complex. Hence, heavy agricultural activities and industrial sewage pose substantial threats to groundwater security. The application of nitrogen fertilizers and the use of industrial chemicals constitute potential point and non-point sources of groundwater contamination.

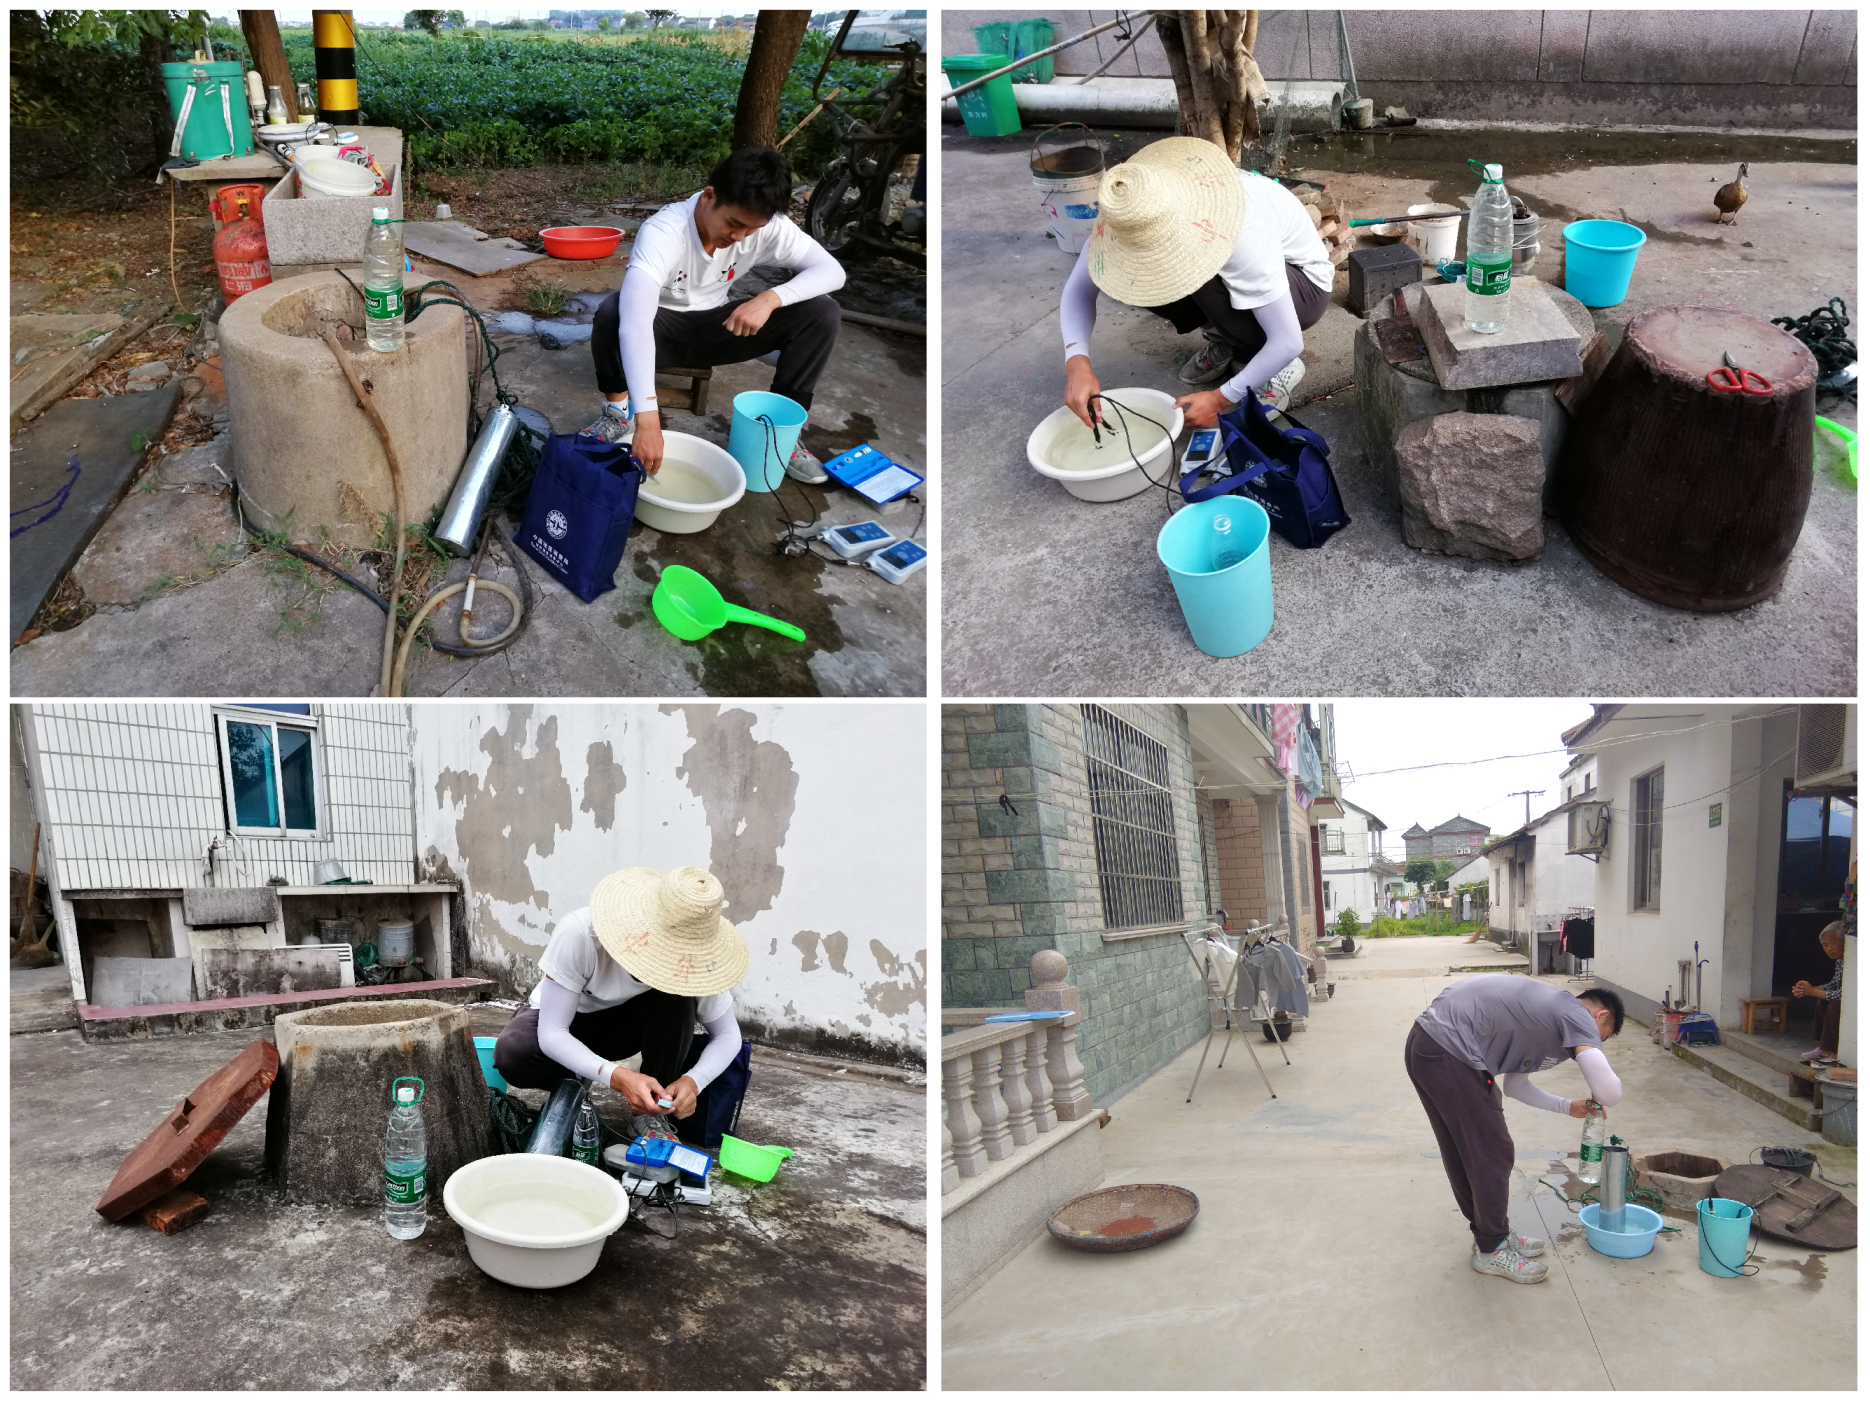
2.2. Data Preparation

Groundwater samples were collected from 84 wells in June 2020 and June 2021, and the sampling sites were chosen with the considerations of land-use types (cultivated land, residential land, etc.) and spatial distribution (approximately 1 km 2 per point) (Figure 1). In each well, the water temperature (WT), pH, dissolved oxygen (DO) and total dissolved solids (TDS) were measured by SX-620 pH Testor, SX-630 ORP Testor and Hanna DiST in situ, respectively. Figure 3 shows the landscape surroundings of several wells and the in situ test procedures. Polyethylene containers with a capacity of 1.5 L were used to store groundwater samples, and then brought back to the laboratory for an analysis of total phosphorus (TP), C l , S O 4 2 , N H 4 N , N O 3 N , N O 2 N , K + , N a + , C a 2 + , M g 2 + , M n , I and S b . Various instruments were used for the analyses (Table 1).

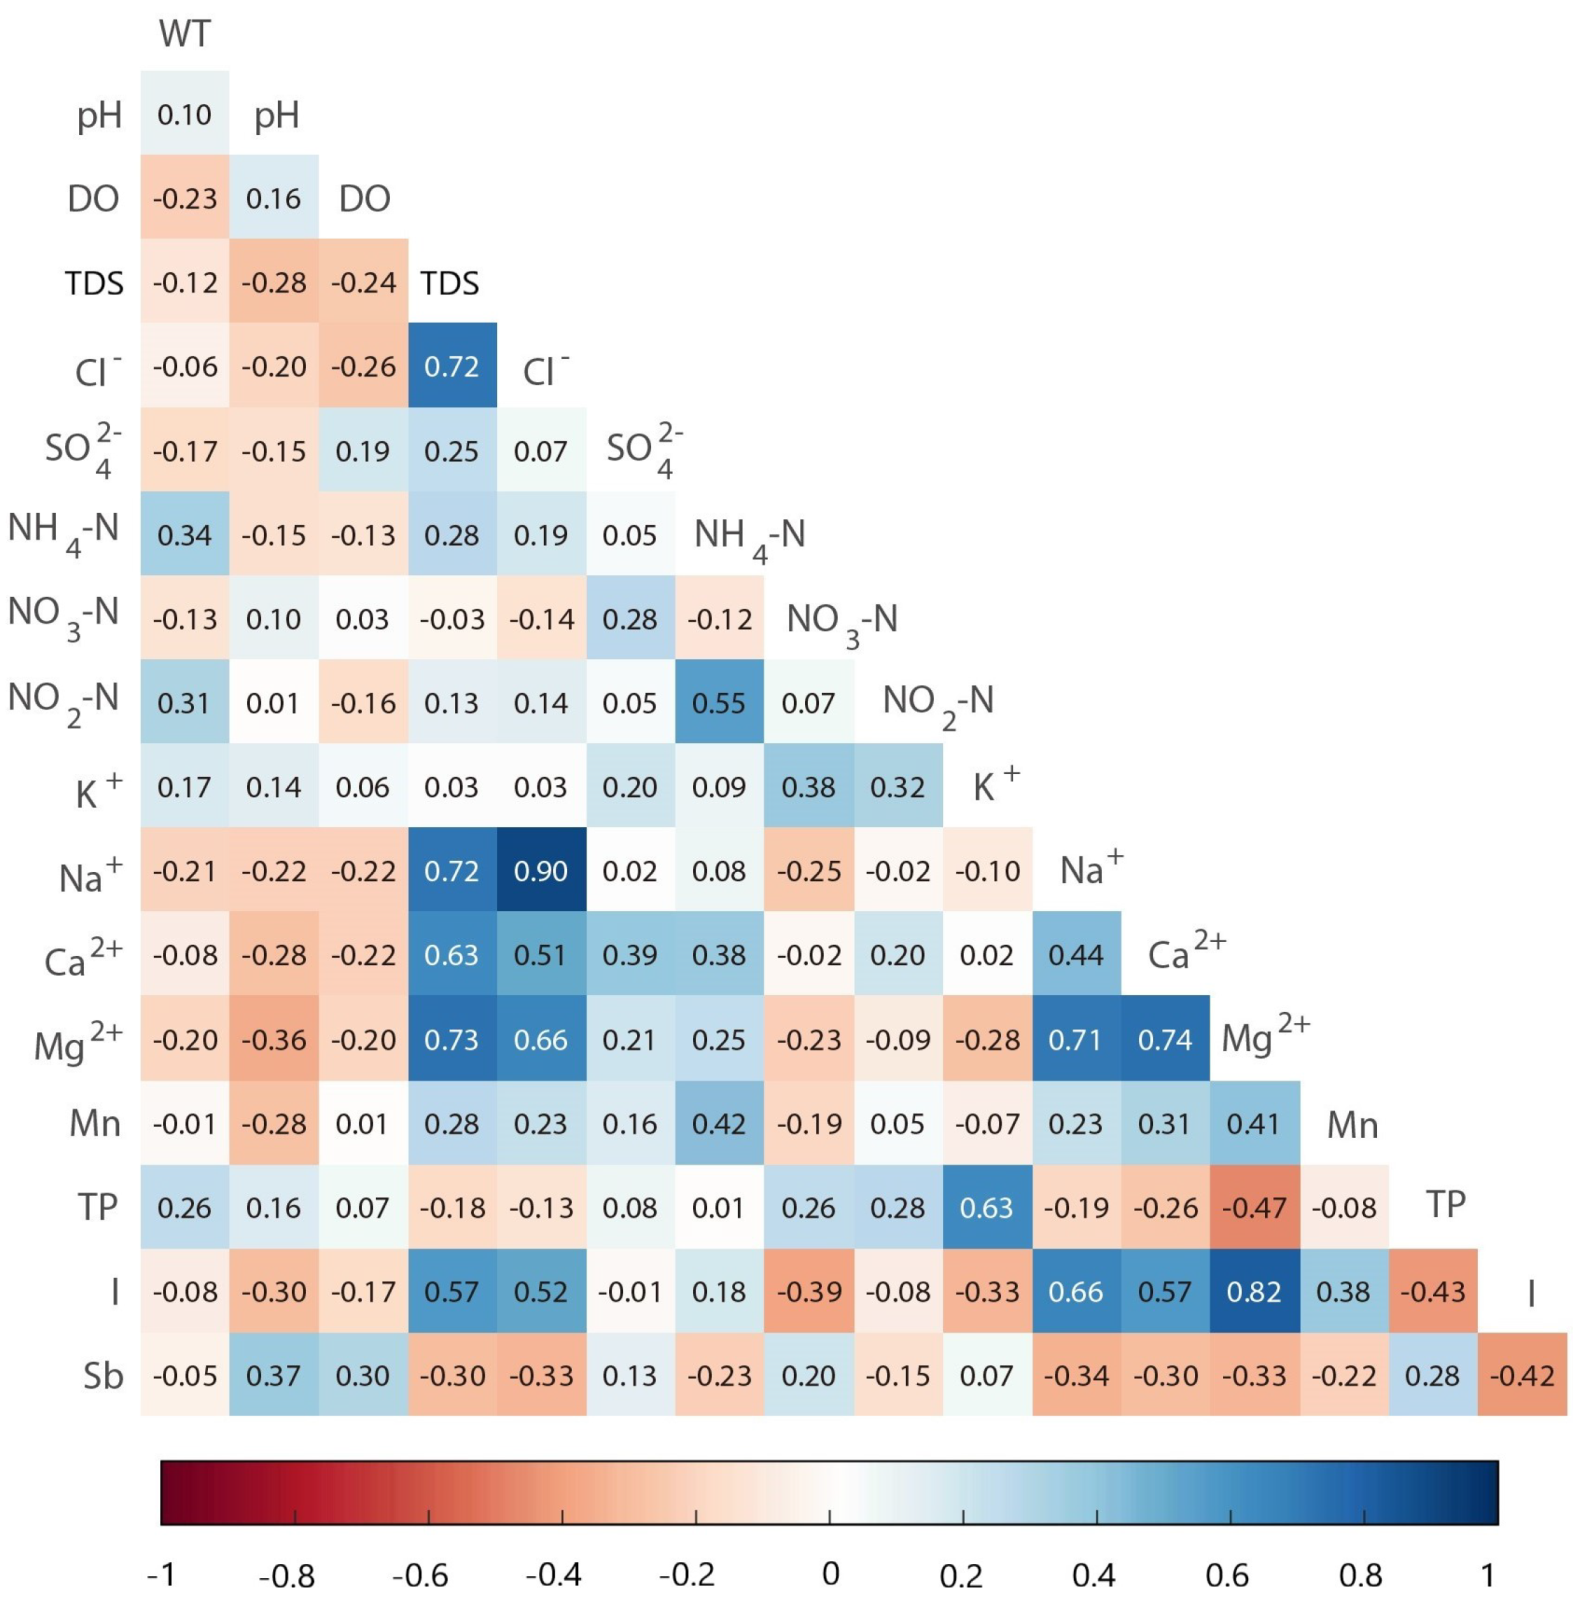
2.3. Multivariate Statistical Analysis

For an in-depth analysis of the groundwater chemistry data, APCS-MLR was employed. The ACPS-MLR is a receptor model based on the results of principal component analysis (PCA), together with a multivariate linear regression using the measured contaminant concentrations [46,47,48]. First, Kaiser-Meyer-Olkin (KMO) criteria and Bartlett’s test of sphericity were performed to assess the adequacy of the dataset for PCA [49,50]. We employed the criteria that for the PCA to be considered reliable, the KMO value needs to be larger than 0.5, and the significance level of Bartlett’s test of sphericity should be smaller than 0.05. By conducting PCA procedure, the principal components from the related groundwater quality parameters could be obtained, as follows:
( A z ) i j = a i 1 C 1 j + a i 2 C 2 j + + a i m C m j ,
for i = 1 , 2 , , p , and j = 1 , 2 , , n , where A z represents the component score; a stands for the component loading; C is the measured concentration of each groundwater quality parameter; p is the number of components; n is the number of samples and m is the number of groundwater quality parameters.
The principal components, with eigenvalues greater than 1.0 in the variance computation, are believed to be able to provide qualitative information about the potential contamination [51,52]. For a clearer interpretation, the original loadings normally need to be rotated until the loadings of PCs are redistributed and polarized. This procedure is normally mentioned as varimax rotation and the obtained new variables are called varifactors (VFs). For each VF, the component loadings reflect relative attribution of the groundwater quality parameters, with absolute loading values >0.75, 0.75–0.5 and 0.5–0.3 defined as strong, medium and weak, respectively [53,54].
Then, the component scores from the PCA are normalized to perform APCS-MLR for groundwater contaminant source apportionment. A detailed description of this method could be found in Thurston and Spengler [28] and Rahman et al. [30]. In brief, the APCS-MLR model assumes that the contaminant sources attribute linearly to the pollutant concentration at each sampling site. Hence, the concentration of each contaminant at each sampling site ( C k j ) can be calculated by a multiple linear regression of the contribution of contaminant sources through Equation (2):
C k j = r k 0 + i = 1 p r k i × A P C S i j ,
where r k 0 represents the constants term of multiple linear regression for pollutant k; r k i stands for the coefficient of multiple linear regression of the contaminant source i for the pollutant k; A P C S i j is the absolute principal component scores and it can be obtained through Equations (3)–(5).
( Z 0 ) k = C k ¯ σ k ,
( A 0 ) i = k = 1 m S k i × ( Z 0 ) k ,
A P C S i j = ( A z ) i j ( A 0 ) i ,
where ( Z 0 ) k stands for the normalized concentration of contaminant k in a non-pollution site; C k ¯ represents the mean concentration and σ k indicates the standard deviation of contaminant k; ( A 0 ) i is the principal component score in the non-pollution site; S k i represents the score coefficient of component i for pollutant k; ( A z ) i j stands for principal component score of sample j in principal component i.
Here, r k i × A P C S i j implies the contribution of contaminant source i to pollutant k in sample j. The average of all samples r k i × A P C S i ¯ is established as the contribution of contaminant source i to pollutant k. Notably, negative values may be achieved during the calculation process, which could lead to a total contribution of all pollutants exceeding 100%. Hence, Haji Gholizadeh et al. [46] proposed an absolute value method to calculate the contribution of contaminant sources to water quality parameters, as it is shown in Equations (6) and (7).
P C k i = r k i × A P C S i ¯ r k 0 + i = 1 p r k i × A P C S i ¯ × 100 % ,
P C k = r k 0 r k 0 + i = 1 p r k i × A P C S i ¯ × 100 % ,
where P C k i stands for the relative contribution rate of contaminant source i to the pollutant k; P C k indicates the relative contribution rate of unrecognized source to the pollutant k; A P C S i ¯ is the average value of the absolute principal component scores of all samples.

3. Result and Discussion

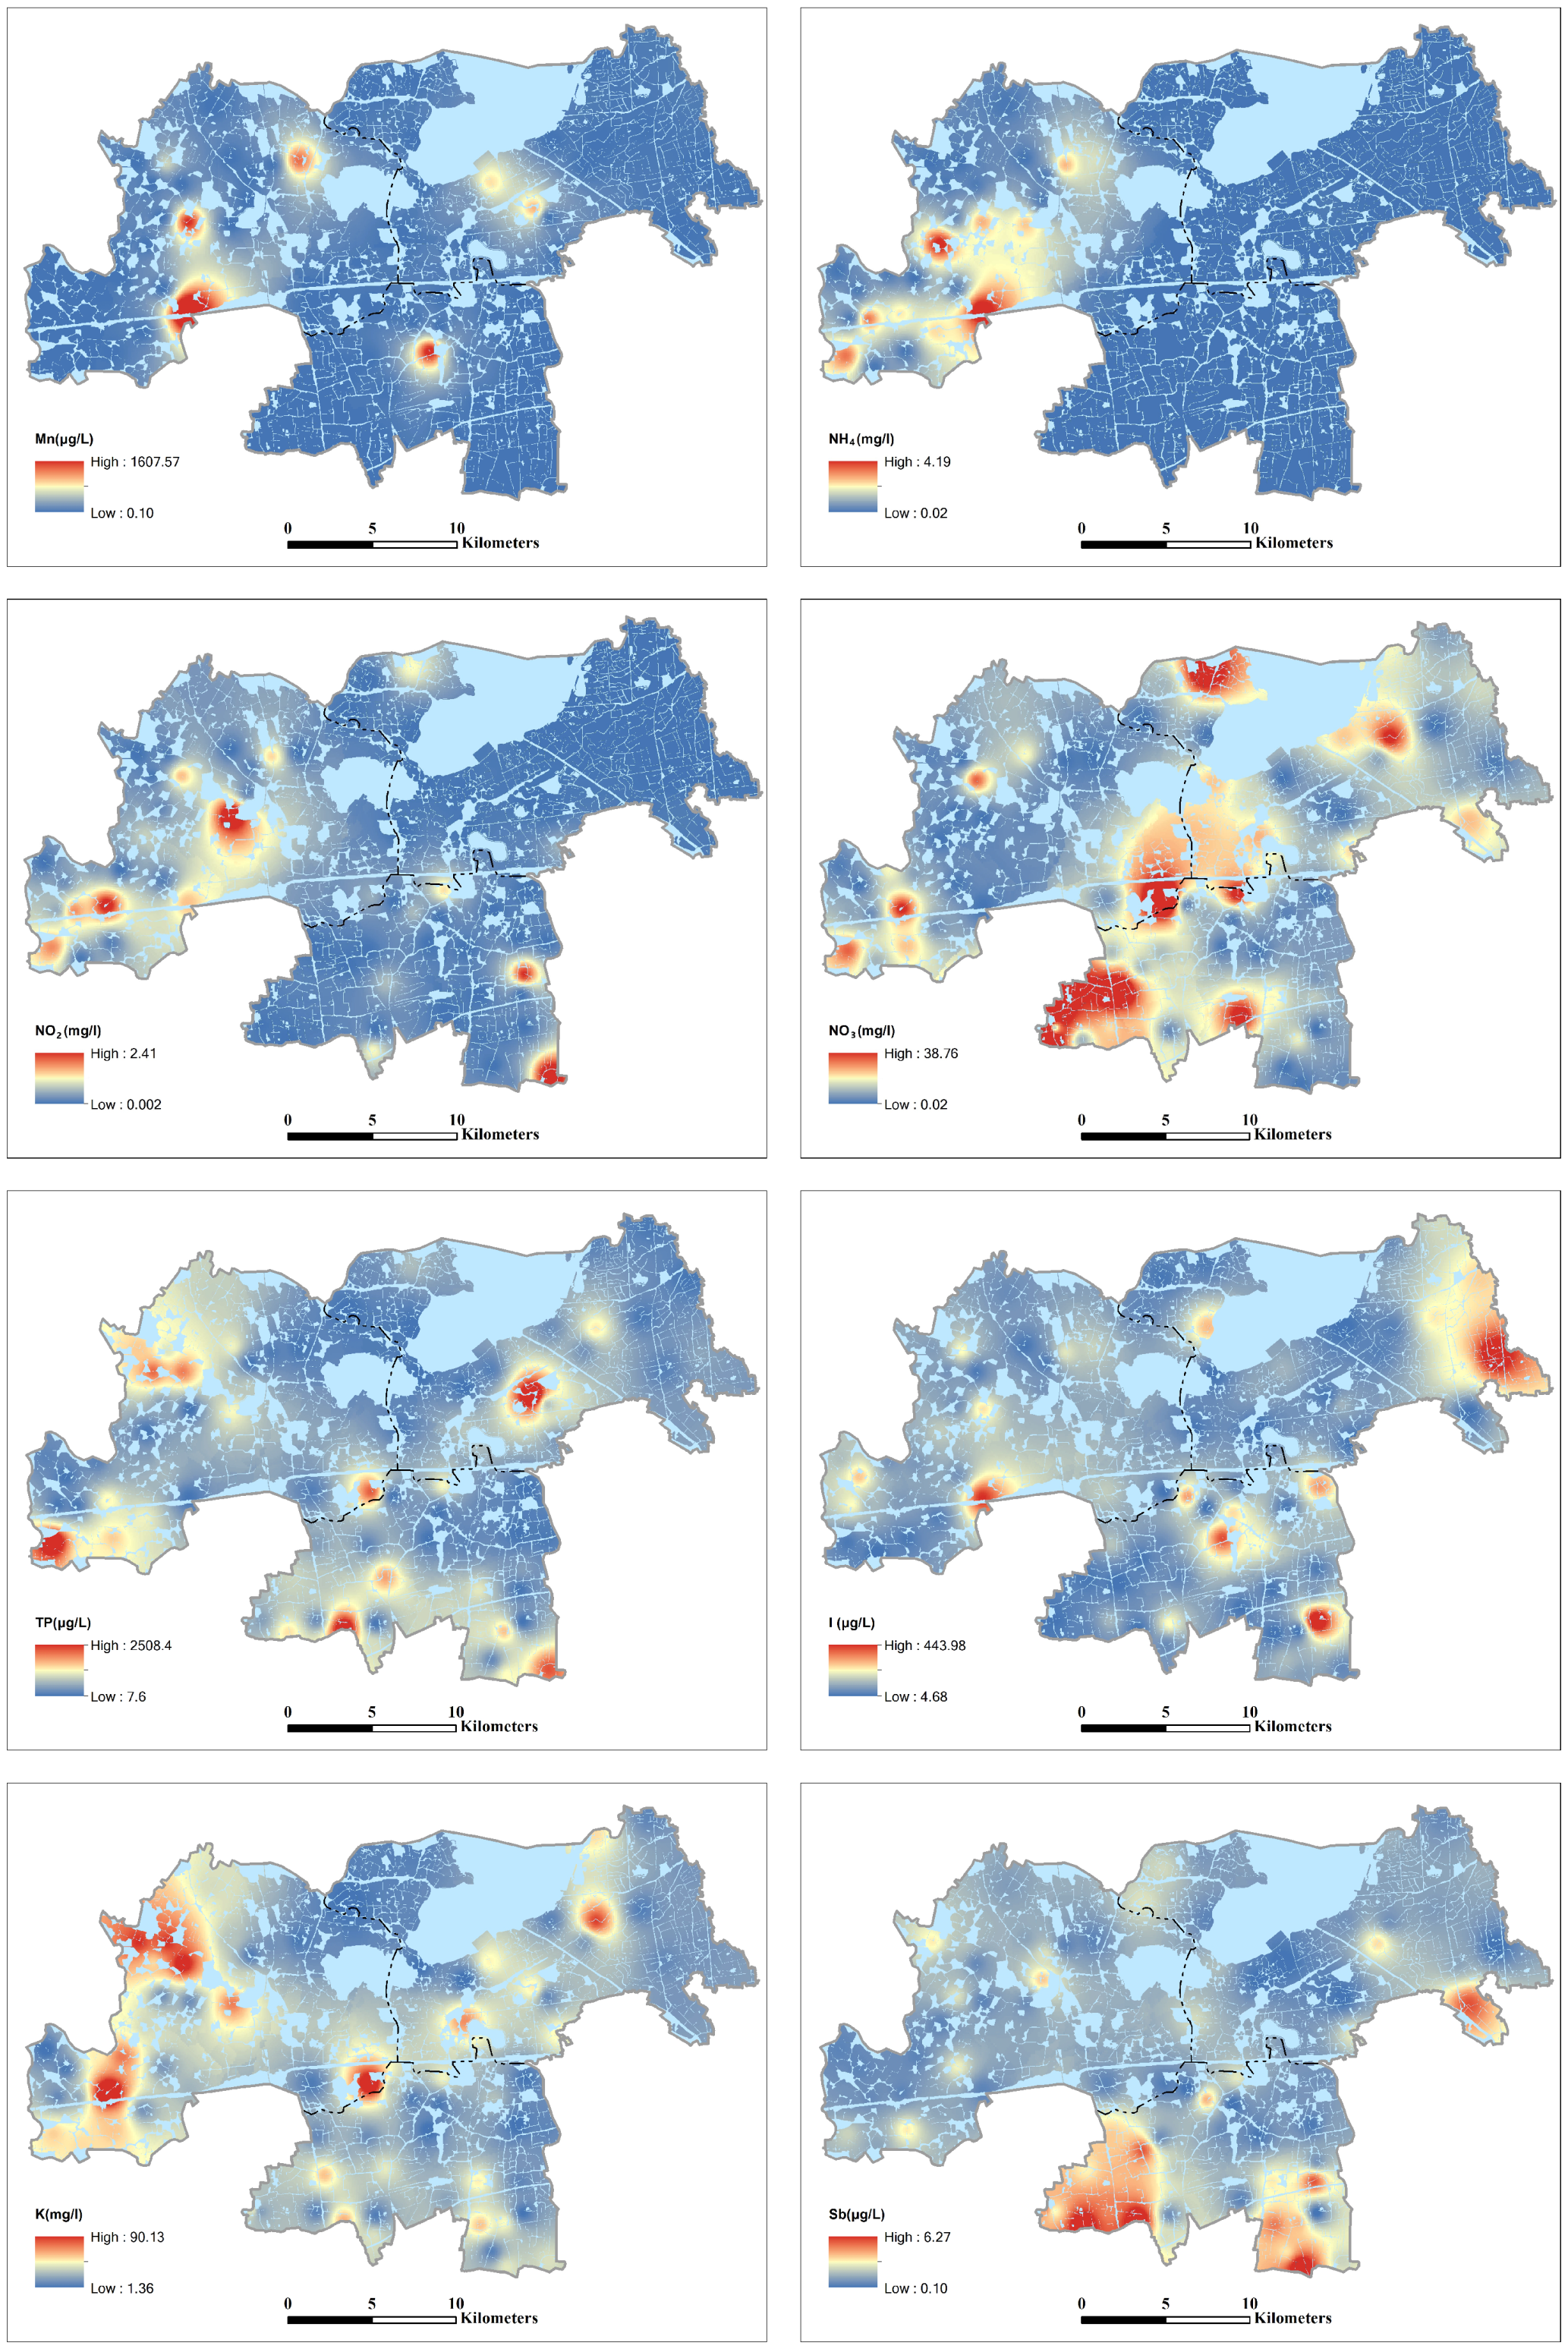
3.1. Characteristics of the Groundwater Pollution

The descriptive statistics of physicochemical parameters for all groundwater samples were summarized in Table 2. For several groundwater quality parameters, such as N H 4 + , N O 2 , N O 3 , M n , C a , I and S b , the maximum concentration in groundwater samples had exceeded level III of Chinese Groundwater Quality Standard(GB/T 14848-2017). What is more, T P , which had a maximum concentration of 2510 μ g/L, also deteriorated the groundwater quality in this region.
The variation coefficient of groundwater quality parameter is an index presenting the overall variability of the samples, and such variability is believed to be caused by various anthropogenic activities [51,55,56]. Here, the geographic information system technique with inverse distance weighted interpolation method was utilized to generate the spatial distribution of groundwater quality parameters with variation coefficient larger than 80 % (Figure 4). The comparison between figures showed that the contaminants could be classified into several groups with similar spatial distribution. For instance, M n , N H 4 + and N O 2 were relatively enriched in the western corner of the study area, while higher concentration of T P and K + were detected in the centre and northwestern of the region. As for S b , it can be found distributed all across the region, but the highest concentrations are found primarily in the southern area, which was consistent with the location of textile industries.
To uncover the linear correlations between physicochemical water quality parameters, the Pearson’s correlation coefficient with statistical significance (p < 0.05) was performed here. As it was shown in Figure 5, strong correlations (r > 0.5) were observed among N a + , C a 2 + , M g 2 + and C l , indicating that they may have the same origin from hydro-geochemical processes. Their high positive correlations with T D S (r > 0.6) implied the chemical composition of groundwater in this region was mainly controlled by these ions. A moderate positive correlation (r = 0.55) was also spotted for N H 4 + and N O 2 , illustrating that the nitrification process is occurring in the groundwater. As for K + , its relations with other physicochemical parameters were mostly uncorrelated, except for T P . With a positive correlation of 0.63, K + and T P were likely to be an indication of agricultural fertilization.
Based on the above analysis, we believe the nitrogen and phosphorus compounds could be attributed to the application of fertilizer or waste of livestock breeding. Other contaminants, such as I and S b , can be ascribed to the natural minerals and industrial effluent, respectively.

3.2. Pollution Sources Identified Based on the PCA Analysis

To provide a more detailed pollution-source analysis, the PCA method was then applied. The Kaiser–Meyer–Olkin(KMO) and Bartlett’s test were performed first to check the adequacy of the original dataset. The KMO value was equal to 0.732, while the value of Bartlett’s sphericity test was very close to zero (p < 0.001), indicating the validity of the PCA application. Based on the criteria, the principal components with eigenvalues exceeding 1.0 were chosen as the potential contaminant sources. As indicated in Table 3, five principal components were selected in this case, accounting for 71.23 % of the total variances. The rotated factor loadings for varifactors were shown in Figure 6.
The first varifactor, VF1, accounted for 24.72 % of the total variance. It was heavily weighted by T D S (0.83), C l (0.91), N a + (0.94) and M g 2 + (0.79), while moderately weighted by C a 2 + (0.61) and I (0.70). Generally speaking, the contribution of these ions to VF1 was the result of water–rock interactions [47,57]. In addition, the quaternary aquifer marine and lagoon-facies sediments in this area are rich in iodide and serve as a source of dissolved I in groundwater [58,59]. Hence, VF1 can be interpreted as natural hydro-chemical evolution contribution. The second varifactor (VF2) accounted for 15.02 % of the total variance, and was mainly characterized by K + (0.82) and T P (0.78), with moderate positive loadings of N O 2 (0.52) and N O 3 (0.50). These three ions in the groundwater are normally associated to the application of chemical fertilizer [60,61,62]. During our field survey, lots of aquaculture sites and farmlands could be spotted in the study area, especially near LiLi town. Hence, VF2 is assumed to represent the non-point source pollution from agricultural activities. VF3 ( 12.09 % of the total variance) had a strong positive loading on N H 4 + (0.85), with moderate positive loadings of N O 2 (0.54) and M n (0.63). The most common source of N H 4 + and N O 2 in groundwater are domestic sewage, livestock wastes and application of nitrogen fertilizer [48,63]. Dissolved M n may naturally come from weathering of manganese oxide minerals, but its concentrations can be increased by contamination from industrial effluent and domestic sewage [64,65]. In the pilot promoter region of the Yangtze River Delta integration demonstration zone, as in some rural areas, the sewage collection system is imperfect and municipal sewage may leak and contaminate the groundwater. Especially in the west corner of the study area, several dry toilets and garbage heaps can be spotted during our field surveys. Therefore, VF3 is considered as domestic sewage. VF4 explained 10.02 % of the total variance and had the highest loadings on S O 4 2 (0.78) and N O 3 (0.55). Meanwhile, weak negative loadings on W T (−0.45) and p H (−0.41) also could be observed. Since S O 4 2 and low p H value (acidic condition) are normally related with industrial effluent [47,66,67], this factor can be identified as the influence of industrial activities. The last component (VF5) accounted for 9.38 % of the total variance and it was mainly affected by D O (0.78) and S b (0.64). The high level of S b compound in groundwater normally comes from mining or textile industry [68,69]. Since the textile industries are widely distributed in the southern part of our study area, VF5 can be regarded as the impact of textile industrial effluent.

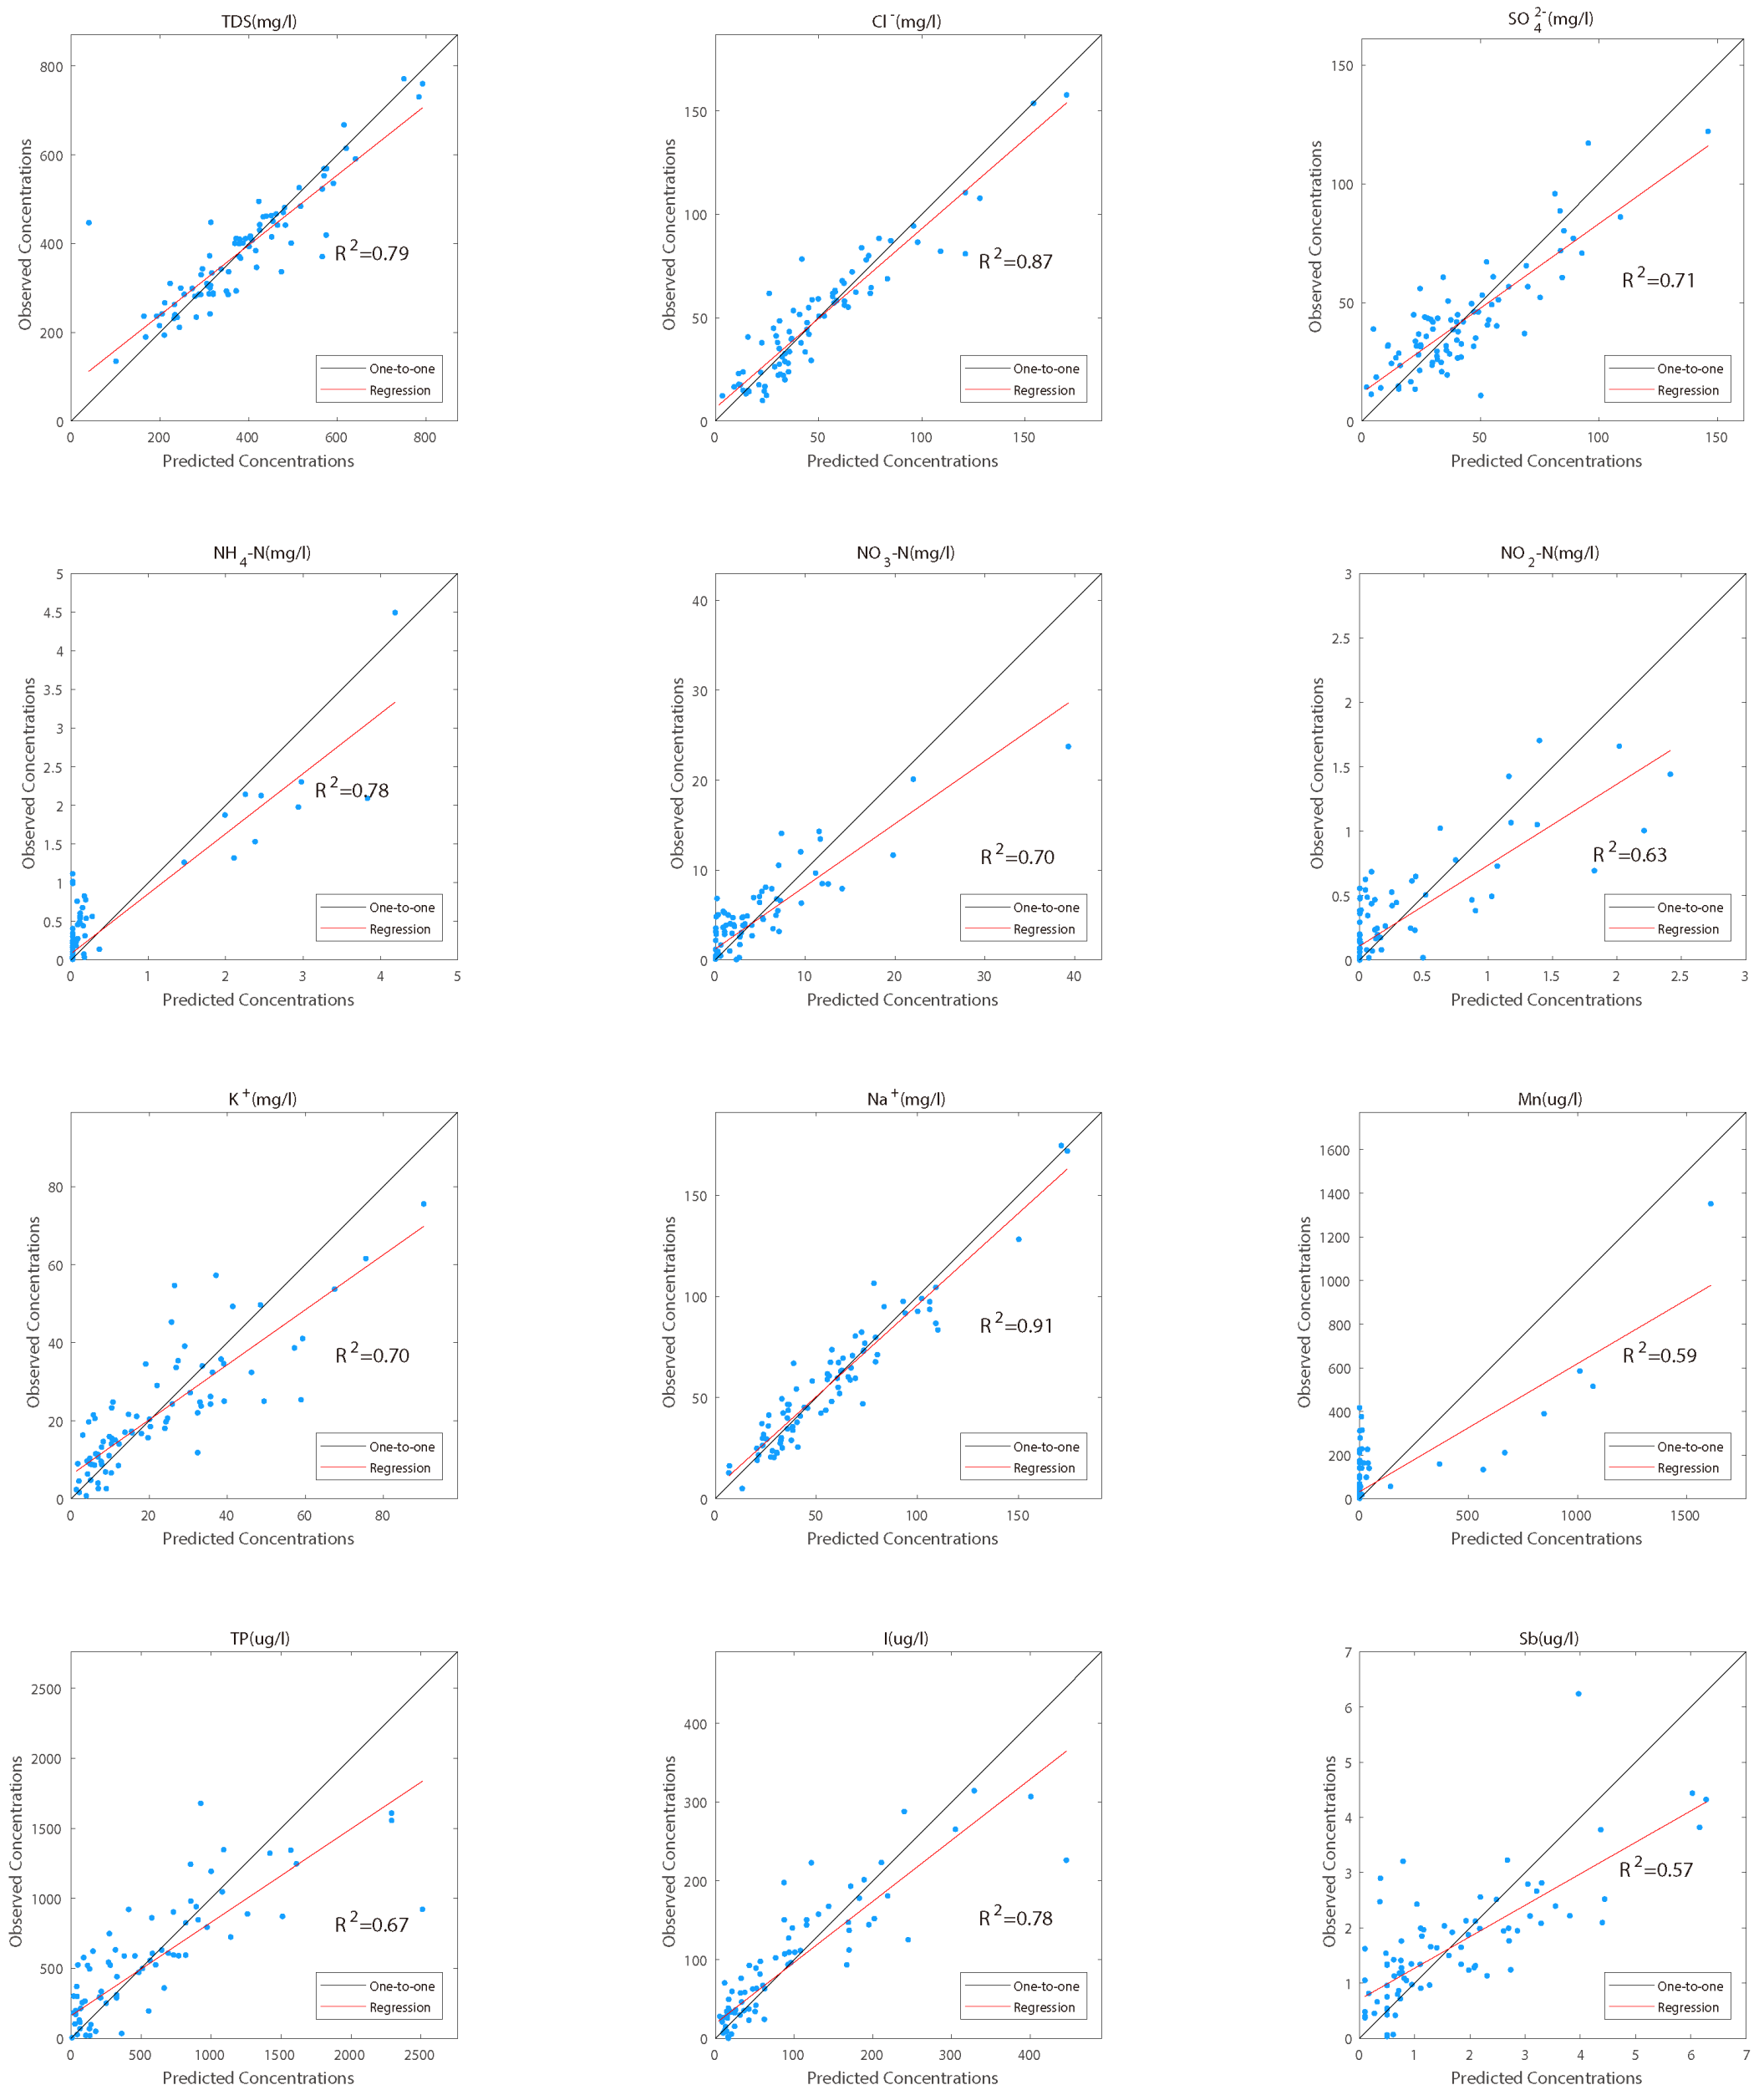
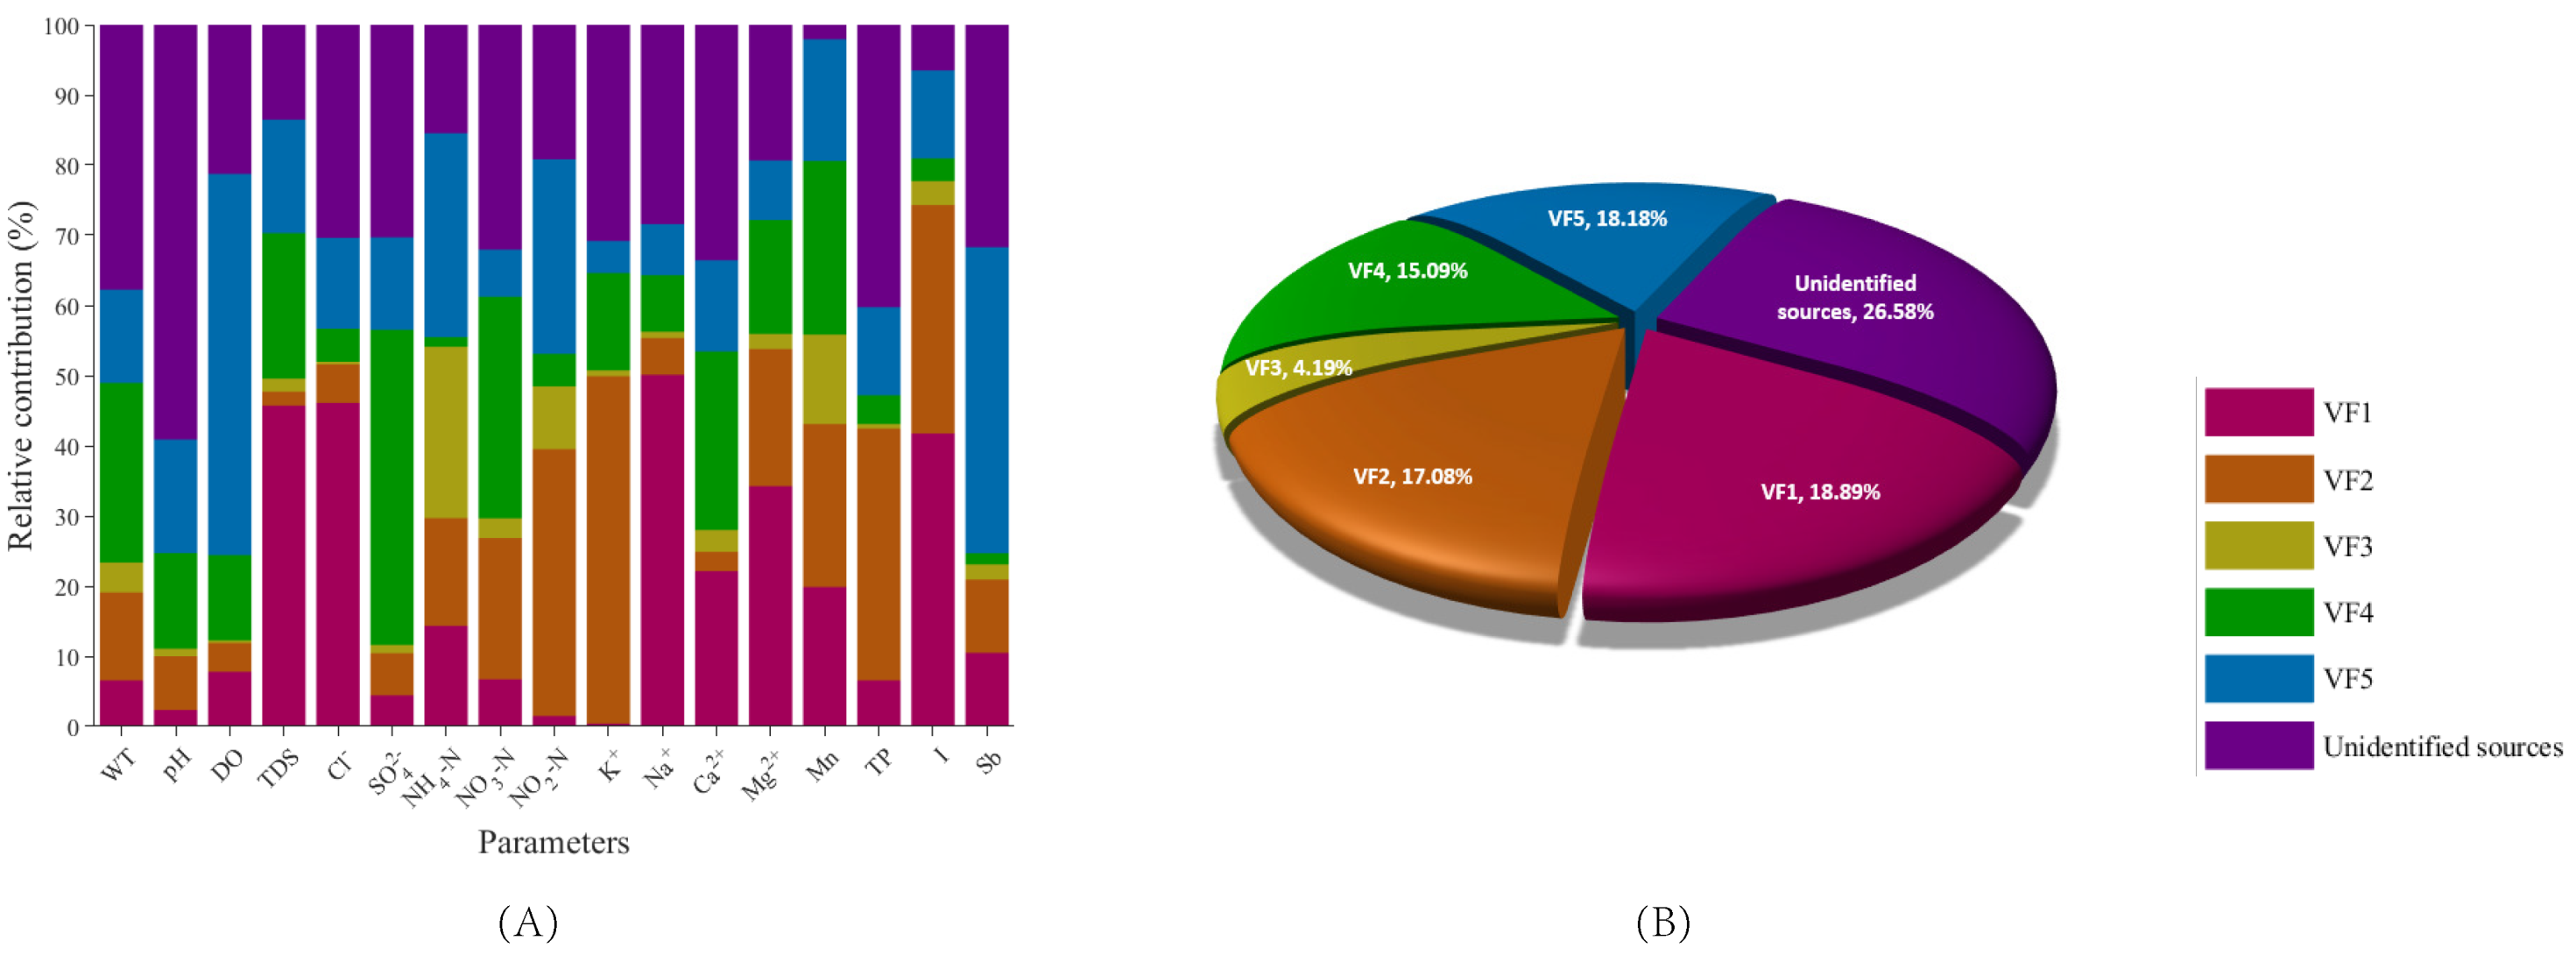
3.3. Source Apportionment Using APCS-MLR

Based on the results of PCA analysis, the APCS-MLR model was then employed to quantify the contribution of each potential contaminant source to all 17 groundwater quality parameters using Equations (6) and (7). The scatter plots of predicted and observed concentrations for main groundwater pollutant parameters by using the APCS-MLR model were shown in Figure 7. Except for M n (0.59) and S b (0.57), the linear regression of other groundwater quality parameters were all well-matched with a R-square values larger than 0.6, indicating the contaminant source apportionment was reliable.
The outcome of source apportionment via APCS-MLR model were shown in Figure 8. The relative contribution of all pollution sources to each contaminant are calculated according to Equations (6) and (7), and the average relative contribution of pollution sources is also obtained for an overall evaluation. As it is shown in Figure 8B, the hydrochemical characteristics of groundwater in the Yangtze River Delta integration demonstration zone was greatly affected by natural hydro-chemical evolution (VF1), accounting for 18.89 % of the total sources and showed high contribution ratios in T D S (46%), C l (46%), N a + (50%) and I (42%) (Figure 8A). The most threatening anthropogenic factor to groundwater quality was textile industrial effluent (VF5), accounting for 18.18 % of the total sources and presented high contribution to S b (44%). Furthermore, non-point source pollution from agricultural activities (VF2) accounted for 17.08 % of the entire sources and presented a relatively high contribution to K + (49%), T P (36%) and N O 2 (38%). Other industrial activities (VF4) were also responsible for 15.09 % of the total sources, shown as S O 4 2 (45%) and N O 3 (32%), while domestic sewage (VF3, 4.19%) presented relatively high contribution ratio in N H 4 + (24%). In addition, the contribution of unidentified sources to each groundwater quality parameters, which are mainly due to the complex pollutants evolution processes, ranging from 2 % to 59 % with the average of 26.58 % . Therefore, the contributions of identified sources in the Yangtze River Delta integration demonstration zone were determined as being in the following descending order: natural hydro-chemical evolution > textile industrial effluent > non-point source pollution from agricultural activities > other industrial activities > domestic sewage.

4. Conclusions

In the present study, principal component analysis (PCA) was employed to identify the potential natural and anthropogenic aspects impacting the groundwater quality, then the absolute principal component score-multiple linear regression (APCS-MLR) model was used to quantify the contribution of potential sources to 17 groundwater quality parameters in the pilot promoter region of Yangtze River Delta integration demonstration zone, China. Based on the result of PCA analysis and possible sources for each ion, five major sources that affected the groundwater quality were identified, namely natural hydro-chemical evolution, agricultural activities, domestic sewage, textile industrial effluent and other industrial activities. With most linear regression R-square values larger than 0.6, the APCS-MLR model successfully quantified the contribution of potential sources in this study area. The contributions of five potential sources were ranked as natural hydro-chemical evolution ( 18.89 % ) > textile industrial effluent ( 18.18 % ) > non-point source pollution from agricultural activities ( 17.08 % ) > other industrial activities ( 15.09 % ) > domestic sewage ( 4.19 % ). The results clarified the groundwater in the pilot promoter region of the Yangtze River Delta integration demonstration zone was primarily contaminated by textile industrial effluent and agricultural activities, while domestic sewage only accounted for a small part of the responsibility. These insights could provide reliable advice for groundwater pollution management in highly developed areas. On the other hand, this study still suffered from a shortage of groundwater quality data, especially in temporal scale. Hence, further research with more measurements needs to be conducted and temporal variation could be a possible way to recognize the unidentified sources.

Author Contributions

Conceptualization, Z.C. and J.L.; methodology, Z.C.; validation, H.Y. (Hai Yang), S.M., Z.J. and R.S.; formal analysis, Z.C.; investigation, J.L., H.Y. (Hui Yang), H.Z., Y.J. (Yang Jin) and L.L.; resources, J.L.; data curation, J.L.; writing—original draft preparation, Z.C.; writing—review and editing, J.L. and H.Y. (Hai Yang); supervision, Q.Z. and Y.J. (Yuehua Jiang); project administration, Q.Z. and Y.J. (Yuehua Jiang). All authors have read and agreed to the published version of the manuscript.

Funding

This research was funded by China Geological Survey, grant number DD20190260 and DD20221728.

Institutional Review Board Statement

Not applicable.

Informed Consent Statement

Not applicable.

Data Availability Statement

The data that support the findings of this study are available from the corresponding author, upon reasonable request.

Conflicts of Interest

The authors declare no conflict of interest.

References

  1. Han, D.; Currell, M.J.; Cao, G. Deep challenges for China’s war on water pollution. Environ. Pollut. 2016, 218, 1222–1233. [Google Scholar] [CrossRef] [PubMed] [Green Version]
  2. Jia, Y.; Xi, B.; Jiang, Y.; Guo, H.; Yang, Y.; Lian, X.; Han, S. Distribution, formation and human-induced evolution of geogenic contaminated groundwater in China: A review. Sci. Total. Environ. 2018, 643, 967–993. [Google Scholar] [CrossRef] [PubMed]
  3. Burri, N.M.; Weatherl, R.; Moeck, C.; Schirmer, M. A review of threats to groundwater quality in the anthropocene. Sci. Total. Environ. 2019, 684, 136–154. [Google Scholar] [CrossRef] [PubMed]
  4. Wen, D.; Zhang, F.; Zhang, E.; Wang, C.; Han, S.; Zheng, Y. Arsenic, fluoride and iodine in groundwater of China. J. Geochem. Explor. 2013, 135, 1–21. [Google Scholar] [CrossRef] [Green Version]
  5. He, X.; Li, P.; Ji, Y.; Wang, Y.; Su, Z.; Elumalai, V. Groundwater Arsenic and Fluoride and Associated Arsenicosis and Fluorosis in China: Occurrence, Distribution and Management. Expo. Health 2020, 12, 355–368. [Google Scholar] [CrossRef]
  6. Podgorski, J.; Berg, M. Global threat of arsenic in groundwater. Science 2020, 368, 845–850. [Google Scholar] [CrossRef]
  7. Datta, P.S.; Deb, D.L.; Tyagi, S.K. Assessment of groundwater contamination from fertilizers in the Delhi area based on 18O, NO3/- and K+ composition. J. Contam. Hydrol. 1997, 27, 249–262. [Google Scholar] [CrossRef]
  8. Gu, B.; Ge, Y.; Chang, S.X.; Luo, W.; Chang, J. Nitrate in groundwater of China: Sources and driving forces. Glob. Environ. Change 2013, 23, 1112–1121. [Google Scholar] [CrossRef]
  9. Tao, Y.; Deng, Y.; Du, Y.; Xu, Y.; Leng, Z.; Ma, T.; Wang, Y. Sources and enrichment of phosphorus in groundwater of the Central Yangtze River Basin. Sci. Total. Environ. 2020, 737, 139837. [Google Scholar] [CrossRef]
  10. Bhagure, G.R.; Mirgane, S.R. Heavy metal concentrations in groundwaters and soils of Thane Region of Maharashtra, India. Environ. Monit. Assess. 2011, 173, 643–652. [Google Scholar] [CrossRef]
  11. Bhutiani, R.; Kulkarni, D.B.; Khanna, D.R.; Gautam, A. Water Quality, Pollution Source Apportionment and Health Risk Assessment of Heavy Metals in Groundwater of an Industrial Area in North India. Expo. Health 2016, 8, 3–18. [Google Scholar] [CrossRef]
  12. Sharma, M.K.; Kumar, M. Sulphate contamination in groundwater and its remediation: An overview. Environ. Monit. Assess. 2020, 192, 74. [Google Scholar] [CrossRef]
  13. McCance, W.; Jones, O.A.; Edwards, M.; Surapaneni, A.; Chadalavada, S.; Currell, M. Contaminants of Emerging Concern as novel groundwater tracers for delineating wastewater impacts in urban and peri-urban areas. Water Res. 2018, 146, 118–133. [Google Scholar] [CrossRef]
  14. Zhou, F.; Huang, G.H.; Guo, H.; Zhang, W.; Hao, Z. Spatio-temporal patterns and source apportionment of coastal water pollution in eastern Hong Kong. Water Res. 2007, 41, 3429–3439. [Google Scholar] [CrossRef]
  15. Gómez-Hernández, J.J.; Xu, T. Contaminant Source Identification in Aquifers: A Critical View. Math. Geosci. 2021, 54, 437–458. [Google Scholar] [CrossRef]
  16. Lapworth, D.J.; Baran, N.; Stuart, M.E.; Ward, R.S. Emerging organic contaminants in groundwater: A review of sources, fate and occurrence. Environ. Pollut. 2012, 163, 287–303. [Google Scholar] [CrossRef] [Green Version]
  17. Zamani, A.A.; Yaftian, M.R.; Parizanganeh, A. Multivariate statistical assessment of heavy metal pollution sources of groundwater around a lead and zinc plant. Iran. J. Environ. Health Sci. Eng. 2012, 9, 29. [Google Scholar] [CrossRef] [Green Version]
  18. Nijenhuis, I.; Schmidt, M.; Pellegatti, E.; Paramatti, E.; Richnow, H.H.; Gargini, A. A stable isotope approach for source apportionment of chlorinated ethene plumes at a complex multi-contamination events urban site. J. Contam. Hydrol. 2013, 153, 92–105. [Google Scholar] [CrossRef]
  19. Zhou, H.; Gómez-Hernández, J.J.; Li, L. Inverse methods in hydrogeology: Evolution and recent trends. Adv. Water Resour. 2014, 63, 22–37. [Google Scholar] [CrossRef] [Green Version]
  20. Cui, J.; Zhou, F.; Gao, M.; Zhang, L.; Zhang, L.; Du, K.; Leng, Q.; Zhang, Y.; He, D.; Yang, F.; et al. A comparison of various approaches used in source apportionments for precipitation nitrogen in a mountain region of southwest China. Environ. Pollut. 2018, 241, 810–820. [Google Scholar] [CrossRef]
  21. Chen, Z.; Gómez-Hernández, J.J.; Xu, T.; Zanini, A. Joint identification of contaminant source and aquifer geometry in a sandbox experiment with the restart ensemble Kalman filter. J. Hydrol. 2018, 564, 1074–1084. [Google Scholar] [CrossRef]
  22. Chen, Z.; Xu, T.; Gómez-Hernández, J.J.; Zanini, A. Contaminant Spill in a Sandbox with Non-Gaussian Conductivities: Simultaneous Identification by the Restart Normal-Score Ensemble Kalman Filter. Math. Geosci. 2021, 53, 1587–1615. [Google Scholar] [CrossRef]
  23. Xu, T.; Gómez-Hernández, J.J.; Chen, Z.; Lu, C. A comparison between ES-MDA and restart EnKF for the purpose of the simultaneous identification of a contaminant source and hydraulic conductivity. J. Hydrol. 2021, 595, 125681. [Google Scholar] [CrossRef]
  24. Chen, Z.; Xu, T.; Gómez-Hernández, J.J.; Zanini, A.; Zhou, Q. Reconstructing the release history of a contaminant source with different precision via the ensemble smoother with multiple data assimilation. J. Contam. Hydrol. 2022, 104115. [Google Scholar] [CrossRef] [PubMed]
  25. Cloutier, V.; Lefebvre, R.; Therrien, R.; Savard, M.M. Multivariate statistical analysis of geochemical data as indicative of the hydrogeochemical evolution of groundwater in a sedimentary rock aquifer system. J. Hydrol. 2008, 353, 294–313. [Google Scholar] [CrossRef]
  26. Li, P.; Tian, R.; Liu, R. Solute Geochemistry and Multivariate Analysis of Water Quality in the Guohua Phosphorite Mine, Guizhou Province, China. Expo. Health 2019, 11, 81–94. [Google Scholar] [CrossRef]
  27. Cheng, G.; Wang, M.; Chen, Y.; Gao, W. Source apportionment of water pollutants in the upstream of Yangtze River using APCS-MLR. Environ. Geochem. Health 2020, 42, 3795–3810. [Google Scholar] [CrossRef]
  28. Thurston, G.D.; Spengler, J.D. A quantitative assessment of source contributions to inhalable particulate matter pollution in metropolitan Boston. Atmos. Environ. 1985, 19, 9–25. [Google Scholar] [CrossRef]
  29. Wang, H.; An, J.; Cheng, M.; Shen, L.; Zhu, B.; Li, Y.; Wang, Y.; Duan, Q.; Sullivan, A.; Xia, L. One year online measurements of water-soluble ions at the industrially polluted town of Nanjing, China: Sources, seasonal and diurnal variations. Chemosphere 2016, 148, 526–536. [Google Scholar] [CrossRef]
  30. Rahman, M.S.; Bhuiyan, S.S.; Ahmed, Z.; Saha, N.; Begum, B.A. Characterization and source apportionment of elemental species in PM2.5 with especial emphasis on seasonal variation in the capital city "Dhaka", Bangladesh. Urban Clim. 2021, 36, 100804. [Google Scholar] [CrossRef]
  31. Choi, H.; Cho, Y.C.; Kim, S.H.; Yu, S.J.; Kim, Y.S.; Im, J.K. Water Quality Assessment and Potential Source Contribution Using Multivariate Statistical Techniques in Jinwi River Watershed, South Korea. Water 2021, 13, 2976. [Google Scholar] [CrossRef]
  32. Cho, Y.c.; Choi, H.; Lee, M.G. Sources Using Multivariate Statistical Techniques and APCS-MLR Model to Assess Surface Water Quality. Water 2022, 14, 793. [Google Scholar] [CrossRef]
  33. Proshad, R.; Kormoker, T.; Al, M.A.; Islam, M.S.; Khadka, S.; Idris, A.M. Receptor model-based source apportionment and ecological risk of metals in sediments of an urban river in Bangladesh. J. Hazard. Mater. 2022, 423, 127030. [Google Scholar] [CrossRef]
  34. Zhang, Q.; Wang, H.; Wang, Y.; Yang, M.; Zhu, L. Groundwater quality assessment and pollution source apportionment in an intensely exploited region of northern China. Environ. Sci. Pollut. Res. 2017, 24, 16639–16650. [Google Scholar] [CrossRef]
  35. Meng, L.; Zuo, R.; Sheng Wang, J.; Yang, J.; Guo Teng, Y.; Tao Shi, R.; Zheng Zhai, Y. Apportionment and evolution of pollution sources in a typical riverside groundwater resource area using PCA-APCS-MLR model. J. Contam. Hydrol. 2018, 218, 70–83. [Google Scholar] [CrossRef]
  36. Yu, L.; Zheng, T.; Yuan, R.; Zheng, X. APCS-MLR model: A convenient and fast method for quantitative identification of nitrate pollution sources in groundwater. J. Environ. Manag. 2022, 314, 115101. [Google Scholar] [CrossRef]
  37. Sheng, D.; Meng, X.; Wen, X.; Wu, J.; Yu, H.; Wu, M. Contamination characteristics, source identification, and source-specific health risks of heavy metal(loid)s in groundwater of an arid oasis region in Northwest China. Sci. Total. Environ. 2022, 841, 156733. [Google Scholar] [CrossRef]
  38. Xing, G.; Cao, Y.; Shi, S.; Sun, G.; Du, L.; Zhu, J. N pollution sources and denitrification in waterbodies in Taihu Lake region. Sci. China Ser. B Chem. 2001, 44, 304–314. [Google Scholar] [CrossRef]
  39. Li, D.; Jiang, X.; Wang, J.; Wang, K.; Zheng, B. Effect of sewage and industrial effluents on bacterial and archaeal communities of creek sediments in the Taihu Basin. Water 2017, 9, 373. [Google Scholar] [CrossRef] [Green Version]
  40. Yin, X.; Jiang, B.; Feng, Z.; Yao, B.; Shi, X.; Sun, Y.; Wu, J. Comprehensive evaluation of shallow groundwater quality in Central and Southern Jiangsu Province, China. Environ. Earth Sci. 2017, 76, 400. [Google Scholar] [CrossRef]
  41. Jiang, Y.; Ni, H.; Zhou, Q.; Cheng, Z.; Duan, X.; Zhu, Z.; Wu, J.; Ren, H.; Fan, C.; Yang, J.; et al. Key technology of ecological restoration demonstration in the Yangtze River Economic Zone and its application. Geol. China 2021, 48, 1305–1333. [Google Scholar] [CrossRef]
  42. Li, L.; Xing, H.X.; Gong, J.S.; Wang, H.S.; Zhou, K.E.; Zhou, Y.E.; Deng, T.T. Hydrochemical characteristics and format mechanism of groundwater in northern Taihu Lake Basin. East China Geol. 2022, 43, 217–226. [Google Scholar] [CrossRef]
  43. Chen, T.; Wang, Z.H.; Qiang, X.K.; Ma, C.Y.; Zhan, Q. Magnetic properties of minerals recorded by the borehole WJ and Late Quaternary transgressions in the Taihu plain, southern Yangtze Delta. Chin. J. Geophys. Chin. Ed. 2013, 56, 2748–2759. [Google Scholar] [CrossRef]
  44. Hua, W.; Wang, C.; Chen, G.; Yang, H.; Zhai, Y. Measurement and simulation of soil water contents in an experimental field in delta plain. Water 2017, 9, 947. [Google Scholar] [CrossRef] [Green Version]
  45. Shi, G.; Ma, P.; Hu, X.; Huang, B.; Lin, H. Surface response and subsurface features during the restriction of groundwater exploitation in Suzhou (China) inferred from decadal SAR interferometry. Remote Sens. Environ. 2021, 256, 112327. [Google Scholar] [CrossRef]
  46. Haji Gholizadeh, M.; Melesse, A.M.; Reddi, L. Water quality assessment and apportionment of pollution sources using APCS-MLR and PMF receptor modeling techniques in three major rivers of South Florida. Sci. Total. Environ. 2016, 566–567, 1552–1567. [Google Scholar] [CrossRef]
  47. Li, Q.; Zhang, H.; Guo, S.; Fu, K.; Liao, L.; Xu, Y.; Cheng, S. Groundwater pollution source apportionment using principal component analysis in a multiple land-use area in southwestern China. Environ. Sci. Pollut. Res. 2020, 27, 9000–9011. [Google Scholar] [CrossRef]
  48. Zhang, H.; Cheng, S.; Li, H.; Fu, K.; Xu, Y. Groundwater pollution source identification and apportionment using PMF and PCA-APCA-MLR receptor models in a typical mixed land-use area in Southwestern China. Sci. Total. Environ. 2020, 741, 140383. [Google Scholar] [CrossRef]
  49. Kaiser, H.F. An index of factorial simplicity. Psychometrika 1974, 39, 31–36. [Google Scholar] [CrossRef]
  50. Shrestha, S.; Kazama, F. Assessment of surface water quality using multivariate statistical techniques: A case study of the Fuji river basin, Japan. Environ. Model. Softw. 2007, 22, 464–475. [Google Scholar] [CrossRef]
  51. Chen, R.; Chen, H.; Song, L.; Yao, Z.; Meng, F.; Teng, Y. Characterization and source apportionment of heavy metals in the sediments of Lake Tai ( China ) and its surrounding soils. Sci. Total. Environ. 2019, 694, 133819. [Google Scholar] [CrossRef]
  52. Helena, B.; Pardo, R.; Vega, M.; Barrado, E.; Fernandez, J.M.; Fernandez, L. Temporal evolution of groundwater composition in an alluvial aquifer (Pisuerga River, Spain) by principal component analysis. Water Res. 2000, 34, 807–816. [Google Scholar] [CrossRef]
  53. Liu, L.; Tang, Z.; Kong, M.; Chen, X.; Zhou, C.; Huang, K.; Wang, Z. Tracing the potential pollution sources of the coastal water in Hong Kong with statistical models combining APCS-MLR. J. Environ. Manag. 2019, 245, 143–150. [Google Scholar] [CrossRef]
  54. Li, W.; Wu, J.; Zhou, C.; Nsabimana, A. Groundwater Pollution Source Identification and Apportionment Using PMF and PCA-APCS-MLR Receptor Models in Tongchuan City, China. Arch. Environ. Contam. Toxicol. 2021, 81, 397–413. [Google Scholar] [CrossRef]
  55. Li, Y.; Wang, S.; Zhang, W.; Yuan, J.; Xu, C. Potential drivers of the level and distribution of nitrogen in the hyporheic zone of Lake Taihu, China. Water 2017, 9, 544. [Google Scholar] [CrossRef] [Green Version]
  56. Vadde, K.K.; Wang, J.; Cao, L.; Yuan, T.; McCarthy, A.J.; Sekar, R. Assessment of water quality and identification of pollution risk locations in Tiaoxi River (Taihu Watershed), China. Water 2018, 10, 183. [Google Scholar] [CrossRef] [Green Version]
  57. Li, F.; Zhu, J.; Deng, X.; Zhao, Y.; Li, S. Assessment and uncertainty analysis of groundwater risk. Environ. Res. 2018, 160, 140–151. [Google Scholar] [CrossRef]
  58. Wei, W.; Nghiem, A.; Ma, R.; Sun, Z.; Gong, X.; Zhou, A.; Prommer, H. Factors controlling iodine enrichment in a coastal plain aquifer in the North Jiangsu Yishusi Plain, China. J. Contam. Hydrol. 2021, 243, 103894. [Google Scholar] [CrossRef]
  59. Liu, H.; Li, J.; Cao, H.; Xie, X.; Wang, Y. Prediction modeling of geogenic iodine contaminated groundwater throughout China. J. Environ. Manag. 2022, 303, 114249. [Google Scholar] [CrossRef]
  60. Griffioen, J. Potassium adsorption ratios as an indicator for the fate of agricultural potassium in groundwater. J. Hydrol. 2001, 254, 244–254. [Google Scholar] [CrossRef]
  61. Kendall, C.; Elliott, E.M.; Wankel, S.D. Tracing Anthropogenic Inputs of Nitrogen to Ecosystems. In Stable Isotopes in Ecology and Environmental Science; John Wiley & Sons, Ltd.: Hoboken, NJ, USA, 2007; Chapter 12; pp. 375–449. [Google Scholar] [CrossRef]
  62. Chen, X.; Wo, F.; Chen, C.; Fang, K. Seasonal changes in the concentrations of nitrogen and phosphorus in farmland drainage and groundwater of the Taihu Lake region of China. Environ. Monit. Assess. 2010, 169, 159–168. [Google Scholar] [CrossRef] [PubMed]
  63. Zanotti, C.; Rotiroti, M.; Fumagalli, L.; Stefania, G.A.; Canonaco, F.; Stefenelli, G.; Prévôt, A.S.; Leoni, B.; Bonomi, T. Groundwater and surface water quality characterization through positive matrix factorization combined with GIS approach. Water Res. 2019, 159, 122–134. [Google Scholar] [CrossRef] [PubMed]
  64. Abd El-Salam, M.M.M.; El-Ghitany, E.M.A.; Kassem, M.M.M. Quality of bottled water brands in Egypt part I: Physico-chemical analyses. J. Egypt Public Health Assoc. 2008, 83, 369–388. [Google Scholar] [PubMed]
  65. Huang, H.; Liu, M.; Wang, J.; He, J.; Chen, H. Sources Identification of Nitrogen Using Major Ions and Isotopic Tracers in Shenyang, China. Geofluids 2018, 2018, 8683904. [Google Scholar] [CrossRef]
  66. Wu, J.; Sun, Z. Evaluation of Shallow Groundwater Contamination and Associated Human Health Risk in an Alluvial Plain Impacted by Agricultural and Industrial Activities, Mid-west China. Expo. Health 2016, 8, 311–329. [Google Scholar] [CrossRef]
  67. Ghahremanzadeh, H.; Noori, R.; Baghvand, A.; Nasrabadi, T. Evaluating the main sources of groundwater pollution in the southern Tehran aquifer using principal component factor analysis. Environ. Geochem. Health 2017, 40, 1317–1328. [Google Scholar] [CrossRef]
  68. Wu, F.; Sun, F.; Wu, S.; Yan, Y.; Xing, B. Removal of antimony(III) from aqueous solution by freshwater cyanobacteria Microcystis biomass. Chem. Eng. J. 2012, 183, 172–179. [Google Scholar] [CrossRef]
  69. Li, Z.; Ma, Z.; van der Kuijp, T.J.; Yuan, Z.; Huang, L. A review of soil heavy metal pollution from mines in China: Pollution and health risk assessment. Sci. Total Environ. 2014, 468–469, 843–853. [Google Scholar] [CrossRef]
Figure 1. Location of the pilot promoter region of Yangtze River Delta integration demonstration zone and distribution of groundwater sampling sites with the land-use.
Water 15 00225 g001
Figure 2. Hydrogeological profile (A-B) of the study area.
Water 15 00225 g002
Figure 3. The landscape surroundings of several wells and the in situ test procedures.
Water 15 00225 g003
Figure 4. Spatial distribution of M n , N H 4 + , N O 2 , N O 3 , T P , I, K + and S b in groundwater.
Water 15 00225 g004
Figure 5. Correlation coefficients between groundwater quality parameters.
Water 15 00225 g005
Figure 6. Component loadings for 17 parameters after varimax rotation.
Water 15 00225 g006
Figure 7. Scatter plots of the predicted and observed concentrations for main groundwater pollutant parameters by using APCS-MLR models.
Water 15 00225 g007
Figure 8. The contributions on the groundwater quality parameters (A) and average contributions (B) of pollution sources in the pilot promoter region of Yangtze River Delta integration demonstration zone according to the APCS-MLR model.
Water 15 00225 g008
Table 1. Water quality parameters, units and analytical methods used for groundwater samples in the pilot promoter region of Yangtze River Delta integration demonstration zone.
ParametersAbbreviationsUnitsAnalytical Equipments
Water temperatureWT°CSX-620/SX-630
Pondus HydrogeniipHpH unitSX-620 pH Testor
Dissolved oxygenDOmg/LSX-630 ORP Testor
Total dissolved solidsTDSmg/LHanna DiST
Chloride C l mg/LDionex-2500
Sulfate S O 4 2 mg/LDionex-2500
Ammonical nitrogen N H 4 N mg/LAutoAnalyzer3
Nitrate nitrogen N O 3 N mg/LDionex-2500
Nitrite nitrogen N O 2 N mg/LTU-1950
Potassium K + mg/LICAP 6300Duo
Sodium N a + mg/LICAP 6300Duo
Calcium C a 2 + mg/LICAP 6300Duo
Magnesium M g 2 + mg/LICAP 6300Duo
Manganese M n μ g/LICAP Q
Total phosphorus T P μ g/LICAP 6300Duo
IodineI μ g/LICAP Q
Antimony S b μ g/LICAP Q
Table 2. Summary statistics of physicochemical parameters in groundwater in the pilot promoter region of Yangtze River Delta integration demonstration zone.
ParametersMinMaxMeanStandard DeviationCoefficients of Variation (%)National Standards, Class III
W T 18.429.723.22.410/
p H 6.808.197.200.2846.5–8.5
D O 1.424.03.52.880/
T D S 40792383146381000
C l 1.7170.047.932.768250
S O 4 2 2.0146.041.426.163250
N H 4 N 0.024.190.360.902500.5
N O 3 N 0.0139.294.065.9014520
N O 2 N 0.0022.4130.2900.5381861
K + 1.390.320.818.689/
N a + 6.7174.056.333.259200
C a 2 + 27.6148.070.026.03775
M g 2 + 3.275.220.914.268150
M n 0.101610.0078.31266.27340100
T P 6.42510.0484.7556.7115/
I4.4446.083.392.211180
S b 0.106.281.631.45895
Table 3. The varifactor loadings of 17 parameters after the varimax rotated. Bold values stand for the parameters with medium or strong loadings.
ParametersVF1VF2VF3VF4VF5
W T −0.190.310.47−0.45−0.22
p H −0.120.33−0.20−0.410.46
D O −0.19−0.090.040.180.78
T D S 0.830.030.130.23−0.17
C l 0.910.100.03−0.06−0.15
S O 4 2 0.130.150.130.780.22
N H 4 N 0.130.120.850.01−0.15
N O 3 N −0.190.50−0.310.55−0.11
N O 2 N 0.020.520.54−0.05−0.25
K + 0.010.820.060.160.05
N a + 0.94−0.09−0.06−0.09−0.08
C a 2 + 0.61−0.070.330.43−0.21
M g 2 + 0.79−0.390.190.23−0.12
M n 0.26−0.260.630.200.13
T P −0.160.780.06−0.060.18
I0.70−0.470.22−0.03−0.12
S b −0.260.23−0.210.020.64
Eigenvalues4.202.552.061.701.60
% of Variance24.7215.0212.0910.029.38
Cumulative %24.7239.7451.8361.8571.23
Disclaimer/Publisher’s Note: The statements, opinions and data contained in all publications are solely those of the individual author(s) and contributor(s) and not of MDPI and/or the editor(s). MDPI and/or the editor(s) disclaim responsibility for any injury to people or property resulting from any ideas, methods, instructions or products referred to in the content.

