Article

Ecological and Human Health Risks of Metal–PAH Combined Pollution in Riverine and Coastal Soils of Southern Russia

1
Academy of Biology and Biotechnologies, Southern Federal University, 344090 Rostov-on-Don, Russia
2
Faculty of Geography, Lomonosov Moscow State University, 119991 Moscow, Russia
3
Consortium on Health, Environment, Education, and Research (CHEER), Department of Science and Environmental Studies, The Education University of Hong Kong, Hong Kong, China
*
Author to whom correspondence should be addressed.
Water 2023, 15(2), 234; https://doi.org/10.3390/w15020234
Submission received: 15 December 2022 / Revised: 30 December 2022 / Accepted: 2 January 2023 / Published: 5 January 2023

Abstract

:
The floodplains and seacoasts of southern Russia are characterized by urbanization, developed agriculture, and rapidly developing industries. Anthropogenic activity leads to the long-term release of pollutants into the environment, which threatens the stability of ecosystems and public health. The study aimed to assess the ecological and human health risks posed by potentially toxic elements (PTEs) and polycyclic aromatic hydrocarbons (PAHs) in the topsoils of the Taganrog Bay coast and the Lower Don floodplain. Concentrations of PTEs and PAHs were measured using X-ray fluorescence and high-performance liquid chromatography, respectively. Except for the comparatively most toxic Cd, which ranged from low to moderate, ecological risk factors indicated a low risk for PTEs. The cumulative ecological risk of PTEs was low. Zn, As, Cd, and benzo[a]pyrene (BaP) were the most dangerous pollutants, with concentrations 1–2 orders of magnitude higher than the maximum permissible concentrations (MPCs). Mostly sandy soils were characterized by high and very high individual pollution since they have more stringent quality standards due to their lower resistance to contamination. Significant concern is caused by the total contamination of soils with PAHs. A comparison of the toxic equivalent quotient of PAHs with the MPC of BaP showed high or very high contamination in two-thirds of the samples. The non-carcinogenic risk for adults in the region was negligible, whereas the risk for children was low. Dermal contact with PTEs and PAHs contributed to a significant non-carcinogenic risk. Only the combined intake of pollutants poses a substantial risk for children. Over most of the research area, total carcinogenic risk surpasses the threshold, indicating a low risk, with As being the most important contributor. The results of the study showed that PAHs pose a greater potential ecological risk than PTEs, and the opposite trend was observed in relation to the risk of negative impacts on human health. In this regard, taking into account the combined influence of different types of components allows for a more comprehensive risk assessments.

1. Introduction

Due to relatively favorable climatic conditions, the regions of southern Russia are predominantly agricultural. Thus, the Rostov and Krasnodar regions together account for 11.6% of the value of agricultural production produced in Russia [1]. The developed agriculture provided the basis for the growth of industry in the cities, in particular the metallurgy, metalworking, and agricultural engineering industries. There is also an electrical and thermal power industry, the manufacture of chemicals and chemical products, the consumer industry, and food processing [2]. The most populated urban areas in the region are traditionally located along the rivers, the largest of which is the Don, and on the coast of the Sea of Azov. In the coastal cities of Taganrog, Azov, and Yeysk, as well as Rostov-on-Don, there are seaports, which are one of the main sources of pollution of surface water and bottom sediments. In recent decades, the trends in the development of coastal areas for tourism and recreation have become more important [2,3]. It is the landscapes of the Lower Don and the coast of Taganrog Bay that are experiencing the most significant anthropogenic pressure, the main adverse consequences of which are the degradation of soil and vegetation cover, including those occurring as a result of chemical pollution [3,4,5,6].
The latter is of particular interest for several reasons. First, soils in floodplains and riparian zones are essential for the sustainable functioning of ecosystems and biodiversity conservation [7,8,9]. It is generally accepted that aquatic landscapes of floodplains, deltas, and riparian zones act as a strong barrier that controls terrestrial geochemical fluxes [10,11,12]. Secondly, they are very fertile, and, therefore, they have been intensively used for agricultural production in most of the populated regions of the world since antiquity [13]. Thirdly, hydromorphic soils are very dynamic. They are subjected to periodic flooding events and regular fluctuations in redox conditions [14,15,16], which makes their role in the accumulation and potential remobilization of pollutants rather complex [17,18,19,20]. In the case of deltaic and riparian soils, their role in the ecosystem and geochemical status is also primarily determined by the up and down surges, the interaction of fresh and saline waters, and the abrasion processes [21,22,23,24,25,26].
Soil pollution is one of the leading environmental factors in terms of ecological hazards and public health threats. Some metals and metalloids, e.g., Cr, Mn, Ni, Cu, Zn, As, Cd, and Pb, are potentially toxic elements (PTEs) in ecological and human health protection. In the international practice of regulating hazardous pollutants, special attention is paid to polycyclic aromatic hydrocarbons (PAHs) as environmentally persistent compounds due to their toxic and carcinogenic properties and the ability to bioaccumulate [27,28,29].
Previously, it was shown that the soils of the Lower Don floodplain and the coast of the Sea of Azov are significantly contaminated with PTEs [3,5,6,30] and PAHs [31,32]. The abovementioned studies discuss the levels and fluxes of elements and compounds in soils, as well as the sources and spatial distribution patterns of individual pollutants. At the same time, the ecological and human health risks posed by combined soil pollution by PTEs and PAHs for the Lower Don floodplain and adjacent coastal area of Taganrog Bay were never estimated.
In 2021, a high background risk of the incidence rate of malignant neoplasms was reported in southern Russia: 319 per 100,000 standard population overall in Rostov Oblast [33] and 415 per 100,000 standard population overall in Krasnodar Krai [34]. Certainly, chemical contamination of soils is not the only source of carcinogenic risk; however, it warrants further investigation [35]. Soil pollution may adversely affect the population engaged in various activities, e.g., agriculture (including small family garden cultivation) and recreational and service activities in the Sea of Azov. These estimations may be rather important for environmental management and planning [36]. They may reveal some less obvious risks to the population from soil pollution, as was the case in the PTE risk assessment in the Central Elbe River soils [37].
The novelty of the study lies in the fact that studies of the environmental and human health risks of soils within river–marine systems are very limited, and, as a rule, the focus of attention is constrained by only one type of pollutant. When planning and conducting subsequent studies, we set the task of assessing and monitoring ecological and human health risks caused by soil contamination with both PAHs and PTEs in the largest and most densely populated floodplain and coastal landscapes of southern Russia. The study aims to (1) assess individual and cumulative ecological risks of PTEs and PAHs in riverine and coastal soils of southern Russia; (2) evaluate possible carcinogenic and non-carcinogenic risks for adults and children related to PTEs and PAHs; and (3) characterize the spatial distribution of individual and cumulative risk parameters.

2. Materials and Methods
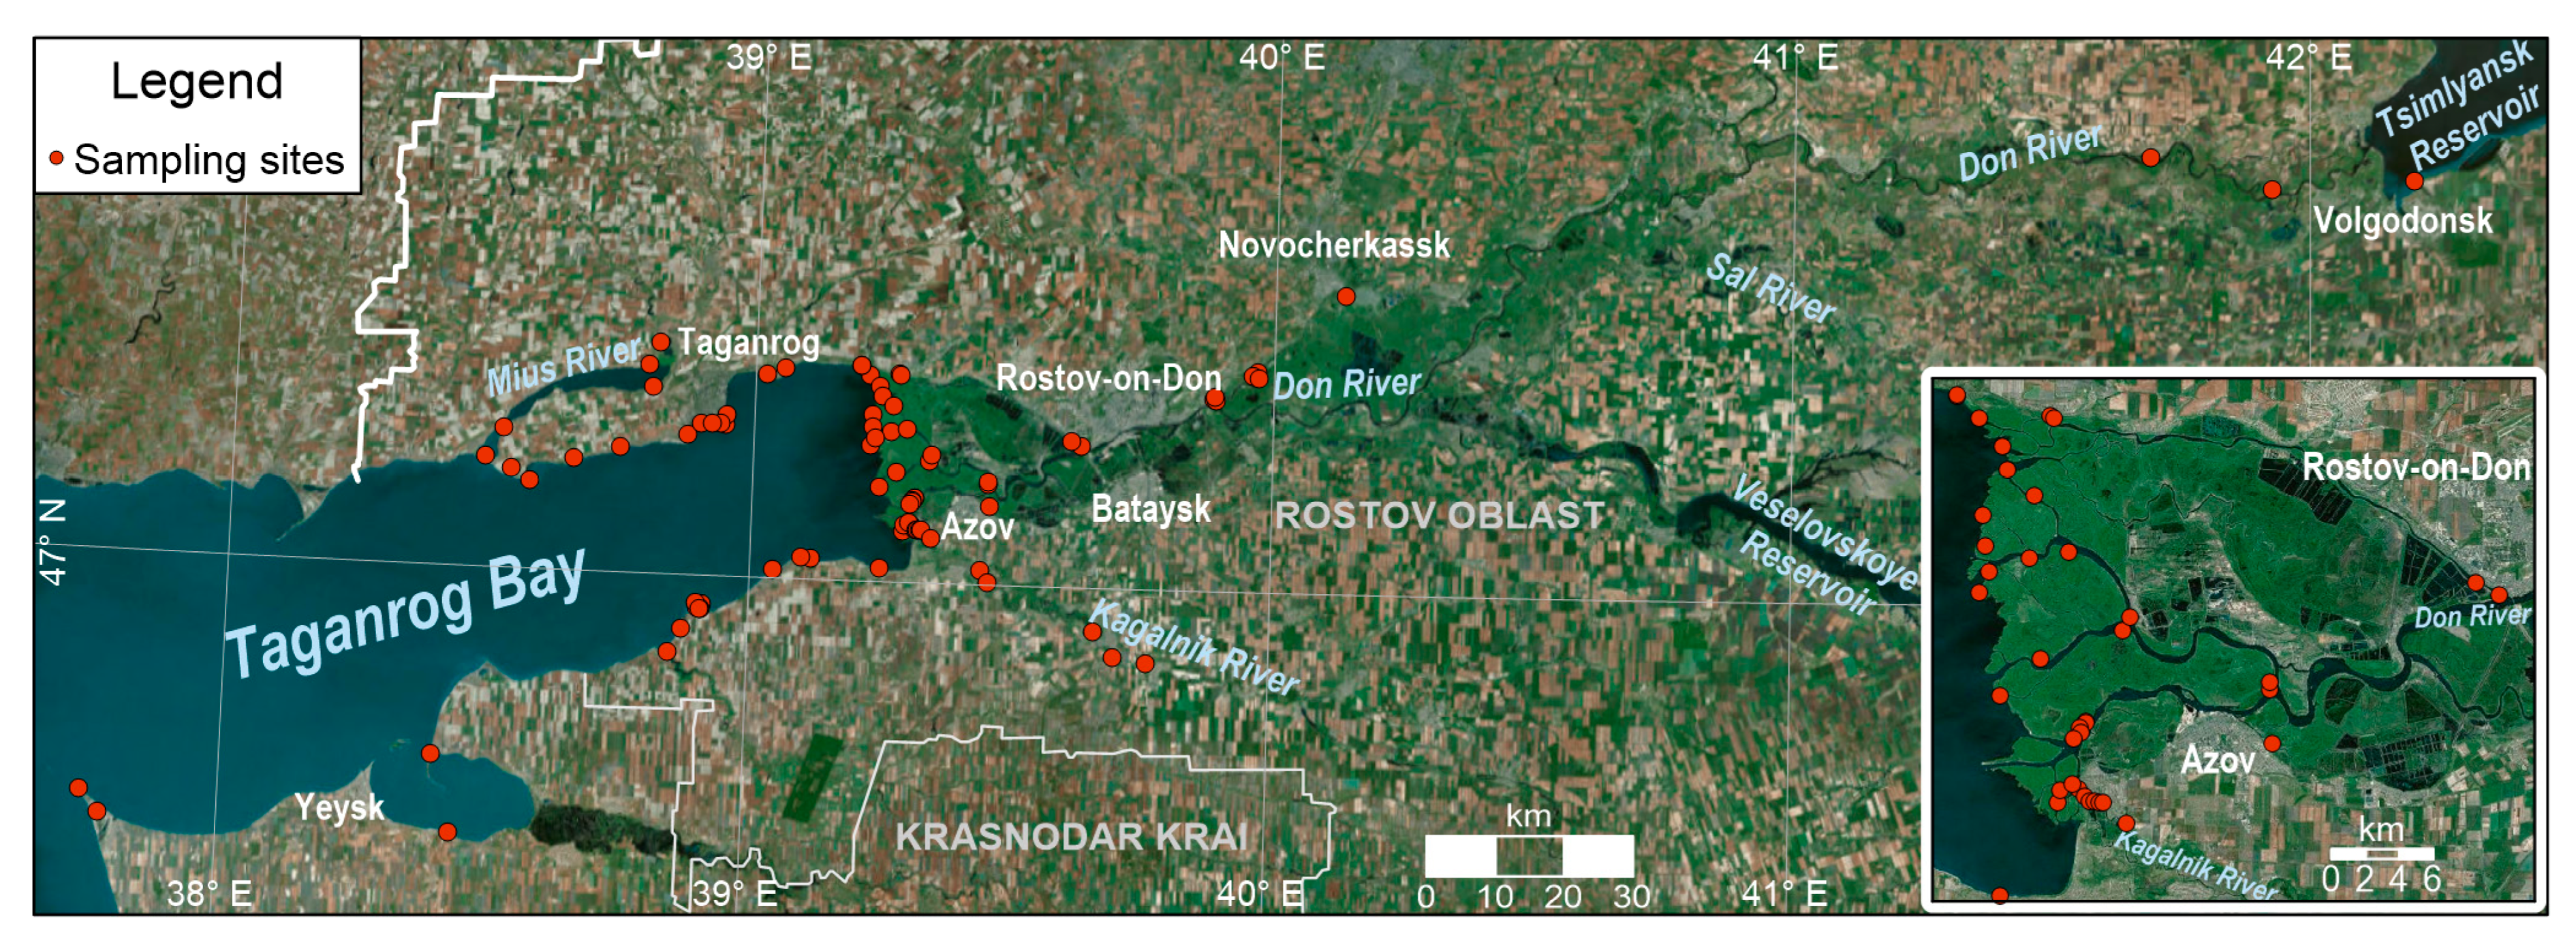
2.1. Study Area

The study was carried out in Rostov Oblast and Krasnodar Krai, Russia. The study area is located on the coast of Taganrog Bay, the northeastern arm of the Sea of Azov, from the estuary of the Mius River in the north to the Dolgaya Spit in the south and the Don floodplain from Tsimlyansk Dam to the Don River delta (Figure 1). The climate of the territory is hot and humid during summer. The average annual temperature is 8.2–9.9 °C, the average annual precipitation is 500–615 mm, and the average frostless season lasts 170–180 days.
The study area’s coastal, deltaic, and floodplain landscapes are characterized by different types of natural, undisturbed semi-hydromorphic, and hydromorphic soils. The background soils are Gleyic Phaeozems, Eutric (or Calcaric) Gleyic, and Gleyic Fluvisols. Fluvic solonchaks (hypersalic) form in local depressions on saline marine or alluvial deposits. Outside of local waterlogging conditions, Haplic Chernozems are most common under steppe vegetation on loess in autonomous geochemical positions.

2.2. Soil Sampling and Physical–Chemical Characterization of Topsoils

The location of sampling points was selected randomly throughout the study area, taking into account differences in landscape conditions in the following areas: the lower reaches of the Don River; the Don Delta; the coast of Taganrog Bay; and the floodplains of small rivers flowing into the bay (the rivers Kagalnik, Mius, Sukhaya Chuburka, and Mokraya Chuburka). Samples of the surface horizon of riverine and coastal soils (n = 86) were collected in the summer of 2020 during the steady low water period (Figure 1). Topsoil samples (0–20 cm deep) were taken from five surface subsamples with a stainless-steel spade [38]. In clean, hermetically sealed polythene bags, 1 kg of mixed topsoil was stored. Collected soil samples were air-dried, cleaned by removing visible residues, homogenized, and sieved through a 2 mm sieve [39].
The main physical–chemical properties were determined in the collected topsoil samples: pH at a soil-to-water ratio of 2.5 using a glass electrode; content of CaCO3 by the Kudrin complexometric method with the destruction of CaCO3 with 0.02 mol L−1 HCl and subsequent titration of excess acid with alkali; content of total organic carbon (TOC) by the Tyurin dichromate oxidation titrimetric method [39]; and particle size distribution by the pipette method with the pyrophosphate soil preparation to obtain the clay fraction (<0.002 mm) [40].
Eutric Gleyic Fluvisols ranged in acidity from neutral to strongly alkaline (pH = 7.2–8.9). Soils ranged in texture from sandy to fine loamy. These soils are characterized mainly by a moderate content of CaCO3 (0.1–8.3%) and TOC (0.1–3.1%). The pH values in other types of soils were lower and corresponded to slightly to moderately alkaline reactions (Table 1). The content of carbonates varied greatly depending on the soil type. The highest TOC content was characteristic of Gleyic Fluvisols (Humic). Most soils were characterized by a sandy texture, except for Solonchaks and Chernozems, which had a predominantly fine loamy composition.

2.3. PTE Analysis

For the determination of selected PTEs (Cr, Mn, Ni, Cu, Zn, As, Cd, and Pb), the air-dried bulk samples were finely ground with an agate pestle and mortar to a 200-mesh particle size and pressed into a tablet supported on boric acid.
The total content of PTEs was measured in triplicate using a Spectroscan «MAX-GV» vacuum wavelength-dispersive scanning X-ray fluorescence spectrometer (Spectron, Saint Petersburg, Russia) [41]. Quantitative analysis of the composition of soil samples was carried out using atomic absorption spectrophotometer «Kvant-2Z» (Kortec, Moscow, Russia). A set of calibration curves for the analyzed elements was created using a standard sample suite, comprising five samples of Haplic Chernozems. Limits of quantification (LOQ) were (in mg kg−1): 80 for Mn, 20 for Cr, 10 for Ni, Cu, and Zn, 5 for Pb, 1 for As, and 0.1 for Cd.
For quality assurance and quality control (QA/QC) purposes, the analytical duplicates, reagent blanks, internal standard, and certified GSS 10412–2014 state reference material (CRM) were used. Accuracy and precision corresponded to the standards of the certified method [41].

2.4. PAH Analysis

Sample preparation for the PAH analysis was performed according to the procedure previously described in the studies [31,32,42,43]. One gram of the dry soil sample was spiked with the internal standard solution (Sigma-Aldrich, Saint Louis, MO, USA), mixed with 20 mL of 2% KOH solution in ethanol, and then heated to reflux in a water bath for 3 h to remove interfering lipid components of the soil. The percolate was extracted three times with 15 mL of n-hexane and 5 mL of distilled water on a mechanical shaker LOIP LS-110 (Loip, Saint Petersburg, Russia) for 10 min. The extract was cleaned with distilled water through anhydrous Na2SO4 in a separatory funnel before being concentrated by rotary evaporation with solvent exchange to acetonitrile.
The composition and content of PAHs were determined using a high-performance liquid chromatograph (HPLC) with a fluorescence detector (1260 Infinity Agilent, Santa Clara, CA, USA); Hypersil BDS C18 reversed phase column, 5 μm, 125 mm × 4.6 mm and HPLC with a mass selective detector (1260 Infinity Agilent, Santa Clara, CA, USA; QTrap 3200 ABSCIEX, Framingham, MA, USA) according to the ISO 13859:2014 method [44]. Identification of each compound was based on its retention time of an authentic standard solution (Sigma-Aldrich, Merck, Rahway, NJ, USA) containing the priority PAHs: acenaphthene (ACE), acenaphthylene (ACY), anthracene (ANT), benzo[a]anthracene (BaA), benzo[a]pyrene (BaP), benzo[b]fluoranthene (BbF), benzo[g,h,i]perylene (BghiP), benzo[k]fluoranthene (BkF), chrysene (CHR), dibenzo[a,h]anthracene (DBA), fluoranthene (FLT), fluorene (FLU), naphthalene (NAP), phenanthrene (PHE), and pyrene (PYR). Quantification was performed by using the standard external method. The spiked recovery rates of PAHs in the samples ranged from 72% to 96%. QA/QC procedures were performed according to the Agilent Application Solution [45]. The calibration curves and CRM were used for the calculation of the limits of detection (LODs) and LOQs, which were presented previously [42].

2.5. Data Analysis

Descriptive statistics for the concentrations of PTEs and PAHs and risk parameters were calculated using STATISTICA 12 (StatSoft, Tulsa, OK, USA). The normality of the data was checked by the Kolmogorov–Smirnov test. Data visualization was conducted using Grapher 17 (Golden Software, Golden, CO, USA). Maps illustrating the spatial distribution of the studied risk parameters were created in Surfer 15 (Golden Software, Golden, CO, USA). Data interpolation was performed by the inverse weighted distance method with a power of 2.

2.6. Ecological Risk Assessment

Two approaches were used to evaluate the ecological risk of soil contamination by different classes of pollutants. The first approach was to calculate individual and cumulative ecological risk parameters on the basis of the pollution index (PI), taking into account the toxic response factor of individual pollutants (Tr) [46,47,48,49]. Since Tr has not been established for individual PAHs, in this study, ecological risk parameters were calculated only for PTEs. The second approach was to determine the toxic pollution hazard on the basis of the risk quotient (RQ), which reflects the excess of PTEs and PAHs in soils compared with the established screening level estimate [11,50].
The ecological risks of PTEs were assessed using individual and integral risk indices. The potential ecological risk factor (Er) and the potential ecological risk index (RI) are widely used to assess the risk of PTE soil contamination in wetlands and floodplains [9,46,47,51,52,53,54,55]. These parameters were calculated as follows:
R I =   E r i =   ( P I × T r i ) =   ( C i / C b × T r i ) ,
where Ci is the concentration of PTE in the sample (mg kg−1), Cb is the regional geochemical background value of the I element (mg kg−1), and Tri is the toxic response factor of the I element (Table 2).
The ecological hazard of soil contamination by individual pollutants was also assessed by comparison with the tentative allowable concentrations (TACs) and maximum permissible concentrations (MPCs) of pollutants in soils using the RQ, calculated as [57]:
R Q = C i / C M P C ,
where Ci is the concentration of i pollutant in the sample (mg kg−1), and CMPC is the MPC or the TAC of the total metal content, taking into account the soil texture and acidity (mg kg−1) (Table 2). Since the MPC of Cr in the soils of Russia is not defined, agricultural soil quality guidelines for total Cr in Canada were used [56]. The MPC of individual PAHs in Russia has not been adopted, except for BaP, whose MPC is 20 μg kg−1 [57]. Given that PAHs enter the environment as a mixture, the ecological hazard was assessed for the total content of PAHs in soils, expressed as the BaP toxic equivalent quantity (TEQ), which is the sum of the concentrations of BaP equivalents of each compound [50]:
T E Q =   ( C i × T E F i ) ,
where Ci is the PAH concentration (μg kg−1), and TEFi is the toxicity equivalency factor of individual PAHs. TEF was 5.0 for DahA, 1.0 for BaP, 0.1 for BaA, BbF, and BkF, 0.01 for ANT, BghiP, and CHR, and 0.001 for ACY, ACE, FLT, FLU, NAP, PHE, and PYR [58]. The classification of ecological risk values is listed in Table 3.

2.7. Human Health Risk Assessment

The human health risk of the general public was assessed using the quantitative model [59] to identify risks associated with soil pollutants. Three main routes of exposure were considered: direct ingestion (ing), inhalation (inh), and dermal contact (derm). Adults and children under 6 years of age were identified as two sensitive subpopulations that are at potential risk of chronic exposure to a compound [60]. Non-carcinogenic risk characterized the possibility of adverse general toxic effects occurring in an individual [59]. The hazard quotient (HQ) measured the potential non-carcinogenic toxicity of a pollutant under a particular exposure route. HQ was estimated as the level of exposure over a specified period divided by the reference dose (RfD) of a pollutant [59,61] (Equations (4)–(6)). The carcinogenic risk (CR) of lifetime exposure to a potential carcinogen in a recipient was estimated as the increase in the likelihood of developing cancer in a person, with age adjusted for an appropriate slope factor (SF) [59], using Equations (7)–(9). Multi-pathway and multi-chemical non-carcinogenic and carcinogenic risks were assessed on the basis of summary indicators, namely the total hazard index (HI) and the total carcinogenic risk (TCR) [59] (Equations (10) and (11)).
H Q i n g = ( C i × I R s × F I × E F × E D × C F B W × A T ) / R f D i n g
H Q d e r m = ( C i × S A × A F × A B S d × E F × E D × C F B W × A T ) / R f D d e r m
H Q i n h = ( C i × I R a × E F × E D B W × A T × P E F ) / R f D i n h
C R i n g = C i × F I × E F × C F L T × ( E D c × I R s c B W c + E D a × I R s a B W a ) × S F i n g
C R d e r m = C i × A B S d × E F × C F L T × ( S A c × A F c × E D c B W c + S A a × A F a × E D a B W a ) × S F d e r m
C R i n h = C i × E F   L T × P E F × ( I R a c × E D c B W c + I R a a × E D a B W a ) × S F i n h
H I = k = 1 n H Q k = H Q i n g + H Q d e r m + H Q i n h
T C R = k = 1 n C R k = C R i n g + C R d e r m + C R i n h
The definition, units, and reference values for exposure parameters used in the above equations are presented in Table 4. The values of RfDs and SFs for PTEs and PAHs used for human health risk assessment are listed in Table 5.
According to the values of HQ and HI [62], the following hazard classes are defined: non-existent (<0.1), low (0.1–1.0), moderate (1.0–10), and high (>10). The individual and total carcinogenic risks (CR and TCR values) are classified as follows [59,63,64]: negligible (<1 × 10⁻⁶), low (1 × 10⁻⁶–1 × 10⁻⁴), moderate (1 × 10⁻⁴–1 × 10⁻³), and unacceptable (>1 × 10⁻³).
Table 4. Exposure parameters used for the health risk assessment.
ParameterUnitChildrenAdultsReference
ABSddermal absorption factorCd 0.002; Cr 0.02; Mn, Cu, Zn, and Pb 0.03; Ni 0.04; As 0.06; PAHs 0.13[65]
AFsoil adherence factormg cm−20.20.07[60]
ATaverage timedays21907300[60]
BWbody weightkg1580[60]
CFconversion factorkg mg−11 × 10−6[59]
EDexposure durationyears620[60]
EFexposure frequencydays year−1350[60]
FIfraction ingested1[59]
IRainhalation ratem3 day−18.115.6[66]
IRsingestion ratemg day−13010[67]
LTlifetimedays25550[60]
PEFparticulate emission factorm3 kg−11.36 × 10⁹[61]
SAskin surface areacm223736032[60]
Table 5. Reference doses (RfD, mg kg−1 day−1) and slope factors (SF, kg day−1 mg−1) of the studied elements and compounds.
PollutantRfDingRfDdermaRfDinhbSFingSfdermcSFinhdReference
Cr (III)1.51.95 × 10−21.43 × 10⁻³[27,29]
Mn0.148.4 × 10−31.4 × 10⁻⁵[29]
Ni1.1 × 10−24.4 × 10−42.57 × 10−50.84[27,28,29]
Cu1.0 × 10−25.7 × 10⁻³[27]
Zn0.33.0 × 10−2[29]
As3.0 × 10−42.85 × 10−44.29 × 10−41.51.5815.05[28,29]
Cd1.0 × 10−32.5 × 10−52.86 × 10−66.3[27,29]
Pb3.6 × 10−33.6 × 10−48.5 × 10−30.0850.042[28,68]
NAP2.0 × 10−21.78 × 10−28.57 × 10−40.120.130.12[28,29]
ACY
ACE6.0 × 10−25.34 × 10⁻²[69]
FLU4.0 × 10−23.56 × 10−24.57 × 10−4[29,69]
PHE4.0 × 10−23.56 × 10⁻²[68]
ANT0.30.2670.34[29,69]
FLT4.0 × 10−23.56 × 10⁻²[29]
PYR3.0 × 10−22.67 × 10−23.4 × 10−2[29,69]
BaA1.21.350.39[28]
CHR0.120.1353.9 × 10−2[28]
BbF1.21.350.39[28]
BkF1.21.350.39[28]
BaP3.0 × 10−42.67 × 10−45.7 × 10−71.01.122.1[29]
DahA4.14.614.1[28]
BghiP3.0 × 10−22.67 × 10⁻²[68]
Subscripts indicate the entry paths of elements: ing—ingestion, derm—dermal contact, inh—inhalation. a  R f D d e r m = R f D i n g × A B S g i , where ABSgi is a fraction of contaminant absorbed in gastrointestinal tract: Cr 0.013, Mn 0.06, Ni 0.04, Cu 0.57, Zn, and Pb 0.1, As 0.95, Cd 0.025, and PAHs 0.89 [70]. b  R f D i n h = R f C   ( mg   m 3 ) × 20   ( m 3   day 1 ) 70   ( kg ) , where RfC is a reference concentration [59]. c  S F d e r m = S F i n g A B S g i , where ABSgi is a fraction of contaminant absorbed in gastrointestinal tract [70]. d  S F i n h = U R   ( m 3   μ g 1 ) × 70   ( kg ) 20   ( m 3 day 1 ) × 10 3   ( m g   μ g 1 ) , where UR is a risk per unit content of the substance [59].

3. Results and Discussion

3.1. PTE and PAH Levels in Soils

The descriptive statistics for 8 PTEs and 15 PAHs identified in topsoil throughout the study area and selected zones are provided in Table 6. The Kolmogorov–Smirnov test showed that none of the PTEs and PAHs distributions were normal (p < 0.05), so median values were used below to characterize the central trend. Median PTE concentrations (mg kg−1) increased in the following order: Cd < As < Pb < Cu < Ni < Zn < Cr < Mn. It is expedient to compare the PTE level in the soils of the study area with the global geochemical background, which was assessed by Kabata-Pendias [71]. The median contents of Cd, Cr, and Ni were higher (1.51–1.8 times) than the soil geochemical background, while the contents of other PTEs corresponded, on average, to the global background (higher by 1.04–1.48 times). Previously, it was shown that elevated levels of Cr and Ni were due to natural causes, namely the composition of soil-forming rocks. At the same time, Cd enters soils mainly from anthropogenic sources [3].
The total content of PAHs in soils ranged from 73 to 16,006 µg kg−1, with a median of 391 µg kg−1. The median contents of individual compounds increased in the following order: ANT < ACE < ACY < NAP < DBA < FLU < BkF < BaA < BaP < BbF < CHR < PYR < BghiP < FLT < PHE. The last four compounds in the series had the largest contribution among individual PAHs and accounted for approximately half of the total content. With regard to organic pollutants, data of the average content of PAHs in the grassland soils of the temperate zone [72] were used as a reference to determine the geochemical features of the studied topsoils. On average, the levels of FLU (by 7.5 times), PHE, ACY, NAP, BghiP, and PYR (by 1.5–2 times) were significantly increased in the topsoils of the Lower Don and the coast of the Taganrog Bay compared with the geochemical background. At the same time, ACE (by 3.7 times) and ANT (by 5.3 times) were lower compared with the global background.
In general, the PTE content of the soils of the territory varied less than the PAHs content (Table 6). Moderate variation (CV < 50%) was typical for Ni, Cu, Cr, and Mn; high (50–100%) for As, Pb, Zn, ACE, and PHE; very high (100–120%) for ACY, Cd, NAP, and FLU; and extremely high (>200%) for FLT, DBA, CHR, BkF, BaP, PYR, BbF, ANT, BaA, and BghiP. The extreme heterogeneity of the distribution of Cd and most PAHs, except for ACE and PHE, indicated a significant number of anthropogenic sources of pollutants and the dependence of the accumulation of these components on the physical–chemical properties (Table 1) and soil regime. The identification of PAH and PTE sources, as well as the relationship between the accumulation of pollutants and the main basic properties of soils, were discussed in detail in earlier studies [3,31].
The geochemical specialization of soils related to PTEs and PAHs differed depending on whether they belonged to one or another zone of the river–marine system (Table 6). On average, Cr, As, ANT, PYR, and CHR accumulated in the floodplain soils of the Lower Don. The Don Delta was characterized by elevated levels of all PAHs except for ANT, PYR, and CHR. In the floodplains of small rivers, the accumulation of all PTEs except for Cr, and As was noted.

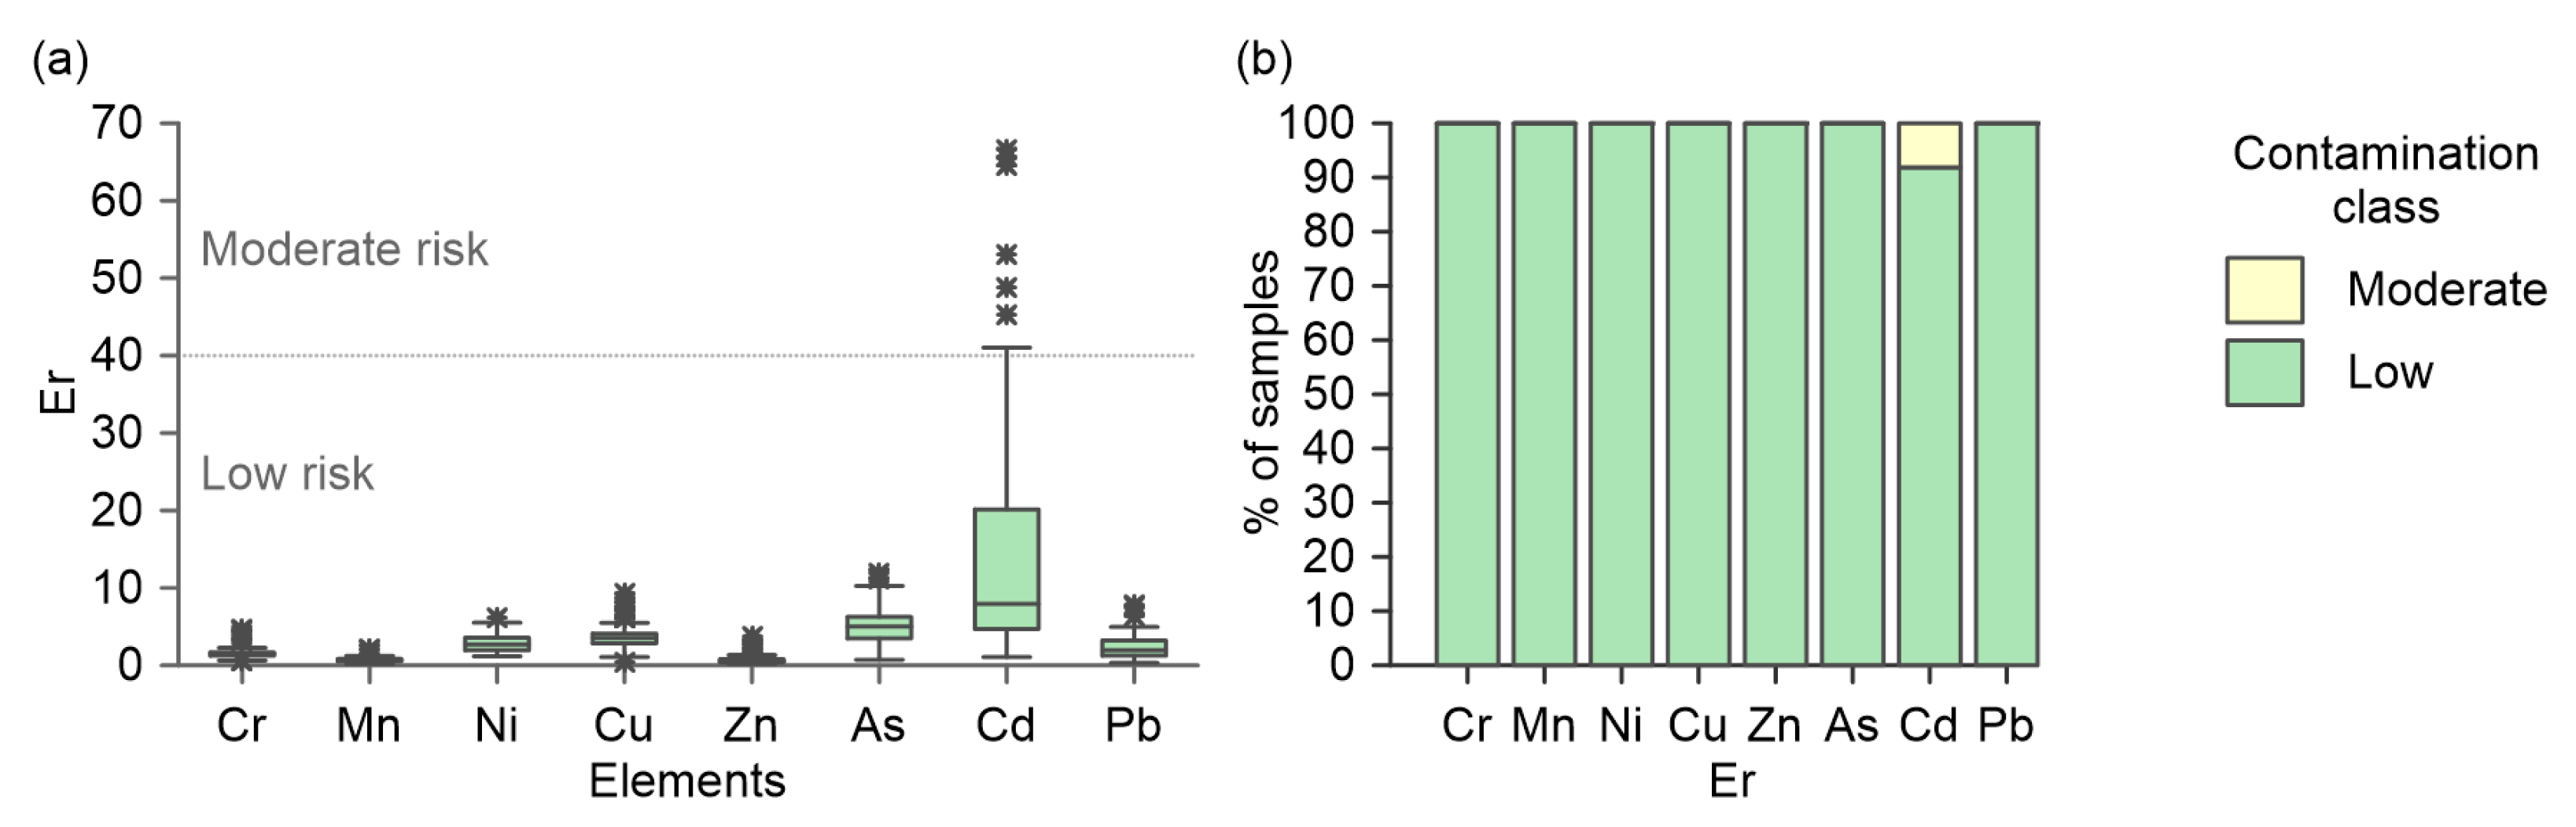
3.2. Ecological Risks of Soil Pollution by PTEs

Boxplots illustrating the Er values for PTEs in the topsoil of the study area are shown in Figure 2a. Elements in ascending order of median values of Er calculated in the topsoils of the entire study area are Zn (0.5), Mn (0.6), Cr (1.5), Pb (2.0), Ni (2.7), Cu (3.5), As (5.0), and Cd (7.9). Values of Er indicated a low ecological risk for most of the PTEs studied, except for Cd (Figure 2b). A low ecological risk of Cd was found in 91.9% of the samples. A moderate risk of Cd pollution was found in Don Delta’s soils and small rivers’ floodplains.
The values of RI ranged from 10.5 to 86.9, with a median of 26.8 that corresponded to low risk in all the studied soil samples. An area of increased integral ecological risk was found near the city of Azov within the Don Delta (Figure 3a). This is explained by the fact that in the soils of this zone, there is an intensive accumulation of pollutants, which are due to both river runoff and sea surges.
Thus, the results of the study showed that the level of PTEs in the floodplain and coastal soils of southern Russia, both individually and jointly, poses a low risk of negative environmental consequences for adjacent landscape components. Almost the entire study area is occupied by agricultural land, which implies a moderate anthropogenic load. Similar estimates of the integral ecological risk were obtained for agricultural soils around the rivers Beas and Sutlej, India [51], and the rivers Great and West Morava, Danube, Drina, Kolubara, and Sava, Serbia [46]. Other economic activities, especially mining within the river basin, were more significant in terms of pollution of floodplain soils and, as a consequence, higher ecological risks. For example, floodplain soils along the Le’an River, China [53], and the Ibar River, Serbia [47], which drain the mining areas, were generally at low to moderate risk, elevated by RI values.

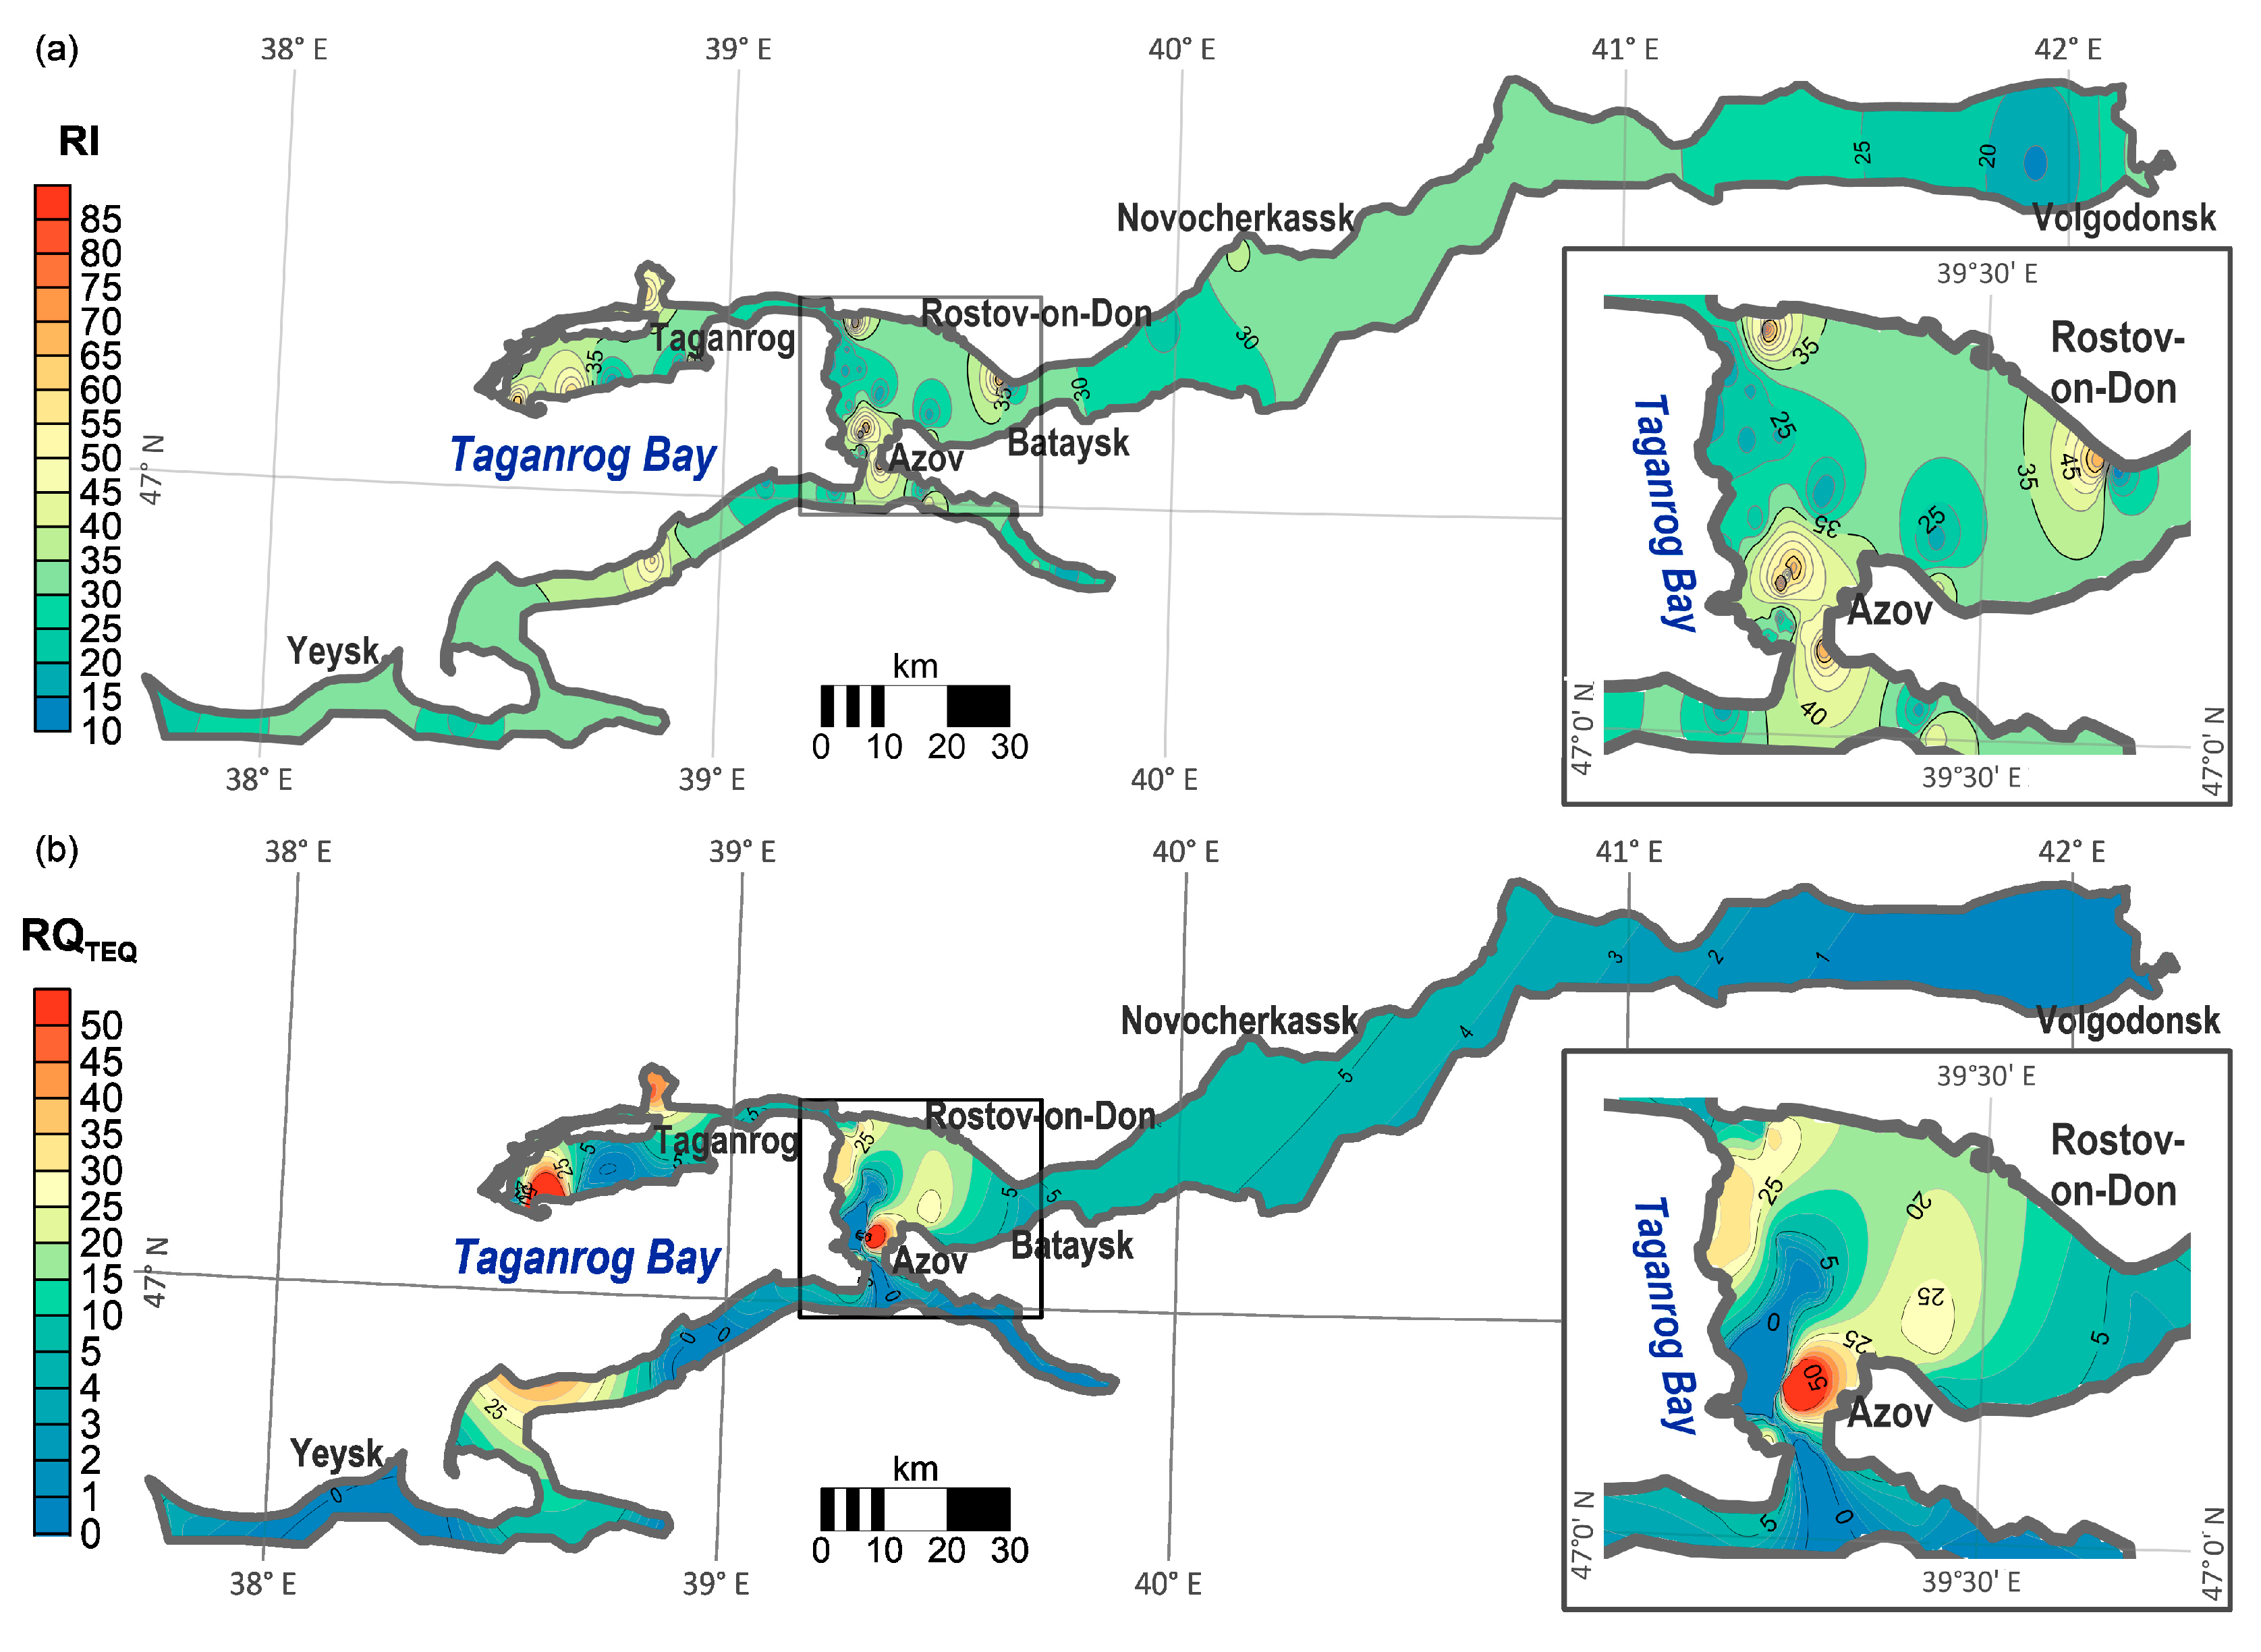
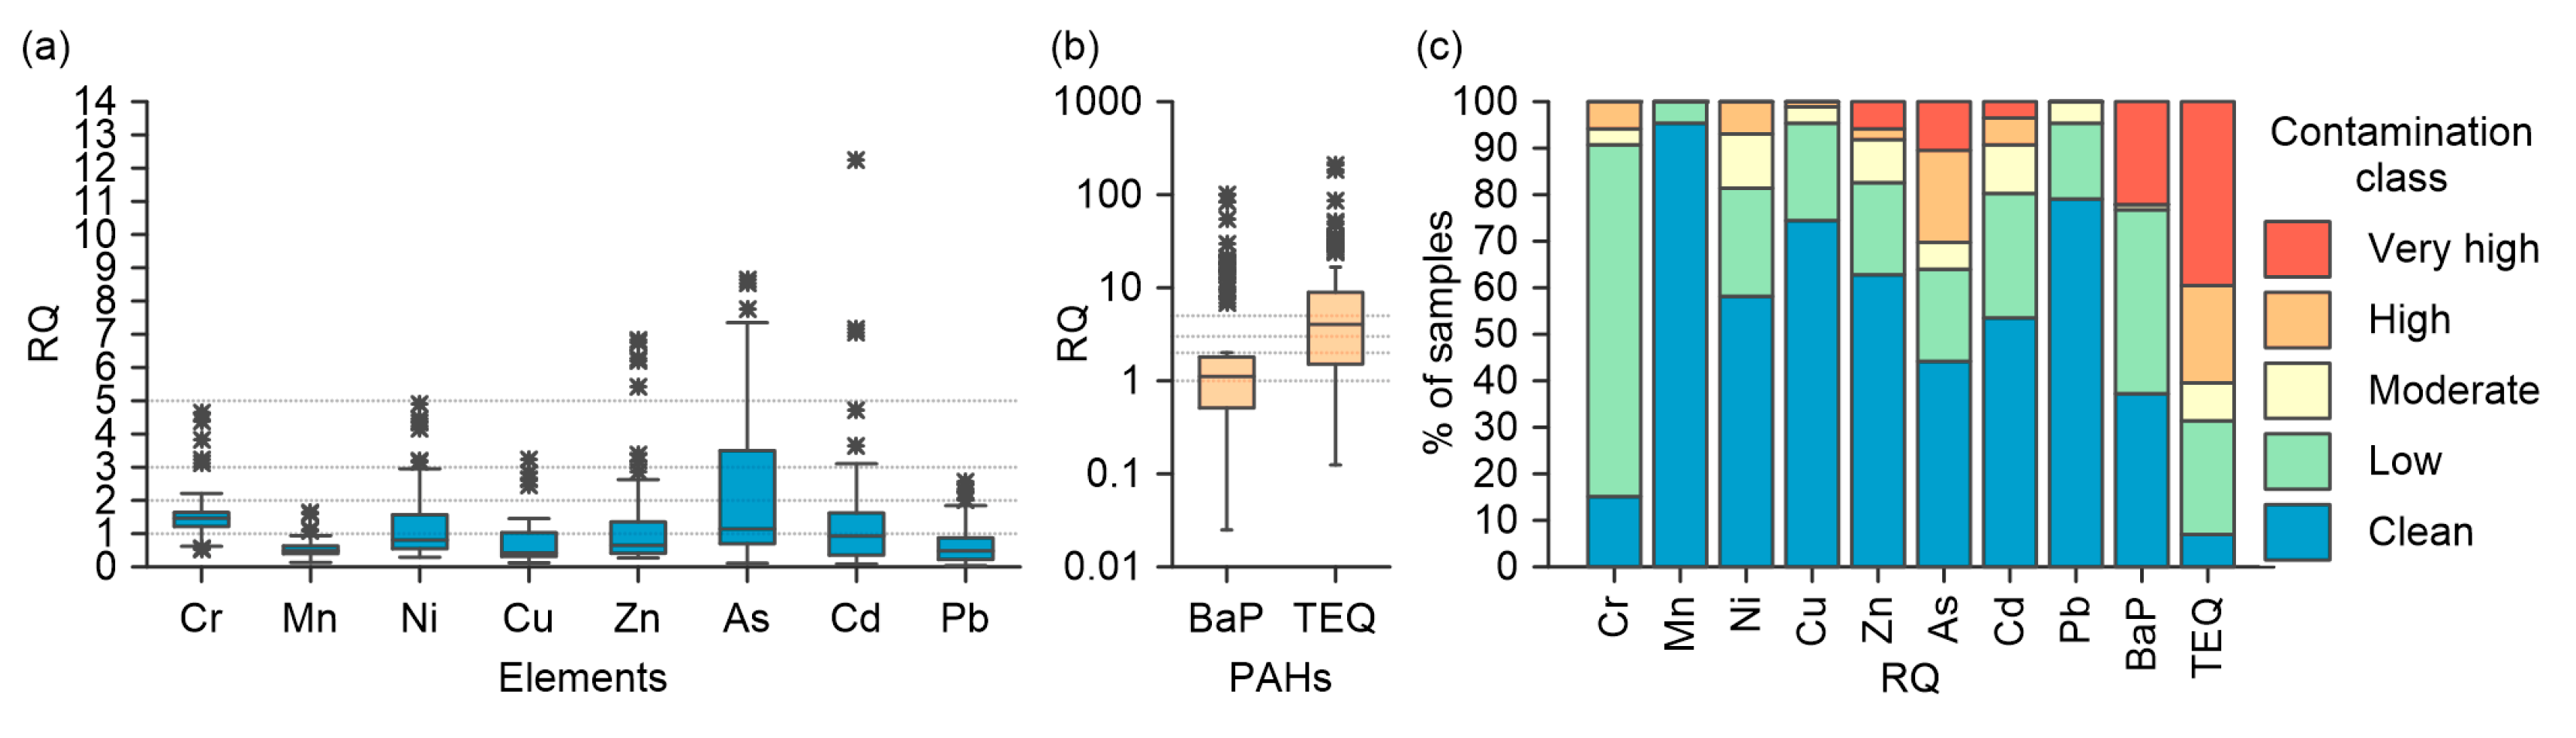
3.3. Ecological Hazard of Soil Contamination with PTEs and PAHs

The individual pollution with PTEs and BaP in soils was assessed by the degree of excess concentrations in the studied soils with MPCs and TACs. The following elements are listed according to ascending median RQ values: Cu (0.4), Pb, Mn (0.5), Zn (0.6), Ni (0.8), Cd (0.9), BaP (1.1), As (1.1), and Cr (1.5) (Figure 4a,b). Among all pollutants, Mn posed the least risk of soil pollution. Only 4.7% of the samples showed low contamination; the remaining 95.3% were uncontaminated (Figure 4c). The soils of the study area possessed low (16.3%) to moderate (4.7%) levels of Pb. Low to high contamination was noted for Cu, Ni, and Cr (for 25.6%, 41.9%, and 84.5% of the samples, respectively). The most dangerous pollutants were Zn, As, Cd, and BaP, the contents of which in individual samples exceeded TAC by 6.8, 8.7, 12.2, and 100.7 times, respectively (Figure 4a,b). Sandy soils, for which more stringent TACs have been established [57], are more sensitive to contamination with these elements than soils with a heavier texture. Accordingly, the highest RQ values were characteristic of soils with a light texture, especially in the impact zones of local anthropogenic sources. High and very high soil contamination was noted in 8.1% of the samples for Zn, 9.3% for Cd, 22.1% for BaP, and 30.2% for As (Figure 4c).
The following substances are listed by ascending median RQ values: Cu (0.4), Pb, Mn (0.5), Zn (0.6), Ni (0.8), Cd (0.9), BaP (1.1), As (1.1), and Cr (1.5) (Figure 4a,b).
The total soil contamination with PAHs (including BaP) was estimated by comparing the TEQ of a mixture of compounds with the MPC for BaP. Values of RQTEQ ranged from 0.1 to 208.6, with a median of 4.0 in the soils of the study area (Figure 4b). Most of the studied samples were characterized by a fairly high level of total PAH contamination: 24.4% of soils were classified as slightly polluted, 8.1% as moderately polluted, 20.9% as heavily polluted, and 39.5% as very heavily polluted. Only 7.0% of soil samples from Lower Don and the coast of Taganrog Bay were not contaminated with PAHs (Figure 4c). An increase in soil PAHs was observed near large cities (Figure 3b). It should be noted that in Russia, compared with the EU countries, one of the most stringent MACs for BaP has been set [73]—tens or even hundreds of times lower, depending on the method for determining toxicity. Therefore, the total soil PAHs estimated in the study area are likely much too high.
Thus, the ecological assessment of soil pollution showed that the mixture of PAHs in the soils of the Lower Don and Taganrog Bay coasts poses a higher hazard compared with individual PTEs. However, at the same time, the behavior and fate of elements in soils are determined by a more complex set of conditions: sources of input, which can be predominantly natural (for example, high content in soil-forming rocks) or physical–chemical properties of soils (elements are known to exhibit different mobility under different conditions); therefore, it is more difficult to assess the ecological hazards of the combined impact of PTEs.

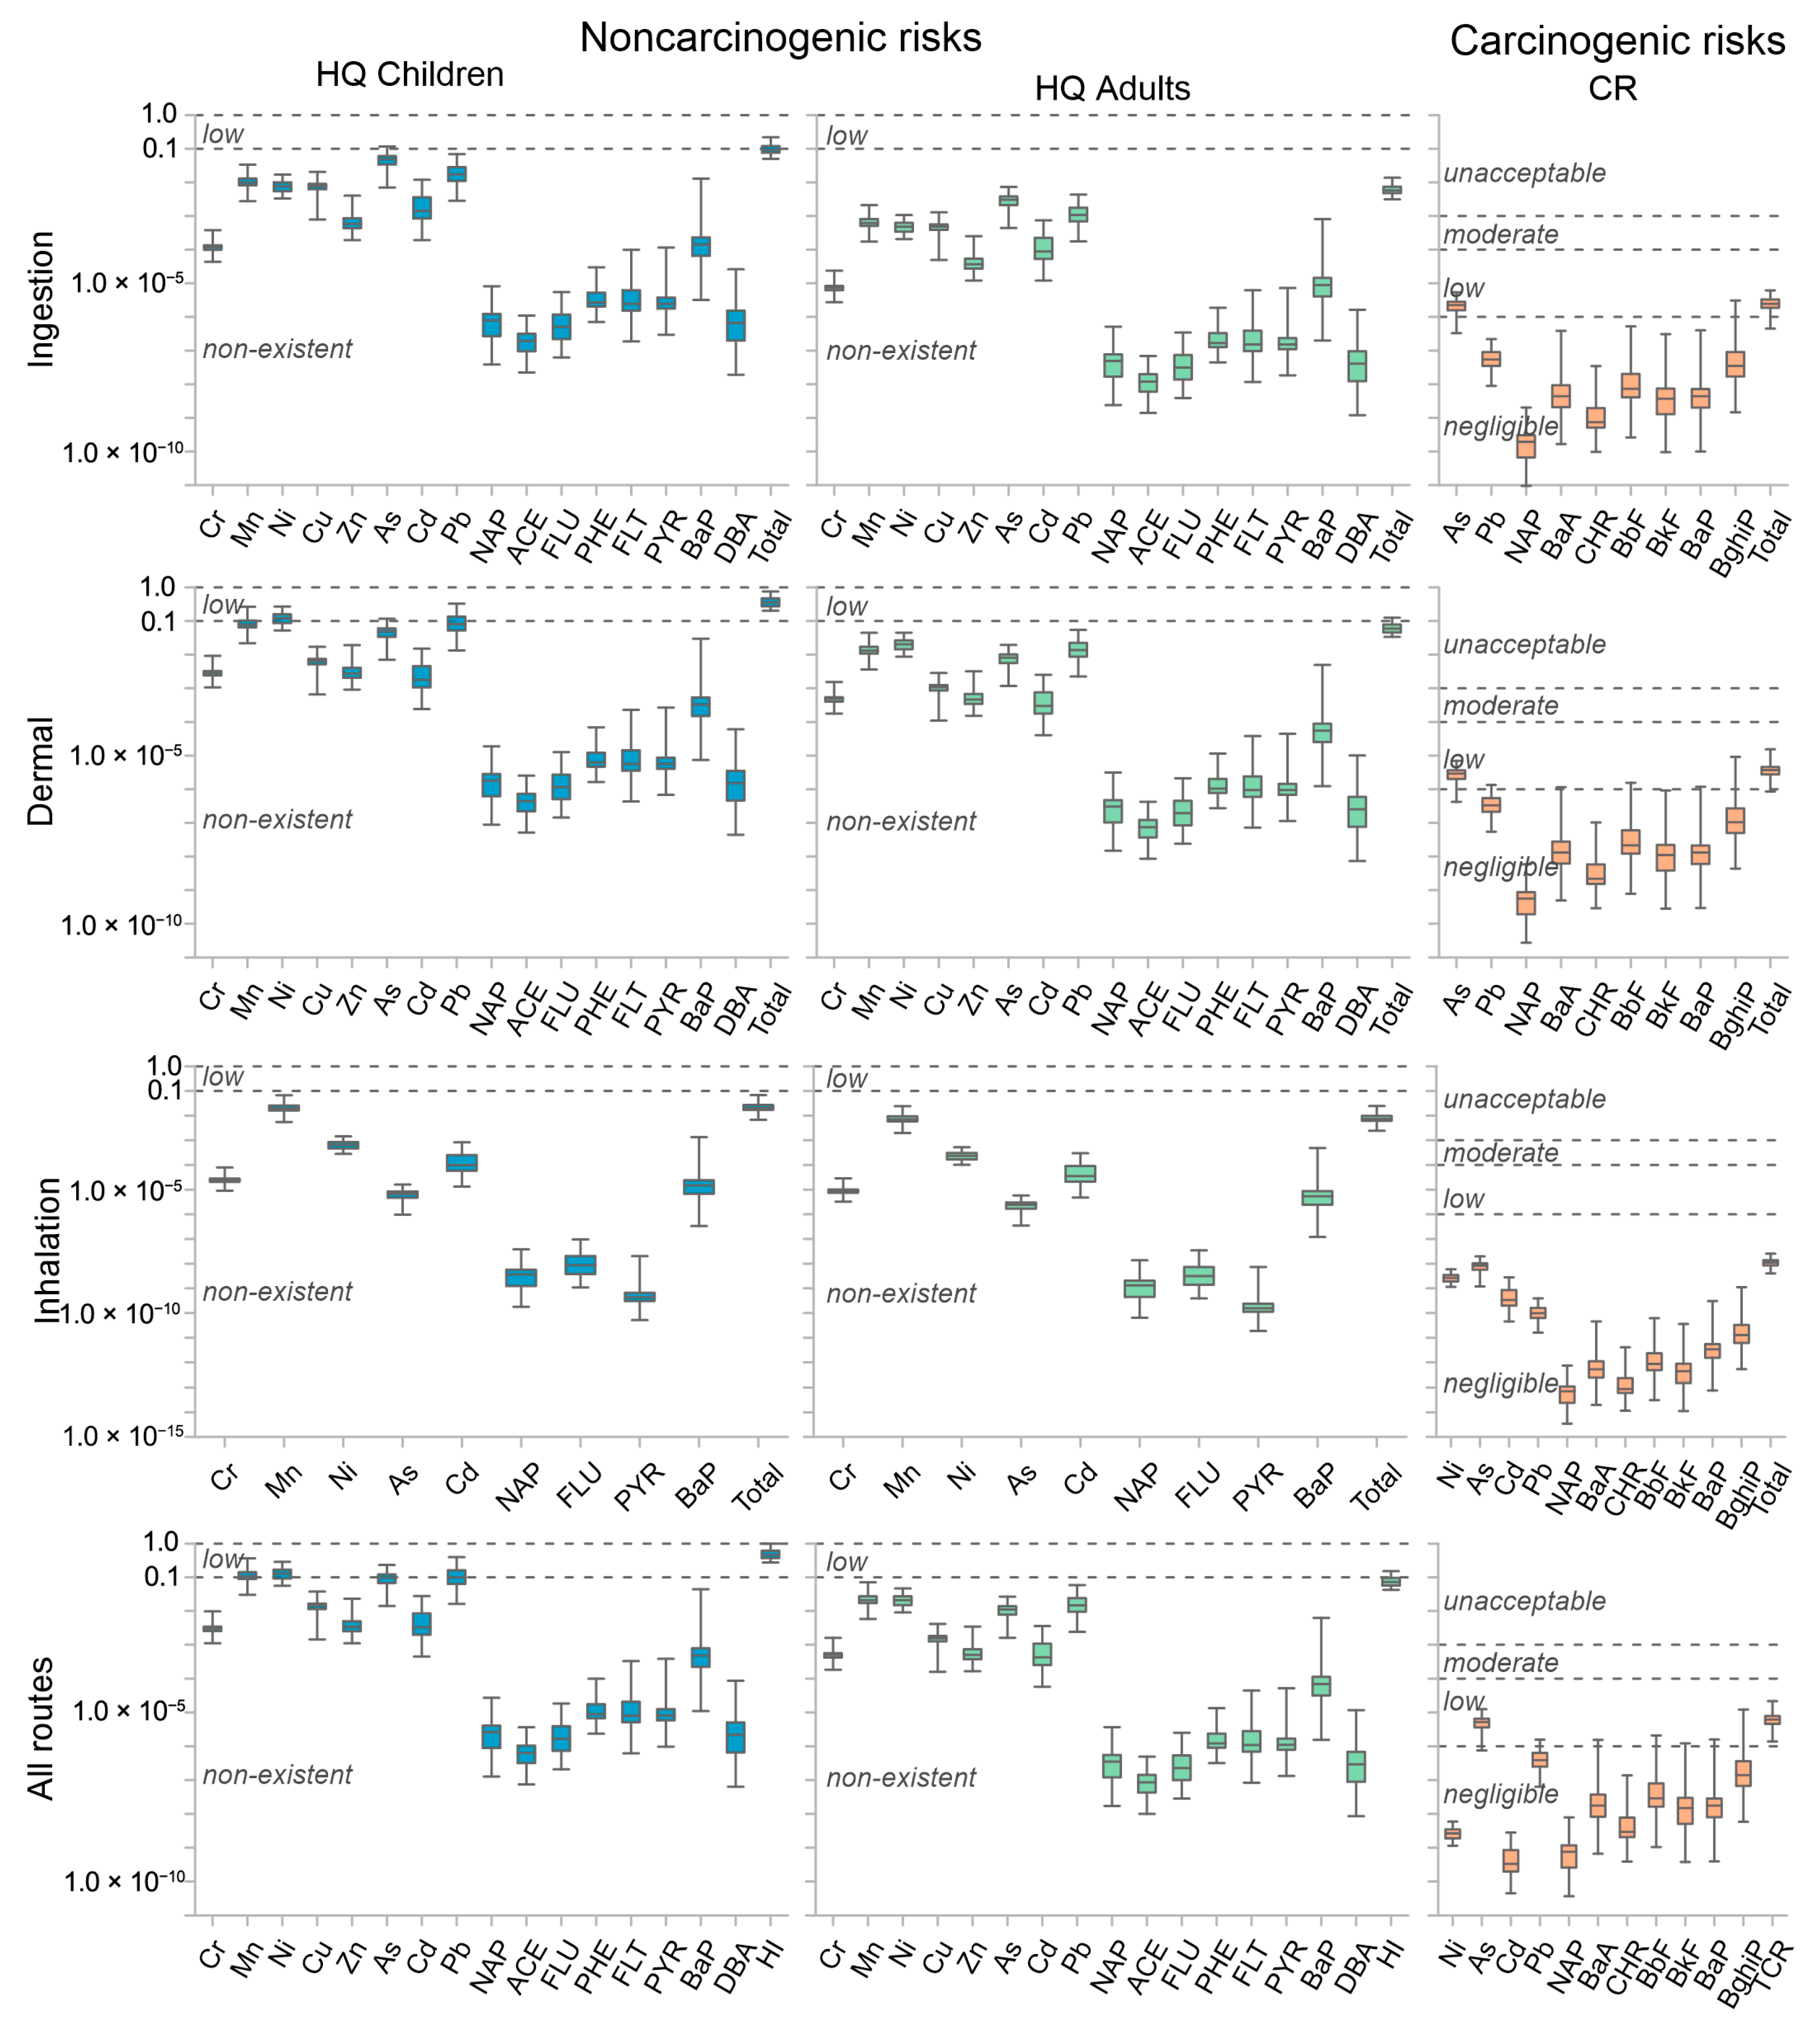
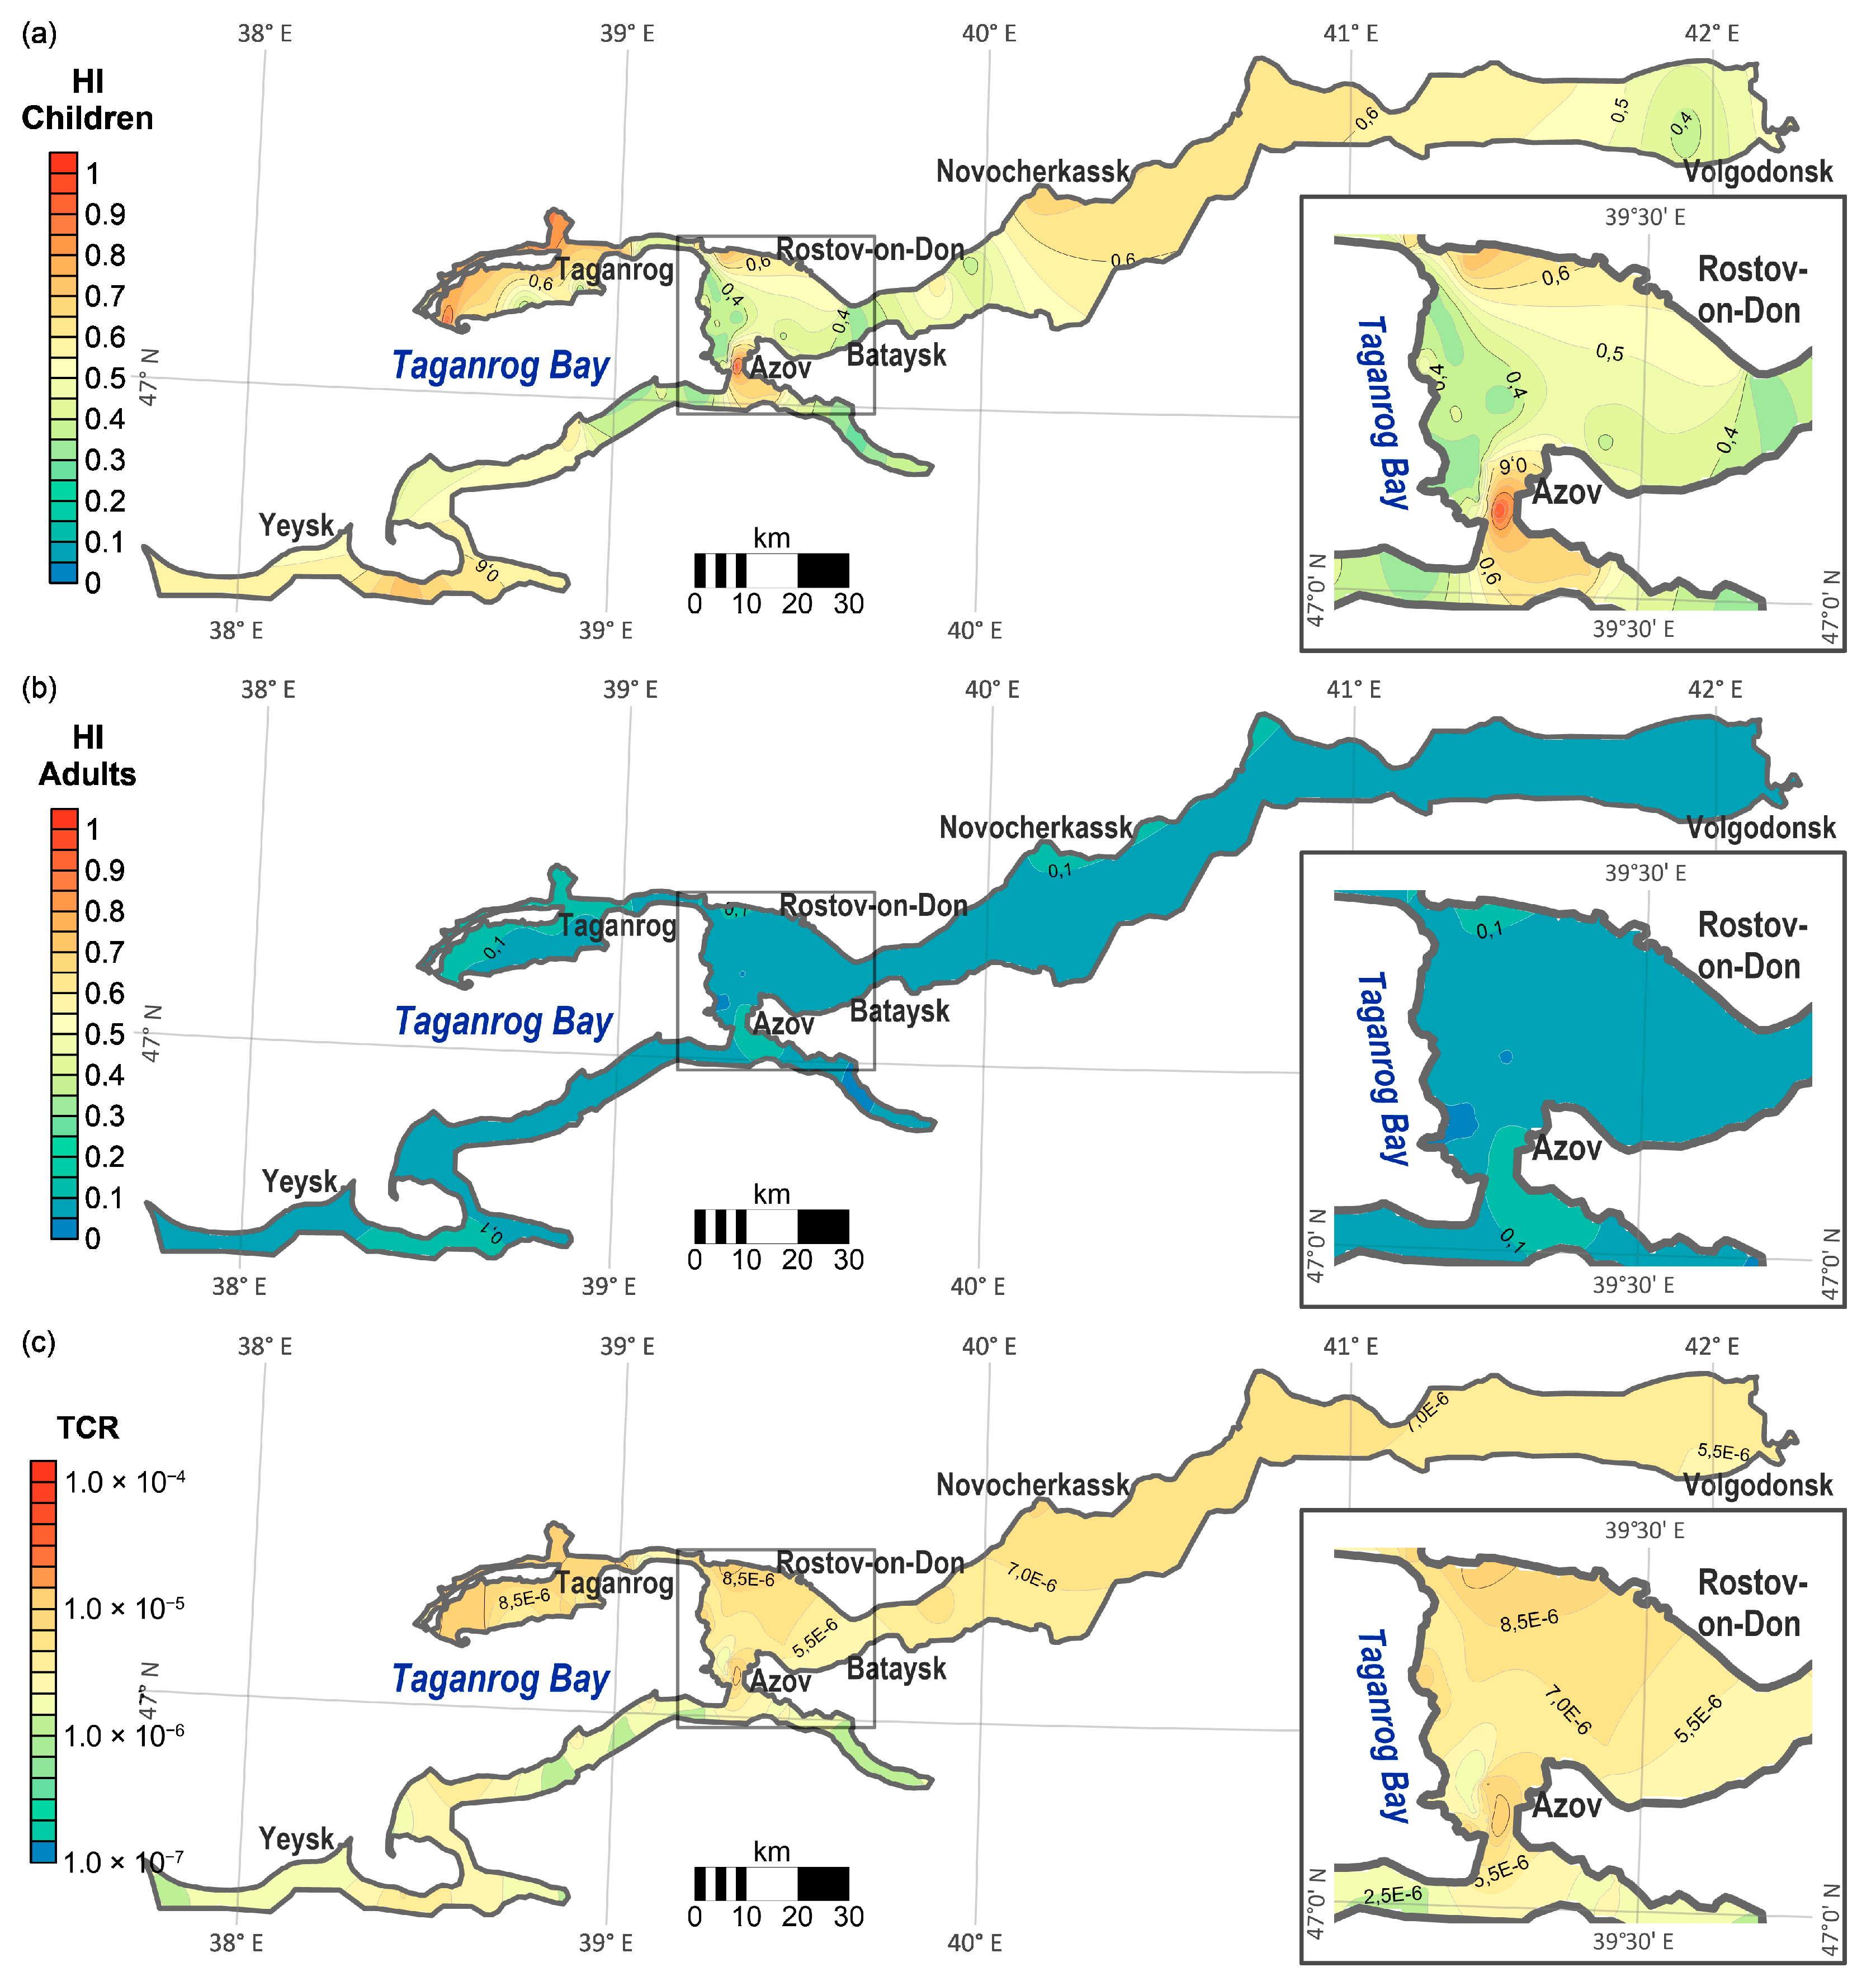
3.4. Human Health Risks of Combined Soil Pollution

All studied PTEs cause long-term toxic effects, as do most priority PAHs except for ACY, BaA, CHR, BbF, BkF, and BghiP (Figure 5). Descriptive statistics on the HQ for children and adults are presented in Table A1. By increasing the median HQ values and taking into account all routes of intake, regardless of the age of recipients, pollutants formed a series: ANT < ACE < FLU < DBA < NAP < FLT < PYR < PHE < BaP < Cr ≈ Cd < Zn < Cu < As < Pb < Mn < Ni. Significant health risks for children were Mn, Ni, As, and Pb, which, on average, corresponded to a low level (0.1 < HQ < 1.0). Concerning adult health, exposure to none of the PTEs or PAHs alone poses a significant hazard. The greatest risks of exposure to non-carcinogenic soil-borne elements are characteristic of the transdermal route, lessened by ingestion, and insignificant due to inhalation of soil particles, both for individual elements and in combination for all age groups. HQ values for children via ingestion varied within 0.05–0.22, transdermal intake was 0.2–0.76, and inhalation was 0.01–0.07. In adults, significant low risks of non-carcinogenic pollutants exposure appeared only with transdermal intake in 7.0% of the studied samples.
The cumulative risk of non-carcinogenic exposure to pollutants entering the human body along with the soil was higher for children than for adults (Figure 5). The overall risk of non-carcinogenic effects (HI) of all PTEs and PAHs for children’s health ranged from 0.28 to 1.0 (median: 0.47). A low general toxic risk of non-carcinogenic effects on children was manifested in most samples (98.8%), and only 1.2% showed a moderate risk. In the case of adults, the overall risk of exposure to pollutants varied from 0.04 to 0.15 (median: 0.07). Insignificant adult risk was negligible for most samples (79.1%). In the remaining 20.9%, there was a low risk. Generally, areas of high risk for all age groups were confined to large cities (Figure 6a,b).
Carcinogenic risks were due to exposure to only some of the studied pollutants from the soil (Table A2). By increasing the median values of CR, taking into account all pathways, the pollutants form a series: Cd < NAP < Ni < CHR < BkF < BaA < BaP < BbF < BghiP < Pb < As. The substance with the greatest risk of carcinogenic effects was As, whose CR values exceeded the threshold of 1 × 10⁻⁶ in 97.7% of samples, corresponding to low risk. In most samples, exposure to the remaining elements and compounds alone did not cause significant carcinogenic risk (Figure 5). The risks of carcinogenic effects from absorption and the transdermal route were generally comparable (median CR values are 2.5 × 10⁻⁶ and 3.7 × 10⁻⁶). However, the risks for inhalation intake were several orders of magnitude lower (1.1 × 10⁻⁸). The overall carcinogenic risk ranged from 1.4 × 10⁻⁶ to 2.5 × 10⁻⁵, with a median of 6.2 × 10⁻⁶. In all of the samples studied, the overall carcinogenic risk was low. The spatial distribution pattern of the TCR (Figure 6c) was similar to the results obtained for total non-carcinogenic risks for both age groups.
The human health risk assessment showed that As was the element of greatest general toxic and carcinogenic risk to the public in the study area, since the HI and CR values of this PTE exceeded the acceptable risk level in most of the studied soils. Arsenic was considered to be one of the most significant risks to humans. Long-term exposure to inorganic As leads to increased risks of cancer in the skin, lungs, and genitourinary system as well as chronic effects, such as hyperkeratosis, cardiac and neurological diseases, and diabetes [29]. Therefore, additional studies should be conducted on the areas with high levels of this element and its potential health risk to the specific population of the Lower Don floodplain and coastal regions of the Sea of Azov.

4. Conclusions

The results of the present study showed that urbanization is the main factor in soil pollution and a source of risks within the studied coastal and riverine landscapes. The hotspots of both PAHs and PTEs in soils and the associated ecological and human health risks are strongly related to densely populated areas near the industrial and transport centers of Rostov-on-Don, Taganrog, and Azov, with much less attention given to the geomorphological and fluvial features of the riverine and coastal landscapes. PTE levels in southern Russian coastal and riverine soils were slightly higher than the global geochemical background. Nevertheless, the degree of soil pollution by PTEs is characterized by a low ecological risk, according to individual and integral assessments. General toxic and carcinogenic risks are of greatest importance due to the potential adverse effects of As, and, to a lesser extent, Pb. It is important to note that children are at greater risk of non-carcinogenic effects from PTE exposure than are adults. Analysis of the spatial distribution of non-carcinogenic and carcinogenic risks showed that most of the study area is characterized by low risk. It should be noted that hot spots of high soil pollution, which result in significant environmental and human health risks, are confined to suburban areas. In this regard, further monitoring of the level of PAHs and PTEs in the soils of these territories is necessary due to increasing urbanization, and constant monitoring of potential anthropogenic sources of pollutants is required.

Author Contributions

Conceptualization, E.K.; methodology, E.K., D.N. and T.B.; validation, S.M., D.N. and V.D.R.; formal analysis, E.K.; investigation, D.N., T.B., I.Z. and S.S.; resources, T.M. and S.M.; data curation, T.B., I.Z. and S.S.; writing—original draft preparation, E.K., S.M. and S.S.; writing—review and editing, T.M., V.D.R., M.L. and M.H.W.; visualization, E.K.; supervision, T.M.; project administration, S.M.; funding acquisition, E.K., T.M. and M.L. All authors have read and agreed to the published version of the manuscript.

Funding

The analytical work was financially supported by the Russian Geographical Society (no. 09/2021-I) and the Grant of the President of the Russian Federation (no. MK-4654.2022.1.5). Analysis and interpretation of data were carried out in the laboratory “Soil Health” of the Southern Federal University with the financial support of the Ministry of Science and Higher Education of the Russian Federation, agreement no. 075-15-2022-1122.

Data Availability Statement

The data presented in this study are available on request from the corresponding author. The data are not publicly available due to the fact that the raw/processed data needed to reproduce these results are currently also part of an ongoing study.

Conflicts of Interest

The authors declare no conflict of interest. The funders had no role in the design of the study; in the collection, analyses, or interpretation of data; in the writing of the manuscript; or in the decision to publish the results.

Appendix A

Table A1. Hazard quotient (HQ) for adults and children attributed to the PTEs in topsoils of the Lower Don and the Taganrog Bay coast (n = 86).
Parameter *HQ ChildrenHQ Adults
IngestionDermalInhalationAll RoutesIngestionDermalInhalationAll Routes
Cr1.2 × 10−42.9 × 10−32.5 × 10−53.1 × 10−37.5 × 10−64.9 × 10−49.0 × 10−65.0 × 10⁻⁴
4.4 × 10⁻⁵–3.8 × 10−41.1 × 10−3–9.2 × 10−39.1 × 10−6–7.9 × 10−51.1 × 10−3–9.7 × 10−32.7 × 10−6–2.4 × 10−51.8 × 10−4–1.5 × 10−33.3 × 10−6–2.9 × 10−51.8 × 10−4–1.6 × 10⁻³
Mn9.9 × 10−37.8 × 10−22.0 × 10−21.1 × 10−16.2 × 10−41.3 × 10−27.1 × 10−32.1 × 10⁻²
2.8 × 10⁻³–3.4 × 10−22.2 × 10−2–2.7 × 10−15.5 × 10−3–6.7 × 10−23.0 × 10−2–3.7 × 10−11.7 × 10−4–2.1 × 10−33.7 × 10−3–4.5 × 10−22.0 × 10−3–2.4 × 10−25.8 × 10−3–7.1 × 10⁻²
Ni7.7 × 10−31.2 × 10−16.5 × 10−41.3 × 10−14.8 × 10−42.0 × 10−22.3 × 10−42.1 × 10⁻²
3.3 × 10⁻³–1.7 × 10−25.2 × 10−2 –2.7 × 10−12.8 × 10−4–1.5 × 10−35.6 × 10−2–2.9 × 10−12.1 × 10−4–1.1 × 10−38.7 × 10−3–4.5 × 10−21.0 × 10−4–5.2 × 10−49.1 × 10−3–4.7 × 10⁻²
Cu7.7 × 10−36.4 × 10−31.4 × 10−24.8 × 10−41.1 × 10−31.6 × 10⁻³
7.9 × 10⁻⁴–2.1 × 10−26.5 × 10−4–1.7 × 10−21.4 × 10−3–3.8 × 10−24.9 × 10−5–1.3 × 10−31.1 × 10−4–2.8 × 10−31.6 × 10−4–4.1 × 10⁻³
Zn5.9 × 10−42.8 × 10−33.4 × 10−33.7 × 10−54.7 × 10−45.0 × 10⁻⁴
1.9 × 10⁻⁴–4.0 × 10−39.2 × 10−4–1.9 × 10−21.1 × 10−3–2.3 × 10−21.2 × 10−5–2.5 × 10−41.5 × 10−4–3.2 × 10−31.6 × 10−4–3.4 × 10⁻³
As4.9 × 10−24.9 × 10−26.7 × 10−69.7 × 10−23.0 × 10−38.1 × 10−32.4 × 10−61.1 × 10⁻²
7.0 × 10⁻³–1.2 × 10−17.0 × 10−3–1.2 × 10−19.8 × 10−7–1.6 × 10−51.4 × 10−2–2.3 × 10−14.4 × 10−4–7.3 × 10−31.2 × 10−3–1.9 × 10−23.5 × 10−7–5.8 × 10−61.6 × 10−3–2.7 × 10⁻²
Cd1.4 × 10−31.8 × 10−39.9 × 10−53.3 × 10−38.9 × 10−53.0 × 10−43.6 × 10−54.2 × 10⁻⁴
1.9 × 10⁻⁴–1.2 × 10−22.4 × 10−4–1.5 × 10−21.3 × 10−5–8.3 × 10−44.5 × 10−4–2.8 × 10−21.2 × 10−5–7.4 × 10−44.0 × 10−5–2.5 × 10−34.8 × 10−6–3.0 × 10−45.7 × 10−5–3.6 × 10⁻³
Pb1.7 × 10−28.2 × 10−29.9 × 10−21.1 × 10−31.4 × 10−21.5 × 10⁻²
2.8 × 10⁻³–6.9 × 10−21.3 × 10−2–3.3 × 10−11.6 × 10−2–4.0 × 10−11.8 × 10−4–4.3 × 10−32.2 × 10−3–5.5 × 10−22.4 × 10−3–5.9 × 10⁻²
NAP7.9 × 10−71.8 × 10−63.6 × 10−92.6 × 10−64.9 × 10−83.0 × 10−71.3 × 10−93.5 × 10⁻⁷
3.8 × 10⁻⁸–8.2 × 10−68.9 × 10−8–1.9 × 10−51.8 × 10−10–3.8 × 10−81.3 × 10−7–2.7 × 10−52.4 × 10−9–5.1 × 10−71.5 × 10−8–3.2 × 10−66.4 × 10−11–1.4 × 10−81.7 × 10−8–3.7 × 10⁻⁶
ACE1.9 × 10−74.4 × 10−76.3 × 10−71.2 × 10−87.4 × 10−88.6 × 10⁻⁸
2.2 × 10⁻⁸–1.1 × 10−65.2 × 10−8–2.5 × 10−67.4 × 10−8–3.6 × 10−61.4 × 10−9–6.9 × 10−88.6 × 10−9–4.2 × 10−71.0 × 10−8–4.9 × 10⁻⁷
FLU5.0 × 10−71.2 × 10−68.7 × 10−91.7 × 10−63.1 × 10−81.9 × 10−73.1 × 10−92.3 × 10⁻⁷
6.2 × 10⁻⁸–5.5 × 10−61.4 × 10−7–1.3 × 10−51.1 × 10−9–9.6 × 10−82.1 × 10−7–1.8 × 10−53.9 × 10−9–3.4 × 10−72.4 × 10−8–2.1 × 10−63.9 × 10−10–3.5 × 10−82.8 × 10−8–2.5 × 10⁻⁶
PHE2.7 × 10−66.2 × 10−68.9 × 10−61.7 × 10−71.0 × 10−61.2 × 10⁻⁶
7.1 × 10⁻⁷–3.0 × 10−51.6 × 10−6–6.9 × 10−52.3 × 10−6–9.9 × 10−54.4 × 10−8–1.9 × 10−62.7 × 10−7–1.2 × 10−53.2 × 10−7–1.3 × 10⁻⁵
ANT1.9 × 10−94.4 × 10−93.4 × 10−136.3 × 10−91.2 × 10−107.4 × 10−101.2 × 10−138.6 × 10⁻¹⁰
0.0 × 10⁻¹–1.3 × 10−70.0 × 10−1–3.1 × 10−70.0 × 10−1–2.4 × 10−110.0 × 10⁻¹–4.4 × 10−70.0 × 10−1–8.4 × 10−90.0 × 10−1–5.2 × 10−80.0 × 10−1–8.5 × 10−120.0 × 10⁻¹–6.0 × 10⁻⁸
FLT2.4 × 10−65.6 × 10−68.1 × 10−61.5 × 10−79.4 × 10−71.1 × 10⁻⁶
1.9 × 10⁻⁷–9.9 × 10−54.3 × 10−7–2.3 × 10−46.2 × 10−7–3.3 × 10−41.2 × 10−8–6.2 × 10−67.2 × 10−8–3.8 × 10−58.4 × 10−8–4.4 × 10⁻⁵
PYR2.4 × 10−65.6 × 10−64.3 × 10−108.1 × 10−61.5 × 10−79.4 × 10−71.5 × 10−101.1 × 10⁻⁶
2.9 × 10⁻⁷–1.2 × 10−46.8 × 10−7–2.7 × 10−45.2 × 10−11–2.0 × 10−89.7 × 10−7–3.8 × 10−41.8 × 10−8–7.2 × 10−61.1 × 10−7–4.5 × 10−51.9 × 10−11–7.3 × 10−91.3 × 10−7–5.2 × 10⁻⁵
BaP1.4 × 10−43.3 × 10−41.5 × 10−54.9 × 10−48.9 × 10−65.5 × 10−55.4 × 10−66.9 × 10⁻⁵
3.2 × 10⁻⁶–1.3 × 10−27.4 × 10−6–3.0 × 10−23.3 × 10−7–1.3 × 10−31.1 × 10−5–4.4 × 10−22.0 × 10−7–8.0 × 10−41.2 × 10−6–5.0 × 10−31.2 × 10−7–4.9 × 10−41.6 × 10−6–6.3 × 10⁻³
DBA6.6 × 10−71.5 × 10−62.2 × 10−64.1 × 10−82.5 × 10−72.9 × 10⁻⁷
1.9 × 10⁻⁸–2.6 × 10−54.4 × 10−8–6.0 × 10−56.3 × 10−8–8.6 × 10−51.2 × 10−9–1.6 × 10−67.4 × 10−9–1.0 × 10−58.6 × 10−9–1.2 × 10⁻⁵
* Median is above the line; range is below the line.
Table A2. Cancer risks (CR) attributed to the PTEs in topsoils of the Lower Don and the Taganrog Bay coast (n = 86).
Parameter *IngestionDermalInhalationAll Routes
MedMinMaxMedMinMaxMedMinMaxMedMinMax
Ni2.7 × 10−91.1 × 10−95.9 × 10−92.7 × 10−91.1 × 10−95.9 × 10⁻⁹
As2.3 × 10−63.3 × 10−75.4 × 10−62.9 × 10−64.2 × 10−77.0 × 10−68.2 × 10−91.2 × 10−92.0 × 10−85.2 × 10−67.5 × 10−71.2 × 10⁻⁵
Cd3.4 × 10−104.5 × 10−112.8 × 10−93.4 × 10−104.5 × 10−112.8 × 10⁻⁹
Pb5.5 × 10−88.9 × 10−92.2 × 10−73.3 × 10−75.5 × 10−81.3 × 10−69.8 × 10−111.6 × 10−113.9 × 10−103.9 × 10−76.4 × 10−81.6 × 10⁻⁶
NAP2.0 × 10−109.5 × 10−122.0 × 10−95.6 × 10−102.7 × 10−115.8 × 10−97.1 × 10−143.5 × 10−157.4 × 10−137.6 × 10−103.7 × 10−117.9 × 10⁻⁹
BaA4.4 × 10−91.7 × 10−103.9 × 10−71.3 × 10−85.0 × 10−101.2 × 10−65.2 × 10−132.0 × 10−144.5 × 10−111.8 × 10−86.6 × 10−101.5 × 10⁻⁶
CHR7.4 × 10−109.8 × 10−113.5 × 10−82.2 × 10−92.9 × 10−101.0 × 10−78.7 × 10−141.1 × 10−144.1 × 10−122.9 × 10−93.9 × 10−101.4 × 10⁻⁷
BbF7.3 × 10−92.6 × 10−105.2 × 10−72.2 × 10−87.8 × 10−101.6 × 10−68.5 × 10−133.1 × 10−146.1 × 10−112.9 × 10−81.0 × 10−92.1 × 10⁻⁶
BkF3.7 × 10−99.5 × 10−113.1 × 10−71.1 × 10−82.8 × 10−109.2 × 10−74.4 × 10−131.1 × 10−143.6 × 10−111.5 × 10−83.8 × 10−101.2 × 10⁻⁶
BaP4.4 × 10−99.9 × 10−114.0 × 10−71.3 × 10−82.9 × 10−101.2 × 10−63.4 × 10−127.6 × 10−143.0 × 10−101.8 × 10−83.9 × 10−101.6 × 10⁻⁶
BghiP3.5 × 10−81.5 × 10−93.1 × 10−61.0 × 10−74.4 × 10−99.1 × 10−61.3 × 10−115.3 × 10−131.1 × 10−91.4 × 10−75.8 × 10−91.2 × 10−5
* Med: median, Min: minimum, and Max: maximum.

References

  1. Strokov, A.S.; Potashnikov, V.Y. Environmental tradeoffs of agricultural growth in Russian regions and possible sustainable pathways for 2030. Russ. J. Econ. 2022, 8, 60–80. [Google Scholar] [CrossRef]
  2. Ketova, N.P.; Kolesnikov, Y.S.; Ovchinnikov, V.N. Economy of southern Russia: Features of functioning and prospects of development. Stud. Russ. Econ. Dev. 2015, 26, 388–393. (In Russian) [Google Scholar] [CrossRef]
  3. Konstantinova, E.; Minkina, T.; Nevidomskaya, D.; Mandzhieva, S.; Bauer, T.; Zamulina, I.; Voloshina, M.; Lobzenko, I.; Maksimov, A.; Sushkova, S. Potentially toxic elements in surface soils of the Lower Don floodplain and the Taganrog Bay coast: Sources, spatial distribution and pollution assessment. Environ. Geochem. Health 2021, 45, 99–105. [Google Scholar] [CrossRef]
  4. Matishov, G.G.; Ivlieva, O.V.; Bespalova, L.A.; Kropyanko, L.V. Ecological and geographical analysis of the sea coast of the Rostov region. Dokl. Earth. Sci. 2015, 460, 53–57. [Google Scholar] [CrossRef]
  5. Minkina, T.M.; Fedorov, Y.A.; Nevidomskaya, D.G.; Polshina, T.N.; Mandzhieva, S.S.; Chaplygin, V.A. Heavy metals in soils and plants of the Don River estuary and the Taganrog Bay coast. Eurasian Soil Sci. 2017, 50, 1033–1047. [Google Scholar] [CrossRef]
  6. Minkina, T.; Fedorenko, G.; Nevidomskaya, D.; Konstantinova, E.; Pol’shina, T.; Fedorenko, A.; Chaplygin, V.; Mandzhieva, S.; Dudnikova, T.; Hassan, T. The Morphological and functional organization of cattails Typha laxmannii Lepech. and Typha australis Schum. and Thonn. under soil pollution by potentially toxic elements. Water 2021, 13, 227. [Google Scholar] [CrossRef]
  7. El Hourani, M.; Broll, G. Soil protection in floodplains—A Review. Land 2021, 10, 149. [Google Scholar] [CrossRef]
  8. Khromykh, V.V.; Khromykh, V.S.; Khromykh, O.V. Features of soils in the floodplain landscapes of Siberian Rivers. IOP Conf. Ser. Earth. Environ. Sci. 2018, 201, 012007. [Google Scholar] [CrossRef]
  9. Wang, X.; Sun, Y.; Li, S.; Wang, H. Spatial distribution and ecological risk assessment of heavy metals in soil from the Raoyanghe Wetland, China. PLoS ONE 2019, 14, e0220409. [Google Scholar] [CrossRef] [Green Version]
  10. Chalov, S.; Thorslund, J.; Kasimov, N.; Aybullatov, D.; Ilyicheva, E.; Karthe, D.; Kositsky, A.; Lychagin, M.; Nittrouer, J.; Pavlov, M.; et al. The Selenga River delta: A geochemical barrier protecting Lake Baikal waters. Reg. Environ. Chang. 2017, 17, 2039–2053. [Google Scholar] [CrossRef]
  11. Skála, J.; Vácha, R.; Hofman, J.; Horváthová, V.; Sáňka, M.; Čechmánková, J. Spatial differentiation of ecosystem risks of soil pollution in floodplain areas of the Czech Republic. Soil Water Res. 2017, 12, 1–9. [Google Scholar] [CrossRef] [Green Version]
  12. Sorokina, V.V.; Berdnikov, S.V. Nutrient Loading of the Don and Kuban on the Ecosystem of the Sea of Azov. Water. Resour. 2018, 45, 920–934. [Google Scholar] [CrossRef]
  13. Łabaz, B.; Kabala, C. Human-induced development of mollic and umbric horizons in drained and farmed swampy alluvial soils. CATENA 2016, 139, 117–126. [Google Scholar] [CrossRef]
  14. Frohne, T.; Rinklebe, J.; Diaz-Bone, R.A.; Du Laing, G. Controlled variation of redox conditions in a floodplain soil: Impact on metal mobilization and biomethylation of arsenic and antimony. Geoderma 2011, 160, 414–424. [Google Scholar] [CrossRef]
  15. Martynov, A.V. Influence of the large flood on the element composition of fluvisols in the Amur River Valley. Geogr. Environ. Sustain. 2020, 13, 52–64. [Google Scholar] [CrossRef]
  16. Ponting, J.; Verhoef, A.; Watts, M.J.; Sizmur, T. Field observations to establish the impact of fluvial flooding on potentially toxic element (PTE) mobility in floodplain soils. Sci. Total Environ. 2022, 811, 151378. [Google Scholar] [CrossRef]
  17. Antić-Mladenović, S.; Frohne, T.; Kresović, M.; Stärk, H.-J.; Tomić, Z.; Ličina, V.; Rinklebe, J. Biogeochemistry of Ni and Pb in a periodically flooded arable soil: Fractionation and redox-induced (im)mobilization. J. Environ. Manag. 2017, 186, 141–150. [Google Scholar] [CrossRef]
  18. Schulz-Zunkel, C.; Krueger, F.; Rupp, H.; Meissner, R.; Gruber, B.; Gerisch, M.; Bork, H.-R. Spatial and seasonal distribution of trace metals in floodplain soils. A case study with the Middle Elbe River, Germany. Geoderma 2013, 211–212, 128–137. [Google Scholar] [CrossRef]
  19. Shaheen, S.M.; Kwon, E.E.; Biswas, J.K.; Tack, F.M.G.; Ok, Y.S.; Rinklebe, J. Arsenic, chromium, molybdenum, and selenium: Geochemical fractions and potential mobilization in riverine soil profiles originating from Germany and Egypt. Chemosphere 2017, 180, 553–563. [Google Scholar] [CrossRef]
  20. Xu, J.; Cai, Q.; Wang, H.; Liu, X.; Lv, J.; Yao, D.; Lu, Y.; Li, W.; Liu, Y. Study of the potential of barnyard grass for the remediation of Cd- and Pb-contaminated soil. Environ. Monit. Assess. 2017, 189, 224. [Google Scholar] [CrossRef]
  21. Buscaroli, A.; Zannoni, D.; Dinelli, E. Spatial distribution of elements in near surface sediments as a consequence of sediment origin and anthropogenic activities in a coastal area in northern Italy. CATENA 2021, 196, 104842. [Google Scholar] [CrossRef]
  22. Du Laing, G.; De Vos, R.; Vandecasteele, B.; Lesage, E.; Tack, F.M.G.; Verloo, M.G. Effect of salinity on heavy metal mobility and availability in intertidal sediments of the Scheldt estuary. Estuar. Coast. Shelf Sci. 2008, 77, 589–602. [Google Scholar] [CrossRef]
  23. Trifuoggi, M.; Ferrara, L.; Toscanesi, M.; Mondal, P.; Ponniah, J.M.; Sarkar, S.K.; Arienzo, M. Spatial distribution of trace elements in surface sediments of Hooghly (Ganges) river estuary in West Bengal, India. Environ. Sci. Pollut. Res. 2022, 29, 5929–6942. [Google Scholar] [CrossRef] [PubMed]
  24. Kosyan, R.D.; Krylenko, M.V. Modern state and dynamics of the sea of Azov coasts. Estuar. Coast. Shelf Sci. 2019, 224, 314–323. [Google Scholar] [CrossRef]
  25. Lychagin, M.Y.; Tkachenko, A.N.; Kasimov, N.S.; Kroonenberg, S.B. Heavy metals in the water, plants, and bottom sediments of the Volga River mouth area. J. Coast. Res. 2015, 31, 859–868. [Google Scholar] [CrossRef]
  26. Sheverdyaev, I.V.; Kleschenkov, A.V. Revealing the surge phenomena contribution of the heavy metals inflow to the River Don Delta. Phys. Oceanogr. 2020, 27, 535–546. [Google Scholar] [CrossRef]
  27. Agency for Toxic Substances and Disease Registry. Minimal Risk Levels (MRLs) List. August 2022. Available online: https://www.atsdr.cdc.gov/mrls/pdfs/ATSDR%20MRLs%20-%20August%202022%20-%20H.pdf (accessed on 12 October 2022).
  28. California Office of Environmental Health Hazard Assessment. Chemical Database. Available online: https://oehha.ca.gov/chemicals (accessed on 12 November 2022).
  29. U.S. Environmental Protection Agency (EPA). Integrated Risk Information System (IRIS). Available online: https://cfpub.epa.gov/ncea/iris_drafts/AtoZ.cfm (accessed on 10 November 2022).
  30. Konstantinova, E.; Minkina, T.; Nevidomskaya, D.; Mandzhieva, S.; Bauer, T.; Zamulina, I.; Burachevskaya, M.; Sushkova, S. Exchangeable form of potentially toxic elements in floodplain soils along the river-marine systems of Southern Russia. Eurasian J. Soil Sci. 2021, 10, 132–141. [Google Scholar] [CrossRef]
  31. Dudnikova, T.; Minkina, T.; Sushkova, S.; Barbashev, A.; Antonenko, E.; Bakoeva, G.; Shuvaev, E.; Mandzhieva, S.; Litvinov, Y.; Chaplygin, V.; et al. Features of the polycyclic aromatic hydrocarbon’s spatial distribution in the soils of the Don River delta. Environ. Geochem. Health 2022, ahead-of-print. [CrossRef]
  32. Sazykin, I.S.; Minkina, T.M.; Khmelevtsova, L.E.; Antonenko, E.M.; Azhogina, T.N.; Dudnikova, T.S.; Sushkova, S.N.; Klimova, M.V.; Karchava, S.K.; Seliverstova, E.Y.; et al. Polycyclic aromatic hydrocarbons, antibiotic resistance genes, toxicity in the exposed to anthropogenic pressure soils of the Southern Russia. Environ. Res. 2021, 194, 110715. [Google Scholar] [CrossRef]
  33. Rospotrebnadzor of the Rostov Oblast (Rostov Oblast regional office of the Russian Federal Service for Surveillance on Consumer Rights Protection and Human Wellbeing). Report on the State of Sanitary and Epidemiological Welfare of the Population of the Rostov Oblast in 2021; Rospotrebnadzor of Rostov Oblast: Rostov-on-Don, Russia, 2022; 195p. (In Russian)
  34. Rospotrebnadzor of the Krasnodar Krai (Krasnodar Krai regional office of the Russian Federal Service for Surveillance on Consumer Rights Protection and Human Wellbeing). Report on the State of Sanitary and Epidemiological Welfare of the Population of the Krasnodar Krai in 2021; Rospotrebnadzor of Krasnodar Krai: Krasnodar, Russia, 2022; 228p. (In Russian)
  35. Arkhipova, O.E.; Chernogubova, E.A.; Likhtanskaya, N.V. Spatiotemporal analysis of the incidence of cancer diseases as an indicator of medical and environmental safety. Proc. Int. Conf. InterCarto InterGIS 2018, 24, 109–122. [Google Scholar] [CrossRef]
  36. Zhuang, S.; Lu, X. Environmental risk evaluation and source identification of heavy metal(loid)s in agricultural soil of Shangdan Valley, Northwest China. Sustainability 2020, 12, 5806. [Google Scholar] [CrossRef]
  37. Rinklebe, J.; Antoniadis, V.; Shaheen, S.M.; Rosche, O.; Altermann, M. Health risk assessment of potentially toxic elements in soils along the Central Elbe River, Germany. Environ. Int. 2019, 126, 76–88. [Google Scholar] [CrossRef] [PubMed]
  38. GOST 17.4.4.02-2017; Nature Protection. Soils. Methods for Sampling and Preparation of Soil for Chemical, Bacteriological, Helmintological Analysis. Standardinform: Moscow, Russia, 2018; 10p. (In Russian)
  39. Vorobyova, L.A. Theory and Practice of Chemical Analysis of Soils; GEOS: Moscow, Russia, 2006; 400p. (In Russian) [Google Scholar]
  40. Soil Survey Staff. Soil Survey Laboratory Information Manual; Soil survey investigations report No. 45, version 2.0; Department of Agriculture, Natural Resources Conservation Service: Lincoln, UK, 2011; 506p.
  41. OST 10-259-2000; Soil. X-ray Fluorescence Determination of the Total Content of Heavy Metals. The Russian Federation Ministry of Agriculture: Moscow, Russia, 2001; 24p. (In Russian)
  42. Konstantinova, E.; Minkina, T.; Sushkova, S.; Antonenko, E.; Konstantinov, A. Levels, sources, and toxicity assessment of polycyclic aromatic hydrocarbons in urban topsoils of an intensively developing Western Siberian city. Environ. Geochem. Health 2020, 42, 325–341. [Google Scholar] [CrossRef]
  43. Sushkova, S.N.; Minkina, T.; Deryabkina, I.; Mandzhieva, S.; Zamulina, I.; Bauer, T.; Vasilyeva, G.; Antonenko, E.; Rajput, V. Influence of PAH contamination on soil ecological status. J. Soils Sediment. 2018, 18, 2368–2378. [Google Scholar] [CrossRef]
  44. ISO 13859:2014; Soil quality: Determination of Polycyclic Aromatic Hydrocarbons (PAH) by Gas Chromatography (GC) and High-Performance Liquid Chromatography (HPLC). ISO/TC 190, Soil quality. International Organization for Standardization: Geneva, Switzerland, 2014; 24p.
  45. Volk, S.; Gratzfeld-Huesgen, A. Agilent Application Solution: Analysis of PAHs in Soil According to EPA 8310 Method with UV and Fluorescence Detection; Agilent Technologies Inc.: Santa Clara, CA, USA, 2011. [Google Scholar]
  46. Antić-Mladenović, S.; Kresović, M.; Čakmak, D.; Perović, V.; Saljnikov, E.; Ličina, V.; Rinklebe, J. Impact of a severe flood on large-scale contamination of arable soils by potentially toxic elements (Serbia). Environ. Geochem. Health 2019, 41, 249–266. [Google Scholar] [CrossRef] [PubMed] [Green Version]
  47. Barać, N.; Škrivanj, S.; Bukumirić, Z.; Živojinović, D.; Manojlović, D.; Barać, M.; Petrović, R.; Ćorac, A. Distribution and mobility of heavy elements in floodplain agricultural soils along the Ibar River (Southern Serbia and Northern Kosovo). Chemometric investigation of pollutant sources and ecological risk assessment. Environ. Sci. Pollut. Res. 2016, 23, 9000–9011. [Google Scholar] [CrossRef]
  48. Covre, W.P.; Ramos, S.J.; Pereira, W.V.D.S.; Souza, E.S.D.; Martins, G.C.; Teixeira, O.M.M.; Amarante, C.B.D.; Dias, Y.N.; Fernandes, A.R. Impact of copper mining wastes in the Amazon: Properties and risks to environment and human health. J. Hazard. Mater. 2022, 421, 126688. [Google Scholar] [CrossRef]
  49. Håkanson, L. An ecological risk index for aquatic pollution control—A sedimentological approach. Water. Res. 1980, 14, 975–1001. [Google Scholar] [CrossRef]
  50. Benlaribi, R.; Djebbar, S. Concentrations, distributions, sources, and risk assessment of polycyclic aromatic hydrocarbons in topsoils around a petrochemical industrial area in Algiers (Algeria). Environ. Sci. Pollut. Res. 2020, 27, 29512–29529. [Google Scholar] [CrossRef]
  51. Bhatti, S.S.; Kumar, V.; Kumar, A.; Gouzos, J.; Kirby, J.; Singh, J.; Sambyal, V.; Nagpal, A.K. Potential ecological risks of metal(loid)s in riverine floodplain soils. Ecotox. Environ. Saf. 2018, 164, 722–731. [Google Scholar] [CrossRef]
  52. Haghnazar, H.; Pourakbar, M.; Mahdavianpour, M.; Aghayani, E. Spatial distribution and risk assessment of agricultural soil pollution by hazardous elements in a transboundary river basin. Environ. Monit. Assess. 2021, 193, 158. [Google Scholar] [CrossRef] [PubMed]
  53. Liang, Y.; Xiao, H.; Liu, X.; Shi, H. The risk and phytotoxicity of metal(loid)s in the sediment, floodplain soil, and hygrophilous grasses along Le’an River. Int. J. Environ. Sci. Technol. 2020, 17, 1963–1974. [Google Scholar] [CrossRef]
  54. Mao, Z.; Zhao, H.; Qin, Z. Assessment of Cd–Pb pollution in soils of the Youjiang River Basin, South China. Eurasian Soil Sci. 2020, 53, 829–837. [Google Scholar] [CrossRef]
  55. Zgłobicki, W.; Telecka, M.; Skupiński, S. Assessment of microscale variation of heavy metal pollution of the Bystrzyca River alluvia downstream from Lublin. Pol. J. Soil Sci. 2016, 49, 167–180. [Google Scholar] [CrossRef] [Green Version]
  56. Canadian Council of Ministers of the Environment. Canadian Council of Ministers of the Environment. Canadian soil quality guidelines for the protection of environmental and human health: Chromium (total 1997) (VI 1999). In Canadian Environmental Quality Guidelines; Canadian Council of Ministers of the Environment: Winnipeg, MB, Canada, 1999. [Google Scholar]
  57. SanPiN 1.2.3685–21; Hygienic Standards and Requirements for Ensuring the Safety and (or) Harmlessness of Environmental Factors for Humans. 2021. Available online: https://docs.cntd.ru/document/573500115 (accessed on 12 November 2022). (In Russian)
  58. Nisbet, I.C.T.; LaGoy, P.K. Toxic equivalency factors (TEFs) for polycyclic aromatic hydrocarbons (PAHs). Regul. Toxicol. Pharm. 1992, 16, 290–300. [Google Scholar] [CrossRef] [PubMed]
  59. U.S. Environmental Protection Agency (EPA). Risk Assessment Guidance for Superfund. Volume I: Human Health Evaluation Manual (Part A). Interim Final (EPA/540/1-89/002); Office of Emergency and Remedial Response: Washington, DC, USA, 1989.
  60. U.S. Environmental Protection Agency (EPA). Human Health Evaluation Manual, Supplemental Guidance: Update to Standard Default Exposure Factors (OSWER 9200.1-120); National Center for Environmental Assessment: Washington, DC, USA, 2014.
  61. U.S. Environmental Protection Agency (EPA). Supplemental Guidance for Developing Soil Screening Levels for Superfund Sites (OSWER 9355.4-24); Office of Emergency and Remedial Response: Washington, DC, USA, 2002.
  62. Lemly, A.D. Evaluation of the hazard quotient method for risk assessment of selenium. Ecotox. Environ. Saf. 1996, 35, 156–162. [Google Scholar] [CrossRef]
  63. Guney, M.; Zagury, G.J.; Dogan, N.; Onay, T.T. Exposure assessment and risk characterization from trace elements following soil ingestion by children exposed to playgrounds, parks and picnic areas. J. Hazard. Mater. 2010, 182, 656–664. [Google Scholar] [CrossRef] [PubMed]
  64. Vu Duc, T.; Thi Lan, C.D.; Ngo Tra, M. Residue of selected persistent organic pollutants (POPs) in soil of some areas in Vietnam. In Biochemical Toxicology—Heavy Metals and Nanomaterials; Ince, M., Ince, O.K., Ondrasek, G., Eds.; IntechOpen: London, UK, 2020; pp. 1–14. [Google Scholar] [CrossRef] [Green Version]
  65. Office of Environmental Health Hazard Assessment. Air toxics hot spots program risk assessment guidelines. In Technical Support Document for Exposure Assessment and Stochastic Analysis; Office of Environmental Health Hazard Assessment California Environmental Protection Agency: Oakland, CA, USA, 2012. [Google Scholar]
  66. U.S. Environmental Protection Agency (EPA). Exposure Factors Handbook: 2011 Edition (EPA/ 600/ R-090/052F); National Center for Environmental assessment: Washington, DC, USA, 2011.
  67. U.S. Environmental Protection Agency (EPA). Update for Chapter 5 of the Exposure Factors Handbook. Soil and Dust Ingestion; (EPA/600/ R-17/384F); National Center for Environmental assessment: Washington, DC, USA, 2017.
  68. Baars, A.J.; Theelen, R.M.C.; Janssen, P.J.C.M.; Hesse, J.M.; van Apeldoorn, M.E.; Meijerink, M.C.M.; Verdam, L.; Zeilmaker, M.J. Re-Evaluation of Human-Toxicological Maximum Permissible Risk Levels (RIVM report 711701 025); Rijksinstituut voor Volksgezondheid en Milieu: Bilthoven, The Netherlands, 2001; 297p.
  69. U.S. Environmental Protection Agency (EPA). Regional Screening Level (RSL) Summary Table (TR=1E-06, HQ=1) May 2022. Available online: https://semspub.epa.gov/work/HQ/402369.pdf (accessed on 20 June 2022).
  70. U.S. Environmental Protection Agency (EPA). Risk Assessment Guidance for Superfund Volume I: Human Health Evaluation Manual (Part E, Supplemental Guidance for Dermal Risk Assessment). Final (EPA/540/R/99/005, OSWER 9285.7-02EP); Office of Superfund Remediation and Technology Innovation: Washington, DC, USA, 2004.
  71. Kabata-Pendias, A. Trace Elements in Soils and Plants, 4th ed.; CRC Press: Boca Raton, FL, USA, 2011; 505p. [Google Scholar] [CrossRef]
  72. Wilcke, W. SYNOPSIS Polycyclic Aromatic Hydrocarbons (PAHs) in Soil—A Review. J. Plant Nutr. Soil Sci. 2000, 163, 229–248. [Google Scholar] [CrossRef]
  73. Cachada, A.; Ferreira da Silva, E.; Duarte, A.C.; Pereira, R. Risk assessment of urban soils contamination: The particular case of polycyclic aromatic hydrocarbons. Sci. Total Environ. 2016, 551–552, 271–284. [Google Scholar] [CrossRef]
Figure 1. Location of the study area and soil sampling sites (red dots). The satellite image was from Google Earth.
Water 15 00234 g001
Figure 2. Boxplots of (a) potential ecological risk factors (Er) for PTEs in topsoils of the Lower Don floodplain and Taganrog Bay coast and (b) soil contamination class percentages. The boxes represent interquartile range (IQR), the line inside the box is the median, whiskers are rated as IQR *1.5, outliers (>IQR *1.5) were shown by asterisks.
Water 15 00234 g002
Figure 3. Spatial distribution of cumulative ecological risk indices in topsoils from the Lower Don floodplain and Taganrog Bay coast: (a) ecological risk index (RI) of PTEs and (b) risk quotient (RQ) of PAHs and toxic equivalent quotients (TEQ).
Water 15 00234 g003
Figure 4. Boxplots of risk quotients (RQ) (a) for PTEs and (b) for benzo[a]pyrene (BaP) and PAHs toxic equivalent quotients (TEQ) in topsoils of the Lower Don floodplain and the Taganrog Bay coast; (c) the percentage of distribution of soil contamination classes. The boxes represent interquartile range (IQR), the line inside the box is the median, whiskers are rated as IQR *1.5, outliers (>IQR *1.5) were shown by asterisks.
Water 15 00234 g004
Figure 5. Boxplots of human health risk indices for PTEs and PAHs in topsoils of the Lower Don floodplain and the Taganrog Bay coast. Hazard quotient (HQ), total hazard index (HI), carcinogenic risk (CR), and total carcinogenic risk (TCR).
Water 15 00234 g005
Figure 6. Spatial distribution of human health risk indices for PTEs and PAHs in topsoils of the Lower Don floodplain and the Taganrog Bay coast: (a) Total hazard index for children (HI_Children); (b) Total hazard index for adults (HI_Adults); and (c) Total carcinogenic risk (TCR).
Water 15 00234 g006
Table 1. Physical–chemical properties of soils from the study area.
SoilsNpH H2OCaCO3 (%)TOC (%)Clay (%)
Eutric Gleyic Fluvisols617.8
7.2–8.9
2.1
0.1–8.3
1.2
0.1–3.1
12.2
0.1–31.7
Calcaric Gleyic Fluvisols127.7
7.3–8.1
2.3
0.7–4.8
1.0
0.7–1.5
8.1
5.9–11.7
Gleyic Fluvisols (Humic)17.81.53.917.6
Gleyic Phaeozems58.0
7.7–8.2
1.3
0.7–2.6
1.6
0.5–2.8
15.3
2.8–24.8
Fluvic Solonchaks (Hypersalic)37.9
7.8–7.9
2.0
1.1–3.6
1.8
1.7–2.0
25.7
20.2–31.5
Haplic Chernozems37.7
7.5–7.8
2.1
0.7–3.7
2.4
2.0–3.1
26.3
24–29.8
Tidalic Arenosols17.72.30.12.9
Notes:: Mean value is above the line; range is below the line. N is number of soil samples and TOC is total organic carbon.
Table 2. Parameters used to assess the ecological risk of PTEs.
ParameterCrMnNiCuZnAsCdPbReference
Cb 124.91139.180.85716915.22.883[3]
Tr 2155110305[48,49]
MPC 641500[56,57]
TACSandy soils20335520.532
Loamy soils, pH > 5.580132220102130
Notes: Cb is regional background value, Tr is toxic response factor, MPC is maximum permissible concentration, and TAC is tentative allowable concentration.
Table 3. Criteria for classifying ecological risk on the basis of potential ecological risk factor (Er), potential ecological risk index (RI) [49], and risk quotient (RQ) [57].
Risk ClassesErRIRQ
Non-existent<1
Low<40<1501–2
Moderate40–80150–3002–3
Considerable80–160300–600
High160–3203–5
Very high≥320≥600>5
Table 6. Descriptive statistics for the PTE (mg kg−1) and PAH (μg kg−1) concentrations in topsoils from the Lower Don floodplain and the Taganrog Bay coast.
ParameterLower Don Floodplain (n = 10)Don Delta (n = 28)Small River Floodplains (n = 19)Coastline (n = 29)Total (n = 86)
MedMinMaxCVMedMinMaxCVMedMinMaxCVMedMinMaxCVMedMinMaxCV
Cr100.739.7138.625.090.143.9118.821.3100.546.6297.060.185.234.1141.527.493.934.1297.045.3
Mn879.1216.61202.734.7671.5202.31351.134.0931.5487.82466.245.8724.6343.32422.650.8723.9202.32466.246.3
Ni45.029.374.831.932.619.067.136.258.027.398.034.045.320.375.333.043.919.098.039.1
Cu41.110.170.937.836.012.354.027.049.533.9106.937.037.612.571.233.140.410.1106.940.4
Zn68.831.6199.957.570.530.2631.5105.9137.078.3376.058.699.338.0298.846.992.030.2631.578.5
As8.57.011.618.17.41.213.538.77.51.117.367.76.82.318.255.47.61.118.250.2
Cd0.80.31.542.00.50.16.2125.31.40.34.676.80.90.23.678.70.70.16.2101.3
Pb27.914.464.146.322.25.575.663.253.018.4129.649.936.75.3126.861.732.35.3129.664.1
NAP7.61.323.571.412.71.985.399.22.31.247.6124.36.00.451.8127.08.20.485.3116.0
ACY7.94.910.827.416.44.257.362.42.60.811.081.24.80.716.672.16.10.757.3100.3
ACE6.14.29.926.712.73.034.457.12.11.312.293.75.20.718.475.16.00.734.485.2
FLU10.91.820.257.940.210.7114.756.85.42.113.557.46.11.326.377.510.51.3114.7116.7
PHE89.019.8168.061.4116.337.8405.365.840.325.2174.165.953.214.8623.3142.756.314.8623.398.2
ANT9.20.521.079.90.40.212.2247.00.20.01.6121.00.10.01.2128.20.30.021.0261.3
FLT108.13.9190.371.4201.432.21618.7135.426.514.9372.3151.145.213.92070.1311.250.83.92070.1208.0
PYR129.48.1225.365.954.24.6419.4137.130.125.2216.999.938.012.71811.0319.738.24.61811.0252.3
BaA25.00.749.476.8101.58.81619.4187.24.30.8152.7208.215.04.71101.7355.918.50.71619.4276.9
CHR103.615.0180.262.359.34.1242.187.525.318.3173.6100.430.010.01448.8320.631.04.11448.8219.6
BbF26.21.155.671.3135.812.5882.5121.821.110.6417.2163.730.88.02191.1363.230.51.12191.1258.2
BkF7.80.416.767.3112.212.51289.1142.83.52.3148.0215.313.22.3870.8355.215.60.41289.1239.5
BaP13.90.524.568.5194.320.22013.3142.68.81.0243.3222.820.44.71655.6372.822.30.52013.3244.0
BghiP32.01.843.557.0149.013.21152.5129.121.72.7779.5206.649.615.93767.6374.643.21.83767.6302.0
DBA17.60.330.173.135.40.4253.3132.03.11.7130.3219.310.12.1408.5308.310.30.3408.5214.5
∑ PAH599.573.11049.063.61485.2236.49371.6117.4242.4138.42846.4144.4349.8115.916,006.0319.7390.773.116,006.0208.2
Notes: Med is median, Min is minimum, Max is maximum, and CV is coefficient of variation, %
Disclaimer/Publisher’s Note: The statements, opinions and data contained in all publications are solely those of the individual author(s) and contributor(s) and not of MDPI and/or the editor(s). MDPI and/or the editor(s) disclaim responsibility for any injury to people or property resulting from any ideas, methods, instructions or products referred to in the content.

