

Herbicide Fate and Transport in the Great Barrier Reef: A Review of Critical Parameters
1
School of Agriculture and Environmental Science, University of Southern Queensland, Toowoomba, QLD 4350, Australia
2
School of Engineering, University of Southern Queensland, Toowoomba, QLD 4350, Australia
*
Author to whom correspondence should be addressed.
Water 2023, 15(2), 237; https://doi.org/10.3390/w15020237
Submission received: 13 November 2022
/
Revised: 17 December 2022
/
Accepted: 21 December 2022
/
Published: 5 January 2023
(This article belongs to the Special Issue Contaminants of Emerging Concerns in the Water Environment: Sources, Fates, and Toxicity)
Abstract
:Herbicides used for weed management on agricultural land in Australia’s Great Barrier Reef catchments are a key concern for its ecosystem, including the lagoon’s marine plants and corals, whose productivity has been found to decline. The most reliable way to assess herbicide risk is by monitoring a site regularly, but this is costly and time-consuming, so numerical simulations and computer models are an alternative method. Despite the availability of low-cost and less labor-intensive modelling methods, they have been limited in their effectiveness due to a lack of specific herbicide usage data and an inadequate understanding of the breakdown and transport processes of herbicides after application. This paper reviews current findings regarding herbicide risk in all Great Barrier Reef catchments according to their agricultural land use, and the most recent Reef Water Quality Protection Plan recommendations. The various pathways for fate and transport of the herbicides were also examined, and a list of critical parameters was developed to help with computer simulations. The accuracy and reliability of modelling can be improved by including aerial drifts, interceptions by crop residues, mechanisms within the root zone, and subsurface and groundwater contributions to the herbicide load in the GBR lagoon. Moreover, the findings will provide new directions for management practices adoption data with the fate and transport model from paddock to reef and improve the reliability of model results.
1. Introduction
A natural wonder, the Great Barrier Reef (GBR) is the largest coral reef system in the world with more than 3000 reefs. Located on the northern shelf of North Queensland, Australia, the GBR extends over 2300 km, making Australia the custodian of this ecological site. In addition, Australia relies heavily on the GBR for its economic contribution, gaining $6.4 billion in 2015–2016 from tourism, recreation, fishing, and scientific industries, providing 64,000 jobs [1]. As a result of climate change, sediments, excess nutrients and pesticides washed into Reef waters, coral coverage has declined across the GBR with a 50% decline in hard coral cover since the mid-1980s [2,3]. United Nations Educational, Scientific and Cultural Organization (UNESCO) designated the Great Barrier Reef as a World Heritage Area in 1981, increasing efforts to protect and conserve it. World Heritage Committee (WHC) and the Australian government actively work together by regularly publishing State Party Reports detailing Australia’s progress in implementing WHC requests.
In 2019, the most recent State Party Report was published, updating the latest information on the GBR since the last State Party report in 2015 [4]. The report observed that the long-term outlook for the Reef’s ecosystem has deteriorated from ‘poor’ to ‘very poor’ within the past four years. The Outstanding Universal Value (OUV) of the site was affected by coral bleaching events in 2016 and 2017, 6 tropical cyclones, flooding, and an outbreak of coral-eating starfish crown-of-thorns. While climate change remains the foremost threat to the GBR, other issues like land-based runoff, coastal development, and illegal fishing also threaten the ecosystem [5]. Moreover, this report updates the progress of the Reef 2050 Long-Term Sustainability Plan (Reef 2050 LTSP), a framework for protecting and managing the Great Barrier Reef to 2050, which was established by the Queensland and Australian governments in 2015. In order to develop ecosystem resilience in the GBR, the plan focuses on improving water quality, maintaining biodiversity, and controlling shipping and port development impacts [5]
A previous study [6] on the 2019 State Party Report concluded that due to the clear evidence of deteriorating OUV of the GBR, the current management measures are inadequate to provide ‘effective and sustained protection of the property’s OUV’ as requested by the WHC in 2017. Further, the $270 million per year (from 2014–2015 to 2023–2024) investment by the Queensland and Australian governments is not sufficient for addressing current and future threats as well as water quality impacts from previous land use. About 30% of the investment ($826 million) has been allocated to improve water quality, which is significantly less than the estimated cost of $4.5 billion required to reach Reef 2050 LTSP water quality targets in all GBR catchments by 2025. Moreover, the Reef 2050 Long Term Strategic Plan is not meeting water quality targets, especially in the sugarcane industry [6]. This critical evaluation has revealed a need for a more efficient and cost-effective management practice from paddock to reef to meet the targets for water quality improvement within the GBR catchments according to the Reef 2050 Water Quality Improvement Plan (Reef 2050 WQIP).
While the water quality targets evaluate three components, i.e., the nutrient, pesticide and sediment loads of the GBR, this paper focuses on the pesticide, specifically on herbicide, fate and transport from paddock to the GBR. It is important to note that the pesticide target has been recently amended from end-of-catchment loads-based target to end-of-catchment risk-based target. As such, the Mackay Whitsunday region was found to impose the highest pesticide risk to the GBR lagoon, followed by the Wet Tropics region [7]. By having access to the information mentioned above, research efforts can be targeted more effectively on identifying the parameters that influence the fate and transport of herbicide within these regions, and subsequently, gathering sufficient data in order to produce reliable modelling outcomes for predicting the impacts of specific catchment land use on the GBR lagoon. Official reports from the Australian and Queensland governments have provided basic information on the methodology and assumptions used on current modelling work. These models were mostly focused on the fate of pesticides deposited within the topsoil region and transported through surface runoff [8]. However, by determining other potential fate and transport pathways based on the GBR catchments land use, this paper outlines the need for the models to incorporate site-specific parameters relevant to herbicide fate and transport in the crop foliage, crop residues and root zone areas. Pathways other than surface runoff, such as aerial drift, lateral flow and groundwater percolation need to be considered to improve the accuracy of the models. Based on the review of published papers on similar works, possible strategies relevant to modelling the fate and transport of herbicide within the GBR catchments were critically analysed. These key findings of this study will provide new directions for future work, especially in improving the reliability of modelling outcomes.
2. Pollutant Load to the GBR
2.1. Natural Resource Management (NRM) Regions of the GBR Catchments
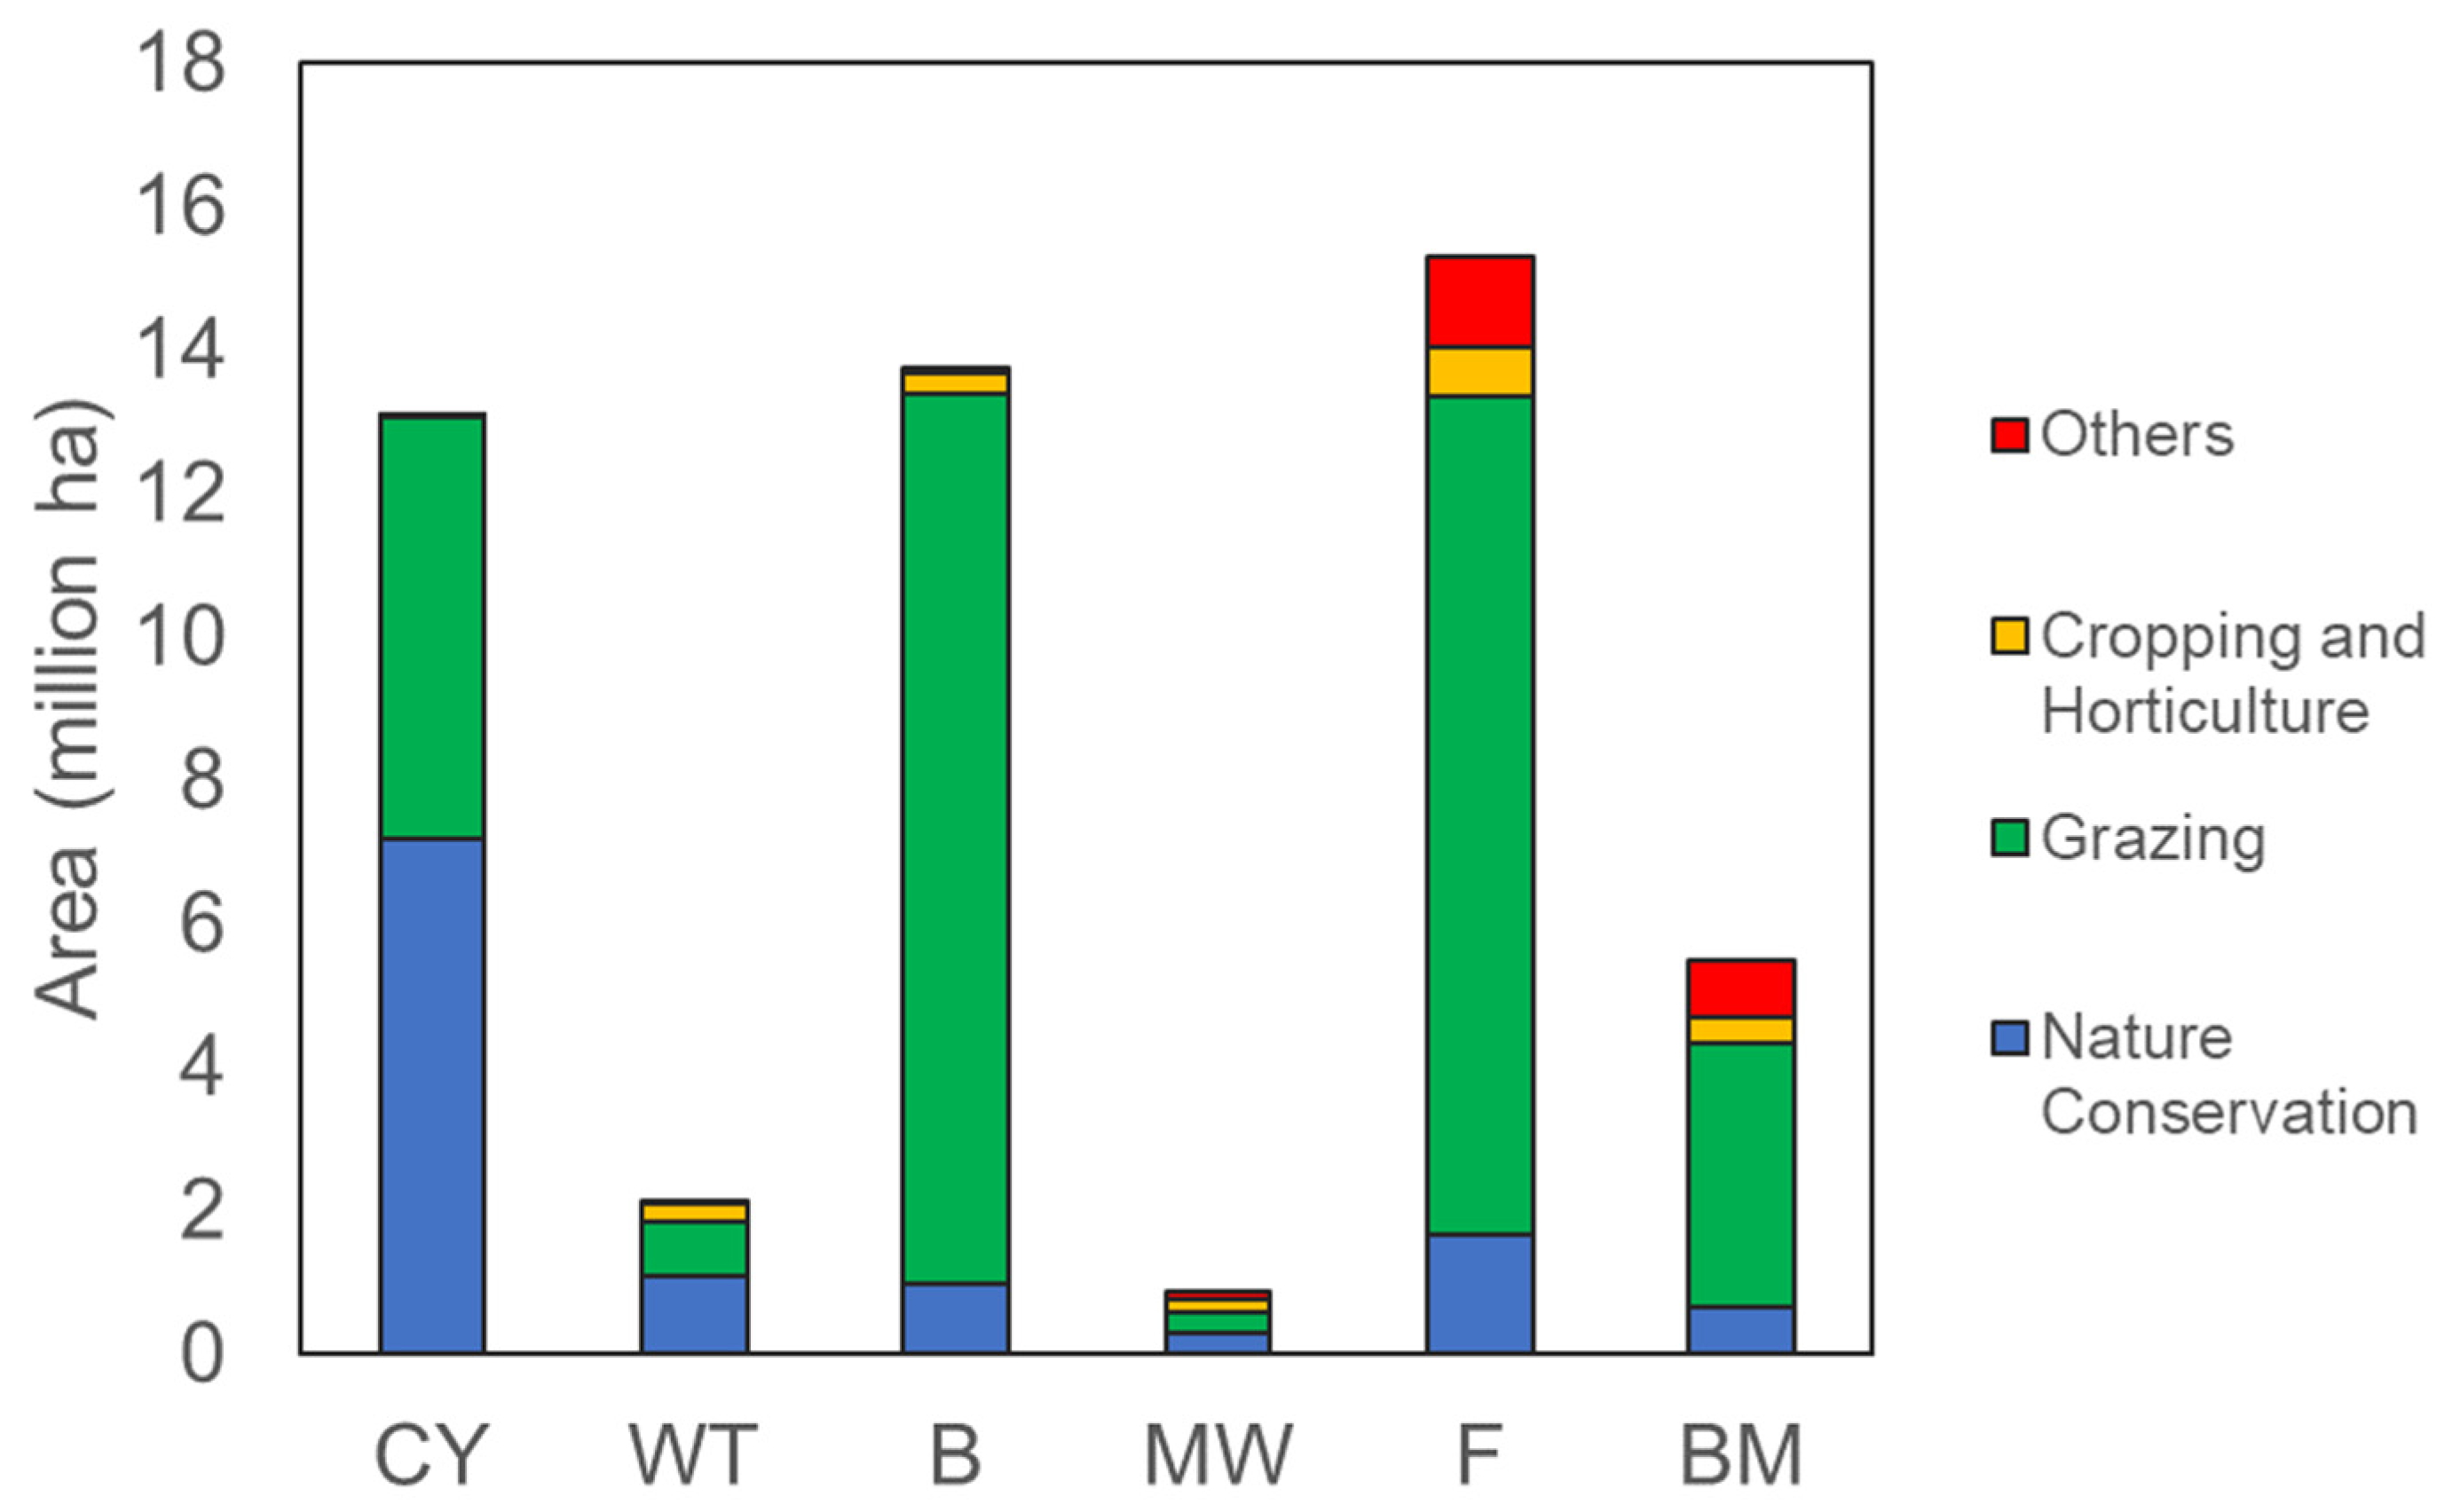
The GBR is very much influenced by the activities undertaken in its surrounding regions as it is an open system. It comprises of 39 coastal catchments distributed across an area of 424,000 km2 within north-east and central Queensland, with diverse ecosystems which includes freshwater riverine systems, wetlands, mangroves and seagrasses; all drain into the GBR lagoon [9,10]. These 39 catchments are defined by the Australian Water Resources Management Committee (WRMC) and are located within 6 Queensland regions (Cape York, Wet Tropics, Burdekin, Mackay Whitsunday, Fitzroy and Burnett Mary) [11]. Table 1 lists the catchments, regions and percentage land use of the regions based on the reports of land use summary prepared by the Remote Sensing Centre for the Queensland Government. Based on the data obtained, approximately 72% of the land within the GBR catchments is for agricultural use, with 68.5% allocated for livestock grazing and 3.4% for crop production which includes sugarcane, banana, cotton, grain, horticulture and pasture.
2.2. Nutrient Pesticide and Sediment Loads
Currently, Australia is the third largest raw sugar producer in the world, with 95% of the production coming from Queensland [19]. A total of 400,000 hectares are cultivated for sugarcane in the GBR catchments, which makes up 1.4% of total land. Along with other horticulture crops, they are grown in the high rainfall and coastal irrigation areas, particularly the Wet Tropics and Mackay Whitsunday regions.
Sugarcane needs nitrogen-based fertilisers and pesticides to maximize productivity, but if it is not managed properly, run-off can enter local waterways and enter the GBR. According to previous research, sugarcane growing areas contribute 78% of dissolved inorganic nitrogen (DIN) and 95% of pesticide loads [20]. Wetter climates and high agricultural land use impact have created high levels of dissolved nutrients and pesticides in these two regions. DIN loads from the Wet Tropics Region are estimated to be 75% sugarcane, 5% bananas, 12% grazing and forest, and 8% other crops/dairy and urban [2]. Furthermore, Table 1 shows that the Wet Tropics region contributes the highest DIN loading of 36.33%, while the Mackay Whitsunday region contributes the highest pesticide loading of 43.2%. In comparison, the Fitzroy region has the largest area dedicated to cropping and horticulture, as shown in Figure 1.
The sediment loads in the GBR is mainly sourced from areas dedicated to grazing. While this is the main activity for all 6 regions, locations with poor ground cover and for multi-crops are more susceptible to erosion, resulting in sediment runoff prior to the break of the wet season [10]. As per Table 1, the highest contributor of anthropogenic-derived fine sediment to the GBR lagoon is the Burdekin Region followed by the Fitzroy Region, with 40.43% and 20.28%, respectively. This corelates well with Figure 1 that highlights the largest grazeland areas in the catchment belong to these two regions. The third largest area for grazing is in Cape York but this region accounts for only 5.03% of GBR’s Total Suspended Sediment (TSS). With approximately 55% of Cape York Peninsular under nature conservation, the abundance of vegetation coverage have proven to reduce runoff and improve water quality [21].
2.3. Types of Herbicides Found within the GBR Catchments
Herbicides are pesticides used to kill or inhibit unwanted plants such as weeds and invasive species which will compete with cultivated crops if left untreated. PS-II herbicides, for example, inhibit photosynthesis by blocking the production of energy required for plant growth [22].
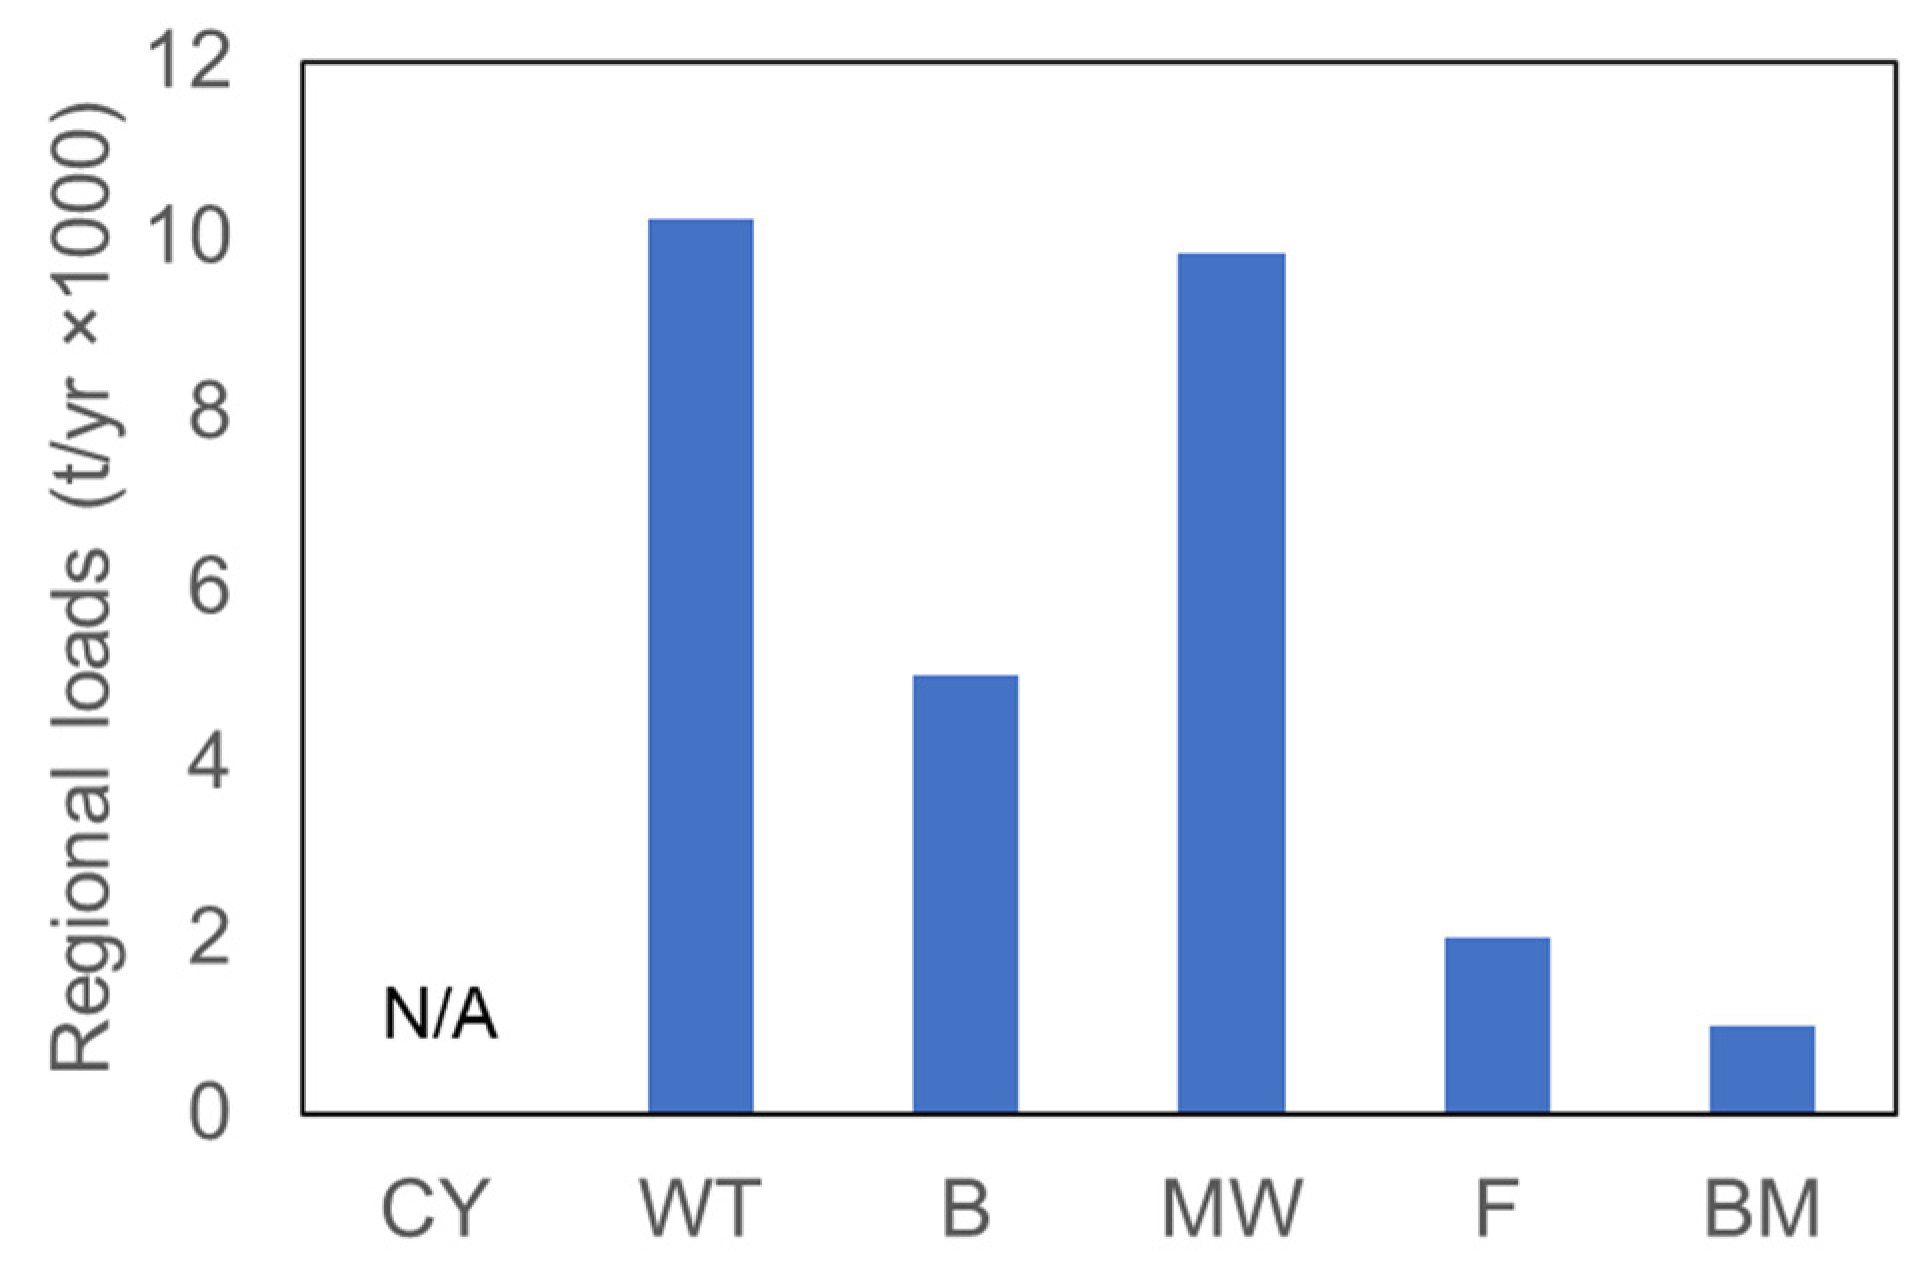
Table 2 shows that most catchments contribute more herbicides to the GBR than insecticides, except Daintree River in the Wet Tropics Region, and Shoalwater and Boyne River in the Fitzroy Region. As part of the Reef Plan targets and Reef Water Quality Program requirements, PS-II herbicides were designated priority contaminants since they have frequently been detected in the GBR. In the GBR catchment areas, agricultural industries such as sugarcane, grains, and grazing have widely applied PS-II herbicide, which has left waterways near these areas with high concentrations. In Figure 2, the Wet Tropics and Mackay Whitsunday are shown to contribute the most PS-II herbicides in 2009, due to intensive sugarcane cultivation [23].
Herbicides detected and commonly used in GBR catchments are listed in Table 3, including priority and alternative PS-II herbicides, knockdown products, and alternate herbicides. In addition, sources of these herbicides from different land uses and regions were included based on previous studies [24]. According to Table 3, all regions contributed at least four of the five PS-II herbicides to the GBR among the five priority PS-II herbicides.
In the GBR, herbicide management has developed over decades with extensive government and industry investments, leading to a focus on minimising the use of PS-II herbicides. It is however a major issue that the environmental impact of alternative pesticides remains poorly understood, and the methods for their analysis are not available on a regular basis in Australia [24]. There are some alternative herbicides that work similarly to priority PS-II herbicides to suppress weeds and have similar physicochemical profiles to PS-II herbicides deemed problematic for the environment. There are limited data on ecotoxicity, fate, transport, and persistence of these pesticides in the environment [25]. These factors need to be investigated further in order to assess the risk of herbicides to the health and resilience of the GBR.
3. Critical Parameter in Herbicide Fate and Transport
There are several ways to apply herbicides, including (1) aerial or canopy spraying (2) incorporating it into soil (3) injecting it below ground level [26].
After application, these herbicides have a wide range of fates and can be very complex. It is either taken up by pests or crops, degraded through microbial and chemical reactions, immobilised through soil or water sorption, or removed with harvested crops. Multiple pathways can transport these herbicides into the environment, depending on their fate. There are three major pathways: (1) Atmosphere: Through aerial drift and volatilization (2) Surface water bodies: Through runoff and lateral flows (3) Groundwater basins: Through leaching
To predict the fate and transport of herbicides within GBR catchments, knowledge of their chemical properties, their breakdown processes, and their physical transport is essential. A variety of factors influence these data, including herbicide type, soil conditions, and management practices.
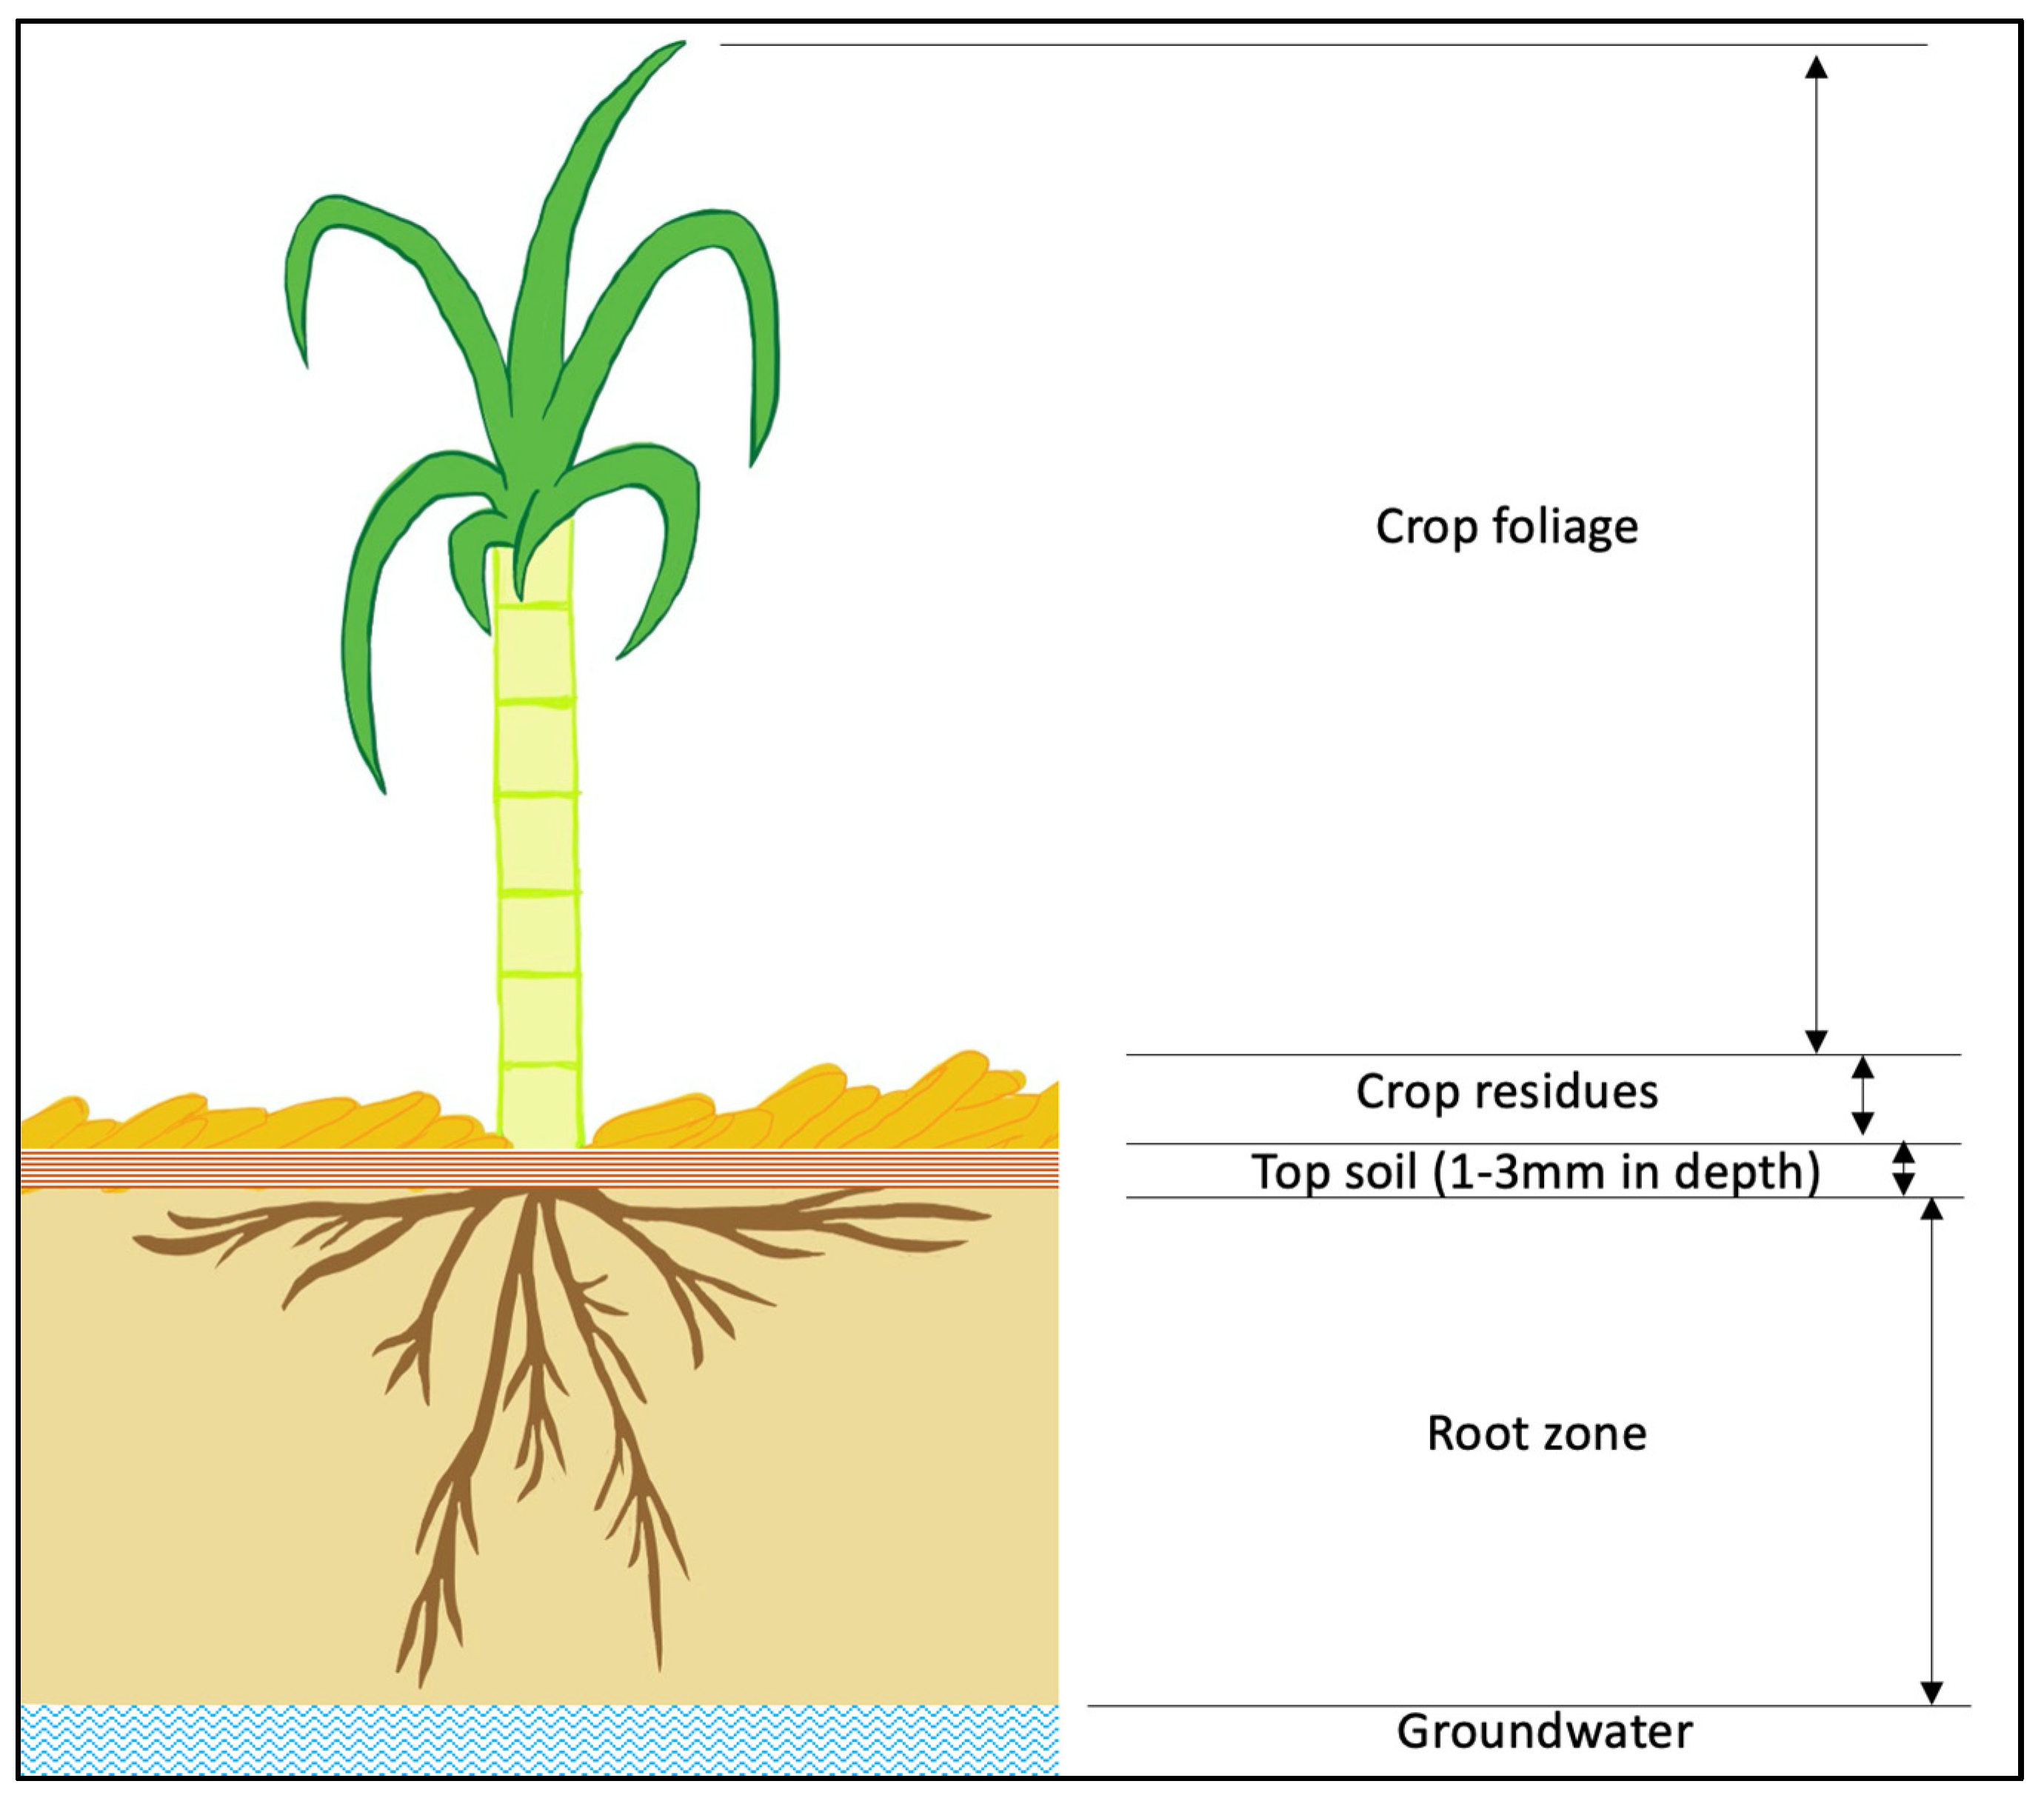
The following sections discuss potential major factors that affect herbicide fate and transport within the GBR catchments at crop foliage, crop residues, topsoil, and root zone. These factors are derived from studies directly related to the GBR or studies with similar land uses which may be applicable to the GBR. Figure 3 represents the areas in which herbicides may reside, interact, and be transferred after application, as well as identifying critical parameters for this study.
3.1. Spray Drift
Herbicides are applied by spraying within crop foliage or crop canopy zones. By drifting, herbicide droplets from crop fields are carried by the wind to surface waterbodies. Drift percentages are influenced by travel distance, crop type and growth stage [27]. Surface water input tended to be more prevalent at a distance of 6 m from application, while at a distance of 20 m, runoff became more important [28]. Therefore, herbicide contribution from this mode of transport needs to be evaluated for agricultural fields near drainage basins.
3.2. Type of Crops Harvested
Herbicides not affected by drift will settle and some will be intercepted by crops. Interception depends on the leaf area index (LAI) of the crops; higher LAI means more foliage interception, and less herbicide will reach the soil [27]. Similarly, the interception rate can also be estimated according to the crop development stage, so it depends greatly on land use and crop cultivation [29].
3.3. Degradation through Volatilization and Photodegradation
Herbicides can also dissipate through volatilisation and photodegradation on crop foliage, upper surface of crop residues, and topsoil [30]. These processes can be represented as foliar half-life, describing the herbicide dissipation half-life on crop canopies [26,31,32]. Phytodegradation is not a major pathway for herbicide loss in Australian farming systems, but applications during summer without following rainfall or mechanical incorporation may cause high losses. A number of herbicides are susceptible to photodegradation, including atrazine, fluometuron, simazine, terbuthylazine, diuron, sulfosulfuron, pendimethalin, picloram, and s-metolachlor [31].
3.4. Rainfall Occurrence and Intensity
Depending on rainfall or overhead irrigation, any intercepted herbicides may also be subjected to washoff. Herbicides are removed from crops and leaves by water and transferred to soil below. The most important factor is the time before rain or irrigation. After application, herbicides are more resistant to washoff if it takes longer for the first rainfall to occur. Although this delay reduces the risk of herbicide runoff, it also reduces the efficacy of herbicides in eliminating undesirable crops. Therefore, first rain after herbicide application has the highest risk of herbicide washoff loss, with concentration of herbicides declining with cumulative rainfall [33]. It has been suggested that a rainfall intensity of 5 mm/day triggers the occurrence of washoff loss [34].
3.5. Washoff Coefficients of Herbicides
The washoff coefficient is also an important parameter to consider because it reflect the ease of washoff for different herbicide formulations. Lower solubility herbicides tend to wash away more slowly, and vice versa. However, this is not always the case. For example, while the solubility of tebuthiuron and hexazinone results in rapid washoff, ametryn, which is not particularly soluble also experiences rapid washoff [33].
3.6. Herbicide Sorption
Sorption is the distribution of herbicides between soil particles and interstitial water, resulting either in molecule-water interaction or molecule-soil interaction. A sorption (partition) coefficient (Koc) based on soil organic carbon content is commonly used. In soil, herbicides can move laterally through subsurface drainage water. In surface waterbodies, herbicides distributed to the liquid phase can be transported horizontally by water fluxes discharged from the soil layers [27]. Subsurface drainage can be the dominant route of entry into rivers in scenarios where pesticides with low Koc are applied to artificially drained soils, with low slopes and far away from surface water [25]. On the other hand, high Koc herbicides applied on steep slopes travel through erosion, as their association with solids reflects their entry path [28].
3.7. Herbicide Half-Life Affecting Microbial Degradation
Another important parameter for the degradation of herbicides is their half-life, and within different layers, the characteristics of origin and the degree of degradation can influence the outcome. The biodegradation of herbicides through food consumption or breakdown by soil microbes also follows the same parameters for decomposition as organic matter [35]. Hydrolysis is another method of herbicide degradation in soils, where different transformation products are formed when a herbicide reacts with water. According to previous study, Queensland’s climatic conditions have extended the half-lives of herbicides in the GBR catchments, especially in drier areas such as Emerald in Fitzroy Basin. Despite limited hydrolysis and biolysis potential in drier soils, herbicides were detected in paddock runoff three years after application [25,36].
3.8. Transport Pathways of Persistent Herbicide and Metabolites
Persistent herbicides and metabolites are now either distributed to water particles or soil particles, depending on their sorption coefficients, and are ready to be transported horizontally through runoff or lateral flow and enter surface waterbodies, or transported vertically into groundwater through percolation across the root zone.
3.9. Transport Pathway through Evapotranspiration
Herbicides contained in soil water can also be removed from soil layers through evapotranspiration, whereby upward vertical movement of water is influenced by the sum of transpiration and evaporation. Plant uptake is assumed to be proportional to the transpiration rate and the herbicide concentration [37]. Evapotranspiration is a significant water outflow pathway from the soil system during hot and drier periods [38], which is particularly relevant to Queensland’s climate.
3.10. Transport Pathway through Preferential Flow
Depending on the soil type and conditions, downward vertical flow of herbicides across the root zone may occur through both micropores and macropores of the soil, albeit at different rates [39]. In this condition, gravity and soil porosity will be the determining factors instead of the sorption coefficient for the herbicide transport. The closer the point of discharge, the shorter the residence time, and therefore limits the degradability of the herbicides prior to discharge.
It is critical to identify all pesticides, particularly non-degradable herbicides, and their breakdown currently deposited in the GBR lagoon in order to fully evaluate their properties and consequent impacts. As shown in Table 4 undegraded herbicides and their break down products can be transported into rivers through aerial drifts, surface water runoffs, subsurface lateral flows and groundwater discharges. From this point, a lag between field-generated herbicide and channel-delivered herbicide may also be considered to account for the amounts of herbicide either stored or lagged from the previous day in surface runoff, lateral flow and sediment. Prior to reaching the GBR, these herbicides are subjected to various instream processes which includes losses through outflows, degradation, volatilization, setting and burial [27].
4. Modelling of Fate and Transport of Herbicides in the GBR Catchment
In order to monitor the concentrations of herbicides within the GBR lagoon, it is necessary to predict the fate and transport of herbicides in all catchments, particularly those identified as high-risk. This ability will be critical for assessing the environmental risks associated with herbicide applications and making informed decisions about land management. The quantitative assessment of herbicide fate and transport is expensive and labor-intensive. Because of insufficient and high uncertainty of data for meaningful prediction or modelling of herbicide concentrations, this method is currently the most reliable [25].
However, for preliminary investigations of herbicide fate and transport processes, numerical simulation can be an effective alternative. The use of computer models provides a relatively low cost, less labor-intensive method of estimating the effectiveness of compounds, as well as a consistent methodology across compounds. While computer models are commonly used to predict the fate and transport of herbicides, it is essential that all relevant parameters affecting the fate and transport can be identified, including data on the use of the herbicide and environmental measurements to boost the accuracy of computer models.
4.1. Input Parameters on Herbicide Fate and Transport
In general, there are many models available to simulate the fate and transport mechanisms of herbicides (or pesticides) with varying degrees of capability, complexity and accuracy. Some of these models are listed in Table 5 and their applications in various studies relevant to the fate and transport mechanisms of pesticides were evaluated; ‘Y’ denotes mechanism was incorporated into the model, ‘N’ denotes mechanism was explicitly disregarded and unmarked denotes that the mechanism was not/vaguely mentioned in the paper. These articles were chosen based on their relevancy to the topic of this study with keywords ‘fate’, ‘transport’, ‘herbicide’, ‘pesticide’ and ‘catchment’ were used in ‘Google Scholar’ and ‘Science Direct’ databases. Articles on modelling studies performed specifically on the GBR catchments were scarce, therefore, other articles with similar agricultural land use as the GBR catchments were also evaluated with priority given to those published after 2010. Older review papers were also considered as these papers provide comprehensive comparisons between many software that are still relevant to this day. The types of studies performed in these papers include review study of a single software, review study of multiple software, site specific modelling study and comparison study to experimental data.
4.2. Current Status of Modelling
There are a number of paddock scale models from the Reef Water Quality Protection Plan 2013 Technical Report that have been used to calculate daily loads for each land use in the GBR catchments, including APSIM for sugarcane, HowLeaky for pesticides and phosphorus, HowLeaky for cropping, RUSLE for grazing, and EMC/DWC for the rest. In Reef Plan 2009, PS-II herbicides were considered a priority by using HowLeaky in APSIM water balance for sugarcane, HowLeaky for cropping, and EMC for grazing. An overview of the herbicide generation model was provided in the technical report. The mass balance and runoff losses of herbicides were modeled using Howleaky with several enhancements [8]. The pesticide module in HowLeaky is based on CREAMS and GLEAMS algorithms and was further developed for a range of chemicals under Australian conditions [10]. This model incorporates the following concepts:
- (1)
- The scenarios represent several management practices relevant to GBR catchments and describe the products applied and their timing and rates.
- (2)
- The application of herbicides is calculated based on product concentration, product rate, and application efficiency, as well as application onto the crop, crop residue or directly to the soil.
- (3)
- Herbicide concentration in surface soil is calculated after leaching losses and extraction coefficients were used to estimate concentrations of herbicides in runoff as a function of soil concentration.
- (4)
- The proportion of herbicides in dissolved and particulate phases was considered using partitioning coefficients between soil and water which were calculated from both soil and herbicide chemistry.
- (5)
- Temperature dependent half-lives of herbicides were obtained from available studies in the literature or from Paddock to Reef monitoring results, where possible, and first order degradation rates are assumed.
As shown in Table 5, three studies discussed the fate and transport of pesticides within the GBR catchments, where two of the studies used HowLeaky and the other used GLEAMS to assess the fate and transport of pesticides. All three studies focused on the topsoil environment where the major loss was through runoff. While leaching was considered, losses of herbicides through this pathway were not further analysed [40,41]. Additionally, GLEAMS incorporated losses through ‘transpiration’ and ‘transformation to metabolites’, which were not included in HowLeaky. Based on the outcome, GLEAMS accurately reproduces runoff and pesticide transport at Australian sites but requires programming modifications. This study was initially conducted in 2001, and then developed the HowLeaky program based on GLEAMS for monitoring herbicide loads in the GBR lagoon ever since [40].
Based on this evaluation, there are potentials for further improvement on the accuracy of the modelling of the fate and transport of herbicides within the GBR catchments. Extensions can be made to accurately incorporate other fate and transport pathways, namely aerial drifts, interceptions by crop residues, mechanisms within the root zone, and subsurface and groundwater contributions to the herbicide load within the GBR lagoon. The parameters relevant to these processes may be incorporated into future models based on existing modelling work on similar projects to the GBR as discussed in the model comparison section.
4.3. Model Comparison
Previous studies describing the fate and transport mechanisms of pesticides with similar land use to the GBR catchments provide insight into how the current pesticide model can be improved. Several papers examined the capabilities of these models and highlighted critical parameters that must be included. However, parameterization is difficult as demonstrated by previous author [37] when comparing nine well established pesticide leaching models including VARLEACH, GLEAMS, PRZM, PELMO, LEACHM, PESTLA, PESTRAS, MACRO, and WAVE on humic sandy soil with shallow groundwater tables with topsoil and root zone studies. The study found that no single run of the model was parameterized in the same way as another, leading to user-dependent variability of model inputs as a result [37]. A more recent study used equivalent parameterization for the processes specifically simulated by PEARL, MACRO, and PRZM models to predict the fate of pesticides and the results show a better comparison than before [29].
Another study [38] compared herbicide leaching models for Finnish sugar beet cultivation. A total of 54 models were outlined in that study, and only 13 were considered after assessing their suitability and complexity. These models are VARLEACH, GLEAMS, PRZM, PELMO, LEACHM, PESTLA, PESTRAS, MACRO and WAVE. Even though none of the models met all the criteria set for the purpose of the study, they found that MACRO and GLEAMS ranked highest despite their limitations. The results for GLEAMS are supported by the model overview study that illustrates the capabilities of GLEAMS for simulating most of the herbicide fate and transport processes within the topsoil and root zones [26]. However, none of the models considered particle-facilitated colloidal transport phenomena, which may be an influential process in pesticide transport [38]. In recent years, new models such as the C-Ride module developed through HYDRUS have been shown to fully account for colloid transfer dynamics [39].
5. Improvement of Model Results Using Critical Parameters
5.1. Herbicide Usage Data
Ideally, models should be able to identify parameters while maintaining the right balance between model complexity and parameter identification. Model parameters should be derivable from experimental data, as has been highlighted in previous study [37]. A comparison study revealed that, when in situ or laboratory data are lacking, using literature data or pedotransfer functions to determine model parameters can be useful, but may not always be reliable. The authors conclude that even with complex parameterization of the PEARL, MACRO and PRZM 1-D models, field conditions cannot be completely reproduced [29]. Currently, some herbicide usage data for the GBR catchments are outdated and do not cover all products. Data limitations make it difficult to estimate catchment losses of herbicides and assess the risks to aquatic life they pose [25].
5.2. Herbicide Degradation Half-Life
The degradation of herbicides in soil environments is influenced by physico-chemical processes such as volatilization, photolysis, hydrolysis, and biolysis, all of which are controlled by first-order kinetics. However, most models, including HowLeaky and SWAT, use lump half-lives to depict overall degradation in soil water and particles [27]. In GLEAMS, degradation half-lives can also be considered based on soil depth, foliar half-lives for degradation on crop leaves, and metabolite half-lives for metabolites produced through sequential first-order reactions [26]. In the PEARL, MACRO and PRZM models [29], the authors considered the influence of depth on degradation rates, and this parameter was used as an input. It has been shown that the deep drainage half-lives of diuron and hexazinone are approximately 5.25 times greater than surface runoff at Mackay-Whitsunday sugarcane sites. Increasing soil depth leads to a rapid decline in organic matter content and proportionate microbial activity, resulting in reduced herbicide degradation and therefore a longer half-life. Upon reaching the subsurface layers, herbicides may be transported unattenuated to the groundwater [25]. Consequently, modelling herbicide degradation half-life on a soil-by-soil basis might be a viable solution to improve pesticide load monitoring on the GBR.
5.3. Herbicide Transport Pathway through Aerial Drift
The majority of the studies in Table 5, including the studies performed for the GBR catchments, focused on the fate and transport of herbicides within the topsoil area and subsequent discharge from soil by runoff and/or leaching. Pesticide losses through aerial drift were examined in two studies using SYNOPS and PesTox [28,29,30]. The herbicide loss pathway may not be explicitly represented in other models, but it may be represented through the reduction in application amounts on top of the crop foliage [41]. There are two priority PS-II herbicides in the GBR that are susceptible to spray drift. Therefore, this pathway must be taken into account when modeling these herbicides [42].
5.4. Herbicide Transport Pathway within Crop Residues
One study used PASTIS to model herbicide fate and transport in crop residues. The model was tested for crop residues (referred to as mulch) composed of maize and dolichos and simulates water transfer, mulch decomposition, and pesticide dynamics [43]. The increased use of GTCB in sugarcane areas within the GBR catchments suggests that a similar approach could be relevant to improving the accuracy of herbicide loads from this industry by focusing on the mechanism of decomposition of herbicide residues.
5.5. Herbicide Transport Pathway within Root Zone
In comparison to herbicide losses from paddocks to surface water, leaching to below root zones associated with losses to groundwater are relatively poorly understood. To model the processes within the root zone and beyond is a more complex task. An analysis using STICS of herbicide fate and transport in the root zone concluded that the inconsistencies between observed and modelled data were due to the model’s inability to incorporate lower boundary conditions that represent shallow groundwater variations and water transfer mechanisms such as preferential flow resulting from soil cracks [44]. In a southern GBR catchment, dissolved diuron has been observed to leach to groundwater due to preferential flow across porous media [45]. The movement of water can be simulated using MACRO, which divides the simulation system into micropore and macropore systems, as well as PLM, which divides soil water into immobile, slow and fast mobile phases, with the fast phase representing macropores and cracks. Incorporating macropores into models were found to slightly improve simulation results [38]. Despite the most recent groundwater sampling finding a concentration of 1 g/L of individual pesticides in the GBR catchment, this load is ignored by the Paddock to Reef program and other research projects, unless the groundwater is discharged to surface water for the purposes of monitoring and modeling catchment loads [25].
5.6. Toxicological Effects of Herbicides
The toxicological effects of pesticides on aquatic biota in the Great Barrier Reef have been assessed through measurements of their concentrations from grab samples and comparisons to Australian and New Zealand Trigger Values (TV). There is a moderate to high risk of toxic effects if the 95th percentile of concentrations exceeds the TV. According to a separate study, the assessment may underestimate 9 of the pesticides detected due to the unavailability of TVs. To the best of the authors’ knowledge, there have been no published papers on the numerical modeling of herbicide toxicological effects on GBR species. However, predictions from toxicant-fate models can generally assess the ecotoxicological threat of herbicides to biodiversity. These tools, similar to the grab sample methodology, require the concentration data of herbicides present, and toxicity parameters require the no-effect concentration (NEC) and tolerance concentration (TC), which represent the ineffective threshold and strength of toxic effect, respectively. Moreover, contaminant toxicity changes over time [46,47], which makes the fate and transport model relevant to factor 3 assessment.
6. Conclusions
As for the measurement of herbicide, the target was recently changed from a loads-based target to a risk-based target as presented in the Reef 2050 Water Quality Improvement Plan (Reef 2050 WQIP). The baselines and methods used to measure the progress are now different and cannot be measured against the previously set target. The new risk-based target is based on the concentrations of pesticides required to protect 99% of species at end-of-catchment across all regions. It is important to note that based on this new target, highest pesticide load does not equate highest concentration of exposure to organisms. Biological effects will be directly impacted by the combination of concentration, relative toxicity of the pesticide and duration of exposure [25].
Based on four different environmental exposures, this article discusses and summarizes the various possible fates and transport routes of herbicides after application, as well as the critical parameters that determine these fates and transport. In this article, these parameters are grouped into six different categories based on the type of crop, the crop residues, the herbicide application, the herbicide properties, the environmental data, and the soil properties. The use of these parameters for computer simulation will depend on the software selected for modelling, as different software may use different approaches for problem solving, the method of herbicide application and farming technique used, as well as the specific fate and transport mechanism being investigated. In order for models to accurately predict water quality, they need to take into account the complex interactions between soil, climate, and land management practices. The information collected here will assist in developing a framework for future numerical modelling research on herbicide fate and transport in the catchment of the GBR
Author Contributions
K.N.: Conceptualization, Data curation, Investigation, Writing—Original draft preparation, J.B.: Funding Acquisition, Writing—Review and Editing, N.A.Z.: Data curation, Investigation, Writing—Original draft preparation. All authors have read and agreed to the published version of the manuscript.
Funding
The research conducted in this study was funded by a grant from the University of Southern Queensland, Australia.
Acknowledgments
This study is supported by the University of Southern Queensland, Australia.
Conflicts of Interest
The authors declare no conflict of interest.
References
- De Valck, J.; Rolfe, J. Linking water quality impacts and benefits of ecosystem services in the Great Barrier Reef. Mar. Pollut. Bull. 2018, 130, 55–66. [Google Scholar] [CrossRef] [PubMed]
- Waterhouse, J.; Brodie, J.; Lewis, S.; Mitchell, A. Quantifying the sources of pollutants in the Great Barrier Reef catchments and the relative risk to reef ecosystems. Mar. Pollut. Bull. 2012, 65, 394–406. [Google Scholar] [CrossRef] [PubMed]
- Emslie, M.J.; Bray, P.; Cheal, A.J.; Johns, K.A.; Osborne, K.; Sinclair-Taylor, T.; Thompson, C.A. Decades of monitoring have informed the stewardship and ecological understanding of Australia’s Great Barrier Reef. Biol. Conserv. 2020, 252, 108854. [Google Scholar] [CrossRef]
- Commonwealth-of-Australia. State Party Report on the State of Conservation of the Great Barrier Reef World Heritage Area (Australia). 2019. Available online: https://www.dcceew.gov.au/ (accessed on 12 October 2022).
- Commonwealth-of-Australia. Reef 2050 Long-Term Sustainability Plan. 2015. Available online: https://www.dcceew.gov.au/parks-heritage/great-barrier-reef/protecting/reef-2050-plan (accessed on 14 October 2022).
- Tarte, D.; Hughes, T. Review of State Party Report on the state of conservation of the Great Barrier Reef World Heritage Area (Australia). 2020. Available online: https://www.marineconservation.org.au/ (accessed on 12 October 2022).
- Australian-and-Queensland-Governments. Pesticide Risk Baseline Results, Reef Water Quality Report Card 2017 and 2018. 2019. Available online: https://www.reefplan.qld.gov.au/__data/assets/pdf_file/0026/82907/report-card-2017-2018-results-pesticide-risk-baseline.pdf (accessed on 10 October 2022).
- Waters, D. Modelling Reductions of Pollutant Loads Due to Improved Management Practices in the Great Barrier Reef Catchments. 2014; pp. 1–120. Available online: https://www.reefplan.qld.gov.au/__data/assets/pdf_file/0027/46098/great-barrier-reef-catchment-modelling-report.pdf (accessed on 8 October 2022).
- Smith, R.; Middlebrook, R.; Turner, R.; Huggins, R.; Vardy, S.; Warne, M. Large-scale pesticide monitoring across Great Barrier Reef catchments–paddock to reef integrated monitoring, modelling and reporting program. Mar. Pollut. Bull. 2012, 65, 117–127. [Google Scholar] [CrossRef]
- Carroll, C.; Waters, D.; Vardy, S.; Silburn, D.M.; Attard, S.; Thorburn, P.J.; Davis, A.; Halpin, N.; Schmidt, M.; Wilson, B.; et al. A Paddock to reef monitoring and modelling framework for the Great Barrier Reef: Paddock and catchment component. Mar. Pollut. Bull. 2012, 65, 136–149. [Google Scholar] [CrossRef]
- Queensland Government. Reef 2050 Water Quality Improvement Plan; 2019. Available online: https://www.reefplan.qld.gov.au/water-quality-and-the-reef/the-plan (accessed on 4 January 2023).
- Economics, D.A. Economic contribution of the Great Barrier Reef. 2013. Available online: https://www.dcceew.gov.au/parks-heritage/great-barrier-reef/publications/economic-contribution-great-barrier-reef-march-2013 (accessed on 12 October 2022).
- DSITI. Land Use Summary 1999–2013: Cape York NRM Region. 2015. Available online: https://www.publications.qld.gov.au/dataset/9f2aafcd-1994-4958-ac5b-b6a034b2b0ef/resource/dd0dc40a-2930-4e6f-9fcd-41257c35fde2/download/cape-york-land-use-summary.pdf (accessed on 12 October 2022).
- DSITI. Land Use Summary 1999–2015: Wet Tropics NRM Region. 2016. Available online: https://www.publications.qld.gov.au/dataset/1e257ae1-8bdb-4fc1-a742-6f4a22d55ecf/resource/0bf01de4-0e89-4680-90c9-05154f8034e3/download/wet-tropics-land-use-summary-1999-2015.pdf (accessed on 12 October 2022).
- DSITI. Land Use Summary 1999–2015: Burdekin NRM Region. 2016. Available online: https://www.publications.qld.gov.au/dataset/land-use-summary-1999-2015 (accessed on 12 October 2022).
- DSITI. Land Use Summary 1999–2016: Mackay Whitsunday NRM Region. 2017. Available online: https://www.publications.qld.gov.au/dataset/4b4ea2de-0327-4c48-85f3-fe9b5fcd73c3/resource/4956d016-eee4-40b7-85fa-93495a5259fe/download/mackay-whitsunday-land-use-summary-1999-2016.pdf (accessed on 12 October 2022).
- DSITI. Land Use Summary 1999–2017: Fitzroy NRM Region. 2017. Available online: http://qldspatial.information.qld.gov.au/catalogue/custom/search.page?q=%22Land%20use%20mapping%20-%201999%20to%202017%20-%20Fitzroy%20NRM%22 (accessed on 12 October 2022).
- DSITI. Land Use Summary 1999–2017: Burnett Mary NRM Region. 2017. Available online: https://www.publications.qld.gov.au/dataset/51761481-26cc-492b-92f1-1b5ed6667ec7/resource/dff51ef9-fe65-42ee-958a-75853e2fd8a2/download/burnettmarylanduse19992009.pdf (accessed on 12 October 2022).
- Linnenluecke, M.K.; Zhou, C.; Smith, T.; Thompson, N.; Nucifora, N. The impact of climate change on the Australian sugarcane industry. J. Clean. Prod. 2020, 246, 118974. [Google Scholar] [CrossRef]
- DES. Reef 2050 Water Quality Improvement Plan; Department of Environment and Science, Queensland Government: Queensland, Australia, 2020.
- Bartley, R.; Corfield, J.P.; Hawdon, A.A.; Kinsey-Henderson, A.E.; Abbott, B.N.; Wilkinson, S.N.; Keen, R.J. Can changes to pasture management reduce runoff and sediment loss to the Great Barrier Reef? The results of a 10-year study in the Burdekin catchment, Australia. Rangel. J. 2014, 36, 67–84. [Google Scholar] [CrossRef] [Green Version]
- Al-Khatib, K. Herbicide Symptoms. 2020. Available online: http://herbicidesymptoms.ipm.ucanr.edu/ (accessed on 2 November 2022).
- Queensland Government. Reef Water Quality Protection Plan. 2009; pp. 37–56. Available online: https://www.reefplan.qld.gov.au/__data/assets/pdf_file/0025/46177/technical-report.pdf (accessed on 2 November 2022).
- Smith, R.A.; Turner, R.; Vardy, S.; Huggins, R.; Rohan, W. An Evaluation of the Prevalence of Alternate Pesticides of Environmental Concern in Great Barrier Reef Catchments. 2015. Available online: https://www.publications.qld.gov.au/dataset/1bf3951b-e3cc-4727-9d96-262f374f553f/resource/efaa76da-5714-45a5-ba40-30476d9e214e/download/alternatepesticidesreportrp57cfinalmetadata.pdf (accessed on 14 October 2022).
- Davis, A.; Smith, R.; Negri, A.; Thompson, M.; Poggio, M. Advancing our understanding of the source, management, transport and impacts of pesticides on the Great Barrier Reef 2011-2015. 2016. Available online: https://www.researchgate.net/publication/303301289_Advancing_our_understanding_of_the_source_management_transport_and_impacts_of_pesticides_on_the_Great_Barrier_Reef_2011-2015 (accessed on 12 November 2022).
- Leonard, R.; Knisel, W.; Davis, F. Modelling pesticide fate with GLEAMS. Eur. J. Agron. 1995, 4, 485–490. [Google Scholar] [CrossRef]
- Wang, R.; Yuan, Y.; Yen, H.; Grieneisen, M.; Arnold, J.; Wang, D.; Wang, C.; Zhang, M. A review of pesticide fate and transport simulation at watershed level using SWAT: Current status and research concerns. Sci. Total Environ. 2019, 669, 512–526. [Google Scholar] [CrossRef]
- de Baan, L. Sensitivity analysis of the aquatic pesticide fate models in SYNOPS and their parametrization for Switzerland. Science of the Total Environment 2020, 715, 136881. [Google Scholar] [CrossRef]
- Marín-Benito, J.; Pot, V.; Alletto, L.; Mamy, L.; Bedos, C.; Barriuso, E.; Benoit, P. Comparison of three pesticide fate models with respect to the leaching of two herbicides under field conditions in an irrigated maize cropping system. Sci. Total. Environ. 2014, 499, 533–545. [Google Scholar] [CrossRef] [PubMed]
- Felix, M.; Holst, N.; Sharp, A. PestTox: An object oriented model for modeling fate and transport of pesticides in the environment and their effects on population dynamics of non-target organisms. Comput. Electron. Agric. 2019, 166. [Google Scholar] [CrossRef]
- GRDC. Understanding Pre-Emergent Herbicides and How They Interact with the Environment. 2007, pp. 1–9. Available online: https://grdc.com.au/ (accessed on 10 October 2022).
- The Pennsylvania State University, Volitilization 2003. Available online: http://www.personal.psu.edu/faculty/a/s/asm4/turfgrass/education/turgeon/lessons/lesson13/corefiles/links/pestdanger/vol1.html (accessed on 10 October 2022).
- Dang, A.; Silburn, M.; Craig, I.; Shaw, M.; Foley, J. Washoff of Residual Photosystem II Herbicides from Sugar Cane Trash under a Rainfall Simulator. J. Agric. Food Chem. 2016, 64, 3967–3974. [Google Scholar] [CrossRef] [PubMed]
- Shaw, M.; Dunlop, J.; McGregor, G. Identifying Pesticides and Locations for Monitoring in the Great Barrier Reef Catchments. In Approach and Assessment Outputs; Queensland Department of Environment and Resource Management: Brisbane, Australia, 2011; p. 86. [Google Scholar]
- Trovato, V.W.; Portilho, I.I.R.; Barizon, R.R.; Scorza, R.P., Jr. Herbicide runoff from a soil with different levels of sugarcane straw coverage in Brazil. Ecotoxicol. Environ. Contam. 2020, 15, 25–35. [Google Scholar] [CrossRef]
- Hussain, S.; Arshad, M.; Springael, D.; Sørensen, S.R.; Bending, G.; Devers-Lamrani, M.; Maqbool, Z.; Martin-Laurent, F. Abiotic and Biotic Processes Governing the Fate of Phenylurea Herbicides in Soils: A Review. Crit. Rev. Environ. Sci. Technol. 2015, 45, 1947–1998. [Google Scholar] [CrossRef]
- Tiktak, A. Application of pesticide leaching models to the Vredepeel dataset: II Pesticide fate. Agric. Water Manag. 2000, 44, 119–134. [Google Scholar] [CrossRef]
- Siimes, K.; Kämäri, J. A review of available pesticide leaching models: Selection of models for simulation of herbicide fate in Finnish sugar beet cultivation. Boreal Environ. Res. 2003, 8, 31–51. [Google Scholar]
- Simunek, J.; Jacques, D.; Langergraber, G.; Bradford, S.A.; Šejna, M.; van Genuchten, M.T. Numerical modeling of contaminant transport using HYDRUS and its specialized modules. J. Indian Inst. Sci. 2013, 93, 265–284. [Google Scholar]
- Shaw, M.; Silburn, D.; Thornton, C.; Robinson, B.; McClymont, D. Modelling pesticide runoff from paddocks in the Great Barrier Reef with HowLeaky. In Proceedings of the International Congress on Modelling and Simulation (MODSIM), Perth, WA, Australia, 12–16 December 2011. [Google Scholar]
- Connolly, R.; Kennedy, I.; Silburn, D.; Simpson, B.; Freebairn, D. Simulating Endosulfan Transport in Runoff from Cotton Fields in Australia with the GLEAMS Model. J. Environ. Qual. 2001, 30, 702–713. [Google Scholar] [CrossRef] [Green Version]
- King, O.; Smith, R.; Mann, R.; Warne, M. Proposed Aquatic Ecosystem Protection Guideline Values for Pesticides Commonly Used in the Great Barrier Reef Catchment Area: Part 1–2, 4-D, Ametryn, Diuron, Glyphosate, Hexazinone, Imazapic, Imidacloprid, Isoxaflutole, Metolachlor, Metribuzin, Metsulfuron-methyl, Simazine and Tebuthiuron; Department of Science, Information Technology and Innovation: Brisbane, Australia, 2017; p. 211. [Google Scholar]
- Aslam, S.; Iqbal, A.; Lafolie, F.; Recous, S.; Benoit, P.; Garnier, P. Mulch of plant residues at the soil surface impact the leaching and persistence of pesticides: A modelling study from soil columns. J. Contam. Hydrol. 2018, 214, 54–64. [Google Scholar] [CrossRef] [Green Version]
- Queyrel, W.; Habets, F.; Blanchoud, H.; Ripoche, D.; Launay, M. Pesticide fate modeling in soils with the crop model STICS: Feasibility for assessment of agricultural practices. Sci. Total Environ. 2016, 542, 787–802. [Google Scholar] [CrossRef] [PubMed]
- Simpson, B.W.; Fraser, G.; Armour, J.; Hargreaves, P.; Ruddle, L. Pesticide Studies—Australia. In Offsite Movement of Agrochemicals in Tropical Sugarcane Production: Extension Workshop, Bundaberg, Australia; Department of Natural Resources and Mines: Bundaberg, Australia, 2001; pp. 87–100. [Google Scholar]
- King, G.K.K.; Larras, F.; Charles, S.; Delignette-Muller, M.L. Hierarchical modelling of species sensitivity distribution: Development and application to the case of diatoms exposed to several herbicides. Ecotoxicol. Environ. Saf. 2015, 114, 212–221. [Google Scholar] [CrossRef] [PubMed]
- Bontje, D.; Kooi, B.; Liebig, M.; Kooijman, S. Modelling long-term ecotoxicological effects on an algal population under dynamic nutrient stress. Water Res. 2009, 43, 3292–3300. [Google Scholar] [CrossRef] [PubMed]
Figure 1.
Total area and land use of NRM regions within the GBR catchments (CY = Cape York, WT = Wet Tropics, B = Burdekin, MW = Mackay Whitsunday, F = Fitzroy and BM = Burnett Mary).
Figure 1.
Total area and land use of NRM regions within the GBR catchments (CY = Cape York, WT = Wet Tropics, B = Burdekin, MW = Mackay Whitsunday, F = Fitzroy and BM = Burnett Mary).

Figure 2.
PS-II Herbicide regional load estimate in 2009 (CY = Cape York, WT = Wet Tropics, B = Burdekin, MW = Mackay Whitsunday, F = Fitzroy and BM = Burnett Mary) [23].
Figure 2.
PS-II Herbicide regional load estimate in 2009 (CY = Cape York, WT = Wet Tropics, B = Burdekin, MW = Mackay Whitsunday, F = Fitzroy and BM = Burnett Mary) [23].

Figure 3.
Areas for herbicide interactions and pathways within a cropping system.


Table 1.
The GBR catchments, land use and end-of-catchment pollutant load contributions [12].
Table 1.
The GBR catchments, land use and end-of-catchment pollutant load contributions [12].
| Catchment No. | Catchment Name | Natural Resource Management (NRM) Regions | Land Use (% of Land Area, Excluding Water Bodies) | Average Pollutant Loads to the GBR (Relative Proportion in %) [1] | ||
|---|---|---|---|---|---|---|
| Nutrients (Dissolve Inorganic Nitrogen, DIN) | Sediments (Total Suspended Sediment, TSS) | Pesticides | ||||
| 101 | Jacky-Jacky Creek | I. Cape York Region Total area: ~136,520 km2 | Grazing (~44.7%) Cropping and Horticulture (~0.1%) Nature conservation (~55%) Others (~0.2%) [13] | 0.13 | 5.03 | 0.01 |
| 102 | Olive-Pascoe | |||||
| 103 | Lockhart River | |||||
| 104 | Stewart River | |||||
| 105 | Normanby River | |||||
| 106 | Jeannie River | |||||
| 107 | Endeavour River | |||||
| 108 | Daintree River | II. Wet Tropics Region Total area: ~22,230 km2 | Grazing (~51%) Cropping and Horticulture (~35%) Nature conservation (~11%) Others (~3%) [14] | 36.33 | 11.84 | 35.79 |
| 109 | Mossman River | |||||
| 110 | Barron River | |||||
| 111 | Mulgrave-Russell River | |||||
| 112 | Johnstone River | |||||
| 113 | Tully River | |||||
| 114 | Murray River | |||||
| 115 | Hinchinbrook Island | |||||
| 116 | Herbert River | |||||
| 117 | Black River | III. Burdekin Region Total area: ~140,874 km2 | Grazing (~90.4%) Cropping and Horticulture (~2%) Nature cons. (~7%) Others (~0.6%) [15] | 29.46 | 40.43 | 18.93 |
| 118 | Ross River | |||||
| 119 | Haughton River | |||||
| 120 | Burdekin River | |||||
| 121 | Don River | |||||
| 122 | Proserpine River | IV. Mackay Whitsunday Total area: ~9335 km2 | Grazing (~35%) Cropping and Horticulture (~18%) Nature cons. (~34%) Others (~13%) [16] | 11.89 | 7.43 | 43.2 |
| 123 | Whitsunday Island | |||||
| 124 | O’Connell River | |||||
| 125 | Pioneer River | |||||
| 126 | Plane Creek | |||||
| 127 | Styx River | V. Fitzroy Region Total area: ~156,762 km2 | Grazing (~76.3%) Cropping and Horticulture (~4.3%) Nature conservation (11%) Others (~8.4%) [17] | 10.96 | 20.28 | 0.74 |
| 128 | Shoalwater | |||||
| 129 | Waterpark Creek | |||||
| 130 | Fitzroy River | |||||
| 131 | Curtis Island | |||||
| 132 | Calliope River | |||||
| 133 | Boyne River | |||||
| 134 | Baffle Creek | VI. Burnett Mary Region Total area: ~55,777 km2 | Grazing (~67.2%) Cropping and Horticulture (~6.7%) Nature conservation (12%) Others (~14.1%) [18] | 11.23 | 14.99 | 1.33 |
| 135 | Kolan River | |||||
| 136 | Burnett River | |||||
| 137 | Burrum River | |||||
| 138 | Mary River | |||||
| 139 | Fraser Island | |||||
Table 2.
Pesticide risk of the GBR catchment.
| No. | Catchments | Largest Pesticide Loads Contributor [9] | Risk Category | Pesticide Risk Baseline (% Species Protected) | Contribution of Pesticide Groups (Relative Proportion in %) | ||
|---|---|---|---|---|---|---|---|
| PSII Herbicides | Other Herbicides | Insecticides | |||||
| Australian and Queensland Governments (2019) | |||||||
| Wet Tropics Region | Moderate | 95 | - | - | - | ||
| 108 | Daintree River | Very Low | 100 | 2 | 0 | 98 | |
| 109 | Mossman River | Moderate | 91 | 53 | 36 | 11 | |
| 110 | Barron River | Very Low | 100 | 14 | 69 | 17 | |
| 111 | Mulgrave-Russell River | Moderate | 91 | 47 | 26 | 27 | |
| 112 | Johnstone River | √ | Moderate | 92 | 50 | 32 | 18 |
| 113 | Tully River | √ | Moderate | 93 | 59 | 20 | 21 |
| 114 | Murray River | Moderate | 91 | 63 | 23 | 14 | |
| 116 | Herbert River | Moderate | 94 | 61 | 22 | 17 | |
| Burdekin Region | Low | 98 | - | - | - | ||
| 117 | Black River | Very Low | 99 | 0 | 97 | 3 | |
| 118 | Ross River | Low | 97 | 1 | 79 | 20 | |
| 119 | Haughton River | √ | High | 86 | 61 | 34 | 5 |
| 120 | Burdekin River | √ | Very Low | 99 | 42 | 54 | 4 |
| Sub | Belyando River | √ | - | - | - | - | - |
| Sub | Suttor River | √ | - | - | - | - | - |
| 121 | Don River | Very Low | 100 | 9 | 73 | 18 | |
| Mackay Whitsunday Region | High | 81 | - | - | - | ||
| 122 | Proserpine River | Moderate | 91 | 48 | 28 | 24 | |
| 124 | O’Connell River | High | 84 | 60 | 27 | 13 | |
| 125 | Pioneer River | √ | Very High | 76 | 59 | 24 | 17 |
| 126 | Plane Creek | √ | Very High | 71 | 62 | 26 | 12 |
| Fitzroy Region | Low | 96 | - | - | - | ||
| 127 | Styx River | Very Low | 99 | 48 | 50 | 2 | |
| 128 | Shoalwater | Very Low | 99 | 0 | 5 | 95 | |
| 129 | Waterpark Creek | Very Low | 100 | 48 | 35 | 17 | |
| 130 | Fitzroy River | √ | Low | 96 | 35 | 65 | 0 |
| Sub | Comet River | √ | - | - | - | - | - |
| 132 | Calliope River | Low | 98 | 24 | 70 | 6 | |
| 133 | Boyne River | Very Low | 99 | 17 | 21 | 62 | |
| Burnett Mary Region | Low | 97 | - | - | - | ||
| 134 | Baffle Creek | Very Low | 99 | 16 | 47 | 37 | |
| 135 | Kolan River | Low | 96 | 19 | 56 | 25 | |
| 136 | Burnett River | √ | Low | 97 | 51 | 43 | 6 |
| 137 | Burrum River | Moderate | 92 | 34 | 60 | 6 | |
| 138 | Mary River | Moderate | 95 | 23 | 69 | 8 | |
| Types of Herbicides Detected/Commonly Used in the GBR Catchments | Land Use | GBR Catchments | |||||||||||
|---|---|---|---|---|---|---|---|---|---|---|---|---|---|
| Sugarcane | Horticulture | Cotton | Urban/STP | Banana | Grazing | Forestry | Broadacre Cropping | Wet Topics | Burdekin | Mackay Whitsunday | Fitzroy | Burnett Mary | |
| ‘Priority’ PSII herbicides | |||||||||||||
| Ametryn | / | / | / | / | / | ||||||||
| Atrazine | / | / | / | / | / | / | / | / | / | ||||
| Diuron | / | / | / | / | / | / | / | / | / | / | |||
| Hexazinone | / | / | / | / | / | / | / | ||||||
| Tebuthiuron | / | / | / | / | / | / | |||||||
| ‘Alternative’ PSII herbicides | |||||||||||||
| Metribuzin | / | / | / | / | |||||||||
| Simazine | / | / | / | / | / | / | / | / | / | ||||
| Terbutryn | / | / | |||||||||||
| Bromacil | / | / | / | / | |||||||||
| Prometryn | / | / | / | ||||||||||
| Fluometuron | / | / | / | ||||||||||
| ‘Alternative’ herbicides | |||||||||||||
| Glyphosate | / | / | |||||||||||
| Imazapic | / | ||||||||||||
| Isoxaflutole | / | / | / | / | |||||||||
| Metolachlor | / | / | / | / | / | / | / | / | / | ||||
| S-metolachlor | |||||||||||||
| Pendimethalin | / | / | |||||||||||
| Picloram | / | ||||||||||||
| 2,4-D | / | / | / | / | / | / | |||||||
| Triclopyr | / | / | / | / | |||||||||
| Trifluralin | / | ||||||||||||
| Imazethapyr | / | ||||||||||||
| Fluroxypyr | / | / | |||||||||||
| MCPA | / | / | / | / | |||||||||
| Propazine | / | ||||||||||||
| Mecoprop | / | ||||||||||||
| Acifluorfen | / | ||||||||||||
| Metsulfuron-methy | / | / | / | ||||||||||
| Glufosinate-ammonium | / | ||||||||||||
| Pyrithiobac sodium | / | / | |||||||||||
| Haloxyfop | / | / | |||||||||||
Table 4.
Parameters impacting the fate and transport of herbicides into the GBR.
| Fate and Transport | Field Scale Modelling | Basin Level Modelling | End of Catchment | ||
|---|---|---|---|---|---|
| Input Parameters | Fate Behaviour | Mechanism of Transport | Channel Entry Route | Instream Processes | |
| Crop type Agricultural land use Crop coverage Growth stages Photo-degradation Availability of crop residues Transpiration Rooting depth and density Crop residues Amount, thickness, density Residue water content Chemical composition Characteristics of origin Degree of decomposition Biological parameters Herbicide application Mode of application Application rate No. of application Product concentration Application efficiency Time to rain Irrigation management Herbicide properties Half life Degradation Active ingredients Chemical properties Sorption coefficient Wash off coefficient Partition coefficient Environment Slope Precipitation Temperature Distance to water body Water type Evaporation Rainfall data (intensity, amount) Soil properties Soil density and porosity Soil organic carbon Soil water content Soil drainage Soil temperature Soil pH and Eh Hydraulic conductivity Soil layers | Air Wind loss—spray drifts Foliage Uptake by plant Volatilization Photolysis Washoff Crop residues Sorption Volatilization Photolysis Microbial degradation Generation of metabolites Washoff Topsoil Volatilization Photolysis Biolysis Distribution Run-off Leaching Root Zone Uptake by plant Abiotic transformation Hydrolysis (Degradation) Microbial degradation Generation of metabolites Sorption/desorption on organic matter and clays Resurface due to evaporation Leaching into groundwater Subsurface lateral flow Preferential flow through micropores into groundwater | Drift Soil erosions Transported during soil erosion process Liquid Phase Transported by soil water fluxes Transformed and Attenuated Herbicide Dissolved herbicide, break-down products and organic carbon transported by groundwater | Surface waters: Run-off Drift Erosion Subsurface water: Lateral flow Groundwater: Percolation | Losses Outflow Degradation Volatilization Setting Burial Herbicide Distribution: Herbicide transferred between liquid and solid phases via diffusion | Herbicide loads to GBR |
Table 5.
Modelling studies or reviews performed on pesticide fate and transport on various catchments.
Table 5.
Modelling studies or reviews performed on pesticide fate and transport on various catchments.
| Authors | Wang et al., (2019) | Shaw et al., (2011) | Anzooman et al., (2013) | Baan (2020) | Mwema et al., (2019) | Jaikaew et al., (2017) | Siimes and Kamari (2003) | Suarez (2013) | de Oliveira et al., (2019) | Boivin et al., (2006) | Leonard et al., (1995) | Aslam et al., (2018) | Marin Benito et al., (2014) | Tiktak (2000) | Bannwarth et al., (2014) | Connoly et al., (2001) |
|---|---|---|---|---|---|---|---|---|---|---|---|---|---|---|---|---|
| Model | ||||||||||||||||
| FATE | ||||||||||||||||
| Air | ||||||||||||||||
| Spray drifts | Y | Y | N | |||||||||||||
| Crop foliage | ||||||||||||||||
| Crop interception | Y | Y | Y | Y | Y | Y | Y | Y | Y | Y | ||||||
| Degradation | Y | Y | Y | Y | Y | Y | ||||||||||
| Uptake by plant | ||||||||||||||||
| Washoff | Y | Y | Y | Y | Y | Y | Y | |||||||||
| Crop residues | ||||||||||||||||
| Crop residue interception | Y | |||||||||||||||
| Sorption on crop residues | Y | |||||||||||||||
| Degradation | Y | |||||||||||||||
| Microbial degradation | Y | |||||||||||||||
| Generation of metabolites | Y | |||||||||||||||
| Washoff | Y | |||||||||||||||
| Topsoil (0–3 mm) | ||||||||||||||||
| Degradation | Y | Y | Y | Y | Y | Y | Y | Y | Y | Y | Y | Y | Y | Y | Y | Y |
| Distribution phase | Y | Y | Y | Y | Y | Y | Y | Y | Y | Y | Y | Y | Y | Y | Y | Y |
| Run-off | Y | Y | Y | Y | Y | Y | Y | N | Y | |||||||
| Leaching | Y | Y | Y | Y | Y | Y | Y | Y | Y | Y | Y | Y | Y | |||
| Within Root Zone | ||||||||||||||||
| Uptake by plant | Y | Y | Y | Y | ||||||||||||
| Abiotic transformation | Y | Y | ||||||||||||||
| Degradation | Y | Y | Y | Y | Y | Y | ||||||||||
| Microbial degradation | Y | Y | ||||||||||||||
| Generation of metabolites | Y | Y | Y | |||||||||||||
| Sorption/ | Y | Y | Y | Y | Y | Y | Y | Y | ||||||||
| Resurface | Y | Y | Y | |||||||||||||
| Preferential flow | Y | Y | Y | Y | Y | |||||||||||
| Leaching | Y | Y | ||||||||||||||
| TRANSPORT | ||||||||||||||||
| Surface waters: | ||||||||||||||||
| Runoff | Y | Y | Y | Y | Y | Y | Y | Y | ||||||||
| Drift | Y | Y | ||||||||||||||
| Erosion | Y | Y | Y | Y | Y | Y | ||||||||||
| Subsurface water: | ||||||||||||||||
| Lateral flow | Y | Y | Y | Y | ||||||||||||
| Groundwater: | ||||||||||||||||
| Percolation | Y | Y | Y | Y | Y | Y | Y | |||||||||
| Adjustment for lag | Y | |||||||||||||||
| INSTREAM PROCESSES | ||||||||||||||||
| Pesticides removed via: | ||||||||||||||||
| Outflow | Y | |||||||||||||||
| Degradation | Y | |||||||||||||||
| Volatilization | Y | |||||||||||||||
| Setting | Y | |||||||||||||||
| Burial | Y | |||||||||||||||
| Pesticides Distribution: | ||||||||||||||||
| Pesticides transferred between liquid and solid phases via diffusion | Y |
Disclaimer/Publisher’s Note: The statements, opinions and data contained in all publications are solely those of the individual author(s) and contributor(s) and not of MDPI and/or the editor(s). MDPI and/or the editor(s) disclaim responsibility for any injury to people or property resulting from any ideas, methods, instructions or products referred to in the content. |
© 2023 by the authors. Licensee MDPI, Basel, Switzerland. This article is an open access article distributed under the terms and conditions of the Creative Commons Attribution (CC BY) license (https://creativecommons.org/licenses/by/4.0/).
Share and Cite
MDPI and ACS Style
Nahar, K.; Baillie, J.; Zulkarnain, N.A. Herbicide Fate and Transport in the Great Barrier Reef: A Review of Critical Parameters. Water 2023, 15, 237. https://doi.org/10.3390/w15020237
AMA Style
Nahar K, Baillie J, Zulkarnain NA. Herbicide Fate and Transport in the Great Barrier Reef: A Review of Critical Parameters. Water. 2023; 15(2):237. https://doi.org/10.3390/w15020237
Chicago/Turabian StyleNahar, Kamrun, Justine Baillie, and Noor Azwa Zulkarnain. 2023. "Herbicide Fate and Transport in the Great Barrier Reef: A Review of Critical Parameters" Water 15, no. 2: 237. https://doi.org/10.3390/w15020237
Note that from the first issue of 2016, this journal uses article numbers instead of page numbers. See further details here.